water quality and sources of nitrogen and phosphorus in ... · nutrient concentrations that are...
TRANSCRIPT
Waikato Regional Council Technical Report 2016/17
Water quality and sources of nitrogen and phosphorus in the Hauraki rivers, 2006–15
www.waikatoregion.govt.nz ISSN 2230-4355 (Print) ISSN 2230-4363 (Online)

Prepared by: Bill Vant For: Waikato Regional Council PO Box 4010 HAMILTON EAST November 2016 Document #: 4111377
Doc # 4111377
Peer reviewed by:
Date August 2016
Dr Jim Cooke, Streamlined Environmental Ltd
Approved for release by: Date November 2016 Tracey May
Disclaimer
This technical report has been prepared for the use of Waikato Regional Council as a reference document and as such does not constitute Council’s policy. Council requests that if excerpts or inferences are drawn from this document for further use by individuals or organisations, due care should be taken to ensure that the appropriate context has been preserved, and is accurately reflected and referenced in any subsequent spoken or written communication. While Waikato Regional Council has exercised all reasonable skill and care in controlling the contents of this report, Council accepts no liability in contract, tort or otherwise, for any loss, damage, injury or expense (whether direct, indirect or consequential) arising out of the provision of this information or its use by you or any other party.

Doc # 4111377

Doc # 4111377 Page i
Acknowledgements Over the past 25 years, many members of Waikato Regional Council’s Environmental Monitoring team have helped with the collection of surface water quality and river flow information that is reviewed and analysed here. Claire Kotze assembled the databases used in the Sedrate analysis of the nutrient loads carried by the rivers. Stuart Beard, Ben Murphy, Ed Prince and Mark Row helped locate and collate the consent monitoring information that is analysed here. Aaron Jefferies prepared the maps used in this report, and Jim Cooke (Streamlined Environmental) made helpful comments on a draft of it (see WRC documents #8984956 and 8985949).
Page ii Doc # 4111377
Table of Contents
Abstract iii
1 Introduction 1
2 Water quality of the Hauraki rivers 3
2.1 Current condition: WRC guidelines 3
2.2 Current condition: NOF requirements 7
2.3 Long-term changes 8
3 Sources of nitrogen and phosphorus in the rivers 11
3.1 Loads carried by the rivers 11
3.2 Loads from point sources 15
3.3 Components of the total loads in rivers 20
4 Summary and conclusions 21
References 23
Doc # 4111377 Page iii
Abstract Major rivers in the Hauraki area flow in a generally northerly direction into the Firth of Thames. Water quality has been monitored monthly at 19 sites on these rivers since 1990–94. Information is also available for the 24 moderate-to-large discharges of sewage or industrial wastewaters into the rivers. This report describes the current water quality of the rivers—as indicated by conditions during the past decade—and the changes observed since the records began. It also describes the loads of the plant nutrients nitrogen (N) and phosphorus (P) that are carried by the rivers into the nutrient-sensitive Firth of Thames; various different sources contribute to the loads, and these are quantified. During 2006–15, the quality of the water in the Kauaeranga River was mostly excellent: it was well-oxygenated and clear, and contained low concentrations of total N and total P, and moderate concentrations of Escherichia coli bacteria. But this river accounted for just 8% of the combined flow of the Hauraki rivers. Conversely, the water quality of the Piako River (18% of the combined flow) was generally poor, being somewhat oxygen-depleted and murky, and with particularly high concentrations of total N and total P (up to 3–7 times higher than guideline values). Concentrations of E. coli were also high (6 times higher than guideline values). Its main tributary, the Waitoa River, had similarly-poor water quality. The water quality of the largest river, the Waihou (72% of the combined flow), was intermediate: at the most downstream site on the main-stem the water was often well-oxygenated, but was murky, and concentrations of total N, total P and E. coli were 2–3 times higher than guideline values. The water quality of its main tributary the Ohinemuri River, however, was generally good. Many (64%) of the records of river water quality at the 19 sites have been reasonably-stable over the past 22–25 years. Some 25% of the records showed important improvements, while 11% showed deteriorations. Several of the improvements have resulted from improved treatment of the wastewaters that are discharged to the rivers. In some cases these appear to have offset the effects of more intensive farming on the nutrient concentrations that are found in the rivers, particularly those of total P. Mass flows (or loads) of total N and total P during 2006–15 were determined at 11 sites on the Hauraki rivers. Altogether the rivers carried about 3730 t/yr of nitrogen and 206 t/yr of phosphorus to the Firth of Thames. The Waihou River carried 55–63% of the combined loads while the Kauaeranga and Waitakaruru Rivers each carried 1–2%; the Piako/Waitoa River carried about 34–42%. During 1991–2015 the combined load of nitrogen carried by the rivers decreased at a rate of about 0.3% per year, while the combined load of phosphorus decreased at a rate of about 2% per year. The 24 point source discharges contributed about 6% of the nitrogen and 22% of the phosphorus that was carried by the rivers. Background sources in the river catchments were estimated to contribute about 21% of the combined load of total N and 38% of the total P. The remaining 73% of the combined load of total N and 41% of the total P is likely to have come from diffuse agricultural sources in the rivers’ catchments.

Doc # 4111377 Page 1
1 Introduction Plant growth in the Firth of Thames depends on the supply to it of the nutrients N and P (Vant 2011, Green & Zeldis 2015). Four moderate-to-large rivers carry nutrients into the southern part of the Firth: the Waitakaruru, Piako, Waihou and Kauaeranga Rivers (Figure 1). The Waitoa River, a major tributary of the Piako, enters about 40 km upstream of its mouth, while the Ohinemuri River enters the Waihou a similar distance from its mouth (Figure 1). In this report these rivers are collectively called the “Hauraki rivers”. Vant (2011) quantified the loads of N and P carried by the rivers during 2000–09, and concluded that they were several times higher than those carried prior to the development of the river catchments. Altogether the area of the land that drains to the Firth is about 4200 km2; about 65% of it is in pasture, with about 20% in native bush (Turner et al. 2006). Some 60,000 people live here,1 many (c. 60%) in one of seven moderate-sized towns (c. 3500–7000 people each). Table 1 lists some important characteristics of the catchments of the Hauraki rivers, showing that the pressures on them differ markedly. At one extreme the catchment of the Kauaeranga River is mostly covered by indigenous vegetation (89%). By contrast, the catchments of the Piako River and its Waitoa tributary are mostly covered in pasture (90%; mainly dairy), and 11 treatment plants discharge wastewaters to these rivers (see later). The Waikato Regional Council operates a routine river water quality monitoring programme that includes a number of sites on the Hauraki rivers. It also issues the resource consents that permit the discharge of treated wastewaters to these rivers; consent holders are required to monitor the flow and water quality of these discharges and to provide the information to the Council. Vant (2011) used this information to determine the relative importance of the various sources of the N and P that was carried by the Hauraki rivers during 2000–09.2 This report updates the analysis of Vant (2011) to address the following matters:
What is the current water quality of the Hauraki rivers?
Has this changed in the past 25 years, and if so how?
What loads of N and P do the Hauraki rivers currently carry into the Firth of Thames?
What are the main sources of these loads of N and P—how important are consented discharges of wastewaters?
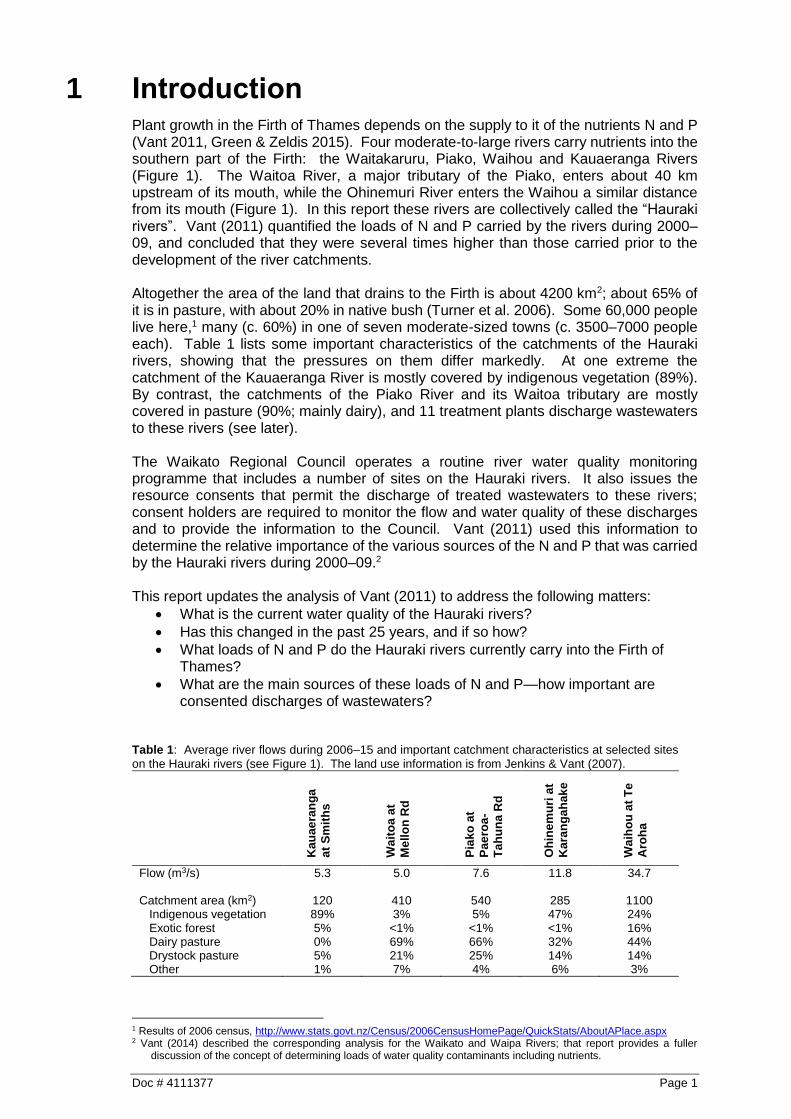
Table 1: Average river flows during 2006–15 and important catchment characteristics at selected sites
on the Hauraki rivers (see Figure 1). The land use information is from Jenkins & Vant (2007).
Kau
ae
ran
ga
at
Sm
ith
s
Wa
ito
a a
t
Me
llo
n R
d
Pia
ko
at
Pa
ero
a-
Ta
hu
na
Rd
Oh
ine
mu
ri a
t
Kara
ng
ah
ak
e
Wa
iho
u a
t T
e
Aro
ha
Flow (m3/s) 5.3 5.0 7.6 11.8 34.7 Catchment area (km2) 120 410 540 285 1100 Indigenous vegetation 89% 3% 5% 47% 24% Exotic forest 5% <1% <1% <1% 16% Dairy pasture 0% 69% 66% 32% 44% Drystock pasture 5% 21% 25% 14% 14% Other 1% 7% 4% 6% 3%
1 Results of 2006 census, http://www.stats.govt.nz/Census/2006CensusHomePage/QuickStats/AboutAPlace.aspx 2 Vant (2014) described the corresponding analysis for the Waikato and Waipa Rivers; that report provides a fuller
discussion of the concept of determining loads of water quality contaminants including nutrients.

Page 2 Doc # 4111377
Figure 1: The four Hauraki river catchments, showing 19 sites at which water quality has been routinely
monitored, and the subset of 11 of these at which loads of nitrogen and phosphorus were determined for 2006–15.
Doc # 4111377 Page 3
2 Water quality of the Hauraki rivers Waikato Regional Council’s water quality monitoring network includes 17 sites on the Hauraki rivers (Tulagi 2015). A further two sites have been monitored as part of NIWA’s national river water quality network (Ohinemuri River at Karangahake and Waihou River at Te Aroha). The river network and the locations of the monitoring sites are shown in Figure 1. Monitoring of the 19 sites began during 1990–94.3 The sites are all visited monthly, with field measurements being made (water temperature, dissolved oxygen and water clarity), and samples being collected for analysis in the laboratory.
2.1 Current condition: WRC guidelines
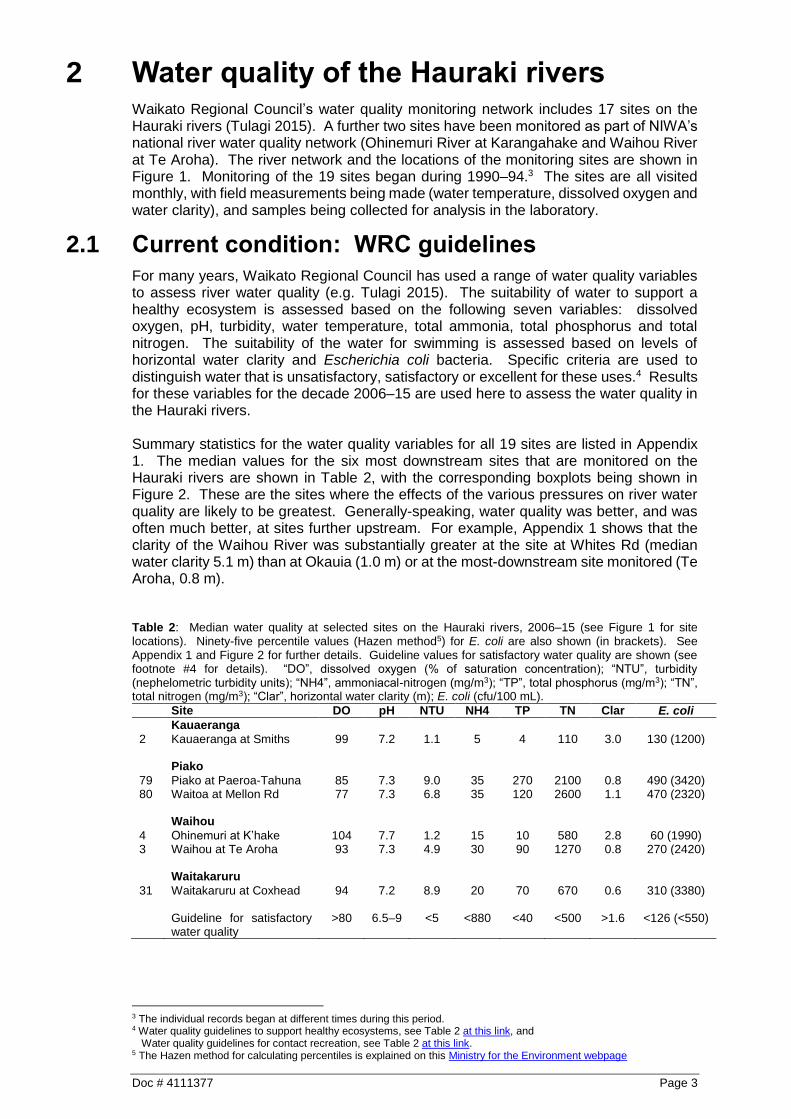
For many years, Waikato Regional Council has used a range of water quality variables to assess river water quality (e.g. Tulagi 2015). The suitability of water to support a healthy ecosystem is assessed based on the following seven variables: dissolved oxygen, pH, turbidity, water temperature, total ammonia, total phosphorus and total nitrogen. The suitability of the water for swimming is assessed based on levels of horizontal water clarity and Escherichia coli bacteria. Specific criteria are used to distinguish water that is unsatisfactory, satisfactory or excellent for these uses.4 Results for these variables for the decade 2006–15 are used here to assess the water quality in the Hauraki rivers. Summary statistics for the water quality variables for all 19 sites are listed in Appendix 1. The median values for the six most downstream sites that are monitored on the Hauraki rivers are shown in Table 2, with the corresponding boxplots being shown in Figure 2. These are the sites where the effects of the various pressures on river water quality are likely to be greatest. Generally-speaking, water quality was better, and was often much better, at sites further upstream. For example, Appendix 1 shows that the clarity of the Waihou River was substantially greater at the site at Whites Rd (median water clarity 5.1 m) than at Okauia (1.0 m) or at the most-downstream site monitored (Te Aroha, 0.8 m). Table 2: Median water quality at selected sites on the Hauraki rivers, 2006–15 (see Figure 1 for site locations). Ninety-five percentile values (Hazen method5) for E. coli are also shown (in brackets). See Appendix 1 and Figure 2 for further details. Guideline values for satisfactory water quality are shown (see footnote #4 for details). “DO”, dissolved oxygen (% of saturation concentration); “NTU”, turbidity (nephelometric turbidity units); “NH4”, ammoniacal-nitrogen (mg/m3); “TP”, total phosphorus (mg/m3); “TN”, total nitrogen (mg/m3); “Clar”, horizontal water clarity (m); E. coli (cfu/100 mL).
Site DO pH NTU NH4 TP TN Clar E. coli
Kauaeranga 2 Kauaeranga at Smiths 99 7.2 1.1 5 4 110 3.0 130 (1200) Piako 79 Piako at Paeroa-Tahuna 85 7.3 9.0 35 270 2100 0.8 490 (3420) 80 Waitoa at Mellon Rd 77 7.3 6.8 35 120 2600 1.1 470 (2320) Waihou 4 Ohinemuri at K’hake 104 7.7 1.2 15 10 580 2.8 60 (1990) 3 Waihou at Te Aroha 93 7.3 4.9 30 90 1270 0.8 270 (2420) Waitakaruru 31 Waitakaruru at Coxhead 94 7.2 8.9 20 70 670 0.6 310 (3380) Guideline for satisfactory
water quality >80 6.5–9 <5 <880 <40 <500 >1.6 <126 (<550)
3 The individual records began at different times during this period. 4 Water quality guidelines to support healthy ecosystems, see Table 2 at this link, and
Water quality guidelines for contact recreation, see Table 2 at this link. 5 The Hazen method for calculating percentiles is explained on this Ministry for the Environment webpage
Page 4 Doc # 4111377
Dissolved oxygen (% of saturation concentration)
pH
Turbidity (NTU)
Total ammonia (mg/m3)
Total phosphorus (mg/m3)
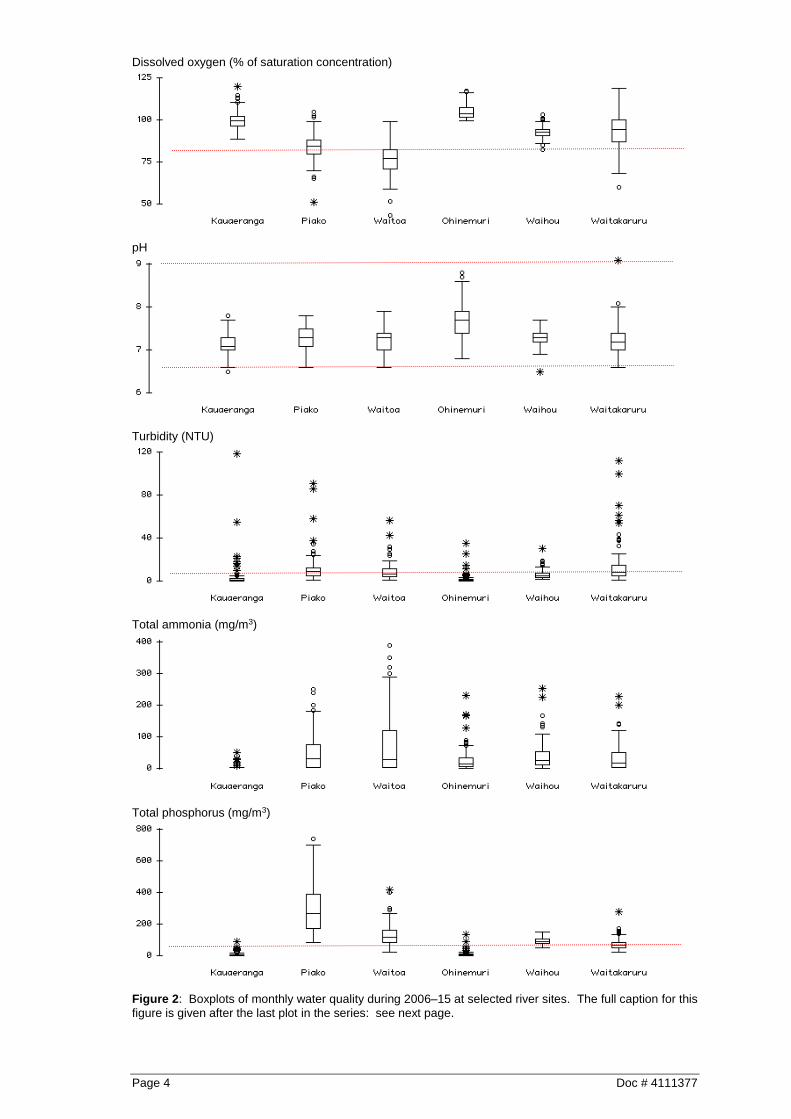
Figure 2: Boxplots of monthly water quality during 2006–15 at selected river sites. The full caption for this
figure is given after the last plot in the series: see next page.

Doc # 4111377 Page 5
Total nitrogen (mg/m3)
Clarity (m)
E. coli (cfu/100 mL)
Figure 2 (continued): Boxplots of monthly water quality during 2006–15 at selected river sites (Kauaeranga
at Smiths, Piako at Paeroa-Tahuna Rd, Waitoa at Mellon Rd, Ohinemuri at Karangahake, Waihou at Te Aroha and Waitakaruru at Coxhead Rd). The central box spans the inter-quartile range with the line in the middle being the median (see Table 2 also); the whiskers encompass most of the data, but outliers are shown as circles and extreme outliers as stars. A small number of extreme outliers lie outside the y-axis range and are not shown. The red dotted lines show the values for satisfactory water quality (see Table 2). Water quality varied markedly between the six sites (Table 2, Figure 2). Overall, most aspects of the water quality of the Kauaeranga River were excellent, whereas several aspects of the water quality of the Piako and Waitoa Rivers in particular were unsatisfactory. Dissolved oxygen The water in the Kauaeranga and Ohinemuri Rivers was generally well-oxygenated, with all of the measurements from the Ohinemuri exceeding 99% of the saturation concentration, and most of those from the Kauaeranga exceeding 90% (and thus being classified as “excellent”). About 80% of the measurements from the Waihou River were excellent. Just 9% of the measurements in the Waitakaruru River were lower than 80% of saturation, and were thus classified as unsatisfactory. But many of the measurements in the Piako and Waitoa Rivers—24% and 71%, respectively—were unsatisfactory. pH Measurements of pH at all six river sites were mostly at least satisfactory; indeed in all cases between 73% (Ohinemuri) and 96% (Waihou) of the measurements showed that pH was excellent (being in the range 7 to 8). Note that about a quarter of the pH

Page 6 Doc # 4111377
measurements from the Ohinemuri exceeded 8, possibly due to the photosynthetic-depletion of inorganic carbon levels in the water by the periphyton growing there. Turbidity The water in the Kauaeranga and Ohinemuri Rivers was generally clear, as indicated by the low turbidity (with 71–75% of measurements being classified as excellent). By contrast, the water of the Piako and Waitakaruru Rivers was often murky, with nearly 80% of measurements being classified as unsatisfactory. The turbidity of the Waihou and Waitoa Rivers was intermediate, with about 35–50% of the measurements being classified as satisfactory. The appearance of the river waters was also affected by the differing amounts of dissolved organic compounds that they contained (Tulagi 2015). Concentrations of these compounds were relatively-high in the Piako, Waitakaruru and Waitoa Rivers, reflecting the large areas of peat wetland that these rivers drain. Concentrations were relatively-low at the sites on the Kauaeranga, Ohinemuri and Waihou Rivers.6 Ammonia Concentrations of a toxic form of nitrogen, total ammonia (or ammoniacal-N), were relatively low at the six sites. Very few of the results were classified as unsatisfactory (1% of samples from the Waitoa River). Concentrations were particularly-low in the Kauaeranga (100% excellent), Ohinemuri (96%), Waihou (93%) and Waitakaruru (92%) Rivers. Many results from the Piako (85%) and Waitoa (70%) Rivers were excellent as well. Nitrogen and phosphorus Concentrations of total nitrogen and total phosphorus varied markedly between the six sites, with concentrations generally being low in the Kauaeranga and Ohinemuri Rivers, moderate in the Waihou and Waitakaruru Rivers and high in the Piako and Waitoa Rivers. The results from the Piako, Waihou and Waitoa Rivers were almost always classified as unsatisfactory. By contrast, in the Kauaeranga River about 80% of the results for total P and 45% of those for total N were classified as excellent. Horizontal clarity The results for water clarity as measured by the visibility of a black disc were similar to those described above for turbidity. Water clarity was moderate-to-high in the Kauaeranga and Ohinemuri Rivers, and poor in the Piako, Waihou, Waitakaruru and Waitoa Rivers. E. coli Concentrations of E. coli were lowest in the Kauaeranga and Ohinemuri Rivers, and highest in the Piako and Waitoa Rivers. While the median concentration in the Ohinemuri River (60 cfu/100 mL) met an earlier (1992) guideline value for safe swimming (namely 126 cfu/100 mL), the 95 percentile concentration was 1990 cfu/100 mL, and thus exceeded the more recent (2003) 550 cfu/100 mL guideline. Water quality at this site can therefore be described as no better than borderline for safe swimming, while conditions at the other five sites were unsuitable for swimming.7 In summary, when compared with the Council guidelines, the water quality of the Hauraki rivers during 2006–15 was variable, as follows:
The water in the Kauaeranga and Ohinemuri Rivers was well-oxygenated; that in the Piako and Waitoa Rivers was often somewhat oxygen-depleted. Conditions in the Waihou and Waitakaruru Rivers were mostly satisfactory or better.
6 Very low concentrations of dissolved organic compounds were found in the spring-fed waters found at the Whites Rd
site on the Waihou River. This site also had the lowest turbidity and highest clarity (Appendix 1). 7 The spring-fed waters of the site on the Waihou River at Whites Rd and the Waiohotu Stream had the lowest
concentrations of E. coli (Appendix 1), with the values during 2006–15 for both the median (40 cfu/100 mL at both sites) and 95 percentile (550 and 350 cfu/100 mL, respectively) meeting the guidelines for safe swimming. The median concentration was also acceptable in the Mangawhero and Piakonui Streams and the Ohinemuri and Waitekauri Rivers, but the 95 percentile values exceeded the more recent guideline. See also section 2.2.
Doc # 4111377 Page 7
The water in the Kauaeranga and Ohinemuri Rivers was generally clear, while that in the Piako and Waitakaruru Rivers was often murky. Although the headwaters of the Waihou River were particularly clear, the water further downstream was rather murky.
Concentrations of ammoniacal-N were relatively-low in all rivers; they were particularly-low in the Kauaeranga, Ohinemuri, Waihou and Waitakaruru Rivers.
Concentrations of total nitrogen and total phosphorus were generally low in the Kauaeranga and Ohinemuri Rivers, and were moderate in the Waihou and Waitakaruru Rivers. But they were were high in the Piako and Waitoa Rivers.
Concentrations of E. coli bacteria were lowest in the Ohinemuri River, although they were only borderline at best for safe swimming. Conditions were not suitable for swimming in the other rivers, with E. coli concentrations being highest in the Piako and Waitoa Rivers.
2.2 Current condition: NOF requirements
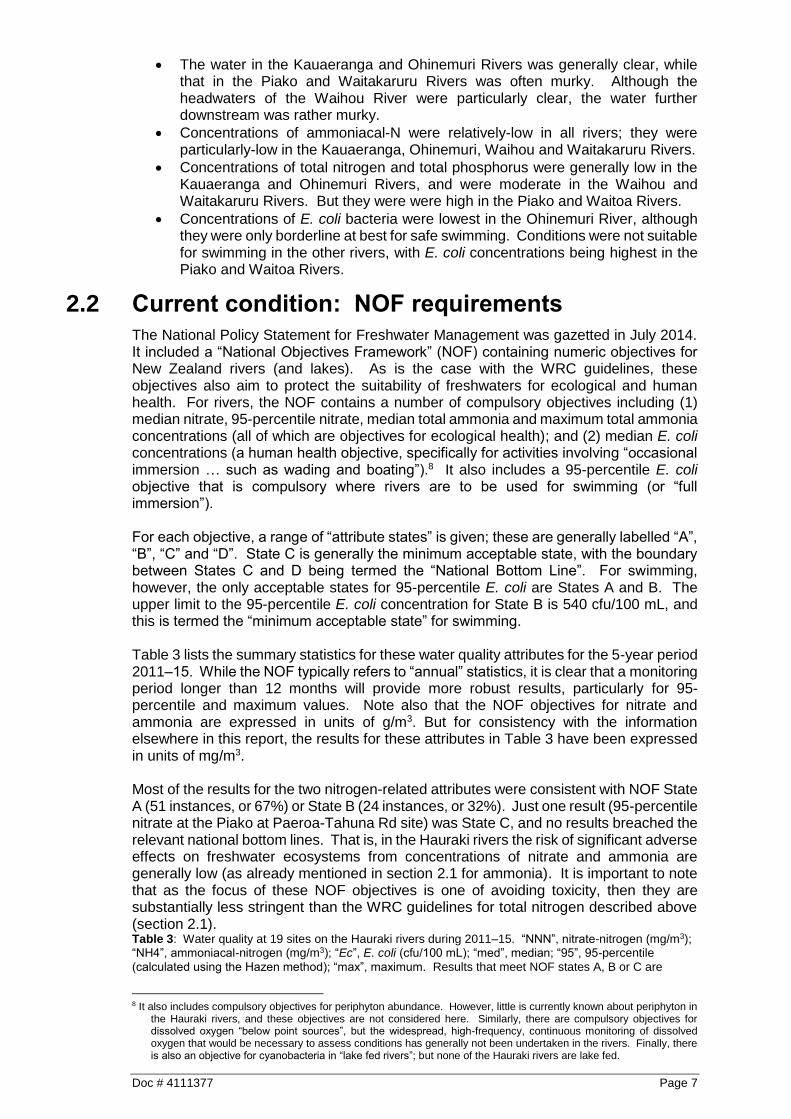
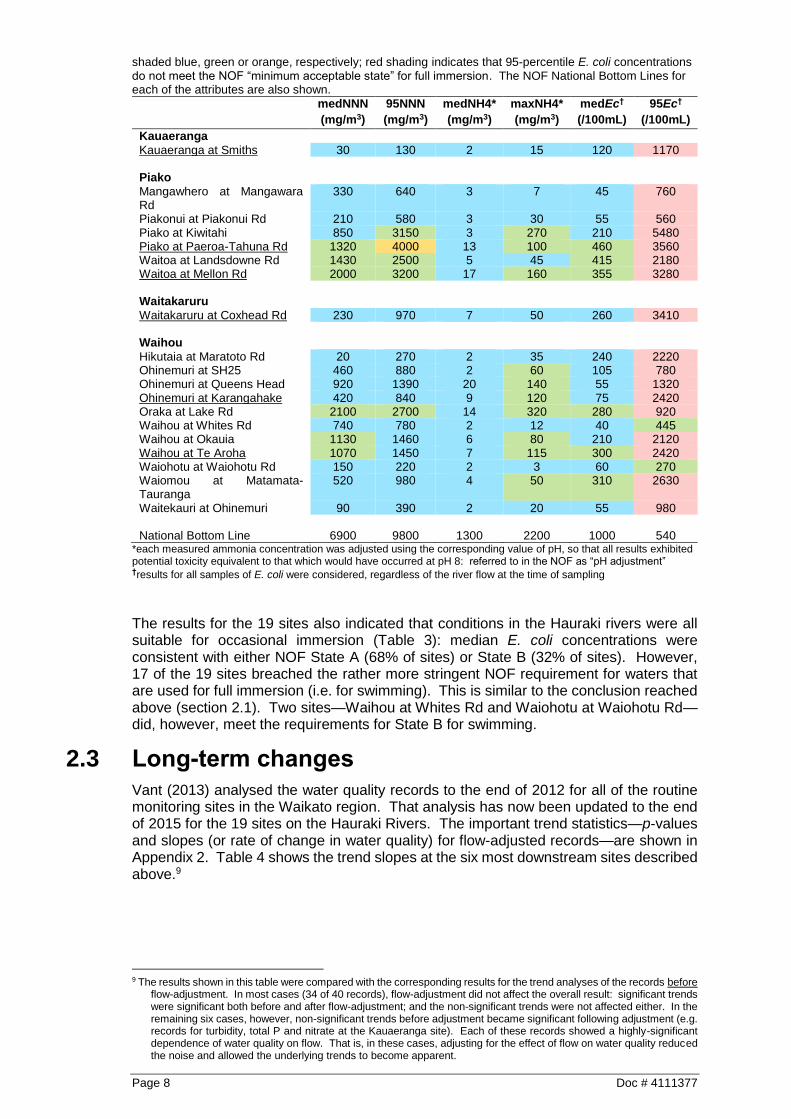
The National Policy Statement for Freshwater Management was gazetted in July 2014. It included a “National Objectives Framework” (NOF) containing numeric objectives for New Zealand rivers (and lakes). As is the case with the WRC guidelines, these objectives also aim to protect the suitability of freshwaters for ecological and human health. For rivers, the NOF contains a number of compulsory objectives including (1) median nitrate, 95-percentile nitrate, median total ammonia and maximum total ammonia concentrations (all of which are objectives for ecological health); and (2) median E. coli concentrations (a human health objective, specifically for activities involving “occasional immersion … such as wading and boating”).8 It also includes a 95-percentile E. coli objective that is compulsory where rivers are to be used for swimming (or “full immersion”). For each objective, a range of “attribute states” is given; these are generally labelled “A”, “B”, “C” and “D”. State C is generally the minimum acceptable state, with the boundary between States C and D being termed the “National Bottom Line”. For swimming, however, the only acceptable states for 95-percentile E. coli are States A and B. The upper limit to the 95-percentile E. coli concentration for State B is 540 cfu/100 mL, and this is termed the “minimum acceptable state” for swimming. Table 3 lists the summary statistics for these water quality attributes for the 5-year period 2011–15. While the NOF typically refers to “annual” statistics, it is clear that a monitoring period longer than 12 months will provide more robust results, particularly for 95-percentile and maximum values. Note also that the NOF objectives for nitrate and ammonia are expressed in units of g/m3. But for consistency with the information elsewhere in this report, the results for these attributes in Table 3 have been expressed in units of mg/m3. Most of the results for the two nitrogen-related attributes were consistent with NOF State A (51 instances, or 67%) or State B (24 instances, or 32%). Just one result (95-percentile nitrate at the Piako at Paeroa-Tahuna Rd site) was State C, and no results breached the relevant national bottom lines. That is, in the Hauraki rivers the risk of significant adverse effects on freshwater ecosystems from concentrations of nitrate and ammonia are generally low (as already mentioned in section 2.1 for ammonia). It is important to note that as the focus of these NOF objectives is one of avoiding toxicity, then they are substantially less stringent than the WRC guidelines for total nitrogen described above (section 2.1). Table 3: Water quality at 19 sites on the Hauraki rivers during 2011–15. “NNN”, nitrate-nitrogen (mg/m3); “NH4”, ammoniacal-nitrogen (mg/m3); “Ec”, E. coli (cfu/100 mL); “med”, median; “95”, 95-percentile
(calculated using the Hazen method); “max”, maximum. Results that meet NOF states A, B or C are
8 It also includes compulsory objectives for periphyton abundance. However, little is currently known about periphyton in
the Hauraki rivers, and these objectives are not considered here. Similarly, there are compulsory objectives for dissolved oxygen “below point sources”, but the widespread, high-frequency, continuous monitoring of dissolved oxygen that would be necessary to assess conditions has generally not been undertaken in the rivers. Finally, there is also an objective for cyanobacteria in “lake fed rivers”; but none of the Hauraki rivers are lake fed.
Page 8 Doc # 4111377
shaded blue, green or orange, respectively; red shading indicates that 95-percentile E. coli concentrations do not meet the NOF “minimum acceptable state” for full immersion. The NOF National Bottom Lines for each of the attributes are also shown.
medNNN
(mg/m3)
95NNN
(mg/m3)
medNH4*
(mg/m3)
maxNH4*
(mg/m3)
medEc†
(/100mL)
95Ec†
(/100mL)
Kauaeranga Kauaeranga at Smiths 30 130 2 15 120 1170 Piako Mangawhero at Mangawara Rd
330 640 3 7 45 760
Piakonui at Piakonui Rd 210 580 3 30 55 560 Piako at Kiwitahi 850 3150 3 270 210 5480 Piako at Paeroa-Tahuna Rd 1320 4000 13 100 460 3560 Waitoa at Landsdowne Rd 1430 2500 5 45 415 2180 Waitoa at Mellon Rd 2000 3200 17 160 355 3280 Waitakaruru Waitakaruru at Coxhead Rd 230 970 7 50 260 3410 Waihou Hikutaia at Maratoto Rd 20 270 2 35 240 2220 Ohinemuri at SH25 460 880 2 60 105 780 Ohinemuri at Queens Head 920 1390 20 140 55 1320 Ohinemuri at Karangahake 420 840 9 120 75 2420 Oraka at Lake Rd 2100 2700 14 320 280 920 Waihou at Whites Rd 740 780 2 12 40 445 Waihou at Okauia 1130 1460 6 80 210 2120 Waihou at Te Aroha 1070 1450 7 115 300 2420 Waiohotu at Waiohotu Rd 150 220 2 3 60 270 Waiomou at Matamata-Tauranga
520 980 4 50 310 2630
Waitekauri at Ohinemuri 90 390 2 20 55 980 National Bottom Line 6900 9800 1300 2200 1000 540
*each measured ammonia concentration was adjusted using the corresponding value of pH, so that all results exhibited potential toxicity equivalent to that which would have occurred at pH 8: referred to in the NOF as “pH adjustment” †results for all samples of E. coli were considered, regardless of the river flow at the time of sampling
The results for the 19 sites also indicated that conditions in the Hauraki rivers were all suitable for occasional immersion (Table 3): median E. coli concentrations were consistent with either NOF State A (68% of sites) or State B (32% of sites). However, 17 of the 19 sites breached the rather more stringent NOF requirement for waters that are used for full immersion (i.e. for swimming). This is similar to the conclusion reached above (section 2.1). Two sites—Waihou at Whites Rd and Waiohotu at Waiohotu Rd—did, however, meet the requirements for State B for swimming.
2.3 Long-term changes
Vant (2013) analysed the water quality records to the end of 2012 for all of the routine monitoring sites in the Waikato region. That analysis has now been updated to the end of 2015 for the 19 sites on the Hauraki Rivers. The important trend statistics—p-values and slopes (or rate of change in water quality) for flow-adjusted records—are shown in Appendix 2. Table 4 shows the trend slopes at the six most downstream sites described above.9
9 The results shown in this table were compared with the corresponding results for the trend analyses of the records before
flow-adjustment. In most cases (34 of 40 records), flow-adjustment did not affect the overall result: significant trends were significant both before and after flow-adjustment; and the non-significant trends were not affected either. In the remaining six cases, however, non-significant trends before adjustment became significant following adjustment (e.g. records for turbidity, total P and nitrate at the Kauaeranga site). Each of these records showed a highly-significant dependence of water quality on flow. That is, in these cases, adjusting for the effect of flow on water quality reduced the noise and allowed the underlying trends to become apparent.

Doc # 4111377 Page 9
This discussion focuses on statistically significant trends (p-value <5%) where the absolute value of the slope is greater than 1% per year. Following Vant (2013), these trends are regarded as being important (with those where the slope is smaller being regarded as “slight trends”). Records where dissolved oxygen and water clarity have increased over time represent an improvement, while a decrease represents a deterioration; for all other variables an increase over time represents a deterioration (and vice versa). In each case Appendix 2 shows the trend statistics for two periods: (1) from 1991–94 to 2015 (22–25 years), and (2) for the decade 2006–15. This discussion deals just with the results for the past 22–25 years. The analyses showed that many (64%) of the records for the 19 sites as a whole showed no important trends (Appendix 2), so that average water quality was broadly stable throughout the period. However, 25% of the records showed important improvements, while 11% showed deteriorations (Appendix 2). The improvements included reductions in total phosphorus at ten sites (e.g. Figures 3A, 3B) and reductions in total ammonia concentrations at nine sites. Furthermore, none of the 19 sites showed deteriorations in total phosphorus or total ammonia. Several of the improvements are likely to be the result of improved treatment of the wastewaters that are discharged to the rivers. For example, the loads of total P discharged from the Waitoa dairy factory and the Waihi sewage treatment plant have decreased markedly (see later), resulting in the downstream improvements in river water quality shown in Figures 3A and 3B, respectively. Similarly, improved treatment of the sewage wastewater discharged from Tirau is likely to be responsible for the improvements in the concentrations of total P and E. coli in the Oraka Stream (Appendix 2). The deteriorations in water quality included increases in turbidity, nitrate, total N and clarity. Interestingly, there were generally a similar number of improvements in each of these variables elsewhere in the Hauraki area (Appendix 2). Some information is available on the nitrate concentrations in the Upper Waihou River (Whites Rd site) in the early 1980s (Hauraki Catchment Board, unpublished results). This is shown in Figure 3D, together with the WRC record. A clear increase with a slope 1.8% per year is apparent over the 30-year period (noting that there are no point source discharges upstream of this location).10 This increase will have contributed to the small increases (0.5% per year) in both nitrate and total N that were observed further downstream at Te Aroha (Table 4). Table 4: Slopes (% per year) of statistically significant (p < 5%) trends at selected sites on the Hauraki rivers
during 1991–2015. See Appendix 2 for further details. Important improvements are shown in bold; important deteriorations are bold and underlined. “ns”, not significant; other abbreviations as in Tables 2 and 3.
Site DO NTU NH4 NNN TP TN Clar Ecoli
Kauaeranga 2 Kauaeranga at Smiths ns 1.5 ns 2.2 0.6 2.6 –1.4 ns Piako 79 Piako at Paeroa-Tahuna Rd 0.2 –1.6 –5.5 –1.2 –0.6 –1.2 ns ns 80 Waitoa at Mellon Rd 0.5 ns –3.7 –0.5 –14.8 –0.8 –1.0 ns Waihou 4 Ohinemuri at Karangahake –0.1 ns –1.9 –0.7 –3.1 –0.5 0.6 ns 3 Waihou at Te Aroha –0.1 ns ns 0.5 –0.4 0.5 ns ns Waitakaruru 31 Waitakaruru at Coxhead Rd –0.2 –1.8 –4.0 –1.6 –1.3 –1.3 1.1 ns
10 Note that nitrate currently meets NOF State A at this site (Table 3), despite the major increase in concentration seen
since the 1980s (Figure 3D). As noted earlier (section 2.2), however, the NOF objectives for nitrate (and ammonia) are not particularly stringent, and are readily met at most locations on the Hauraki rivers.

Page 10 Doc # 4111377
Figure 3: Concentrations of total phosphorus in A, the Waitoa River at Mellon Rd and B, the Ohinemuri River at Karangahake; and concentrations of nitrate in C, the Piako River at Paeroa-Tahuna Rd and D, the
Waihou River at Whites Rd in monthly samples during 1983–2015. Note the differing vertical scales. The dotted lines broadly indicate the overall trends in the records.
The largest number of improvements in the water quality variables at any given site occurred in the Waitakaruru River (Appendix 2, Table 4). In that case the records for six of the eight variables considered showed an improvement (and no records showed a deterioration). The largest number of deteriorations occurred in the Kauaeranga River. In that case the records for four variables showed a deterioration, and no records showed an improvement. Given that the water quality of the Kauaeranga River is typically excellent (section 2.1), this general deterioration is of some concern.
Doc # 4111377 Page 11
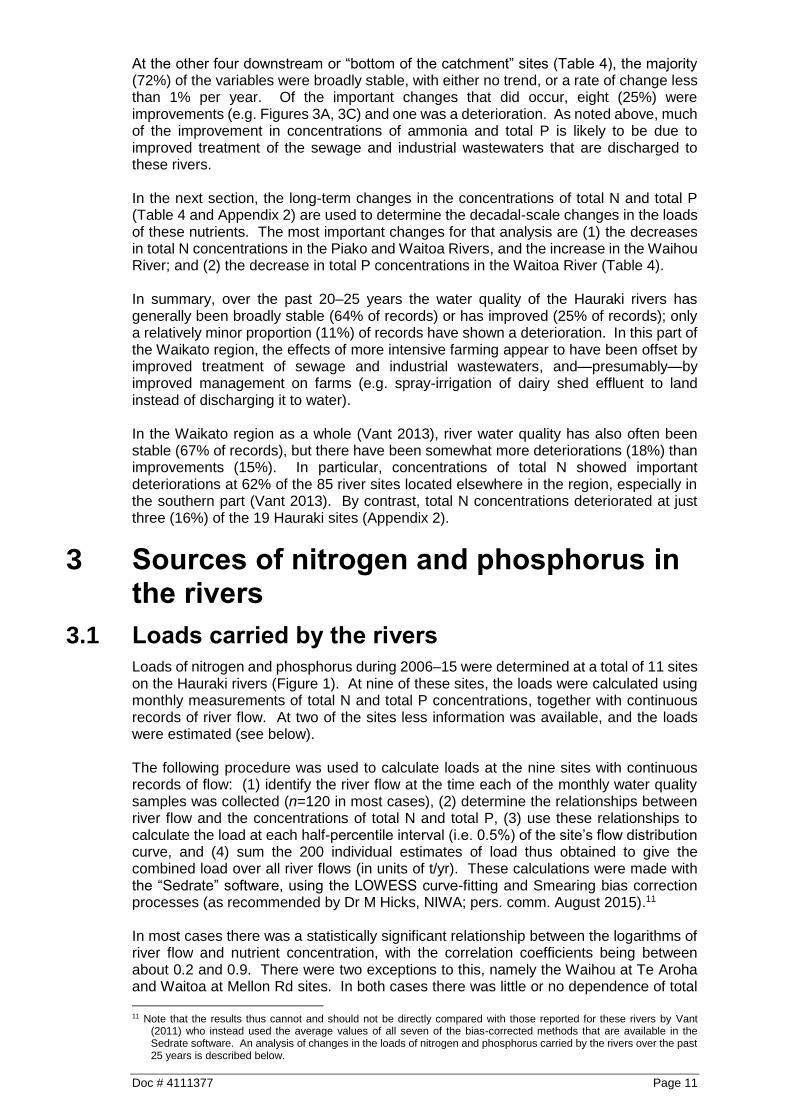
At the other four downstream or “bottom of the catchment” sites (Table 4), the majority (72%) of the variables were broadly stable, with either no trend, or a rate of change less than 1% per year. Of the important changes that did occur, eight (25%) were improvements (e.g. Figures 3A, 3C) and one was a deterioration. As noted above, much of the improvement in concentrations of ammonia and total P is likely to be due to improved treatment of the sewage and industrial wastewaters that are discharged to these rivers. In the next section, the long-term changes in the concentrations of total N and total P (Table 4 and Appendix 2) are used to determine the decadal-scale changes in the loads of these nutrients. The most important changes for that analysis are (1) the decreases in total N concentrations in the Piako and Waitoa Rivers, and the increase in the Waihou River; and (2) the decrease in total P concentrations in the Waitoa River (Table 4). In summary, over the past 20–25 years the water quality of the Hauraki rivers has generally been broadly stable (64% of records) or has improved (25% of records); only a relatively minor proportion (11%) of records have shown a deterioration. In this part of the Waikato region, the effects of more intensive farming appear to have been offset by improved treatment of sewage and industrial wastewaters, and—presumably—by improved management on farms (e.g. spray-irrigation of dairy shed effluent to land instead of discharging it to water). In the Waikato region as a whole (Vant 2013), river water quality has also often been stable (67% of records), but there have been somewhat more deteriorations (18%) than improvements (15%). In particular, concentrations of total N showed important deteriorations at 62% of the 85 river sites located elsewhere in the region, especially in the southern part (Vant 2013). By contrast, total N concentrations deteriorated at just three (16%) of the 19 Hauraki sites (Appendix 2).
3 Sources of nitrogen and phosphorus in the rivers
3.1 Loads carried by the rivers
Loads of nitrogen and phosphorus during 2006–15 were determined at a total of 11 sites on the Hauraki rivers (Figure 1). At nine of these sites, the loads were calculated using monthly measurements of total N and total P concentrations, together with continuous records of river flow. At two of the sites less information was available, and the loads were estimated (see below). The following procedure was used to calculate loads at the nine sites with continuous records of flow: (1) identify the river flow at the time each of the monthly water quality samples was collected (n=120 in most cases), (2) determine the relationships between river flow and the concentrations of total N and total P, (3) use these relationships to calculate the load at each half-percentile interval (i.e. 0.5%) of the site’s flow distribution curve, and (4) sum the 200 individual estimates of load thus obtained to give the combined load over all river flows (in units of t/yr). These calculations were made with the “Sedrate” software, using the LOWESS curve-fitting and Smearing bias correction processes (as recommended by Dr M Hicks, NIWA; pers. comm. August 2015).11 In most cases there was a statistically significant relationship between the logarithms of river flow and nutrient concentration, with the correlation coefficients being between about 0.2 and 0.9. There were two exceptions to this, namely the Waihou at Te Aroha and Waitoa at Mellon Rd sites. In both cases there was little or no dependence of total
11 Note that the results thus cannot and should not be directly compared with those reported for these rivers by Vant
(2011) who instead used the average values of all seven of the bias-corrected methods that are available in the Sedrate software. An analysis of changes in the loads of nitrogen and phosphorus carried by the rivers over the past 25 years is described below.

Page 12 Doc # 4111377
phosphorus concentration on river flow (r=0.1 and 0.0, respectively). Figure 4 shows how the concentrations of total N and total P varied with flow at the Waitoa at Landsdowne Rd site. In each case, higher flows tended to be associated with higher concentrations, with the log-log correlation coefficients being 0.76 and 0.67 for total N and total P, respectively. The extent to which the loads of total N and total P varied at each site also depended on the extent to which flows themselves varied, with some sites exhibiting less flow variability than others. For example, high flow (95-percentile) in the Piako River at Paeroa-Tahuna Rd was about 40 times higher than low flow (5-percentile); but in the Waihou River at Te Aroha high flow was just three times higher than low flow. The seasonal variation in the loads of total N and total P at these two sites is shown in Figure 5. Loads of both total N and total P tended to be 10–100 times higher during the winter than in the summer at the Piako River site, whereas the loads at the Waihou River site showed much less seasonal variability. There was no record of river flow at the Hikutaia River site (catchment area 73 km2). In this case, the flow at the time of each monthly sampling visit was estimated from the corresponding flow in the Kauaeranga River, taking account of the catchment areas at the two locations. The estimated flows and measured concentrations were used to calculate flow-weighted average concentrations of total N and total P at the Hikutaia River site. Following Littlewood et al. (1998), loads were then calculated by multiplying the flow-weighted average concentrations by the average flow in the Hikutaia River during 2006–15 (which was also estimated from the average flow in the Kauaeranga, taking account of the respective areas). A similar approach was used to calculate the loads during 2006–15 at the Waitakaruru site (catchment area 50 km2). In this case the flow record used was from the Jefferies Rd site on the Mangawara River (catchment area 98 km2), 25 km to the south. Table 5 shows the average loads of nitrogen and phosphorus at the 11 river monitoring sites during 2006–15. The combined flow of the Hauraki rivers averaged about 69 m3/s, with the combined loads of total N and total P averaging about 3670 t/yr and 200 t/yr, respectively (but see later for more comprehensive estimates). The Waihou River system was the largest, and carried the greatest share of the nutrients. While the Kauaeranga River carried about 8% of the combined river flow, it only carried 2% of the
Figure 4: Monthly measurements of flow and A, total nitrogen, and B, total phosphorus at the Waitoa at
Landsdowne Rd site, 2006–15.

Doc # 4111377 Page 13
Figure 5: Loads of nitrogen and phosphorus in the Piako River (Paeroa-Tahuna Rd; black circles, solid line)
and the Waihou River (Te Aroha; red crosses, dotted line) at monthly intervals during 2006–15.
Table 5: Average flows and loads of nitrogen and phosphorus in four Hauraki river systems, 2006–15 (site
locations in Figure 1). The most downstream sites are shown underlined. Values in italics are estimated: see text. Note that the totals are lower than the more comprehensive values shown in Table 9.
Flow (m3/s) Nitrogen (t/yr) Phosphorus (t/yr)
Kauaeranga Kauaeranga at Smiths 5.3 (8%) 61 (2%) 4 (2%) Piako Piako at Kiwitahi 1.7 244 6 Piako at Paeroa-Tahuna Rd 7.6 997 46 Waitoa at Landsdowne Rd 1.6 150 6 Waitoa at Mellon Rd 5.0 581 23
Piako combined 12.6 (18%) 1578 (43%) 69 (35%) Waihou Hikutaia at Maratoto Rd 3.3 52 4 Ohinemuri at Queens Head 5.1 291 4 Ohinemuri at Karangahake 11.6 428 9 Waihou at Okauia 26.4 1248 85 Waihou at Te Aroha 34.7 1515 109
Waihou combined 49.7 (72%) 1996 (54%) 122 (62%) Waitakaruru Waitakaruru at Coxhead Rd 0.9 (1%) 32 (1%) 3 (1%) All four rivers 68.5 (100%) 3666 (100%) 198 (100%)

Page 14 Doc # 4111377
loads of nitrogen and phosphorus. Conversely, the Piako River system carried 18% of the combined river flow, but between 35% and 43% of the loads of nitrogen and phosphorus. These differences largely reflected the lower concentrations of total N and total P found in the Kauaeranga River (Table 2). The Ohinemuri River also had relatively low nutrient concentrations and carried a disproportionately-low share of the nutrient loads. The rates of change in the concentrations of nitrogen and phosphorus that were described earlier (section 2.3) can now be used to identify the long term changes in the loads of these nutrients carried by the rivers. Table 6 shows the nitrogen and phosphorus loads at the seven downstream locations on the Hauraki rivers during 2006–15 (from Table 5). It also shows the corresponding rates of change in the nitrogen and phosphorus concentrations during the past 25 years (1991–2015) and the past decade (2006–15): data from Appendix 2. The contributions of individual sites or individual rivers to the changes in the combined nitrogen or phosphorus load can be compared using this information. For example, Table 6 shows that the nitrogen load carried by the Waihou at Te Aroha was 1515 t/yr, and that this changed at an average rate of 0.5% per year during 1991–2015, being an annual increase of about 7.2 t/yr. As noted above (section 2.3), changes in the upper catchment at Whites Rd (see Figure 3D) will have contributed to this, with an average annual increase at that location of about 1.7 t/yr.12 However, these increases in the Waihou catchment were more than offset by the annual decrease in the nitrogen load carried by the Piako at Paeroa-Tahuna Rd of about –11.5 t/yr (= 997 t/yr, decreasing at an average rate of –1.2% per year). The net effect of these and the other changes shown in Table 6 was that during 1991–2015 the average load of nitrogen carried by the Hauraki rivers as a whole decreased by about –0.3% or –11 t/yr per year. The load-weighted average rate of change (Table 6) is a measure of the size of the overall change in the combined nutrient load carried by the rivers as a whole. As noted above, the average rate of change in the load of nitrogen carried by the Hauraki rivers during 1991–2015 was –0.3% per year; the average rate of change during 2006–15 was –1.2% per year (Table 6). Similarly, the average rate of change in the load of phosphorus carried by the Hauraki rivers during 1991–2015 was –2.3% per year, and the average rate of change during 2006–15 was –3.1% per year. That is, Table 6 shows that the combined load of nitrogen carried by the Hauraki rivers has decreased slightly over the past 25 years (–0.3% per year), while that of phosphorus has decreased by a moderate amount (–2.3% per year). Table 6: Rates of change in the loads of nitrogen and phosphorus carried by seven Hauraki rivers. The
loads during 2006–15 are from Table 5, and the rates of change in concentration (Δ, % per year) during 1991–2015 and 2006–15 are the slopes from Table 4 and Appendix 2. Note that slopes of non-significant trends (p > 5%) have been set to equal zero. “Khake”, Karangahake.
Nitrogen Phosphorus Load (t/yr) Δ1991–2015 Δ2006–15 Load (t/yr) Δ1991–2015 Δ2006–15
Waihou (Te Aroha) 1515 +0.5 0 109 –0.4 –3.0 Piako (PT Rd) 997 –1.2 –3.2 46 –0.6 –2.9 Waitoa (Mellon) 581 –0.8 0 23 –14.8 –4.5 Ohinemuri (Khake) 428 –0.5 –2.8 9 –3.1 –2.4 Kauaeranga 61 +2.6 0 4 +0.6 0 Hikutaia 52 –1.4 0 4 –2.0 –4.2 Waitakaruru 32 –1.3 0 3 –1.3 –3.8 Average (load-weighted) –0.3 –1.2 –2.3 –3.1
12 The average load of total N carried at Whites Rd was estimated as 107 t/yr, based on the average value of nine flow
gaugings undertaken there by WRC during 2001–16, namely about 4.5 m3/s (WRC unpublished results, document 9012254), and an average total N concentration during 2006–15 of 750 mg/m3. At an average rate of change during 1991–2015 of 1.6% per year (Appendix 2), this is equivalent to an annual increase in the load carried at this location of 1.7 t/yr.

Doc # 4111377 Page 15
3.2 Loads from point sources
Monitoring information Figure 6 shows the location of 24 sites where contaminants are discharged to the Hauraki rivers: 11 in the greater Piako catchment, 12 in the greater Waihou catchment and one to the Waitakaruru River. Each can be regarded as being a moderate-to-large point source of nitrogen and phosphorus. Some 14 of these locations are sites where sewage wastewaters from towns and other smaller settlements are treated, while the remaining ten are various industrial sites, mainly dairy factories and meatworks (Table 7). In each case the discharge of treated wastewater is permitted by a resource consent issued by the Waikato Regional Council. The terms of these consents generally limit both the volume and the water quality of the effluent that may be discharged; they also require the consent holders to regularly monitor these variables and to provide this information to the Council.
Figure 6: Location of 24 discharges of wastewaters discharging to the Hauraki rivers.
See Table 7 for further details.

Page 16 Doc # 4111377
Table 7: Summary of consent monitoring information held by Waikato Regional Council
for 24 point source discharges to the Hauraki rivers, 2006–15. “Int”, intermittent discharge: loads were calculated for periods when discharge to water occurred.
Site WRC document
number
Period Number of samples
(N, P)
Sewage wastewater
A Morrinsville 4103351 2010–13 133, 144 B Thames 4103630 2006–15 109, 108 C Te Aroha 4103413 2010–12 37, 38 D Paeroa 4106251 2006–15 120, 120 E Matamata 4103427 2010–14 71, 90 F Waihi 4105536 2006–15 1081, 108 G Putaruru 4078729 2006–15 115, 113 H Ngatea 4109169 2008–15 84, 84 I Tirau 4079532 2008–15 92, 91 J Kerepehi 4108688 2009–15 113, 114 K Turua 6119961 2006–15 106, 106 L Waihou 4103543 2006–12 822, 782
M Tahuna 4103393 2009–13 39, 39 N Waitakaruru 6121490 2008–15 351, 354 Industrial wastewater
O Waihi gold mine 4103172 2006–15 36523, – P Waitoa dairy factory 8338554 2006–15 296, 301 Q Tirau dairy factory 8412655 2006–15 443, 442 R Te Aroha meatworks 4102479 2006–14 90, 87 S Waitoa poultry processor (Int) 4099776 2006–15 171, 227 T Waitoa meatworks (Int) 3855752 2006–15 190, 110 U Morrinsville dairy factory 8770554 2006–15 166, 189 V Tatuanui dairy factory (Int) 3893961 2006–15 113, 113 W Paeroa meatworks (Int) 4102448 2006–12 152, 160 X Waharoa dairy factory (Int) 3920447 2010–15 59, 59
Notes 1. Total Kjeldahl N only (no NNN) 2. Dissolved forms only (DIN and DRP) 3. Ammoniacal-N only, noting that some additional results suggest that this is likely to underestimate the concentration (and load) of total N at this site by a factor of two or more
This consent monitoring information was used to determine the average loads of nitrogen and phosphorus that were discharged from each of the point sources during 2006–15. Electronic copies of the monitoring information were generally available in the Council’s document management system. These records were retrieved, collated and checked for errors. In most cases, daily wastewater volumes were recorded; samples of wastewater were often collected monthly, although fortnightly, weekly or even daily samples were collected in other cases (Table 7). However, the available records varied in their completeness: records spanning much or most of the decade were available for nine sites (D, F, O, P, Q, S, T, V and X); and reasonably-complete records were available for a further ten sites (Table 7). Although the amount of information available for the remaining five sites was limited or patchy, it was regarded as being adequate for determining the decadal-average results used here. The wastewater samples were usually analysed for total nitrogen and total phosphorus, but in some cases these variables needed to be estimated from the results of other analyses, including ammoniacal-N (Waihi gold mine), ammoniacal-N and nitrate (Waihou sewage), Kjeldahl-N (Waihi sewage) and dissolved reactive P (Waihou sewage). Note that in a few cases where the records of total nitrogen and total phosphorus were somewhat limited, longer records of dissolved forms of these nutrients were available (e.g. Te Aroha sewage), but these were not used.
Doc # 4111377 Page 17
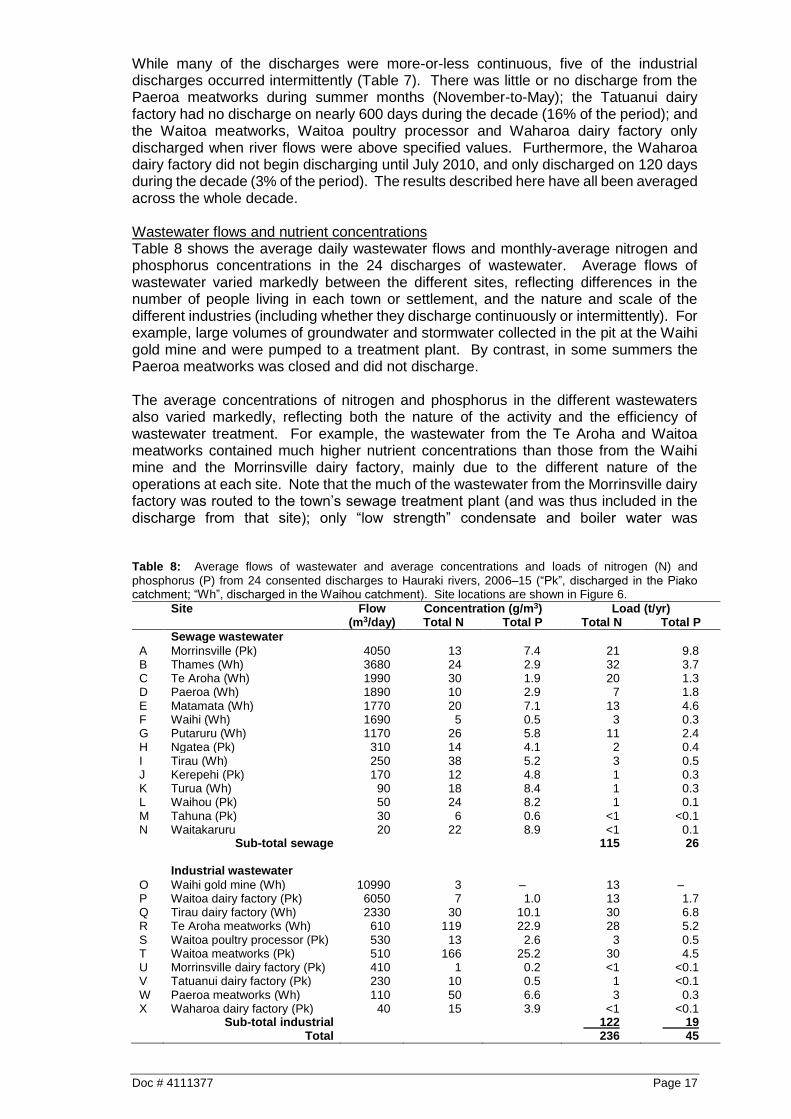
While many of the discharges were more-or-less continuous, five of the industrial discharges occurred intermittently (Table 7). There was little or no discharge from the Paeroa meatworks during summer months (November-to-May); the Tatuanui dairy factory had no discharge on nearly 600 days during the decade (16% of the period); and the Waitoa meatworks, Waitoa poultry processor and Waharoa dairy factory only discharged when river flows were above specified values. Furthermore, the Waharoa dairy factory did not begin discharging until July 2010, and only discharged on 120 days during the decade (3% of the period). The results described here have all been averaged across the whole decade. Wastewater flows and nutrient concentrations Table 8 shows the average daily wastewater flows and monthly-average nitrogen and phosphorus concentrations in the 24 discharges of wastewater. Average flows of wastewater varied markedly between the different sites, reflecting differences in the number of people living in each town or settlement, and the nature and scale of the different industries (including whether they discharge continuously or intermittently). For example, large volumes of groundwater and stormwater collected in the pit at the Waihi gold mine and were pumped to a treatment plant. By contrast, in some summers the Paeroa meatworks was closed and did not discharge. The average concentrations of nitrogen and phosphorus in the different wastewaters also varied markedly, reflecting both the nature of the activity and the efficiency of wastewater treatment. For example, the wastewater from the Te Aroha and Waitoa meatworks contained much higher nutrient concentrations than those from the Waihi mine and the Morrinsville dairy factory, mainly due to the different nature of the operations at each site. Note that the much of the wastewater from the Morrinsville dairy factory was routed to the town’s sewage treatment plant (and was thus included in the discharge from that site); only “low strength” condensate and boiler water was Table 8: Average flows of wastewater and average concentrations and loads of nitrogen (N) and
phosphorus (P) from 24 consented discharges to Hauraki rivers, 2006–15 (“Pk”, discharged in the Piako catchment; “Wh”, discharged in the Waihou catchment). Site locations are shown in Figure 6.
Site Flow Concentration (g/m3) Load (t/yr) (m3/day) Total N Total P Total N Total P
Sewage wastewater A Morrinsville (Pk) 4050 13 7.4 21 9.8 B Thames (Wh) 3680 24 2.9 32 3.7 C Te Aroha (Wh) 1990 30 1.9 20 1.3 D Paeroa (Wh) 1890 10 2.9 7 1.8 E Matamata (Wh) 1770 20 7.1 13 4.6 F Waihi (Wh) 1690 5 0.5 3 0.3 G Putaruru (Wh) 1170 26 5.8 11 2.4 H Ngatea (Pk) 310 14 4.1 2 0.4 I Tirau (Wh) 250 38 5.2 3 0.5 J Kerepehi (Pk) 170 12 4.8 1 0.3 K Turua (Wh) 90 18 8.4 1 0.3 L Waihou (Pk) 50 24 8.2 1 0.1 M Tahuna (Pk) 30 6 0.6 <1 <0.1 N Waitakaruru 20 22 8.9 <1 0.1 Sub-total sewage 115 26
Industrial wastewater O Waihi gold mine (Wh) 10990 3 – 13 – P Waitoa dairy factory (Pk) 6050 7 1.0 13 1.7 Q Tirau dairy factory (Wh) 2330 30 10.1 30 6.8 R Te Aroha meatworks (Wh) 610 119 22.9 28 5.2 S Waitoa poultry processor (Pk) 530 13 2.6 3 0.5 T Waitoa meatworks (Pk) 510 166 25.2 30 4.5 U Morrinsville dairy factory (Pk) 410 1 0.2 <1 <0.1 V Tatuanui dairy factory (Pk) 230 10 0.5 1 <0.1 W Paeroa meatworks (Wh) 110 50 6.6 3 0.3 X Waharoa dairy factory (Pk) 40 15 3.9 <1 <0.1 Sub-total industrial 122 19 Total 236 45

Page 18 Doc # 4111377
discharged directly from the factory. The wastewaters from the other dairy factories, by contrast, generally came from a wider range of factory processes. Loads In most cases, average values of wastewater flow and nutrient concentration were calculated for each month. Multiplying these values together gave the average nutrient load discharged in that month. Following Vant (2011, 2014), unbiased estimates of the average nutrient load over the decade 2006–15 were obtained by averaging these individual monthly loads. That is, loads were calculated as the “average of the products”, rather than as the “product of the averages” (i.e. decadal-average flow times decadal-average concentration). Leaving aside the Waihi gold mine discharge (where daily records of both flow and concentration were available), the average number of separate monthly products of flow and concentration available for both nitrogen and phosphorus in the various discharges during the decade (i.e. 120 months) was about 74 (range 15–115). Figure 7 shows the monthly-average loads of nitrogen (Figure 7A) and phosphorus (Figures 7B-to-E) at four selected sites. The combined load of nitrogen discharged from the 24 moderate-to-large point sources during 2006–15 averaged about 236 t/yr (Table 8). Two-thirds of this came from six sites: Thames sewage (14%), Tirau dairy factory (13%), Waitoa meatworks (13%), Te Aroha meatworks (12%), Morrinsville sewage (9%) and Te Aroha sewage (9%). By contrast, nine sites each contributed less than 1% of the total. For phosphorus, the combined load averaged about 45 t/yr (Table 8). Three-quarters of this came from six sites: Morrinsville sewage (22%), Tirau dairy factory (15%), Te Aroha meatworks (12%), Waitoa meatworks (10%), Matamata sewage (10%) and Thames sewage (8%). By contrast, 11 sites each contributed less than 1% of the total. The available records of monthly load at each site were analysed to determine whether average values had changed over the decade. No statistically significant trends were apparent in 60% of the records. Loads of nitrogen decreased at seven sites (B, G, J, N, O, T and X; e.g. Figure 7A), and those of phosphorus decreased at ten sites (B, F, G, I, J, N, P, T, U and X; e.g. Figures 7B-to-E).13 At one site—Morrinsville sewage—the loads of both nitrogen and phosphorus increased over the decade—although the information available for this site was rather limited. Because of the patchy nature of some of the records—particularly those for some of the larger discharges—it was not possible to rigorously determine the nature of any changes in the combined loads from the 24 point sources. However, analysis of synthetic records generated by filling the gaps in the monthly data by interpolation does suggest that the combined loads of nitrogen and of phosphorus discharged from these point sources decreased during 2006–15 (at an average rate of about 3% per year over the decade).
13 Note that the load of phosphorus discharged from the Waitoa dairy factory has decreased markedly since the 1990s:
see Figure 7E (inset) and Vant (1999, 2011).

Doc # 4111377 Page 19
Figure 7: Monthly-average loads of nitrogen or phosphorus from four selected point sources during 2006–15. A, Thames sewage (nitrogen); B, Thames sewage (phosphorus); C, Putaruru sewage (phosphorus); D, Tirau sewage (phosphorus); and E, Waitoa dairy factory (phosphorus); inset: annual average values
during 2000–15 for this discharge (with data shown as open circles being from Vant 2011). Note differing vertical scales.
Page 20 Doc # 4111377
3.3 Components of the total loads in rivers
The loads of nitrogen and phosphorus discharged from the point sources described above (Table 8) may now be compared with the total loads of these nutrients that are carried by the Hauraki rivers (Table 5). Furthermore, by estimating the contributions from background—that is, the loads that would have been carried by the rivers prior to development of their catchments—it is possible to also estimate the loads that have resulted from the development of the land. The only information for the Kauaeranga River is for the monitoring site at Smiths (Figure 1). The individual components of the overall load were therefore calculated for this site. The discharge of sewage wastewater from the settlement of Waitakaruru enters the Waitakaruru River downstream of the monitoring site at Coxhead Rd, so the wastewater load was added to that carried at Coxhead Rd. There are two downstream sites in the Piako catchment—Piako River at Paeroa-Tahuna Rd and Waitoa River at Mellon Rd—and the loads at these sites were combined.14 The discharges of sewage wastewater from Kerepehi, Ngatea and Tahuna enter the Piako River downstream of these monitoring sites, so the loads from these three point sources were added to those for the river sites to obtain the combined load for the Piako River. The most downstream monitoring site on the Waihou River itself is at Te Aroha (noting that this site is more than 65 km from the mouth of the river). Various tributaries (Figure 1)—including the moderately-large Ohinemuri River—and several point source discharges (Figure 6) enter the river downstream of the monitoring site at Te Aroha. The nutrient loads at the mouth of the Waihou River were therefore estimated as being (at least) the sum of the values for the following sites: Waihou River at Te Aroha, Ohinemuri River at Karangahake and Hikutaia Stream at Maratoto Rd, plus the wastewater from the Paeroa meatworks and the sewage wastewaters from Paeroa, Te Aroha, Thames and Turua. Table 9 shows the average loads of nitrogen and phosphorus carried by the four Hauraki rivers during 2006–16. The contributions to these loads from the point source discharges listed in Table 8 are also shown. Following Vant (2011, 2014), pre-development or background loads were calculated from the respective catchment areas (Table 1) and estimates of the specific yields from undeveloped land, namely 3 kg/ha/yr for nitrogen and 0.3 kg/ha/yr for phosphorus, based on the information in Jenkins & Vant (2007, see their Table 2). Subtracting the point source and background loads from the total load gives an estimate of the load that is associated with the areas of the catchment that have been developed (generally for pastoral farming)—called “Landuse” in Table 9. Altogether, on average the four rivers carried about 3731 t/yr of nitrogen and 206 t/yr of phosphorus to the Firth of Thames (Table 9). The Waihou River carried 55–63% of the combined loads while the Piako carried 34–42%; the Kauaeranga and Waitakaruru Rivers each carried 1–2%. Point source discharges contributed 5% of the nitrogen carried by the Piako River and 8% of that carried by the Waihou River. Overall, point sources contributed just 6% of the load of nitrogen that was carried by the Hauraki rivers into the Firth of Thames. However, the discharges were important sources of the phosphorus load carried by the rivers, accounting for 25% of the load in the Piako River and 21% of that in the Waihou River. Overall, point sources contributed about 22% of the load of phosphorus that was carried by the Hauraki rivers into the Firth of Thames. As noted above, runoff and leaching from all land in the catchment—both developed and undeveloped—contributes nutrients to the rivers. In the absence of other information, the background contribution from land that has been developed is assumed in this analysis to be the same as that from an equivalent area of undeveloped land. So land
14 The catchment area upstream of the monitoring site on the Mangawhero Stream is small (<3 km2), so the mass flows
at this point will also be small and were thus discounted.
Doc # 4111377 Page 21
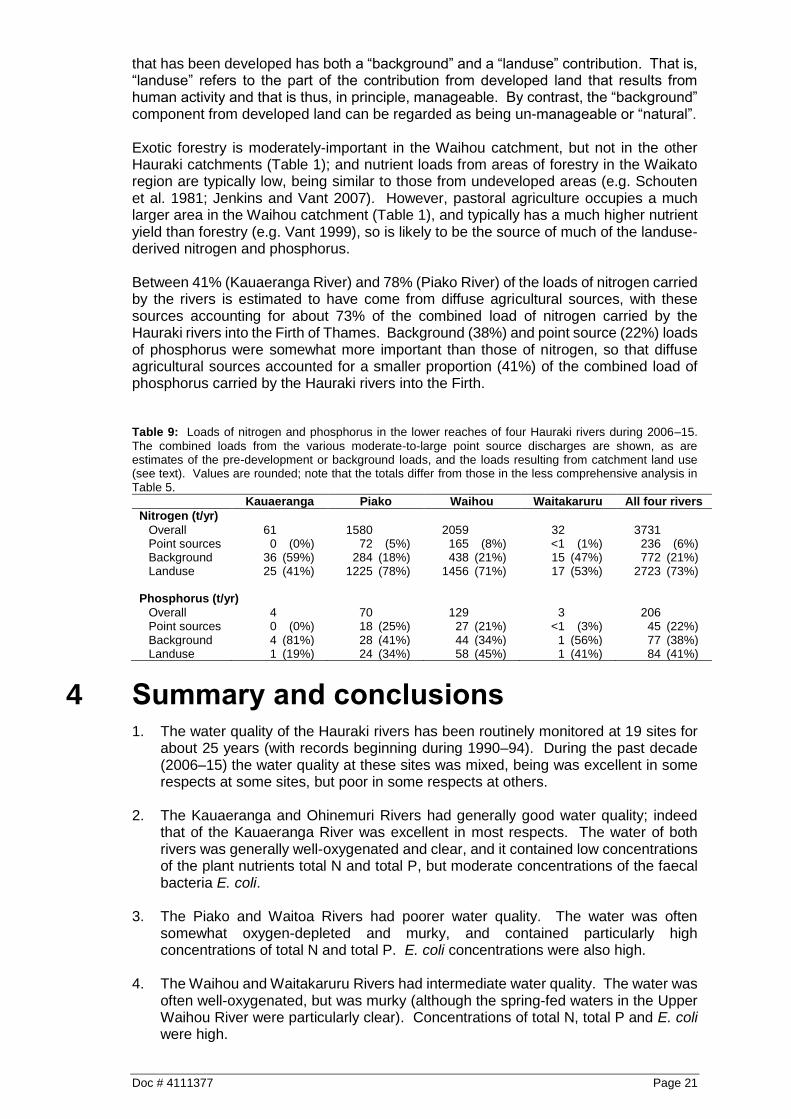
that has been developed has both a “background” and a “landuse” contribution. That is, “landuse” refers to the part of the contribution from developed land that results from human activity and that is thus, in principle, manageable. By contrast, the “background” component from developed land can be regarded as being un-manageable or “natural”. Exotic forestry is moderately-important in the Waihou catchment, but not in the other Hauraki catchments (Table 1); and nutrient loads from areas of forestry in the Waikato region are typically low, being similar to those from undeveloped areas (e.g. Schouten et al. 1981; Jenkins and Vant 2007). However, pastoral agriculture occupies a much larger area in the Waihou catchment (Table 1), and typically has a much higher nutrient yield than forestry (e.g. Vant 1999), so is likely to be the source of much of the landuse-derived nitrogen and phosphorus. Between 41% (Kauaeranga River) and 78% (Piako River) of the loads of nitrogen carried by the rivers is estimated to have come from diffuse agricultural sources, with these sources accounting for about 73% of the combined load of nitrogen carried by the Hauraki rivers into the Firth of Thames. Background (38%) and point source (22%) loads of phosphorus were somewhat more important than those of nitrogen, so that diffuse agricultural sources accounted for a smaller proportion (41%) of the combined load of phosphorus carried by the Hauraki rivers into the Firth. Table 9: Loads of nitrogen and phosphorus in the lower reaches of four Hauraki rivers during 2006–15.
The combined loads from the various moderate-to-large point source discharges are shown, as are estimates of the pre-development or background loads, and the loads resulting from catchment land use (see text). Values are rounded; note that the totals differ from those in the less comprehensive analysis in Table 5.
Kauaeranga Piako Waihou Waitakaruru All four rivers
Nitrogen (t/yr) Overall 61 1580 2059 32 3731 Point sources 0 (0%) 72 (5%) 165 (8%) <1 (1%) 236 (6%) Background 36 (59%) 284 (18%) 438 (21%) 15 (47%) 772 (21%) Landuse 25 (41%) 1225 (78%) 1456 (71%) 17 (53%) 2723 (73%) Phosphorus (t/yr) Overall 4 70 129 3 206 Point sources 0 (0%) 18 (25%) 27 (21%) <1 (3%) 45 (22%) Background 4 (81%) 28 (41%) 44 (34%) 1 (56%) 77 (38%) Landuse 1 (19%) 24 (34%) 58 (45%) 1 (41%) 84 (41%)
4 Summary and conclusions 1. The water quality of the Hauraki rivers has been routinely monitored at 19 sites for
about 25 years (with records beginning during 1990–94). During the past decade (2006–15) the water quality at these sites was mixed, being was excellent in some respects at some sites, but poor in some respects at others.
2. The Kauaeranga and Ohinemuri Rivers had generally good water quality; indeed
that of the Kauaeranga River was excellent in most respects. The water of both rivers was generally well-oxygenated and clear, and it contained low concentrations of the plant nutrients total N and total P, but moderate concentrations of the faecal bacteria E. coli.
3. The Piako and Waitoa Rivers had poorer water quality. The water was often
somewhat oxygen-depleted and murky, and contained particularly high concentrations of total N and total P. E. coli concentrations were also high.
4. The Waihou and Waitakaruru Rivers had intermediate water quality. The water was
often well-oxygenated, but was murky (although the spring-fed waters in the Upper Waihou River were particularly clear). Concentrations of total N, total P and E. coli were high.

Page 22 Doc # 4111377
5. The water quality at each monitoring site was compared with the requirements of the recently-released National Objectives Framework. Most sites easily met the compulsory, toxicity-based requirements for concentrations of both nitrate and total ammonia, with the majority of results being classed as either State A (67%) or B (32%). The sites also met the compulsory E. coli requirements for waters used for occasional immersion (“such as wading and boating”). However, all but two sites breached the more stringent—but optional—E. coli requirement for waters used for full immersion.
6. The records of water quality at the 19 river sites during 1991–2015 were examined
for the presence of long-term changes (or “trends”). Many (64%) of the records showed no important trends, so that average water quality was broadly stable over the past 22–25 years. Some 25% of the records showed important improvements, however, while 11% showed deteriorations.
7. Concentrations of total phosphorus in particular have improved at half of the
monitoring sites, often as a result of the improved treatment of the wastewaters that are discharged to the rivers. Concentrations of total nitrogen also improved at a few sites (four), but they deteriorated at a few others (three). It appears as though most of the increase in nutrient concentrations in the Hauraki rivers—and it has been a substantial increase (Table 9)—occurred more than 20 years ago. Since then, more intensive farming has caused steady increases in nitrogen concentrations in rivers elsewhere in the Waikato region (Vant 2013), but in the Hauraki area increases like this appear to have been largely offset by the improved treatment of sewage, industrial and dairy shed wastewaters.
8. Table 10 summarises the overall water quality of the Hauraki rivers, based on both
their current condition and on changes over the past 22-25 years. At one extreme the water quality of the Kauaeranga River has deteriorated, but is still largely excellent, while at the other extreme the water quality of the Piako River is poor, but has improved.
Table 10: Overall assessment of the water quality of the lower reaches of the Hauraki
rivers, based on eight routinely-monitored variables: current condition (see Table 2) and long-term changes (see Table 4)
Site Current condition Long-term changes Kauaeranga Kauaeranga at Smiths Excellent Deteriorated Piako Piako at Paeroa-Tahuna Rd Poor Improved Waitoa at Mellon Rd Poor Steady Waihou Ohinemuri at Karangahake Excellent Improved Waihou at Te Aroha Moderate Steady Waitakaruru Waitakaruru at Coxhead Rd Moderate Improved
9. Loads of total N and total P during 2006–15 were determined at several locations
on the Hauraki rivers. Altogether the rivers carried about 3730 t/yr of nitrogen and 206 t/yr of phosphorus to the Firth of Thames. The Waihou River carried 55–63% of the combined loads while the Kauaeranga and Waitakaruru Rivers each carried 1–2%. The Piako/Waitoa River carried 34–42%. Loads were also determined at 24 locations where treated sewage or industrial wastewaters are discharged to the rivers. Overall, these moderate-to-large point sources contributed about 6% of the nitrogen and 22% of the phosphorus that was carried by these rivers into the Firth of Thames.
Doc # 4111377 Page 23
10. During 1991–2015 the combined load of nitrogen carried by the Hauraki rivers
decreased at a rate of about 0.3% per year, while the combined load of phosphorus decreased at a rate of about 2% per year.
11. The combined load of total N discharged from the 24 point sources was about 236
t/yr, while that of total P was about 45 t/yr. These loads probably both decreased by about 3% per year during 2006–15; the load of total P discharged from the Waitoa dairy factory in particular has fallen substantially over the past 20 years.
12. Background (or “natural”) sources in the catchments of the rivers were estimated to
contribute about 21% of the combined load of total N and 38% of the total P. The remaining 73% of the combined load of total N and 41% of the total P is likely to have come from diffuse agricultural sources in the rivers’ catchments. That is, losses of N and P due to the development of land for farming contributed much of the nutrient load carried by the Hauraki rivers to the Firth of Thames.
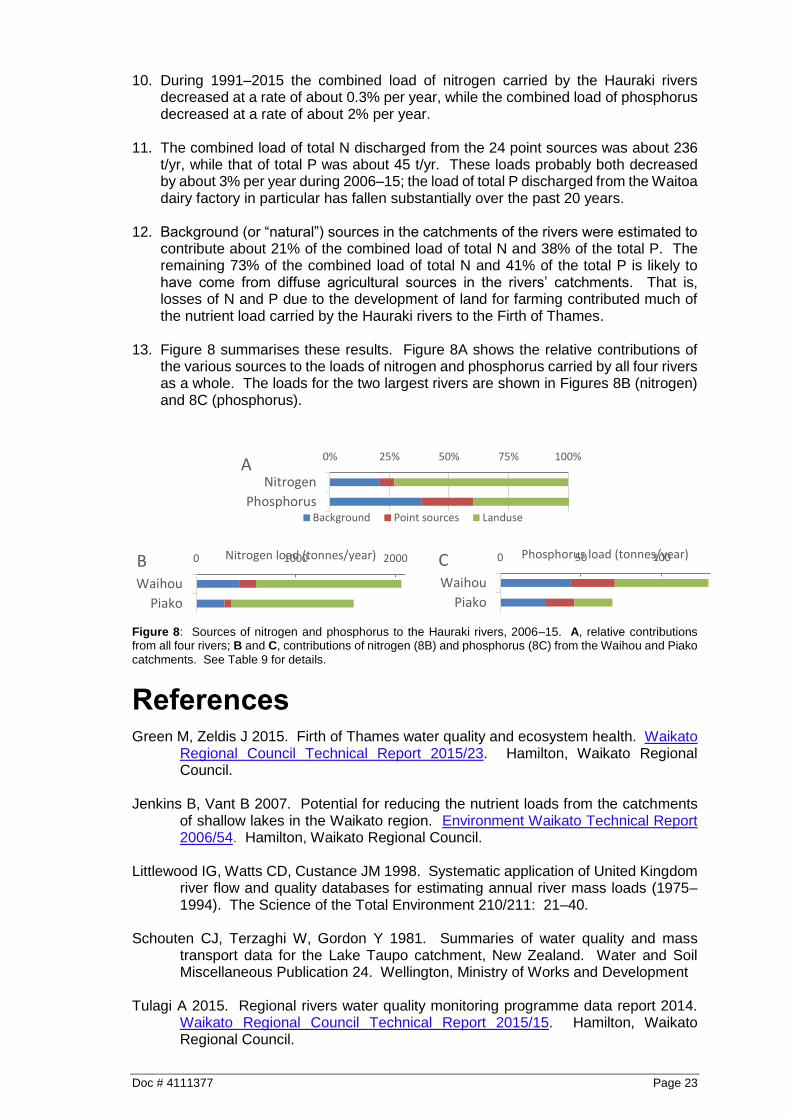
13. Figure 8 summarises these results. Figure 8A shows the relative contributions of
the various sources to the loads of nitrogen and phosphorus carried by all four rivers as a whole. The loads for the two largest rivers are shown in Figures 8B (nitrogen) and 8C (phosphorus).
Figure 8: Sources of nitrogen and phosphorus to the Hauraki rivers, 2006–15. A, relative contributions from all four rivers; B and C, contributions of nitrogen (8B) and phosphorus (8C) from the Waihou and Piako
catchments. See Table 9 for details.
References Green M, Zeldis J 2015. Firth of Thames water quality and ecosystem health. Waikato
Regional Council Technical Report 2015/23. Hamilton, Waikato Regional Council.
Jenkins B, Vant B 2007. Potential for reducing the nutrient loads from the catchments
of shallow lakes in the Waikato region. Environment Waikato Technical Report 2006/54. Hamilton, Waikato Regional Council.
Littlewood IG, Watts CD, Custance JM 1998. Systematic application of United Kingdom
river flow and quality databases for estimating annual river mass loads (1975–1994). The Science of the Total Environment 210/211: 21–40.
Schouten CJ, Terzaghi W, Gordon Y 1981. Summaries of water quality and mass
transport data for the Lake Taupo catchment, New Zealand. Water and Soil Miscellaneous Publication 24. Wellington, Ministry of Works and Development
Tulagi A 2015. Regional rivers water quality monitoring programme data report 2014.
Waikato Regional Council Technical Report 2015/15. Hamilton, Waikato Regional Council.
0% 25% 50% 75% 100%
Nitrogen
Phosphorus
A
Background Point sources Landuse
0 1000 2000
Waihou
Piako
Nitrogen load (tonnes/year)B 0 50 100
Waihou
Piako
Phosphorus load (tonnes/year)C
Page 24 Doc # 4111377
Turner S, Hume T, Gibberd B 2006. Waikato region estuaries—information and
management issues. Environment Waikato Internal Series 2006/09. Hamilton, Waikato Regional Council.
Vant B 1999. Sources of the nitrogen and phosphorus in several major rivers in the
Waikato Region. Environment Waikato Technical Report 1999/10. Hamilton, Waikato Regional Council.
Vant B 2011. Water quality of the Hauraki rivers and the Southern Firth of Thames.
Waikato Regional Council Technical Report 2011/06. Hamilton, Waikato Regional Council.
Vant B 2013. Trends in river water quality in the Waikato Region, 1993–2012. Waikato
Regional Council Technical Report 2013/20. Hamilton, Waikato Regional Council.
Vant B 2014. Sources of nitrogen and phosphorus in the Waikato and Waipa Rivers,
2003–12. Waikato Regional Council Technical Report 2014/56. Hamilton, Waikato Regional Council.

Doc # 4111377 Page 25
Page 26 Doc # 4111377
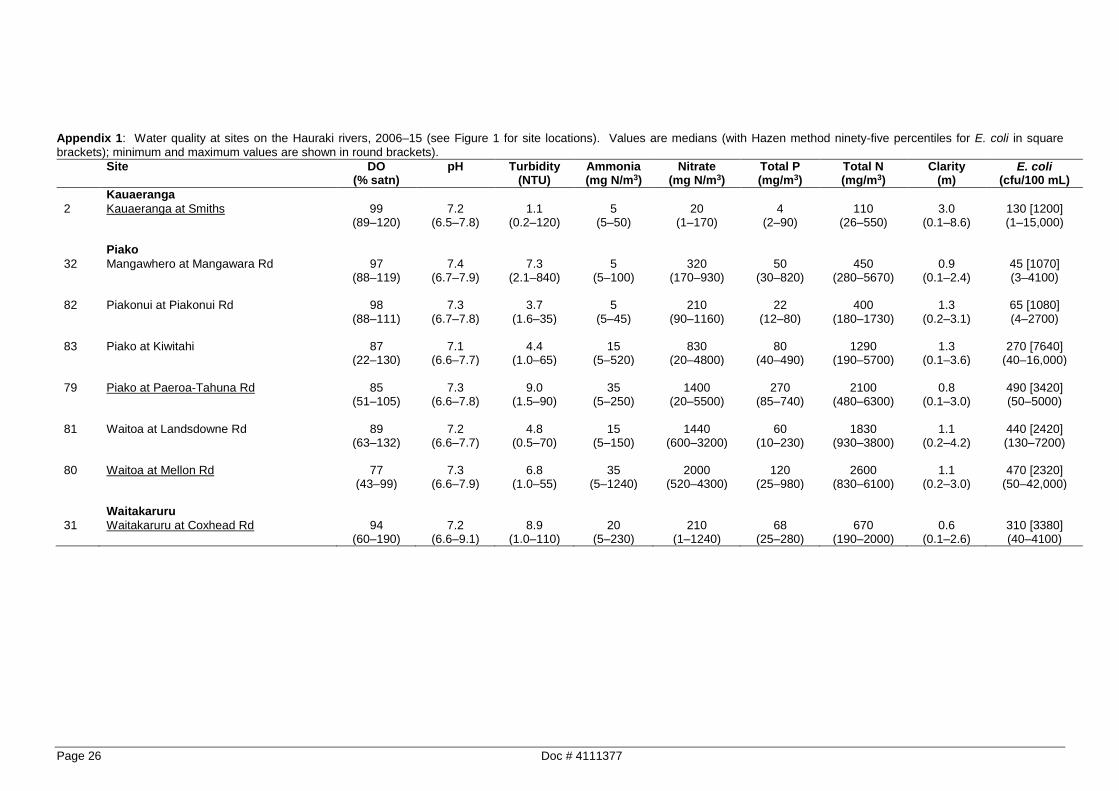
Appendix 1: Water quality at sites on the Hauraki rivers, 2006–15 (see Figure 1 for site locations). Values are medians (with Hazen method ninety-five percentiles for E. coli in square
brackets); minimum and maximum values are shown in round brackets).
Site DO (% satn)
pH Turbidity (NTU)
Ammonia (mg N/m3)
Nitrate (mg N/m3)
Total P (mg/m3)
Total N (mg/m3)
Clarity (m)
E. coli (cfu/100 mL)
Kauaeranga 2 Kauaeranga at Smiths 99
(89–120) 7.2
(6.5–7.8) 1.1
(0.2–120) 5
(5–50) 20
(1–170) 4
(2–90) 110
(26–550) 3.0
(0.1–8.6) 130 [1200] (1–15,000)
Piako 32 Mangawhero at Mangawara Rd 97
(88–119) 7.4
(6.7–7.9) 7.3
(2.1–840) 5
(5–100) 320
(170–930) 50
(30–820) 450
(280–5670) 0.9
(0.1–2.4) 45 [1070] (3–4100)
82 Piakonui at Piakonui Rd 98
(88–111) 7.3
(6.7–7.8) 3.7
(1.6–35) 5
(5–45) 210
(90–1160) 22
(12–80) 400
(180–1730) 1.3
(0.2–3.1) 65 [1080] (4–2700)
83 Piako at Kiwitahi 87
(22–130) 7.1
(6.6–7.7) 4.4
(1.0–65) 15
(5–520) 830
(20–4800) 80
(40–490) 1290
(190–5700) 1.3
(0.1–3.6) 270 [7640]
(40–16,000) 79 Piako at Paeroa-Tahuna Rd 85
(51–105) 7.3
(6.6–7.8) 9.0
(1.5–90) 35
(5–250) 1400
(20–5500) 270
(85–740) 2100
(480–6300) 0.8
(0.1–3.0) 490 [3420] (50–5000)
81 Waitoa at Landsdowne Rd 89
(63–132) 7.2
(6.6–7.7) 4.8
(0.5–70) 15
(5–150) 1440
(600–3200) 60
(10–230) 1830
(930–3800) 1.1
(0.2–4.2) 440 [2420] (130–7200)
80 Waitoa at Mellon Rd 77
(43–99) 7.3
(6.6–7.9) 6.8
(1.0–55) 35
(5–1240) 2000
(520–4300) 120
(25–980) 2600
(830–6100) 1.1
(0.2–3.0) 470 [2320]
(50–42,000) Waitakaruru 31 Waitakaruru at Coxhead Rd 94
(60–190) 7.2
(6.6–9.1) 8.9
(1.0–110) 20
(5–230) 210
(1–1240) 68
(25–280) 670
(190–2000) 0.6
(0.1–2.6) 310 [3380] (40–4100)
Doc # 4111377 Page 27
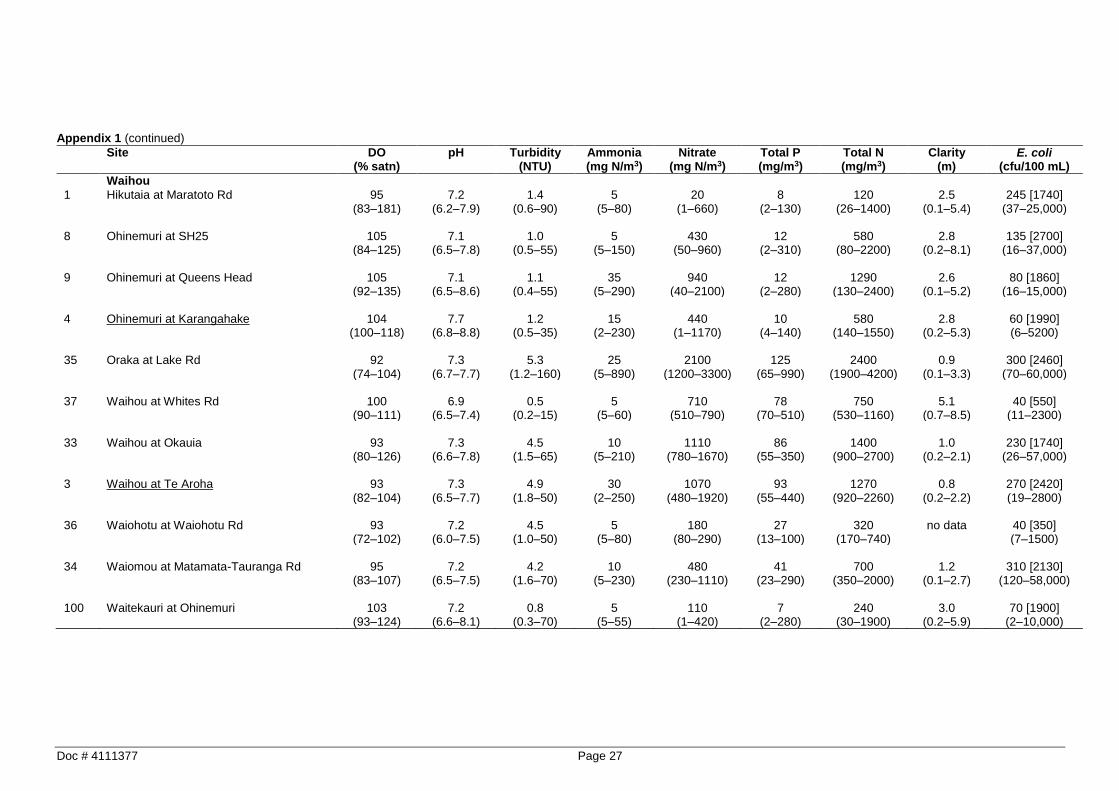
Appendix 1 (continued)
Site DO (% satn)
pH Turbidity (NTU)
Ammonia (mg N/m3)
Nitrate (mg N/m3)
Total P (mg/m3)
Total N (mg/m3)
Clarity (m)
E. coli (cfu/100 mL)
Waihou 1 Hikutaia at Maratoto Rd 95
(83–181) 7.2
(6.2–7.9) 1.4
(0.6–90) 5
(5–80) 20
(1–660) 8
(2–130) 120
(26–1400) 2.5
(0.1–5.4) 245 [1740]
(37–25,000) 8 Ohinemuri at SH25 105
(84–125) 7.1
(6.5–7.8) 1.0
(0.5–55) 5
(5–150) 430
(50–960) 12
(2–310) 580
(80–2200) 2.8
(0.2–8.1) 135 [2700]
(16–37,000) 9 Ohinemuri at Queens Head 105
(92–135) 7.1
(6.5–8.6) 1.1
(0.4–55) 35
(5–290) 940
(40–2100) 12
(2–280) 1290
(130–2400) 2.6
(0.1–5.2) 80 [1860]
(16–15,000) 4 Ohinemuri at Karangahake 104
(100–118) 7.7
(6.8–8.8) 1.2
(0.5–35) 15
(2–230) 440
(1–1170) 10
(4–140) 580
(140–1550) 2.8
(0.2–5.3) 60 [1990] (6–5200)
35 Oraka at Lake Rd 92
(74–104) 7.3
(6.7–7.7) 5.3
(1.2–160) 25
(5–890) 2100
(1200–3300) 125
(65–990) 2400
(1900–4200) 0.9
(0.1–3.3) 300 [2460]
(70–60,000) 37 Waihou at Whites Rd 100
(90–111) 6.9
(6.5–7.4) 0.5
(0.2–15) 5
(5–60) 710
(510–790) 78
(70–510) 750
(530–1160) 5.1
(0.7–8.5) 40 [550]
(11–2300) 33 Waihou at Okauia 93
(80–126) 7.3
(6.6–7.8) 4.5
(1.5–65) 10
(5–210) 1110
(780–1670) 86
(55–350) 1400
(900–2700) 1.0
(0.2–2.1) 230 [1740]
(26–57,000) 3 Waihou at Te Aroha 93
(82–104) 7.3
(6.5–7.7) 4.9
(1.8–50) 30
(2–250) 1070
(480–1920) 93
(55–440) 1270
(920–2260) 0.8
(0.2–2.2) 270 [2420] (19–2800)
36 Waiohotu at Waiohotu Rd 93
(72–102) 7.2
(6.0–7.5) 4.5
(1.0–50) 5
(5–80) 180
(80–290) 27
(13–100) 320
(170–740) no data 40 [350]
(7–1500) 34 Waiomou at Matamata-Tauranga Rd 95
(83–107) 7.2
(6.5–7.5) 4.2
(1.6–70) 10
(5–230) 480
(230–1110) 41
(23–290) 700
(350–2000) 1.2
(0.1–2.7) 310 [2130]
(120–58,000) 100 Waitekauri at Ohinemuri 103
(93–124) 7.2
(6.6–8.1) 0.8
(0.3–70) 5
(5–55) 110
(1–420) 7
(2–280) 240
(30–1900) 3.0
(0.2–5.9) 70 [1900]
(2–10,000)

Page 28 Doc # 4111377
Appendix 2: p-values (%) and, in brackets, slopes (% per year) of trends in flow-adjusted water quality at sites on the Hauraki rivers. Upper row, 1991–2015 (≤25 years); lower row, 2006–15 (10 years). . Important improvements (see text) are shown in bold; important deteriorations are bold and underlined. Monthly data, apart for E. coli which was mostly quarterly, except at Ohinemuri at Karangahake and Waihou at Te Aroha, where it was also monthly. E. coli records did not begin until 1998, except for Ohinemuri at Karangahake and Waihou at Te Aroha, where they did not begin until 2005.
Site DO Turbidity Ammonia Nitrate Total P Total N Clarity Ecoli
Kauaeranga 2 Kauaeranga at Smiths 27 (0.0)
96 (0.0)
2 (1.5)
83 (0.2) 58 (0.0) 7 (0.0)
<1 (2.2) <1 (8.6)
3 (0.6) 43 (0.5)
<1 (2.6)
68 (–0.7)
<1 (–1.4) <1 (3.9)
69 (0.8) 96 (1.0)
Piako 32 Mangawhero at Mangawara Rd <1 (–0.2)
99 (0.0) 27 (0.5) 64 (0.9)
<1 (–0.6) 37 (0.0)
5 (0.3) 99 (0.0)
1 (–0.6) <1 (–3.5)
99 (0.0) <1 (–1.8)
48 (0.3) 8 (3.4)
4 (–5.6)
14 (–12.6) 82 Piakonui at Piakonui Rd <1 (–0.2)
71 (–0.1)
<1 (–1.8)
9 (1.7) <1 (–0.4)
62 (0.0) 2 (–0.7)
82 (–0.2)
<1 (–2.4) 2 (–2.3)
1 (–0.6) 8 (–1.1)
<1 (2.0) 2 (3.2)
78 (0.8) 14 (9.4)
83 Piako at Kiwitahi <1 (–0.3)
4 (0.9)
<1 (–1.6)
31 (–1.2)
<1 (–5.6) <1 (–9.7)
23 (–0.4) 70 (–0.2)
<1 (–2.0) <1 (–5.0)
<1 (–0.8) 5 (–1.5)
12 (0.6) 10 (2.6)
81 (0.5) 75 (–3.2)
79 Piako at Paeroa-Tahuna Rd 4 (0.2)
98 (–0.1)
<1 (–1.6) <1 (–7.3)
<1 (–5.5)
15 (–2.5)
<1 (–1.2) <1 (–3.7)
2 (–0.6) 3 (–2.9)
<1 (–1.2) <1 (–3.2)
26 (0.5) <1 (8.4)
52 (–1.9) 84 (1.0)
81 Waitoa at Landsdowne Rd 6 (0.1)
83 (0.0) 3 (–0.9)
39 (–1.1)
<1 (–4.2) <1 (–9.6)
88 (0.0) 42 (0.6)
<1 (–1.9) <1 (–5.3)
69 (–0.1) 98 (0.0)
6 (–1.0) 19 (2.7)
64 (–2.0) 69 (–3.8)
80 Waitoa at Mellon Rd <1 (0.5)
45 (0.2) 41 (0.4) 94 (0.2)
<1 (–3.7)
42 (0.9) <1 (–0.5)
74 (0.4)
<1 (–14.8) <1 (–4.5)
<1 (–0.8) 90 (0.1)
1 (–1.0)
86 (–0.3) 75 (–1.2) 26 (–5.6)
Waitakaruru 31 Waitakaruru at Coxhead Rd 1 (–0.2)
16 (–0.4)
<1 (–1.8) 2 (–3.0)
<1 (–4.0) 4 (–6.6)
<1 (–1.6)
35 (–1.4)
<1 (–1.3) <1 (–3.8)
<1 (–1.3)
6 (–1.8)
2 (1.1) <1 (5.0)
49 (–1.3) 1 (–12.6)

Doc # 4111377 Page 29
Appendix 2 (continued)
Site DO Turbidity Ammonia Nitrate Total P Total N Clarity Ecoli
Waihou 1 Hikutaia at Maratoto Rd 1 (0.1)
12 (0.3)
1 (–1.4)
19 (–2.0)
<1 (–10.9)
70 (0.1) 7 (–1.6) 39 (3.4)
<1 (–2.0) 2 (–4.2)
<1 (–1.4)
7 (–2.3) 35 (–0.4)
7 (2.9) 18 (–2.0) 35 (–4.7)
8 Ohinemuri at SH25 22 (–0.1)
6 (0.3) 51 (–0.3) 45 (–1.0)
<1 (–5.3)
8 (–0.7) 4 (–0.5) 37 (0.7)
<1(–2.2) <1 (–5.9)
3 (–0.5) 90 (–0.1)
<1 (–2.1)
69 (0.4) 11 (–3.7)
12 (–10.4) 9 Ohinemuri at Queens Head 1 (–0.2)
21 (0.3)
<1 (–1.5)
75 (–0.2) 68 (0.5) 13 (4.1)
1 (0.6) 7 (–1.1)
<1 (–6.8) <1 (–7.7)
5 (0.6) 2 (–2.4)
92 (0.0) 5 (2.7)
2 (–5.6) 4 (–13.8)
4 Ohinemuri at Karangahake <1 (–0.1) 66 (0.0)
80 (0.1) 52 (–0.7)
<1 (–1.9)
17 (–4.0) 1 (–0.7) 1 (–2.8)
<1 (–3.1) 2 (–2.4)
3 (–0.5) 3 (–2.8)
1 (0.6) 3 (2.4)
73 (1.2) 66 (1.9)
35 Oraka at Lake Rd 2 (–0.1)
52 (–0.1)
<1 (2.9)
5 (3.2) 15 (1.1) 42 (2.3)
<1 (0.8) <1 (0.9)
<1 (–1.0)
37 (–0.8) <1 (0.9)
1 (0.9)
1 (–1.0)
34 (–1.1)
<1 (–8.2)
50 (–1.8) 37 Waihou at Whites Rd <1 (–0.2)
62 (0.1) 14 (0.6) 1 (3.9)
23 (–0.1) 24 (0.2)
<1 (1.6) <1 (1.3)
<1 (–0.5) 10 (–0.4)
<1 (1.6) <1 (1.2)
19 (–0.3) 2 (–2.0)
75 (0.3) 30 (–5.1)
33 Waihou at Okauia 61 (0.0)
25 (–0.1)
<1 (1.4)
45 (0.8) 9 (–1.0) 19 (2.5)
<1 (0.8) <1 (0.8)
<1 (–0.9) <1 (–1.4)
<1 (0.9) 7 (0.6)
9 (–0.5) 74 (–0.2)
25 (–1.9) 3 (–7.1)
3 Waihou at Te Aroha <1 (–0.1)
4 (0.1) 7 (0.6)
62 (–0.8) 89 (0.0)
<1 (–7.1) <1 (0.5) 62 (0.3)
2 (–0.4) <1 (–3.0)
<1 (0.5) 98 (0.0)
62 (0.1) <1 (4.5)
80 (–0.9) 98 (–0.3)
36 Waiohotu at Waiohotu Rd 2 (–0.1)
88 (0.0)
<1 (1.5)
17 (1.4) 77 (0.0) 78 (0.0)
43 (0.1) <1 (–2.6)
1 (–0.6) <1 (–2.1)
<1 (0.7) <1 (–2.2)
no data 12 (–5.3) 82 (3.0)
34 Waiomou at Matamata-Tauranga Rd 3 (–0.1)
29 (–0.2)
<1 (2.0) 1 (3.0)
98 (0.0) 49 (–1.0)
<1 (1.1) 2 (1.6)
11 (–0.5) <1 (–3.0)
<1 (1.3) 2 (1.1)
7 (–0.5) 31 (0.9)
58 (0.7) 30 (–1.8)
100 Waitekauri at Ohinemuri 87 (0.0)
48(–0.1) 81 (–0.1) <1 (–2.9)
<1 (–14.9)
8 (–0.4)
<1 (–5.1)
7 (–2.1) 13 (–0.8) <1 (–7.2)
<1 (–3.9) 3 (–2.5)
<1 (–1.1)
11 (2.0)
<1 (–7.4)
10 (–12.6)
Total numbers of important trends (22–25 years ending 2015)
Improvements 0 6 9 3 10 4 2 4 Deteriorations 0 5 0 3 0 3 5 0