water poverty in urban india: a study of major cities · 2 water poverty in urban india: a study of...
TRANSCRIPT

1
Water Poverty in Urban India: A Study of
Major Cities
ABDUL SHABAN
Tata Institute of Social Science,
Mumbai
Seminar Paper
UGC-Summer Programme
(June 30- July 19, 2008)
Submitted to
UGC- Academic Staff College
Jamia Millia Islamia, New Delhi

2
Water Poverty in Urban India: A Study of Major Cities
Abdul Shaban ([email protected]) Assistant Professor,
Tata Institute of Social Sciences, Deonar, Mumbai, India – 400 088.
I. Introduction
In years to come, water, the need of life, is possibly to pose greatest challenge on account
of its increased demand with population rise, economic development, and shrinking
supplies due to over exploitation and pollution. In India, with development, the demand of
water is increasing both in urban and rural areas. This may create increased tension and
dispute between these areas for sharing and command of water resources. The emerging
scarcity of water has also raised a host of issues related to sustainability of present kind of
economic development, sustanious water supply, equity and social justice, water financing,
pricing, governance and management. The present paper explores the quantity of water
used in domestic households vis-à-vis the recommended quantity of water consumption in
seven major Indian cities, namely, Delhi, Kanpur, Kolkata, Ahmedabad, Mumbai,
Hyderabad and Madurai. The paper also attempts to find out equity in consumption of
water across various socio-economic groups, sources of water supply, perception of
households about quality of municipal water, and duration of municipal water supply. The
organization of the rest of the study is as follows. Section II deals with methods used for
data collection and analysis, while Section III discusses the recommendations of various
agencies about the per capita need of water in urban areas. Results and discussions are
presented in Section IV, and the last Section presents summary and conclusions of the
study.
II. Materials and Methods
The household survey, to find out the consumption, availability, access and methods
adopted for conservation of water in domestic households in seven major Indian cities,
Delhi, Gr. Mumbai, Kolkata, Hyderabad, Kanpur, Ahmedabad and Madurai, was
conducted in March 2005. As per the Census of India 2001, these cities, except Madurai
(Municipal Corporation) are among 27 municipal corporations with million plus
population, and their respective populations are 9.8, 11.9, 4.6, 3.5, 2.5, 3.5 and 0.92
millions, respectively. The number of sample households selected from each of these cities

3
was 507 in Delhi, 500 in Mumbai, 400 in Kolkata, 398 in Hyderabad, 303 in Kanpur, 361
in Ahmedabad, and 265 in Madurai. Thus, total 2,734 households were interviewed in
these seven cities. Each of these cities were categorized in five different areas, (i) high
income group (HIG) areas with well planned buildings, (ii) middle income group (MIG)
areas with well planned buildings, (iii) low income group (LIG) areas with well planned
buildings, (iv) slum areas, and (v) the mixed areas. Within these identified clusters,
random sampling of households from electoral role was done. In each of these cities,
several clusters of the same kinds of areas can be found, and therefore, from each cluster at
least 8 interviews were conducted. The data was collected through a structured schedule
and target respondents were the housewives. The volume of vessels in which households
used to store water was measured and the number of vessels of water used in different
activities was ascertained. Where running tap or piped water was used in some activities,
the duration for which the tap remained open was arrived at and the quantity of water per
minute coming out from the tap was measured. By multiplying the time with the quantity
of water per minute, the amount of water used through running taps was arrived at. The
amount of water used in toilet was assessed by volume of bucket used, and flush tank
capacity. The assessment of quantity of water used in various activities was a difficult
task, but all the efforts were put in to assure the accuracy of data.
Asset score has been used to classify households in various economic classes, such as the
‘very poor’, ‘poor’, ‘lower’, ‘middle’ and ‘upper’ classes. We assigned certain weights to
the assets possessed by households, and by summing up the scores for each asset, ‘asset
score’ for a household was arrived at. The assets for which data were collected and
weights assigned to them, are as follows: four-wheeler/car (weight 5.0), refrigerator (2.0),
washing machine (2.0), microwave oven (2.0) three/two-wheeler (1.5), colour-television
(1.5), computer/laptop (1.0), music devices like cd/dvd/vcd/MP3 player (0.5), internet
connection (0.5), black and white television (0.5), mobile phone (0.5), cable for television
(0.25), and radio/tape recorder (0.25). The following ranges of asset scores were used to
classify the households in the above mentioned economic /asset classes: (a) Very poor
class: asset score 0.00 (has no assets on which data is collected); (b) Poor class: asset score
between 0.01 to 0.99 (at least has radio/tape recorder and/or black and white television);
(c) Lower class: asset score between 1.00 to 4.99 (at least has black & white television,
radio/tape recorder, cable, mobile phone, or some of them with other assets); (d) Middle
4
class: asset score between 5.00 to 9.99 (at least has colour-television, refrigerator, washing
machine or some of them with other assets); (e) Upper class: asset score 10.00 and above
(at least has four-wheeler, refrigerator, washing machine and colour television, or some of
them with other assets). Annual income data of households were also collected. The
Pearson correlation coefficient between the household asset score and the income was
found to be 0.722 (p-value 0.0001). However, we have used household assets score rather
than monthly income for classifying households in various economic categories, as there is
a greater possibility of under or over reporting of income. Besides categorizing households
on the basis of asset score, we have also classified the households in five socio-economic
classes (SEC) based on education and occupation of the main wage earner of the
household. These five SEC classes are SEC-A, SEC-B, SEC-C, SEC-D and SEC-E
(Shaban and Sharma, 2007).
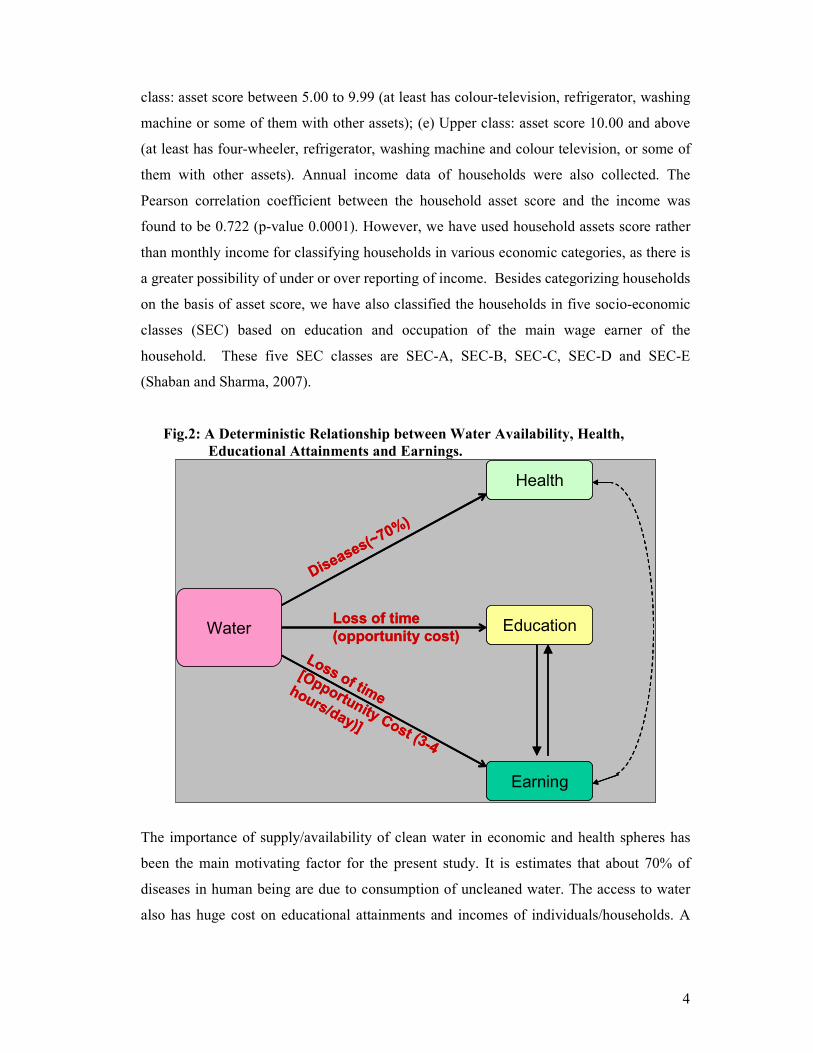
Fig.2: A Deterministic Relationship between Water Availability, Health,
Educational Attainments and Earnings.
Water
Health
Education
Earning
Diseases(~7
0%)
Loss of time
(opportunity cost)
Loss of time
[Opportunity Cost (3-4
hours/day)]
Water
Health
Education
Earning
Diseases(~7
0%)
Loss of time
(opportunity cost)
Loss of time
[Opportunity Cost (3-4
hours/day)]
The importance of supply/availability of clean water in economic and health spheres has
been the main motivating factor for the present study. It is estimates that about 70% of
diseases in human being are due to consumption of uncleaned water. The access to water
also has huge cost on educational attainments and incomes of individuals/households. A

5
large share of population from the poorer section of the society (both in rural and urban
areas) loses their precious time collecting water for their daily needs. This deprives them
from daily wages crucial for their economic sustenance (see Fig.1). Further, recurring
health expenditures due to consumption of uncleaned water and low wages due to lower
skills keep them in vicious circle of poverty. While education helps to improve their
earnings, the health expenditures and loss of time/wages due to illness keep them in
poverty and penury (see Fig.2). Clean, adequate and regular water supply, therefore, are
extremely important in countries like South Asia, more so in India where a large section of
population lives in poverty and consumes uncleaned water, to help sizeable proportion of
the population move above poverty line.
Fig.2: The Making and Unmaking of Poverty
Poverty Line
Education Health
Nudging Out
Skidding Down
III. Quantity of Water Required for Different Activities
A number of factors like climate, culture, food habits, work and working conditions, level
and type of development, and physiology determine the requirement of water. As per the
Bureau of Indian Standards, IS:1172-1993, minimum water supply of 200 litres per capita
per day (lpcd) should be provided for domestic consumption in cities with full flushing
systems. IS:1172-1993 also mentions that the amount of water supply may be reduced to
135 lpcd for the LIG and the economically weaker sections (EWS) of the society and in
small towns (Modi, 1998).
Besides domestic requirement, water is also demanded for commercial, industrial, and
civic or public use. The IS:1172-1993 gives the total requirement of water in industrial
and commercial towns with full-flushing system as 280 lpcd. The Ninth Plan (1997-2002)
had advocated the requirements of water in urban areas as 125 lpcd in cities with the
6
planned sewerage systems; 70 lpcd in cities without planned sewerage system; and 40 lpcd
for those collecting water from public stand-posts. However, in the Tenth Plan (2002-07),
the cities with planned sewerage system are classified into two groups based on population,
i.e., metropolitan or megacities and non-metropolitan cities. In the former, the
recommended minimum water supply level is 150 lpcd and in the latter 135 lpcd. (Govt.
of India, 1997, 2002). The National Commission on Urbanisation (1988) recommended
that a per capita water supply of 90-100 litres per day is needed to lead a hygienic
existence, and emphasised that this level of water supply must be ensured to all citizens
(quoted in Ramachandraiah, 2001)
The World Health Organization (WHO) classifies the supply and access to water in four
service categories. These categories are, (1) no access (water available below 5 lpcd), (2)
basic access (average approximately 20 lpcd), (3) inter-mediate access (average
approximately 50 lpcd), and (4) optimal access (average of 100-200 lpcd) (WHO, 2003;
see also Bartram, 2003). Considering the fact that various agencies recommend different
quantities of requirement of water for domestic use, we have taken 100 lpcd consumption
(an indication of availability, as consumption is determined by the availability) of water as
benchmark for finding out water deficient households. It must be noted here that there is
no strong basis for this 100 litres bench mark but it is some kind of average requirement
one must get in order to live with minimum health and hygiene.
IV. Results and Discussion
IV.1. Domestic Consumption of Water
It is important to note here, and this will be amply clear later, that the quantity of water
consumed in most of the Indian cities is not determined by the demand but the supply.
People attempt to adjust to the quantity (as well as quality) of water supplied. The 54th
round National Sample Survey Organisation (NSSO) data reveal that 80% of the
households in urban India, across different segments, consider that they have sufficient
water supply (Bajpai and Bhandari, 2001), while the present study finds that about 71% of
the households in these seven cities consider water supply as adequate. The share of
households considering water supply adequate to their need is 73% in Delhi, 77% each in
Mumbai and Kolkata, 49% in Hyderabad, 75% in Kanpur, 63% in Ahmedabad and 82% in
Madurai. In fact, this shows nothing but adjustment of people to the supply so much that

7
they do not feel that more water is required. This in turn creates hygiene and sanitation
problems resulting in several health consequences.
Table 1: Domestic Water Consumption per Household and per capita per day (in litres). Per Household Per Capita Cities
Mean Std. Deviation Mean Std. Deviation
Delhi 377.7 256.8 78.0 49.9
Mumbai 406.8 158.6 90.4 32.6
Kolkata 443.2 233.6 115.6 64.9
Hyderabad 391.8 172.0 96.2 43.8
Kanpur 383.7 286.2 77.1 58.2
Ahmedabad 410.9 224.1 95.0 54.6
Madurai 363.1 182.1 88.2 44.4
Total 398.3 220.20 91.56 51.51
Source: Calculated using data from ‘field survey’.
Table 1 shows per household as well as per capita consumption of water in seven major
cities in the country. It is very obvious from the Table that in all the cities, the
consumption (indication of availability) of water per capita is much lower than what is
recommended by the Bureau of Indian Standard, IS:1722-1993, and the Tenth Five Year
Plan. Moreover, it is even lower than the recommended level for LIG colonies and weaker
section households. The data is also an indication for the lower public hygiene and
sanitation conditions in Indian cities. The average per capita water consumption in
domestic households for all the seven cities is about 92 lpcd. The highest consumption is
in Kolkata (116 lpcd), followed by Hyderabad (96 lpcd), Ahmedabad (95 lpcd), Mumbai
(90 lpcd), Madurai (88 lpcd), Delhi (78 lpcd), and Kanpur (77 lpcd). It is surprising to find
that in Delhi water consumption is so low when Delhi Jal Board claims supplying, on an
average, 211 lpcd per household. Similarly, the Brihan-Mumbai Municipal Corporation
(BMC) claims of supplying 198 lpcd (total water supply to the city 2950 million litres per
day - less 20% lossess), but the consumption in Mumbai, as mentioned above, is only
about 92 lpcd. In terms of international comparison, the Indian cities have far less
consumption of water. For example, domestic water consumption in Munich is 130 lpcd,
and in Amsterdam it is 156 lpcd. In Singapore, Hong Kong, Sydney and Tokyo, the
consumptions are 162 lpcd, 203 lpcd, 254 lpcd, and 268 lpcd, respectively (Down to Earth,
2005). Overall, in terms of per capita consumption of water, the condition in two North
Indian cities, Delhi and Kanpur, seems to be worse. The dispersion statistics (standard
deviation) shows that wide variations in per capita consumption of water also exist in
North Indian cities. Besides, having the highest level of water consumption, Kolkata also
has wide variation in consumption of water per capita. In terms of the variation, Kanpur,
8
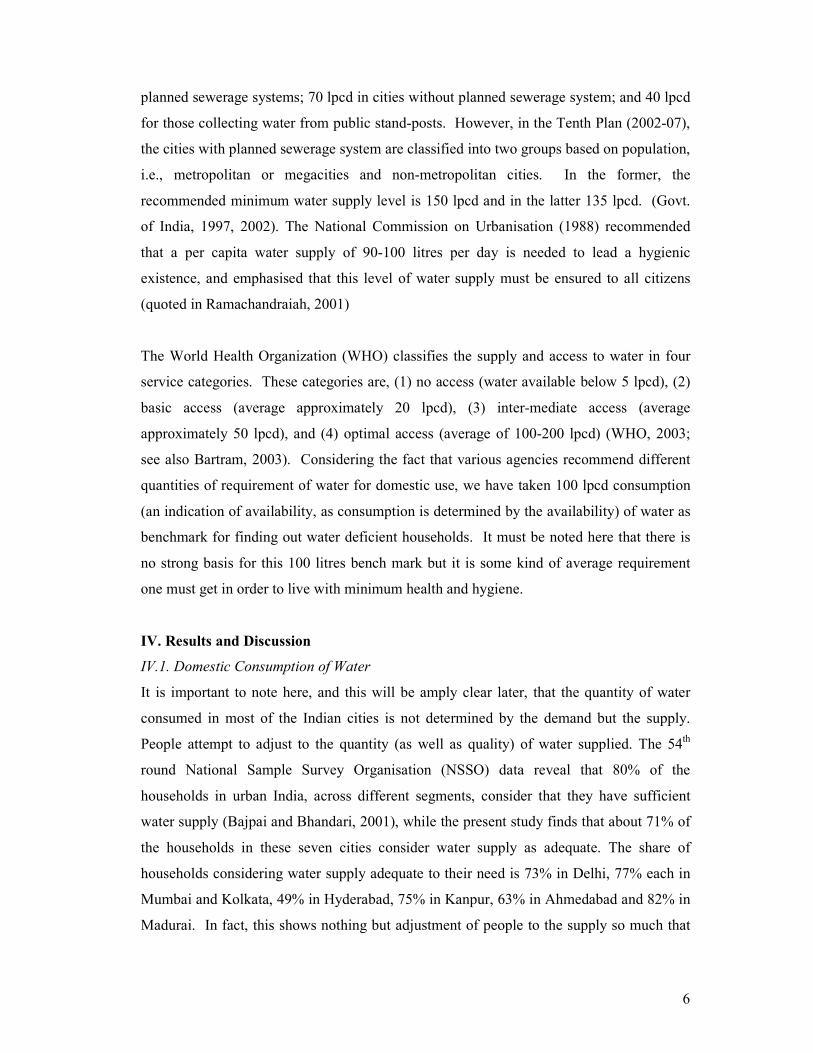
Ahmedabad and Delhi follow Kolkata. In these seven cities, a very small proportion of
population consumes water above 100 lpcd. As shown in Table 2, only about 35 percent of
the total population in the cities consumes water above 100 lpcd. There also exist wide
variations in proportion of household in different cities consuming water above 100 lpcd.
For example, in Kolkata 52.9% of the households consume water above 100 lpcd, but in
Kanpur only 24.7% consume water above 100 lpcd. Likewise, Ahmedabad (37.9% of the
households), Hyderabad (37%), Mumbai (31%), and Madurai (30.7%) follow Kolkata in
terms of the consumption of water above 100 lpcd.
Table 2: Water Consumption Category-wise Distribution of Households (%). Cities Litres
/capita/day All 7
Cities Delhi Mumbai Kolkata Hyderabad Kanpur Ahmedabad Madurai
Below 50 17.5 29.8 5.4 11.8 9.0 33.7 19.4 17.0
50 to 75 22.6 22.1 29.4 13.5 21.6 24.4 20.8 26.4
75 to 100 25.3 20.7 34.2 22.0 32.4 17.2 21.9 26.0
100 to 135 20.2 17.2 23.6 24.3 23.4 14.2 18.8 17.4
135 to 175 8.7 5.3 5.0 15.0 8.3 6.9 12.7 10.2
175 to 200 2.2 2.2 1.4 4.8 2.3 1.3 2.2 .8
Above 200 3.4 2.8 1.0 8.8 3.0 2.3 4.2 2.3
Total 100 100.0 100.0 100.0 100.0 100.0 100.0 100.0
Source: As for Table 1.
Kanpur has a dubious distinction among the cities under focus. In this city, more than one-
third of population uses water below 50 lpcd. And in this respect, Kanpur is followed by
Ahmedabad (19.4% of population consuming water below 50 lpcd), Madurai (17.0%),
Kolkata (11.8%), Hyderabad (9.0%), and Mumbai (5.4%). The water consumption among
different areas in a city is not vary different from each other, except that the model class of
consumption for HIG, MIG and LIG areas is formed by the consumption class of 75-100
lpcd, and in the case of slums and mixed areas, it is 50-75 lpcd (Table 3). However, where
23.4% of the population in HIG areas uses water above 135 lpcd, in slum areas only 9.6%
of population uses water above 135 lpcd. The consumption of water by various socio-
economic classes shows that although a sizeable proportion of households in all the classes
consume water below 50 lpcd, it is in the case of SEC-E where the consumption is very
low. More than one-quarter of households in this class consumes water below 50 lpcd
(Table 4). Also, as compared to 23.3% of the SEC-A consuming above 135 lpcd, it is only
8.1% of the population in SEC-E which consumes water above this limit. The
consumptions by socio-economic classes do largely correspond with the consumptions
based on the asset classes. Whereas 25.7% of the population in SEC-E has the

9
consumption below 50 lpcd, 28.1% of the population in ‘very poor’ category consumes
water below this limit (Table 5). Similar to HIG, MIG and the LIG areas, the model class
of consumption for ‘Upper’, ‘Middle’ and ‘Lower’ categories of households, based on the
asset score, is also 75-100 litres per capita per day.
Table 3: Area and Consumption Category-wise Distribution of Household (%). Area Litres
/capita/day High income
group area with
well planned
building
Middle income
group area with
well planned
building
Low income
group area with
well planned
building
Slum area Others (a mixed
area)
Below 50 19.8 17.7 13.2 21.3 15.5
50 to 75 16.3 20.5 23.4 27.0 26.2
75 to 100 21.2 26.4 31.0 24.2 23.8
100 to 135 19.2 20.0 21.4 17.9 22.5
135 to 175 12.9 8.4 7.6 6.2 8.5
175 to 200 3.8 2.1 1.4 2.3 1.3
Above 200 6.7 4.9 2.0 1.1 2.3
Total 100.0 100.0 100.0 100.0 100.0
Source: As for Table 1.
Table 4: Socio-economic and Consumption Category-wise Distribution of
Household (%). Socio-economic Category Litres/
capita/day SEC-A SEC-B SEC-C SEC-D SEC-E
Below 50 18.0 17.7 14.1 15.2 25.7
50 to 75 17.7 19.3 25.5 27.5 26.6
75 to 100 22.2 24.9 27.8 29.1 22.7
100 to 135 18.8 21.9 21.6 20.0 16.9
135 to 175 13.1 9.6 7.6 5.4 5.1
175 to 200 2.8 3.4 1.1 1.1 2.1
Above 200 7.4 3.2 2.3 1.7 .9
Total 100.0 100.0 100.0 100.0 100.0
Source: As for Table 1.
Table 5: Asset and Consumption Category-wise Distribution of Household (%). Asset Class Litres
/capita/day Very Poor Poor Lower Middle Upper
Below 50 28.1 16.7 13.1 21.5 21.7
50 to 75 23.1 25.9 25.3 18.8 15.8
75 to 100 24.0 28.4 25.9 24.1 22.2
100 to 135 15.7 19.5 22.6 18.8 16.3
135 to 175 5.0 6.2 8.6 9.5 13.1
175 to 200 1.7 1.7 1.9 2.6 3.6
Above 200 2.5 1.5 2.6 4.8 7.2
Total 100.0 100.0 100.0 100.0 100.0
Source: As for Table 1.
Inadequate water supply in Indian cities seems to be a rule rather than an exception. Even
if we take 100 litres per capita per day as the criterion for defining water deficient and
sufficient households, 65% of the sample households remain water deficient. The

10
proportion of deficient households is the highest in Kanpur (75.2%), followed by Delhi
(72.6%). In fact, except Kolkata, in all the other cities, the water deficient households are
above 60%. Analysis shows that households with monthly income up to Rs.3000 suffer the
most as about 72% of such households are found to be water deficient (Fig.3). Area-wise
classification of water deficient households (Table 6) shows that, as expected, these are
slum areas which have maximum percentage of water deficient households in all the cities.
In Ahmedabad and Kanpur, the percentages of water deficient slum households are as high
as 86.1%, and 82.1%, respectively, while it ranges between 70% to 75% in case of Delhi,
Mumbai, and Hyderabad. Among the cities, the least percentage of water deficient
households are found in Kolkata (47.3%). Per capita water consumption in different areas,
asset-classes and SECs of households are highly correlated with each other, as they have
very similar percentages of water deficient/sufficient households (see Tables 3, 4, and 5).
Fig. 3: Monthly Incomewise Distribution of Households in Various Water
Consumption Categories in Seven Major Cities in India.
0
10
20
30
40
50
60
70
80
90
100
Up
to 3
00
0
30
01
to
50
00
50
01
to
10
000
10
00
1 t
o
20
00
0
20
00
1 t
o
50
00
0
50
00
1 &
abo
ve
To
tal
Income (Rs.)
Per
cen
tag
e o
f H
ou
seh
old
s
below 50 50 to 75 75 to 100 100 to 135 135 to 175 175 to 200 above 200
Source: As for Table 1.
11
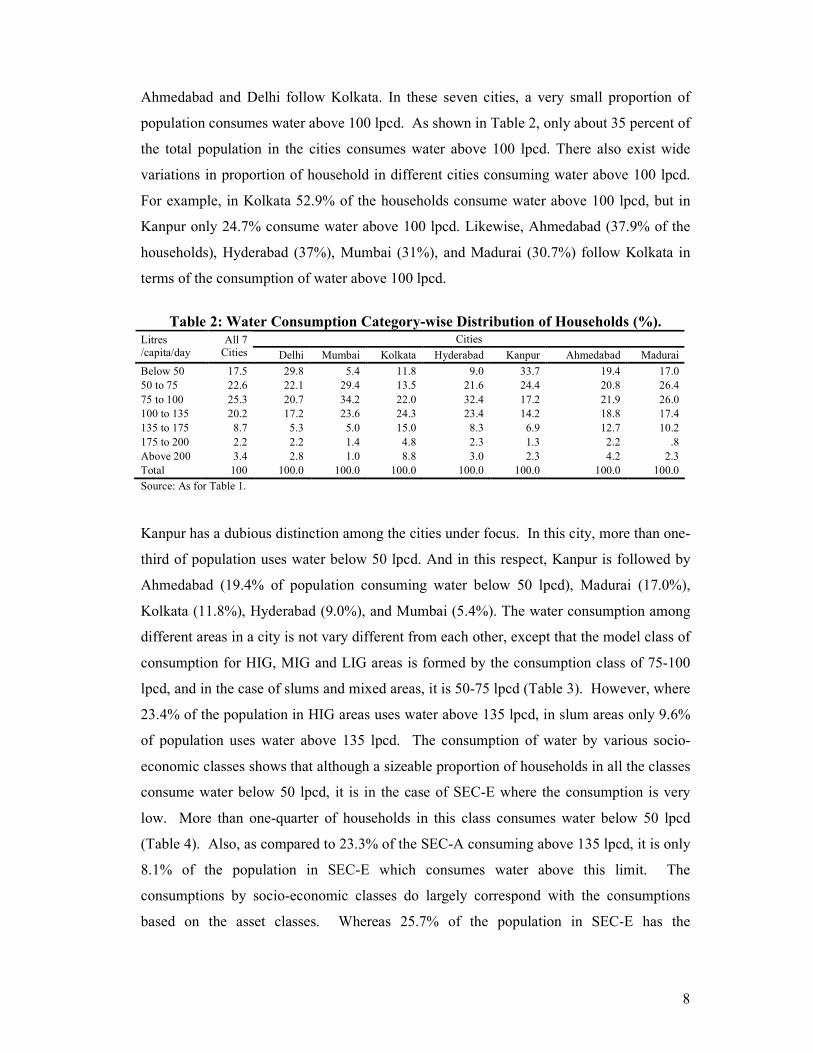
Table 6: Percentage of Water Deficient Households in Different Areas (consuming
below 100 lpcd). Areas All 7 Cities Delhi Mumbai Kolkata Hyderabad Kanpur Ahmedabad Madurai
HIG Areas 57.3 68.4 48.8 39.8 64.6 75.0 42.5 66.7
MIG Areas 64.6 78.1 69.2 42.1 61.7 66.1 56.3 76.8
LIG Areas 67.4 71.7 76.2 55.7 61.7 70.2 69.2 66.7
Slum Areas 72.5 72.4 74.1 58.1 65.4 82.1 86.1 70.0
Mixed Areas 65.5 72.0 73.1 40.5 62.0 82.8 57.8 67.3
Total 65.4 72.6 69.0 47.3 63.1 75.2 62.0 69.4
Source: As for Table 1.
IV.2. Activity-wise Consumption of Water
At household level, bathing consumes highest amount of water. Together, in all the seven
cities, it consumes about 28% of the total water at household level (Table 7). Consumption
in toilets (20.0%), washing clothes (18.6%) and washing utensils (16.3%) follow the
consumption in bathing. On an average, less than 10% of the total water in a household is
used for drinking and cooking.
Table 7: Activity-wise Distribution of Water Consumption in Cities (% of total
consumption by households / day).
Source: As for Table 1.
Among the cities, households (37.1%) in Kolkata consume highest proportion of total
water in bathing. Delhi (31.7%) Kanpur (29.1%), Madurai (26.6%) and Hyderabad
(25.6%) follow Kolkata in this regard. Toilet consumes 15-26% of the water at household
level in these cities, the highest being in Madurai (25.7%) and the least in Kolkata (15.9%).
Washing clothes also accounts for about 14-22% of the total water consumption at
household level, and it is the highest in Mumbai (24.3%), followed by Hyderabad (20.9),
and Ahmedabad (21.4%). Interestingly, North Indian cities Delhi, Kanpur and even
Kolkata use less proportion of water in washing clothes than other cities.
Activity All 7 cities
Delhi Mumbai Kolkata Hyderabad Kanpur Ahmedabad Madurai
Bathing 28.2 31.7 23.7 37.1 25.6 29.1 22.8 26.6
Washing clothes 18.6 14.2 24.3 14.0 20.9 16.3 21.4 18.9
Drinking 4.2 5.0 4.2 2.6 4.3 3.8 4.9 4.9
Cooking 3.0 3.7 1.7 2.3 3.1 3.2 3.3 4.2
Toilets 20.0 16.5 21.6 15.9 24.1 20.1 19.1 25.7
Cleaning house 7.3 7.0 6.6 11.7 3.5 5.7 12.4 1.9
Washing utensils 16.3 16.5 17.4 16.1 16.5 15.4 15.2 16.1
Others 2.4 5.6 0.5 0.3 2.0 6.3 0.9 1.7
Total 100.0 100.0 100.0 100.0 100.0 100.0 100.0 100.0
12
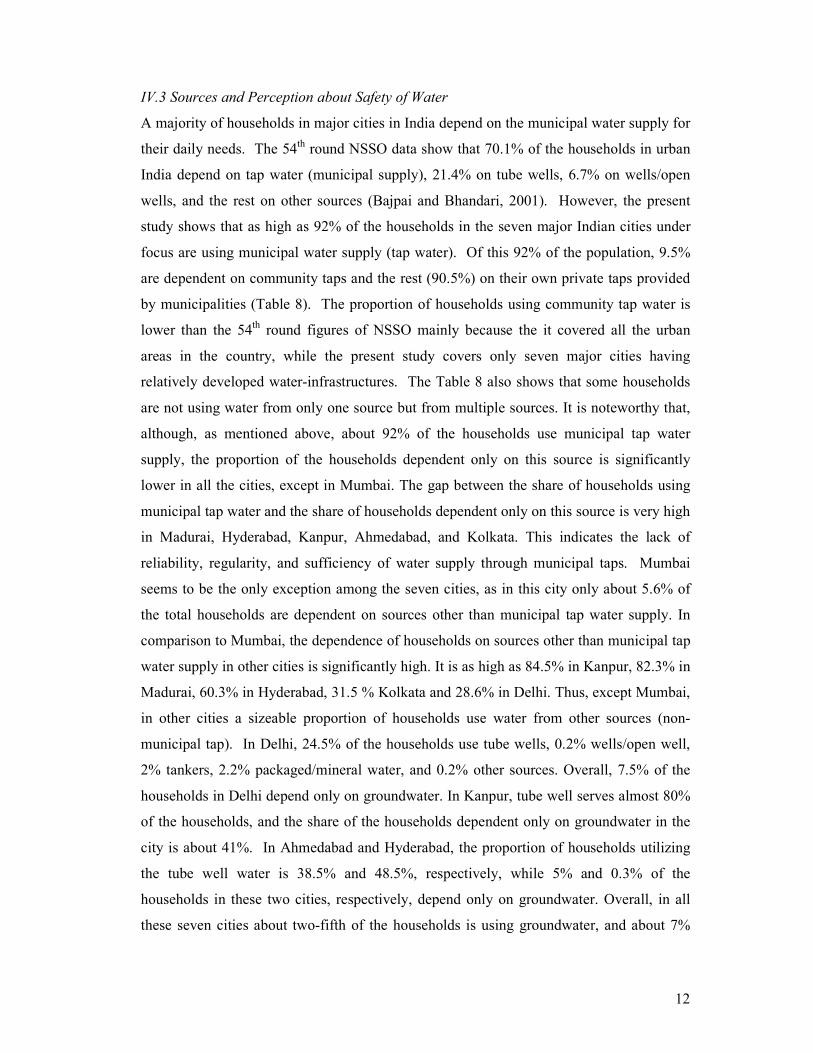
IV.3 Sources and Perception about Safety of Water
A majority of households in major cities in India depend on the municipal water supply for
their daily needs. The 54th
round NSSO data show that 70.1% of the households in urban
India depend on tap water (municipal supply), 21.4% on tube wells, 6.7% on wells/open
wells, and the rest on other sources (Bajpai and Bhandari, 2001). However, the present
study shows that as high as 92% of the households in the seven major Indian cities under
focus are using municipal water supply (tap water). Of this 92% of the population, 9.5%
are dependent on community taps and the rest (90.5%) on their own private taps provided
by municipalities (Table 8). The proportion of households using community tap water is
lower than the 54th
round figures of NSSO mainly because the it covered all the urban
areas in the country, while the present study covers only seven major cities having
relatively developed water-infrastructures. The Table 8 also shows that some households
are not using water from only one source but from multiple sources. It is noteworthy that,
although, as mentioned above, about 92% of the households use municipal tap water
supply, the proportion of the households dependent only on this source is significantly
lower in all the cities, except in Mumbai. The gap between the share of households using
municipal tap water and the share of households dependent only on this source is very high
in Madurai, Hyderabad, Kanpur, Ahmedabad, and Kolkata. This indicates the lack of
reliability, regularity, and sufficiency of water supply through municipal taps. Mumbai
seems to be the only exception among the seven cities, as in this city only about 5.6% of
the total households are dependent on sources other than municipal tap water supply. In
comparison to Mumbai, the dependence of households on sources other than municipal tap
water supply in other cities is significantly high. It is as high as 84.5% in Kanpur, 82.3% in
Madurai, 60.3% in Hyderabad, 31.5 % Kolkata and 28.6% in Delhi. Thus, except Mumbai,
in other cities a sizeable proportion of households use water from other sources (non-
municipal tap). In Delhi, 24.5% of the households use tube wells, 0.2% wells/open well,
2% tankers, 2.2% packaged/mineral water, and 0.2% other sources. Overall, 7.5% of the
households in Delhi depend only on groundwater. In Kanpur, tube well serves almost 80%
of the households, and the share of the households dependent only on groundwater in the
city is about 41%. In Ahmedabad and Hyderabad, the proportion of households utilizing
the tube well water is 38.5% and 48.5%, respectively, while 5% and 0.3% of the
households in these two cities, respectively, depend only on groundwater. Overall, in all
these seven cities about two-fifth of the households is using groundwater, and about 7%
13
are solely dependent on this source. Thus, the second largest source of water for a majority
of households in major cities in the country is groundwater. The rapid increase of
population in these cities is making people more dependent on it leading to rapid decline in
groundwater table. Delhi, Hyderabad, Kanpur are suitable examples in this regard (see also
Soni, 2003).
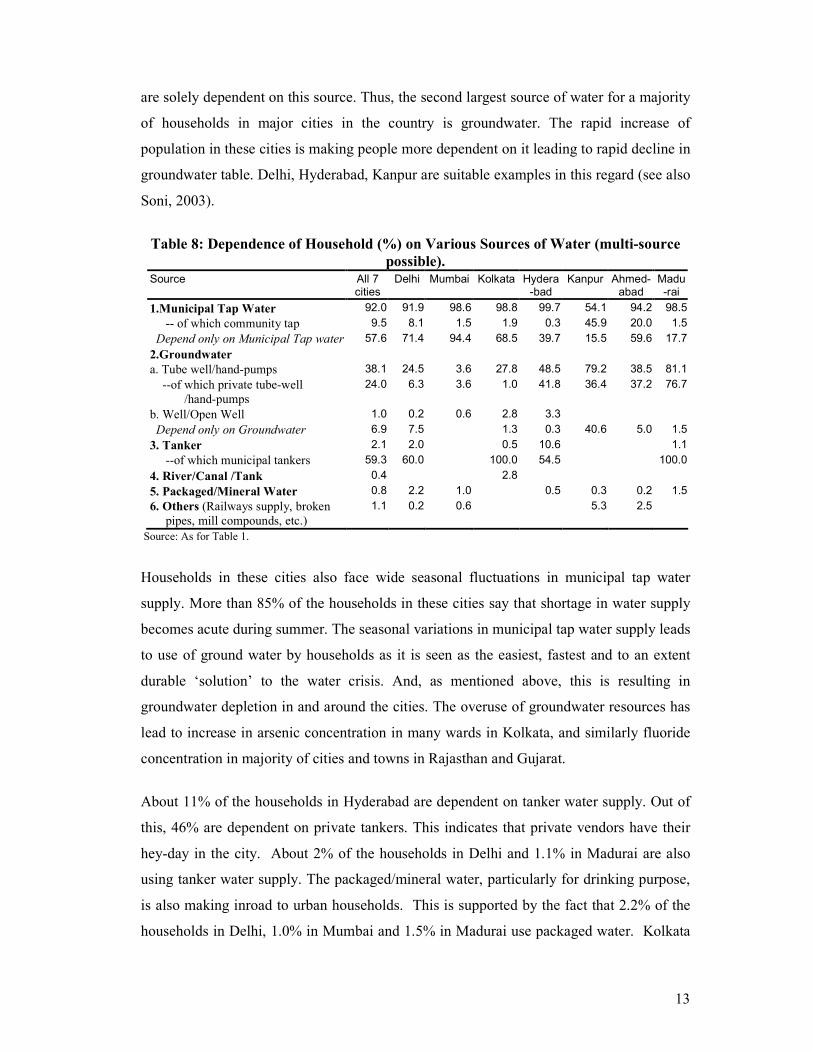
Table 8: Dependence of Household (%) on Various Sources of Water (multi-source
possible). Source All 7
cities Delhi Mumbai Kolkata Hydera
-bad Kanpur Ahmed-
abad Madu-rai
1.Municipal Tap Water 92.0 91.9 98.6 98.8 99.7 54.1 94.2 98.5
-- of which community tap 9.5 8.1 1.5 1.9 0.3 45.9 20.0 1.5
Depend only on Municipal Tap water 57.6 71.4 94.4 68.5 39.7 15.5 59.6 17.7
2.Groundwater
a. Tube well/hand-pumps 38.1 24.5 3.6 27.8 48.5 79.2 38.5 81.1
--of which private tube-well
/hand-pumps
24.0 6.3 3.6 1.0 41.8 36.4 37.2 76.7
b. Well/Open Well 1.0 0.2 0.6 2.8 3.3
Depend only on Groundwater 6.9 7.5 1.3 0.3 40.6 5.0 1.5
3. Tanker 2.1 2.0 0.5 10.6 1.1
--of which municipal tankers 59.3 60.0 100.0 54.5 100.0
4. River/Canal /Tank 0.4 2.8
5. Packaged/Mineral Water 0.8 2.2 1.0 0.5 0.3 0.2 1.5
6. Others (Railways supply, broken
pipes, mill compounds, etc.)
1.1 0.2 0.6 5.3 2.5
Source: As for Table 1.
Households in these cities also face wide seasonal fluctuations in municipal tap water
supply. More than 85% of the households in these cities say that shortage in water supply
becomes acute during summer. The seasonal variations in municipal tap water supply leads
to use of ground water by households as it is seen as the easiest, fastest and to an extent
durable ‘solution’ to the water crisis. And, as mentioned above, this is resulting in
groundwater depletion in and around the cities. The overuse of groundwater resources has
lead to increase in arsenic concentration in many wards in Kolkata, and similarly fluoride
concentration in majority of cities and towns in Rajasthan and Gujarat.
About 11% of the households in Hyderabad are dependent on tanker water supply. Out of
this, 46% are dependent on private tankers. This indicates that private vendors have their
hey-day in the city. About 2% of the households in Delhi and 1.1% in Madurai are also
using tanker water supply. The packaged/mineral water, particularly for drinking purpose,
is also making inroad to urban households. This is supported by the fact that 2.2% of the
households in Delhi, 1.0% in Mumbai and 1.5% in Madurai use packaged water. Kolkata

14
seems to be an exception as none of the surveyed households in the city has reported using
packaged water for drinking purpose. It is interesting to note that although about 10% of
the households in Kolkata say that water is ‘not so safe’ and ‘not safe at all’, and further
about 26% express their inability to say anything about the quality of tap water supplied by
municipal corporation, still none of these households report using packaged/mineral water
(Table 9). Ideological orientation of the population, largely supporting communist ideology
and having reservations about multinationals and private companies, may be playing a big
role in this regard. Table 9 also shows that only about 40% of the households in Kolkata
view municipal water “quite safe” or “very safe”. In Madurai, Mumbai and Delhi, about
74%, 65% and 52% of the households, respectively, view municipal water supply “quite
safe” and “very safe”, but in the case of Kanpur, only about 11% say so. Thus, one finds
that a sizeable share of households do not consider the municipal tap water as ‘safe’ or
‘very safe’ for drinking.
Table 9: Perception of Households (%) about the Quality of Water from Municipal
Taps.
Safety Level All 7 Cities
Delhi Mumbai Kolkata Hyderabad Kanpur Ahmedabad Madurai
Not safe at all 2.9 2.96 .20 3.25 2.76 9.90 1.11 1.89
Not so safe 5.0 6.71 2.40 6.50 3.02 12.54 2.49 1.89
Somewhat safe 21.5 30.97 28.40 24.25 12.06 20.46 7.20 21.13
Quite safe 28.6 30.97 31.80 15.50 22.36 10.23 43.49 47.55
Very safe 25.6 20.51 33.60 24.25 57.04 .99 9.14 26.04
Cannot say 16.8 7.89 3.60 26.25 2.76 45.87 36.57 1.51
Total 100.0 100.00 100.00 100.00 100.00 100.00 100.00 100.00
Source: As for Table 1.
Contamination of municipal tap water has been a common problem, particularly in slums,
in Indian cities. The data from Municipal Corporation of Greater Mumbai (MCGM) shows
that 8-10% of the samples taken at consumer taps in 1997 and 1998 were contaminated by
coliform bacteria and unfit for consumption (MCGM, 1999). However, the present study
reveals that about 46% of the households in slums “feel” that municipal tap water supply is
‘somewhat safe’. In comparison to Mumbai, about 37% in Delhi, and only 10% in Kolkata
considered that piped water is “somewhat safe”. As opposed to Mumbai, where none of
the households living in slum areas state that the Municipal tap water is “unsafe”, 2% slum
households in Delhi and 2.7% in Kolkata consider the water “not safe at all”. In Kolkata,
about 49% of the slum households were unable to say anything about the quality of the
municipal water, while in Delhi and Mumbai, the percentages of slum households
expressing the similar views were 26% and 8%, respectively. A study by Karn, et.al.

15
(2003) in some selected slums in Mumbai shows that the percentage of households boiling
water before consumption varies from slum to slum: highest being 14%, and the lowest
5%. However, the present study shows that about 12% of the slum households boil water
before consumption, and 80% filter it by cloth, and remaining 8% do not use any
purification method before consumption. In Delhi’s slums, about 9% of the households
filter the water before its consumption, 6% boil it, and 85% use no purification methods.
In Kolkata, about 78% of the slum households use no purification method. In Kanpur, none
of the households in slum areas reported using any water purification methods.
IV.4 Duration of Water Supply and Distance of Source of Water
Cleanliness of municipal water in Indian cities is not the only issue, the supply is also very
erratic and for a very limited duration. A basic need and service like water on tap for 24
hours a day has been unheard of for decades in most Indian towns (ADB, 1993). As the
supply is highly erratic and for a very limited duration, the households and housing
societies store water in their tanks and drums. In the seven cities, about 18% of the
households, who reported using municipal tap water supply, stated that the water supply on
tap was available for 24 hours, while about 25% and 27% claimed that it was available for
a few hours (less than 4 hours) twice a day, and once in a day, respectively (Table 10).
About 21% of the households in these cities report that water on tap comes for a few hours
in two days. Among the seven cities, only in the case of Ahmedabad and Kolkata, about a
half of the total households report that the water on tap is available for 24 hours. But in
case of Mumbai, Delhi Kanpur and Madurai, only 5%, 14%, 6% and 3%, respectively, of
the total households report so. In Hyderabad, hardly any household reports the supply of
water for 24 hours. More than 80% of the total households in Mumbai get water on tap for
a few hours once in a day, while about two-thirds of the Delhi residents report that they get
the supply twice a day for a few hours. Hyderabad, has dubious distinction among the
cities as about 90% of households in the city state that the water on tap is supplied only for
a few hours once in two days. In Kanpur, the situation is more pathetic, where more than
two-fifths of the households inform that the supply of municipal tap water is not
predictable at all.

16
Table 10: Availability of Tap Water to Households (%) in Indian Cities. Supply All 7
Cities
Delhi Mumbai Kolkata Hyderabad Kanpur Ahmedabad Madurai
24 hours / round the clock 17.9 13.6 5.0 47.3 0.3 5.6 50.1 2.6
For a few hours once in a day 27.0 15.4 84.4 2.8 7.0 7.3 38.5 14.7
For a few hours twice a day 24.9 64.3 7.4 39.3 44.2 6.4 1.5
Once in two days 20.7 0.2 88.9 2.2 77.0
Once in four days 0.0 0.4
Once in a Week 0.2 3.4
Not predictable 1.8 3.7 2.8 0.5 2.0 1.7
Cannot say 7.3 3.0 0.2 10.3 1.8 41.3 2.8 0.4
Total 100.0 100.0 100.0 100.0 100.0 100.0 100.0 100.0
Source: As for Table 1.
Only about 68% of the total population in the seven cities under focus have source of water
supply within their premises. The 54th
round NSSO data also reveals that a total 65.7% of
the households in urban India have source of water supply within their dwelling or
premises (Bajpai and Bhandari, 2001). There is a wide variation among the cities in terms
of location of the source of water. Where about 62% and 50% of the households have the
source of water outside the dwelling and premises in Kanpur and Kolkata, respectively, in
Mumbai, only about 13% of the households have the source of water outside their
premises. In Ahmedabad and Delhi, about one-fifth and one-fourth, respectively, of the
total households collect water from outside their house premises.
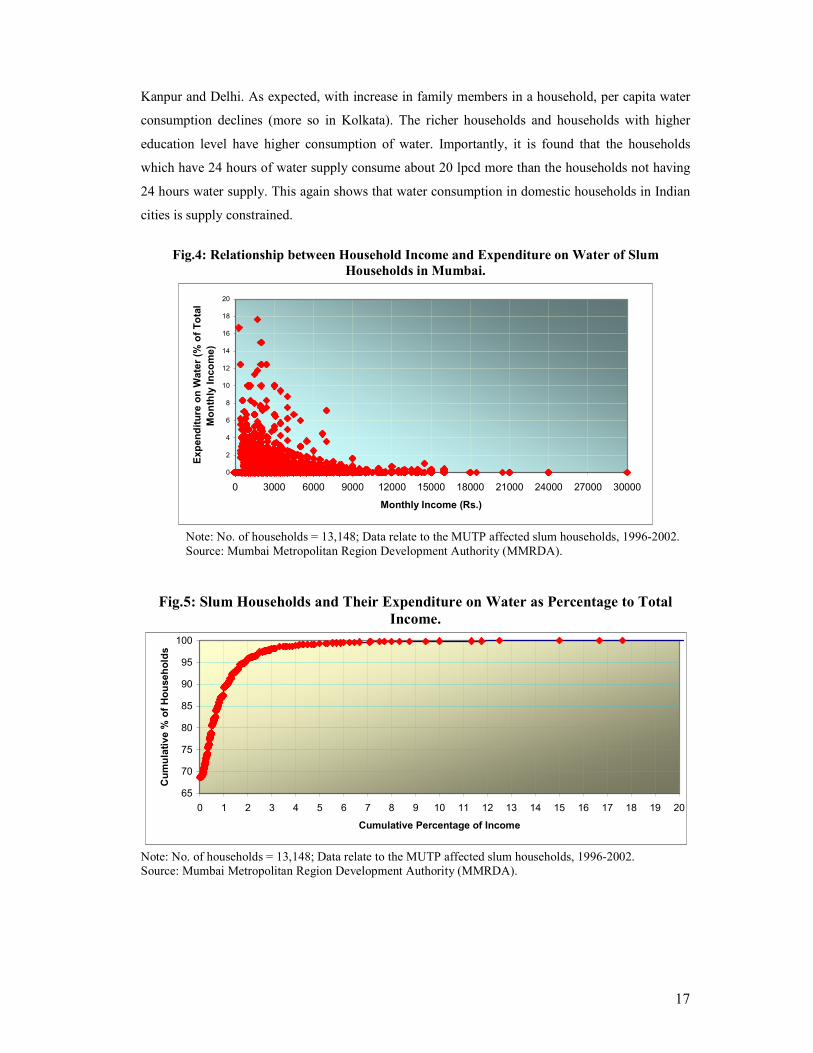
IV.5 Expenditure and Determinants of Domestic Water Consumption
Available data on slum households in Mumbai show that poorer households spend a large share of
their income on water. These are households with monthly income of Rs.3000 (below poverty line)
or less who suffer the most (Fig.4). Fig.5 shows that about 5% of such households spend more
than 2% of their income on water. Thus, water which should have otherwise been human right,
takes precious shares of income of the poor.
The analysis of determinants of water consumption has always been of special interest to
academics and policy makers. Although, it is known that water consumption is supply constrained
in the cities under focus, we have attempted to find out the determinants of even this limited
supply/consumption of water. As shown in Table 11, there are considerable variations among the
cities in terms of per capita water consumption and the greatest similarity emerges only between
17
Kanpur and Delhi. As expected, with increase in family members in a household, per capita water
consumption declines (more so in Kolkata). The richer households and households with higher
education level have higher consumption of water. Importantly, it is found that the households
which have 24 hours of water supply consume about 20 lpcd more than the households not having
24 hours water supply. This again shows that water consumption in domestic households in Indian
cities is supply constrained.
Fig.4: Relationship between Household Income and Expenditure on Water of Slum
Households in Mumbai.
0
2
4
6
8
10
12
14
16
18
20
0 3000 6000 9000 12000 15000 18000 21000 24000 27000 30000
Monthly Income (Rs.)
Expenditure on Water (% of Total
Monthly Income)
Note: No. of households = 13,148; Data relate to the MUTP affected slum households, 1996-2002.
Source: Mumbai Metropolitan Region Development Authority (MMRDA).
Fig.5: Slum Households and Their Expenditure on Water as Percentage to Total
Income.
65
70
75
80
85
90
95
100
0 1 2 3 4 5 6 7 8 9 10 11 12 13 14 15 16 17 18 19 20
Cumulative Percentage of Income
Cumulative % of Households
Note: No. of households = 13,148; Data relate to the MUTP affected slum households, 1996-2002.
Source: Mumbai Metropolitan Region Development Authority (MMRDA).

18
Table 11: Determinants of Consumption of Water in Domestic Households.
Determinants Regression
Coefficients
t-values P=Values
Intercept ( )0α 93.240 15.005 0.000
Mumbai ( )1α 22.399 2.811 0.005
Kolkata ( )2α 58.971 7.319 0.000
Hyderabad( )3α 29.043 3.685 0.000
Kanpur( )4α 11.093 1.144 0.253
Ahmedabad( )5α 42.674 4.575 0.000
Madurai ( )6α 34.421 3.311 0.001
No of family members ( )0φ -5.343 -5.104 0.000
Family Members Mumbai ( )1φ -1.721 -1.157 0.247
Family Members Kolkata ( )2φ -7.171 -4.569 0.000
Family Members Hyderabad ( )3φ -2.539 -1.682 0.093
Family Members Kanpur ( )4φ -1.332 -.772 0.440
Family Members Ahmedabad ( )5φ -7.194 -4.032 0.000
Family Members Madurai ( )6φ -5.384 -2.538 0.011
Asset Score ( )β .716 3.007 0.003
Year of Schooling of Housewife ( )λ .359 1.736 0.083
24 hrs Tap Water Availability ( )π 19.392 7.083 0.000
2 0.444R =
41.750f = 0.000
Note: 1α to 6α are slope shifters dummies while 1φ to 6φ are slope shifter variables.
Source: Computed using field survey data.
V. Conclusions
Although recycled by the Nature, the fresh water is a limited resource. The high water
consuming economic activities and population explosion are responsible for declining per
capita water availability. To consume more is emerging main goal of societies, more so of
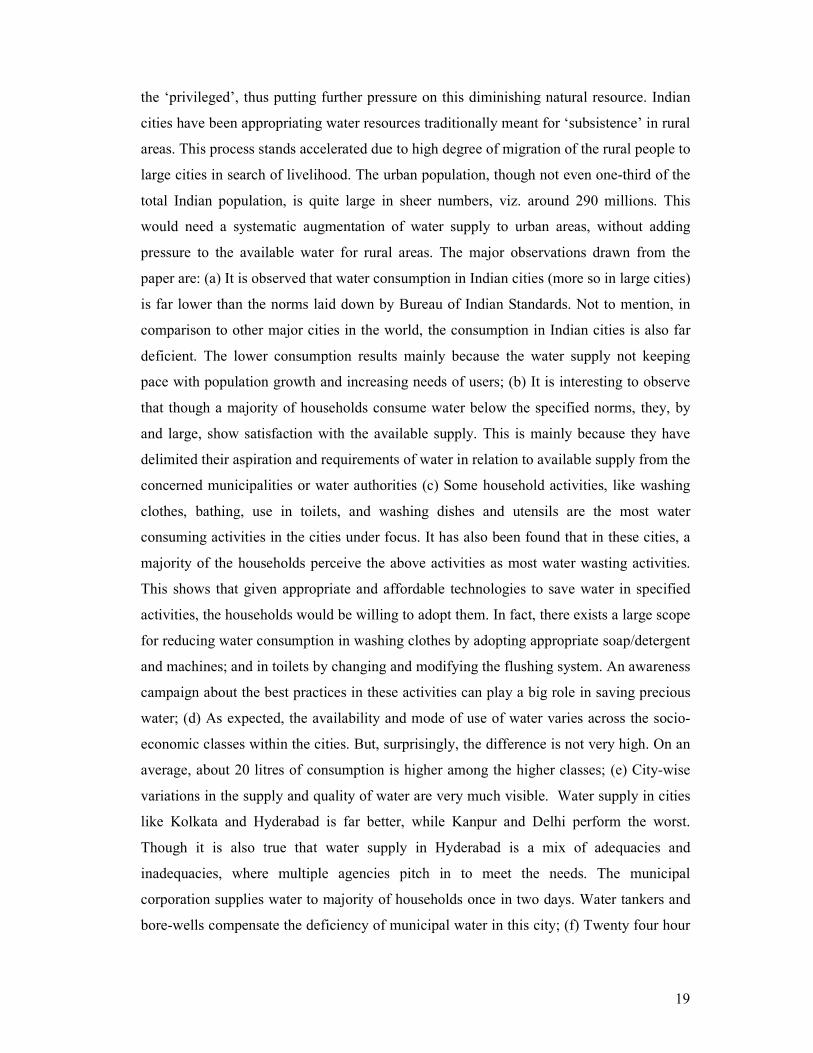
19
the ‘privileged’, thus putting further pressure on this diminishing natural resource. Indian
cities have been appropriating water resources traditionally meant for ‘subsistence’ in rural
areas. This process stands accelerated due to high degree of migration of the rural people to
large cities in search of livelihood. The urban population, though not even one-third of the
total Indian population, is quite large in sheer numbers, viz. around 290 millions. This
would need a systematic augmentation of water supply to urban areas, without adding
pressure to the available water for rural areas. The major observations drawn from the
paper are: (a) It is observed that water consumption in Indian cities (more so in large cities)
is far lower than the norms laid down by Bureau of Indian Standards. Not to mention, in
comparison to other major cities in the world, the consumption in Indian cities is also far
deficient. The lower consumption results mainly because the water supply not keeping
pace with population growth and increasing needs of users; (b) It is interesting to observe
that though a majority of households consume water below the specified norms, they, by
and large, show satisfaction with the available supply. This is mainly because they have
delimited their aspiration and requirements of water in relation to available supply from the
concerned municipalities or water authorities (c) Some household activities, like washing
clothes, bathing, use in toilets, and washing dishes and utensils are the most water
consuming activities in the cities under focus. It has also been found that in these cities, a
majority of the households perceive the above activities as most water wasting activities.
This shows that given appropriate and affordable technologies to save water in specified
activities, the households would be willing to adopt them. In fact, there exists a large scope
for reducing water consumption in washing clothes by adopting appropriate soap/detergent
and machines; and in toilets by changing and modifying the flushing system. An awareness
campaign about the best practices in these activities can play a big role in saving precious
water; (d) As expected, the availability and mode of use of water varies across the socio-
economic classes within the cities. But, surprisingly, the difference is not very high. On an
average, about 20 litres of consumption is higher among the higher classes; (e) City-wise
variations in the supply and quality of water are very much visible. Water supply in cities
like Kolkata and Hyderabad is far better, while Kanpur and Delhi perform the worst.
Though it is also true that water supply in Hyderabad is a mix of adequacies and
inadequacies, where multiple agencies pitch in to meet the needs. The municipal
corporation supplies water to majority of households once in two days. Water tankers and
bore-wells compensate the deficiency of municipal water in this city; (f) Twenty four hour
20
water supply on municipal taps is a dream for a majority of households in the large cities in
the country. The study reveals that only about 18% of the total households in these cities
get 24 hours municipal water supply. The erratic and limited duration of supply of water
has become a common phenomenon in these cities. This has forced the households, in
majority of the cities, to depend on groundwater and other sources of water, like the private
vendors who supply water through tankers and drums. These, in turn, are leading to
depletion of groundwater due to over withdrawal by the burgeoning population and
emerging water markets. In fact, during the summer season private water vendors have
their hay-days in these cities; (g) The much talked commodification of water and water
services is also making dent into the otherwise role of government departments as the key
supplier of water in cities. For instance, in cities like Delhi, Mumbai, Hyderabad,
Ahmedabad, and Madurai some households have started using packaged water for drinking
purposes. It is also true that so far none of these cities have permanently handed over the
task of supply to their citizens (NGOs) or the private sector.
To conclude, it can be stated that the supply of water in large cities of India is going to be a
big challenge in future. The rapid increase in population in these cities, depleting water
resources and enhanced consumer needs are going to create a difficult situation. The
market oriented development is creating new needs in sectors like entertainment industry
and tourism, building industry, adapted new technologies pushing up water needs, more
supply in shopping malls, and so on. Simultaneously, the alarming rise in pollution levels
in surface water bodies and even in groundwater is going to add to the situation. Therefore,
an urgent need is felt for a comprehensive water policy for cities which is suitable and
satisfactory to growing needs of citizens. The prevailing ‘adhocism’ in protecting,
enhancing and conserving water needs to be done away with.
[Note: This paper partly draws from the paper “Water Consumption Pattern in Domestic Households in Major Indian
Cities” by Abdul Shaban and R.N. Sharma, published in Economic and Political Weekly, June 9, 2007.]

21
References
Asian Development Bank. (1993). Service Level and the Urban Poor: Managing Water
Resources to Meet Megacity Need, Themes Paper, Proceedings of Regional
Consultations, Manila.
Bajpai, P. and Bhandari, L. (2001). Ensuring Access to Water in Urban Households.
Economic and Political Weekly, Sept. 29: 3774-3778.
Bartram, Howard G. (2003). Domestic Water Quantity: Service Level and Health, WHO,
Geneva.
Down to Earth. (2005). Fact Sheet: Fresh Water Up for Grab, Down to Earth, March 5.
Figureres, C.M., et.al. (2005). Rethinking Water Management, Earthscan Publications Ltd.,
London
Govt. of India. (1997). Ninth Five -Year Plan 1997-2002 - Vol. II, Planning Commission,
New Delhi.
Govt. of India. (2002). Tenth Five -Year Plan 2002-2007 - Vol. II, Planning Commission,
New Delhi.
Karn, S.K. et.al. (2003). Living Environment and Health of Urban Poor: A Study in
Mumbai, Economic and Political Weekly, Aug. 23: 3575-3586.
MCGM (1999). Health Profile 1997 and 1998, Metropolitan Corporation of Greater
Mumbai, Mumbai.
Modi, P.N. (1998). Water Supply Engineering, Standard Book House, Delhi.
Ramachandraiah, C. (2001). Drinking water as a Fundamental Right, Economic and
Political Weekly, Feb. 24: 619-621.
Shaban, Abdul and Sharma (2007). Water Consumption Pattern in Domestic Households
in Major Indian Cities, Economic and Political Weekly, June 9:2190-2197.
Soni, Vikram. (2003). Water and Carrying Capacity of a City– Delhi, Economic and
Political Weekly, Nov. 8: 4745-4750.
WHO. (2003). The Right to Water, WHO, Geneva.