water meters john van arsdel
TRANSCRIPT

John H. Van Arsdel, Vice President
Water meters:

Water PumpedWater Sold
Gallons of water being pumped into the distribution systemeach billing period exceeds the gallons being sold.

Water Loss Control
Monitoring water resources has been conducted for thousands of years.
Roman Adjutage
Julius Frontenus was first Roman Water Commissioner and recognized importance of equitable water distribution (300 BC)
Flow

Metering of Water
Concept of “water rights” and efficient water use has been debated and fought over for centuries
End result: majority of water is now metered for equitable economic distribution.

AWWA Policy Statement (M-36)Metering
Meter all water introduced into distribution system
Meter all water distributed to users
** Metering provides basis of assessing users equitably, encourages responsible and efficient use of a precious resource (remember: Julius Frontenus)

MeteringThe purpose of metering water:
Produce revenue to operate the utility
To make sure each customer is charged equitably for water use
Protect a valuable resource
Encourage conservation and proper stewardship

Water PumpedWater Sold
Where did it all go??

Water Audit Process: A Top Down Approach
• Advantage: quickly pulls together data and information that is readily available.
• Disadvantage: for most water utilities, incomplete or inaccurate data limits the validity of the top-down water audit.

Water Audit Form
•v 5.0 available free from AWWA at:
www.awwa.org
Developed by the AWWA Water Loss Committee
Easier than a 1040 form!
Water Audit Report for:Reporting Year:
PLEASE CHOOSE REPORTING UNITS FROM THE INSTRUCTIONS SHEET BEFORE ENTERING DATA
WATER SUPPLIED
Volume from own sources:Master meter error adjustment (enter positive value):
Water imported:Water exported:
WATER SUPPLIED: 0.000.
AUTHORIZED CONSUMPTIONBilled metered:
Billed unmetered:Unbilled metered: Pcnt: Value:
Unbilled unmetered: 0.000 1.25%
AUTHORIZED CONSUMPTION: 0.000
WATER LOSSES (Water Supplied - Authorized Consumption) 0.000
Apparent Losses Pcnt: Value:
Unauthorized consumption: 8 0.000 0.25%
Customer metering inaccuracies: 0.000Systematic data handling errors:
Apparent Losses: 0.000
Real LossesReal Losses = Water Losses - Apparent Losses: 0.000
WATER LOSSES: 0.000
NON-REVENUE WATERNON-REVENUE WATER: 0.000
= Total Water Loss + Unbilled Metered + Unbilled Unmetered
SYSTEM DATA
Length of mains:Number of active AND inactive service connections:
Connection density:Average length of customer service line:
Average operating pressure:
COST DATA
Total annual cost of operating water system: $/Year
Customer retail unit cost (applied to Apparent Losses):
Variable production cost (applied to Real Losses): $/
PERFORMANCE INDICATORS
Financial IndicatorsNon-revenue water as percent by volume of Water Supplied:Non-revenue water as percent by cost of operating system:
Annual cost of Apparent Losses:Annual cost of Real Losses:
Operational Efficiency Indicators
Apparent Losses per service connection per day:
Real Losses per service connection per day*:
Real Losses per length of main per day*:
Real Losses per service connection per day per meter (head) pressure:
Unavoidable Annual Real Losses (UARL):
* only the most applicable of these two indicators will be calculated
WATER AUDIT DATA VALIDITY SCORE:
PRIORITY AREAS FOR ATTENTION:
1: Billed metered
2: Customer metering inaccuracies
3: Total annual cost of operating water system
Based on the information provided, audit accuracy can be improved by addressing the following components:
Add a grading value for 9 parameter(s) to enable an audit score to be calculated
Infrastructure Leakage Index (ILI) [Real Losses/UARL]:
Default option selected for unauthorized consumption - a grading of 5 is applied but not displayed
Choose this option to enter a percentage of
billed metered consumption. This is NOT a default value
Default option selected for Unbilled unmetered - a grading of 5 is applied but not displayed
AWWA WLCC Free Water Audit Software: Reporting Worksheet
<< Enter grading in column 'E'
?
?
?
?
?
? Click to access definition
?
?
?
?
?
?
Back to
Please enter data in the white cells below. Where available, metered values should be used; if metered values are unavailable please estimate a value. Indicate your confidence in the accuracy of the input data by grading each component (1-10) using the drop-down list to the left of the input cell. Hover the mouse over the cell to obtain a description of the grades
?
?
?
???
?
?
?
(pipe length between curbstop and customer meter or property boundary)
Use buttons to selectpercentage of water supplied
ORvalue
?Click here: for help using option buttons below
For more information, click here to see the Grading Matrix worksheet
WAS v4.0
?
Copyright © 2009, American Water Works Association. All Rights Reserved.
?
?
?
?

Standard Water Balance Format
WaterImported
OwnSources
TotalSystemInput
( allowfor
knownerrors )
TotalSystemInput
(allowfor
knownerrors)
WaterSupplied
WaterExported
WaterSupplied
WaterExported
WaterLosses
AuthorizedConsumption
WaterLosses
AuthorizedConsumption
RealLosses
ApparentLosses
UnbilledAuthorized
Consumption
BilledAuthorized
Consumption
Non-Revenue
Water
RevenueWater
Leakage & Overflows at Storage
Billed Unmetered Consumption
Billed Metered Consumption
Billed Water Exported
Leakage on Service Lines(before the meter)
Leakage on Mains
Customer Metering & Data Inaccuracies
Unauthorized Consumption
Unbilled Unmetered Consumption
Unbilled Metered Consumption
Start hereMove this direction

Water Losses
Apparent - Metering InaccuraciesUnauthorized Consumption
( $$ Non-Revenue Water $$ )
Real Losses - Leakage
( $$ Non-Revenue Water $$)

How do Apparent losses occur?
Inaccurate meters Wrong meter application Inaccurate meter reading (data
collection/management) Accounting errors Unauthorized consumption

This form of Pitot tube was designed by Edward S. Cole in 1896.
Henri Pitot (1700’s)

Old Woltmann style devicesEarly 1800’s
Late 1800’s

Class I Turbine
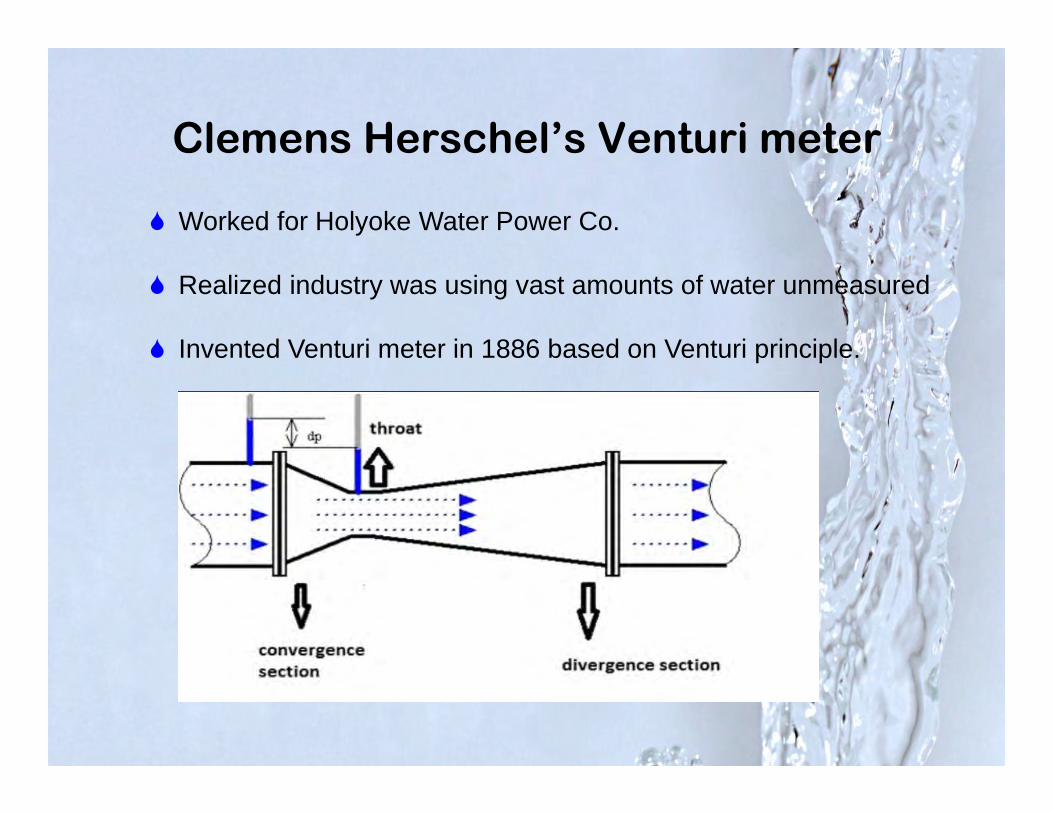
Clemens Herschel’s Venturi meter
Worked for Holyoke Water Power Co.
Realized industry was using vast amounts of water unmeasured
Invented Venturi meter in 1886 based on Venturi principle.
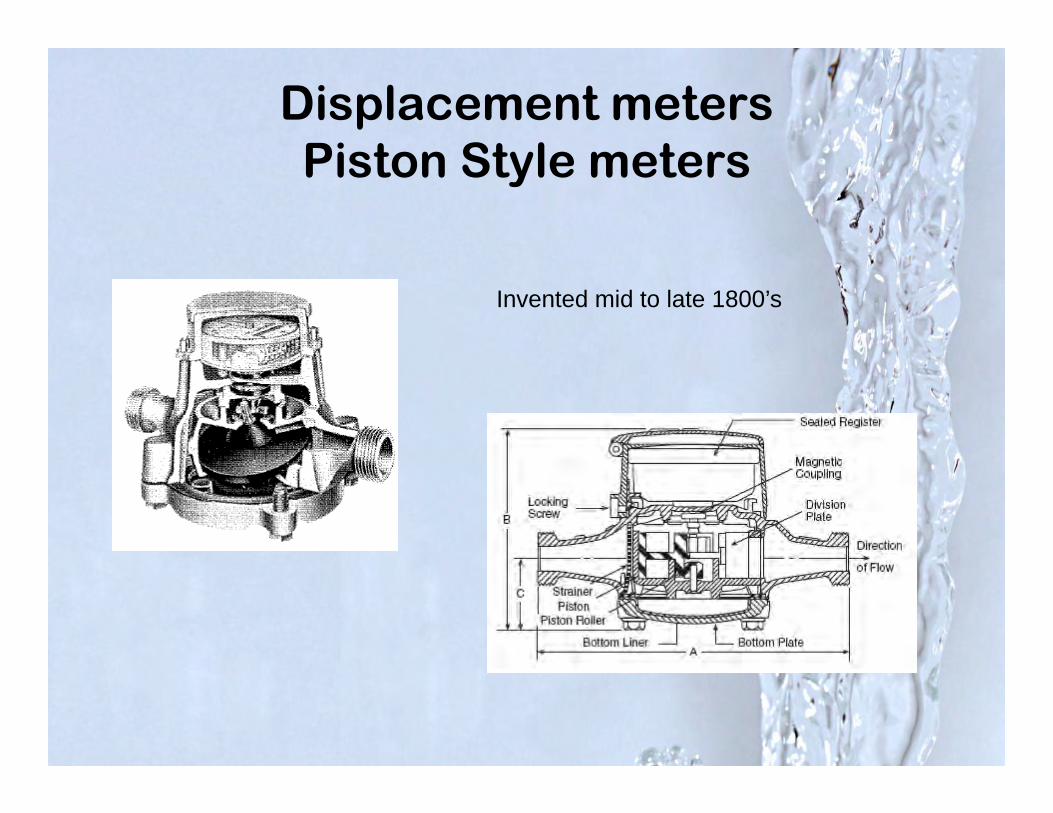
Displacement metersPiston Style meters
Invented mid to late 1800’s

Single Jet and Multijet meters
Invented mid to late 1800’s

Compound meters
Invented early 1900’s

Turbine style
Needs flow conditioning

Mag style meter

Ultra Sonic Meter

Ultrasonic Strap on meter

2010 Pumped vs. Billed & Difference
‐50000000
0
50000000
100000000
150000000
200000000
250000000
300000000
Jan Feb Mar Apr May Jun Jul Aug Sep Oct Nov Dec
Gallons
2010 Pumped vs Billed
Pumped
Billed
Dif

Meters: 13,475 total
Meter Size
(inches)
Numbers of Meters Percentage
5/8 12175 90.3533/4 162 1.2021 439 3.258
1 1/4 3 0.0221 1/2 244 1.811
2 363 2.6943 49 0.3644 18 0.1346 17 0.1268 4 0.03012 1 0.007
Total 13,475

Average annual revenue per sampled meter record
Meter Size Cu. Ft. Revenue
0.625 6,737 $211.170.75 11,946 $311.29
1 20,718 $490.641.25 no data no data
1.5 76,194 $3,770.292 97,335 $1,878.733 505,217 $7,991.874 470,220 $7,923.426 2,336,430 $42,795.008 9,496,130 $127,088.00
12 13,382,700 $179,486.00

Service Connection Diagram
Note differences in meter locations

Meter Selection Accuracy - (how good is it, really?)
Precision Error –technology and limitations
Bias Error – average measured value versus actual
Sensitivity – flow responsiveness
Linearity – readout “straight line” of not
Repeatability – results of data collection repeatable?
Range – Minimum flow versus Maximum flow
Traceable – traceable to a standard?

Meter Selection Things that can affect Meter Performance
Velocity profile Nonhomogeneous flow Air/solids in fluid Cavitation Pulsating flow Installation considerations
Straight pipe, flow conditionersPressure, Power needed for read out
Life Cycle costs
Meter Selection Meter size and type selection is generally a problem for larger water user, not residential or small commercial users.
If the meter is too big, low flow use will not get measured (or billed) properly.
If the meter is too small, the water use will be restricted and cause premature meter wear.

Meter Selection
Meter standards were set by AWWA early 1900’s
C 700 standards (701-704) M6 manual on selection, installation, and testing M33 manual on flow meters M22 manual on service line sizing and meter sizing
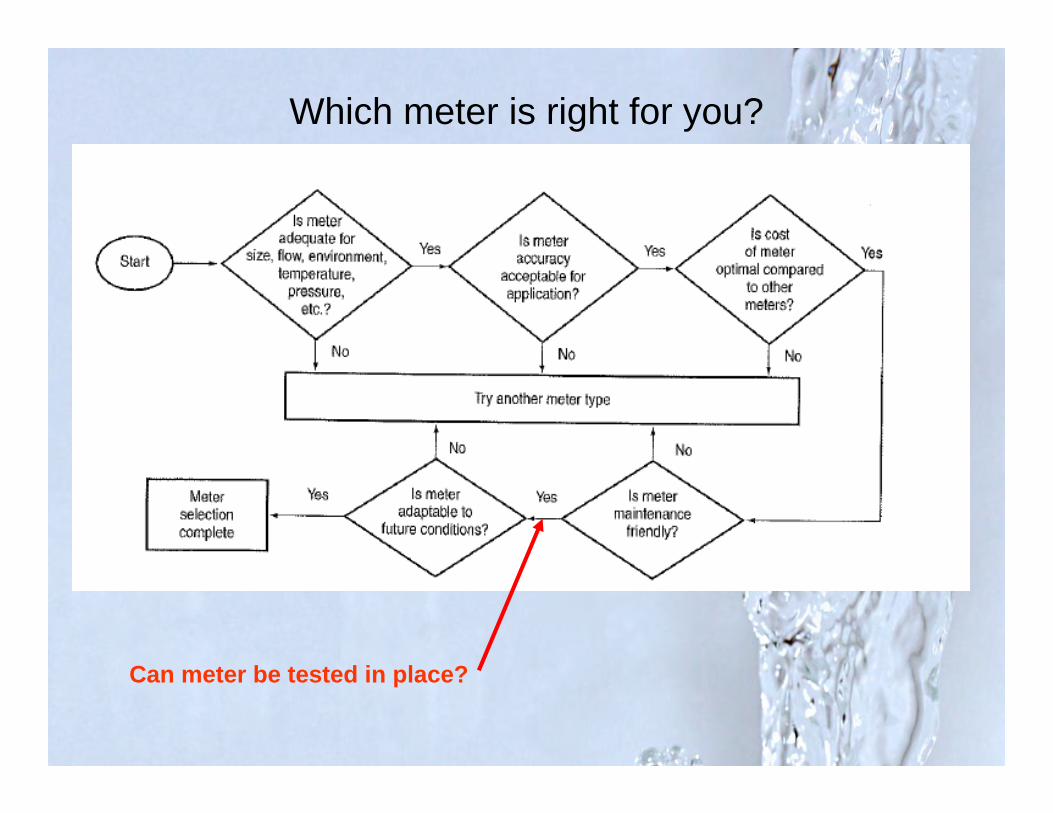
Which meter is right for you?
Can meter be tested in place?

Meter Installation
**Meter standards do not include meter setting standards.
Setting needs to be plumb and level (meters work better in horizontal plane)
Readily accessible for servicing, reading, testing Remove/install meter without piping/plumbing issues Electrical Grounding Protect from freezing Operational inlet/outlet valves Minimum pressure loss Public Safety Considerations

Meter installations
For vertical inside pipes
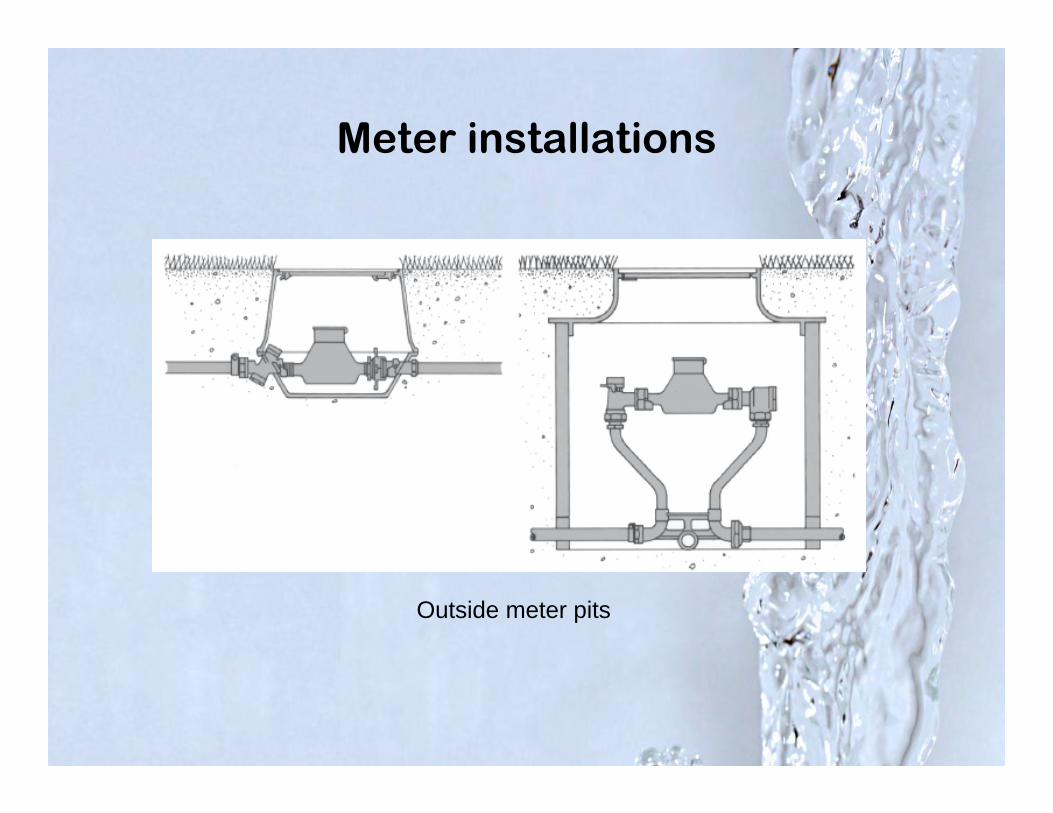
Meter installations
Outside meter pits

Meter installations
Hydraulically balanced settings

Q=VA
Q is “ Quantity” of water
V is velocity of flow measured in feet per second
A is Area of pipe: Inside diameter (ID) in square feet
Flow Measurement

FLOW
FLOW FLOW
FLOW
BUTTERFLY VALVE
INCRUSTATION / TUBERCULATION BUILD-UP ON WALLS
PARTIALLY CLOSED GATE VALVE
SMOOTH INTERIOR PIPE WALL

Meter Sizing
• If you use too Small of a Meter– Meter will be damaged by over speeding

Meter Sizing
• Who sizes your meters?
Do you put in the size and type of meter that is proper for the application?
Do you put in whatever size and type of meter that the builder/architect/engineer requests?

Sizing of Water Meters• Service Size = Meter Size
User Needs Fixture EvaluationAWWA manual – M22
\\\\\\\\\\\\\\\\\\\\\\\\\\\\\\\\\\\\\\\\\\\\\\\\\\\\\\\\\
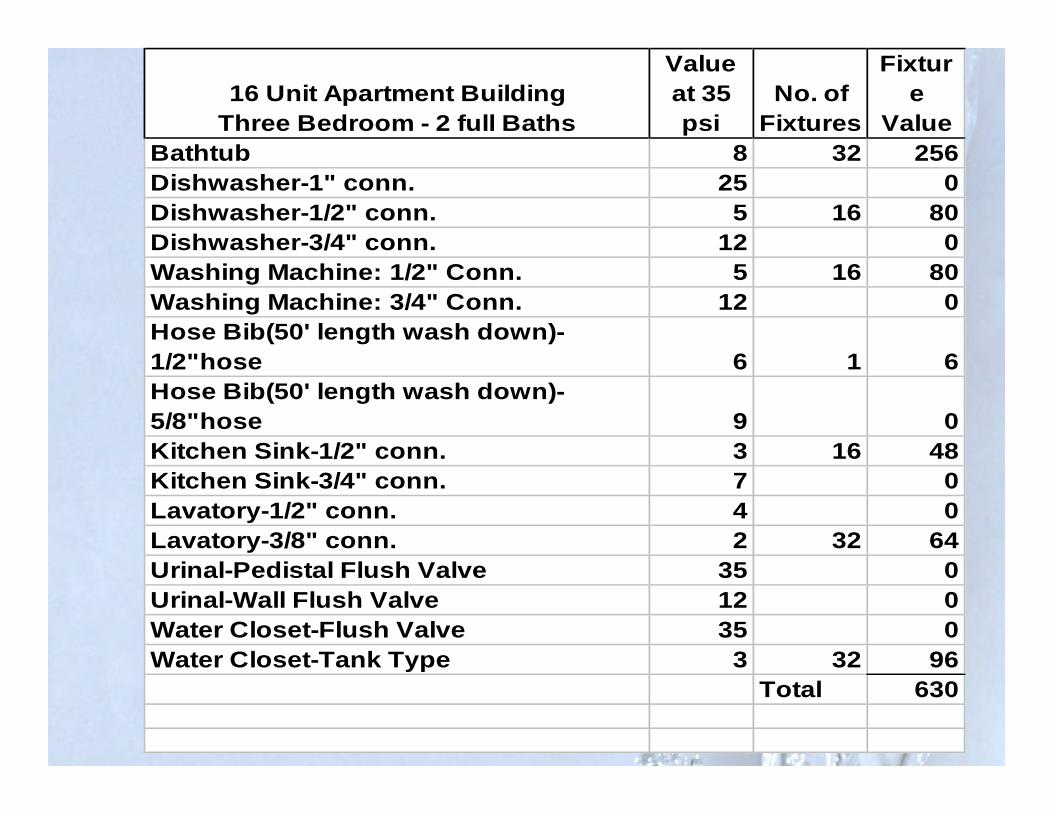
16 Unit Apartment Building Three Bedroom - 2 full Baths
Value at 35 psi
No. of Fixtures
Fixture
ValueBathtub 8 32 256Dishwasher-1" conn. 25 0Dishwasher-1/2" conn. 5 16 80Dishwasher-3/4" conn. 12 0Washing Machine: 1/2" Conn. 5 16 80Washing Machine: 3/4" Conn. 12 0Hose Bib(50' length wash down)-1/2"hose 6 1 6Hose Bib(50' length wash down)-5/8"hose 9 0Kitchen Sink-1/2" conn. 3 16 48Kitchen Sink-3/4" conn. 7 0Lavatory-1/2" conn. 4 0Lavatory-3/8" conn. 2 32 64Urinal-Pedistal Flush Valve 35 0Urinal-Wall Flush Valve 12 0Water Closet-Flush Valve 35 0Water Closet-Tank Type 3 32 96
Total 630

150
140
130
120
110
100
90
80
70
60
50
40
30
20
10
Domestic Use Hotels, Schools, Restaurants, Hospitals
Domestic Use Only
No Irrigation
ApartmentsMotelsCondosTrailer Parks
0 100 200 300 400 500 600 700 800 900 1000 1100 1200
Combined Fixture Value
Demand -gpm
Fig. 4.4 Water-Flow Demand per Fixture Value-Low Range
55 gpm
630

Master Meter Test Standards
• M-6 manual addresses turbines and propeller meters but does not address Venturi meters or other types.
• M-33 doesn’t state allowable accuracy levels (except to mention the manufacturer’s specs)

Production Mag Meter
Production Venturi Meter
Wholesale 16”Turbine meter
Commercial/Industrial Compound Meter

Commercial and Industrial Meters High Revenue Meters
Usually 10%-12% of the customers use 50% -60% of the water.
Test and repair industrial and commercial meters
Replace obsolete meters

Large Meter Testing Program
Meter testing should be performed as on-going maintenance program
An annual testing program will insure that revenues stay up
Test meters within 6 months of installation 2 percent of annual revenue should be ear
marked for meter testing

Testing Methodology
Refer to the AWWA M-6 Manual Test specs are for meter test bench situations Field testing (testing meters “on site”) requires
following a strict methodology. **M-6 does not spell out field testingrequirements.
Refer to the meter manufacturer specsNewer style meters require different testing
approach

Testing Methodology Calibrated test meter needs to be used
AWWA requires tests at 3 flows Low , Intermediate, High flows
In some cases testing may be limited by flow situation
It makes sense to conduct several tests at different flows to get full assessment of meter’s performance aside from the three tests.
Look at how water is being used by water customer That will help in determining proper meter size and type. Refer to the M-22 Manual on Service line and Meter sizing.

Field testing verses shop testing
• It doesn’t mater if the meter is 100% accurate, if it’s not accurate in it’s setting!
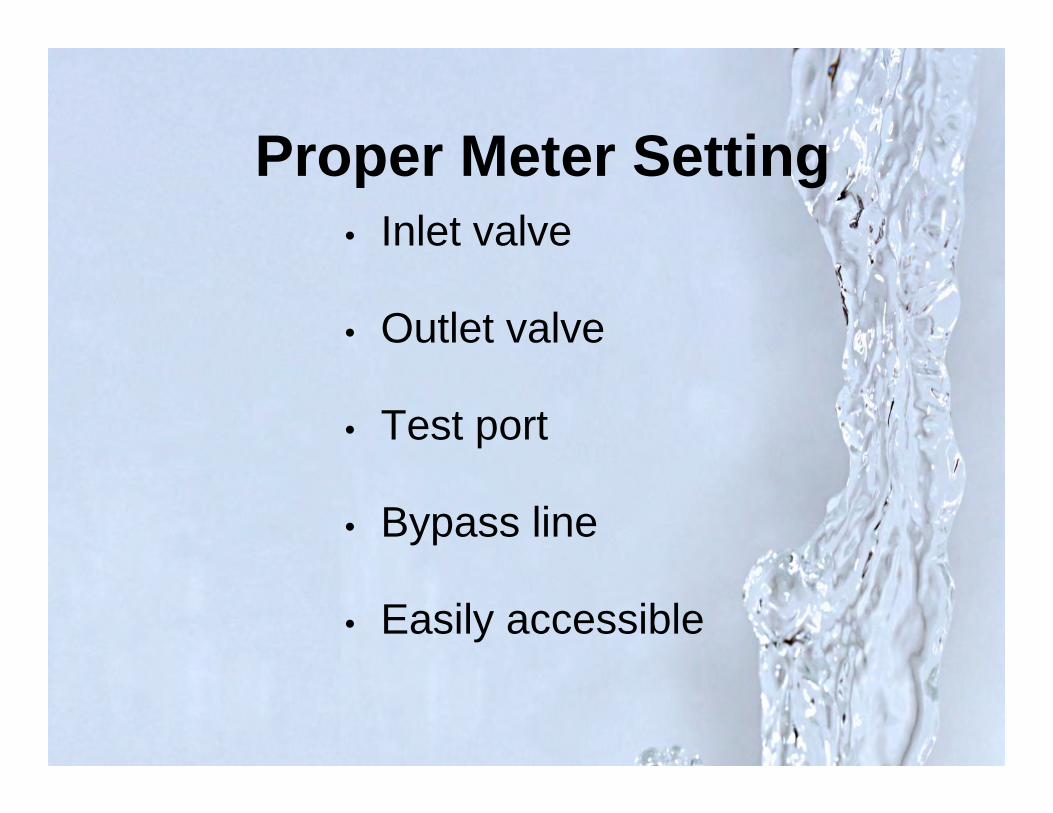
• Inlet valve
• Outlet valve
• Test port
• Bypass line
• Easily accessible
Proper Meter Setting
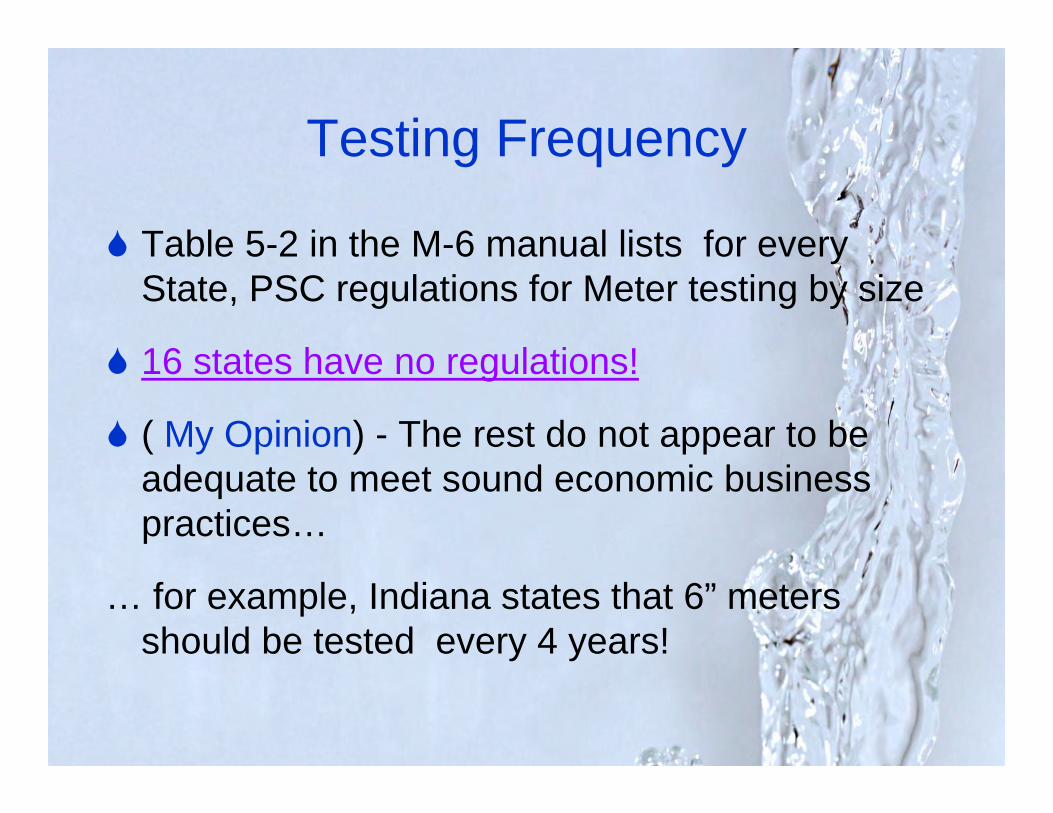
Testing Frequency
Table 5-2 in the M-6 manual lists for every State, PSC regulations for Meter testing by size
16 states have no regulations!
( My Opinion) - The rest do not appear to be adequate to meet sound economic business practices…
… for example, Indiana states that 6” meters should be tested every 4 years!

Using Revenue as a basis for large meter testing frequency
Using the rule of investing about 2% of a meter’s annual revenue in the “maintenance” (testing) of that meter, the following averages apply. $14,400.00 or greater = annual testing $7,200.00 to $14,400.00 = every 2 years $3,600.00 to $7,200.00 = every 3 years Less than $3,600.00 = every 4 years

Consequences of not maintaining meters
These are your cash registers! (** Do you think it is ok to loose 10% - 20% of your money?)
All your operating money comes from collecting the revenue generated by the meters!
Make sure everyone pays for their fair share
Sewer revenues often based on meter readings!(** Maybe you can get the sewer department to help fund the meter testing program!)

M.E. Simpson Co., Inc.
Effects of Normal Wear on Meter Accuracy
0102030405060708090
100
Time
Perc
enta
ge

M.E. Simpson Co., Inc.
Effects of Normal Wear on Meter Accuracy
0102030405060708090
100
Time
Perc
enta
ge

M.E. Simpson Co., Inc.
Effects of Normal Wear on Meter Accuracy
0102030405060708090
100
Time
Perc
enta
ge

Test in placeAdvantages
Practical - do not have to remove meter Test under conditions of current operation Able to inspect and assess flow conditions
Disadvantages Meter may be in a compromised setting Test sites may be compromised Flows may be limited You have to “settle” for what is available/practical

Remove and ship once a year for testing???

Residential Meters - Sample Testing
Test a sample of the residential meters to determine the overall accuracy of the residential metering system. Test 10% of a particular age group
of meters. If 10% of this sample fails to test within accuracy limits then a replacement program is needed

Residential Meters -
Weighted Averages: 15%-70%-15%
‘81 - ‘85 meters = 67% failure ‘86 - ‘90 meters = 40% failure ‘91 - ‘95 meters = 15% failure ‘96 - ‘99 meters = 17% failure ‘00 - ‘03 meters = 21% failureOverall = 26% failure


M.E. Simpson Co., Inc.

M.E. Simpson Co., Inc.
M.E. Simpson Co., Inc.
Why Utilities are installing AMR
Better customer infoProvides link to customer
completing a communications infrastructure to fully develop retail services business.Make sure that no curb reading is
being done Improve overall cash flow.


“4 Pillars” of Apparent Loss Management
UnavoidableApparent Loss
Meter accuracyerror
Meters do notregister actual
volumes passing
Unauthorized Consumption
Theft and illegalconsumption
Data transfer errors between
meter and archives
Poor customeraccountability
Data analysisErrors Between
archived data and data used forbilling/water
balance
Existing Apparent Losses
Economic Level
• As each component receives more or lessattention the losses will increase or decrease
• The operator strives tokeep losses to a minimum
Billing Meter Reading Customer Services Revenue Water Field Services System Development IT
NRW Management Team:

Thanks!!