water management implications of crhm: mountains to ... · water management implications of crhm:...
TRANSCRIPT

Water Management Implications of Water Management Implications of CRHM: Mountains to Prairies to ArcticCRHM: Mountains to Prairies to Arctic
John Pomeroy and colleaguesJohn Pomeroy and colleaguesCentre for Hydrology, Centre for Hydrology,
University of Saskatchewan, SaskatoonUniversity of Saskatchewan, Saskatoon
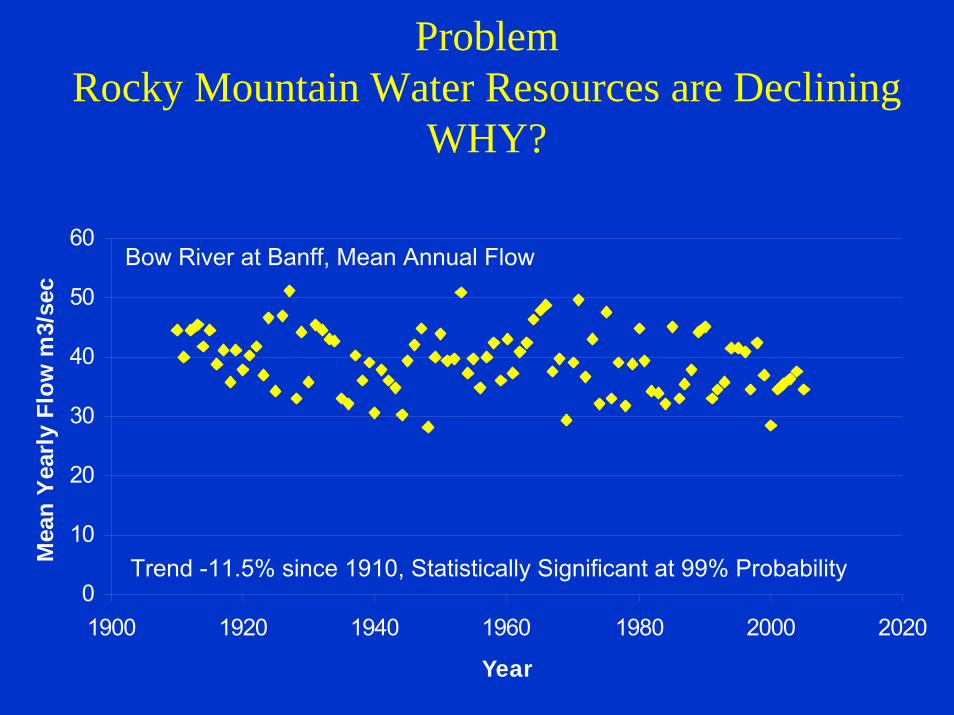
ProblemRocky Mountain Water Resources are Declining
WHY?
0
10
20
30
40
50
60
1900 1920 1940 1960 1980 2000 2020
Year
Mea
n Y
earl
y Fl
ow m
3/se
c
Bow River at Banff, Mean Annual Flow
Trend -11.5% since 1910, Statistically Significant at 99% Probability

Flows in Late Summer
0
20
40
60
80
100
120
1900 1920 1940 1960 1980 2000 2020
Year
Mea
n Au
gust
Flo
w m
3/se
c Bow River at Banff, Mean August Flow
Trend -24.9% since 1910, Statistically Significant at 99.9% Probability
Late summer flows large and dropping rapidly

Early Spring Flow Increasing
0
2
4
6
8
10
12
1900 1920 1940 1960 1980 2000 2020
Year
Mea
n M
arch
Flo
w m
3/se
c
Bow River at Banff, Mean March Flow
Trend +15.2% since 1910, Statistically Significant at 99.9% Probability
Winter flows small and rising somewhat

Marmot Creek Research Basin• 1450-2886 m.a.s.l. Kananaskis Valley, Bow River• Alpine• Subalpine• Montane• Clearcut• Meadow• 900 mm
precipitation• 70% snowfall• ~50% runoff
Marmot Basin
Bow River valley
Kananaskis River valley
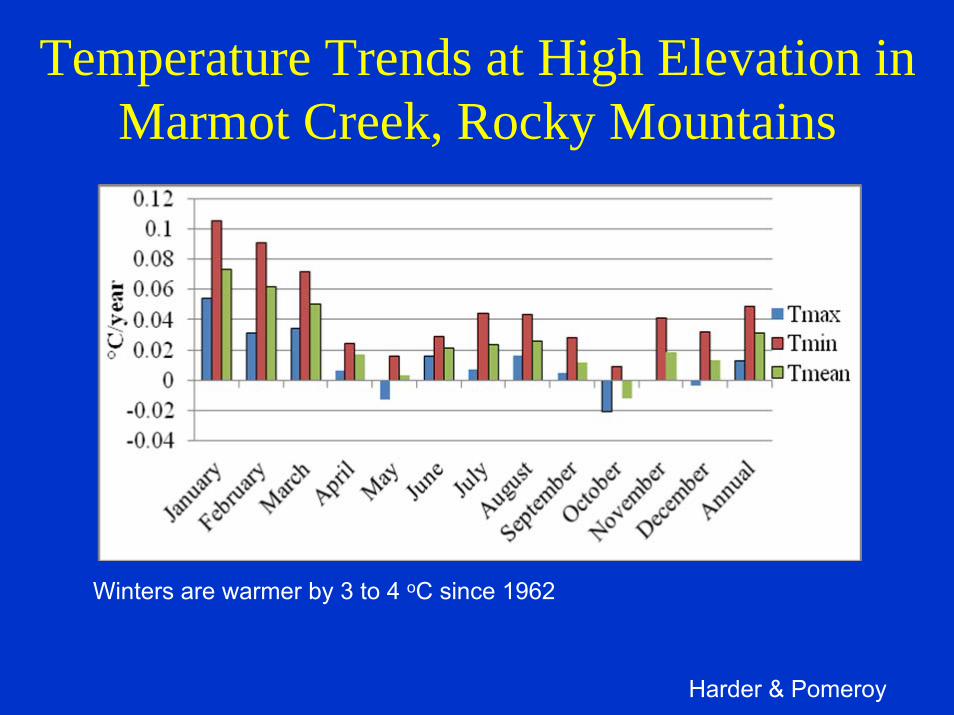
Temperature Trends at High Elevation in Marmot Creek, Rocky Mountains
Winters are warmer by 3 to 4 oC since 1962
Harder & Pomeroy
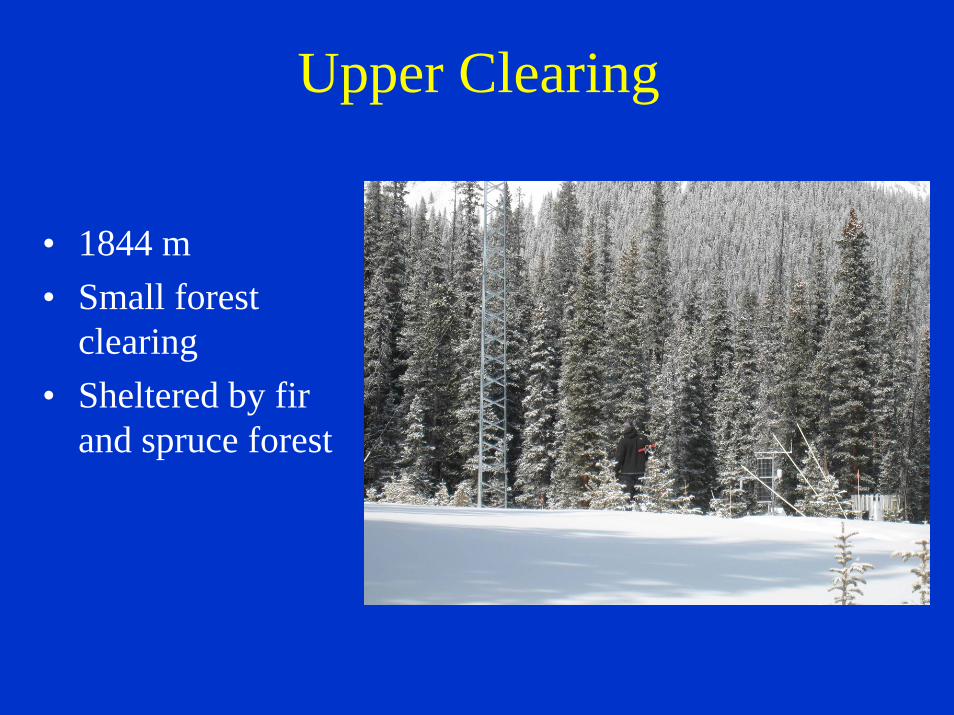
Upper Clearing
• 1844 m• Small forest
clearing• Sheltered by fir
and spruce forest
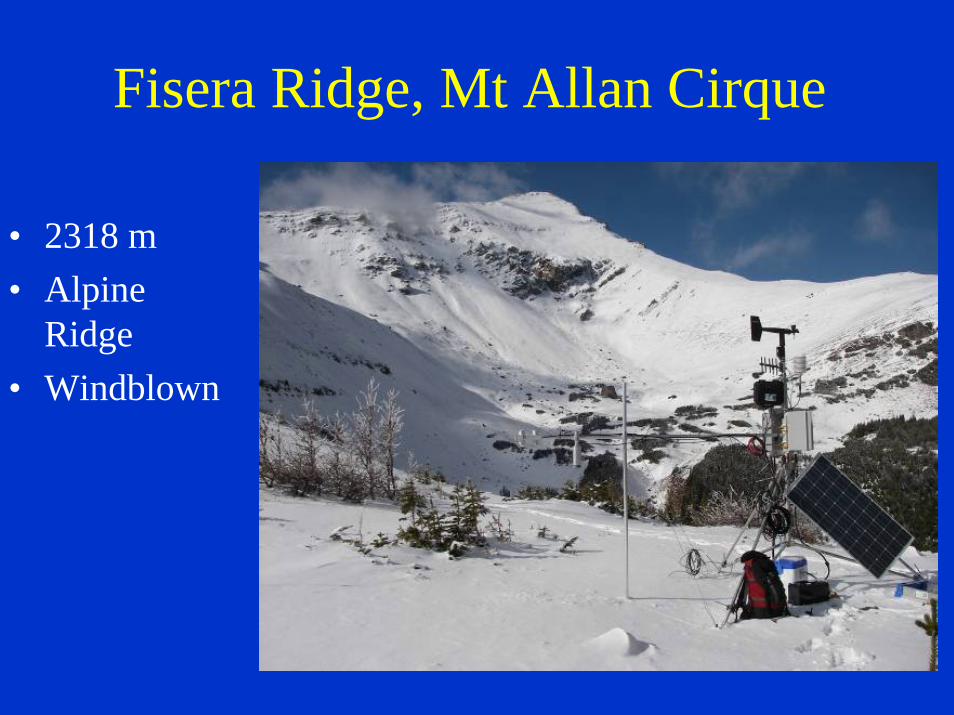
Fisera Ridge, Mt Allan Cirque
• 2318 m• Alpine
Ridge• Windblown
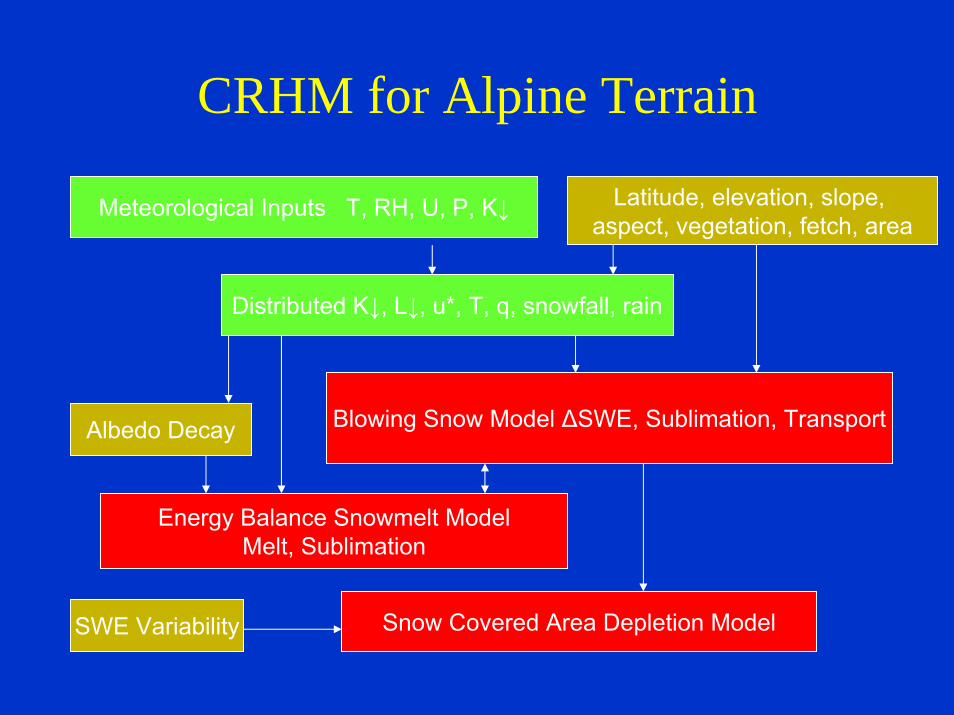
CRHM for Alpine Terrain
Meteorological Inputs T, RH, U, P, K↓
Distributed K↓, L↓, u*, T, q, snowfall, rain
Blowing Snow Model ΔSWE, Sublimation, Transport
Latitude, elevation, slope, aspect, vegetation, fetch, area
Energy Balance Snowmelt ModelMelt, Sublimation
Albedo Decay
Snow Covered Area Depletion ModelSWE Variability

0
0.1
0.2
0.3
0.4
0.5
0.6
0.7
01/11/06 01/12/06 31/12/06 30/01/07 01/03/07 31/03/07 30/04/07 30/05/07
snow
dep
th (m
)
observedsnow depth
calculatedsnow depth
Alpine Ridge Snow Modelling
Fisera Ridge
rms error = 0.134 m, mean error = 0.074 m
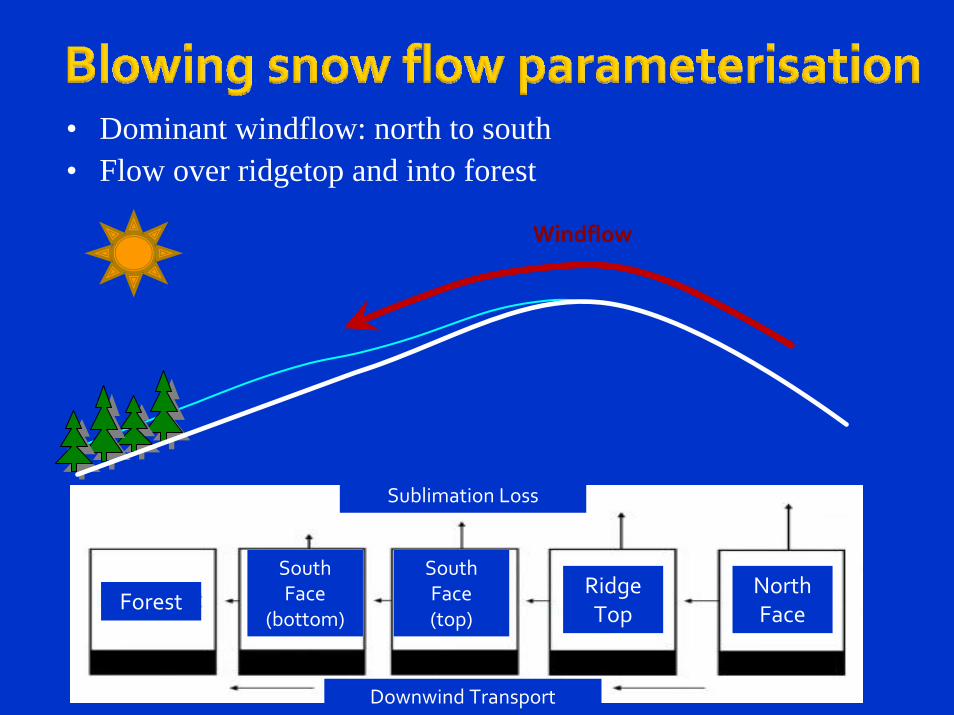
• Dominant windflow: north to south• Flow over ridgetop and into forest
ForestSouth Face
(bottom)
South Face(top)
RidgeTop
North Face
Sublimation Loss
Downwind Transport
Windflow

0
100
200
300
400
500
600
700
24-Sep-08 24-Oct-08 24-Nov-08 24-Dec-08 24-Jan-09 24-Feb-09 24-Mar-09
SWE
(mm
)
Snowfall NF SWE (SIM) Ridge SWE (SIM)
SF Upper SWE (SIM) SF Lower SWE (SIM) Forest SWE (SIM)
NF (OBS) Ridge (OBS) SF Upper (OBS)
SF Lower (OBS) Forest (OBS)
RMSE = 9.7 mmMB = 0.00

0%10%20%30%40%50%
050
100150200
Forest SF bottom SF top Ridgetop NF Transect Tran
sport
Out/Sno
wfall
Tran
sport
Out(m
m)
Transport Out Transport Out/Snowfall
0%10%20%30%40%50%
050
100150200
Forest SF bottom SF top Ridgetop NF Transect Blow
ing Snow
Sublim
ation/
Snow
fall
Blow
ing Snow
Sublim
ation
(mm)
Blowing Snow Sublimation Sublimation/Snowfall
0%25%50%75%100%
0100200300400
Forest SF bottom SF top Ridgetop NF Transect
Tran
sport
In/Sno
wfall
Tran
sport In
(mm)
Transport In Transport In/Snowfall

Winter Warming Impact on Alpine Ridge Snow Accumulation
0
50
100
150
200
30/11/06 30/12/06 29/01/07 28/02/07 30/03/07 29/04/07 29/05/07
SWE
(mm
)
reference simulation
+ 1°C
+ 2 °C
+ 3°C
+ 4 °C

Impact of Warming on Blowing Snow Fluxes
80
90
100
110
120
130
140
150
160
0.0 +0.5 +1.0 +1.5 +2.0 +2.5 +3.0 +3.5 +4.0
Temperature Increase ( ºC)
Cumulative Blow
ing Snow
Transpo
rt or
Sublim
ation (m
m)
Transport Sublimation

Impact of Winter Warming on Maximum Snow Accumulation
0
50
100
150
200
0 1 2 3 4air temperature increase (°C)
max
imum
SW
E (m
m)

Impact of Winter Warming on Snowmelt Rate
0123456789
0 1 2 3 4temperature increase (°C)
mel
t rat
e (m
m S
WE
/day
)

Impact of Winter Warming on Spring Snowmelt Duration
0
5
10
15
20
25
30
35
0 1 2 3 4
temperature increase (°C)
dura
tion
of s
prin
g m
elt (
days
)

Impact of Winter Warming on Date of Snowpack Depletion
0
0.5
1
1.5
2
2.5
3
3.5
4
03-May 08-May 13-May 18-May 23-May 28-May 02-Jun
date of snowcover depletion
tem
pera
ture
incr
ease
(°C
)

CRHM for Mountain Forests

0
0.1
0.2
0.3
0.4
0.5
0.6
0.7
01/11/06 01/12/06 31/12/06 30/01/07 01/03/07 31/03/07 30/04/07 30/05/07
snow
dep
th (m
)
observed snowdepthcalculated snowdepth
Forest Snow Modelling
Upper Clearing
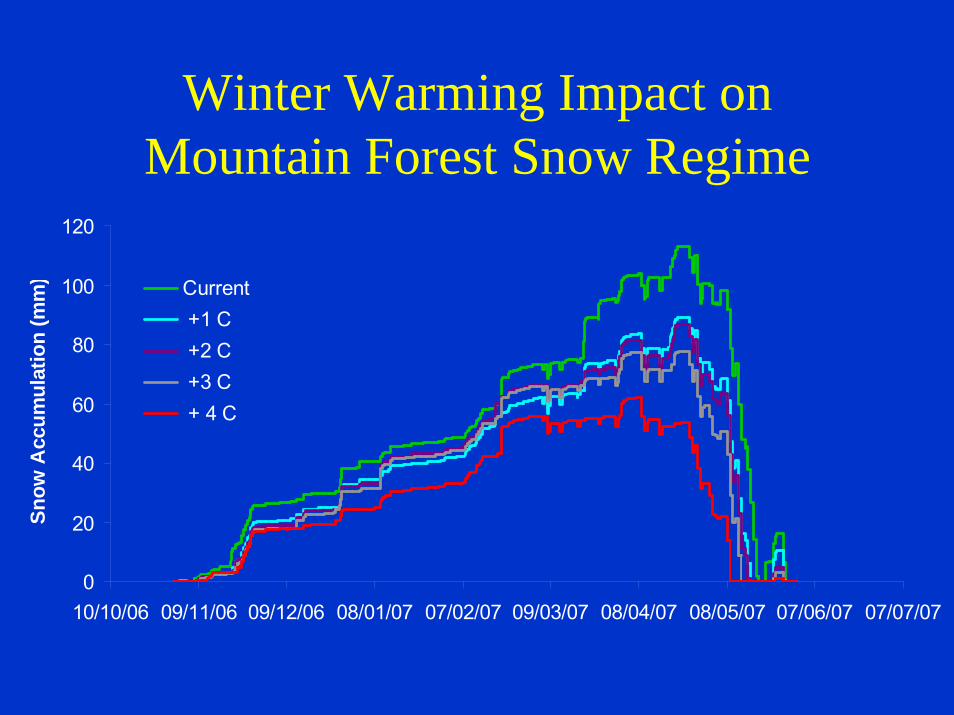
Winter Warming Impact on Mountain Forest Snow Regime
0
20
40
60
80
100
120
10/10/06 09/11/06 09/12/06 08/01/07 07/02/07 09/03/07 08/04/07 08/05/07 07/06/07 07/07/07
Snow
Acc
umul
atio
n (m
m) Current
+1 C +2 C +3 C + 4 C
0
50
100
150
200
250
10/10/06 09/11/06 09/12/06 08/01/07 07/02/07 09/03/07 08/04/07 08/05/07 07/06/07 07/07/07
mm
wat
er e
quiv
alen
t
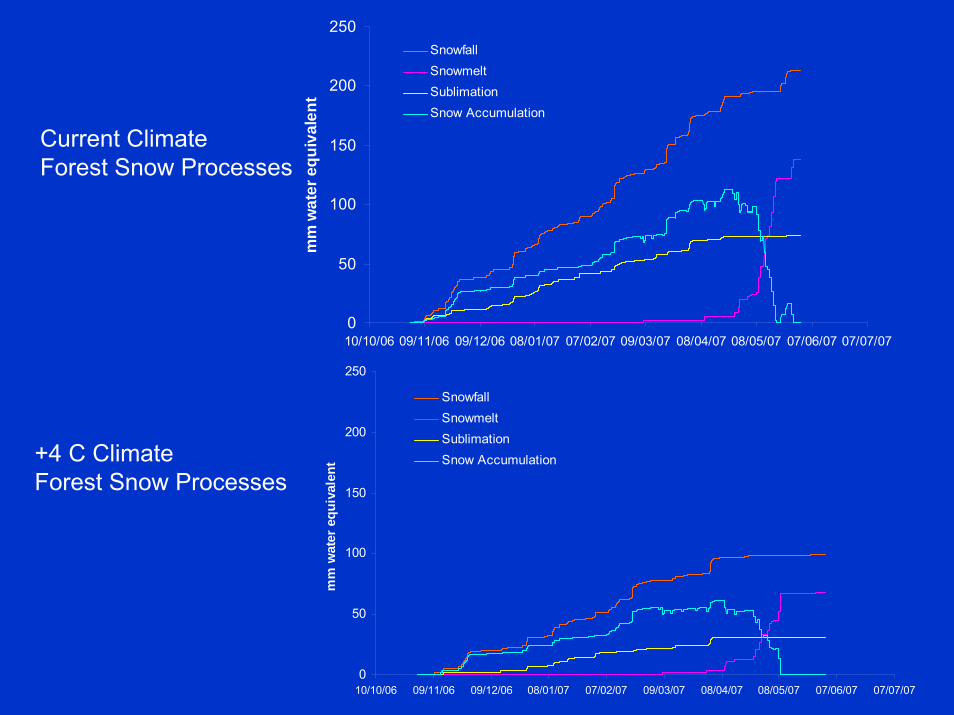
SnowfallSnowmeltSublimationSnow Accumulation
0
50
100
150
200
250
10/10/06 09/11/06 09/12/06 08/01/07 07/02/07 09/03/07 08/04/07 08/05/07 07/06/07 07/07/07
mm
wat
er e
quiv
alen
t
SnowfallSnowmeltSublimationSnow Accumulation
Current ClimateForest Snow Processes
+4 C ClimateForest Snow Processes

Change in Melt with Temperature
0
20
40
60
80
100
120
140
160
10/10/06 09/11/06 09/12/06 08/01/07 07/02/07 09/03/07 08/04/07 08/05/07 07/06/07 07/07/07
Cum
ulat
ive
Snow
mel
t (m
m)
Current +0.5 C +1 C +1.5 C +2 C +2.5 C +3 C +3.5 C + 4 C

Change in Snowfall with Temperature
0
50
100
150
200
250
Current +0.5 C +1 C +1.5 C +2 C +2.5 C +3 C +3.5 C + 4 C
Seas
onal
Sno
wfa
ll (m
m)
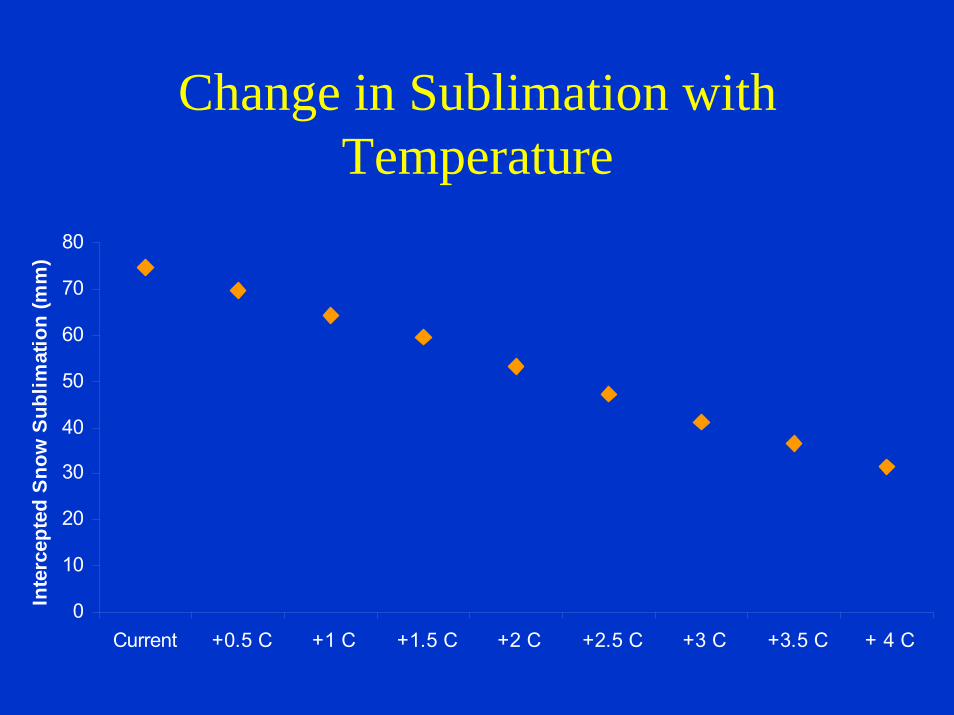
Change in Sublimation with Temperature
0
10
20
30
40
50
60
70
80
Current +0.5 C +1 C +1.5 C +2 C +2.5 C +3 C +3.5 C + 4 C
Inte
rcep
ted
Snow
Sub
limat
ion
(mm
)

Change in Maximum Accumulation with Temperature
0
20
40
60
80
100
120
Current +0.5 C +1 C +1.5 C +2 C +2.5 C +3 C +3.5 C + 4 C
Max
imum
Sno
w A
ccum
ulat
ion
(mm
)
Water Management Implications• These results show that intact mountain forests
have a mitigating effect on some aspects of climate variability and that wind-swept open environments are highly sensitive to climate warming.
• Full consideration of blowing and intercepted snow processes along with energy balance snowmelt calculations must be given for credible climate change impact studies of mountain snow hydrology.

Effects of Forest Cover Change
• Evergreen forest canopy is associated with two primary hydrological effects– Snow and rainfall interception and subsequent
sublimation and evaporation resulting in reduced sub-canopy snowfall or rainfall,
– Alteration of sub-canopy radiation and turbulent transfer affecting the snowmelt rate.
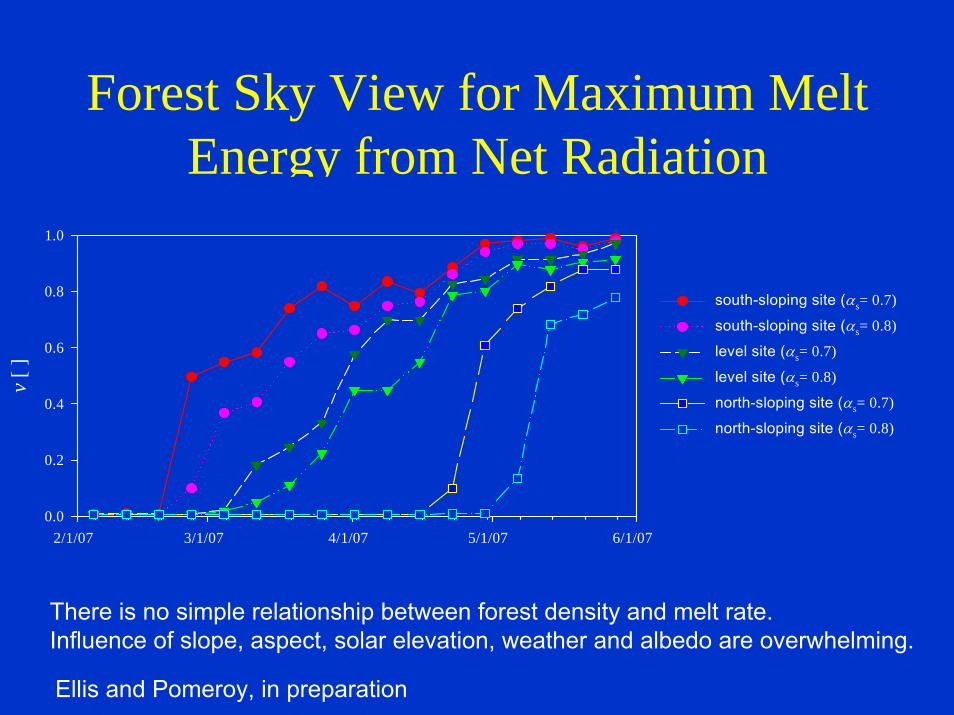
Forest Sky View for Maximum Melt Energy from Net Radiation
2/1/07 3/1/07 4/1/07 5/1/07 6/1/07
v [ ]
0.0
0.2
0.4
0.6
0.8
1.0
south-sloping site (αs= 0.7)
south-sloping site (αs= 0.8)
level site (αs= 0.7)
level site (αs= 0.8)
north-sloping site (αs= 0.7)
north-sloping site (αs= 0.8)
There is no simple relationship between forest density and melt rate.Influence of slope, aspect, solar elevation, weather and albedo are overwhelming.
Ellis and Pomeroy, in preparation

CRHM Forest

Observed and Modelled Forest Energetics – Marmot Creek
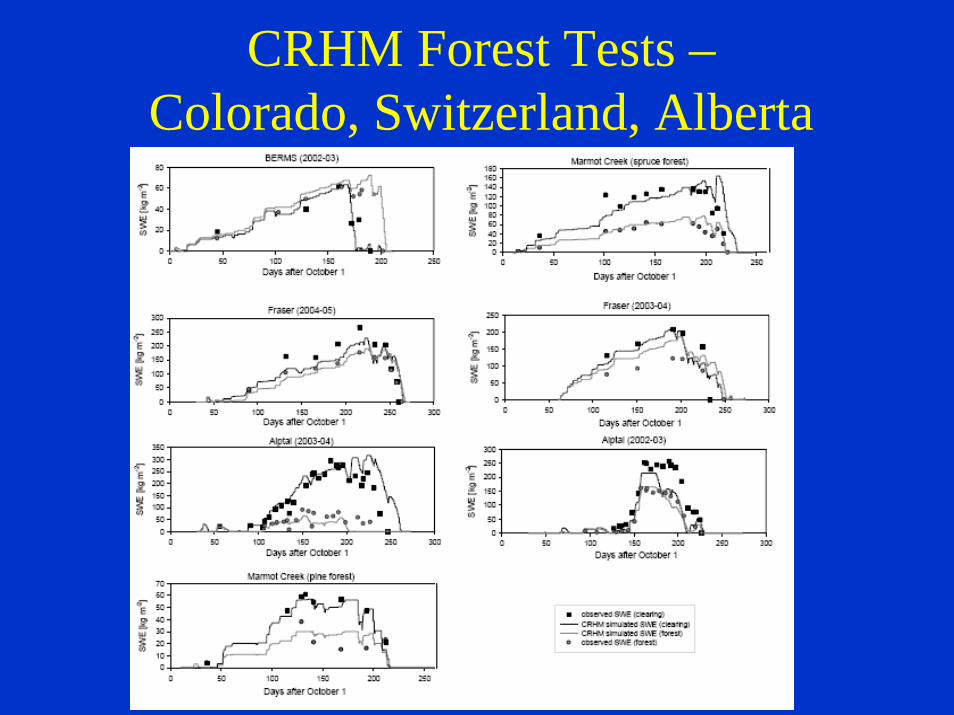
CRHM Forest Tests –Colorado, Switzerland, Alberta
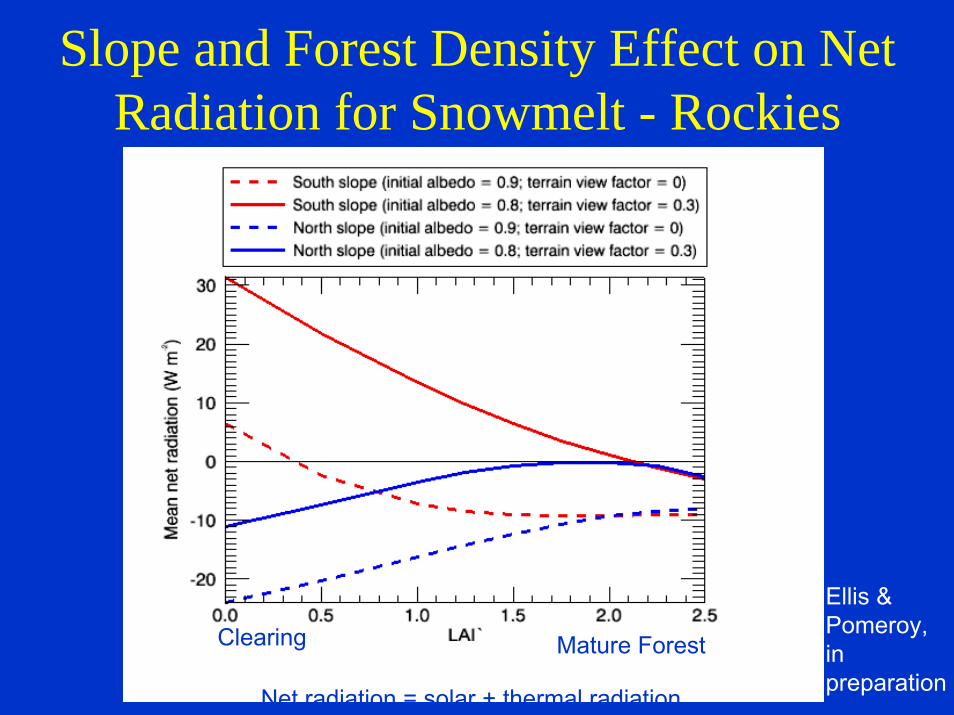
Slope and Forest Density Effect on Net Radiation for Snowmelt - Rockies
Clearing Mature Forest
Net radiation = solar + thermal radiation
Ellis &Pomeroy, in preparation

Water Management Implications
• Forest clearing increases snow accumulation
• Forest clearing accelerates snowmelt rates on south facing slopes and level sites, BUT
• Forest clearing reduces snowmelt rates on north facing slopes

Prairie Runoff GenerationSnow Redistribution to Channels
Spring melt and runoff
Water Storage in Wetlands
Dry non-contributing areas to runoff

PRAIRIE HYDROLOGY – Limited Contributing Areas for Streamflow
Non-contributing areas for streamflowextensive in Canadian Prairies
Localized hydrology affected by poor drainage,storage in small depressions
Modelling Prairie Hydrology• Need a physical basis to calculate the effects of
changing climate, land use, wetland drainage• Need to incorporate key prairie hydrology processes:
snow redistribution, frozen soils, spring runoff, wetland fill and spill, non-contributing areas
• Frustration that hydrological models developed elsewhere do not have these features and fail in this environment
• Streamflow calibration does not provide information on basin non-contributing areas and is not suitable for change analysis

Smith Creek Hydrology Study• Problem: Inability to reliably model the basins of the
Upper Assiniboine River and other prairie basins where variable contributing area, wetlands, nonsaturatedevapotranspiration, frozen soils, snow redistribution and snowmelt play a major role in hydrology.
• Objectives– Develop a Prairie Hydrological Model computer program that
can simulate the response of streams, wetlands, and soil moisture to weather inputs for various basin types.
– Evaluate the model performance in Smith Creek by comparing to observations of streamflow, wetland extent, and snowpack.
– Use the Prairie Hydrological Model to estimate the sensitivity of streamflow, wetland water storage, and soil moisture to changes in drainage and land use.

Smith Creek – extreme interannual and seasonal variability
0
5
10
15
20
25
01-Jan
31-Jan
02-Mar
01-Apr
01-May
31-May
30-Jun
30-Jul
29-Aug
28-Sep
28-Oct
27-Nov
27-Dec
Stre
amflo
w m
3 pe
r se
cond
Average 1975-20061995 High Year2000 Low Year
Smith Creek, Saskatchewan, ~400 km2 basin area

Streamflow over Time
Smith Creek Annual Streamflow
0
5000000
10000000
15000000
20000000
25000000
3000000019
75
1977
1979
1981
1983
1985
1987
1989
1991
1993
1995
1997
1999
2001
2003
2005
Ann
ual S
tream
flow
(m3 )
Top 4 years for streamflow since 1995

Peak Flow over Time
Maximum Daily Discharge of Smith Creek during 1975-2006
0
5
10
15
20
25
1975
1977
1979
1981
1983
1985
1987
1989
1991
1993
1995
1997
1999
2001
2003
2005
Max
imum
Dai
ly D
isch
arge
(m3 /s
) Top 6 peak daily flows since 1995

Changing Climate?Mean Annual Air Temperature at Yorkton
y = 0.0239x + 1.4259R2 = 0.0404
-1
0
1
2
3
4
519
75
1977
1979
1981
1983
1985
1987
1989
1991
1993
1995
1997
1999
2001
2003
2005
Mea
n A
nnua
l Tem
pera
ture
(°C
)
An n u a l R a in fa ll an d S n o w fa ll a t Yo rk to n
0
100
200
300
400
500
600
1975
1977
1979
1981
1983
1985
1987
1989
1991
1993
1995
1997
1999
2001
2003
2005
Ra inf a ll (mm)
Snow f a ll (mm)
Warming but high variability
No trend in rainfall and snowfall
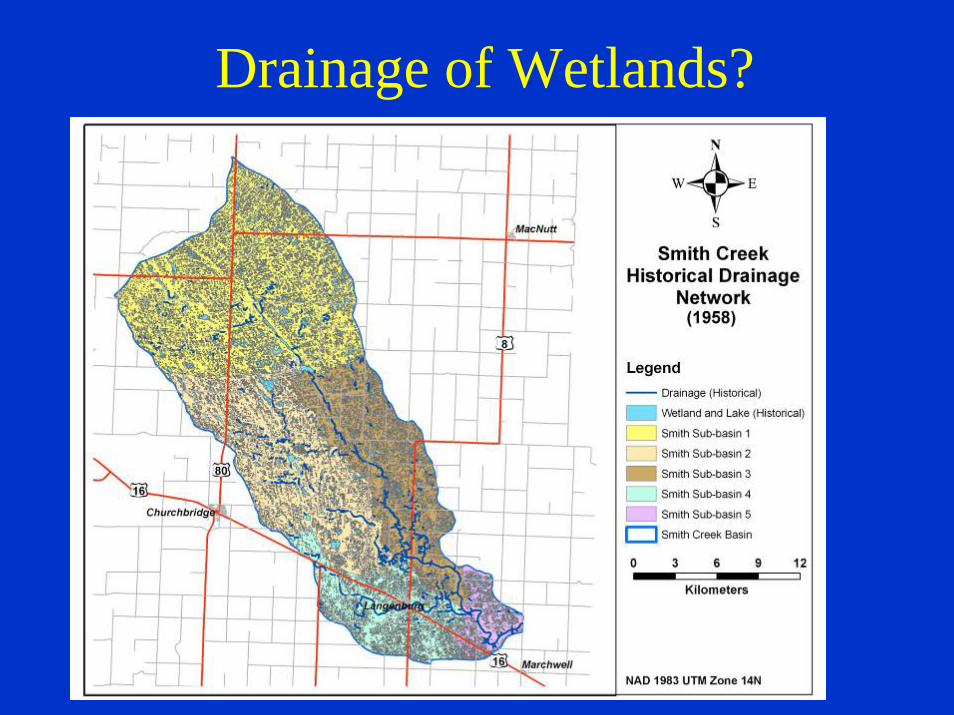
Drainage of Wetlands?

Drainage of Wetlands?
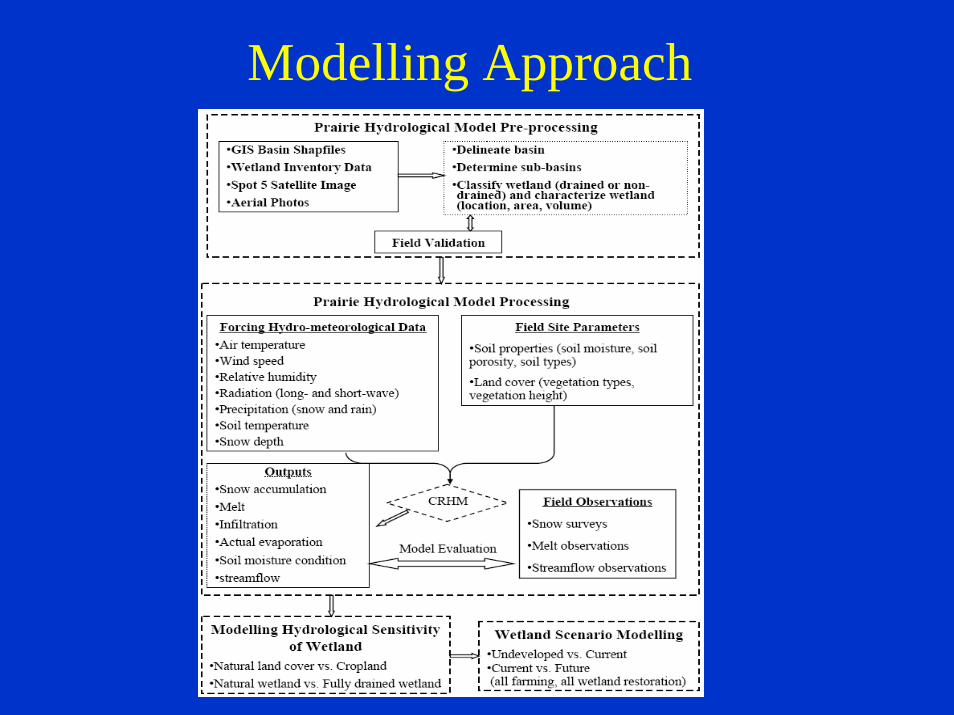
Modelling Approach

CRHM – Prairie Hydrological Model Configuration
Flow Chart in Cold Regions Hydrological Model Platform
(CRHM)
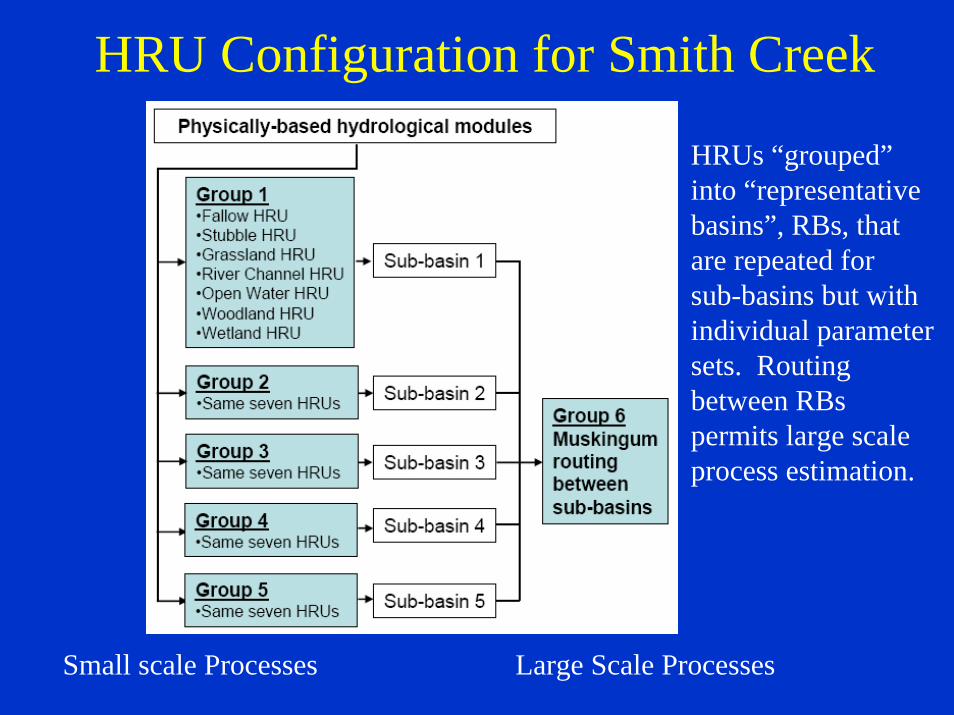
HRU Configuration for Smith Creek
Small scale Processes Large Scale Processes
HRUs “grouped”into “representativebasins”, RBs, that are repeated forsub-basins but withindividual parametersets. Routingbetween RBspermits large scaleprocess estimation.
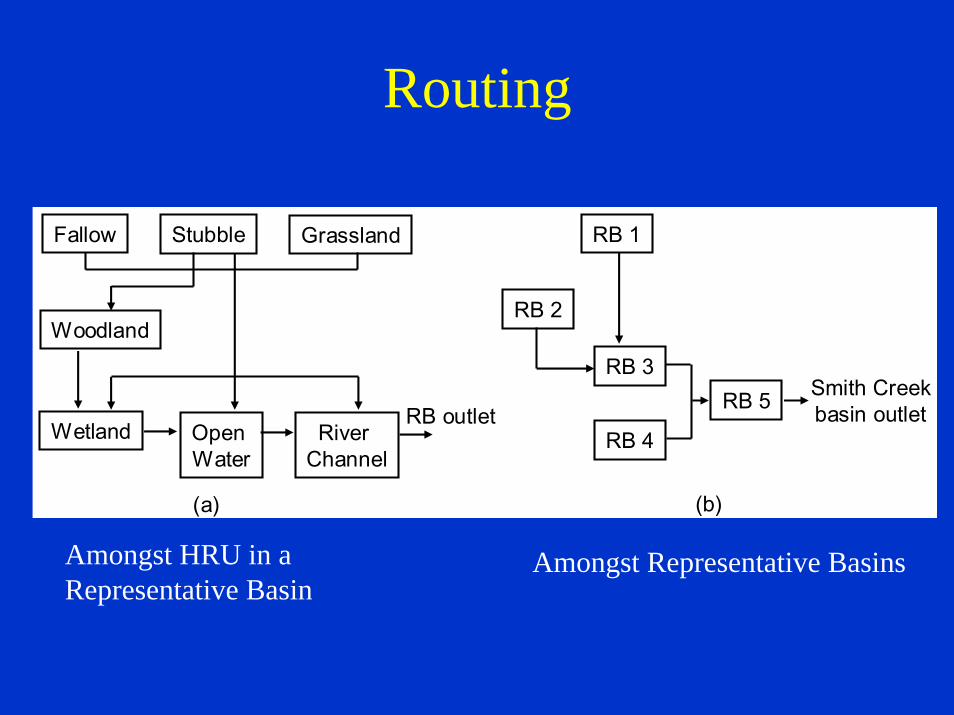
Routing
Fallow
River Channel
Open Water
Stubble Grassland
Woodland
WetlandRB outlet
RB 1
RB 2
RB 4
RB 3RB 5 Smith Creek
basin outlet
(a) (b)
Amongst HRU in a Representative Basin
Amongst Representative Basins
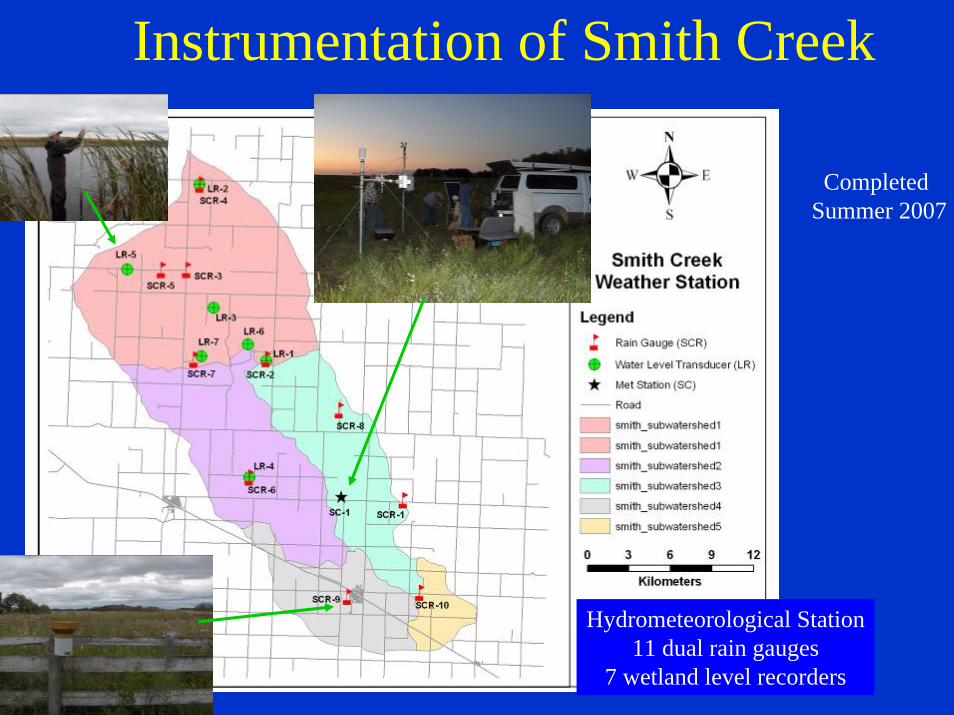
Instrumentation of Smith Creek
Hydrometeorological Station11 dual rain gauges
7 wetland level recorders
Completed Summer 2007
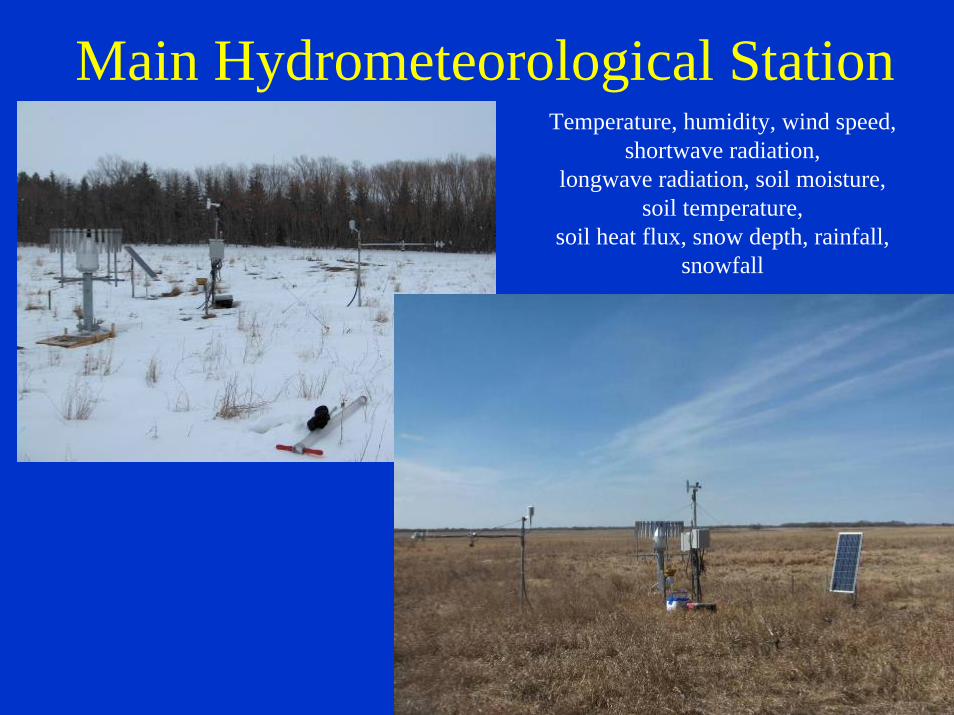
Main Hydrometeorological StationTemperature, humidity, wind speed,
shortwave radiation, longwave radiation, soil moisture,
soil temperature,soil heat flux, snow depth, rainfall,
snowfall

Snow and Wetland Surveys

Smith Creek Basin CharacteristicsDrainage Network Spot Image

SCR-9
SCR-8LR-5
LT-2/SCR-4
SCR-9
SCR-8LR-5
LT-2/SCR-4
SCR-9SCR-9
SCR-8SCR-8LR-5LR-5
LT-2/SCR-4LT-2/SCR-4
Remote Sensing Supervised Classification
SPOT5Field tests ofvegetationclassification
vegetationused to defineHRU area,HRU location &vegetationparameters

LiDAR-Derived DEM Drainage Network
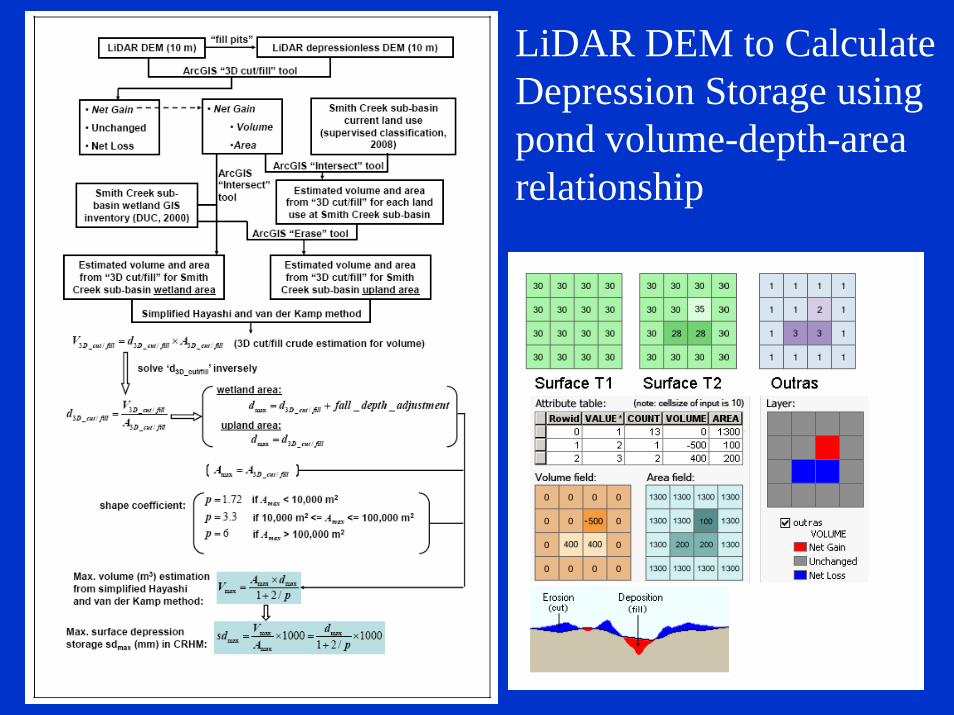
LiDAR DEM to Calculate Depression Storage using pond volume-depth-area relationship

Derivation of Wetland Depressions

CRHM Tests Smith Creek – No CalibrationObserved SWE vs Simulated SWE at Smith Creek Sub-basin 1
0
50
100
150
200
250
300
7-Feb 18-Feb 29-Feb 11-Mar 22-Mar 2-Apr 13-Apr
2008
Snow
Acc
umul
atio
n (m
m S
WE)
Fallow Obs. SWE Fallow Sim. SWEChannel Obs. SWE Channel Sim. SWEWetland Obs. SWE Wetland Sim. SWE
Volumetric Soil M oisture at Smith Creek during Spring Snowmelt Period
0
0.1
0.2
0.3
0.4
0.5
22-Mar 31-Mar 9-Apr 18-Apr 27-Apr 6-May
2008
Volu
met
ric S
oil
Moi
stur
e
ObservedSimulated
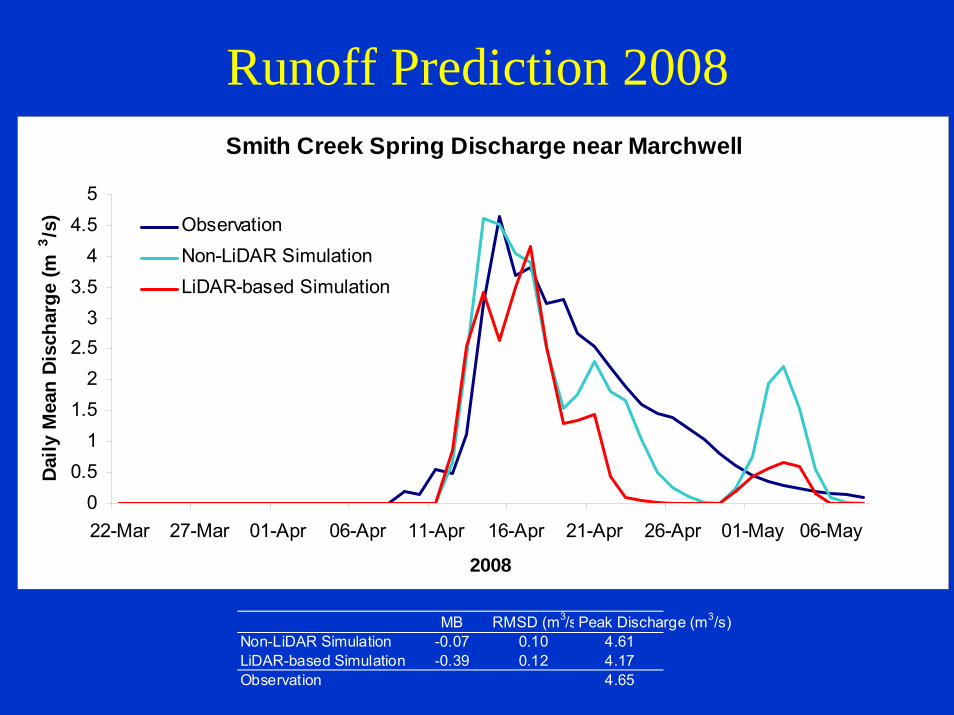
Runoff Prediction 2008
MB RMSD (m3/sPeak Discharge (m3/s)Non-LiDAR Simulation -0.07 0.10 4.61LiDAR-based Simulation -0.39 0.12 4.17Observation 4.65
Smith Creek Spring Discharge near Marchwell
00.5
11.5
22.5
33.5
44.5
5
22-Mar 27-Mar 01-Apr 06-Apr 11-Apr 16-Apr 21-Apr 26-Apr 01-May 06-May
2008
Dai
ly M
ean
Dis
char
ge (m
3 /s) Observation
Non-LiDAR SimulationLiDAR-based Simulation

Runoff Prediction 2009
MB RMSD (m3/Peak Discharge (m3/s)Non-LiDAR Simulation -0.21 0.28 7.83LiDAR-based Simulation -0.57 0.31 5.37Observation 6.22
Smith Creek Spring Discharge near Marchwell
0
1
2
3
4
5
6
7
8
9
23-Mar 28-Mar 02-Apr 07-Apr 12-Apr 17-Apr 22-Apr 27-Apr 02-May 07-May
2009
Daily
Mea
n Di
scha
rge
(m3 /s
) ObservationNon-LiDAR SimulationLiDAR-based Simulation

Sensitivity Analysis: Change in Spring Discharge
0.00
5.00
10.00
15.00
20.0025.00
30.00
35.00
40.00
45.00
1993
-94
1994
-95
1995
-96
1996
-97
1997
-98
1998
-99
1999
-200
0
2000
-01
2001
-02
2002
-03
2003
-04
2004
-05
Spri
ng D
isch
arge
(100
0 da
m3)
"normal condition"complete forest coverprimarily agricultural land usehigh wetland extentminimal wetland extent

Sensitivity of Spring Discharge Volume to Land use and Drainage
-10
-8
-6
-4
-2
0
2
4
6
0 5 10 15 20 25 30 35 40
Spring Discharge Volume (1000 dam3)
Cha
nge
in d
isch
arge
vol
ume
(100
0 da
m3)
Agricultural Conversion
Forest Conversion
Wetland Restoration
Wetland Drainage

Long-term Impact of Land Use and Drainage Change
-40-30-20-10
010203040506070
ForestConversion
AgriculturalConversion
WetlandRestoration
Wetland Drainage% C
hang
e in
Dis
char
ge V
olum
e

Wetland Change in Low Discharge Volume Year
Scenarios of Smith Creek Spring Discharge near Marchwell
0
0.2
0.4
0.6
0.8
1
1.2
1.4
1.6
11-Feb 20-Feb 29-Feb 09-Mar 18-Mar 27-Mar 05-Apr 14-Apr 23-Apr 02-May
2000
Daily
Mea
n Di
scha
rge
(m3 /s
)
"Normal Condition"high natural wetland extentminimum wetland extent
2000 Drought: Lowest Discharge Volume on Record
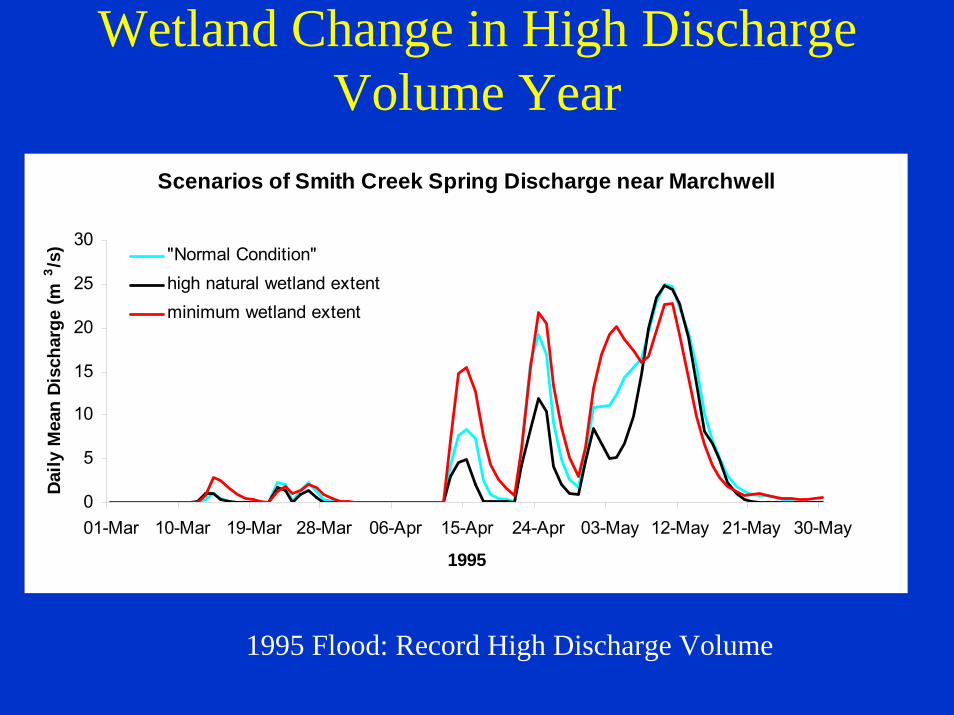
Wetland Change in High Discharge Volume Year
Scenarios of Smith Creek Spring Discharge near Marchwell
0
5
10
15
20
25
30
01-Mar 10-Mar 19-Mar 28-Mar 06-Apr 15-Apr 24-Apr 03-May 12-May 21-May 30-May
1995
Daily
Mea
n Di
scha
rge
(m3 /s
) "Normal Condition"high natural wetland extentminimum wetland extent
1995 Flood: Record High Discharge Volume
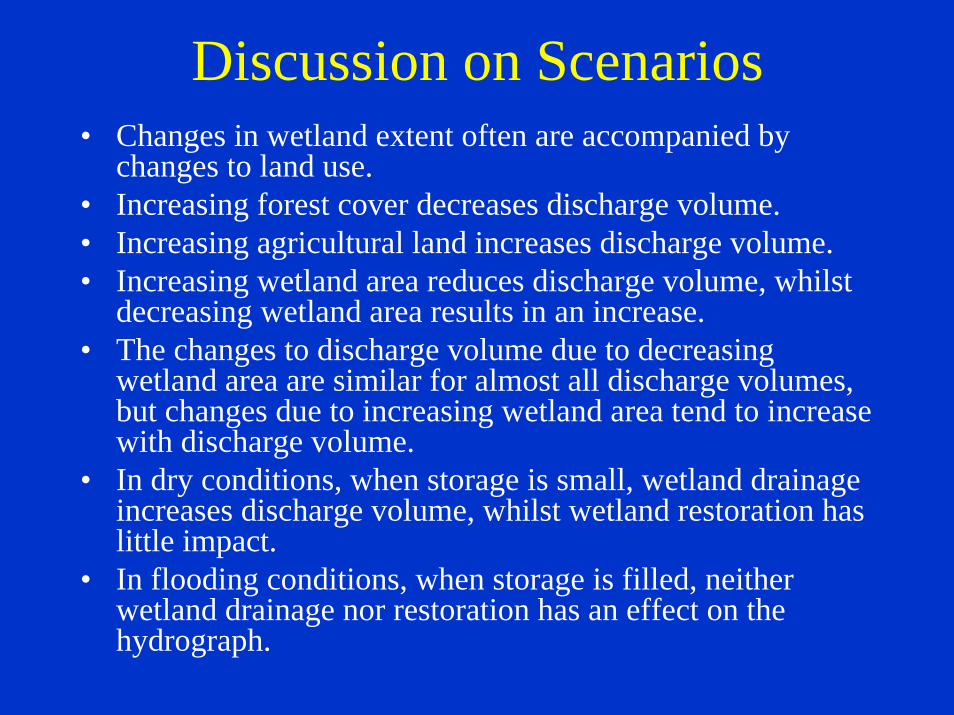
Discussion on Scenarios• Changes in wetland extent often are accompanied by
changes to land use.• Increasing forest cover decreases discharge volume.• Increasing agricultural land increases discharge volume.• Increasing wetland area reduces discharge volume, whilst
decreasing wetland area results in an increase. • The changes to discharge volume due to decreasing
wetland area are similar for almost all discharge volumes, but changes due to increasing wetland area tend to increase with discharge volume.
• In dry conditions, when storage is small, wetland drainage increases discharge volume, whilst wetland restoration has little impact.
• In flooding conditions, when storage is filled, neither wetland drainage nor restoration has an effect on the hydrograph.

Conclusions• Consideration of snow, frozen soil and surface storage
processes are essential to calculating spring runoff in the Prairies.
• Depressional storage is exceedingly difficult to calculate in this flat, poorly drained environment – LiDAR permits estimation of depressional and wetland storage volumes.
• It is possible to model prairie snowpack, soil moisture and streamflow without calibration using physically based simulations that aggregate landscape scale hydrological cycle calculations, if high resolution information is available on catchment characteristics.
• There is moderate sensitivity of streamflow volumes to changes in agricultural and forest land use.
• There is strong sensitivity of streamflow volumes to wetland drainage and restoration.