water level forecasts and squats calculation for the traverse du
TRANSCRIPT
Captain Simon Mercier
Water Level Forecasts and Squats Calculation for the
Traverse du Nord

Introduction


The 5 ingredients

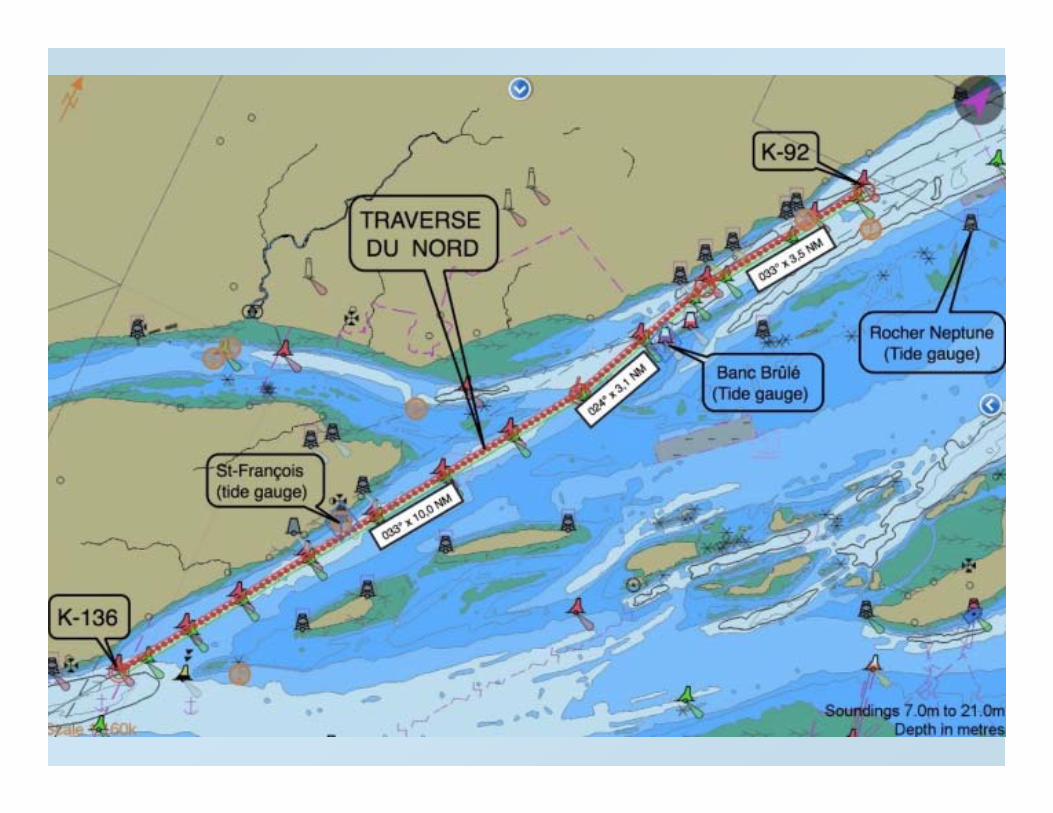
• The Traverse du Nord

The
5 in
gred
ient
sTh
e Tr
aver
se d
u No
rd

16.6 miles long, 305 meters wideMaintained depth of 12.5 metersAverage tide at Saint‐François is 5.5 meters The average tide 30 centimeters less only five miles away, at the western limit of the TraverseNot considered a confined canal as the horizontal limits outside the dredged channel do not impede water flow. It is considered restricted because of the water depth available
The
5 in
gred
ient
sTh
e Tr
aver
se d
u No
rd
• The Traverse du Nord • The Ships

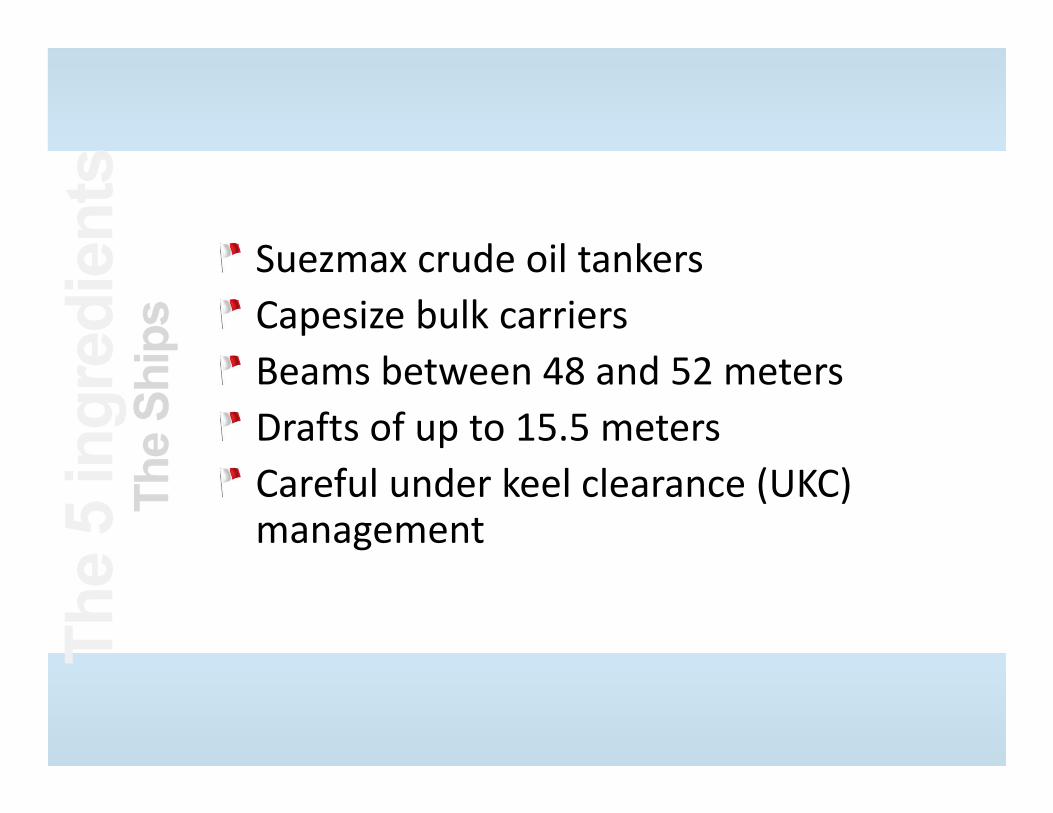
Suezmax crude oil tankersCapesize bulk carriers Beams between 48 and 52 metersDrafts of up to 15.5 metersCareful under keel clearance (UKC) management
The
5 in
gred
ient
sTh
eSh
ips

• The Traverse du Nord• The Ships• The Squat Model

The
5 in
gred
ient
sTh
e Sq
uat M
odel
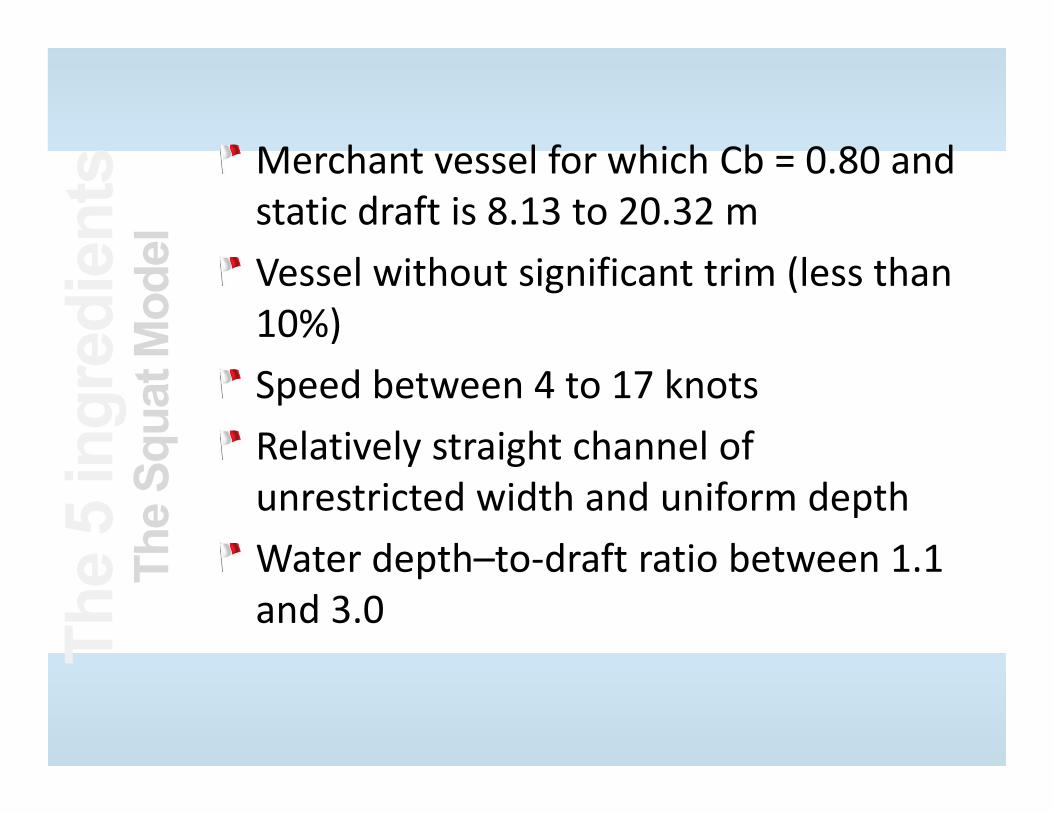
Merchant vessel for which Cb = 0.80 and static draft is 8.13 to 20.32 mVessel without significant trim (less than 10%)Speed between 4 to 17 knotsRelatively straight channel of unrestricted width and uniform depthWater depth–to‐draft ratio between 1.1 and 3.0Th
e 5
ingr
edie
nts
The
Squa
t Mod
el

Vessel Beam Not Exceeding (m)
Vessel Speed Not Exceeding (knots)
7 8 9 10 11 12 13 14
Required Under‐Keel Clearance (m)
31 0.86 0.95 1.06 1.17 1.38 1.60 1.84 2.09
34 0.87 0.97 1.08 1.20 1.41 1.64 1.89 2.15
37 0.89 0.98 1.10 1.22 1.44 1.68 1.93 2.20
40 0.90 1.00 1.11 1.25 1.47 1.72 1.97 2.25
43 0.91 1.01 1.13 1.27 1.50 1.75 2.01 2.29
46 0.92 1.03 1.15 1.29 1.53 1.78 2.05 2.34
49 0.93 1.04 1.17 1.32 1.56 1.81 2.09 2.38
52 0.94 1.05 1.18 1.34 1.58 1.85 2.13 2.42
Estimated Squat (m)
31 0.25 0.34 0.45 0.56 0.70 0.84 1.00 1.18
34 0.27 0.36 0.47 0.59 0.73 0.88 1.05 1.23
37 0.28 0.37 0.49 0.62 0.76 0.92 1.09 1.28
40 0.29 0.39 0.51 0.64 0.79 0.95 1.14 1.33
43 0.30 0.40 0.52 0.66 0.82 0.99 1.18 1.38
46 0.31 0.42 0.54 0.68 0.84 1.02 1.21 1.42
49 0.32 0.43 0.56 0.71 0.87 1.05 1.25 1.47
52 0.33 0.44 0.57 0.73 0.90 1.08 1.29 1.51
Safety/Manoeuvrability Margin (m)
0.61 0.61 0.61 0.61 0.69 0.76 0.84 0.91
The
5 in
gred
ient
sTh
e Sq
uat M
odel

The
5 in
gred
ient
sTh
e Sq
uat M
odel

Vessel TypeCoefficient of
Determination (‐)
Bias E (m) Relative Bias ER (%)
Mean Standard Deviation Mean Standard Deviation
All 0.60 0.15 0.17 28 33
Container Ships 0.62 0.25 0.15 47 30
Bulk Carriers 0.78 0.07 0.12 13 26
Tankers 0.68 0.04 0.14 10 24

• The Traverse du Nord• The Ships• The Squat Model
• The Hydrodynamic Model

From Montreal to Saint‐Joseph‐de‐la‐RiveForecasted flows at Montreal from Lake Ontario outflow, the Ottawa River, etc.Atmospheric forcing added to the tidal forecast at the downstream boundaryFrom unidirectional flow regime at Montreal to an almost symmetrical tidal cycle up to Saint‐Joseph‐de‐la‐Rive
The
5 in
gred
ient
sTh
e Hy
drod
ynam
ic M
odel

Hourly forecasted wind intensity;Added values (positive of negative) at Saint‐Joseph‐de‐la‐Rive for the next 48 hours;Model forecasts assimilated to the last observation (every 3 minutes) on a 15‐minute schedule;Forecasted values of the water levels available at every 3 kilometers of the navigational channel.Th
e 5
ingr
edie
nts
The
Hydr
odyn
amic
Mod
el

• The Traverse du Nord• The Ships• The Squat Model• The Hydrodynamic Model
• The Communication Protocol

The
5 in
gred
ient
sTh
e Co
mm
unic
atio
n Pr
otoc
ol

Tide gauges sending their data through UHF or a cellular modem every 3 minutes20‐second delay to implement validationUHF data converted in IP data packetsTo Quebec server, then retransmitted via CHS intranet servers in Ottawa and Sidney, BC.SOAP Web services used as bridges to access predictions, observations from the tide gauges, and forecast from SPINE.Th
e 5
ingr
edie
nts
The
Com
mun
icat
ion
Prot
ocol

Prediction, Observation and SPINE) accessible on the WDS via InternetThose services are called by the pilot’s Internet application Web site server. Tide Windows Module is a Web‐based application and not a native application.
The
5 in
gred
ient
sTh
e Co
mm
unic
atio
n Pr
otoc
ol

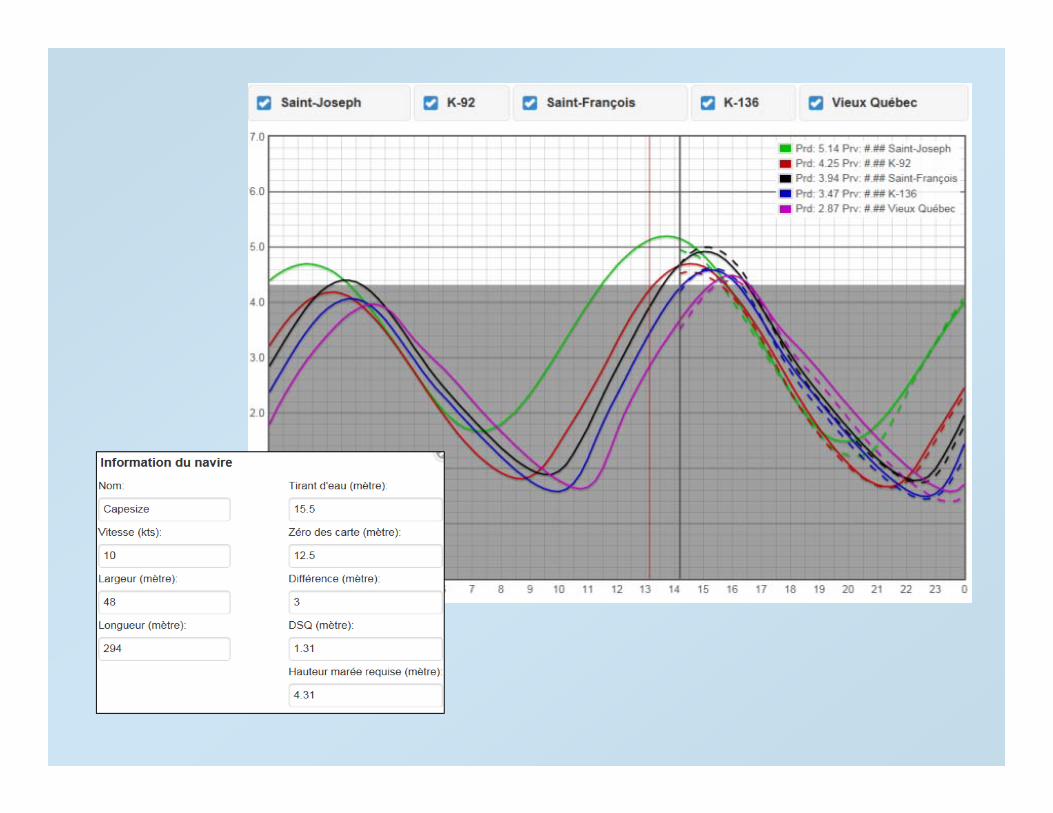
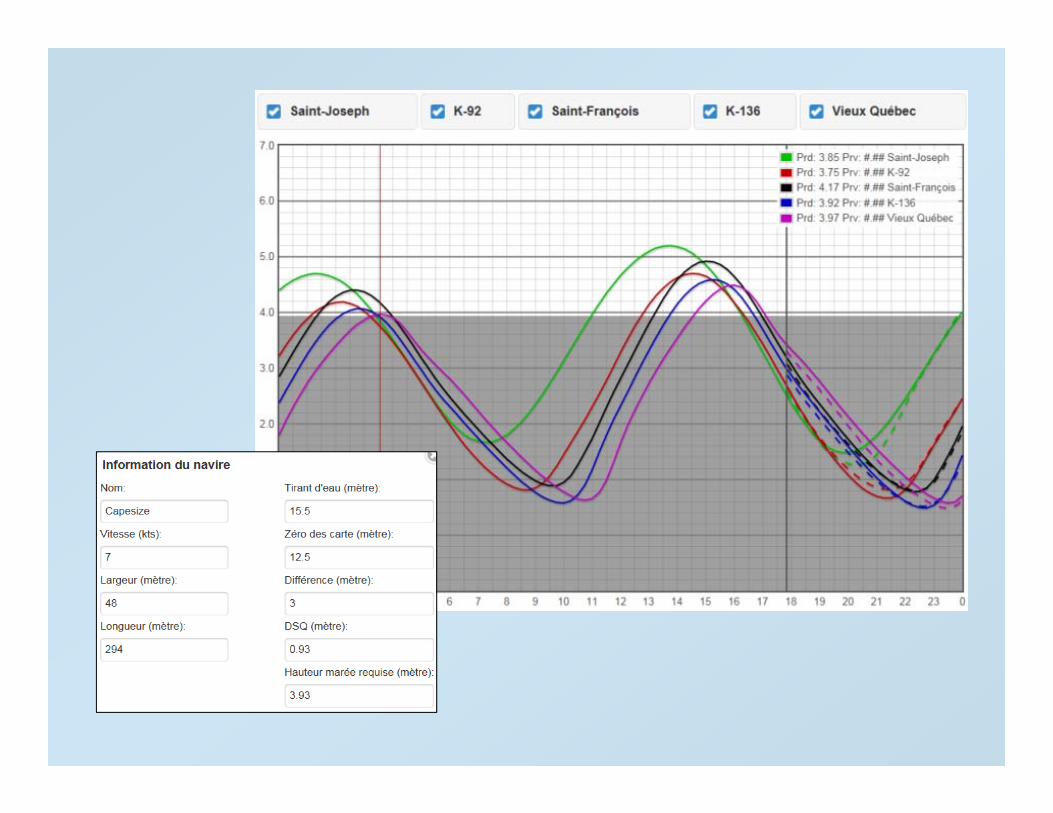
Tide Windows Module


Ship’s information dialogue boxShip’s beam, draft and speedChannel’s depthRequired water level to proceed in the Traverse at the expected transit speed computed, using the squat and UKC table
Tide
Win
dow
s M
odul
eUs
ing
the
Tide
Win
dow
s M
odul
e

Conclusions

Developed with the Canadian Coast Guard e‐Navigation Strategy in mindHigh‐quality government dataCustomized by professional third partiesFor the specific needs of an end userUser‐friendly tool to plan, manage and monitor the water levels and the under‐keel clearance necessary for the safe and efficient transit through the Traverse du Nord.

Five basic ingredients?A sixth one: the peoplePeople from various organisations, with multiple backgrounds, among which navigation, oceanography, software design and communication technologies, brought together their expertise and knowledge to make this project a success.

Bernard Cayer, pilot CPBSLAlain D’Astous, research scientist at Fisheries and Oceans CanadaDenis Lefaivre, research scientist at Fisheries and Oceans CanadaGermain Sauvé, Software Analyst at Innovation maritimeSpecial thanks to Samir Gharbi, Waterways acting Manager Canadian Coast Guard Programs Central and Arctic Region