water for food security - fwrreview of current knowledge 5 1. introduction water and food are...
TRANSCRIPT
A Review of Current Knowledge
WATER FOR FOOD SECURITY
FR/R00017 November 2013
© Foundation for Water Research
Price: £15.00 (20% discount to FWR Members)
Foundation for Water Research Allen House, The Listons, Liston Road, Marlow, Bucks SL7 1FD, U.K. Tele: +44(0)1628 891589 Fax: +44(0)1628 472711 E-mail: [email protected] Home page: www.fwr.org

Review of Current Knowledge
© Foundation for Water Research 2013
Copyright
Apart from any fair dealing for the purposes of research or private study, or criticism or review, as permitted under the UK Copyright, Designs and Patents Act (1998), no part of this publication may be reproduced, stored or transmitted in any form or by any means, without the prior permission in writing of FWR.
Disclaimer
Whilst every effort has been made to ensure accuracy FWR will not accept responsibility for any loss or damage suffered by any person acting or refraining from acting upon any material contained in this publication. Appropriate professional advice should be sought when making important decisions to ensure the information is correct, up-to-date and applicable to specific circumstances.
This review is one of a series of Reviews Of Current Knowledge (ROCKs) produced by FWR. They focus on topics related to water supply, wastewaterdisposal and water environments, which may be the subject of debate andinquiry. The objective of each review is to produce concise, independentscientific and technical information on the subject to facilitate a widerunderstanding of the issues involved and to promote informed opinion aboutthem.

Review of Current Knowledge
1
WATER FOR FOOD SECURITY
© Shutterstock
Authors: Sandra Ryan & Chris Fawcett
AMEC Environment & Infrastructure UK Limited

Review of Current Knowledge
2
CONTENTS
1 INTRODUCTION 5
2 THE RELATIONSHIP BETWEEN AGRICULTURE AND WATER 8
3 WATER AND FOOD PRODUCTION: A UK PERSPECTIVE 15
3.1 Agricultural Activity in the UK 15
3.2 Agricultural Water Demand 16
3.3 Water Needs Vary for Different Foods 18
3.4 Rainfed versus Irrigation in the UK 23
3.5 Water and Food Manufacturing in the UK 24
3.6 Impact of Climate Change on UK Agriculture 25
3.7 Impact of Agriculture on UK Water Resources 27
4 WATER AND FOOD PRODUCTION: GLOBALISATION OF FOOD 29
4.1. Impact of Agriculture on Water Resources around the World 34
5 WATER SECURITY 36
5.1 Water Risks 36
5.2 Water Security Strategies 39
6 REFERENCES 45

Review of Current Knowledge
3
TABLES
Table 3.1 Volumes of Water used by Agricultural Activity 17 Table 3.2 Volumes of Water used for Drinking Water and Washing down on Livestock Farms 20 Table 3.3 Typical Rates for Water Use for Various Industries 25
FIGURES
Figure 2.1 The agri-water Cycle 9 Figure 2.2 Sources of Water used by Agriculture 10 Figure 3.1 Land-use for Agriculture in the UK 16 Figure 3.2 Water Intensity of Different Foods 19 Figure 3.3 Crops Irrigated as a Percentage of the Total 23 Figure 4.1 UK Water Resources Used to Support Food Consumed in the UK 30 Figure 4.2 The UK’s External Water Footprint 32 Figure 4.3 UK Agricultural Water Footprint and Water Stressed Food Production Locations 33 Figure 5.1 Inter-relationships between Water Risks 38

Review of Current Knowledge
4

Review of Current Knowledge
5
1. Introduction
Water and food are inextricably linked as significant quantities of water are required to produce our food. Water is fundamental to agricultural production: crops require water to grow; livestock require water for drinking and hygiene; and farms need water for operations and processing. Inland fisheries and aquaculture cannot exist without freshwater. The water consumed in food production is either sourced directly from precipitation or from soil moisture (green water), or withdrawn from aquifers, streams and lakes (blue water). Agriculture and food production are not necessarily the same thing. Large areas of the world are devoted to agriculture, growing crops such as cotton, or crops which are used to produce fuel or other non-edible products (bio-diesel, palm oil). As demand for food to feed the ever growing world population increases so does the emerging conflict between crops for food and crops for other purposes. This ROCK introduces and explains some of the main aspects of the water and food relationship.
Population and Food
Since the 1950s the world’s population has more than doubled and in 2013 the world population reached 7 billion. In response, food output also doubled but the amount of land given over to cultivation increased by just 13 percent. This was made possible with more intensive farming and doubling the amount of land that is irrigated. This response is commonly referred to as the “Green Revolution”. New technologies, new high-yielding crop varieties, and the widespread use of inorganic fertilisers and irrigation, backed by powerful state-driven strategies to increase food gains transformed the agricultural sector (Lundqvist et al., 2008) and in particular was the catalyst for many Asian countries to transform from agrarian to industrialising economies (FAO, 2011a). Around the world, 1.5 billion hectares of land are dedicated to cultivated agriculture (12 percent of the total land area). That is about the same as 1.5 billion international rugby pitches all being used for cultivated farming. More than twice this amount of land is managed pastureland for livestock (FAO, 2011b). Providing food and water for 7 billion people is already an incredibly difficult challenge and it is expected that the world population will reach 9 billion by 2050, another 2 billion people needing food. Almost all of that growth will be in the developing world and as standards of living rise, and the trend towards people

Review of Current Knowledge
6
living in urban areas increases, food requirements in the developing world could double (FAO, 2011a). In particular, demand for meat is expected to rise significantly. The United Nations Food and Agricultural Organisation (FAO) estimates up to 70 percent more food will be needed: an extra 200 million tonnes of livestock products and one billion tonnes of cereals will be needed every year (much of the extra cereals will be used as animal feed). Already, about 40 percent of all cereals grown are used to feed animals to produce milk, cheese and meat (Lundqvist et al., 2008)
Food and Water
Globally, agriculture is by far the biggest user of water. Around 70 percent of all water abstracted is used to irrigate crops, in addition to rainfed agriculture. Some of these crops directly support food supplies, others are used as animal feeds to support livestock products, whilst the rest are non-food based, for example cotton, or crops used to produce bio-fuels, or other industrial ingredients (e.g. palm oil). The demand for extra food is going to place a considerable extra stress on the world’s freshwater resources. Water in sufficient quantity and of adequate quality will have to be secured but there is very little scope to further increase the amount of cropland and there are no ‘new’ sources of water (SIWI, 2012) and so maximising the amount of ‘crop per drop’ of water will be essential (Chapter 5 has more information on strategies that could achieve this). The irony is that this growth in demand will largely be in the areas where water is often at its most scarce.
Box 1 Water Scarcity
Every continent contains areas where water is scarce;
If the amount of renewable water in a country is below 1,700 m3 per person per year, that country is said to be experiencing water stress; below 1,000 m3 it is said to be experiencing water scarcity; and where each person has access to less than 500 m3 of renewable water they are experiencing absolute water scarcity (Falkenmark et al., 1989);
40 percent of the world’s population (one in three people on every continent) are affected by water scarcity (WHO, online) and this could rise to over 60 percent by 2025;
1.6 billion people are already living in regions with absolute water scarcity and this could rise to 1.8 billion people by 2025; and
Over consumption of water for food production is the main factor behind water scarcity.

Review of Current Knowledge
7
Food waste is another important aspect in the relationship between demand for food and demand for water. Roughly 30 percent of the food produced world-wide (about 1.3 billion tonnes) is lost or wasted every year at every stage from the ‘field to fork’ (FAO, 2012). Food is lost due to poor storage and transport, but it is also wasted, particularly in developed countries, due to shopping and kitchen habits. It is estimated that a 50 percent reduction in food waste at the global level would save around 1350km3(1.3 billion litres) of water per year.
Box 2 Water Measurement Units
1 hectare (ha) - 10,000m2 (about the same size as an international rugby pitch);
1m3 – cubic metre (1000 litres);
1Km3 – cubic kilometre: 1000m3; 1,000,000 litres (also known as a Megalitre - Ml);
1Mm3 - million cubic metres (1,000,000,000 litres);
1 Gm3 – cubic gigametre: thousand million cubic metres; a billion cubic metres (1,000,000,000,000 litres);
The volume of Lake Windermere (north basin)1 is about 21,500m3 (21.5 million litres); and
Lake Victoria holds approximately 2,760.00 km3 2,760,000,000 litres (2.7 billion litres).
1http://www.windermerlakes.co.uk/default.asp?textpage=Windermere_South_Basin_and_Windermere_North_Basin

Review of Current Knowledge
8
2. The Relationship between Agriculture and Water
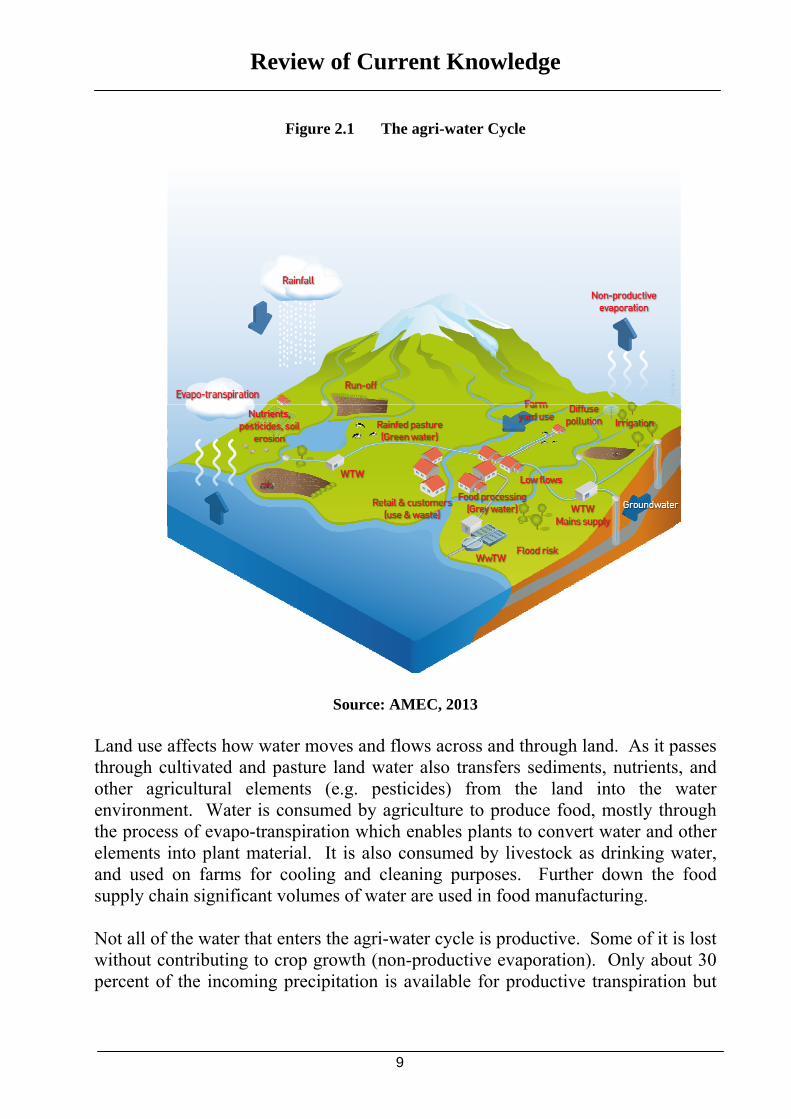
The relationship between food and water is an ancient one. Water has been used for agricultural purposes for several millennia (Strosser et al., 1999) but the relationship is changing due to pressure to produce more food with less water. Water for food is now a core environmental issue. Significant proportions of the world’s land area are devoted to agriculture, making agricultural practices fundamental to environmental management, including how water is used and managed. Figure 2.1 illustrates the main elements of the agriculture-water (‘agri-water’) cycle. Water inputs include: rainfall, direct abstractions from surface and groundwaters (e.g. rivers, lakes, and aquifers), and municipal mains water supplies. Water that makes its way into waterbodies, e.g. rivers, lakes, and aquifers, is often referred to as ‘blue water’. The portion that is retained within the soil profile, or within vegetation is ‘green water’. Water that has been used is sometimes called ‘grey water’, e.g. used wash water. ‘Grey water’ is also an important term in water footprinting where it refers to pollution and is defined as the volume of freshwater that is required to assimilate the load of pollutants given natural background concentrations and existing ambient water quality standards (Water Footprint Network, 2011).
Review of Current Knowledge
9
Figure 2.1 The agri-water Cycle
Source: AMEC, 2013
Land use affects how water moves and flows across and through land. As it passes through cultivated and pasture land water also transfers sediments, nutrients, and other agricultural elements (e.g. pesticides) from the land into the water environment. Water is consumed by agriculture to produce food, mostly through the process of evapo-transpiration which enables plants to convert water and other elements into plant material. It is also consumed by livestock as drinking water, and used on farms for cooling and cleaning purposes. Further down the food supply chain significant volumes of water are used in food manufacturing. Not all of the water that enters the agri-water cycle is productive. Some of it is lost without contributing to crop growth (non-productive evaporation). Only about 30 percent of the incoming precipitation is available for productive transpiration but

Review of Current Knowledge
10
this varies around the world (higher proportions of productive transpiration occur in temperate regions). Food production is limited by water availability and there are two main ways to access water. The vast majority of agricultural land (80 percent) is rainfed; most of this is pastureland or in humid regions. Unsurprisingly 90 percent of all the water used by agriculture comes directly from rainfall. Despite this only 60 percent of the annual food stocks comes from rainfed agriculture (FAO, 2011a). Rainfed agriculture is highly vulnerable to weather patterns (and climate change) and tends to be less productive than irrigated land. The rest of our food is sourced from farms that abstract water to irrigate crops (the remaining 10 percent of water used in agriculture). Only 20 percent of agricultural land is cultivated but produces 40 percent of food output. Figure 2.2 illustrates what proportion of rainfall is converted into green water for rain-fed agriculture, and what proportion is converted into blue water and subsequently abstracted to irrigate cultivated agriculture.
Figure 2.2 Sources of Water used by Agriculture
Source: AMEC, 2013
Review of Current Knowledge
11
Irrigation is clearly a highly significant, albeit smaller, proportion of total water used in agriculture. However, it is easier to understand the significance of irrigation on water resources by comparing how abstraction for agriculture compares to abstraction for all other purposes. On a global scale, agricultural irrigation accounts for 70 percent of freshwater withdrawals (UNESCO, 2003).
Use versus Consumption
Referring to the volume of water ‘used’ by agriculture can be misleading. Some water used is ‘consumed’ i.e. it is effectively removed from the local water environment and is no longer available for re-use or re-circulation. Consumptive uses include evapo-transpiration and water embedded within agricultural products, e.g. milk. In the UK, most water that is abstracted for irrigation is considered to be ‘consumptive’ although elsewhere this is not always the case. Irrigation is not always planned and used efficiently; more water is supplied than is needed by the crops and can end up as run-off rather than evapo-transpiring. Water is also said to be consumed if it is lost (as far as the environment is concerned) due to pollution (i.e. ‘grey water’). Generally, water resources in areas downstream of consumptive use are negatively impacted, especially where water is scarce (Lundqvist et al., 2008).
Non-consumptive uses are defined as a use of abstracted water which is returned to the immediate environment from where it came, with the water requiring little or no wastewater treatment, e.g. fish farms, cress ponds (aquaculture). As a point of interest, aquaculture is the fastest growing food-producing sector. Inland fisheries and aquaculture do not consume water but do require a certain quantity and quality of water in rivers, wetlands, lakes, and estuaries (FAO, 2012). The volume of water that is required to produce food varies depending on the type of food, farming practices and location. These are covered in the following chapters.
Land-use and Water
Modern agriculture impacts on the natural water cycle in several ways. Since the onset of agriculture 8000 years ago the global landscape has changed dramatically; primarily extensive areas of forest and woodlands have been replaced by managed pastureland and large-scale intensively farmed cultivated land. These types of land use have very different properties when it comes to how water moves through the water cycle.

Review of Current Knowledge
12
The main issues for the agri-water cycle relate to how the existing agricultural land is managed. Considering the vast areas of land that are managed by the agricultural sector agricultural management practices can exert a significant influence on the water environment. Effective land and soil management can capture much of the rainwater and avoid surface run-off that causes erosion and the loss of soil nutrients. It can also support groundwater recharge by slowing down run-off rates whilst performing a water purification role. Good management includes effective crop rotation, installation of hedgerows to protect soils from wind (aeolian) erosion, installation of ‘buffer strips’ for the capture of sediment and nutrients in run-off to prevent them from entering rivers and streams and managing livestock to protect river banks from erosion and animal waste. From a crop production perspective managing water is about maintaining soil conditions that are optimal for crop growth via irrigation, drainage and water conservation. Conversely, poor agricultural practices can create problems for farming and the water environment:
Excessive abstraction can divert water from supporting ecosystems (OECD, 2010);
Irrigation infrastructure along river banks can affect fragile ecosystems, including wetlands;
Tilling cultivation disturbs the soil surface exposing more soil to evaporation and erosion;
Poor drainage and run-off can cause valuable soil material and nutrients to be lost; and
Pollution: Excessive application of pesticides and organic and inorganic fertilisers can have a direct impact on water quality and affect people’s health.
Pesticides, herbicides, nitrates and phosphates are often spread over wide areas. They are highly soluble so it can be very difficult to isolate, measure, and control their transfer into the water environment where they have a major impact on the water environment. Phosphates are a soluble form of phosphorus and come from livestock effluents and mineral fertilisers. On the land these are important for plant growth but in water they continue to stimulate algae and other plant growth and can lead to

Review of Current Knowledge
13
eutrophication within rivers, lakes and coastal waters. Ultimately this depletes oxygen levels and significantly reduces water quality. Water quality problems arising from pesticides (e.g. weedkillers such as Atrazine) are generally seasonal reflecting the seasonal use of the products.
Water Footprinting
Water Footprinting is a concept that was introduced in 2003 by Professor Arjen Hoekstra of the University of Twente (Netherlands) to help measure our total demand for water (direct and indirect) in the products we use and consume (FAO, 2012).
Traditionally, water use to produce food has been measured purely as direct water abstraction. This approach underestimates total water use and makes no assessment of the impacts. A water footprint (WWF, 2008) measures all the direct and indirect water (‘virtual water’) used to produce a product. It is usually true to say that the direct water use of a product is small compared to the indirect water use of the supply chain. There is currently no standard accredited approach to calculating a water footprint. The concept and methodology is evolving and research is being advanced, promoted and coordinated by the Water Footprint Network (http://www.waterfootprint.org) and also by ISO project 14046. A water footprint (m3/ton) considers the total freshwater volume required across all stages in the production chain, direct (e.g. water taken from the tap) and indirect (e.g. the water use required to produce all inputs into the production process, measured where these inputs were produced). Water use is measured in terms of water volumes consumed (e.g. evapo-transpirated) or polluted (e.g. effluent requiring treatment, or pesticides in water courses) and as such a water footprint can be broken down into three components: the blue, green, and grey water footprint:
The blue water footprint is defined as the volume of freshwater evaporated from global water resources e.g. rivers, lakes, and groundwater used to produce a product;
The green water footprint is defined as the volume of water stored in the soil from rainfall that is evaporated to produce a product; and,
The grey water footprint is the volume of water that is required to dilute pollutants to an extent that the quality of the discharged water is above the agreed water quality standards.

Review of Current Knowledge
14
A water footprint on its own quantifies use, taking into account temporal considerations of water use and spatial variability, but it does not measure impact and it does not enable comparisons of environmental, social, or economic impacts to be made between different locations. Work is ongoing to continue to improve the method and its application (e.g. Ridoutt and Pfister (2009) present a revised water footprint approach to incorporate a water stress characterisation factor). Despite this, understanding footprints enables business to target water use hotspots within the food supply chain and mitigate against water risks. It enables customers to make informed decisions about the sustainability of their food choices.

Review of Current Knowledge
15
3. Water and Food Production: a UK Perspective
The UK’s total water footprint is 102 Gm3/year, and 73 percent of this (75 Gm3/year) is driven by demand for agricultural products (although this includes non-food products such as cotton) (WWF, 2008). Water resources in England and Wales are becoming increasingly stressed in many areas, with a recurrent imbalance arising from an overuse of water resources, caused by consumption being significantly higher than water availability. As such, there is not always enough water available for the requirements of all users. Similarly water quality in many water bodies is failing, or is at risk of failing, the standards set by the Water Framework Directive. Also the costs of water quality treatment at the treatment works are high; indeed some water quality issues cannot feasibly be treated, resulting in further loss of water available. Agricultural water users are increasingly concerned about the quantity of water that is, or is forecast to be available to them as demands for water become increasingly more competitive whilst climate change creates uncertainty and unpredictable water availability. 3.1 Agricultural Activity in the UK
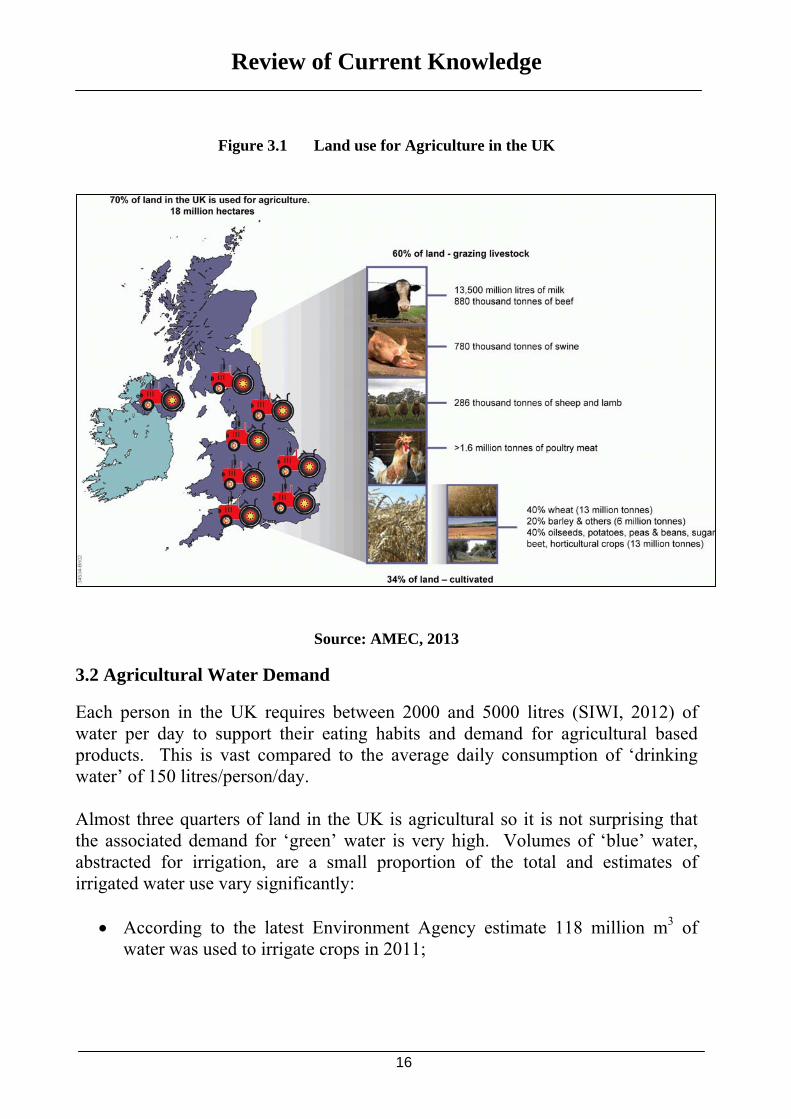
According to Defra (Defra, 2013) agriculture occupies over 70 percent of land in the UK, approximately 18 million hectares. The majority of this (60 percent of agricultural land) 10.9 million hectares, is pastureland for grazing livestock. 6 million hectares (34 percent of agricultural land) is given over to arable farming. In terms of output, arable farming is dominated by 18 million tonnes per year of cereal crops (mostly wheat (40 percent) and barley (20 percent)). Oilseeds, potatoes, peas and beans, sugar beet, and horticultural crops combined generate the remaining 40 percent of arable output. The most valuable crops are those within the horticultural sector that occupy the smallest areas of land. 6 percent of agricultural land consists of other types of land holding, e.g. woodland (Figure 3.1). Livestock produce around 13,500 million litres of milk per year, over 1.6 million tonnes of poultry meat, 880 thousand tonnes of cattle, 780 thousand tonnes of swine, and 286 thousand tonnes of sheep and lamb. As a whole, over 19 million tonnes of cereals are harvested per year. At over 13 million tonnes, wheat is the single most volumous foodstuff produced in this country. In monetary terms £12Bn worth of the food and drink produced in this country is exported overseas, but 40 percent of the total food consumed in the UK is imported (Defra, 2009).
Review of Current Knowledge
16
Figure 3.1 Land use for Agriculture in the UK
Source: AMEC, 2013
3.2 Agricultural Water Demand
Each person in the UK requires between 2000 and 5000 litres (SIWI, 2012) of water per day to support their eating habits and demand for agricultural based products. This is vast compared to the average daily consumption of ‘drinking water’ of 150 litres/person/day. Almost three quarters of land in the UK is agricultural so it is not surprising that the associated demand for ‘green’ water is very high. Volumes of ‘blue’ water, abstracted for irrigation, are a small proportion of the total and estimates of irrigated water use vary significantly:
According to the latest Environment Agency estimate 118 million m3 of water was used to irrigate crops in 2011;
Review of Current Knowledge
17
Defra surveyed farmers in 2009/10 and the results indicate that 184 million m3 of water was applied to land and used on farms during the year; and,
Other studies have estimated the total on-farm use of abstracted water to be in excess of 300 million m3 per year (ADAS, 2006). Data from the Royal Agricultural Society of England indicated total water use by agriculture in 2006 was 304,311 million m3.
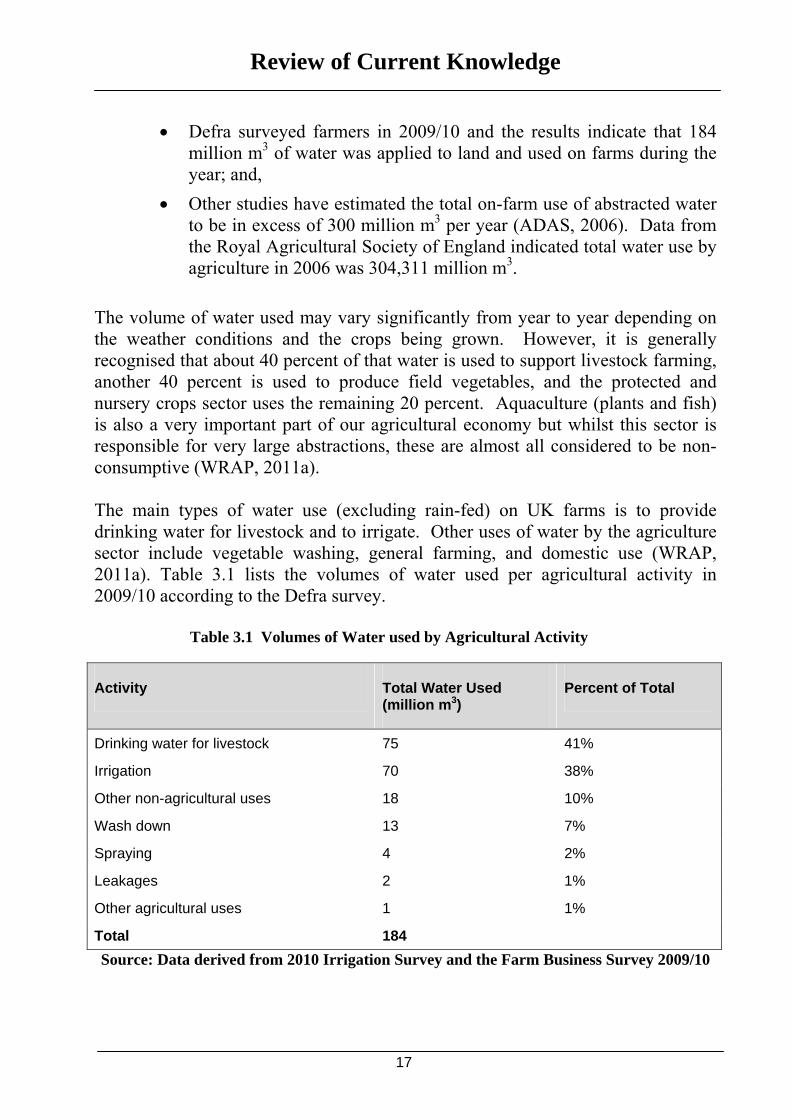
The volume of water used may vary significantly from year to year depending on the weather conditions and the crops being grown. However, it is generally recognised that about 40 percent of that water is used to support livestock farming, another 40 percent is used to produce field vegetables, and the protected and nursery crops sector uses the remaining 20 percent. Aquaculture (plants and fish) is also a very important part of our agricultural economy but whilst this sector is responsible for very large abstractions, these are almost all considered to be non-consumptive (WRAP, 2011a). The main types of water use (excluding rain-fed) on UK farms is to provide drinking water for livestock and to irrigate. Other uses of water by the agriculture sector include vegetable washing, general farming, and domestic use (WRAP, 2011a). Table 3.1 lists the volumes of water used per agricultural activity in 2009/10 according to the Defra survey.
Table 3.1 Volumes of Water used by Agricultural Activity
Activity Total Water Used (million m3)
Percent of Total
Drinking water for livestock 75 41%
Irrigation 70 38%
Other non-agricultural uses 18 10%
Wash down 13 7%
Spraying 4 2%
Leakages 2 1%
Other agricultural uses 1 1%
Total 184
Source: Data derived from 2010 Irrigation Survey and the Farm Business Survey 2009/10

Review of Current Knowledge
18
3.3 Water Needs Vary for Different Foods
It is very difficult to appreciate how much water goes into making our food, but typically the ratio of water to food output is huge. For example, it is estimated that 1,500 litres of water is required per kg of wheat, at least 1200 litres to produce a kg of rice, and 15,000 litres per kg of beef (Water Footprint Network, online). Producing meat and dairy is much more water intensive than producing arable crops. Approximately 500 litres of water is needed to produce 1000kcal of plant based food, but up to 8 times the amount of water (4000 litres) is needed to produce the same amount of kcal from animal-based food, although this varies between meat types and crop types. To put it another way, 500-4000 litres are used to produce a kg of wheat (depending on where it is grown, and the type of wheat) but to produce 1 kg of meat anything between 5000-20000 litres of water may be needed (Lundqvist et al., 2008). Typically, more water per calorie is required to produce higher value crops, such as sugar and vegetables than staple cereal crops. Similarly, a kg unit of beef requires approximately 8 times more water than chicken (Lundqvist et al., 2008). Meat and dairy products require so much water because most livestock is fed not simply on grass but by feed crops, such as maize, which have their own water requirements and dairy cows drink up to 90 litres of water per day.

Review of Current Knowledge
19
Figure 3.2 Water Intensity of Different Foods
Data source: Mekonnen, M.M. and Hoekstra, A.Y. (2010a) and Mekonnen, M.M. and Hoekstra, A.Y. (2010b)
Livestock According to the Royal Agricultural Society of England there are 10 million cattle (dairy and beef), 34 million sheep, 5 million pigs, and 168 million poultry in the UK; and in 2006 119 million m3 of water was consumed by the livestock sector (data as per 2006, Charlton et al., 2010). Unsurprisingly, cattle consume the majority of this (approximately 70 percent) due to their dominance in terms of animal numbers and the water requirements of cows compared to other animals. The cattle sector is followed by sheep (14 percent); poultry (10 percent); and pigs (6 percent). Interestingly, the Defra 2009/10 survey reported that livestock consumed only 73 million m3 of water, considerably less than 119 million m3 in 2006 (Water Footprint Network, online).

Review of Current Knowledge
20
Most UK cattle and sheep farming is in the west where pastureland is supported by rainfall. Pigs and poultry farms are more evenly spread across the country, with concentrations of pigs occurring in Yorkshire, Humberside and Eastern England, and concentrations of poultry in Eastern England and the East Midlands. Of the water that is abstracted up to 75 percent is used for drinking water. Dairy cows need the most water, drinking on average 90 litres/day; a beef cow drinks about 20 litres/day; and a calf just 5 litres/day (ADAS, 2006). The other main uses of water on livestock farms are to cool down machinery and to clean equipment and farm yards. Large volumes of water are also used in the slaughter and production of meat. The use of wash water for cleaning purposes is normally confined to dairy production, the milking parlour, the bulk milk tank, pipelines, and the collecting and dispersal yards. Unless there are specific animal disease or health reasons, no cleaning water is used in stock accommodation for both adults and young stock, whether dairy or beef.
Table 3.2 Volumes of Water used for Drinking Water and Washing down on Livestock Farms
Livestock Type
Total Drinking Water m3 (million)
Average Water used per Farm for Livestock Drinking (m3 per farm)
Average Water used per Livestock Unit for Drinking (m3 per LU)
Total Wash down Water m3 (million)
Average Water used per Farm for Wash down (m3 per farm)
Average Water used per Livestock Unit for Wash down (m3 per LU)
Dairy 34 4030 21 11 1300 7
Grazing Livestock
18 1130 13 0.2 20 0.2
Pigs and Poultry
8 4120 11 0.4 230 0.6
Source: Data taken from Defra report which has been derived from the 2009/10 Farm Business Survey
Due to the water quality standards required on granivore farms (pigs and poultry) these farms are more likely to irrigate using mains water than direct abstractions from rivers or streams (Defra, 2011). In fact, most of the water for these purposes is supplied as mains water, although many farmers also have their own abstractions from surface water and groundwater. In the field, cattle also drink from rivers and streams etc. Water use on these farms is fairly evenly distributed throughout the
Review of Current Knowledge
21
year with a small increase during the summer months when animals tend to drink more when temperatures are higher. Farmers are increasingly looking to use water more efficiently and are harvesting rainfall from farm roofs, and re-using water that has been used for washing down of cooling plates. .
Field Crops In the UK 60 percent of all the arable land (17.5 percent of all the agricultural land) is used to grow just two cereal crops: wheat (40 percent) and barley (20 percent). The rest is shared between crops such as oilseed rape, peas and beans, potatoes, sugar beet and horticultural crops (Charlton et al., 2010). Crops require water for growth and there must be sufficient moisture in the soil to provide this from rainfall or be ‘topped up’ artificially by irrigation to meet the crop requirement and maximise productivity. Potatoes, sugar beet and other field vegetable crops are particularly thirsty and so irrigation is usually required to maintain soil moisture. The primary reason for irrigation in the UK is to ensure quality of product rather than maximise yield, as farmers irrigate only when there has been insufficient rainfall during the main growth period (or to establish some vegetables). Field crop irrigation is dominant in Eastern and Southern England, takiing place during the drier summer period and almost not at all in Wales. An increasing proportion, though still less than 10 percent of all irrigation is undertaken by drip or trickle irrigation, a method which is generally more efficient at providing water to the roots of plants when they need it, avoiding losses to runoff. Trickle irrigation is practised most in the South East where more than half of the national estimated quantity is used (ADAS, 2006). Outside of the organic farming sector, all arable crops require considerable amounts of water to be applied to them for the delivery of various pesticides by spray application (ADAS, 2006). Water is also used to wash vegetable crops. This removes unwanted material such as soil, to improve the appearance and possibly to remove pesticides. Water is also used to cushion/move crops though other processes such as size grading and ‘polishing’. Crop washing may take place in the field or in a packhouse or a combination of both. The scale of production will have an influence as will the tenderness or perishability of the crop and the quantities to be washed (ADAS, 2006). All producers supplying food to supermarkets etc are generally obliged to follow crop assurance protocols to ensure food safety linked to washing. Water used for

Review of Current Knowledge
22
final product washing must meet national drinking water standards and recycled water must be filtered. Water is therefore mainly drawn from the public mains or from any other source (mainly boreholes), providing its quality is of a high enough standard (ADAS, 2006). There are no statutory water quality requirements for irrigating field crops and most irrigation water is abstracted by farmers directly from surface or groundwater sources. Protected and Nursery Crops The third largest sector in terms of overall agricultural water use is the protected and nursery crops sector (about 53 million m3 of water annually) (Charlton et al., 2010). There are no complete datasets to confirm the total land area given over to this type of agriculture at the UK level but estimates from 2004 suggest 1,750 ha in England2 (ADAS, 2006). This type of agriculture, and its associated water use is mainly concentrated in the South East of England; there is also significant activity in Eastern England and the Midlands, although it is present in all regions. . Protected crops are described as those grown permanently under glass or plastic cover, e.g. tomatoes, sweet peppers, cucumbers, lettuce, strawberries, mushrooms. For covered horticultural crops significant amounts of irrigation are required. This is because all protected crops require irrigation throughout the year, peaking during the summer months (ADAS, 2006). According to the Royal Agricultural Society of England, ‘polytunnel crops’ use significant amounts of irrigation water but the process is more efficient than for field crops. Whilst the irrigation process is more efficient, these types of farms generally have to use potable public water supplies for health reasons (ADAS, 2006; Defra, 2011) as crops that grow on the surface, especially salad crops, are less able to tolerate varying levels of water quality than are crops that grow within the ground (e.g. potatoes). Figure 3.3 shows the proportion of the total irrigated area by crop type according to the Defra 2010 survey. The total volume (83 million m3) was almost a third less than in 2005 due to a reduced number of irrigated holdings and wetter weather in 2010. It clearly shows that main crop potatoes are the single most water demanding crop in the UK irrigated sector, followed by field vegetables. These are both high value crops with yield and quality directly responsive to irrigation.
2 1ha is about the same size as an international rugby pitch

Review of Current Knowledge
23
Figure 3.3 Crops Irrigated as a Percentage of the Total
Source: Defra Irrigation Survey 2010.
3.4 Rainfed versus Irrigation in the UK
Most water in UK agriculture is rain-fed. However, where arable agriculture predominates (eastern England) irrigation is by far the main use of water. Whilst in some areas natural rainfall can supply all the required water for outdoor crops, cropping under pure rainfed systems is risky and yields tend to be low. Irrigation is often essential for some crops to ensure good quality water is available at the right time and in the right quantity to assure the best crop result is achieved. Irrigation prevents disease (such as scab in potatoes) and aids timeliness of establishment and harvest. Product quality and quantity are often highly dependent on the availability of water in the right volume and at the right time to ensure product quality and yield and profitability. Irrigation in the UK is, therefore, “supplementary and the aim is not to meet the plant’s full water demand but to provide enough water to get the plant through the critical growth stages” (Lundqvist et al., 2008). How much irrigation is required depends upon the amount of rainfall received on a season to season basis (ADAS, 2006).

Review of Current Knowledge
24
In the UK irrigation occurs mainly during the summer months when the pressure on water resources is already at the highest level but demand varies from year to year depending on rainfall levels and temperatures. Spray irrigation is the most common type of irrigation in the UK and accounts for 88 percent of agricultural consumptive use. In East Anglia demand can be significant in the summer months where irrigation abstractions can average 20 percent of the total for all uses over a typical summer. Farms across East Anglia use as much as 16 percent of the national farming total. Sometimes more water is used on a hot dry day for spray irrigation than for public water supply. However, agriculture is a relatively small abstractor compared to other uses (e.g. public water supply, power sector, other industry) just 1 percent of licensed abstraction volumes are allocated to agriculture (Environment Agency, 2008). This figure is slightly misleading in terms of total water use as many UK farmers grow crops which require higher quality treated water and so irrigate using mains water. A study by the UK Government’s Waste & Resources Action Programme (WRAP) in 2011 (which examined abstraction returns data from the Environment Agency databases) claims that in England and Wales agriculture is the third largest user of non-household mains supply (10-12 percent), consuming approximately 240,000 Ml in 2006. The key point is that despite relatively small abstraction volumes, agricultural irrigation is highly consumptive.
3.5 Water and Food Manufacturing in the UK
The food and drink industry has a high demand for clean and fresh water. Access to an abundant source of high quality water is one of the essential factors in designing a food plant. Contaminated water would generate substantial threat to the product quality and safety so there is always the pressure to ensure it meets an appropriately high standard. It is estimated that 80 percent of water requirements for the food and beverage industry are sourced from public water supplies. Water use during food production is significantly lower than during primary production but it is still a significant component of many foods. It can either be added directly as an ingredient or be present in the processing. Water has been added to food as an ingredient by food producers since food processing began. For example, the primary steps in processing livestock in the meat, poultry and seafood sector include rendering and bleeding; scalding and/or skin removal; internal organ evisceration; washing, chilling, and cooling; packaging; and cleanup (UNIDO, 2004). Another example is the fresh fruit and vegetable sector where the primary steps include general cleaning and dirt removal; removal of leaves, skin, and seeds; blanching; washing and cooling; packaging; and cleanup (UNIDO, 2004). There

Review of Current Knowledge
25
are many examples of water being used as a processing aid including the use as a thermal transfer medium, as a transport medium and in cleaning (Kirby et al., 2003). Food processing can be divided into four major sectors including fruit and vegetables; meat, poultry, and seafood; beverage and bottling; and dairy operations. All of these sectors consume a huge amount of water for processing food (United Nations Industrial Development Organisation (UNIDO), 2004)), see Table 3.3.
Table 3.3 Typical Rates for Water Use for Various Industries
Industry Range of Flow gal/ton Product
Fruits and Vegetables
Green beans 12,000-17,000
Peaches and pears 3,600-4,800
Other fruits and vegetables 960-8,400
Food and Beverage
Beer 2,400-3,840
Bread 480-960
Meat packing 3,600-4,800
Milk products 2,400-4,800
Whiskey 14,400-19,200
Sources: UNIDO (2004)
The total volume of water abstracted from non-tidal sources in England and Wales in 2006 including major non-consumptive uses and excluding that abstracted for public water supply is estimated to be 23,752 Ml and 30,240 Ml for the manufacture of beverages and food respectively (WRAP, 2011b). The Food Industry Sustainability Strategy (Defra, 2006) states that the food industry in England and Wales is estimated to use 157,950 Ml per year of mains water.
3.6 Impact of Climate Change on UK Agriculture
It is estimated that the population of England and Wales will increase by 9.6 million people by the 2030s and this growth means that demand for water is likely to increase. The UKCP09 medium emissions climate change scenario indicates that by the 2050s UK summer temperatures may increase, summer rainfall may

Review of Current Knowledge
26
decrease, and short duration droughts (12-18 months) are likely to become more frequent. In recent years we have already witnessed changing patterns of rainfall which has had a direct impact on water availability for agriculture, leading to a shortage of irrigation water in some regions of the UK. The Potato Council reports that due to climate change, the amount of arable land suitable for rain-fed potato production in the UK, is expected to decrease by at least 75 percent, increasing the need for irrigation (refer back to current situation illustrated in Figure 2.1). With the likelihood of increased water demand and reduced water supply in the UK, particularly in Eastern England, there are potential risks to UK agriculture. If climate change does change our rainfall patterns, and extra facilities to store water do not materialise the crop production could diminish in both rain-fed and irrigated agricultures. If water management practices respond appropriately then potentially longer and hotter summers will extend livestock grazing seasons, potentially increasing yields. For arable and other crops, climate change may affect sowing and harvesting dates, and rates of spring growth. Some crops may prosper but others may struggle. Based on evidence from recent droughts in the UK (Charlton et al., 2010) the impacts of reduced water availability on farming include: Livestock:
Grazing (e.g. beef and sheep): forage supply reduced with a loss in both yield and quality and consequently the need to provide more supplementary feed (with its’ own inherent water requirements);
Dairying: reduced grass growth and less silage cutting lowers winter feed stocks; and,
Pigs and poultry: animals reduce their feed intake during hot weather lowering productive output.
Cropping:
Shorter harvest period with longer more unsocial hours;
Early maturation of crops may require logistical changes;
Increased yields and quality of cereals (providing water is available to irrigate);

Review of Current Knowledge
27
Increased yield of oilseed crops although irrigation requirement could increase the cost of spring crops (provided water is available);
Yields of peas and bean crops could fall;
Yield and quality of potato, sugar beet and field vegetables could diminish if irrigation facilities are overstretched. This could create difficult conditions for weed and insect pest control, and crop disease;
Yields of orchard fruit crop may decline but eating quality may improve;
The yield of protected crops would decline if additional water is not available to meet transpiration requirements of existing volumes of crop. Increased irrigation, using mains supplies, would increase production costs; and,
Reductions in yield may have some financial benefits (at some point in the food supply chain) as shortages may be offset by higher prices.
The review of outputs from Defra’s climate change research programme suggests that most farmers will be able to maintain their existing crop and livestock enterprises.
3.7 Impact of Agriculture on UK Water Resources
One important aspect of this regional difference in farming types and their water demands is that whilst livestock has a higher annual total demand than arable farming, that demand is relatively constant across the year (although there will be a higher demand during hot dry weather in the summer). Arable farms’ demand for water is much more acute and intense, during the main growth period in early summer, and in the regions which are least capable of supplying it (ADAS, 2006). Undoubtedly, the most pressing issue to deal with in UK agriculture is securing water for irrigation whilst appropriately protecting the water environment. Most farmers irrigating field crops abstract water directly, from boreholes or surface water local to their farm. Farmers in England and Wales who abstract more than 20m3/day are required to obtain an abstraction licence from the Environment Agency (England), and Natural Resources Wales. Abstraction licences specify the volumes that abstractors are permitted to take, the purpose of use, and the dates during which abstraction is permitted. Since the 1960’s the way water is managed in the UK has become more and more sophisticated. The abstraction licensing system was introduced in the 1960’s and

Review of Current Knowledge
28
this was generally on a first come first served basis. The UK Government is in the process of reforming the abstraction licensing regime which is now questionably not fit for purpose. Proposed reforms include the introduction of time-limited licences, better support for licence trading, and pricing water to reflect its scarcity. Over time farmers and agricultural groups have become more involved in helping to manage water resources and now initiatives such as catchment sensitive farming are integral to water management in many parts of the country. Farmers, particularly in Eastern England, are increasingly concerned about securing their access to water and have formed farming abstraction groups to work more collaboratively with the Environment Agency to find ways to protect farming, and the environment. However, for most other uses farmers use mains water supplied by the water utility companies, and the farmers pay per volume. The water companies now have a statutory duty to develop long-term water resource management plans to safeguard supplies to their customers, and this includes understanding and forecasting demand, including from agricultural customers. Because of the way that water companies manage their water supplies (strategic water supplies) mains water may be sourced a considerable distance from where it is ultimately used. Food Waste Food waste is a big issue. Data from a 2013 study (WRAP, 2013) shows that by 2012 annual UK household food and drink waste had fallen to an estimated 7 million tonnes. However, bearing in mind that 1 million tonnes of food waste would fill Wembley Stadium to the brim3 this is still a huge amount. Some of this waste will be foods from the 40 percent of our needs that are met from farms in the UK, and thus wasting the rain-fed and irrigated water used here, and some of it will be foods from the 60 percent that are imported, therefore wasting water that in all likelihood is from regions that are already water scarce.
“Over eating, and throwing away food is like leaving the tap running” (Lundqvist et al., 2008)
The environmental impact of avoidable household food and drink waste is now around 4 percent of the UK total water footprint (and 17 million tonnes of CO2e, equivalent to the emissions of 1 in 5 cars on UK roads).
3 http://www.wrap.org.uk/content/new-estimates-household-food-and-drink-waste-uk

Review of Current Knowledge
29
4. Water and Food Production: Globalisation of Food
The total water footprint from all products and sectors, across all countries in the world is 9087 Gm3/yr (Mekonnen and Hoekstra, 2011a) and 92 percent of this comes from agricultural production. Agriculture takes the largest share of the total water footprint within each individual country, highlighting the significance of this sector on global water consumption. The total water footprint of agricultural products in the UK is approximately 75 Gm3/year. Chapter 3 set out how food production dominates the UK landscape, the different types of food that is produced on different types of farms, how much water this uses, and also how much food (and therefore water) is lost and wasted. It also states that only 60 percent of the food (and drinks) we consume are sourced in the UK. Food demands and markets have become truly global with all countries importing and exporting huge amounts of food every day. As well as trading in food, by transporting food we are also trading in ‘virtual’ or ‘hidden water’ and exerting pressure on water environments around the world. Countries that export food export virtual water, and countries that import food import virtual water. Thus, “water is increasingly becoming a global resource” (Hoekstra, et al., 2008). Only 38 percent of the UK agricultural related water footprint is sourced within the UK, affecting UK water resources (28.4 Gm3/year, 1292 litres/person/day). We import 46.4 Gm3 of virtual water from other countries (WWF, 2008).

Review of Current Knowledge
30
Figure 4.1 UK Water Resources Used to Support Food Consumed in the UK
Source: AMEC, 2013
From an agricultural perspective, the UK is a net importer of virtual water, highly dependent on global water resources, to provide for our agricultural demands. Despite the pressure on our own water resources, by importing food we are to some extent relieving the pressure that we would otherwise face. We import huge volumes of thirsty crops, e.g. cocoa and sugar. The top ten food products contributing to our external agricultural water footprint due to imports are:
1. Cocoa beans (7346 Gm3/year)
2. Bovine products (5458 Gm3/year)
3. Swine products (3775 Gm3/year)
4. Oil palm fruit (3171 Gm3/year)
5. Soybeans (3092 Gm3/year)
6. Sugar cane (2500 Gm3/year)
7. Coffee (2069 Gm3/year)
8. Milk (1782 Gm3/year)

Review of Current Knowledge
31
9. Rice (1490 Gm3/year)
10. Maize (1420 Gm3/year).
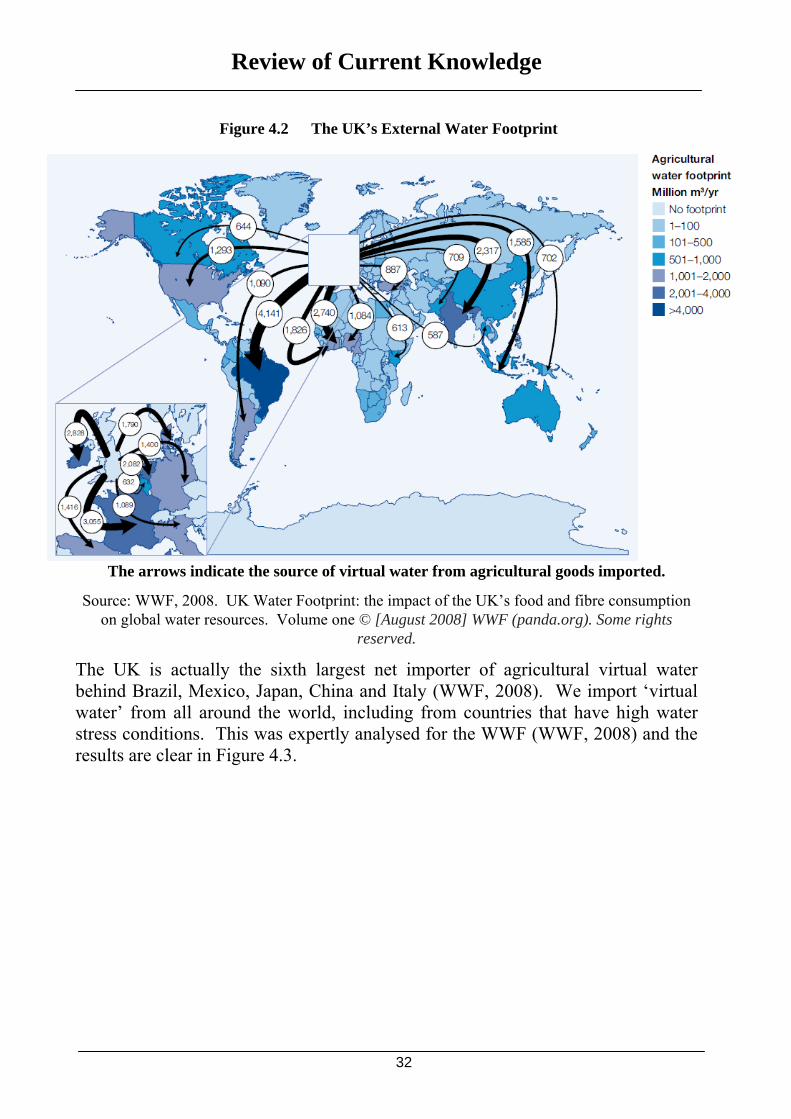
Data on the international trade of products, and the virtual water flows between countries is collated and made available by the International Trade Centre (Intracen.org). Some of the main reasons why we import food (and drinks) whilst at the same time exporting large amounts of food are generally due to our agro-climatic conditions, our tastes, and established trading markets. For instance, wheat, apples, carrots and dairy products are relatively easy to produce in the UK, whereas bananas, pineapples and other more exotic foods are not. As a population our food tastes have become more diverse, but also less seasonally inclined. For example, strawberries and tomatoes grow very well in the UK during the summer, but demand for strawberries is annual and this type of demand is met by imports. Food retailers depend on reliable supplies and so may source foodstuffs from overseas, even whilst these crops are harvested in the UK, if the supply is thought to be more reliable. Retailers may also find it is cheaper to work with suppliers overseas than in the UK. Global growing and trading patterns are complex as there are so many factors driving imports and exports. Figure 4.2 illustrates where the majority of the UK’s food water footprint comes from. It shows quite clearly that the UK imports virtual water from all over the world. Our single largest import of water is from Brazil (4,141 million m3/year), followed by France (3,055 million m3/year), and Ireland (2,828 million m3/year).
Review of Current Knowledge
32
Figure 4.2 The UK’s External Water Footprint
The arrows indicate the source of virtual water from agricultural goods imported.
Source: WWF, 2008. UK Water Footprint: the impact of the UK’s food and fibre consumption on global water resources. Volume one © [August 2008] WWF (panda.org). Some rights
reserved.
The UK is actually the sixth largest net importer of agricultural virtual water behind Brazil, Mexico, Japan, China and Italy (WWF, 2008). We import ‘virtual water’ from all around the world, including from countries that have high water stress conditions. This was expertly analysed for the WWF (WWF, 2008) and the results are clear in Figure 4.3.

Figure 4.3 UK Agricultural Water Footprint and Water Stressed Food Production Locations
Source: WWF, 2008. UK Water Footprint: the impact of the UK’s food and fibre consumption on global water resources. Volume one © [August 2008] WWF (panda.org). Some rights reserved.
Review
of C
urren
t Kn
ow
ledg
e
33
Review of Current Knowledge
34
The main points to take away from this illustration are that countries within the Group D circle contribute significantly to the UK agricultural water footprint whilst also having relatively high – high water stress conditions. This situation has many implications that we should consider.
4.1 Impact of Agriculture on Water Resources around the World
The diagram used by the WWF (Figure 4.3) uses the definition of water stress that compares the volume of water that is abstracted (withdrawn) to the actual volume of renewable water resource in the area (taking into account the environmental flow requirements). Where a very high proportion of the freshwater that is available is abstracted (for all types of need) then the area is highly stressed. Water stress is a problem because it means there is a very fine balance between how much water there is and how much is being abstracted. Environmental flow requirements, and the needs of existing abstractors are precarious. It means that there is very little (if any) water available for new abstraction needs. Stressed conditions means there are high risks of environmental degradation and high risks of social and economic demand for water not being met. The introduction section of this ROCK highlighted that global food production may need to increase by 70 percent and that food requirements in the developing world could double. South Asia, East Asia, and the Middle East are already close to, or exceeding, the limits of their water resources, and their populations and food output requirements are still growing. Food production in some parts of North America is already unsustainable because of depleting groundwater (FAO, 2012). Regions that are under water stress may exhibit a number of agriculture related water problems including reduced water quantity, pollution, and salinisation. The ‘Green Revolution’ of the 1960’s was a global phenomena which extended and intensified food production in many countries. This would not have been possible without irrigation. The widespread intensification of farming has altered the natural hydrology of surface water, groundwater, and the environment in many water catchments (OECD, 2010). Problems include reduced flows in rivers and groundwater levels lowering; wetlands shrinking or disappearing (also happens due to drainage) and less water often means lower oxygen levels which can damage flora or fauna; salinisation of groundwater (in coastal areas) and salinisation of land (particularly if irrigation water has high mineral levels); dams and water diversions to support irrigation; leaching of nitrates and pesticides from agricultural land into water courses.

Review of Current Knowledge
35
Intensified farming in wetter regions generates problems of water quality and pollution.
Box 3 Regions under Stress
The vulnerability of rain-dependent food production systems and the people who depend on them was brought into stark relief by the situation in East Africa in 2011. It was widely reported that more than 13 million people were at risk of starvation after the worst drought to hit East Africa in 60 years;
In large areas of India and China, groundwater levels are falling by 1 to 3 m per year, causing intrusion of seawater into aquifers, higher pumping costs and jeopardising agricultural production (FAO, undated, b); and,
300 million ha of land are irrigated and around 10% of that irrigated land is in a degraded state due to salt accumulation (FAO, undated, b).
Traditionally surface water has been the main source for irrigation, typically because it tends to be more accessible. However, as access to groundwater reserves is improved, this is increasingly seen as a preferable source since water quality is usually much higher than surface waters, and it is less vulnerable to drought. In 2002 the proportion of agricultural water taken from groundwater OECD countries was 30 percent, and this is increasing. The environmental system supports local communities; damage to the water environment is bad enough but there are also real human costs: Water scarcity forces people to rely on unsafe sources of drinking water and water scarcity encourages people to store water in their homes. This can increase the risk of household water contamination and provide breeding grounds for mosquitoes - which are carriers of dengue fever, malaria and other diseases. A lack of water has driven up the use of wastewater for agricultural production in poor urban and rural communities. More than 10 percent of people worldwide consume foods irrigated by wastewater that can contain chemicals or disease. Food waste at a global scale is huge. One study estimated that the volume of water lost in a year due to food loss and food waste could be as much as half of the total volume of water that is abstracted for irrigation, about 1350km3, equivalent to about half the volume of Lake Victoria (Lundqvist et al., 2008).
Review of Current Knowledge
36
5. Water Security
5.1 Water Risks
As demand and competition for water resources continues to grow and water stress levels become more intense, the number of places finding that water is scarce will continue to increase, jeopardising economic development, threatening political instability and public health. Where water is scarce food production is also at risk. Water security is a term that reflects the aspiration of both governments and corporate business to manage these risks. Water security is a truly global issue in that water risks are present all over the world and global trade, particularly in agricultural products, transfers and shares the problems and risks in one country with others. However, unlike carbon it is a global issue which clearly manifests itself in local problems. These problems can be complex and in many cases there is conflict between water use priorities in adjacent water catchments, or across international boundaries. Sharing surface and groundwater across national boundaries for agriculture is important for countries such as Mexico-US, and Portugal-Spain (OECD, 2010). The Nile basin is a prime example of a water resource under pressure from multiple competing countries, namely Egypt, Ethiopia, Sudan, and Uganda. As a net virtual water importer, 40 percent of the UK food supply is inherently at risk from our reliance on water systems which are outside our control. At the moment there is no clear governmental position on this. There are high level policies on food trade, e.g. the European Common Agricultural Policy, but ultimately the risks of our ‘suppliers’ failing to meet our needs (e.g. due to inadequate water resources and climate change) or even deliberately choosing to switch from water intensive agri-economies to other potentially higher value water intensive economies, is a risk which food brand companies and retailers may face. There is an increasing awareness that the economic value of water can be increased by prioritising its use to support ‘high-value’ industry, e.g. the outputs of using water to produce micro-chips and semi-conductors may be significantly more than using the water to grow bananas. Arguably, it is the financial sector that is driving water security up the global agenda. Investors seek assurance that their investments are secure and will prosper, and critically that water will not be a constraint. The UK Government Pension Fund Global is broadly invested in several water-intensive sectors including Food and Beverage. At the global level institutions such as the World Economic Forum are taking the lead, exploring and pushing the issue. The Forum

Review of Current Knowledge
37
encourages and facilitates organisations and business leaders around the world to discuss the issues and call governments and business to action. The CEO Water Mandate is an international public-private initiative where through the direct involvement of corporate CEOs companies are empowered to develop, implement and disclose water sustainability policies and practices. The Mandate recognises that the business sector impacts on water resources both directly and through supply chains. Endorsing CEOs acknowledge that in order to operate in a more sustainable manner, and contribute to the vision of the UN Global Compact and the realization of the Millennium Development Goals, they have a responsibility to make water-resources management a priority, and to work with governments, UN agencies, non-governmental organizations, and other stakeholders to address this global water challenge4. Whilst the international business community continues to grapple with the problem, individual national states, and companies are also taking steps to improve their water security. California is one of the leading states with a comprehensive package of water legislation including the Agricultural Water Management Planning Act. The state has developed a plan which presents the status and trends of California’s water-dependent natural resources; water supplies; and agricultural, urban, and environmental water demands for a range of plausible future scenarios and is developing policies and action plans that take all of these issues into account5. Individual businesses are also recognising that water is not just an ‘environmental issue’ but that the continued success of their business requires that they identify and respond to the various water risks to which they are potentially vulnerable. There are several water related business risks:
Physical: Too little or too much water, water of the wrong quality, risk of production outages, risks increased by climate change;
Geo-political: Conflict (local/regional) for water rights; transboundary rivers; virtual water trading;
Community: Actual or perceived conflicts; (access / degradation of water resources) can directly impact on a business’ social licence to operate;
Reputation: This is easily damaged by real or perceived impacts on the water environment, or by being seen as an aggressive water competitor to other users e.g. domestic supplies. This can directly affect brand value;
4 http://ceowatermandate.org/ 5 http://www.waterplan.water.ca.gov/

Review of Current Knowledge
38
Regulation: Too little regulation or unstable regulatory regimes create uncertainty over resource, too much regulation can incur bureaucratic burdens, regulations can constrain water use; and,
Investment: All risks may reduce investor confidence, jeopardising investment and finance options; onus on due diligence.
In reality any number of risks may be present and may trigger further risks, all of which manifest themselves as financial risk, impacting on the future resilience of the business. Figure 5.1 illustrates a simplified view of the how risks materialising in one area may trigger risks in other areas, and thus lead to undesirable financial and/or environmental outcomes.
Figure 5.1 Inter-relationships between Water Risks
Source: AMEC, 2013

Review of Current Knowledge
39
Ultimately, for a business to be water secure it needs to be in control of the water risks in its supply chain, or at least to be aware of the risks and have an appropriate resilience plan to adapt to or mitigate against forecast and unexpected changes in the water environment.
5.2 Water Security Strategies
As in all areas of management, the first step in managing a situation is to understand and quantify that situation. Primarily, as a response to investors’ concerns over water risk, companies have begun to quantify, report, and disclose their water related performance. This is typically referred to as Water Accounting and includes metrics on water use, wastewater discharge volume and contaminant loads in water. A study by Ceres in 2010 benchmarked 100 companies in terms of how they report water risk. The study found that even for companies operating in sectors and regions of the world facing significant water risk, disclosure of risk and corporate water performance was surprisingly weak (Ceres, 2010). At that time 63 percent of the companies were able to report how much water they abstract, but only 3 percent were able to present the total ‘supply chain’ water footprint of their products. At the same time the UK based Carbon Disclosure Project launched its Water Program to encourage companies to submit and disclose their water related performance. In its first year 137 financial institutions with assets of over US$16 trillion signed up to the CDP Water Disclosure programme and 150 out of 300 companies that were approached from around the world completed the 2010 questionnaire. The response rate from the Food and Drink (and Tobacco) sector was 65 percent, third behind the Chemicals and Pharmaceuticals sectors. At that time the results indicated little evidence that the food and drinks companies (among others) were working with suppliers to manage water risk. In 2013 the fourth Water Disclosure Report was written, this time on behalf of 530 investors with US$57 trillion in assets. 1000 companies were invited to report and just under 600 participated. The Consumer Staples sector, which includes Food and Drink had the highest response rate (76 percent) of all of the sectors. This demonstrates the increasing awareness and recognition of the high level of importance that the sector places on water. 51 percent of companies report that their direct operations are at risk from water scarcity, and 74 percent claim that they are at risk from water scarcity in their supply chains. Other risks include flooding, declining water quality, rising discharge compliance costs, limits on abstraction, higher water prices, reputational damage and restricted operational water permits (CDP, 2013).

Review of Current Knowledge
40
Many companies, particularly food and drinks companies, also have their own corporate water strategies. Currently, many of these focus on water use in their own operations, as these are easier to assess and control, are benchmarking their performance and setting themselves water performance targets, e.g. to reduce water use in their own operations by a set percentage by a target date. In parallel some companies have established ‘water stewardship’ projects, e.g. water resource replenishment projects and community water supply and sanitation projects. Water stewardship is an inherently local response to a local problem. Businesses and governments may have strategic water security plans, but stewardship is much more about resolving specific water needs in the local environment. To support this, the Alliance for Water Stewardship (a collaboration of organisations including the WWF, the United Nations Environment Programme, and the CEO Water Mandate) has developed a Water Steward Standard to provide guidance to potential water stewards and to provide accreditation for stewardship actions. Water Security Resilience Actions
The key challenge is to produce more food of better quality with less water. There are a number of actions that could support this, at different stages in the food supply chain. Clearly, the solution to the forecast increases in demand for food from all around the world cannot simply be to further intensify food production. Inefficient agricultural practices need to be targeted to reduce water demand and waste. Farmers are acutely aware that they need to make themselves and their business more resilient to the emerging climate, with its unpredictable weather patterns, and often shortages of water. Action on Farms
Smarter use of water generally goes hand in hand with smarter use of all resources. Several strategies to improve water productivity on farms (‘more crop per drop’) are available:
Target water lost in the field. Only 30 percent of rainfall that hits the ground is converted into productive transpiration in plant growth.
More food can be produced with the same amount of rainfall if non-productive evaporation is minimised by mulching, weed and pest management, early plant vigour, optimal planting density and no-tillage systems. Zero tillage is a very effective soil water conservation technique for rainfed, mechanised farms (FAO, 2011). It also uses less power and so contributes less to the water problems arising from climate change. Growers can also save water by improving furrow, basin,

Review of Current Knowledge
41
and border irrigation methods to ensure that watering meets crop water requirements while limiting runoff and deep percolation (California Department of Water Resources, 2009). Occasional deep tillage deepens the effective root zone and increases the porosity of soil, planting crops in strips, crop rotation, rotating grazing fields, and surface shaping all enhance water retention in the soil, promote infiltration into groundwater, and help to control runoff (FAO, 2011).
Secure water for agriculture through capture and storage.
Countries which benefit from high winter rainfall and flood water can employ features such as pools, pits, retaining ditches etc to manage water. More significant infrastructure may include local and small-scale reservoirs. Significant water savings can thus be achieved through land use management but there will remain a need for irrigation. Improvements in irrigation are also possible to generate more crop per drop. Across OECD countries, between 1990 and 2002 the average water application rate per hectare irrigated decreased by 7 percent, while in most cases the volume of agricultural production increased. More efficient irrigation systems include:
drip irrigation (precision irrigation);
low pressure sprinkler systems;
lining irrigation ditches;
using micro-irrigation systems;
upgrading flood irrigation systems (e.g. levelling of fields, neutron probes for soil moisture measurement, and scheduling irrigation to match plant needs); and,
Small scale technologies like treadle pumps (which provide irrigation from shallow aquifers) can help improve water efficient use.
In water scarce regions options to improve water efficiency can vary depending on wealth. Where there is enough investment, water efficiency can be high-tech. In California, farms are installing Advanced Irrigation Systems which use advanced technologies such as Geographic Information Systems (GIS), global positioning systems (GPS), and satellite crop and soil moisture sensing systems to monitor and apply water precisely where it is needed, minimising waste (California Department of Water Resources, 2009).

Review of Current Knowledge
42
California continues to make great strides in increasing the economic value and efficiency of its water use (SIWI, 2012). Elsewhere, particularly in developing countries there is less state money available to implement state-of–the art technology and this may be reflected in the water efficiency of food production. Globalised food companies however are more likely to have funds to invest in the food production stage of the supply chain. Improving farmers’ ability to produce more food with less water makes good business sense and many companies have started to investigate this. However, there is a tipping point where irrigation water efficiency can actually create problems. The Californian Department of Water Resources has calculated that the maximum proportion of applied water that should be expected to convert into agricultural productivity is 85 percent; beyond this reductions in water on the land can lead to soil salinity, soil degradation, and loss of productivity (California Department of Water Resources, 2009). Not all irrigation water has to come from freshwater sources. Depending on the quality of water that is required, and specifically any irrigation standards drainage water, treated urban wastewater, brackish, and desalinated water offer further opportunities for irrigation in conditions of water scarcity. “To this extent, agriculture has been much more accountable for the freshwater that it withdraws and uses” (FAO, 2006). There is significant scope to increase the volume of recycled water in agriculture to relieve the pressure on freshwater sources, and to improve the resilience of agriculture to climate change. According to the FAO (2003) it costs around US$.90 (56 pence) to desalinate 1000 litres of sea water. Whilst this is considerably less than the price of a litre of bottled water, desalination is too expensive for staple food production. Crop choice and farming systems can also influence plant water uptake and thus water productivity. For example, by switching rice cultivation from flood irrigation (which uses very high volumes of water and emits high levels of Greenhouse gasses) to aerobic (oxygenated) conditions, water use can fall by 50 percent, cutting GHG emissions and increasing yields. The consultative Group on International Agricultural Research (CGIAR) has released more than 8000 improved crop varieties during the last 40 years, some of these with drought-resistant characteristics. ‘Climate-smart farming’ is a term coined by the UN FAO. The organisation is clear that “climate-smart farming systems that make efficient use of resources like

Review of Current Knowledge
43
water, land, and energy must become the basis of tomorrow’s agricultural economy”6. Organic Farming
In 1999 20 percent of arable land [in Europe] was engaged in some form of voluntary agri-environmental action and over 2 million ha were devoted to organic farming (Strosser et al., 1999). Organic farming is generally considered to be less water intensive than standard farming. It is also praised for using fewer pesticides, or pesticides that are less soluble and therefore have less impact on the water environment. However, a 2012 study published in Nature (Seufert et al., 2012) reports that organic yields are lower than in conventional farming. Also as artificial products are replaced with natural fertilisers, e.g. animal manure, it can be more difficult to monitor and control nitrate and phosphate concentrations. Knowledge Exchange
Water security, and the specific actions to improve resilience, are complex and multi-faceted and so research, policy, and business sectors are starting to work together to better understand the science of water security. The Water Security Knowledge Exchange Programme (WSKEP) is an initiative in the UK funded by the Natural Environment Research Council to “accelerate the uptake of research and help inform the direction of future science to ensure a sustainable use of water in the future”. One of the WSKEP priorities is water and agriculture. In the irrigated crops sector there is a need for knowledge transfer regarding irrigation techniques and improving application, and research into producing crops with less demand for water focusing on drought resistance and improving quality traits without water use. The emphasis in plant breeding programmes should be on drought resistance. In the livestock sector efforts should focus on more efficient use of water for the washing of plant and machinery, particularly within dairy enterprises, through knowledge transfer initiatives regarding opportunities to capture excess winter waters and making better use of available water. It is not feasible to suggest efficiency savings in drinking water requirements (majority of livestock water consumption).
6 FAO comment at the Bonn 2011 Nexus Conference
Review of Current Knowledge
44
Retailers and Brands
It is in the interest of retailers (i.e. the supermarkets) and major brands to ensure that their product lines and the supply chains which support their business are secure against water risks. They have a key role in influencing and managing activities within their supply chains, as well as maximising water efficiency in their own stores and factories. This part of the food supply chain is in a position to help support water efficient farming methods (and many retails and brand companies do this). They are also in a position to re-assess the implications on water consumption of aesthetic related food ‘quality’ standards, and the implications on water of food losses at the farm site (i.e. food rejected and food lost through on-farm storage methods), storage and transport facilities, food processing sites, and at retail units. Customers
A hidden problem is that farmers have to produce food to take care of both our necessary consumption, and our waste. Big supermarkets offer a wide range of foods, but not all perishable goods can be sold before their expiry date. With consumers increasingly concerned about food safety and demanding high quality fresh produce, this inevitably ends up with food being thrown away even before it is sold and often whilst it is still perfectly good to eat (Lundqvist et al., 2008). The food losses are huge (possibly as much as 50 percent between field and fork, Lundqvist et al., 2008) and are equivalent to huge losses of water. Individuals have the power to limit waste by moderating food shopping habits, avoiding buying more food than is necessary, or more food than can be consumed before it needs to be thrown away. Individuals may also wish to consider the water footprint of their food and drink choices, but footprints should be considered in the context of the water stress or scarcity of the source location (which may also be temporal).

Review of Current Knowledge
45
6 References ADAS (2006) Water use in agriculture: establishing a baseline. Final report for Defra WU0102. ADAS.
California Department of Water Resources (2009) California Water Plan Update 2009. Integrated Water Management. Volume 2. Resource Management Strategies. Available at: http://www.waterplan.water.ca.gov/cwpu2009/index.cfm#volume2
CDP (2013) Moving beyond business as usual. A need for a step change in water risk management CDP Global Water Report 2013. Available at: https://www.cdproject.net/CDPResults/CDP-Global-Water-Report-2013.pdf
Ceres (2010) Murky Waters? Corporate Report on Water Risk http://www.ceres.org/resources/reports/corporate-reporting-on-water-risk-2010
Charlton, M.B., Bailey, A., and Arnell, N. (2010) Water for Agriculture - Implications for Future Policy and Practice. Reviewing and modelling the impacts of climate change on future food production. Stoneleigh Park, Warwickshire: Royal Agricultural Society of England:.
Environment Agency (2008) Water resources in England and Wales – current state and future pressures. http://publications.environment-agency.gov.uk/PDF/GEHO1208BPAS-E-E.pdf
Defra, online. Statistical data set. ENV 15 – Water abstraction tables. Available at: https://www.gov.uk/government/statistical-data-sets/env15-water-abstraction-tables
Defra (2006) Food Industry Sustainability Strategy. Available at: https://www.gov.uk/government/publications/food-industry-sustainability-strategy-fiss
Defra (2009) The future of our farming. Available at:. http://webarchive.nationalarchives.gov.uk/20091006185340/http://defra.gov.uk/foodfarm/policy/farming-future/index.htm
Defra (2011) Water usage in agriculture and horticulture. Results from the farm business survey 2009/2010 and irrigation survey 2010.
Defra (2013) Agriculture in the United Kingdom data sets. Available at: https://www.gov.uk/government/statistical-data-sets/agriculture-in-the-united-kingdom
Falkenmark, M., Lundquist, J., and Widstrand., C. (1989) Macro-scale Water Scarcity Requires Micro-scale Approaches: Aspects of Vulnerability in Semi-arid Development. Natural Resources Forum, 13 (4), 258–267
FAO (2003) Unlocking the Water Potential of Agriculture. Food and Agriculture Organization of the United Nations. http://www.fao.org/docrep/006/y4525e/y4525e00.HTM
FAO (2006) Opportunity Untapped. Water in Agriculture. Food and Agriculture Organization of the United Nations. Available at: www.unwater.org/downloads/media/scarcity/factsheet_wwf_eng.pdf
FAO (2011a) Climate change, water and food security. FAO.
FAO (2011b) The state of the world’s land and water resources for food and agriculture (SOLAW) - Managing systems at risk. Rome: FAO and London: Earthscan
FAO (2012) World Water Day 2012. Water and Food Security 22nd March 2012. FAO.
Hoekstra, A.Y. and Chapagain, A.K. (2008) Globalization of water:: Sharing the planet’s freshwater resources, Oxford: Blackwell Publishing.
Kirby, R.M., Bartram, J. and Carr, R. (2003) Water in food production and processing: quantity and quality concerns. Food Control 14, 283-299.
Lundqvist, J.C., de Fraiture, C. and Molden, D. (2008)Saving Water: From Field to Fork – Curbing Losses and Wastage in the Food Chain. SIWI Policy Brief. Stockholm International Water Institute.
Review of Current Knowledge
46
Mekonnen, M.M. and Hoekstra, A.Y., (2010a). The green, blue and grey water footprint of crops and derived crop products, Value of Water Research Report Series No. 47. UNESCO-IHE: Delft, the Netherlands.
Mekonnen, M.M. and Hoekstra, A.Y. (2010b) The green, blue and grey water footprint of farm animals and animal products, Value of Water Research Report Series No. 48. UNESCO-IHE: Delft, the Netherlands.
Mekonnen, M.M. and Hoekstra, A.Y. (2010c) A global and high-resolution assessment of the green, blue and grey water footprint of wheat. Hydrology and Earth System Sciences, 14(7), 1259−1276.
Mekonnen, M.M. and Hoekstra, A.Y. (2011) National water footprint accounts: The green, blue and grey water footprint of production and consumption, Value of Water Research Report Series No. 50. Delft, the Netherlands: UNESCO-IHE:. Available at: http://www.waterfootprint.org/Reports/Report50-NationalWaterFootprints-Vol1.pdf
OECD ( 2010) Sustainable Management of Water Resources in Agriculture. OECD.
Ridoutt, B.G. and Pfister, S. (2009) A revised approach to water footprinting to make transparent the impacts of consumption and production on global freshwater scarcity. Global Environmental Change 20, (2010) 113–120.
Seufert, V., Ramankutty, N. and Foley, J. A. (2012) Comparing the yields of organic and conventional agriculture. Nature 485, 229-232.
Stockholm International Water Institute (2012.) The Water and Food Nexus: Trends and Development of the Research Landscape. SIWI.
Strosser, P., Pau Vall, M, and Plötscher, E. (1999) Water and agriculture: contribution to an analysis of a critical but difficult relationship. In, European Commission (1999) Agriculture, Environment, Rural Development: Facts and Figures – A Challenge for Agriculture. OOPEC.
UNESCO (2003) World Water Assessment Programme. United Nations World Water Development Report WWDR1: Water for People, Water for Life. UNESCO World Water Assessment Programme. http://www.unesco.org/new/en/natural-sciences/environment/water/wwap/wwdr/wwdr1-2003/
United Nations Industrial Development Organisation (UNIDO) (2004) Pollution from Food Processing Factories and Environmental Protection.
Water Footprint Network, online. Available at: http://www.waterfootprint.org/
Water Footprint Network (2011) The Water Footprint Assessment Manual. Setting the Global Standard. London: Earthscan.
World Health Organisation, online. Fact File on Water Scarcity. Available at: http://www.who.int/features/factfiles/water/water_facts/en/index.html
WRAP (2011a) Freshwater use in the UK: agriculture sector. A sub-sectoral analysis of the use of licensed freshwater resources by agriculture in the United Kingdom. Annex to final report on freshwater availability and use in the UK.
WRAP (2011b) Freshwater use in the UK: manufacturing sector. A sub-sectoral analysis of the use of licensed freshwater resources by agriculture in the United Kingdom. Annex to final report on freshwater availability and use in the UK.
WRAP (2013) Household food and drink waste in the UK 2012 Final Report. Project code: CFP102. http://www.wrap.org.uk/contents/household-food-and-drink-waste-uk-2012 WWF (2008) UK Water Footprint: the impact of the UK’s food and fibre consumption on global water resources. Volume one. Godalming, UK.