water for a healthy country - clw.csiro.au · water for a healthy country sources of critical ......
TRANSCRIPT
Water for a Healthy Country
Sources of critical contaminants
in domestic wastewater
A literature review
Grace Tjandraatmadja and Clare Diaper

Water for a Healthy Country
Sources of critical contaminants
in domestic wastewater
A literature review
Grace Tjandraatmadja and Clare Diaper

The Water for a Healthy Country National Research Flagship is a research partnership between CSIRO, state and federal governments, private and public industry and other research providers.
The Flagship was established in 2003 as part of the CSIRO National Research Flagship Initiative.
The work contained in this report is collaboration between CSIRO and the SmartWater Fund.
Citation: Tjadraatmadja G and Diaper C 2006.Sources of critical contaminants in domestic wastewater – a literature review. CSIRO: Water for a Healthy Country National Research Flagship
© Commonwealth of Australia 2006 All rights reserved. This work is copyright. Apart from any use as permitted under the Copyright Act 1968, no part may be reproduced by any process without prior written permission from the Commonwealth.
DISCLAIMER You accept all risks and responsibility for losses, damages, costs and other consequences resulting directly or indirectly from using this site and any information or material available from it.
To the maximum permitted by law, CSIRO excludes all liability to any person arising directly or indirectly from using this site and any information or material available from it.
For further information contact: Ph: (03) 9252 6000
Fax: (03) 9252 6244
www.csiro.au
Printed Nov. 2006.

Sources of critical contaminants in domestic wastewater iv
Acknowledgements
The authors would like to thank:
the Trade Waste Reference Group,
Dr. R.Taylor,
Dr. R.O’Halloran,
Mr. S.Cook and
Dr. P. Davis from CSIRO for their assistance and insight, and
the Smart Water Fund.

Sources of critical contaminants in domestic wastewater v
Table of Contents
Acknowledgements ................................................................................................ iv Table of Contents..................................................................................................... v 1. Introduction....................................................................................................... 1 2. Critical contaminants ....................................................................................... 2
2.1. Metals...................................................................................................................... 2 2.2. Colour...................................................................................................................... 4 2.3. Total Dissolved Solids and Salinity ......................................................................... 4
3. The contribution of domestic sewage ............................................................ 5 4. The role of catchment composition ................................................................ 9 5. Time distribution patterns ............................................................................... 9 6. Sources of pollutants in domestic wastewater............................................ 10
6.1. The role of householder behaviour on wastewater composition...........................14 6.2. Blackwater.............................................................................................................16
6.2.1. Faeces ..............................................................................................................16 6.2.2. Urine..................................................................................................................18 6.2.3. Perspiration.......................................................................................................21
6.3. Greywater..............................................................................................................21 6.4. Laundry products...................................................................................................24
6.4.1. Laundry Detergents ..........................................................................................24 6.4.2. Laundry softeners .............................................................................................27 6.4.3. Other laundry products .....................................................................................27
6.5. Cleaning products .................................................................................................27 6.5.1. Disinfectants .....................................................................................................27 6.5.2. Bleaches ...........................................................................................................28
6.6. Personal care products (bathroom).......................................................................28 6.6.1. Soaps, shampoo and conditioners ...................................................................29 6.6.2. Suncreens.........................................................................................................32 6.6.3. Deodorants and lotions .....................................................................................32 6.6.4. Oral hygiene......................................................................................................34
6.7. Infrastructure .........................................................................................................36 6.7.1. Materials............................................................................................................36 6.7.2. Copper pipes.....................................................................................................37 6.7.3. PVC...................................................................................................................38 6.7.4. Polyethylene .....................................................................................................39 6.7.5. Vitrified clay.......................................................................................................39 6.7.6. Hot Water Services ...........................................................................................40 6.7.7. Appliances and activities...................................................................................40 6.7.8. The impact of infrastructure ..............................................................................40
7. Conclusions and recommendations............................................................. 42 7.1. Boron.....................................................................................................................42 7.2. Arsenic ..................................................................................................................42 7.3. Copper...................................................................................................................42 7.4. Cadmium ...............................................................................................................43 7.5. Lead.......................................................................................................................43 7.6. Mercury .................................................................................................................44 7.7. Nickel.....................................................................................................................44 7.8. Zinc........................................................................................................................44 7.9. TDS and salts........................................................................................................45 7.10. Colour....................................................................................................................45
8. Major Gaps ...................................................................................................... 47 9. Recommendations for monitoring program ................................................ 47 10. Other substances of concern .................................................................... 49 11. References................................................................................................... 50 12. Appendix 1 - Summary Table of critical contaminants in wastewater ... 56
Sources of critical contaminants in domestic wastewater vi
List of Figures
Figure 1: Estimate of domestic wastewater contaminant load at ETP for 2005/06.......................6
Figure 2: Estimate of domestic wastewater contaminant load at WTP for 2005/06.....................8
Figure 3: Contaminant loads in greywater from 3 households in Adelaide.................................12
Figure 4: Contaminant sources in the household .......................................................................13
Figure 5: Stabiliser migration from new PVC pipe in stagnant water ..........................................39
List of Tables
Table 1: Average concentration of contaminants in residential sewage catchments....................9
Table 2: Net contribution of contaminants in an Australian household .......................................14
Table 3: Critical contaminants in anthropogenic residues ..........................................................17
Table 4: Minor components in urine............................................................................................19
Table 5 : Urine composition ........................................................................................................20
Table 6: Concentrations of critical contaminants in mixed source greywater .............................22
Table 7: Components of laundry products ..................................................................................25
Table 8: Concentrations of critical contaminants in laundry greywater .......................................26
Table 9: Bleaches and stain removers and active ingredients....................................................28
Table 10: Concentrations of critical contaminants in bathroom greywater .................................29
Table 11: Personal care products and their components ...........................................................30
Table 12: Suncreens and their active components.....................................................................32
Table 13: Deodorant composition ...............................................................................................33
Table 14: Moisturiser lotion composition.....................................................................................33
Table 15: Typical ingredients used in toothpaste........................................................................34
Table 16: Composition of common oral hygiene products..........................................................35
Table 17: Load for activities in a hard water catchment..............................................................40
Table 18: Summary of potential contaminant sources................................................................46
Sources of critical contaminants in domestic wastewater vii
Executive summary
This document is the first stage of the Smart Water Round 3 – Project 5 Household sources of critical contaminants in domestic wastewater conducted in collaboration between CSIRO and the SmartWater Fund. The aim of the overall project is to elucidate the contribution that domestic wastewater has on wastewater quality and the potential sources of critical contaminants from households with the objective of identifying potential source reduction methods for identified contaminants. The project incorporates four main components:
1. Literature review of identified critical contaminant sources in domestic wastewater.
2. Analysis of wastewater at different locations in the sewer network.
3. Survey of householder product usage.
4. Modeling of future changes in urban population, product and water use to gain an understanding of the impact of these changes on domestic wastewater quality.
This document reviews the literature on domestic wastewater, blackwater and greywater and investigates the contribution that infrastructure, householders and household products have on the load of critical contaminants and evaluates their impact on domestic wastewater composition.
Household wastewater was evaluated for the critical contaminants: Total dissolved solids, colour, arsenic, copper, cadmium, lead, mercury, nickel and zinc. Information on boron was also included as it is an emerging contaminant. For each of these contaminants a brief summary of potential environmental and human health impacts is given, in addition to literature data on normal environmental concentrations where available.
To gain further understanding of potential contaminant sources, a brief description and evaluation of the most common personal care, cleaning products and materials used in household infrastructure is presented.
Additionally, a brief description of emerging contaminants is given as their persistence and potential impact on the environment which arise from the increasing use of pharmaceutical, antibacterial and household products.
Data on household wastewater shows high variability in diurnal, weekly and seasonal readings, as it is affected by local and household characteristics, such as water supply quality, household infrastructure and householder lifestyle. Therefore, in the evaluation of literature data, caution is needed when comparing data from collected from different geographical locations.
A small number of studies exist on the quality of wastewater collected in domestic catchments and at household level in Australia (Connor and Wilkie 1995 , Lock 1994, McCormick 1991). Studies conducted overseas and in Australia investigating blackwater alone, have an emphasis on treatment, nutritional value and toxicity for direct re-use of the waste in agriculture and so focus on chemical parameters such as nitrogen, phosphorous and biological and chemical oxygen demand. Hence, limited data is available on colour and salt content of blackwater.
A number of studies have investigated Australian greywater quality although, as with blackwater, most focus on the performance of treatment technologies and potential impacts for human health and few have focused on the metal and salt content of the stream. Existing values for contaminants are reported. The studies conducted in Australia, indicate that greywater appears to be the major source of metal contaminants in the household. Major inputs of lead appear to originate from the laundry and the bathroom. Zinc was attributed to the bathroom, although faeces could also be a source and some overseas studies suggest a relation with infrastructure. TDS comes from a range of diffuse sources with the majority of household cleaning and personal care products containing salts of sodium in their formulation. Blackwater appears to also be an equally important source of TDS. Nickel, mercury and arsenic concentrations observed at the household level were near detection limits so identification of

Sources of critical contaminants in domestic wastewater viii
their sources is not yet conclusive and more data is required on boron in the household. The major sources identified for copper were the plumbing and the water supply.
Sources of critical contaminants in domestic wastewater 1
1. Introduction
The major input streams that characterise wastewater flows and quality are:
Domestic wastewater from residential areas. There is limited knowledge of the actual characteristics and background concentration of contaminants in domestic wastewater due to the heterogeneity and large number of sources.
Small business and commercial dischargers, such as health clinics, food establishments and other enterprises.
Trade waste, which includes small, medium and large industries categorised as trade waste due to volume of discharge, type of activity and/or quality of discharge which may or may not include prescribed substances.
Infiltration and inflow, the contribution of groundwater infiltration and stormwater inflow into the system during dry and rainwater events.
In the current times, due to reduced rainfalls, climate change and population growth, new patterns of water use are occurring as water conservation and alternative water servicing measures such as, water recycling, greywater reuse and sewer mining, are implemented. In addition, changes in demographics, water use patterns, economic status, public health issues and product diversity increase the range and concentration of novel and critical compounds in wastewater, impacting on its quality, wastewater treatment, and potential for effluent and biosolids reuse.
Traditional end-of-line treatment processes at the wastewater treatment plant (WWTP) have limited capacity to adapt to emerging challenges arising from disposal and reuse of the waste streams. In order to find more sustainable ways to deal with wastewater management it is necessary to gain a better understanding of wastewater and the origin of contaminants within the sewerage system.
Wastewaters entering WWTPs have been widely characterised with detailed information on volumetric flow, patterns and composition available. However, limited data is available on the contribution of the individual streams that form wastewater, particularly domestic wastewater and the sources of contaminants at the household level (Jefferson et al., 2003 in Palmquist and Jönsson 2003).
Additionally, there are often discrepancies between measured and estimated volumes and loads. These discrepancies are often attributed to illegal connections and infiltration. However, the estimation methodology may be a source of discrepancy, as the large variations in water use and contaminants flows may not follow traditional normal distributions and so use of mean or average values may introduce error. By investigating domestic wastewater and the sources of critical contaminants, there is potential for understanding the processes that lead to their ingress into wastewater and for evaluating a wider range of integrated management strategies, decreasing the reliance on end-of-line treatment alone.
This review investigates the potential sources of critical contaminants (metals and salts) in households, their contribution to domestic wastewater and the overall quality of wastewater at the treatment plant. A summary of other potential contaminants of concern is also provided.

Sources of critical contaminants in domestic wastewater 2
2. Critical contaminants
Sewage ‘critical pollutants’ or ‘critical contaminants’ are substances that could endanger public health, cause damage to the sewerage system, adversely impact sewage treatment, the environment and/or prevent the recycling of effluent and biosolids. The sewage critical pollutants as defined by metropolitan Melbourne water utilites are Total Dissolved Solids (TDS), colour, copper, nickel, zinc, cadmium, mercury, lead and arsenic. Additionally, boron is deemed a contaminant of potential interest due to its load at the Western Treatment Plant.
Control of TDS is essential for wastewater treatment plants to achieve the Victorian Government’s targets for effluent reuse in irrigation and reduction in water consumption.
Wastewater treatment results in the concentration of metals, such as copper, zinc, cadmium, mercury and arsenic in the sludge. The partitioning into sludge varies with the treatment process, but typically 70-75% of incoming copper, cadmium, mercury and zinc, 40% of nickel and 80% of lead are removed in the sludge after treatment (Tjandraatmadja and Burn, 2005).
Control of metal contaminants is required to facilitate reuse of biosolids from Melbourne’s two major treatment plants.
2.1. Metals
Metals such as copper, chromium and zinc are micro-nutrients to plant development, however they can be toxic to plants when present at high concentrations. Plants are also able to adsorb contaminants, such as heavy metals, and store them in roots and foliage, resulting in bioaccumulation in the food chain. As a result, biosolids reuse options can be compromised by the metal load in the environment. The major contaminants are described in this section.
Arsenic Arsenic (As) is a naturally occurring compound found in rocks and in soil in trace amounts. It is present in metallic and non-metallic state as trivalent (As3+), inorganic (As0) and pentavalent (As5+) states and is commonly found as arsenic sulphide in ores and metal arsenates (V) in water. Arsenic in water is mainly attributed to dissolution of natural arsenic compounds present in soil and ores or to anthropogenic sources. The solubility of arsenic compounds is dependent on its oxidation state and solubility increases with increasing pH. (http://www.who.int/water_sanitation_health/dwq/chemicals/arsenic.pdf). Arsenic compounds are also used in the manufacture of wood preservatives, some fungicides, pesticides and in industrial activities such as in the fabrication of transistors, lasers and semiconductors, glass, pigments, textiles, paper, hide tanning and metal adhesives.
Typically, the arsenic concentrations detected worldwide in the environment are low, ranging between 3 to 200 ng/ m3 in air, 1-2g/L in natural waters (Hindmarsh & McCurdy, 1986; US NRC, 1999 in WHO 2003a). Higher levels have been reported in waters passing through areas of rich natural sources and near mining and agrochemical industry areas (US NRC, 1999 in WHO 2003a).
Copper
Copper (Cu) is an essential nutrient at low concentrations, aiding the production of plant enzymes and human metabolism. It is present in Australian soils at concentrations ranging from 0.4 to 412mg/kg and is phytotoxic in nutrient solutions ranging from 0.1 to 1.0mg/L.

Sources of critical contaminants in domestic wastewater 3
Copper compounds are commonly used in household and industrial products such as fungicides, algaecides, insecticides, wood preservatives, azo dies, in electroplating, engraving, lithography, petroleum refining, water treatment (copper sulphate pentahydrate), food additives (US FDA, 1994 in WHO 2004) and pyrotechnics. Copper pipes are favoured in household plumbing because of their durability.
Cadmium
Cadmium (Cd) is a rare metal and is present as only 0.2mg/kg of the Earth’s crust (WHO 2000a). Its presence in wastewater is largely attributed to human activity and is widely used in the manufacture of iron and steel, cadmium-nickel batteries, electronic components, communications equipment, in power generation, fossil fuel combustion, including coal, and cement manufacture. It can also be found as an impurity in galvanized pipes, fittings, taps and water heaters, coolers and solder (NHMRC 2004). Concentrations in Australian drinking water supplies are rarely above 0.002 mg/L (NHMRC 2004).
Lead
Lead (Pb) concentrations in natural environments are generally low. It is found in rocks, coal and sediment as immobile lead salts of poor water solubility. It is commonly encountered in urban environments due to the pollution by alkyl lead additives via automobile fuel combustion. Industrial activities such as iron and steel manufacture, coal combustion and copper smelting are also important contributors to dispersion of lead into the atmosphere (WHO 2001). Additional anthropogenic sources include lead in plumbing and flashing, in solder at pipe joints in old houses, dust from lead based paint commonly used prior to 1980, batteries, release from ceramic glazes, cosmetics, alloys, cable sheathing, rust inhibitors, ammunition, glazes and plastic stabilisers (WHO 2001, NHMRC 2004).
Lead is retained by most soils, particularly in the top soil, reducing its availability to plants (ANZMFWD 2001). However, toxicity has been observed at nutrient solutions of 10mg Pb/L to plants and for higher organisms
Mercury
Mercury (Hg) is present in the environment in three forms, as a metal (Hgo) and as inorganic or organometallic complexes of Hg+(I) and Hg+2(II). It is emitted from the environment through degassing and re-evaporation of the earth’s crust as Hgo and is produced by mining and smelting of cinnabar ore. Concentrations in natural waters are low with overseas studies reporting a high of 0.0055 mg/L in wells in Japan. Mercury is used in the manufacture of chloroalkali, batteries, electrical switches, as catalysts for chemical reactions (WHO 2000b), in dental amalgam, as an anti-fouling agent in old paint, thermometers, lamp bulbs, pesticides, wood preservatives, antibacterial soaps and products, embalming fluid, mercury silver tin alloys and silver mirrors. In Australian drinking water, the concentration of Hg is up to 0.001mg/L, and is on average less than 0.0001 mg/L (NHMRC 2004).
Nickel
Nickel (Ni) is present in environment in the form of nickel oxides, complexes with sulphides, hydroxides, chlorides and ammonia (ATSDR, 1995 in CE2002, WHO 2005). It is also found in stainless steel, coins, non-ferrous alloys, alloys used in food processing and sanitary installations, pipes, fittings, electroplating, rechargeable batteries and protective coatings, pigments, electronic products, nickel-cadmium batteries and in emissions from fossil fuel combustion (WHO 2005b). In Australian reticulated water, the concentration of Ni is up to 0.03mg/L, and is on average less than 0.01 mg/L (NHMRC 2004).
Zinc
Zinc (Zn) is an essential nutrient for plants and other higher organisms and is present in the form of salts in food, water and is readily available in acidic conditions (pH<6). Zinc is present in

Sources of critical contaminants in domestic wastewater 4
the environment at doses that are harmless to humans but it is toxic to plants at concentrations > 4 - 6.5mg/L.
Zinc is used in the manufacture of brass, as a coating to protect stainless steel and iron products, in the manufacture of paint and rubber products, including tyres as zinc oxide and in the some cosmetics.
Levels of zinc in surface water and groundwater normally do not exceed 0.01mg/litre, respectively, but concentrations in tap water range from an average of 0.05 to 0.26mg/L as a result of dissolution of zinc from fittings and pipes. (http://www.who.int/water_sanitation_health/dwq/chemicals/zinc/en/ and NHMRC 2004)
2.2. Colour
The visual appearance of water/effluent is related to the combined effect of a range of water characteristics measured via parameters such as turbidity, particle size, metal concentration and colour measurements. Defining the term colour or discoloration of water/wastewater is complex, as it depends on the measurement system used and it can refer to a range of appearance parameters ranging from whiteness, brown, black, yellow coloration and visible suspended matter (Slaats et al,2003).
Colour is included among the parameters of concern for two reasons; effluent discharged to sea often produces a plume of different coloration from the receiving waters, impacting visual acceptability and public perception and colour of recycled water for household or industrial uses is also an issue. Whether the poor visual acceptability is due to colour or turbidity or a combination of both parameters has not been verified.
Turbidity is a measurement of the “light scattering properties” of water/wastewater caused by organic and inorganic suspended and colloidal matter in water. It is measured in NTU (Nephelometric turbidity units) using a turbidity meter, however different readings can be obtained using different kinds of meters (Slaats, 2000 in Slaats et al., 2003, APHA/AWWA 1998, p.2-8).
The colour of a solution “as received”, i.e. with all the suspended and colloidal matter contained in it, is defined as “Apparent Colour”. After filtration or centrifugation of the solution the measurement is the “True colour”.
Colour measurements are commonly expressed as milligrams per litre platinum- cobalt (mg/L Pt-Co). This is measured by comparing the colour of a sample to the colour produced by a 1mg of platinum/L chloroplatinate ion standard (APHA/AWWA1998). The platinum-Co method is commonly used for measurement of colour derived from natural matter but may not be appropriate for characterisation of wastewaters due to differences in colour and hue. The spectrometric method and the Tristimulus Filter method which measure true colour as cie X-Y-Z coordinates may be considered more suitable for wastewater samples (APHA/AWWA, 1998).
Turbidity and pH interfere with the reading of the true colour of a solution and need to be controlled.
The causes of colour formation in wastewater are varied. It can be caused by excessive aeration or excess calcium carbonate, metal particles such as copper, iron, manganese, natural organic matter, humic acids, industrial discharges, suspended or colloidal matter, corrosion of metal pipes (steel, iron, copper, manganese), sedimentation of iron particles present in source water, suspended organic matter and inorganic matter (Slaats et al 2003).
2.3. Total Dissolved Solids and Salinity
The Total Dissolved Salts or Solids (TDS) is an overall measure of the total dissolved matter in water and is commonly correlated to Electrical conductivity (EC). It includes positive and negative ions, such as dissolved chloride, sulphate, phosphate, carbonate, bicarbonate,

Sources of critical contaminants in domestic wastewater 5
sodium, calcium, magnesium, potassium and other inorganic and organic matter. TDS is a critical contaminant because it is commonly used in the water industry as a general indicator of salinity. Salinity is an important factor affecting the beneficial reuse of effluent for irrigation and can also impact the quality of fresh water streams. For effluent reused in irrigation, the two main water quality parameters that affect the soil properties are salt content and sodium absorption ratio. A high salt content in water can increase the salinity of the soil and hence affect the growth and productivity of plants and/or crops, whilst the sodium adsorption ratio (ratio of sodium to calcium and magnesium ions) is an indication of sodicity which can affect the soil compaction and water conductivity (ANZECC/ARMCANZ 2000). Sodium is a common element with widespread distribution as salts and characterised by high solubility. Natural sources include saline water intrusion, windborne spray and run-off and the range of anthropogenic sources is extensive as sodium is used in the manufacture and present in the majority of modern day products, including paper, glass, soap, pharmaceuticals, food industry and the general chemical industry.
TDS values in the water supply of major Australian cities range from about 45 mg/L to 750 mg/L (NHMRC 2004). In major Australian reticulated supplies, sodium concentrations range from 3 mg/L to 300 mg/L, with a typical value of 50 mg/L. However, concentrations vary markedly (NHMRC 2004). Sodium median values reported at the Melbourne WWTP were 1026mg/L at Werribee and 640 mg/L at Carrum (Melbourne Water 2005).
3. The contribution of domestic sewage
Whilst it is known that domestic wastewater is the main source of the nitrogen load reaching the wastewater treatment plant (Metcalf and Eddy 1998), the contribution of domestic wastewater to other contaminant loads at treatment plants is still under investigation worldwide (Eriksson et al, Comber and Gunn 1996, Singh et al 2005, Palmquist and Hanæus 2005, Rule et al 2006, Sörme and Lagerkvist 2002, Wilkie et al 1996).
With increased environmental legislation and reduction of limits for industrial discharges to sewage, the contribution of non–industrial sewage streams: domestic wastewater, run-off and commercial sources, comes under increased scrutiny. This has been exemplified in Europe (UK, Netherlands, Sweden), where control of air and trade waste emissions in the last 2 decades has resulted in significant reduction of heavy metals from industrial sources (Icon 2001). In Stockölm, Sweden, industrial sources now contribute to less than 4% of the total heavy metal load in sewage and in Gothenburg minor enterprise dischargers are responsible for less than 3% of the loads of zinc, mercury, nickel, cadmium and chromium, for 6% of the copper load and only 12% of the lead load (Mattson et al in Sörme et al 2003). Instead, stormwater run-off and domestic sewage have been identified as the major sources for many metals such as copper, lead and zinc (Icon 2001, Becker and Gray 2000).
Other data also highlight the importance of domestic sewage on total loads. In a US study, one third of copper, chromium and cadmium received at WWTP came from domestic sources (Davis and Jacknow 1975 in Lock 1994).
In a study in Adelaide in 1992, domestic sewage was deemed a significant contributor to the load of copper and zinc at the treatment plant (Lock 1994). However the levels of cadmium, mercury, arsenic and boron verified in domestic wastewater were not as significant (Lock 1994).
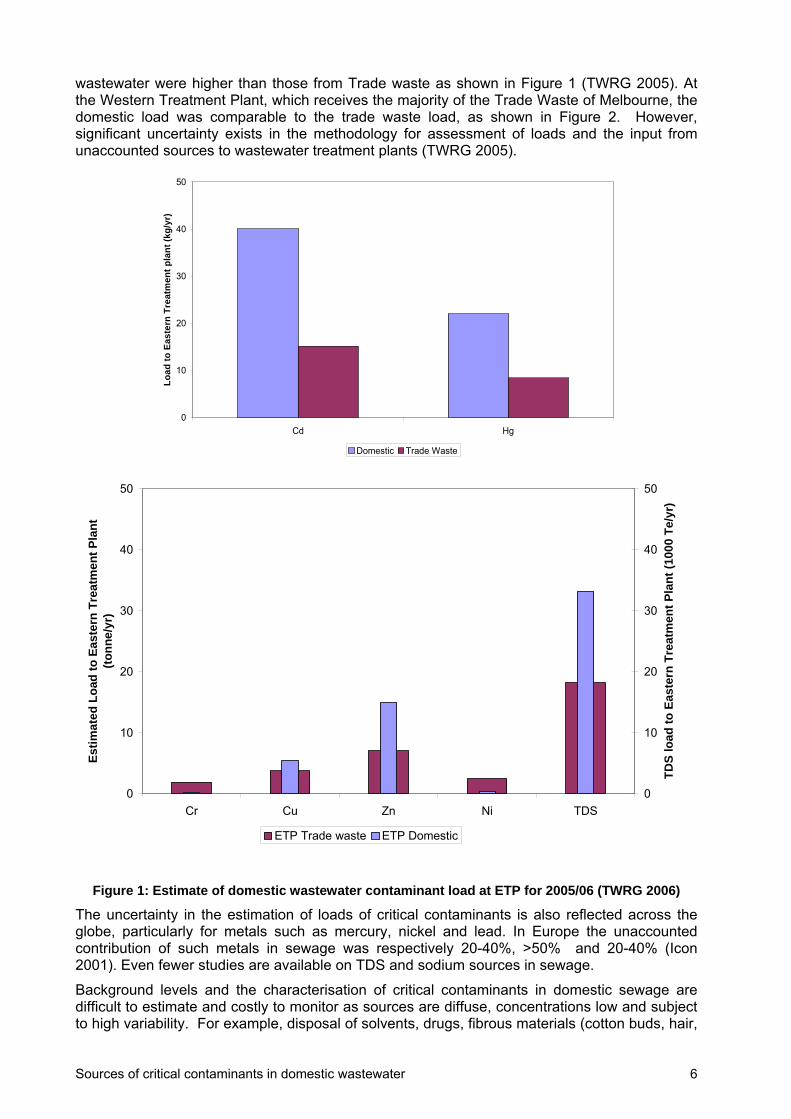
Recent desktop assessments by Melbourne’s water utilities indicate that domestic sewage contributes not only to copper and zinc, but also to a significant proportion of the cadmium, mercury and TDS load at the two major Melbourne sewage treatment plants, and additionally to the load of arsenic, boron and lead at the Western Treatment Plant as seen in Figure 1 and Figure 2 . At the Eastern Treatment plant, which has a larger representation of domestic dischargers, the loads of cadmium, mercury, copper, zinc and TDS attributed to domestic
Sources of critical contaminants in domestic wastewater 6
wastewater were higher than those from Trade waste as shown in Figure 1 (TWRG 2005). At the Western Treatment Plant, which receives the majority of the Trade Waste of Melbourne, the domestic load was comparable to the trade waste load, as shown in Figure 2. However, significant uncertainty exists in the methodology for assessment of loads and the input from unaccounted sources to wastewater treatment plants (TWRG 2005).
0
10
20
30
40
50
Cd Hg
Lo
ad
to
Eas
tern
Tre
atm
ent
pla
nt
(kg
/yr)
Domestic Trade Waste
0
10
20
30
40
50
Cr Cu Zn Ni TDS
Est
imat
ed L
oad
to
Eas
tern
Tre
atm
ent
Pla
nt
(to
nn
e/yr
)
0
10
20
30
40
50
TD
S l
oad
to
Eas
tern
Tre
atm
ent
Pla
nt
(100
0 T
e/yr
)
ETP Trade waste ETP Domestic
Figure 1: Estimate of domestic wastewater contaminant load at ETP for 2005/06 (TWRG 2006)
The uncertainty in the estimation of loads of critical contaminants is also reflected across the globe, particularly for metals such as mercury, nickel and lead. In Europe the unaccounted contribution of such metals in sewage was respectively 20-40%, >50% and 20-40% (Icon 2001). Even fewer studies are available on TDS and sodium sources in sewage.
Background levels and the characterisation of critical contaminants in domestic sewage are difficult to estimate and costly to monitor as sources are diffuse, concentrations low and subject to high variability. For example, disposal of solvents, drugs, fibrous materials (cotton buds, hair,

Sources of critical contaminants in domestic wastewater 7
sanitary products), oil, grease and grit (dirt, coffee grounds) via the sewer system still occurs, despite control strategies and attempts to educate the public on proper disposal methodologies. Different conclusions arise from the limited studies conducted on sewage in regards to the relative contribution of domestic blackwater and greywater streams, and the input from run-off (Rule et al 2006, Vinneras 2001, Comber and Gunn 1996, Wilkie et al 1996, Chino et al 1991, Moryama et al 1989 in Icon 2001, Sörme et al 2003, Icon 2001). For example, in the case of cadmium the following were identified as the major household sources in 4 different studies:
Greywater 83.5% of total cadmium load (Bathroom 39.5%> Kitchen 27.5%> Laundry 16.5%), whilst blackwater was estimated to contribute 16.5% of the load (Gray and Becker 2002);
In a UK study, major sources were identified to be, in decreasing order, Faeces >bath water>laundry>tap water>kitchen (WRC 1994 in Icon 2001);
Whilst major domestic inputs at Shrewsbury WWTS in the UK were identified as: Faeces 20%>washing machine 4.6%>dishwashing 4.6%>Bathing 2.6% (WRc 1994 in Icon 2001)
Household: Bathroom 38%, Tap water 22%, faeces 20%, laundry 14%, kitchen 6% (Chino et al 1991) (Japan)
This highlights the variability of wastewater quality depending on local and household characteristics such as water usage, water quality, local infrastructure and household habits and the need to understand the context of each dataset.
Additionally, stormwater run-off, exfiltration and infiltration inputs are also likely to affect the total load in residential catchments. In a modelling simulation, Gray and Becker (2002) examined a residential catchment based on the water consumption and climate characteristics of Perth and estimated that stormwater contributed 40% of the copper load and 75% of the lead load in the sewage of the residential catchment. However, as the composition of the run-off is strongly influenced by local pollution conditions, results from different areas are likely to depend on site specific traffic and air pollution ( Rule et al 2006, Galloway 2006).
These results indicate that a range of factors affect the sewage quality, including infrastructure age, water supply, activity, occupancy and business type.

Sources of critical contaminants in domestic wastewater 8
0
10
20
30
40
50
60
Cd Hg
Lo
ad t
o W
este
rn T
reat
men
t p
lan
t (k
g/y
r)
Domestic Trade Waste
0
10
20
30
40
50
60
70
B Cr Cu Zn Ni As TDS
Lo
ad t
o W
este
rn T
reat
men
t p
lan
t (t
on
ne/
yr)
0
10
20
30
40
50
60
70
TD
S l
oad
to
Wes
tern
Tre
atm
ent
pla
nt
(100
0 T
e/yr
)
Domestic Trade Waste
Figure 2: Estimate of domestic wastewater contaminant load at WTP for 2005/06 (TWRG 2006)
Sources of critical contaminants in domestic wastewater 9
4. The role of catchment composition
Catchment land use type (residential, commercial, industrial) has an impact on sewage quality as examined in Rule et al (2006) and Pantsar-Kallio et al (1999). Rule et al (2006) evaluated sewage quality in different catchment types in the UK: light industrial, new housing estate (5 years old), 1960s housing estate, and two predominantly commercial catchments with a mix of businesses: hairdressers, dry cleaners, doctor surgeries, dentists, restaurants and offices. In their evaluation, concentrations of domestic and commercial sewage were similar in range for all metals (Cd, Cr, Cu, Hg, Ni, Zn and Pb), whilst light industrial estates had higher concentrations of Cr, Cu , Pb and Zn than domestic or commercial samples.
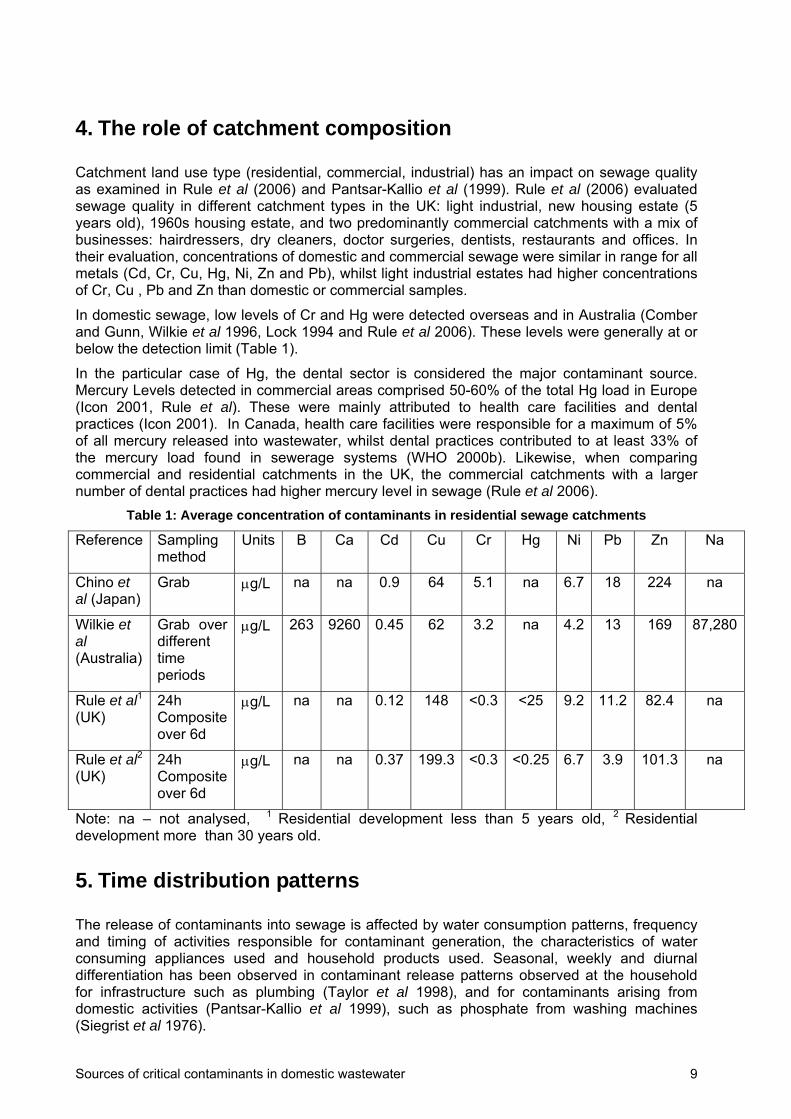
In domestic sewage, low levels of Cr and Hg were detected overseas and in Australia (Comber and Gunn, Wilkie et al 1996, Lock 1994 and Rule et al 2006). These levels were generally at or below the detection limit (Table 1).
In the particular case of Hg, the dental sector is considered the major contaminant source. Mercury Levels detected in commercial areas comprised 50-60% of the total Hg load in Europe (Icon 2001, Rule et al). These were mainly attributed to health care facilities and dental practices (Icon 2001). In Canada, health care facilities were responsible for a maximum of 5% of all mercury released into wastewater, whilst dental practices contributed to at least 33% of the mercury load found in sewerage systems (WHO 2000b). Likewise, when comparing commercial and residential catchments in the UK, the commercial catchments with a larger number of dental practices had higher mercury level in sewage (Rule et al 2006).
Table 1: Average concentration of contaminants in residential sewage catchments
Reference Sampling method
Units B Ca Cd Cu Cr Hg Ni Pb Zn Na
Chino et al (Japan)
Grab g/L na na 0.9 64 5.1 na 6.7 18 224 na
Wilkie et al (Australia)
Grab over different time periods
g/L 263 9260 0.45 62 3.2 na 4.2 13 169 87,280
Rule et al1
(UK) 24h Composite over 6d
g/L na na 0.12 148 <0.3 <25 9.2 11.2 82.4 na
Rule et al2 (UK)
24h Composite over 6d
g/L na na 0.37 199.3 <0.3 <0.25 6.7 3.9 101.3 na
Note: na – not analysed, 1 Residential development less than 5 years old, 2 Residential development more than 30 years old.
5. Time distribution patterns
The release of contaminants into sewage is affected by water consumption patterns, frequency and timing of activities responsible for contaminant generation, the characteristics of water consuming appliances used and household products used. Seasonal, weekly and diurnal differentiation has been observed in contaminant release patterns observed at the household for infrastructure such as plumbing (Taylor et al 1998), and for contaminants arising from domestic activities (Pantsar-Kallio et al 1999), such as phosphate from washing machines (Siegrist et al 1976).
Sources of critical contaminants in domestic wastewater 10
A warmer weather is often also associated with more outdoor activities such as gardening, which could potentially impact householder activities and contaminant loads according to Pantsar-Kallio et al (1999). They verified that wastewater collected in warm wether had high levels of BOD, COD, TSS, TOC, P, N, NH4, K, Ca, Co, Sn and Mn, whilst in cool and rainy weather those inputs were lower, whilst the concentration of Cr, B, Pb and Sn increased (Pantsar-Kallio et al 1999). Although run-off and inflow could have contributed to such increase.
In the UK, higher metal inputs for Cd, Cr, Pb, Ni, Cu and Zn have been detected on the Monday and Tuesday for commercial and light industrial catchments, caused by contaminant build-up in the plumbing from the lower weekend activity (Rule et al 2006). Likewise, increased copper levels in sewage after periods of water stagnation in copper pipes was also observed in Melbourne catchments and related to corrosion of copper pipes (O’Halloran et al 2001 and 2002).
In residential catchments, the lifestyle of the residents plays a significant role on the concentration of pollutants. A Melbourne study verified a peak in contaminant load and activity on Sunday morning (Wilkie et al 1996), whilst in a UK study, the concentration of metals was consistent throughout the week, with high readings of Pb, Ni and Cr observed in an older estate on the Friday, possibly caused by the greater use of appliances such as washing machines and dishwashers at this time (Rule et al 2006).
Families with active lifestyles, eg. sports, are also more likely to use the laundry and washing machines more frequently and also to have more dirt and particulate matter in the washing. Larger families also tend to use appliances such as the dishwasher more frequently (Weegels and van Veen 2001).
6. Sources of pollutants in domestic wastewater
Domestic wastewater is the combination of 2 major waste streams:
Greywater water from the kitchen sink, laundry, bath, and
Blackwater, water from discharged from toilets.
The composition and volumes of domestic sewage from individual households are generally not monitored by water authorities, instead they are estimated based on studies conducted for specific contaminants and on water consumption (Wilkie et al 1996).
Pollutants detected in domestic sewage arise from 4 major sources:
Water supply
Materials used in household infrastructure and plumbing
Anthropogenic waste
Household practices and products used in daily activities.
Household infrastructure is defined as the plumbing, fixtures and equipment used for the delivery of water and collection of wastewater in the household. This includes:
Household pipes used for supply of water;
Fittings, such as taps, hot water storage systems, sinks;
Household pipes and fittings used for collection of wastewater.
Contaminants from household infrastructure can arise from passive transport or migration from household materials to water, or from corrosion of metal components.
Anthropogenic or human sources are defined as the human activities that are responsible for wastewater generation. These include:
Waste excretion by metabolic processes (faeces, urine, perspiration);
Sources of critical contaminants in domestic wastewater 11
Waste generation by householder activities and behaviour, such as food preparation, grooming, bathing and cleaning.
Contaminants within households vary with household water consumption, infrastructure and activities. Household sources (kitchen, bathroom, laundry, toilet, outdoors) have been evaluated experimentally and in simulations in a limited number of overseas and Australian studies (Chino et al 1991, Gray and Becker 2002, Lock 1994, Palmquist and Hanæus 2005, Sörme et al 2003, Comber and Gunn 1996).
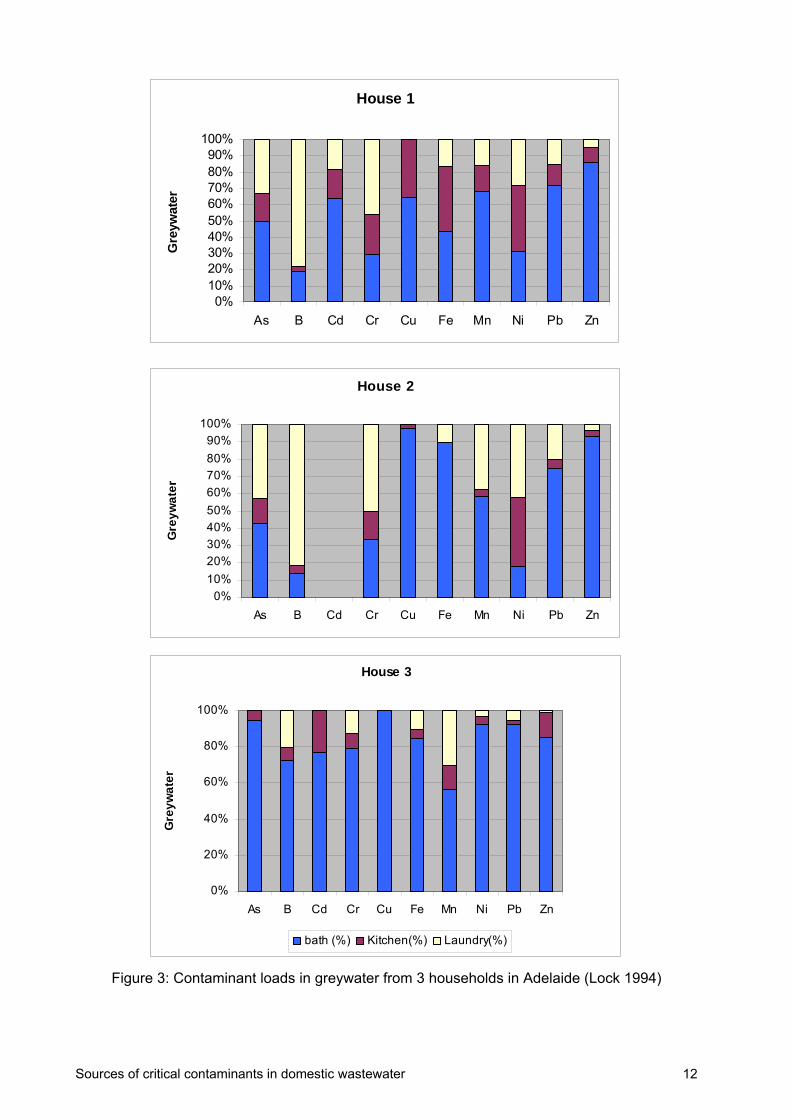
The pollutants generated by anthropogenic activities are influenced by the type of products adopted in the household, the amount and frequency used, the householder’s habits, their diet and the use of household appliances such as washing machines and dishwashers, as well as their age. Evaluation of the contribution of each stream has been undertaken in different studies, but results are subject to high variability, as seen for 3 households in Adelaide in Figure 3, although generally the kitchen greywater contains less metal contamination compared to bathroom and laundry waters.
Sources of critical contaminants in domestic wastewater 12
Figure 3: Contaminant loads in greywater from 3 households in Adelaide (Lock 1994)
House 1
0%10%20%30%40%50%60%70%80%90%
100%
As B Cd Cr Cu Fe Mn Ni Pb Zn
Gre
ywat
er
House 2
0%
10%
20%
30%
40%
50%
60%
70%
80%
90%
100%
As B Cd Cr Cu Fe Mn Ni Pb Zn
Gre
yw
ate
r
House 3
0%
20%
40%
60%
80%
100%
As B Cd Cr Cu Fe Mn Ni Pb Zn
Gre
yw
ate
r
bath (%) Kitchen(%) Laundry(%)

Sources of critical contaminants in domestic wastewater 13
Water supply plays a critical role to many contaminants in sewage. In a 1997 study, the water supply in Melbourne was estimated to be a major contributor to contaminants in domestic sewage (Wilkie and Connor 1997) contributing to:
more than 60% of the level of Ca and Pb in domestic sewage;
between 25-60% of B, Cu, Fe, Mg, Ni and Zn in domestic sewage;
less than 25% of K and Na from the water supply; and
Cd, Hg and Sn were not detected in Melbourne’s water supply and are assumed to come from the distribution system or households (Wilkie et al 1996).
Alternative water supplies, such as galvanised rainwater tanks, could also affect the content of nickel and cadmium in water. Studies in Australia (Coombes et al., 2000; Thomas and Greene, 1993) and overseas (Gromaire et al., 2001; Simmons et al., 2001) have found heavy metals from roof runoff being delivered to the rainwater tanks and accumulating in the sludge (Coombes et al., 2000; Gardner et al., 2004). Recent studies have found levels of > 0.01 mg/L Pb in water supplied from 9 urban tanks in Melbourne (Magyar, 2006).
The impact of water quality on infrastructure is also significant, for example areas subject to hard water conditions and low residual chlorine are also more prone to copper corrosion (Taylor et al 1998).
Comparison of metal loads from water supply and other streams, concluded that greywater was responsible for the majority of the metals in household wastewater (Vinneras 2001 in Sweden, Chino et al 2001 in Japan, Lock 1994 and Gray and Becker 2002 in Australia). In a study of Japanese households, bathwater was the major source of most metal contaminant inputs. Kitchen waste, faeces and urine represented less than 30% of each metal discharged (Figure 4 Chino et al 2001). This data correlates with Adelaide data (Lock 1994) in which Pb, Zn and Cu loads originate mainly from the bathroom greywater.
22 23
47
28
2015
7
23
3841
44
25
5
78
62
43
14
15
7
37
8
1
7
226
9
1
8
7
1
4
420
12
1 2
60
3
20
8
0%
20%
40%
60%
80%
100%
Cd Ni Pb Cr Mn Cu Zn Fe
Ho
use
ho
ld L
oad
(%
)
Faeces
Kitchen
Laundry
Bath
Tap
Figure 4: Contaminant sources in the household (Chino et al 2001)
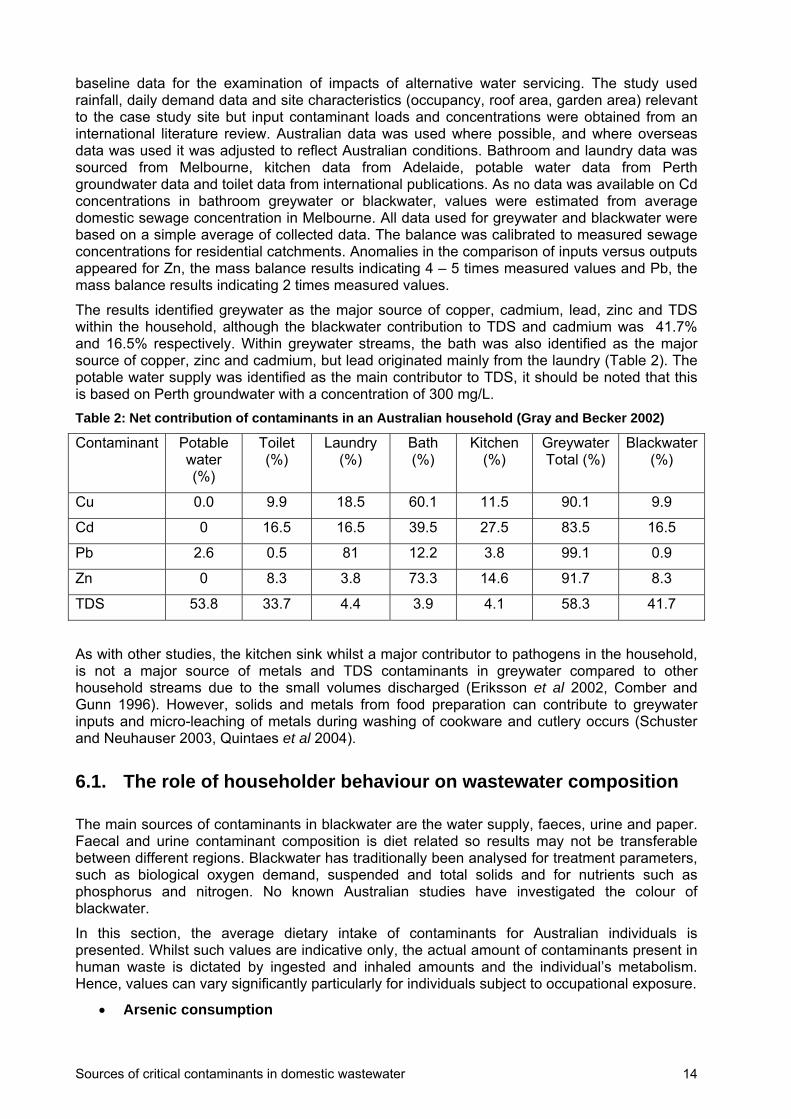
Gray and Becker (2002) carried out a contaminant balance for copper, cadmium, lead, zinc and TDS for a conceptual development in the suburb of Ellendale, in Perth in order to provide
Sources of critical contaminants in domestic wastewater 14
baseline data for the examination of impacts of alternative water servicing. The study used rainfall, daily demand data and site characteristics (occupancy, roof area, garden area) relevant to the case study site but input contaminant loads and concentrations were obtained from an international literature review. Australian data was used where possible, and where overseas data was used it was adjusted to reflect Australian conditions. Bathroom and laundry data was sourced from Melbourne, kitchen data from Adelaide, potable water data from Perth groundwater data and toilet data from international publications. As no data was available on Cd concentrations in bathroom greywater or blackwater, values were estimated from average domestic sewage concentration in Melbourne. All data used for greywater and blackwater were based on a simple average of collected data. The balance was calibrated to measured sewage concentrations for residential catchments. Anomalies in the comparison of inputs versus outputs appeared for Zn, the mass balance results indicating 4 – 5 times measured values and Pb, the mass balance results indicating 2 times measured values.
The results identified greywater as the major source of copper, cadmium, lead, zinc and TDS within the household, although the blackwater contribution to TDS and cadmium was 41.7% and 16.5% respectively. Within greywater streams, the bath was also identified as the major source of copper, zinc and cadmium, but lead originated mainly from the laundry (Table 2). The potable water supply was identified as the main contributor to TDS, it should be noted that this is based on Perth groundwater with a concentration of 300 mg/L.
Table 2: Net contribution of contaminants in an Australian household (Gray and Becker 2002)
Contaminant Potable water (%)
Toilet (%)
Laundry (%)
Bath (%)
Kitchen (%)
Greywater Total (%)
Blackwater (%)
Cu 0.0 9.9 18.5 60.1 11.5 90.1 9.9
Cd 0 16.5 16.5 39.5 27.5 83.5 16.5
Pb 2.6 0.5 81 12.2 3.8 99.1 0.9
Zn 0 8.3 3.8 73.3 14.6 91.7 8.3
TDS 53.8 33.7 4.4 3.9 4.1 58.3 41.7
As with other studies, the kitchen sink whilst a major contributor to pathogens in the household, is not a major source of metals and TDS contaminants in greywater compared to other household streams due to the small volumes discharged (Eriksson et al 2002, Comber and Gunn 1996). However, solids and metals from food preparation can contribute to greywater inputs and micro-leaching of metals during washing of cookware and cutlery occurs (Schuster and Neuhauser 2003, Quintaes et al 2004).
6.1. The role of householder behaviour on wastewater composition
The main sources of contaminants in blackwater are the water supply, faeces, urine and paper. Faecal and urine contaminant composition is diet related so results may not be transferable between different regions. Blackwater has traditionally been analysed for treatment parameters, such as biological oxygen demand, suspended and total solids and for nutrients such as phosphorus and nitrogen. No known Australian studies have investigated the colour of blackwater.
In this section, the average dietary intake of contaminants for Australian individuals is presented. Whilst such values are indicative only, the actual amount of contaminants present in human waste is dictated by ingested and inhaled amounts and the individual’s metabolism. Hence, values can vary significantly particularly for individuals subject to occupational exposure.
Arsenic consumption

Sources of critical contaminants in domestic wastewater 15
The main route for arsenic into humans is via ingestion of food (90%), mainly consumption of meat and fish or drinking water (WHO 2000 and 2003a). In Australia the Arsenic levels in reticulated water supplies are typically less than 0.005 mg/L , but levels up to 0.015 mg/L have been detected (NHMRC 2004). The average adult dietary intake of arsenic is approximately 0.04 mg/day in Australia and it is mainly from consumption of poultry, livestock, fish and vegetables. Wine made from grapes sprayed with arsenic based pesticides have recorded up to 0.5mg/L of the trivalent inorganic arsenic (WHO 2004).
Boron consumption
The major source of boron for humans is food intake. Fruits, vegetables, pulses, legumes, and nuts are rich in boron, whilst dairy products, fish, meats, and most grains are poor sources. Data from the World Health Organisation estimated median 0.75 mg/day, mean 0.93 mg/day and 95th-percentile 2.19 mg/day intakes of boron for all groups, and 0.79, 0.98 and 2.33 mg/day, respectively, for adults aged 17 and older. However, estimations vary with averages of 1.52 mg/day and 1.21 mg/day reported in US studies (Iyengar et al. 1988 in WHO 2001a), 0.8 to 1.9 mg/day in the UK (MAFF, 1991 in WHO 2001a). Approximately 90% of boron is excreted with urine.
Cadmium consumption
Cadmium is deposited in the soil by air pollution and absorbed by leaves and roots of plants, entering the food chain. Amounts inhaled by humans are small, less than 0.01, 0.2 and 0.4 µg/d in rural, urban and industrialized areas respectively (WHO 2000a). Cadmium concentrations in drinking water overseas are usually very low between 0.01–1 µg/L (WHO 2000a). Whilst in major Australian reticulated supplies concentrations of cadmium are usually less than 2 g/L. Based on such values, the average intake would be 4g/person/day assuming daily water consumption of 2L. The estimated average Australian adult dietary intake of cadmium is approximately 30 g/day, with between 93-97% excreted through faeces (NHMRC 2004). By comparison, European dietary intake is 15-25 µg/person/day on average (WHO 2000a). Smoking is a significant additional source of cadmium. European data reports an added load of 1.4 µg by smoking one pack of cigarettes per day (WHO 2000a).
Copper consumption
The daily copper intake ranges between 1 to 5 mg/day for an adult, with food responsible for 1 to 3 mg/person or up to 5mg/person when vitamin supplements are taken (IPCS, 1998; IOM, 2001 in WHO 2004). The drinking-water input is on average 0.1–1 mg/day in most situations. The daily intake in Australia was reported as 2.2mg/d for adult females, 1.9kg/d for adult males and 0.8mg/d for children of age 2 (NHMRC 2004).
Mercury consumption
Food is considered the main route of mercury dietary intake. Concentrations in most foodstuffs are generally at or below detection limits, with the main source and highest concentrations found in fish and seafood products (50-1400ng/kg). The average Australian adult dietary intake of mercury is approximately 0.004 mg/day. Drinking water is likely to constitute only a small fraction of total intake, as in major Australian reticulated supplies, the concentration of total mercury is less than 0.001 mg/L (NHMRC 2004).
Lead consumption
Lead concentrations reported in major Australian water reticulation systems are typically less than 0.005 mg/L, but can go up to 0.01 mg/L (NHMRC 2004). The average Australian adult dietary intake of lead is estimated to be 0.1 mg per day (NHMRC 2004). Lead contamination can be present in food due to storage and manufacture, eg. canned food and alcoholic drinks (WHO 2004).
Nickel consumption
Typical nickel concentrations found in Australian drinking water are on average less than 0.01 mg/L. The average daily dietary intake is between 0.1 mg/day to 0.3 mg/day (NHMRC 2004).
Sources of critical contaminants in domestic wastewater 16
Zinc consumption
Food is the major source of zinc intake, whilst drinking water usually makes a negligible contribution to total intake. In major Australian reticulated supplies, a typical concentration of 0.05 mg/L is reported, but concentrations in tap water up to 0.26mg/L have been detected as a result of dissolution of zinc from fittings and pipes (http://www.who.int/water_sanitation_health/dwq/chemicals/zinc/en/ and NHMRC 2004). Lean red meat, whole-grain cereals, pulses, and legumes provide the highest concentrations of zinc (25–50mg/kg raw weight) and fish, roots and tubers, green leafy vegetables, and fruits are low in zinc ( <10mg/kg) (WHO 2003b).
Salt consumption
TDS values in the water supply of major Australian cities range from about 45 mg/L to 750 mg/L (NHMRC 2004) and in reticulated supplies, sodium concentrations range from 3 mg/L to 300 mg/L, with a typical value of 50 mg/L. However, concentrations can vary markedly across the country. The average Australian dietary sodium intake has been estimated at about 4 g/day, but low-sodium diets may restrict this to less than 2 g/day (NHMRC 2004).
In conclusion, the contaminant intake per person can vary widely depending on diet, location and metabolism. Based on averages, the estimated Australian intake is arsenic 0.04 mg/person/day, boron up to 1.9mg/person/day (UK data), cadmium 0.03 mg/person/day, copper 5 mg/person/day (WHO data), chromium <200g/person/d, mercury 0.004 mg/person/day, lead 0.1 mg/person/day , nickel 0.3 mg/person/day and sodium 4 g/person/day.
6.2. Blackwater
6.2.1. Faeces
A human being produces on average between 30-45kg of faecal matter per year (net weight) or 10 -15kg of faecal dry matter per year (Vinnerås et al 2001 and Lentner et al 1981 in Vinnerås 2001). The contaminant input of faecal matter and urine are influenced by diet so results observed in different countries may not be directly transferable across different regions. Faeces contains 10% of the nitrogen, 40% of the phosphorus, 12% of the potassium, majority of solids and most of heavy metals excreted by the body (Otterpohl 2003, WHO 1991, 92, 95 in Vinnerås 2001). Small amounts of calcium and other ions are also present (Frausto da Silva and Williams, 1997 in Vinnerås 2001). The nitrogen in faeces is present as bacterial matter (17%), ammonia, peptides and amino acids (10%) and the remainder as part of the organic fraction (e.g. as uric acid, enzymes and peptides) (Vinnerås 2001) Approximately 50% of the nitrogen is water soluble (Trémolieres et al in Vinnerås 2001). Phosphorus in faeces is present mainly as granular calcium phosphate (Frausto da Silva and Williams 1997 in Vinnerås 2001) with a small amount contained in organic compounds and as soluble P ions (Lentner et al 1981).
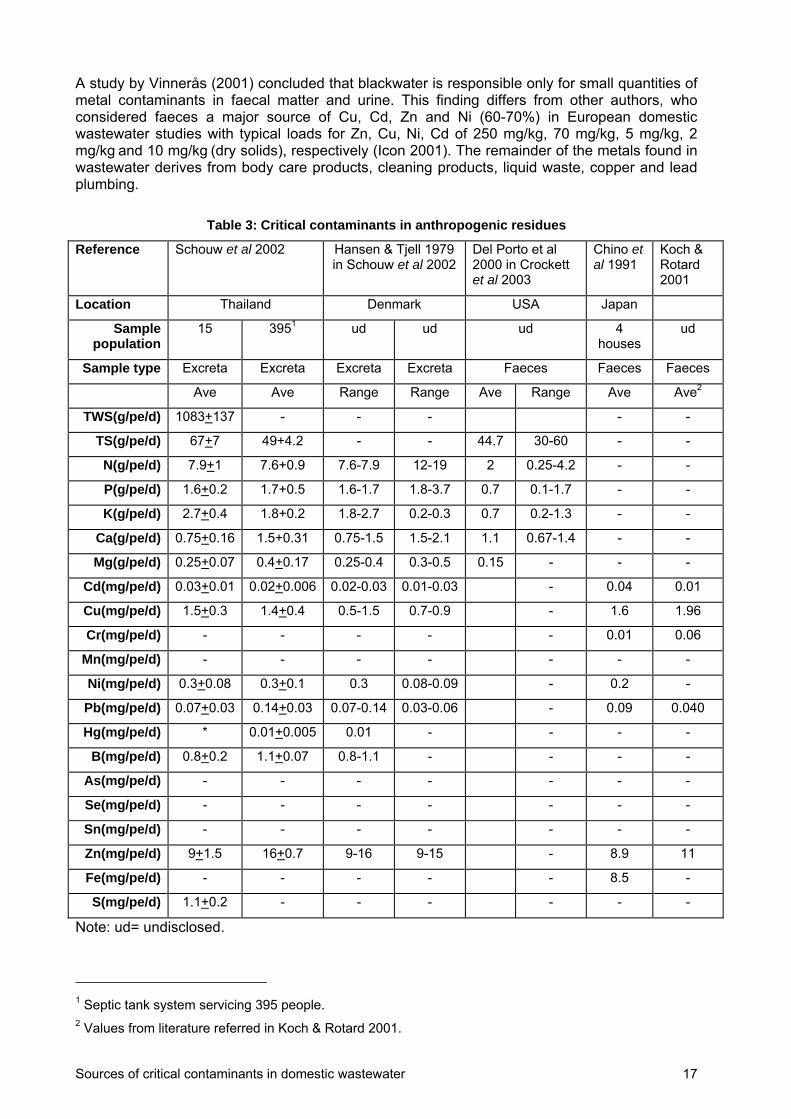
Inorganic ions potassium, calcium, magnesium were present in the range of 0.2 to 2.7 g/pe/d, 0.67 to 2.1 g/pe/d and 0.15 to 0.4g/pe/d respectively (Table 3). Potassium is present in soluble ionic form (Berger 1960 in Vinnerås 2001).
The average metal load in faecal matter reported in a number of studies is shown in Table 3. The levels of zinc (9-16mg/pe/d) and copper (0.5-1.96mg/pe/d) were the highest among metals, the remainder of the critical metal contaminants loads was less than <1mg/pe/d. The recorded metal content in order of decreasing abundance is zinc>iron>copper>sulphur>boron> >nickel. Manganese and iron levels were not recorded, but these could contribute to colour formation.
The importance of faeces as a source of critical contaminants in domestic wastewater varies around the world. Unfortunately, no data on Australian faecal quality was available.
Sources of critical contaminants in domestic wastewater 17
A study by Vinnerås (2001) concluded that blackwater is responsible only for small quantities of metal contaminants in faecal matter and urine. This finding differs from other authors, who considered faeces a major source of Cu, Cd, Zn and Ni (60-70%) in European domestic wastewater studies with typical loads for Zn, Cu, Ni, Cd of 250 mg/kg, 70 mg/kg, 5 mg/kg, 2 mg/kg and 10 mg/kg (dry solids), respectively (Icon 2001). The remainder of the metals found in wastewater derives from body care products, cleaning products, liquid waste, copper and lead plumbing.
Table 3: Critical contaminants in anthropogenic residues
Reference Schouw et al 2002 Hansen & Tjell 1979 in Schouw et al 2002
Del Porto et al 2000 in Crockett et al 2003
Chino et al 1991
Koch & Rotard 2001
Location Thailand Denmark USA Japan
Sample population
15 3951 ud ud ud 4 houses
ud
Sample type Excreta Excreta Excreta Excreta Faeces Faeces Faeces
Ave Ave Range Range Ave Range Ave Ave2
TWS(g/pe/d) 1083+137 - - - - -
TS(g/pe/d) 67+7 49+4.2 - - 44.7 30-60 - -
N(g/pe/d) 7.9+1 7.6+0.9 7.6-7.9 12-19 2 0.25-4.2 - -
P(g/pe/d) 1.6+0.2 1.7+0.5 1.6-1.7 1.8-3.7 0.7 0.1-1.7 - -
K(g/pe/d) 2.7+0.4 1.8+0.2 1.8-2.7 0.2-0.3 0.7 0.2-1.3 - -
Ca(g/pe/d) 0.75+0.16 1.5+0.31 0.75-1.5 1.5-2.1 1.1 0.67-1.4 - -
Mg(g/pe/d) 0.25+0.07 0.4+0.17 0.25-0.4 0.3-0.5 0.15 - - -
Cd(mg/pe/d) 0.03+0.01 0.02+0.006 0.02-0.03 0.01-0.03 - 0.04 0.01
Cu(mg/pe/d) 1.5+0.3 1.4+0.4 0.5-1.5 0.7-0.9 - 1.6 1.96
Cr(mg/pe/d) - - - - - 0.01 0.06
Mn(mg/pe/d) - - - - - - -
Ni(mg/pe/d) 0.3+0.08 0.3+0.1 0.3 0.08-0.09 - 0.2 -
Pb(mg/pe/d) 0.07+0.03 0.14+0.03 0.07-0.14 0.03-0.06 - 0.09 0.040
Hg(mg/pe/d) * 0.01+0.005 0.01 - - - -
B(mg/pe/d) 0.8+0.2 1.1+0.07 0.8-1.1 - - - -
As(mg/pe/d) - - - - - - -
Se(mg/pe/d) - - - - - - -
Sn(mg/pe/d) - - - - - - -
Zn(mg/pe/d) 9+1.5 16+0.7 9-16 9-15 - 8.9 11
Fe(mg/pe/d) - - - - - 8.5 -
S(mg/pe/d) 1.1+0.2 - - - - - -
Note: ud= undisclosed.
1 Septic tank system servicing 395 people. 2 Values from literature referred in Koch & Rotard 2001.

Sources of critical contaminants in domestic wastewater 18
Two Asian studies suggest a lesser role for faecal matter as a contaminant source in domestic wastewater. A study in Thailand, reported that the excreta load was less than 10% Cd, Zn and Ni and 50% of Cu in domestic sewage and solid kitchen waste (Schouw et al 2002) and Chino et al. analysed the metal load from 4 households in Japan and established that faeces in domestic wastewater were the source of 60% Mn, but only 20% Cd and Zn, 12%Ni, 1% Pb, 2% Cr, 3% Cu, and 8% Fe in the total metal load in domestic wastewater (Chino et al 1991).
6.2.2. Urine
Urine composition and production rates depend on dietary intake and individual’s metabolism. The normal volume of urine produced ranges between 210L and 448L per individual per year (equivalent to 0.6L to 2L per person per day) (Strasinger and Di Lorenzo 2001). European data indicates the average person produces between 400L to 550 L of urine per year (Vinnerås and Jönsson 2002, Hellström and Kärrman, 1996), whilst data from Thailand suggests between 210-438L per year (Schouw et al 2002).
Urine is the major source of nitrogen (75%), phosphorus (50%) and potassium (54%) in domestic wastewater. It is comprised mainly of nutrients and water and it has a very low content of heavy metals (Vinnerås 2001, Koch and Rotard 2001, Heitland and Kösters 2006).
It contains 80-90% of the nitrogen, 50-80% of the phosphorus and 80-90% of the potassium ingested from food (Berger 1960; Schroeder and Mason 1971; Lentner et al 1981; Guyton 1992; Frausto da Silva and Williams 1997; in Vinnerås 2001) and 8 main ionic species: Na+, K+, NH4
-, Ca+2 , Cl_, SO4
-2, PO4- and HCO3
- (Table 4) (Kirchmann and Pettersson 1995) and compounds excreted via the kidneys such as antibiotics, hormones and other pharmaceuticals (Tjandraatmadja and Burn 2005). The concentration of urine varies with each individual, their dietary intake, age, gender and metabolic functions. For instance, in Schachter et al (1980) a sodium range of 76 to 153mEq/pe/24 hours (n=9) was recorded for subjects in the USA and 139-149mEq/pe/24 hours for females and 177-184mEq/pe/24 hours for males (n=138) for subjects in New Zealand. Whilst an average of 113mEq/L was recorded for European subjects in Fitttschen and Hahn 1998 in Vinnerås (2001).
The nitrogen is present in the form of urea (80%), ammonia (7%), creatine (6%) and small amounts of peptides and free amino acids (Lentner et al 1981 in Vinnerås 2001). Phosphorus is present as inorganic phosphates that buffer the pH of the urine. Potassium and sodium are excreted as free ions and heavy metals are present in very small amounts, as only 5 to 15% of most heavy metals ingested are excreted in the urine stream, the majority being excreted with faeces. The exceptions to this are arsenic and mercury that are excreted mainly via urine.
The typical load excreted via the urine based on the ingested metal content is 3% of copper, 3% of nickel, 5% of zinc, 7% of lead, and 75% of mercury (Lentner et al 1981 in Vinnerås 2001). Nickel released by body implants is also eliminated via urine (Sarmiento-Gonzalez et al 2005).
The levels of Hg and Cd in urine are generally below the detection limit, i.e, less than 0.0004mg/L and less than 0.0013 mg/L (Jonsson 2001). The mercury concentration in urine for 98% of samples from people without known occupational exposure is less than 5 g/L. Higher levels, between 50-100 g/L have been recorded for people following chronic occupational exposure (WHO 2000b).
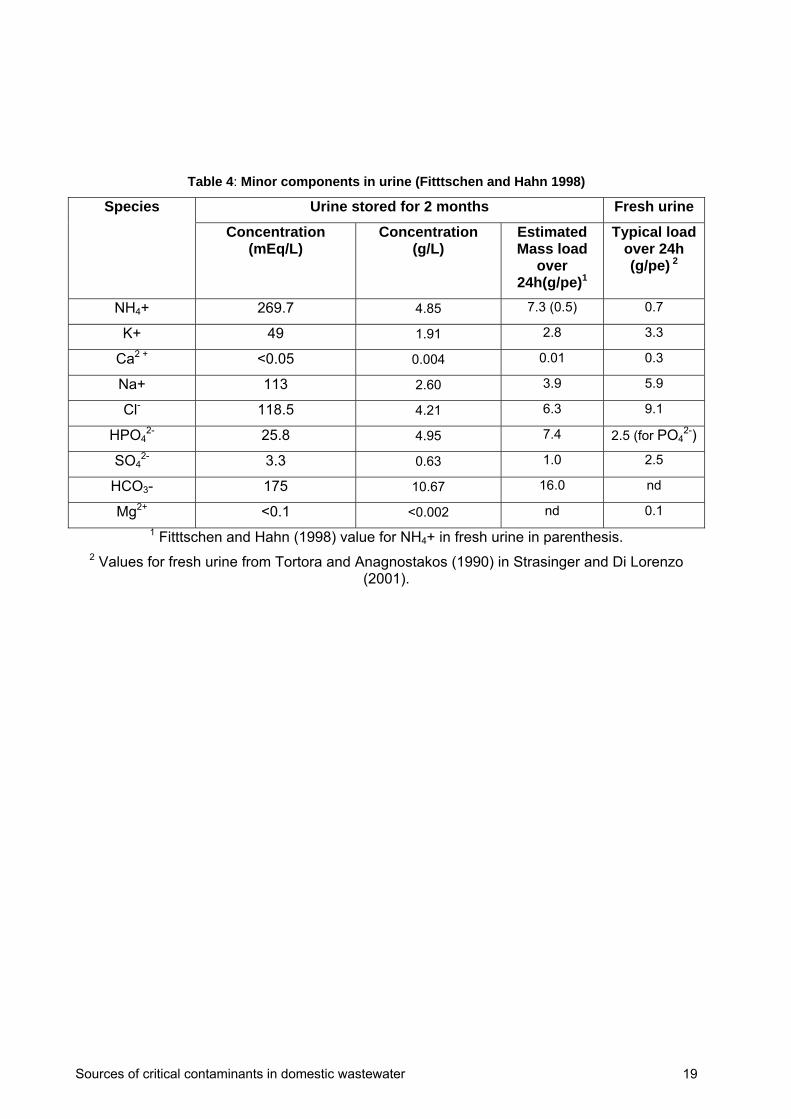
Urine composition data is collected mainly for toxicological and medical evaluation and can vary significantly with sample population characteristics, such as health, age, gender, occupation, diet, exposure. As an illustration, Table 4 shows the average values commonly reported in medical literature and those recorded by Fittschen and Hahn (1998) for 29 subjects. The higher ammonium value in the stored urine (from 0.5g/pe/d to 7.3g/pe/d) is attributed to the decomposition of urea into ammonium with storage, however the other ionic and anionic species tend to remain unaltered.
In Table 5, the metal input from urine is one to three orders of magnitude lower than the metal input from faeces reported in Table 3. However, urine can contribute to dissolved salts in blackwater.
Sources of critical contaminants in domestic wastewater 19
Table 4: Minor components in urine (Fitttschen and Hahn 1998)
Urine stored for 2 months Fresh urine Species
Concentration (mEq/L)
Concentration (g/L)
Estimated Mass load
over 24h(g/pe)1
Typical load over 24h
(g/pe) 2
NH4+ 269.7 4.85 7.3 (0.5) 0.7
K+ 49 1.91 2.8 3.3
Ca2 + <0.05 0.004 0.01 0.3
Na+ 113 2.60 3.9 5.9
Cl- 118.5 4.21 6.3 9.1
HPO42- 25.8 4.95 7.4 2.5 (for PO4
2-)
SO42- 3.3 0.63 1.0 2.5
HCO3- 175 10.67 16.0 nd
Mg2+ <0.1 <0.002 nd 0.1
1 Fitttschen and Hahn (1998) value for NH4+ in fresh urine in parenthesis. 2 Values for fresh urine from Tortora and Anagnostakos (1990) in Strasinger and Di Lorenzo
(2001).

Sources of critical contaminants in domestic wastewater 20
Table 5 : Urine composition
Reference Vinnerås 2001 Becker et al 2002 Heitland and Köster 2006 Koch & Rotard 2001 Schramel et al 1997 Caldwell et al 2005
Location Sweden Germany Germany Germany USA USA
Sample population - 4741 87 14 2465
Sample type Urine Urine Urine Urine Urine Urine Urine
Ave3 Ave4 Ave5 Range Ave Ave3 Range Ave3
N(g/p/d) 10.9 - - - - - - -
P(g/p/d) 1 - - - - - - -
K(g/p/d) 3.01 - - - - - -
Ca(g/p/d) - - - - - - - -
Mg(g/p/d) - - - - - - - -
Cd(mg/p/d) 0.00109 0.0003
(0.0005)
0.0003 0.0001-0.0008 0.0005 0.0005 0.0001-0.0007 0.0005
Cu(mg/p/d) 0.101 - 0.012 0.006-0.045 0.0145 - - -
Cr(mg/p/d) 0.010 - 0.0002 0.0001-0.0015 0.0003 - - -
Mn(mg/p/d) - - 0.0001 0.001-0.0011 - - - -
Ni(mg/p/d) 0.007 - 0.0005 0-0.011 - - - -
Pb(mg/p/d) 0.0019 - 0.0009 0-0.007 0.0006 0.0008 0.0001-0.0013 0.001
Hg(mg/p/d) 0.0013 0.0006
(0.0013)
- - 0.001 0.0021 0-0.0038 -
As(mg/p/d) - 0.0059
(0.0097)
0.02 0.001-0.565 0.013 - - -
Se(mg/p/d) - - 0.0181 0.0045-0.0904 - - - -
Sn(mg/p/d) - - 0.0013 0.0001-0.3074 - 0.0027 0.0015-0.0041 -
Zn(mg/p/d) 0.043 - 0.31 0.07-1.45 0.164 - - -
3 Proposed values for Swedish norm. 4 Geometric mean calculated from Becker et al assuming urine production of 550L/yr, the arithmetic mean is in parenthesis. 5 Geometric mean calculated from concentration values in Heitland & Köster 2006.

Sources of critical contaminants in domestic wastewater 21
6.2.3. Perspiration
The major constituents in perspiration are water, sodium chloride and urea. Other substances are also found in small amounts such as potassium, HCO3
-, 2-methyl phenol, 4-methyl phenol (Patterson et al 2000), copper, chromium and zinc (Schoeder and Mason 1971 in Vinneras 2001).
Individuals perspire at different rates and whilst clothing is likely to absorb and retain the ions excreted, the quantification and the route of the products from perspiration to greywater cannot be defined with certainty.
The amount of sodium and chloride excreted is small. Estimates of sweat production for males under vigorous exercise are on average 0.72mg/cm2/min, resulting in the excretion of 3.85g/pe/d Na+ and 0.81g/pe/d Cl- under a regimen of high activity (Ferner et al 1990, Patterson et al 2000).
6.3. Greywater
Greywater is any effluent from a property excluding that from toilets and urinals and so is composed of wastewater from the bathroom, laundry and the kitchen. There have been a number of previous studies investigating the characteristics of greywater with a view to treatment and use of greywater. The chemical analysis reported in these studies are reviewed and discussed in relation to the Australian and Melbourne context. A more detailed description of the three greywater input streams and the potential critical contaminant sources and concentrations or loads intrinsic to these streams is then given.
Greywater collected from a household is by nature very variable in both flow (Butler, 1993; Butler et al., 1995) and quality (Table 6, Eriksson et al., 2002; Jeppesen, 1993) and the three source streams can have very different characteristics (Eriksson et al., 2002). Kitchen wastewater can contain higher concentrations of gross contaminants and fats, oils and greases. Greywater can also contain human pathogens and depending on the source can contain high concentrations of sodium, phosphorous and other dissolved solids, aluminium, biodegradable organics and nitrogen.
Of the critical contaminants for examination in this study a number have significant concentrations in mixed greywater (Table 6). Total dissolved solids are not reported in many studies, as the simpler conductivity analysis is used. Recorded conductivities of mixed source greywater are >300 S/cm indicating a relatively high dissolved solids concentration in this waste stream. Few studies have measured colour of greywater, with the exception of a 20 year old study from the USA reporting a large range of values.
Arsenic, cadmium and mercury concentrations in mixed source greywater were below the level of detection for the analysis method used in all the studies. Copper and lead concentrations up to 0.39 and 0.15 mg/L respectively were observed in septic sullage but it is not clear if the source was the potable water or products used in the home. Sodium concentrations of greywater are generally high, with most detergents and hygiene products containing sodium based compounds. Lead and nickel concentrations of 0.15 mg/L and 0.027 mg/L respectively have been observed in septic sullage but again the source of these metals was not identified in the study. Zinc concentrations in mixed greywater have shown levels up to 1.6 mg/L for a mixed greywater and 0.44 mg/L for septic sullage have been observed.
The data reported in these previous studies are 10 to 20 years old and changes in washing, personal care and hygiene regimes in the last 20 years mean they may not be indicative of greywater produced in Australia today. Changes in detergent formulation, the use of more products containing dyes and pigments, and the increased use of personal care products all impact of the quality of greywater.

Sources of critical contaminants in domestic wastewater 22
Whilst there have been a number of studies reporting the quality of greywater in different Australian case studies, most are focused on the performance of technologies and potential impacts on human health. For this reason analysis has included parameters such as Biological Oxygen Demand (BOD), Chemical Oxygen Demand (COD), nitrogen and phosphorous and microbial indicators such as E.coli with few studies reporting on the content of metals, dissolved solids or colour (Gardner, 1998). There has been some work on the sodium, phosphorous and nitrogen content of laundry detergents and this will be reported in Section 2.9. Previous work by the CSIRO Urban Water Program also used literature sources to estimate sources of contaminants in the urban residential water system (Gray and Becker, 2002). A contaminant balance was performed for a range of contaminants and average annual household loads were calculated (Table 6). There were some inconsistencies in calculated values and those measured in residential wastewater.
Table 6: Concentrations of critical contaminants in mixed source greywater (from Eriksson et al., 2002 and others)
Parameter Concentration or load in greywater
Original Reference
Total dissolved solids Not reported
65.6 kg/h/y Gray and Becker (2002)
Conductivity (S/cm) 320 – 390 Total* Hypes (1974)
Up to 20,000* Shower,washbasin, laundry
Santala et al., (1998)
325 – 1140* Septic sullage Jeppesen (1993)
Colour (Pt/Co) 30 - >100 (PtCl6)* Hypes (1974)
As (mg/L) <0.038 Bath and dishwasher Hargelius et al. (1995)
<0.01 Total Hypes (1974)
0.00 Tunaley (2004)
Cd (mg/L) <0.006 Bath and dishwasher
<0.03 Total
<0.01 Septic sullage
55 mg/h/yr*
Hargelius et al. (1995)
Hypes (1974)
Jeppesen (1993)
Gray and Becker (2002)
0.007 Tunaley (2004)
Cu (mg/L) 0.056 Bath and dishwasher
0.08 – 0.16 Total
0.018 - 0.390 Septic sullage
0.010kg/h/y
Hargelius et al. (1995)
Hypes (1974)
Jeppesen (1993)
Gray and Becker (2002)
0.30 Tunaley (2004)
Na (mg/L) 21 Bath and dishwasher Hargelius et al. (1995)
68 – 93 Total Hypes (1974)

Sources of critical contaminants in domestic wastewater 23
Parameter Concentration or load in greywater
Original Reference
29 – 230 Septic sullage Jeppesen (1993)
16 Tunaley (2004)
Pb (mg/L) <0.063 Bath and dishwasher
<0.01 - 0.10 Total
<0.050 – 0.150 Septic sullage
<0.05 Greywater and urine
3.9 g/h/yr
Hargelius et al. (1995)
Hypes (1974)
Jeppesen (1993)
Fittschen and Niemczynowicz (1997)
Gray and Becker (2002)
0.006 Tunaley (2004)
Hg (mg/L) <0.0003 Bath and dishwasher Hargelius et al. (1995)
<0.001 Septic sullage Jeppesen (1993)
Ni (mg/L) <0.025 Bath and dishwasher Hargelius et al. (1995)
<0.05 Total Hypes (1974)
<0.015-0.027 Septic sullage Jeppesen (1993)
0.007 Tunaley (2004)
Zn (mg/L) 0.14 Bath and dishwasher Hargelius et al. (1995)
0.37 – 1.60 Total Hypes (1974)
<0.010 – 0.440 Septic sullage Jeppesen (1993)
0.171 Greywater and urine
0.11 kg/h/yr (overestimate)
Fittschen and Niemczynowicz (1997)
Gray and Becker (2002)
* Assumed value
Also, shown in Table 6 are the results of a 5 week sampling program of greywater produced from a house in Highett, Melbourne (Tunaley, 2004). The householders were water and environmentally conscious, factors which will have opposing effect on greywater quality. Water conscious behaviour will reduce water use and increase concentration, whereas environmentally conscious behaviour will reduce contaminant concentrations, due to less use of products or use of more environmentally friendly products. For sodium, the average concentration for this household was only 16 mg/L, the lowest value of all studies reviewed.
In addition to the results from previous CSIRO work, some metals analysis have been undertaken for a range of household hygiene and personal care products as part of this current study. The results are reported in the following sections.
As a further introduction to the following sections a brief description of soaps and detergents, their characteristics and components follows. Soaps are usually the sodium salt of long-chain fatty acids and products in Australia should contain not less than 70% fatty matter (Selinger, 1998). The sodium component can be replaced with other salts giving soaps with different properties for example sodium can be replaced with potassium, forming the soft soaps. Other metal substitution generally produces ‘insoluble’ soaps which have applications in additives for greases and lubricating oils. Detergents were then developed to overcome some of the problems with precipitation of the salts formed when soaps react with calcium and magnesium ions. Synthetic detergents were also originally sodium ion based, but attached to a branched chain alkylbenzene sulphonate rather than a straight chain animal fat. While other synthetic

Sources of critical contaminants in domestic wastewater 24
detergents using compounds other than sodium are available, the anionic surfactants (surface active agents, the active ingredient of the detergent) predominate in the domestic situation. Cationic surfactants are used as fabric softeners as their charge is attracted to the wet fabric forming a lubricating layer on the surface of the fibres.
6.4. Laundry products
6.4.1. Laundry Detergents
Laundry detergents consist of a number of components including; the surfactant which provides the cleaning capability, inorganic and organic builders which assist surfactant action, fluorescers which help brighten fabrics, foaming agents and bleaches. The formulation of the detergents will change depending on the desired end use and different quantities of the different components will be used, within prescribed guidelines. The surfactants and builders in detergents are generally sodium based, the most common builder being sodium tripolyphosphate (see Table 7). Some formulations include a zeolite builder as well as or instead of the sodium tripolyphospate. The zeolites are also sodium based, the sodium present as mobile cations in a silicon-aluminium-oxygen matrix. Other common sodium compounds in detergent formulations are sodium carbonate, sodium silicate, sodium sulphate and sodium perborate, the latter being most common in stain removing products (Sard OxyPlus) the others acting as builders, buffers and auxiliary compounds.
From the data collected on the components of specific products the metals content of laundry detergents is expected to be low. Metals found in the wastewater from the laundry are likely to be sourced from the water supply, or potentially leaching from the washing machine components. The presence of arsenic as a contaminant in phosphate used in laundry detergents in the USA had been reported in early formulations, but has since been significantly reduced by substitution of phosphates with zeolites (Jenkins 1994, 1998).
Metals analysis of a range of laundry products will be carried out in Stage 2 of this project in order to clarify this observation.
The metals concentration observed in a number of different laundry greywater samples from other studies is generally low (Table 8) with the exceptions of Cu and Zn. Gray and Becker (2002) suggest that only 18.5% of copper and 3.8% of zinc in household wastewater is sourced from the laundry with no copper or zinc in the potable supply, but 81% of lead in domestic wastewater comes from the laundry source.
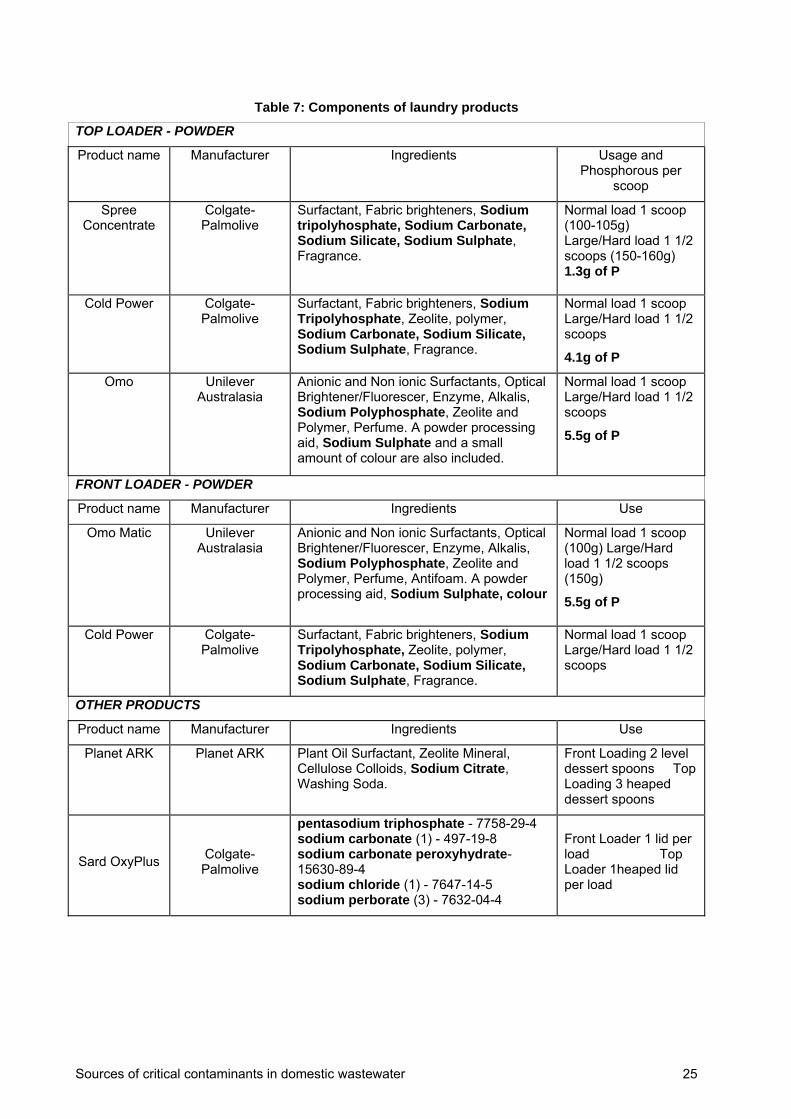
Sources of critical contaminants in domestic wastewater 25
Table 7: Components of laundry products
TOP LOADER - POWDER
Product name Manufacturer Ingredients Usage and Phosphorous per
scoop
Spree Concentrate
Colgate-Palmolive
Surfactant, Fabric brighteners, Sodium tripolyhosphate, Sodium Carbonate, Sodium Silicate, Sodium Sulphate, Fragrance.
Normal load 1 scoop (100-105g) Large/Hard load 1 1/2 scoops (150-160g) 1.3g of P
Cold Power Colgate-Palmolive
Surfactant, Fabric brighteners, Sodium Tripolyhosphate, Zeolite, polymer, Sodium Carbonate, Sodium Silicate, Sodium Sulphate, Fragrance.
Normal load 1 scoop Large/Hard load 1 1/2 scoops
4.1g of P
Omo Unilever Australasia
Anionic and Non ionic Surfactants, Optical Brightener/Fluorescer, Enzyme, Alkalis, Sodium Polyphosphate, Zeolite and Polymer, Perfume. A powder processing aid, Sodium Sulphate and a small amount of colour are also included.
Normal load 1 scoop Large/Hard load 1 1/2 scoops
5.5g of P
FRONT LOADER - POWDER
Product name Manufacturer Ingredients Use
Omo Matic Unilever Australasia
Anionic and Non ionic Surfactants, Optical Brightener/Fluorescer, Enzyme, Alkalis, Sodium Polyphosphate, Zeolite and Polymer, Perfume, Antifoam. A powder processing aid, Sodium Sulphate, colour
Normal load 1 scoop (100g) Large/Hard load 1 1/2 scoops (150g)
5.5g of P
Cold Power Colgate-Palmolive
Surfactant, Fabric brighteners, Sodium Tripolyhosphate, Zeolite, polymer, Sodium Carbonate, Sodium Silicate, Sodium Sulphate, Fragrance.
Normal load 1 scoop Large/Hard load 1 1/2 scoops
OTHER PRODUCTS
Product name Manufacturer Ingredients Use
Planet ARK Planet ARK Plant Oil Surfactant, Zeolite Mineral, Cellulose Colloids, Sodium Citrate, Washing Soda.
Front Loading 2 level dessert spoons Top Loading 3 heaped dessert spoons
Sard OxyPlus Colgate-Palmolive
pentasodium triphosphate - 7758-29-4 sodium carbonate (1) - 497-19-8 sodium carbonate peroxyhydrate-15630-89-4 sodium chloride (1) - 7647-14-5 sodium perborate (3) - 7632-04-4
Front Loader 1 lid per load Top Loader 1heaped lid per load

Sources of critical contaminants in domestic wastewater 26
Table 8: Concentrations of critical contaminants in laundry greywater (from Eriksson et al., 2002 and others)
Parameter Concentration in greywater (mg/l) except*
Original Reference
Total dissolved solids Not reported
5.0 kg/h/yr Gray and Becker (2002)
Conductivity (S/cm) 190 – 1400* Christova Boal et al. (1996)
Colour (Pt/Co) 50 – 70* Christova Boal et al. (1996)
As 0.001-0.007 Christova Boal et al. (1996)
<0.038 Hargelius et al. (1995)
Cd <0.01
0.00063
Siegrist et al. (1976)
Christova Boal et al. (1996)
1.1 g/d Jenkins (1998)
110 g/h/yr Gray and Becker (2002)
Cu <0.05-0.27
0.322
0.058
1.8 g/d
Christova Boal et al. (1996)
Surendran and Wheatley (1998)
Hargelius et al. (1995)
Jenkins (1998)
0.002kg/h/y Gray and Becker (2002)
Na 49 – 480 Christova Boal et al. (1996)
44 Hargelius et al. (1995)
Pb 0.033
<0.063
Surendran and Wheatley (1998)
Hargelius et al. (1995)
2.1 g/d Jenkins (1998)
3.15 g/h/yr Gray and Becker (2002)
Hg 0.00029 Hargelius et al. (1995)
1.4 g/d Jenkins (1998)
Ni <0.028 Hargelius et al. (1995)
0.55 g/d Jenkins (1998)
Zn 0.09 – 0.32 Christova Boal et al. (1996)
0.308 ug/L Surendran and Wheatley (1998)
0.44 Hargelius et al. (1995)
45 g/d Jenkins (1998)
4 g/h/yr Gray and Becker (2002)

Sources of critical contaminants in domestic wastewater 27
There are two Australian studies, one analysing laundry wastewater, the other examining the detergents themselves, that contain useful information regarding the sodium concentration. The Toowoomba council report on greywater quality from the laundry (Laundry Greywater Potential Impact on Toowoomba Soils – Final Report, 2005) found an average sodium concentration of 30 wash samples of 178 mg/L. The majority of households in this study used powder detergents (>70%) and <40% used a softener in the wash. The average electrical conductivity of the wash water was 1037 S/cm. The concentration of other metals was not monitored. The report also indicates that front loading machines increase the total N and suspended solids concentrations discharged but not salinity or the ratio of Na:Ca:Mg:K.
Data from work by Patterson (2004) provides more detail of the sodium for over 50 powder and 41 liquid detergents (http://www.lanfaxlabs.com.au/). Maximum sodium concentrations observed for powder detergents were >90 g/wash for top loaders and ~50 g/wash for front loaders. Levels of sodium in liquid detergents were lower with a maximum of 12 g/wash for a top loading liquid detergent product.
6.4.2. Laundry softeners
There is little data available describing the sodium and metal content of laundry softeners and labelling on Australian products does not provide detailed information on content. Softeners often use cationic surfactants in which the sodium ion is replaced with an ion of negative charge (often chlorine) and contain quaternary ammonium salts, a typical compound being dipalmitoylethyl hydroxyethylmonium methosulfate. Analysis of some commonly used laundry softeners in Stage 2 of this project will verify metals content of these products.
6.4.3. Other laundry products
There are a number of other laundry products that contain compounds which could have an impact on the concentrations of contaminants under investigation in this study. These include dyes, prewashes, presoaks and bleaches which can contain high concentrations of sodium (see Section 6.5.2). Dyes may also contribute to the colour of domestic wastewater. Detailed investigation of these products has not been undertaken as their potential contribution to the overall quality of domestic wastewater is minimal. A study in Queensland of 30 households recorded that less than 40% used fabric softeners or conditioners in the laundry (Howard et al 2005).
6.5. Cleaning products
Household dust can have a significant metal content as seen in the metal contaminant concentrations expressed as geometric means: Cd 1.9 g/g , Cu 103 g/g, Fe 2740g/g, Ni 15.6g/g, Pb 85.2 g/g and Zn 437g/g from households in Sydney (Chattopadhyay et al 2003). But there is insufficient information available on the contribution that cleaning products and dust have or if it is introduced into sewage through activities such as disposal of dirty cleaning water.
6.5.1. Disinfectants
Household disinfectants can have an organic base, such as a surfactant or isopropanol, and often contain high concentrations of sodium based compounds such as carbonates, hydroxides, hypochlorite and EDTA. Products can also contain fragrances and dyes or pigments. The occurrence of other metals of concern in this study for these products is not known and their potential contribution to household wastewater needs to be assessed before more detailed analysis of composition is carried out.

Sources of critical contaminants in domestic wastewater 28
6.5.2. Bleaches
Most household bleaches in Australia are based on sodium hypochlorite, with varying strengths (Table 9), the concentration of hypochlorite being indicative of the available chlorine. The amount of sodium sourced from bleaches appearing in a wastewater stream will be dependent on householder behaviour and cleaning practices.
Table 9: Bleaches and stain removers and active ingredients
Product name Manufacturer Active Ingredients
White King Premium Bleach
Sara Lee Sodium Hypochlorite (42g/L), Available Chlorine 4.0%m/v.
White King Concentrated Bleach
Sara Lee Sodium Hypochlorite (63g/L), Available Chlorine 6.0%m/v.
Riviera regular Bleach Riviera Industry Sodium Hypochlorite 3.7%.
White King Bleach Spray Sara Lee Sodium Hypochlorite (11g/L), Available Chlorine 1.0%m/v.
White King Laundry Bleach
Sara Lee Sodium Hypochlorite (52.5g/L), Available Chlorine 5.0%m/v.
Coles NapiCare Plus Coles Supermarkets
Australia Hydrogen peroxide 59g/L
Vanish NapiSan Reckitt Benckiser Hydrogen peroxide 59g/L
6.6. Personal care products (bathroom)
By their very nature personal care products do not generally contain toxic or harmful compounds due to the high level of skin contact and possible ingestion routes of exposure. However, many of the main ingredients of soaps, shampoos and conditioners are sodium based and some specific personal care products do contain metal compounds i.e. zinc in sunscreens.
Data collected from previous studies shows relatively low levels of most of the contaminants under investigation in this study (Table 10). Exceptions to this are dissolved solids (or conductivity), colour, copper, sodium and zinc. Total dissolved solids concentrations in laundry greywater can vary substantially (Burrows et al., 1991) but on average the load is reported to be similar to that sourced from the laundry (Gray and Becker, 2002). Gray and Becker (2002) also report 73% of zinc and 60% of copper in household wastewater being sourced from the bathroom and high levels of zinc were reported for an Australian study, up to 6.3 mg/L. A potential explanation for this high level of zinc was the use of chlorine tablets causing leaching from zinc plumbing fixtures. An additional explanation is that a higher use of sunscreens occurs in Australia compared to that in other study countries (UK).
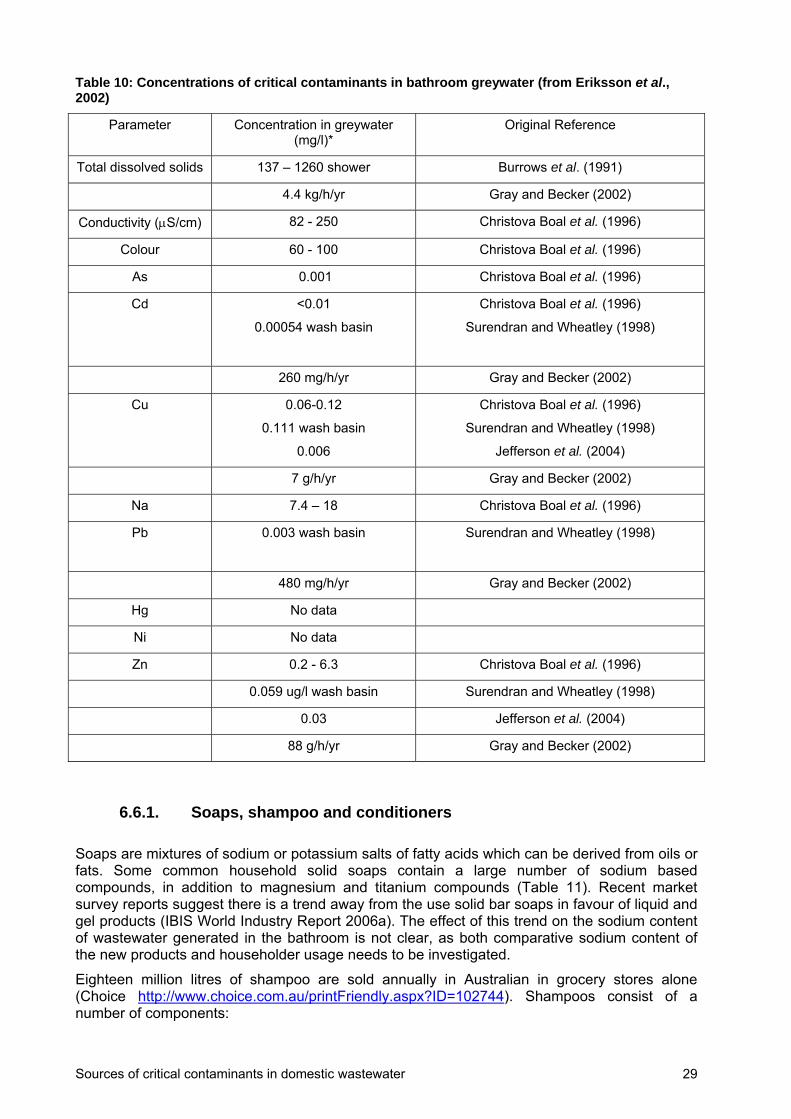
Sources of critical contaminants in domestic wastewater 29
Table 10: Concentrations of critical contaminants in bathroom greywater (from Eriksson et al., 2002)
Parameter Concentration in greywater (mg/l)*
Original Reference
Total dissolved solids 137 – 1260 shower Burrows et al. (1991)
4.4 kg/h/yr Gray and Becker (2002)
Conductivity (S/cm) 82 - 250 Christova Boal et al. (1996)
Colour 60 - 100 Christova Boal et al. (1996)
As 0.001 Christova Boal et al. (1996)
Cd <0.01
0.00054 wash basin
Christova Boal et al. (1996)
Surendran and Wheatley (1998)
260 mg/h/yr Gray and Becker (2002)
Cu 0.06-0.12
0.111 wash basin
0.006
Christova Boal et al. (1996)
Surendran and Wheatley (1998)
Jefferson et al. (2004)
7 g/h/yr Gray and Becker (2002)
Na 7.4 – 18 Christova Boal et al. (1996)
Pb 0.003 wash basin
Surendran and Wheatley (1998)
480 mg/h/yr Gray and Becker (2002)
Hg No data
Ni No data
Zn 0.2 - 6.3 Christova Boal et al. (1996)
0.059 ug/l wash basin Surendran and Wheatley (1998)
0.03 Jefferson et al. (2004)
88 g/h/yr Gray and Becker (2002)
6.6.1. Soaps, shampoo and conditioners
Soaps are mixtures of sodium or potassium salts of fatty acids which can be derived from oils or fats. Some common household solid soaps contain a large number of sodium based compounds, in addition to magnesium and titanium compounds (Table 11). Recent market survey reports suggest there is a trend away from the use solid bar soaps in favour of liquid and gel products (IBIS World Industry Report 2006a). The effect of this trend on the sodium content of wastewater generated in the bathroom is not clear, as both comparative sodium content of the new products and householder usage needs to be investigated.
Eighteen million litres of shampoo are sold annually in Australian in grocery stores alone (Choice http://www.choice.com.au/printFriendly.aspx?ID=102744). Shampoos consist of a number of components:
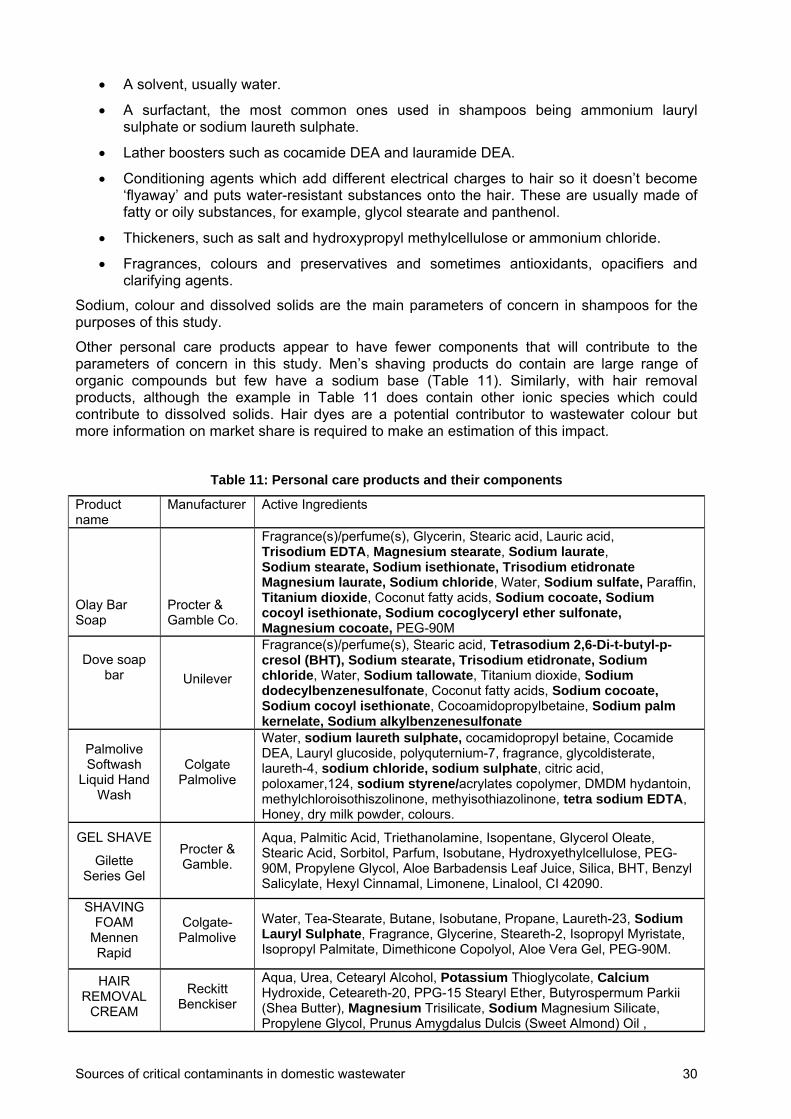
Sources of critical contaminants in domestic wastewater 30
A solvent, usually water.
A surfactant, the most common ones used in shampoos being ammonium lauryl sulphate or sodium laureth sulphate.
Lather boosters such as cocamide DEA and lauramide DEA.
Conditioning agents which add different electrical charges to hair so it doesn’t become ‘flyaway’ and puts water-resistant substances onto the hair. These are usually made of fatty or oily substances, for example, glycol stearate and panthenol.
Thickeners, such as salt and hydroxypropyl methylcellulose or ammonium chloride.
Fragrances, colours and preservatives and sometimes antioxidants, opacifiers and clarifying agents.
Sodium, colour and dissolved solids are the main parameters of concern in shampoos for the purposes of this study.
Other personal care products appear to have fewer components that will contribute to the parameters of concern in this study. Men’s shaving products do contain are large range of organic compounds but few have a sodium base (Table 11). Similarly, with hair removal products, although the example in Table 11 does contain other ionic species which could contribute to dissolved solids. Hair dyes are a potential contributor to wastewater colour but more information on market share is required to make an estimation of this impact.
Table 11: Personal care products and their components
Product name
Manufacturer Active Ingredients
Olay Bar Soap
Procter & Gamble Co.
Fragrance(s)/perfume(s), Glycerin, Stearic acid, Lauric acid, Trisodium EDTA, Magnesium stearate, Sodium laurate, Sodium stearate, Sodium isethionate, Trisodium etidronate Magnesium laurate, Sodium chloride, Water, Sodium sulfate, Paraffin, Titanium dioxide, Coconut fatty acids, Sodium cocoate, Sodium cocoyl isethionate, Sodium cocoglyceryl ether sulfonate, Magnesium cocoate, PEG-90M
Dove soap bar
Unilever
Fragrance(s)/perfume(s), Stearic acid, Tetrasodium 2,6-Di-t-butyl-p-cresol (BHT), Sodium stearate, Trisodium etidronate, Sodium chloride, Water, Sodium tallowate, Titanium dioxide, Sodium dodecylbenzenesulfonate, Coconut fatty acids, Sodium cocoate, Sodium cocoyl isethionate, Cocoamidopropylbetaine, Sodium palm kernelate, Sodium alkylbenzenesulfonate
Palmolive Softwash
Liquid Hand Wash
Colgate Palmolive
Water, sodium laureth sulphate, cocamidopropyl betaine, Cocamide DEA, Lauryl glucoside, polyquternium-7, fragrance, glycoldisterate, laureth-4, sodium chloride, sodium sulphate, citric acid, poloxamer,124, sodium styrene/acrylates copolymer, DMDM hydantoin, methylchloroisothiszolinone, methyisothiazolinone, tetra sodium EDTA, Honey, dry milk powder, colours.
GEL SHAVE
Gilette Series Gel
Procter & Gamble.
Aqua, Palmitic Acid, Triethanolamine, Isopentane, Glycerol Oleate, Stearic Acid, Sorbitol, Parfum, Isobutane, Hydroxyethylcellulose, PEG-90M, Propylene Glycol, Aloe Barbadensis Leaf Juice, Silica, BHT, Benzyl Salicylate, Hexyl Cinnamal, Limonene, Linalool, CI 42090.
SHAVING FOAM
Mennen Rapid
Colgate-Palmolive
Water, Tea-Stearate, Butane, Isobutane, Propane, Laureth-23, Sodium Lauryl Sulphate, Fragrance, Glycerine, Steareth-2, Isopropyl Myristate, Isopropyl Palmitate, Dimethicone Copolyol, Aloe Vera Gel, PEG-90M.
HAIR REMOVAL
CREAM
Reckitt Benckiser
Aqua, Urea, Cetearyl Alcohol, Potassium Thioglycolate, Calcium Hydroxide, Ceteareth-20, PPG-15 Stearyl Ether, Butyrospermum Parkii (Shea Butter), Magnesium Trisilicate, Sodium Magnesium Silicate, Propylene Glycol, Prunus Amygdalus Dulcis (Sweet Almond) Oil ,
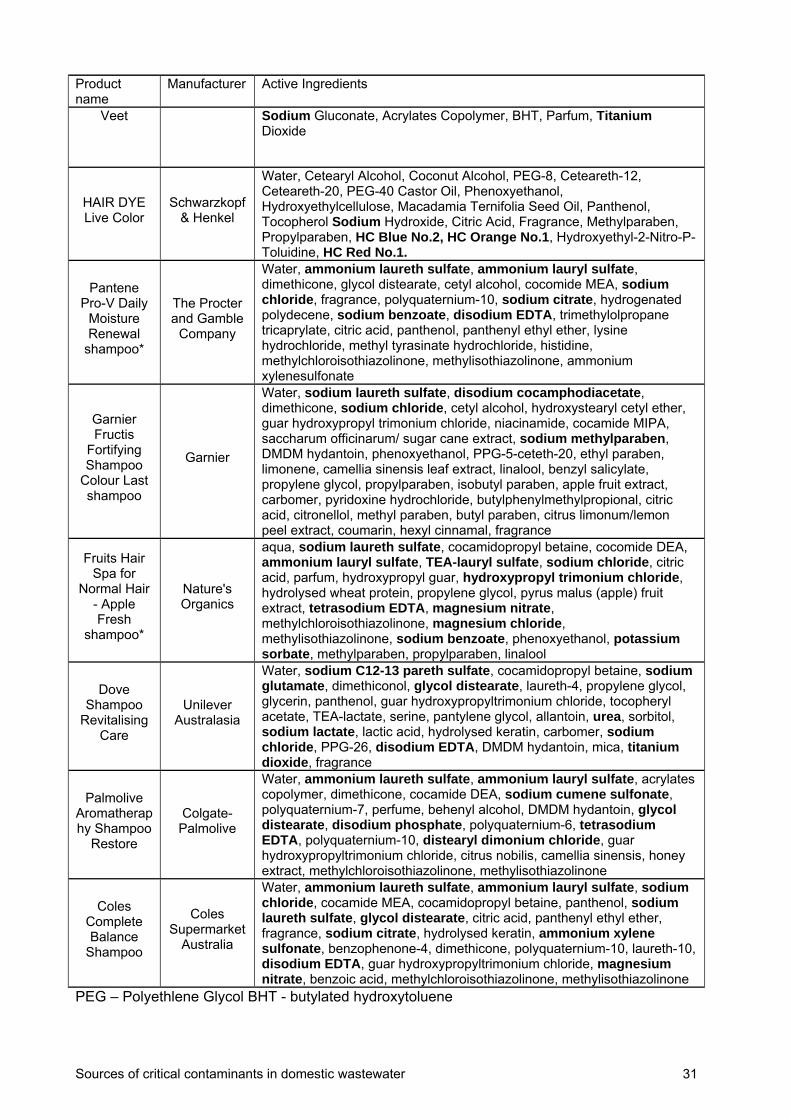
Sources of critical contaminants in domestic wastewater 31
Product name
Manufacturer Active Ingredients
Veet Sodium Gluconate, Acrylates Copolymer, BHT, Parfum, Titanium Dioxide
HAIR DYE Live Color
Schwarzkopf & Henkel
Water, Cetearyl Alcohol, Coconut Alcohol, PEG-8, Ceteareth-12, Ceteareth-20, PEG-40 Castor Oil, Phenoxyethanol, Hydroxyethylcellulose, Macadamia Ternifolia Seed Oil, Panthenol, Tocopherol Sodium Hydroxide, Citric Acid, Fragrance, Methylparaben, Propylparaben, HC Blue No.2, HC Orange No.1, Hydroxyethyl-2-Nitro-P-Toluidine, HC Red No.1.
Pantene Pro-V Daily
Moisture Renewal
shampoo*
The Procter and Gamble
Company
Water, ammonium laureth sulfate, ammonium lauryl sulfate, dimethicone, glycol distearate, cetyl alcohol, cocomide MEA, sodium chloride, fragrance, polyquaternium-10, sodium citrate, hydrogenated polydecene, sodium benzoate, disodium EDTA, trimethylolpropane tricaprylate, citric acid, panthenol, panthenyl ethyl ether, lysine hydrochloride, methyl tyrasinate hydrochloride, histidine, methylchloroisothiazolinone, methylisothiazolinone, ammonium xylenesulfonate
Garnier Fructis
Fortifying Shampoo
Colour Last shampoo
Garnier
Water, sodium laureth sulfate, disodium cocamphodiacetate, dimethicone, sodium chloride, cetyl alcohol, hydroxystearyl cetyl ether, guar hydroxypropyl trimonium chloride, niacinamide, cocamide MIPA, saccharum officinarum/ sugar cane extract, sodium methylparaben, DMDM hydantoin, phenoxyethanol, PPG-5-ceteth-20, ethyl paraben, limonene, camellia sinensis leaf extract, linalool, benzyl salicylate, propylene glycol, propylparaben, isobutyl paraben, apple fruit extract, carbomer, pyridoxine hydrochloride, butylphenylmethylpropional, citric acid, citronellol, methyl paraben, butyl paraben, citrus limonum/lemon peel extract, coumarin, hexyl cinnamal, fragrance
Fruits Hair Spa for
Normal Hair - Apple Fresh
shampoo*
Nature's Organics
aqua, sodium laureth sulfate, cocamidopropyl betaine, cocomide DEA, ammonium lauryl sulfate, TEA-lauryl sulfate, sodium chloride, citric acid, parfum, hydroxypropyl guar, hydroxypropyl trimonium chloride, hydrolysed wheat protein, propylene glycol, pyrus malus (apple) fruit extract, tetrasodium EDTA, magnesium nitrate, methylchloroisothiazolinone, magnesium chloride, methylisothiazolinone, sodium benzoate, phenoxyethanol, potassium sorbate, methylparaben, propylparaben, linalool
Dove Shampoo
Revitalising Care
Unilever Australasia
Water, sodium C12-13 pareth sulfate, cocamidopropyl betaine, sodium glutamate, dimethiconol, glycol distearate, laureth-4, propylene glycol, glycerin, panthenol, guar hydroxypropyltrimonium chloride, tocopheryl acetate, TEA-lactate, serine, pantylene glycol, allantoin, urea, sorbitol, sodium lactate, lactic acid, hydrolysed keratin, carbomer, sodium chloride, PPG-26, disodium EDTA, DMDM hydantoin, mica, titanium dioxide, fragrance
Palmolive Aromatheraphy Shampoo
Restore
Colgate-Palmolive
Water, ammonium laureth sulfate, ammonium lauryl sulfate, acrylates copolymer, dimethicone, cocamide DEA, sodium cumene sulfonate, polyquaternium-7, perfume, behenyl alcohol, DMDM hydantoin, glycol distearate, disodium phosphate, polyquaternium-6, tetrasodium EDTA, polyquaternium-10, distearyl dimonium chloride, guar hydroxypropyltrimonium chloride, citrus nobilis, camellia sinensis, honey extract, methylchloroisothiazolinone, methylisothiazolinone
Coles Complete Balance
Shampoo
Coles Supermarket
Australia
Water, ammonium laureth sulfate, ammonium lauryl sulfate, sodium chloride, cocamide MEA, cocamidopropyl betaine, panthenol, sodium laureth sulfate, glycol distearate, citric acid, panthenyl ethyl ether, fragrance, sodium citrate, hydrolysed keratin, ammonium xylene sulfonate, benzophenone-4, dimethicone, polyquaternium-10, laureth-10, disodium EDTA, guar hydroxypropyltrimonium chloride, magnesium nitrate, benzoic acid, methylchloroisothiazolinone, methylisothiazolinone
PEG – Polyethlene Glycol BHT - butylated hydroxytoluene

Sources of critical contaminants in domestic wastewater 32
6.6.2. Suncreens
There are both organic and inorganic UV shielding components used in sunscreens (Table 12). There may be a health and safety issue with organic UV absorbers as it has been suggested they cause skin irritation and demonstrate estrogenic properties at high concentrations. P-aminobenzoates has been used but is being replaced with other compounds such as octylmethoxycinnamate, octyl salicylate, 2- hydroxy-4-methoxybenzophenone and salicylic acid 3,3,5-trimethylcyclohexyl ester which do not contain contaminants of concern in this study. However, inorganic compounds used include titanium oxide, zinc oxide and cerium oxide which will contribute to the metal content of wastewater as they will be washed off when showering or bathing.
Other components in sunscreens are required in order to ensure the UV absorber is maintained in a stable suspension and allow even distribution of the sunscreen on the skin. These components need to be UV stable, soluble in the base materials but not in water or perspiration.
Table 12: Suncreens and their active components
SUNSCREENS
Product Manufacturer Ingredients
Coles Persona SPF
30+ sunscreen
lotion
Coles Supermarkets
Australia
Contains: phenoxyethanol 6 mg/g, hydroxybenzoates 4 mg/g, phenethyl alcohol 50 mcg/g
Active Ingredients: octyl methoxycinnamate 80 mg/g, 4-methylbenzylidene camphor 30 mg/g, butyl methoxydibenzoylmethane 20
mg/g
Banana Boat Kid's SPF 30+ Very
High Protection *
Sun Pharmaceuticals
Corp
octyl methoxycinnamate 7.00% w/w, 4-methyl benzylidene camphor, 1.00% w/w, zinc oxide (micronised) 6.00% w/w
Preservatives: phenoxyethanol 0.72% w/w, diazolidinylurea 0.30 % w/w, hydroxybenzoates 0.28% w/w
Australian Cancer Society
Sunscreen Sport SPF
30+
Skin Health Pty Ltd
Preservatives: phenoxyethanol 7.2 mg/g, diazolidinyl urea 3.0 mg/g, total hydroxybenzoates 2.8 mg/g
Active Ingredients: octyl methoxycinnamate 70.0 mg/g, zinc oxide 60.0 mg/g, 4-methylbenzylidene camphor 10.0 mg/g
UV Tripleguard Sunstick *
Boots Healthcare
octyl methoxycinnamate 100 mg/g, octocrylene 40 mg/g, zinc oxide 50 mg/g
Preservatives: propyl hydroxybenzoate 500 micrograms/g
Le Tan Sunblock
Lotion SPF 30+
Creative Brands
Active Ingredients: octyl methoxycinnamate 80 mg/g, 4-methylbenzylidene camphor 30 mg/g, butyl methoxydibenzoylmethane 20
mg/g
Preservatives: phenoxyethanol 7.2 mg/g, total hydroxybenzoates 2.8 mg/g, phenethyl alcohol 128 mg/g
6.6.3. Deodorants and lotions
Deodorants and anti-perspirants are substances that mask odours and reduce the amount of perspiration produced. The main active compounds in deodorants and anti- perspirant are aluminium or zinc salts. Typical formulations contain astringent compounds to reduce the amount of perspiration produced and a bacteride, eg. alcohol and perfume. (Table 13).
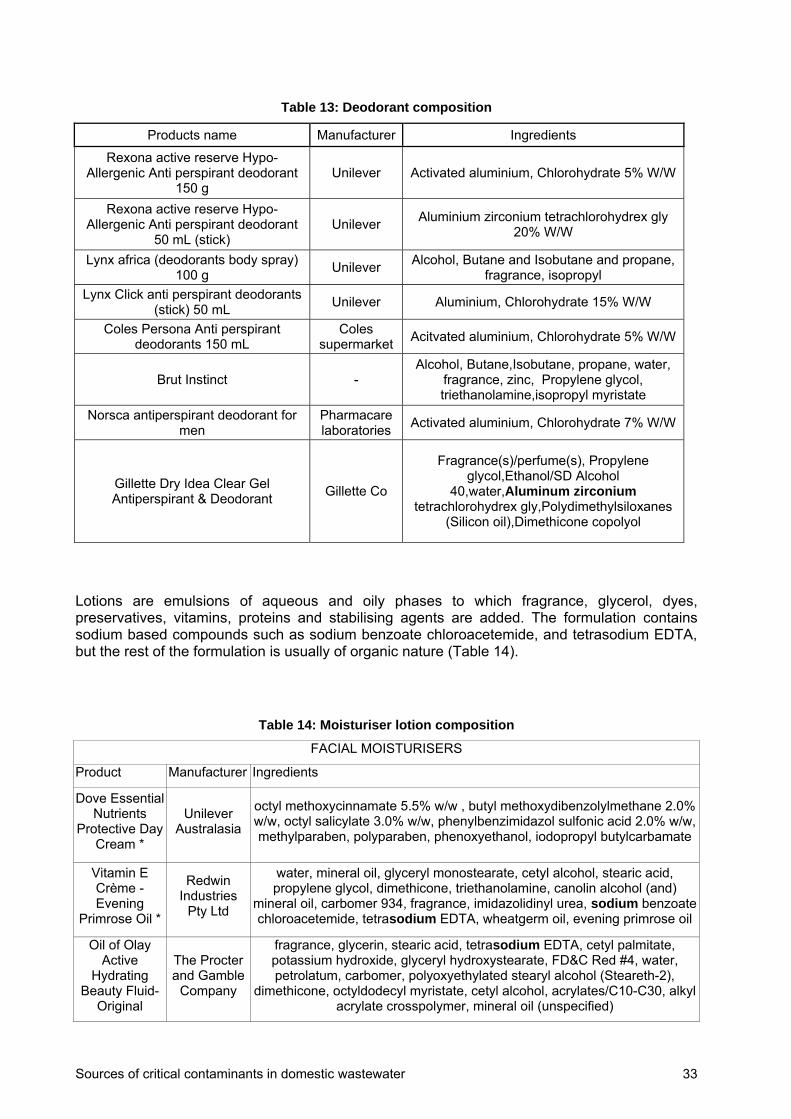
Sources of critical contaminants in domestic wastewater 33
Table 13: Deodorant composition
Products name Manufacturer Ingredients
Rexona active reserve Hypo-Allergenic Anti perspirant deodorant
150 g Unilever Activated aluminium, Chlorohydrate 5% W/W
Rexona active reserve Hypo-Allergenic Anti perspirant deodorant
50 mL (stick) Unilever
Aluminium zirconium tetrachlorohydrex gly 20% W/W
Lynx africa (deodorants body spray) 100 g
Unilever Alcohol, Butane and Isobutane and propane,
fragrance, isopropyl
Lynx Click anti perspirant deodorants (stick) 50 mL
Unilever Aluminium, Chlorohydrate 15% W/W
Coles Persona Anti perspirant deodorants 150 mL
Coles supermarket
Acitvated aluminium, Chlorohydrate 5% W/W
Brut Instinct - Alcohol, Butane,Isobutane, propane, water,
fragrance, zinc, Propylene glycol, triethanolamine,isopropyl myristate
Norsca antiperspirant deodorant for men
Pharmacare laboratories
Activated aluminium, Chlorohydrate 7% W/W
Gillette Dry Idea Clear Gel Antiperspirant & Deodorant
Gillette Co
Fragrance(s)/perfume(s), Propylene glycol,Ethanol/SD Alcohol
40,water,Aluminum zirconium tetrachlorohydrex gly,Polydimethylsiloxanes
(Silicon oil),Dimethicone copolyol
Lotions are emulsions of aqueous and oily phases to which fragrance, glycerol, dyes, preservatives, vitamins, proteins and stabilising agents are added. The formulation contains sodium based compounds such as sodium benzoate chloroacetemide, and tetrasodium EDTA, but the rest of the formulation is usually of organic nature (Table 14).
Table 14: Moisturiser lotion composition
FACIAL MOISTURISERS
Product Manufacturer Ingredients
Dove Essential Nutrients
Protective Day Cream *
Unilever Australasia
octyl methoxycinnamate 5.5% w/w , butyl methoxydibenzolylmethane 2.0% w/w, octyl salicylate 3.0% w/w, phenylbenzimidazol sulfonic acid 2.0% w/w, methylparaben, polyparaben, phenoxyethanol, iodopropyl butylcarbamate
Vitamin E Crème - Evening
Primrose Oil *
Redwin Industries
Pty Ltd
water, mineral oil, glyceryl monostearate, cetyl alcohol, stearic acid, propylene glycol, dimethicone, triethanolamine, canolin alcohol (and)
mineral oil, carbomer 934, fragrance, imidazolidinyl urea, sodium benzoate chloroacetemide, tetrasodium EDTA, wheatgerm oil, evening primrose oil
Oil of Olay Active
Hydrating Beauty Fluid-
Original
The Procter and Gamble
Company
fragrance, glycerin, stearic acid, tetrasodium EDTA, cetyl palmitate, potassium hydroxide, glyceryl hydroxystearate, FD&C Red #4, water, petrolatum, carbomer, polyoxyethylated stearyl alcohol (Steareth-2),
dimethicone, octyldodecyl myristate, cetyl alcohol, acrylates/C10-C30, alkyl acrylate crosspolymer, mineral oil (unspecified)

Sources of critical contaminants in domestic wastewater 34
FACIAL MOISTURISERS
Product Manufacturer Ingredients
Ponds Nourishing Moisturiser
Lotion
Chesebrough Ponds USA Company
(Lever Brothers
Company)
fragrance, glycerin, stearic acid, cholesterol, retinyl palmitate, propylparaben, methylparaben, triethanolamine, glyceryl stearate,
disodium EDTA, myristyl myristate, DMDM hydantoin, tocopheryl acetate, water, carbomer, dimethicone, titanium dioxide, caprylic triglyceride,
cetostearyl alcohol, cyclomethicone, hydrolysed wheat protein, laureth-23
Revlon Eterna 27 All Day Moisture Cream
Revlon Inc.
fragrance, diisopropyl dimerate, TEA-carbomer 940, glucose, glutamic acid, urea, fructose, sucrose, propylparaben, methylparaben, hexylene glycol,
butylene glycol, alanine, aspartic acid, water, paraffin, lanolin alcohol, dextrin, polyethylene glycol monostearate, polyoxyethylated stearyl alcohol, PEG-60, dimethicone 350, hydrolysed collagen, octyl hydroxystearate, octyl
palmitate, imidazolidinyl urea, cetostearyl alcohol, pentahydrosqualene, mineral oil
6.6.4. Oral hygiene
Compounds present in toothpaste include abrasives (10-40%), humectants (20-70%), water (5-30%), binders (1-2%), detergents (1-3%), flavour (1-2%), preservatives (0.05-0.5%) and therapeutic agents (0.1-0.5%).
The actual composition of toothpaste will vary with each brand and toothpaste type, but typical formulations contain ingredients that could contribute to TDS and turbidity such as inorganic salts (phosphates, sodium, sulphate). Some formulations also include baking soda (Table 16).
Mouth wash consists mainly of water with small amounts of antiseptic ingredients (eg.ethanol, cetylpyridinium chloride), flavour (sodium saccharin) and preservative (e.g.sodium benzoate ).
Brushing teeth has been observed to result in release of Hg from amalgam that is either ingested or discharged with greywater (Colquitt 2002). The release rate increases with brushing time. Additionally release of particles of Fe, Ni, Cr from the heads of powered toothbrushes has been observed in Australia (Colquitt 2002). The amount released varied with toothpaste brand, but the amounts were minute 20-135 g of Fe, 3-20 g Cr and 3 -17 g Ni for 6min brushing (Colquitt 2002).
Table 15: Typical ingredients used in toothpaste
Gums Sodium carboxymethyl cellulose, cellulose ethers, xanthan gum, carrageenans
Sodium alginate, carbopols
Inorganic Thickeners
Silica thickeners, Sodium aluminum silicates, Clays
Abrasives Hydrated silica, Dicalcium phosphate dehydrate, Calcium carbonate, Sodium bicarbonate, Calcium pyrophosphate, Alumina, Titanium dioxide, Silicon dioxide, Aluminium oxide.
Surfactants Sodium lauryl sulphate, Sodium N-lauryl sarcosinate, Pluronics, Sodium lauryl sulfoacetate
Humectants Glycerine, Sorbitol, Propylene glycol, Xylitol, Polyethylene glycol
Tartar Control Ingredient
Tetrasodium pyrophosphate, Gantrez S-70, Sodium tri-polyphosphate
Fluoride Monofluorophosphate. In Australia, the maximum fluoride concentration in toothpastes sold in supermarkets is 1000 ppm (0.76% sodium monofluorophosphate).

Sources of critical contaminants in domestic wastewater 35
Table 16: Composition of common oral hygiene products
TOOTHPASTE
Product Name Manufacturer Ingredients
Colgate Total-12
Colgate Palmolive Pty Ltd
Water, hydrated silica, glycerin, sorbitol, PVM/MA, copolymer, sodium lauryl sulphate, flavour, carrageenan, titanium dioxide, sodium saccharin, triclosan, sodium fluoride. No sugar.
Colgate Baking Soda and Peroxide
Colgate Palmolive Pty Ltd
Glycerin, hydrated silicate, sodium bicarbonate, water, propylene glycol, sodium tripoly phosphate, tetrasodium pyrophosphate, sodium lauryl sulphate, flavour, sodium monofluorophosphate, calcium peroxide, titanium peroxide, sodium saccharin, cellulose gum, carrageenan, pigment blue no. 15.
Cedel Soft Polish Spearmint
Cedel Products (Australasia) Pty Ltd
Water, calcium carbonate, glycerin, aluminium hydroxide, silica, sodium lauryl sulphate, cellulose gum, sodium monofluorophosphate, sodium saccharin, methyl paraben, flavours, mineral oil, PEG-60, hydrogenated castor oil, BHA.
Oral-B Oral-B Methyl hydroxybenzoate 1.5mg/g, propyl hydroxybenzoate 0.5mg/g Sensodyne Fresh Impact
Sensodyne Sorbitol solution 70% (non-crystallising), water purifier, silicon dioxide, glycerol, potassium nitrate, sodium lauryl sulphate, xanthan gum, flavour, titanium dioxide, sodium fluoride, saccharin sodium, sodium hydroxide, menthol, Cl42090, peppermint oil, spearmint oil.
Macleans Extreme Clean
Macleans Water, sorbitol, hydrated silica, glycerin, PEG-6, sodium lauryl sulphate, flavour, xanthan gum, titanium dioxide, cocamidopropyl betaine, sodium saccharin, sodium fluoride, Cl77492, Cl73360.
Listerine Maximum Defence
Pfizer Pty Ltd Sorbitol, water, synthetic amorphous silica, silicon dioxide, glycerin, polyethylene glycol, sodium lauryl sulphate, cellulose gum, sodium saccharin, eucalyptol, sodium monofluorophosphate, methyl salicylate, thymol phosphoric acid, titanium dioxide, menthol, sodium phosphate, xanthan gum, flavours, benzoic acid, FD&C Blue No. 1, D&C Yellow No. 10.
Woolworths Herbal Toothpaste
Woolworths Sorbitol, water, hydrated silica, glycerin, PEG-8, cellulose gum, sodium lauryl sarcosinate, sodium ascorbyl phosphate, flavour, carum petroselinium parsley seed oil, titanium dioxide, sodium saccharin, methyl paraben, disodium EDTA.
Colgate Maximum Cavity Protection – Cool Mint
Colgate Palmolive Pty Ltd
Sorbitol, hydrated silica, water, PEG-12, sodium lauryl sulphate, cellulose gum, flavour, tetrasodium pyrophosphate, sodium saccharin, sodium fluoride, FD&C Blue No. 1.
MOUTHWASH
Product Name Manufacturer Ingredients
Listerine Cool Mint
Pfizer Pty Ltd Ethanol 0.22mL/mL, benzoic acid 1.5mg/mL, thymol 0.64mg/mL, cineole (eucalyptol) 0.92mg/mL, saccharin sodium.
Colgate Plax Colgate Palmolive Pty Ltd
Water, glycerin, alcohol, propylene glycol, sorbitol, PEG-40, sorbiten diisostearate, flavour, sodium benzoate, cetylpyridinium chloride, sodium saccharin, D&C Yellow No. 10, FD&C Blue No. 1.
Oral-B Oral-B Purified water, glycerin, polysorbate 20, flavour, methyl paraben 0.1% w/w, cetylpyridinium chloride (cpc) 0.05% w/w, sodium fluoride 0.05% w/w, sodium saccharin, sodium benzoate, propylparaben 0.01% w/w, brilliant FCF Cl42090, quinoline yellow Cl47005.
Anti-plaque regular
Home Brand Ethanol 12%, cetylpyridum chloride 0.1% w/v, also contains sodium benzoate.

Sources of critical contaminants in domestic wastewater 36
6.7. Infrastructure
Water and wastewater infrastructure can affect the quality of water and sewage by mechanisms such as migration of stabilisers, and/or corrosion of materials used in the plumbing and storage of water in the household and reactions between substances in water and pipe materials. Examples of such interactions include blue water events due to copper pipe corrosion (O’Halloran et al 2003) and increased zinc levels in water stored in galvanised iron rainwater tanks (NHMRC 2004). Higher metal loads of Pb, Cu and Zn were observed in water for certain types of distribution plumbing: in Germany +70% Cu for copper plumbing, +600% Pb for Pb plumbing , +30% higher for Zn plumbing and +55% for Cd in Fe plumbing (Koch and Rotard 2001 (Germany), Isaac et al 1997 (USA) and WRc 1994 (UK) in Icon 2001). Higher levels of Cr, Ni and Zn in wastewater were attributed to blackwater transported in galvanized pipes in a study in Sweden (Vinneras et al 2006)
The processes that promote the release of foreign substances into water and sewage are influenced by environmental conditions and water characteristics such as temperature, pH, water or sewage quality, workmanship and installation practices and the quality of the final product.
Water quality affects different pipe materials differently. Acidic soft water increases Pb dissolution, but some soft waters in the UK were less aggressive than hard waters for Cu and Zn (Comber and Gunn 1996).
Pipe related dissolution tends to be higher for new pipes (1st flush) falling of after wards(Cu, Pb and Zn) (Comber and Gunn 1996).
Australian standards specify material requirements and performance to safeguard the integrity of the products. Pipes and fittings that are in contact with potable water need to comply with organoleptic tests to verify their potential to contaminate water as set in AS4020-1999. Pipes used in sewerage are tested mainly for chemical resistance and the impact of degradation on structural integrity, eg. Vitrified clay (AS1741-1991) and concrete (AS 4198-1994) and standards have not been designed to evaluate potential migration/leaching into wastewater.
The age of infrastructure can also impact the release of contaminants. In the case of copper and cadmium, a new residential estate (<5years) had twice the concentration of copper and cadmium in the wastewater compared to an established estate (>40years) in the UK (Rule et al 2006). The values measured were 0.37g/L and 0.15g/L for Cd and 242g/L and 130g/L for copper for new and old estates respectively. The concentrations of copper and cadmium were also higher in new estates compared to light industrial and commercial catchments, which are generally higher than in old estates (Rule et al 2006). .Nickel, zinc and lead concentrations were similar for old and new estates and chromium and mercury concentrations were low for both, being either at, or below the limit of detection (Rule et al 2006). Similar values were recorded for domestic, light industrial and commercial readings by Comber and Gunn (1996).
6.7.1. Materials
Materials allowed in the infrastructure for water supply and sewerage are specified in AS2200-2006 (Standards Australia and New Zealand 2006). These include:
Asbestos cement,
Bitumen lined concrete,
Brass,
Cast iron
Cement mortar lined/coal-tar enamel lined steel,
Lined and unlined concrete,

Sources of critical contaminants in domestic wastewater 37
Copper,
Galvanised steel,
Thermoplastics: Poly vinyl chloride (PVC), polyethylene (PE), acrylonitrile butadiene styrene, polypropylene,
Thermosetting polymers,
Steel with polyethylene lining,
Epoxy lined ductile iron and steel,
Bitumen/cement mortar lined ductile iron, and
Fibre cement.
Additionally, major sewer trunks made of lined brick are also present in Melbourne.
At the household level, the materials most often used in the service infrastructure are:
Copper and copper alloys, in water supply pipes, end connectors and tapware,
Poly (vinyl chloride) (PVC), in water and sewage pipes and fittings,
Vitrified clay, used for connection between household and sewer main,
Polyethylene (PE), in hot water pipes and water supply,
ABS in non-pressure applications,
Cast iron in gullies and fittings,
Brass fittings,
Stainless steel, in fittings and tapware (austenitic or duplex stainless steel)
Acetal, in tapware components,
Ceramics, in tapware components,
Metal fillers: silver brazing alloy (with a min 1.8% Ag) and Solder with a max.0.1%Pb,
Alloys, in tapware components (phosphor bronze, Ni-Cu-Iron-, zinc alloy die castings)
Galvanised iron, used in older houses, pre-1970, for water supply
Lead soldered pipes, sometimes found in older houses.
Of these materials, copper and polyethylene pipes are most commonly used for water supply and PVC and vitrified clay pipes are used for sewage transport from the property. In older households, pre-1950, galvanised pipes were also commonly used for water supply and sewerage. Other materials that can be used are outlined in the Plumbing Code of Australia (NPRF 2004).
The review will focus on copper, PVC, PE and vitrified clay pipes.
6.7.2. Copper pipes
Copper pipes can impact on water quality by release of corrosion products and under certain conditions affect colour of water (O’Halloran 2002) and consequently of wastewater. Copper pipes are used in most households for the supply of water to the taps in the kitchen, bathroom, toilet, or laundry. Their popularity is largely due to corrosion resistance and strength, reliability and ease of use. The corrosion resistance is attributed to the formation of a layer of CuO at the interface of the pipe, however environmental conditions can result in the breakdown of this layer leading to corrosion. Typical corrosion mechanisms include biocorrosion, which
Sources of critical contaminants in domestic wastewater 38
occurs in waters with low chlorination residual, and chemical corrosion, instigated by particular water quality characteristics, e.g. low pH and high carbonate content (O’Halloran et al 1998). Copper is present in uncontaminated surface waters at very low concentrations, usually less than 0.01 mg/L. In drinking-water copper levels are on average 0.05mg/L, but they can range from ≤0.005 to 0.8 mg/litre, with the primary source most often being the corrosion of interior copper plumbing (NHMRC 2004). However, under hard water conditions, concentrations equal or greater than 1.5-2mg/L can be reached (O’Halloran et al 2002, Comber and Gunn 1996) and in one extreme case overseas, a concentration of 22 mg/L has been reported (WHO 2004).
Wilkie et al. (1996) argued that in Melbourne, 40% of the Cu load to WWTP could be attributed to corrosion of copper pipes. In a study conducted in Adelaide, at least 60% of the copper load was estimated to be generated by plumbing at the household level (Lock 1994). Other studies attribute up to 93% of the load to domestic plumbing (Comber and Gunn 1996). In the Adelaide study, the passage via household plumbing to tap increased the original water supply Cu levels by 2.5 to 40 times, and the concentration of Cu was higher in hot water taps (also verified in Comber and Gunn 1996). On the other hand hot water taps are not used as frequently and hold stagnant water for longer periods compared cold water pipes (Lock 1994). Copper levels in sewage increase during periods of wastewater peak flow (morning and after work hours), are consistent with the release of copper corrosion products from plumbing circuits after periods of stagnation (Taylor et al 1998).
Cu and Zn dissolution increased with water hardness, with Cu dissolution correlating with age, but not Zinc (Comber and Gunn 1996).
6.7.3. PVC
PVC pipes are used in the household sewage transport and for stormwater drainage with increasing popularity since the 1970s. Stabilisers are added to the PVC pipe formulation at manufacture to aid the processing and to improve the material resistance to heat and ultraviolet radiation. These are usually bound to the PVC matrix and immobile, however degraded and excess stabiliser was verified to migrate into water (Davis et al 2005).
Originally lead based salts were used to stabilise manufactured PVC pipe (tri-and tetra-basic lead sulfate, di-basic lead phosphate and di-basic lead stearate). However, as concerns emerged on the impact of lead, these were banned and were substituted with less toxic metal salts, such as cadmium, tin and barium stearates (Guillert 1990, Berger 1989 in Davis et al 2005), calcium-zinc stearate combination and organic stabilisers. Other additives such as zinc oxide, titanium dioxide and/or carbon black are used as fillers.
Currently, majority of the PVC pipes in Australia are made with combination of calcium/zinc stearate combination stabilisers, whilst organotin stabilisers are used in the USA (Davis et al 2005).
The migration rate of stabilizers from PVC pipes is highest during the initial operation after installation, decreasing rapidly to trace levels as the degraded and excess stabilizer accumulated on the pipe surface is removed (Packham 1971b, Sadiki and Williams 1999 in Davis et al 2005). During this initial period metal concentrations in excess of the recommended guideline values could occur (Davis et al 2005). In established systems, the amount leached is below detection or within permitted quality guideline values. Information on the migration of metal-based stabilizers other than lead and tin is limited. This is partly due to the minimal toxicity of replacement stabilisers, Ca, Zn and the insoluble barium (Ba), and the absence of deleterious effects have been verified due to their ingestion. As reported in Davis et al (2005), the process of migration of stabilisers is dependent on:
(a) Stabiliser type, (b) pH, acid pH accelerates tin, calcium and cadmium stabiliser migration;
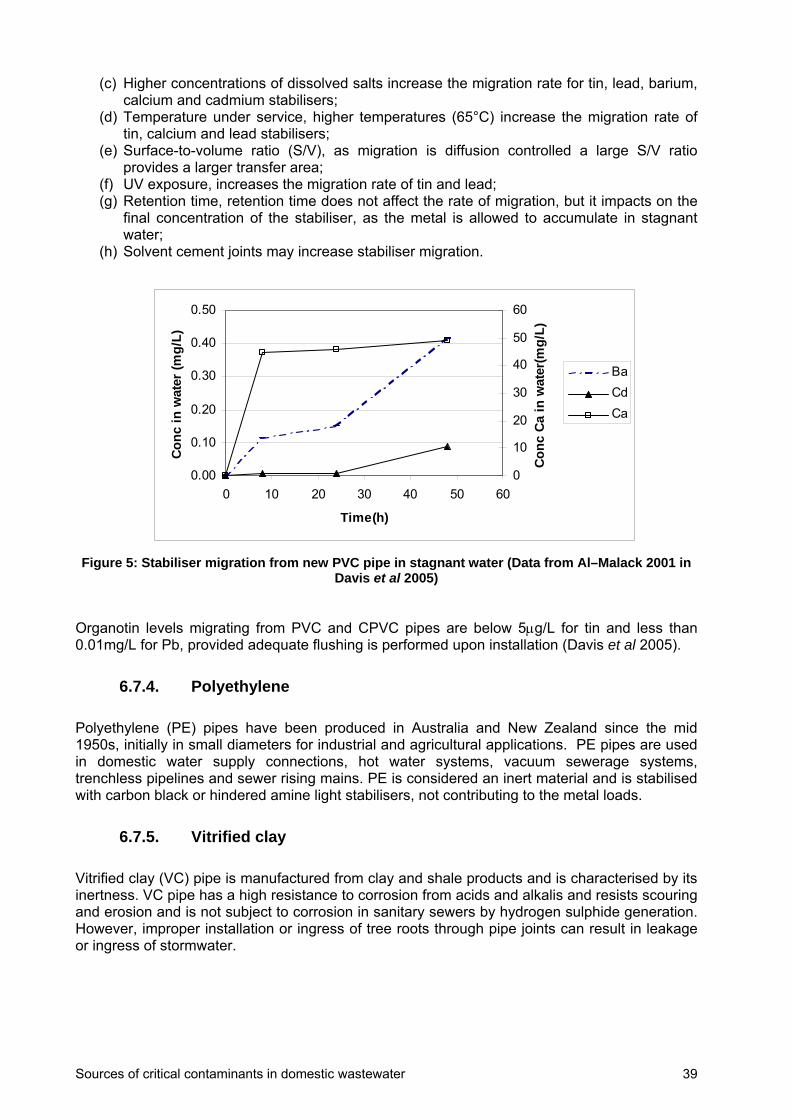
Sources of critical contaminants in domestic wastewater 39
(c) Higher concentrations of dissolved salts increase the migration rate for tin, lead, barium, calcium and cadmium stabilisers;
(d) Temperature under service, higher temperatures (65°C) increase the migration rate of tin, calcium and lead stabilisers;
(e) Surface-to-volume ratio (S/V), as migration is diffusion controlled a large S/V ratio provides a larger transfer area;
(f) UV exposure, increases the migration rate of tin and lead; (g) Retention time, retention time does not affect the rate of migration, but it impacts on the
final concentration of the stabiliser, as the metal is allowed to accumulate in stagnant water;
(h) Solvent cement joints may increase stabiliser migration.
0.00
0.10
0.20
0.30
0.40
0.50
0 10 20 30 40 50 60
Time(h)
Co
nc
in w
ater
(m
g/L
)
0
10
20
30
40
50
60
Co
nc
Ca
in w
ater
(mg
/L)
Ba
Cd
Ca
Figure 5: Stabiliser migration from new PVC pipe in stagnant water (Data from Al–Malack 2001 in
Davis et al 2005)
Organotin levels migrating from PVC and CPVC pipes are below 5g/L for tin and less than 0.01mg/L for Pb, provided adequate flushing is performed upon installation (Davis et al 2005).
6.7.4. Polyethylene
Polyethylene (PE) pipes have been produced in Australia and New Zealand since the mid 1950s, initially in small diameters for industrial and agricultural applications. PE pipes are used in domestic water supply connections, hot water systems, vacuum sewerage systems, trenchless pipelines and sewer rising mains. PE is considered an inert material and is stabilised with carbon black or hindered amine light stabilisers, not contributing to the metal loads.
6.7.5. Vitrified clay
Vitrified clay (VC) pipe is manufactured from clay and shale products and is characterised by its inertness. VC pipe has a high resistance to corrosion from acids and alkalis and resists scouring and erosion and is not subject to corrosion in sanitary sewers by hydrogen sulphide generation. However, improper installation or ingress of tree roots through pipe joints can result in leakage or ingress of stormwater.

Sources of critical contaminants in domestic wastewater 40
6.7.6. Hot Water Services
The concentration of metals in water from hot water services is likely to be higher than in cold water services due to the effect of increased temperature on corrosion (Taylor et al 1998; Rushing and Edwards, 2004). The magnitude of this increase will primarily be dependent on the materials of construction of the hot water service, the temperature profiles within the unit and the characteristics of the feed water. However, limited data are available to confirm this.
A Finnish study reports the Fe, Zn, Cu, Al Ca, Mg, Na, K, St and Mn concentrations for two different water sources (surface and bore water), before and after the hot water system (Zacheus and Martikainen, 1997). Hot water was generated by either district heating or oil heating with predominantly copper hot water pipes. In this study, an increase of Cu from 0.01 to 0.08 mg/L before and after the heating system, was observed and there were positive correlations between Cu, Zn and Fe which were also positively correlated with colour. In a study in Adelaide, the concentration of Cu was found to be higher in hot water taps (Lock 1994). Another study which is currently being undertaken by the CRC Water Quality and Treatment (Chapman et al., 2006) examines the use of rainwater in hot water services in Australia. As rainwater is generally soft and of low pH, this may cause increased corrosion where it is used in copper or other metal appliances.
6.7.7. Appliances and activities
Metal input from household appliances has been investigated in a couple of overseas studies. Friedler and Buttler (1996) analysed contaminant loads based on signatures for common household appliances and found no apparent correlation between metal pollutant concentration and appliance volume. Meanwhile in the evaluation of household activities, the washing machine was identified as a major source of Cr, Pb, Cu and TDS to sewer, but not for Cd and Zn as seen in a UK study as seen in Table 17(Comber and Gunn 1996).
Table 17: Load for activities in a hard water catchment (Comber and Gunn 1996 in Icon 2001)
Activity Zn (g/pe/d)
Cu (g/pe/d)
Pb (g/pe/d)
Cd (g/pe/d)
Ni (g/pe/d)
Cr (g/pe/d)
Washing machine
4452 977 515 11 52 238
Dishwasher 42 8 6 1.3 2 10
Hand dishwashing
1010 <20 46 7.8 138 136.7
Bathing
1095 67 45 13.1 9 7.4
Toilet
11400 2104 121 48 284 51.5
Miscellaneous
Input water
39-2531 69-10651 2.9- 63 0.03-2.0 2-77 0.3-7
6.7.8. The impact of infrastructure
In conclusion, the impact of polymeric pipes and vitrified clay pipes to the load of critical contaminants is likely to be insignificant compared to metal pipes. Among the polymeric pipes commonly used in the household, PVC is the only pipe that contains metal stabilizers (Ca/Zn

Sources of critical contaminants in domestic wastewater 41
stearates) and only excess or degraded metal additives will migrate from the pipe, but the migration rate decreases rapidly after initial operation as the degraded stabilizer is exhausted.
Metallic pipes such as copper, galvanized pipe and metallic fittings corrode provided the environmental conditions are favourable. In the case of copper, the corrosion processes are generally favoured by stagnant water pockets, hard water, low chlorine levels and high temperatures (Taylor et al 1998). In the case of zinc, additional input has been verified from infrastructure in Adelaide (Lock 1994) and some overseas studies and attributed to galvanized pipes and fittings and stainless steel infrastructure (Comber and Gunn 1996, Vinneras et al 2006), but the increase was not as high as that reported for copper. Lock reported an increase of 1.3 to 1.8 times the concentration of the initial water supply from the water main to the household tap (1995)
In an UK study in a hard water area, the metal contribution from plumbing within the household as a percentage of the total metal load in domestic wastewater was identified as (Comber and Gunn 1996 in Icon 2001):
Cu: bathing 12.4%>toilet 8.9%> washing machine = miscellaneous 8%> dishwashing 7.1%
Zn: toilet 2.1%>bathing 1.2% = miscellaneous 1.2%>washing machine 0.7%>dishwashing 0.6%
Cd: toilet 0.5%>bathing 0.3% = miscellaneous 0.3% >washing machine= dishwashing 0.2%
Ni: Toilet 4.%3>miscellaneous 2.4%>bathing 1.6%>washing machine 0.9%> dishwashing 0.8%
Pb: Toilet 8.1%>miscellaneous 6.1%>bathing 4.4 %> washing machine 3.2%>dishwashing 2.7%
Cr: Toilet 0.2 %= miscellaneous 0.2%>bathing 0.1 %= washing machine 0.1%= dishwashing 0.1%
However, the infrastructure type and material within that study had not been specified.
Sources of critical contaminants in domestic wastewater 42
7. Conclusions and recommendations
There are a limited number of studies that investigate the concentrations, range and sources of critical contaminants, As, Cd, Cu, Hg, Pb, Ni, Zn, TDS, colour and B in domestic wastewater, particularly for Australia. The majority of the studies conducted at the household level have focused on the characterization of wastewater and greywater parameters relevant to treatment technologies (BOD, COD, SS, TN, TP, ammonia, pH) and to pathogen risk (coliforms, viruses).
Besides the limited data, there is large variability in the range of detected concentrations and in the evaluation of flow rates and daily loads. Whilst overseas data is available and can be used to provide an indication of potential trends in contaminant management and potential sources, geographical differences can affect household habits, diet, water supply quality, water use patterns and infrastructure which in turn affect the sewage composition.
Sources of critical contaminants within households are many and although easy to identify, the assessment of primary sources is complex. One point on which relevant literature agreed was that within the household, sodium and other salts are present in most laundry and personal care products.
Potential sources of individual critical contaminants are given below. This information is summarised in Table 18.
7.1. Boron
The potential sources of boron in the household are blackwater in human waste and greywater, as boron has been reported as a component in some bathroom and laundry products. Although sources are still unclear the limited data suggests that greywater and in particular the laundry and the bathroom are the major contributors of Boron (Lock 1994). Further assessment of household products and confirmation of boron levels in domestic wastewater and in household products is required.
7.2. Arsenic
Limited information on the contribution from households is available. Data from studies of wastewater in Adelaide and greywater literature suggests that households are a small contributor to Arsenic in wastewater (Lock 1994). Earlier American studies identified arsenic as a contaminant in pre 1995 phosphate laundry detergents, which would have to be confirmed by product analysis. If present, the greywater stream appears to have the potential to be the major source of arsenic in wastewater with the bathroom, the dishwasher and the laundry as potential sources.
7.3. Copper
Overseas and Australian studies indicate that the input of Cu from domestic wastewater is significant, particularly in hard water areas. Overseas data attribute the contribution from domestic sources to range between 30-75% in Europe and 47-100% of total sewage load in Japan (Moriyama et al 1989). Stormwater was responsible for 52% of Cu load in residential catchments as estimated in Perth (Gray and Becker 2002).
The literature indicates that copper plumbing is a major source in the household being responsible for a minimum of 40% to 50% of the Cu wastewater load (Icon 2001, O’Halloran 2002, Lock 1994, Wilkie et al 1996, O’Halloran et al 2002) with up to 90% of this load arising from greywater (Gray and Becker 2002).

Sources of critical contaminants in domestic wastewater 43
Some of the variation in estimates could be caused by differences in infrastructure age and water quality (Comber and Gunn 1996). In areas with soft water that can also induce corrosion of copper plumbing, 40% of the Cu load to the WWTP was attributed to corrosion of pipes as observed for Melbourne (Wilkie et al 1996). On the other hand, studies in the UK indicate that in hard water areas, domestic sources contribute up to 64% Cu, of these 93% caused by plumbing interactions (Comber and Gunn 1996).
In the household, the majority of the load seems to come from the laundry and the bathroom, potentially because of the greater volume of water use.
7.4. Cadmium
Sewage arriving at the two Melbourne WWTP, has a high load of cadmium. However, there is great uncertainty in the identification of loads and sources of cadmium. The limited data from Australian domestic sites does not suggest that households are a significant source of cadmium. Cadmium levels measured in domestic wastewater were low, with concentrations recorded either at or close to the detection limits in Melbourne (Wilkie et al 1996, CWW 2006), in Adelaide (Lock 1994) and Australia averages (Gray and Becker 2002).
Instead, stormwater run-off is suspected the major source of cadmium and some authors estimate a potential contribution from stormwater of 44% of the total load (Gray and Becker, 2002).
At the household level there is limited agreement on the major sources of cadmium. Part of the difficulty in determining loads and sources is the low concentrations detected. It has been detected in some cases in laundry, bathroom and kitchen greywater but again at close to detection limits. Pre -1998 data from the USA (Jenkins 1998), indicated that Cd was present as a contaminant in phosphate used in laundry detergents which resulted in detergent reformulation to reduce its levels. Data from Europe suggests that some cadmium could be released from new development infrastructure (Rule et al 2006, Koch and Rotard 2001) potentially from galvanised parts/pipes and steel fittings and pipes. However, the levels tend to decrease with aging and the frequency of such infrastructure type in Melbourne households would need to be verified in order to assess the cadmium contribution from this source.
7.5. Lead
In Europe, primary lead sources have been identified as run-off, contributing >20% depending on traffic conditions, 30-80% from domestic and 2-20 % from commercial sources, with 20-40% not accounted for (Icon 2001). Likewise, Gray and Becker (2002) estimated from world wide data that >75% of the total lead in the wastewater from domestic areas was attributed to stormwater run-off.
Wastewater network levels recorded for Melbourne in 1995 and 2006 were in a similar range of 4 -31g/L (Connor and Wilkie 1995), and range 2 - 69 g/L (CWW 2006) however the mean values were lower 13g/L (1995) compared to 4.6g (2006).
In domestic residences, the laundry and the bathroom were identified as the main sources (Gray and Becker 2002). The range at households varies widely. Dirt and dust from emissions and residues from lead based paints are suspected as the major inputs. Data from the UK also suggests a strong contribution from household infrastructure and faeces. However, lead pipe infrastructure is less common in Australia.

Sources of critical contaminants in domestic wastewater 44
7.6. Mercury
Mercury in Melbourne wastewater catchments were on average below or at the detection limit of 0.5g/L (Wilkie and Connor 1995, YVW 2006, CWW 2006). Similarly, little or no contribution from households was detected in domestic households in Adelaide (Lock 1994) and Melbourne.
In Europe, domestic sources were estimated to contribute 4-5% of the total contaminant load, whilst commercial sources are responsible for 50-60% of the Hg input (Icon 2001). The main sources are suspected to be dental and medical practices. Dental amalgam, which is typically made of 45-55% mercury, 30% silver and small amounts of copper, tin and zinc, is suspected as the major cause for mercury release in non-industrial settings (WHO 2005a). In the UK alone, estimates of 7.41 tonne Hg per year discharged to sewer are attributed to this source, despite separation and recycling practices (Rule et al., 2006). The same study identified commercial catchments with average concentrations of 0.18g/L and 2.1g/L over a 6 day sampling period. Hence investigation of dental practices discharges in Melbourne is recommended to determine if similar trends can be observed.
7.7. Nickel
There is high uncertainty and variability in estimates of Ni from domestic sources and in Europe > 50% of the total input is unaccounted. The contribution from domestic sources is estimated to be similar or greater than the commercial sources with load estimates ranging from 10-50% domestic, 30% commercial, 10-20% run-off. The main source from run-off is abrasion of road surfaces and galvanised surfaces.
British and Japanese case studies identify faeces as the major source of nickel in domestic wastewater (1994 in Icon 2001 and Moryama et al 1989). In the Japanese study, 61% Ni entering the domestic sewage was attributed to faeces (Moryama et al 1989).
The limited data from Australian studies are also based on low values, which are below or near the lower detection limit. Estimates based on greywater suggests that it would be the greatest load contributor within the household. However the source of the metal is yet unknown as it could originate from solder, any metal coated or galvanised household infrastructure and fittings.
7.8. Zinc
Average recorded zinc concentrations in a number of Melbourne catchments were; 169g/L (range 52-348g/L) (Wilkie et al 2006), 51.75g/L (YVW 2006), 145.65 g/L (CWW 2005) and 162g/L (CWW 2006). Greywater, particularly bathwater, was estimated to be the main source of Zn in the household (Gray and Becker 2002, Lock 1994). However, in that study the estimate of source concentrations from literature sources produced a value only half of that expected in real wastewater.
Sources of zinc include galvanised iron pipe and fittings, rainwater tanks, body care products such as deodorants and sunscreens and the toilet. In Adelaide, 95-93% of the Zn household load came from the bathroom, and was attributed to toiletry use as zinc can be present in sunscreen, deodorants, shampoos and cosmetics (Lock 1994) and secondly to the plumbing as the transport of water via the household plumbing increased the zinc concentration by 1.3 to 18 times. All plumbing was at least 30 years old (Lock 1994). Blackwater is also likely to be a significant contributor of zinc of at least 1/10 of the magnitude as the bathroom.
The contribution of those streams needs to be further verified for personal care products and for household wastewater streams in Melbourne as limited data on greywater streams is available.
Sources of critical contaminants in domestic wastewater 45
7.9. TDS and salts
Greywater, particularly laundry wastewater, is potentially the greatest source of TDS and TSS within the household, with a wide range of observed water quality.
Lock (1994) reported that organics and TDS loadings were proportional to water volume used in the bathroom and laundry. Gray and Becker (2002) also identified greywater and blackwater as responsible for 58.3% and 41.7% respectively of the TDS loads in domestic sewage. Water supply was considered a significant source in all major studies. Based on the review data, blackwater is a significant source of sodium due to urine (sodium range 1.7 to 4.2g/pe/d) of the same magnitude or second to greywater source depending on the greywater load.
In greywater, household products are the main source of TDS and in particular sodium within the home. Sodium is present in almost every single household product used for cleaning, and personal care. Patterson (2004) attributed 25% of the TDS load and 3-4% of the Na load in domestic wastewater to the use of laundry detergents.
7.10. Colour
Limited published information is reported on colour of greywater, blackwater and domestic sewage. Domestic sewage in Melbourne was reported to range between 0 to 1621 ADMI units (Connor and Wilkie 1995). The colour range for greywater was 30 to > 100 Pt/Co units (Hypes 1974 in Eriksson et al 2002), with Christova-Boal et al (1996) reporting 60-100 Pt/Co for bathroom greywater and 50-70 for laundry greywater Pt/Co. Whilst blackwater has a higher concentration of solids, limited data has been collected on blackwater colour. There is also insufficient information to confirm the cause of colour in the effluent from the treatment plant.
Melbourne Water has investigated the effluent from the Eastern Treatment Plant pre and post-chlorination in 2002 (Melbourne Water, personal communication 2006). Fractionation of the samples revealed that majority of the effluent absorption was caused by Natural Organic Matter, with Very Hydrophobic Acids (VHA), Slightly Hydrophobic Acids (SHA) and Charged Hydrophilic acids (CHA) responsible for 74%, 13% and 6% respectively, of the effluent’s UV transmissivity.

Sources of critical contaminants in domestic wastewater 46
Table 18: Summary of potential contaminant sources
Stream Source within household
Contaminant Greywater Blackwater Stormwater run-off
Water supply
Distribution infrastructure
Household infrastructure
Bathroom Laundry Kitchen
Arsenic Likely Possible Likely Possible Unlikely Unlikely Unlikely Possible Unlikely
Boron Likely Likely Possible Unlikely Unlikely Likely Likely Unlikely
Cadmium Likely Possible Likely Possible Unlikely Likely Likely Likely Possible
Copper Likely Likely Likely Possible Unlikely V. Likely Likely Likely Likely
Lead Likely Likely V. Likely Possible Possible V. Likely V. Likely Unlikely
Mercury Possible Unlikely Unlikely Unlikely Unlikely Unlikely Possible Possible Possible
Nickel Unlikely Possible V. Likely Unlikely Possible Possible Unlikely Unlikely Unlikely
Zinc Likely Likely Likely Possible Possible Possible Likely Likely Likely
Sodium V. Likely V. Likely Likely Likely Unlikely Unlikely Likely V. Likely Likely
TDS Likely Likely Likely Likely Unlikely Unlikely Likely Likely Possible
Colour Likely Likely Likely Possible Possible (inorganic)
Possible (inorganic)
Likely Likely Likely
Iron Likely Likely Likely Likely Likely Likely - Likely -
Manganese Likely Likely Likely Likely Likely Likely - Likely -
Sources of critical contaminants in domestic wastewater 47
8. Major Gaps
The major gap in the determination of the contribution of domestic wastewater to contaminant loads and the identification of critical contaminant sources is the lack of suitable data available on the subject. A number of overseas and local studies are starting to emerge in specific areas of critical contaminants which provide valuable lessons. Consideration needs to be given during assessment of the data to:
1. Geographical context: variations in materials and design of infrastructure, water quality and water use patterns, dietary habits and excreta quality. Limited Australian data.
2. Data age: Wastewater studies need to be considered in light of the time of the study as infrastructure, analytical methods and households have changed at a fast pace in the last 2 decades.
3. Sampling conditions and data comparability: a complete data set requires method of sample collection (composite, grab, serial), sampling period, environmental conditions, population size, infrastructure details, data range, etc for full comparison.
4. Water quality focus on infrastructure studies: majority of the studies on infrastructure have evaluated its impact on drinking water quality or its structural integrity, there is limited data on corrosion of wastewater collection infrastructure in regards to transfer of critical contaminants to wastewater.
5. Wastewater treatment focus: limited historical data exists on critical contaminant concentrations as characterisation of wastewater quality has traditionally had a treatment focus based on wastewater BOD and TSS reduction. Limited data is available on different catchment types, partly because of the high cost and the difficulty of differentiating inputs.
6. Limited data at household level;
7. Limited information and disclosure of household/consumer products, their composition and potential contaminants.
9. Recommendations for monitoring program
Sewage volumes and contaminant loads are dependent on a large number of variables: householder habits, water use patterns, appliance use, frequency of appliance use and volume. The dependency on such a large range of parameters and the uncertainty generated from the variability of loads and contaminant combinations has been investigated by Friedler and Butler (1996). In their paper they surveyed 28 households to determine water patterns and volumes used for each major water appliance. The study showed that the distribution of sewage volume data at the household level was not normally distributed, instead the data was closer to a binomial distribution. The implications of such data distribution are that the use of mean values and averages for estimation of volumetric loads and contaminant loads does not provide an adequate representation of the cumulative volume or contaminant load leading to large variability in volume and contaminant balances. It is proposed by the project team that this variation from normal distribution will be more pronounced at smaller scales i.e. the household or individual appliance level whereas at larger scale distributions of flow and quality are more likely to be normally distributed. In addition at the household scale some sources are likely to produce non normal distributions of flow and quality i.e. appliances and showers whereas other sources are likely to produce a more normal distribution i.e. infrastructure, potable water. Therefore evaluation of loads of critical contaminants and volume of discharge at a range of scales for monitoring is required and more multivariate statistical assessments should be used.
Sources of critical contaminants in domestic wastewater 48
To better understand the dependency on the many factors, a number of different methods of analysis of wastewater flows and loads have been suggested by other researchers. These will be reviewed during the development of the monitoring programme and appropriate methods selected from the following:
Hedbrant and Sörme (2001) discuss the use of uncertainty intervals when analysing limited datasets, subjective estimation data, data that are not independent or uncertain data. Uncertainty was defined as the interval within which the uncertain value was ‘very likely’ to be, where ‘very likely’ was quantified to 95% probability. The methodology was used for the calculation of diffuse metal pollution loads (eg. run-off) and mass balances in sewage for Stockholm, based on data from various sources and thus uncertainty levels. The method may be appropriate for comparison of contaminants analysis data collected from different sources in this current study, and also for comparison of data collected from householders in the survey with quantitative contaminant analysis.
Connor and Wilkie (1995) used principal component analysis (PCA) and partial least squares (PLS) to determine correlations between pollutant concentrations and their sources. The analysis confirmed data dependency on the location of the sampling, the lifestyle of the residents, the weather, the day of the week and the sampling time. Weekly contaminant loads were found to differ during working days and weekends, with higher metal concentrations during the week, but more N and P loads attributed to cleaning activities at the weekend for Melbourne data (Pantsar – Kallio et al 1999). The same approach was also used by Singh et al (2005) to differentiate trends in composition of sewage from mixed sources (domestic and industrial) and evaluate their treatment potential.
Household data collection methods such as householder questionnaires, diaries and experiments to measure appliance water use (Friedler and Buttler 1996) and video interviews and task observation (Weegels and van Veen 2001) to monitor household appliances and consumer habits. This method is time intensive and requires a large population sample, but can provide great insight into the sources and their route into sewage. Friedler and Butler (1996) surveyed household water use and analysed the data of the sample population using histograms and cumulative loads to reduce the variability in measurements. The study revealed that dry weather flows could not be treated deterministically and that wastewater flow volume is not normally distributed, hence the use of averages for load estimation is imbued with great variability. Both studies verified that although there is significant inter-individual variation, within a household chores tend to be routinely carried out and can be effectively captured using journals.
Selection of data collection and analysis technique will also depend on available resources and the identification of representative sample populations.
Within this project there are three potential scales of monitoring and data collection and different combinations of these will be used to ensure all the above points are addressed. The monitoring sites are:
Laboratory based profiling of flows and loads from different appliances (shower, laundry and dishwasher).
Field sampling of single properties.
Field sampling of wastewater network at a number of scales.
The potential monitoring sites and data collection processes are discussed further in the ‘Proposal for monitoring sites for wastewater contaminants’ document.
Sources of critical contaminants in domestic wastewater 49
10. Other substances of concern
During the course of data collection and collation for this review a number of other substances of concern in domestic wastewater were identified. The characterisation of occurrence of these substances in domestic wastewater is not an objective of this review. However, these potential contaminants of concern need to be considered in the overall health and environmental risk assessment of utilisation of recycled water. Their impact ranges from substances that can upset the treatment process, substances that are toxic, genotoxic, carcinogenic and teratogenic to humans or to other species. Most of them originate from disposal into domestic sewage wastewater.
These contaminants are listed below and include the following categories:
Persistent compounds (PAH, PCBs, PCDD/Fs),
Detergent residues and sulphonated compounds (nonyl phenol, linear alkyl benzene sulphonates (LAS), di-(2-ethylhexyl)phthalate (DEHP), etc.
Pharmaceuticals and their by products: including hormones such as estriol, estrone, progesterone and testosterone, 17 ethinylestridiole and diethylstilbestrol responsible for feminisation of male fish and interference with mating characteristics of fish, its current effect on drinking water and humans has not yet been verified;
Antimicrobial compounds: Triclosan and other non-persistent antibacterial chemicals commonly found in most household products from toothpaste and soap to cleaning wipes and cosmetics;
Disinfection by-products: N-nitrosodimehtylamine (NDMA) is found in cosmetics, solvents, lubricants, polymers, chlorinated water, food and it is also a by-product of chloramination used in disinfection, root control, metal treatment for circuit boards and is a possible carcinogen. This group includes chemicals used in water treatment and their by-products such as trihalomethanes, haloacetic acids, some are known carcinogens to animals.
Brominated flame retardants;
Monocyclic aromatics: benzene, toluene, ethylbenzene, xylenes, napthalenes.

Sources of critical contaminants in domestic wastewater 50
11. References
ANZMFWD (2001) Australian and New Zealand Guidelines for Fresh and Marine Water Quality, Volume2, Chapter 8, section 8.3 and 8.4 Australian and New Zealand Environment and Conservation Council (ANZECC) and Agriculture and Resource Management Council of Australia and New Zealand (ARMCANZ).
APHA/AWWA (1998), Standard Methods for the Examination of Water and Wastewater, pp.2-8.
Becker, K., Schulz, C., Klaus, S., Seiwert, M. and Bernd, S. (2003) German environmental survey 1998 (GerES III): environmental pollutants in the urine of the German population, International Journal of Hygiene and Environmental Health, 206, pp.15-24.
Burn, et al (2005) Long Term Performance Prediction for PVC Pipes, AWWARF Report 91092F, American Water and Waterworks Association Research Foundation.
Butler D., (1993) The influence of dwelling occupancy and day of the week on domestic appliance wastewater discharges. Building and Environment, 28 (1), pp.73-79
Butler D., Friedler E. and Gatt K. (1995) Characterising the quantity and quality of domestic wastewater inflows. Water Science and Technology 31(7) pp. 13-24
Caldwell, K.I., Hartel, J, Jarret, J, Jones, R.L. (2005) Inductively coupled plasma mass spectrometry to measure multiple toxic elements in urine in NHANED 1999-2000, Atomic Spectroscopy, 26(1), pp.1-7.
Chapman H., Cartwright T., Huston R, and O’Toole J (2006) Water Quality and Health Risks from Urban Rainwater Tanks. CRC for Water Quality and Treatment (in press)
Chattopadhyay, G., Lin, K.C-P and Feitz, A.J. (2003) Household dust metal levels in sydney metropolitan area, Environmental Research, 93, pp.301-307.
Chino, M., Moriyama, K., Saito, H. and Mori, T. (1991) The amount of heavy metals derived from domestic sources in Japan, Water, Air and Soil Pollution, 57-58, pp829-837.
Christova-Boal D., Eden R.E. and McFarlane S. (1996) An investigation into greywater reuse for residential properties, Desalination, 106, pp. 391-397
Colquitt, P.J. (2002) Do powered toothbrushes contaminate toothpaste with metals?, The Science of the Total Environment, 289, pp.25-32.
Connor, M.A. and Wilkie, P.J. (1995) Domestic contributions to levels of key organics and inorganic pollutants in Melbourne sewage, University of Melbourne, June 1995.
Comber, S.D.W and Gunn, A.M. (1996) Heavy metals entering sewage-treatment works from domestic sources,Journal of the Chartered Institution of Water and Environmental Management, 10 (2),pp. 137-142
Coombes, P.J., Argue, J.R. and Kuczera, G., 2000. Figtree Place: A case study in Water Sensitive Urban Development (WSUD). Urban Water Journal, 1(4).
Crockett, J. (2003), Feasibility study for a dry composting toilet and urine separation demonstration project, http://www.ghd.com.au/aptrixpublishing.nsf/AttachmentsByTitle/PP+CompostingToiletStudy+PDF/$FILE/e4215.pdf
CWW (2005) City West Water, A.Kazi, personal communication.
CWW (2006) City West Water, CWW Domestic sampling data_June 2006_AK, personal communication.
Davis, P. et al (2005), CSIRO/AWWARF Research Proposal RFP 3126: Life Expectancy on Cement mortar Linings in Cast and Ductile Iron Mains.

Sources of critical contaminants in domestic wastewater 51
Eriksson E., Auffarth K., Henze M. and Ledin A. (2002) Characteristics of grey wastewater, Urban Water 4 pp.85-104
Ferner S, Koszmagk R, Lehmann A and Heilmann, W (1990) Reference values of Na(+) and Cl(-) concentrations in adult sweat, Z Erkr Atmungsorgane, 175(2), pp. 70-75. Fittschen I., and Niemczynowicz J. (1997) Experiences with dry sanitation and greywater treatment in the eco-village Toarp, Sweden. Water Science and Technology 35(9) pp. 161-170
Fittschen I., and Hahn, H.H. (1998) Characterization of the municipal; wastewaterpart human urine and a preliminary comparison with liquid cattle excretion, Water Science and Technology 38(6), pp. 9-16.
Friedler E. and Butler D. (1996) Quantifying the inherent uncertainty in the quantity and quality of domestic wastewater. Water Science and Technology 33(2) pp. 65-78
Galloway, M. (2005) Bachelor of Environmental Science Thesis: Stormwater Pollutant Concentrations and the Success of Current Treatment Trains in Three Urban Sub-Catchments in Sydney, Australia, School of Biological, Earth and Environmental Science Faculty of Science, UNSW.
Gardner, T., Baisden, J. and Millar, G., 2004. Rainwater First Flush Devices- Are They Effective? In: S. Paper (Editor), Sustainable Water In the Urban Environment Conference, Brisbane.
Gray S.R. and Becker N.S.C Becker (2002) Contaminant flows in urban residential water systems. Urban Water 4 pp. 331-346
Gromaire, M.C., Waintrop, N., Chebbo, G. and Constant, A., 2001. Importance of zinc roofs in Paris and their impact on urban runoff pollutant loads, NOVATECH'2001, Lyon, France.
Hansen, J.A. and Tjell, J.C. (1979) Human excretion of heavy metals and other elements. Working document. Technical University of Denmark: The Laboratory for Technical Hygiene presently known as Environment and Resources, DTU, 1979.
Hargelius et al., (1995) Hushållsspillvatten Framtagende av nya schablonvården för BDT-vatten. In Vad innehåller avlopp från hushåll?. Stockolm: Swedish EPA
Heitland, P and Köster, H.D. (2005) Biomonitoring of 30 trace elements in urine of children and adults by ICP-MS, Clinica Chimica Acta, 365, pp. 310-318.
Hedbrant, J. and Sörme, L. (2001) Data vagueness and uncertainties in urban heavy-metal data collection, Water, air and Soil Pollution: Focus 1, pp.43-53.
Howard E, Misra R, Loch, R and Le-Minh, N (2005). Laundry Grey Water Potential Impact on Toowoomba Soils – Final Report. Landloch and NCEA. National Centre for Engineering in Agriculture Publication 1001420/2, USQ, Toowoomba. Hypes W.D. (1974) Characterisation of typical household greywater. In J.H.T. Winneberger (Ed) Manual of greywater treatment practice pp. 79-88
IBIS World Industry Report (2006a) Toiletry and cosmetic goods wholesaling in Australia F4798 IBIS World Pty Ltd
Icon (2001) Pollutants in Urban Waste and Sewage Sludge – Final Report., IC Consultants Ltd.
Jefferson B, Burgess J.E., Pichon A., Harkness J. and Judd S.J. (2001) Nutrient addition to enhance biological treatment of greywater. Water Research 35(11) pp. 2702-2710
Jenkins, D. (1998) The effect of reformulation of household powder laundry detergents on their contribution to heavy metals in wastewater, Water Environment Research, 70(5), pp. 980-983.
Jeppesen B. (1993) Domestic greywater reuse: preliminary evaluation. Urban Water Research Association of Australia ISBN 1 875298 60 4
Sources of critical contaminants in domestic wastewater 52
Jönsson, H, Stenström, T.A., Svensson, J. and Sundin, A (1997) Source separated urine-nutrient and heavy metal content, water saving and faecal contamination, Water Science and Technology, 35(9), pp.145-152.
Kichmann, H. and Pettersson (1995) Human urine – chemical composition and fertiliser use efficiency, Nutrient Cycling in Agroecosystems, 40(2), pp.149-154.
Koch, M. and Rotard, W. (2001), On the contribution of background sources to the heavy metal content of municipal sewage sludge, Water Science and Technology, 43(2), pp.67-74.
Lentner, C., Lentner. C and Wink, A (1981) Units of Measurement, body fluids, composition of the Body, Nutrition. Geigy Scientific tables, Ciba-Geigy, Basle.
Lock, W.H. (1994) Research Report (Urban Water Research Association of Australia) No.79: Heavy metals and organics in domestic wastewater, Urban Water Research Association of Australia.
Magyar M.I., Mitchell, V.G., Ladson, A. and Diaper, C.(2006) Determining the sediment dynamics in a rainwater tank. In Proceedings of The 30th Hydrology and Water Resources Symposium, Launceston, December 4th to 7th
Melbourne Water (2006), L. Harvey, personal communication.
Melbourne Water (2005) ETP Plant Capacity Statement, 2003-2004 Financial Year, March 2005.
Melbourne Water (2005) WTP Plant Capacity Statement, 2003-2004 Financial Year, March 2005.
Moryama, K., Mori, T., Arayashiki, H, Saito, H and Chino, M (1989) The amount of heavy metals derived from domestic wastewater, Water Science and Technology, 21, pp.1913-1916.
NHMRC (2004) Australian Drinking Water Guidelines-Factsheets, a publication by the National Health and Medical Research Council (NHMRC) and Natural Resource Management Ministerial Council (NRMMC), http://www.nhmrc.gov.au/publications/synopses/eh19syn.htm
O’Halloran, R. , Taylor, R, Bradbury, C., Jarret, RJ and Misiorek, V (2003) Investigation of Remedial Treatment of Copper Plumbing Systems to Eliminate Blue Green Water (BGW) Stage 1 Report: Development and selection of BGW remedial treatments”, Confidential Consultancy Report CMST-C-C-2003-02, March 2003. O’Halloran, R. , Taylor, R, Smith, F., Goodman, N and Critchley, M (2002) Beating the Blues – Research into Blue Water in Copper Plumbing, J Australian Water Association, 29 (7) 2002. Palmquist, H. and Hanaeus, J. (2005) Hazardous substances in separately collected grey- and blackwater from ordinary Swedish households, Science of the Total Environment, 348, pp.151-163.
Pantsar-Kallio, M., Mujunen, S.-P., Hatzimihalis, G., Koutifides, P, Minkinnen, P., Wilkie, P.J. and Connor, M.A. (1999) Multivariate data analysis of key pollutants in sewage samples: a case study, Analytical Chimica Acta, 393, pp.181-191.
Patterson, M.J., Galloway, D.R. and Nimmo, M.A. (2000) Variation in regional sweat composition in normal human males, Experimental Physiology,85(6), pp.869-876.
Patterson, R.A. (2004) Laundry Product Research, Lanfax Laboratories Armidale NSW, http://www.lanfaxlabs.com.au/, accessed September 2006.
Quintaes, K.D., Amaya-Farfan, J., Tomazini, F.M., Morgano, M. A, Mantovani, D.M.B. (2004) Mineral migration from stainless steel, cast iron and soapstone pans (steatite) onto food stimulants, Ciencia e Tecnologia de Alimentos, 24(3), Campinas, ISSN: 0101-2061
Rule, K.L., Comber, S.D.W., Ross, D.,Thornton, A., Makropoulos, C.K. and Rautiu, R., (2006) Diffuse sources of heavy metals entering an urban wastewater catchment, Chemosphere, 63, 64-72.
Sources of critical contaminants in domestic wastewater 53
Rushing, Jason C.; Edwards, Marc (2004) The role of temperature gradients in residential copper pipe corrosion. Corrosion Science, 46( 8), August, pp. 1883-1894
Santala E., Uotila J., Zaitsev G., Alasiurua R., Tikka R. and Tengvall J. (1998) Microbiological greywater treatment and recycling in an apartment building. In AWT98 – Advanced Wastewater Treatment, Recycling and Reuse: Milan 14-16 September pp. 319-324
Sarmiento-Gonzalez A, Marchante-Gayon JM, Tejerina-Lobo JM, et al. (2005) ICP-MS multielemental determination of metals potentially released from dental implants and articular prostheses in human biological fluids, Analytical and Bioanalytical Chemistry, 382 (4), pp. 1001-1009. Schachter, J., Harper, P.H., Radin, M.E., Caggiula, A.W., McDonald, R.H and Diven, W.F., Comparison of sodium and potassium intake with excretion, Hypertension, 2(5), pp. 695-699.
Schouw, N.L., Danteravanich, S., Mosbaek, H. and Tjell, J.C. (2002), Composition of human excreta – a case study from southern Thailand, The Science of the Total Environment, 286, pp.155-166.
Schramel, P. Wendler, I., Angerer, J. (1997) The determination of metals (antimony, bismuth, lead, cadmium, mercury, palladium, tellurium, thallium, tin and tungsten) in urine samples by inductively coupled plasma-mass spectrometry, Int.Arch.Occup.Environ.Health, 69, pp.219-223.
Siegrist H., Witt M. and Boyle W.C. (1976) Characteristics of rural household wastewater. Journal of the Environmental Engineering Division, 102(EE3) pp. 533-548
Simmons, G., Hope, V., Lewis, G., Whitmore, J. and Gao, W., 2001. Contamination of potable roof-collected rainwater in Auckland, New Zealand. Water Research, 35(6): pp.1518-1524.
Slaats, L.P.M., Rosenthal, W.G., Siegers, M., van den Boomen, Beuken, R.H.S and Vreeburg, J.H.G. (2003) AWWARF Report no.90966F Processes involved in the generation of Discolored Water, AWWARF.
Standards Australia and New Zealand (1991) AS1741-1991 Australian/New Zealand Standard™, Vitrified clay pipes and fittings with flexible joints - Sewer quality.
Standards Australia and New Zealand (1994) AS 4198-1994 AS 4198-1994 Australian/New Zealand Standard™ Precast concrete access chambers for sewerage application.
Standards Australia and New Zealand (1999) AS4020-1999 Testing of products for use in contact with drinking water.
Standards Australia and New Zealand (2003), AS/NZS 4131:2003 Australian/New Zealand
Standard™, Polyethylene (PE) compounds for pressure pipes and fittings.
Standards Australia and New Zealand (2005) AS/NZS 3718:2005 Australian/New Zealand
Standard™,Water supply - Tap ware
Standards Australia and New Zealand (2006) AS2200-2006 Design charts for water supply and sewerage.
Strasinger, S.K. and Di Lorenzo, M.S. (2001) Urinalysis and Body fluids, F.A.Davis Company, Philadelphia, 4th edition, pp.26.
Sörme L. and Lagerkvist R. (2002) Sources of heavy metals in urban wastewater in Stockholm. The Science of the Total Environment 298, pp. 131-145
Surendran S. and Wheatley A.D. (1998) Greywater reclamation for non-potable use. Journal of the Chartered Institute for Water and Environmental Management, 12 pp. 406-413
Taylor, R J, O’Halloran, R, Sexton, B A and Smith (1998) F L “Blue-green water – Investigations undertaken by CSIRO for City West Water. Stage 1 Report”, Confidential Consultancy Report CMST-C-C-98-21, August 1998

Sources of critical contaminants in domestic wastewater 54
Thomas, P.R. and Greene, G.R., 1993. Rainwater quality from different roof catchments. Water Science and Technology, 28(3-5): 291-299
Tjandraatmadja, G.F. and Burn, S. (2005) CMIT doc Stock and flows – Sources of contaminants.
TWRG (2006) Trade Waste Reference Group, personal communication.
Tunaley J. (2004) An assessment of a domestic sand filter for greywater treatment. Bachelor or Applied Science, Environmental Science (Hons) Thesis, School of Applied Sciences, RMIT University.
Vinnerås, B. and Jönsson, H. 2002 The performance and potential of faecal separation and urine diversion to recycle plant nutrients in household water, Bioresource Technology, 84, pp.275-282.
Vinneras, B. (2001) Report 244 - Licentiate thesis: Faecal separation and urine diversion for nutrient management of household biodegradable waste and wastewater, Swedish university of Agricultural Science, Uppsala.
Weegels, MF, van Veen, MP (2001) Variation of consumer contact with household products: A preliminary investigation, Risk Analysis, 21 (3), pp. 499-511
Wilkie, P.J., Hatzimihalis, G., Koutofides, P. and Connor, M.A. (1996), The contribution of domestic sources to levels of key organic and inorganic pollutants in sewage: The case of Melbourne, Australia, Wat.Sci.Tech., 34(3-4), pp.63-70.
WHO (2000a) Air Quality Guidelines, Chapter 6.3 Cadmium Air Quality Guidelines - Second Edition, WHO Regional Office for Europe, Copenhagen, Denmark, 2000. WHO (2000b) Air Quality Guidelines, Chapter 6.9 Mercury- Second Edition, WHO Regional Office for Europe, Copenhagen, Denmark, 2000. WHO (2000c) Air Quality Guidelines, Chapter 6.10 Nickel - Second Edition, WHO Regional Office for Europe, Copenhagen, Denmark, 2000. WHO (2001) Air Quality Guidelines, Chapter 6.7 Lead - Second Edition, WHO Regional Office for Europe, Copenhagen, Denmark, 2001. WHO (2001a) Arsenic in drinking-water. Background document for preparation of WHO Guidelines for drinking-water quality. Geneva, World Health Organization Publication WHO/SDE/WSH/03.04/75. WHO (2003b) Zinc in Drinking-water Background document for development of WHO Guidelines for Drinking-water Quality, Publication WHO/SDE/WSH/03.04/17, World Health Organization, pp.1-5. WHO(2004) Copper in Drinking-water Background document for development of WHO Guidelines for Drinking-water Quality, Geneva, World Health Organization Publication WHO/SDE/WSH/03.04/88, World Health Organization, pp.3-5. WHO (2005a) Mercury in Drinking-water, Background document for development of WHO Guidelines for Drinking-water Quality, Geneva, World Health Organization Publication WHO/SDE/WSH/05.08/10 WHO (2005b) Nickel in Drinking-water, Background document for development of WHO Guidelines for Drinking-water Quality, Geneva, World Health Organization Publication WHO/SDE/WSH/05.08/55. YVW (2005) Yarra Valley Water, H. Dang personal communication.
Sources of critical contaminants in domestic wastewater 55
Zacheus, Outi M. and Martikainen, Pertti J. (1997) Physicochemical quality of drinking and hot waters in Finnish buildings originated from groundwater or surface water plants, The Science of the Total Environment Volume, 204( 1), September 19, pp. 1-10.
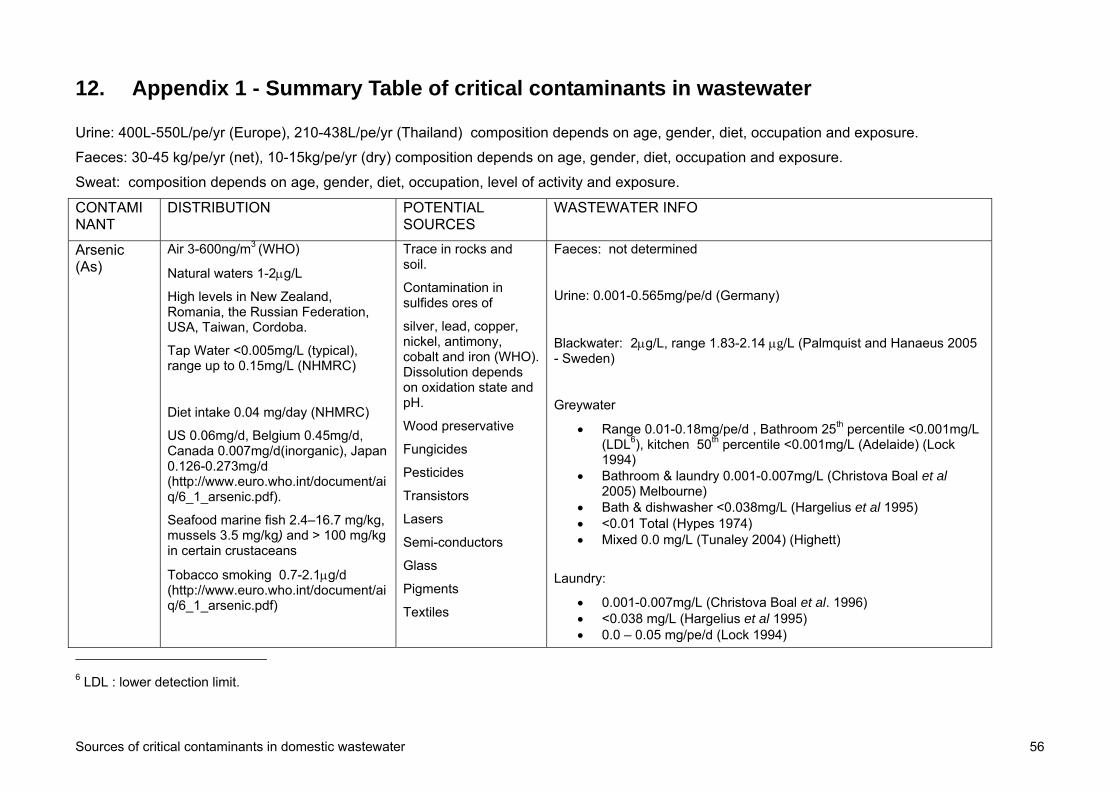
Sources of critical contaminants in domestic wastewater 56
12. Appendix 1 - Summary Table of critical contaminants in wastewater
Urine: 400L-550L/pe/yr (Europe), 210-438L/pe/yr (Thailand) composition depends on age, gender, diet, occupation and exposure.
Faeces: 30-45 kg/pe/yr (net), 10-15kg/pe/yr (dry) composition depends on age, gender, diet, occupation and exposure.
Sweat: composition depends on age, gender, diet, occupation, level of activity and exposure.
CONTAMINANT
DISTRIBUTION POTENTIAL SOURCES
WASTEWATER INFO
Arsenic (As)
Air 3-600ng/m3 (WHO)
Natural waters 1-2g/L
High levels in New Zealand, Romania, the Russian Federation, USA, Taiwan, Cordoba.
Tap Water <0.005mg/L (typical), range up to 0.15mg/L (NHMRC)
Diet intake 0.04 mg/day (NHMRC)
US 0.06mg/d, Belgium 0.45mg/d, Canada 0.007mg/d(inorganic), Japan 0.126-0.273mg/d (http://www.euro.who.int/document/aiq/6_1_arsenic.pdf).
Seafood marine fish 2.4–16.7 mg/kg, mussels 3.5 mg/kg) and > 100 mg/kg in certain crustaceans
Tobacco smoking 0.7-2.1g/d (http://www.euro.who.int/document/aiq/6_1_arsenic.pdf)
Trace in rocks and soil.
Contamination in sulfides ores of
silver, lead, copper, nickel, antimony, cobalt and iron (WHO). Dissolution depends on oxidation state and pH.
Wood preservative
Fungicides
Pesticides
Transistors
Lasers
Semi-conductors
Glass
Pigments
Textiles
Faeces: not determined
Urine: 0.001-0.565mg/pe/d (Germany)
Blackwater: 2g/L, range 1.83-2.14 g/L (Palmquist and Hanaeus 2005 - Sweden)
Greywater
Range 0.01-0.18mg/pe/d , Bathroom 25th percentile <0.001mg/L (LDL6), kitchen 50th percentile <0.001mg/L (Adelaide) (Lock 1994)
Bathroom & laundry 0.001-0.007mg/L (Christova Boal et al 2005) Melbourne)
Bath & dishwasher <0.038mg/L (Hargelius et al 1995) <0.01 Total (Hypes 1974) Mixed 0.0 mg/L (Tunaley 2004) (Highett)
Laundry:
0.001-0.007mg/L (Christova Boal et al. 1996) <0.038 mg/L (Hargelius et al 1995) 0.0 – 0.05 mg/pe/d (Lock 1994)
6 LDL : lower detection limit.
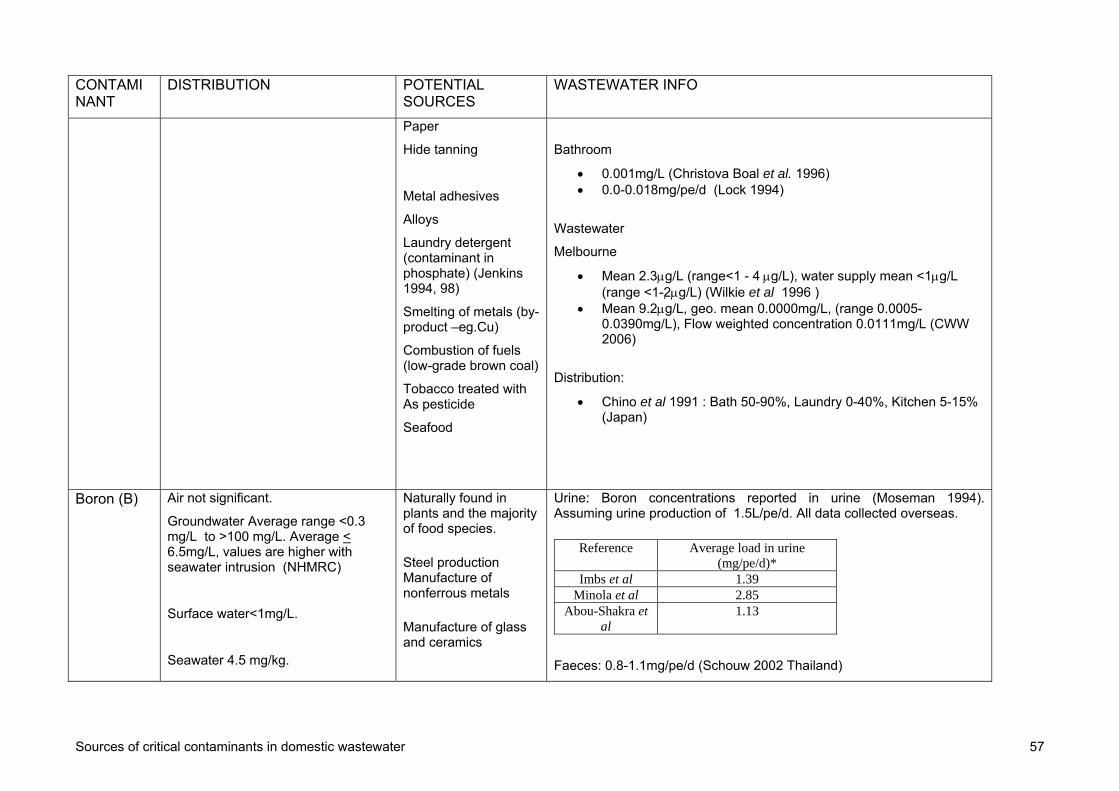
Sources of critical contaminants in domestic wastewater 57
CONTAMINANT
DISTRIBUTION POTENTIAL SOURCES
WASTEWATER INFO
Paper
Hide tanning
Metal adhesives
Alloys
Laundry detergent (contaminant in phosphate) (Jenkins 1994, 98)
Smelting of metals (by-product –eg.Cu)
Combustion of fuels (low-grade brown coal)
Tobacco treated with As pesticide
Seafood
Bathroom
0.001mg/L (Christova Boal et al. 1996) 0.0-0.018mg/pe/d (Lock 1994)
Wastewater
Melbourne
Mean 2.3g/L (range<1 - 4g/L), water supply mean <1g/L (range <1-2g/L) (Wilkie et al 1996 )
Mean 9.2g/L, geo. mean 0.0000mg/L, (range 0.0005-0.0390mg/L), Flow weighted concentration 0.0111mg/L (CWW 2006)
Distribution:
Chino et al 1991 : Bath 50-90%, Laundry 0-40%, Kitchen 5-15% (Japan)
Boron (B) Air not significant.
Groundwater Average range <0.3 mg/L to >100 mg/L. Average < 6.5mg/L, values are higher with seawater intrusion (NHMRC)
Surface water<1mg/L.
Seawater 4.5 mg/kg.
Naturally found in plants and the majority of food species.
Steel production Manufacture of nonferrous metals
Manufacture of glass and ceramics
Urine: Boron concentrations reported in urine (Moseman 1994). Assuming urine production of 1.5L/pe/d. All data collected overseas.
Reference Average load in urine (mg/pe/d)*
Imbs et al 1.39 Minola et al 2.85
Abou-Shakra et al
1.13
Faeces: 0.8-1.1mg/pe/d (Schouw 2002 Thailand)

Sources of critical contaminants in domestic wastewater 58
CONTAMINANT
DISTRIBUTION POTENTIAL SOURCES
WASTEWATER INFO
Tap.water <0.1mg/L(ADWG)
Food intake: median 0.75 mg/day, mean 0.93 mg/day, and 95th-percentile 2.19 mg/day (WHO 2003)
AUS 2.2 mg/pe/d (ADWG)
Semiconductors
Pharmaceuticals (used as pH buffer)
Antiseptics
Cosmetics
Food preservative
Disinfectants (bleach)
Soap
Washing powders (often as sodium perborate)
Flame retardant for wood and fabrics, Abrasives
Rocket fuels.
Fertiliser, Herbicide, Fungicide, Algicide
Leather preservative
Greywater
Low – Laundry, Bathroom, kitchen, supply (major source varied for each house between bathroom, laundry and water supply) (Lock 1994):
House 1: 4.69 (Water Supply), 8.29 (Bathroom),2.77(Kitchen), 48.66(Laundry) mg/pe/d
House 2: 10.32 (Water Supply), 32.5 (Bathroom),3.23(Kitchen), 9.15(Laundry) mg/pe/d
House 3: 9. 97 (Water Supply), 7.04 (Bathroom),1.29(Kitchen), 29.2(Laundry) mg/pe/d
House 4: 9. 24 (Water Supply), 4.40 (Bathroom),1.42(Kitchen), 2.97(Laundry) mg/pe/d
Bath
<0.1mg/L (Christova-Boal et al 1996) Laundry
<0.1- <0.7 mg/L(Cristova-Boal et al 1996). One house 1- 4.4mg/L. Laundry 40% samples <0.1mg/L. Levels were consistent with USA data.
WW:
Ave. 263.4g/L, (10-860g/L), water supply:108g/L, range (<10-490g/L) (Wilkie et al 1996)
Mean 115.5g/L, geo. 33.8g/L, (2.5-650 g/L), Flow weighted concentration 120.2g/L (CWW 2006)
Wet well 90th percentile <0.7mg/L, range 0.33-0.808mg/L (Adelaide) (Lock 1995)
Distribution
Water supply 25-60% load (Connor and Wilkie 1997) At the household B came from different streams: mainly the
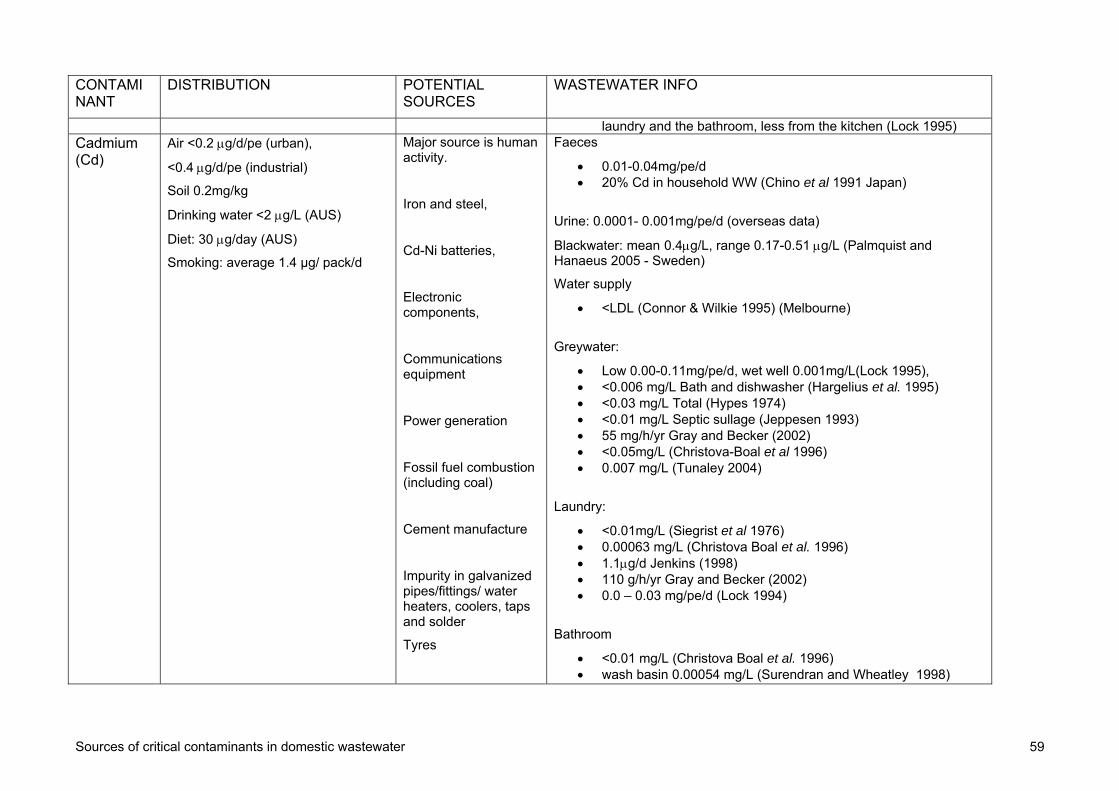
Sources of critical contaminants in domestic wastewater 59
CONTAMINANT
DISTRIBUTION POTENTIAL SOURCES
WASTEWATER INFO
laundry and the bathroom, less from the kitchen (Lock 1995) Cadmium (Cd)
Air <0.2 g/d/pe (urban),
<0.4g/d/pe (industrial)
Soil 0.2mg/kg
Drinking water <2 g/L (AUS)
Diet: 30 g/day (AUS)
Smoking: average 1.4 µg/ pack/d
Major source is human activity.
Iron and steel,
Cd-Ni batteries,
Electronic components,
Communications equipment
Power generation
Fossil fuel combustion (including coal)
Cement manufacture
Impurity in galvanized pipes/fittings/ water heaters, coolers, taps and solder
Tyres
Faeces
0.01-0.04mg/pe/d 20% Cd in household WW (Chino et al 1991 Japan)
Urine: 0.0001- 0.001mg/pe/d (overseas data)
Blackwater: mean 0.4g/L, range 0.17-0.51g/L (Palmquist and Hanaeus 2005 - Sweden)
Water supply
<LDL (Connor & Wilkie 1995) (Melbourne)
Greywater:
Low 0.00-0.11mg/pe/d, wet well 0.001mg/L(Lock 1995), <0.006 mg/L Bath and dishwasher (Hargelius et al. 1995) <0.03 mg/L Total (Hypes 1974) <0.01 mg/L Septic sullage (Jeppesen 1993) 55 mg/h/yr Gray and Becker (2002) <0.05mg/L (Christova-Boal et al 1996) 0.007 mg/L (Tunaley 2004)
Laundry:
<0.01mg/L (Siegrist et al 1976) 0.00063 mg/L (Christova Boal et al. 1996) 1.1g/d Jenkins (1998) 110 g/h/yr Gray and Becker (2002) 0.0 – 0.03 mg/pe/d (Lock 1994)
Bathroom
<0.01 mg/L (Christova Boal et al. 1996) wash basin 0.00054 mg/L (Surendran and Wheatley 1998)

Sources of critical contaminants in domestic wastewater 60
CONTAMINANT
DISTRIBUTION POTENTIAL SOURCES
WASTEWATER INFO
Brake pads
Lubricating oils
Paints
Contaminant in phosphate used in detergent /washing powder
260 mg/h/yr (Gray and Becker 2002)
Kitchen
0.0-0.07mg/pe/d (Lock 1994)
Wastewater:
Levels in Australian domestic wastewater were below or near the LDL.
Ave. 0.45 g/L, range (<0.2-1g/L), water supply not determined (Wilkie et al 1996 )
mean 0.0001mg/L, geo. 0.0000 mg/L, (0.0001-0.0005 mg/L), Flow weighted concentration 0.0001mg/L (CWW 2006)
Wet well 80th percentile <0.001mg/L (Adelaide) (Lock 1995)
Household dust: 1.9 g/g
Distribution
Gray and Becker 2002
Household: GW 83.5% load (5.5 x 10⁻⁵ kg/hh/yr ) (Kitchen 27.5%, Bathroom 39.5%, Laundry 16.5%), BW 16.5% (1.1 x 10⁻⁵ kg/hh/yr)
Residential catchment: Household 12..5%, Run-off 44%, Inflow 0%, Exfiltration 0.6%.
Note: loads and concentrations registered were near detection limit so the calculations could include significant errors.
Major sources:
55-79% Cd sources unknown (Icon 2001). Domestic: Faeces >bath water>laundry>tap water>kitchen
(WRC 1994 in Icon 2001) (UK) Domestic inputs at Shrewsbury WWTS: Faeces 20%>washing
machine 4.6%>dishwashing 4.6%>Bathing 2.6% (WRc 1994 in Icon 2001)

Sources of critical contaminants in domestic wastewater 61
CONTAMINANT
DISTRIBUTION POTENTIAL SOURCES
WASTEWATER INFO
Household: Bathroom 38%, Tap water 22%, faeces 20%, laundry 14%, kitchen 6% (Chino et al 1991) (Japan)
Cd load in water was 55% higher in Fe plumbing (Koch and Rotard 2001-
Germany)
Cd levels were.higher at a new housing estate compared to an older catchment (Rule et al 2006 -UK).
Copper (Cu)
Tap water: 0.1–1 mg/day
Average 0.05mg/L (NHMRC 2004)
Range <0.005 – 0.8mg/L
Hard water 1.5-2mg/L (O’Halloran 2002)
Food 1-3mg/pe/d, up to 5mg/pe/d with vitamin supplementation (NHMRC 2004)
Diet intake: 1 to 5 mg/pe/day
Fungicides
Algaecides
Insecticides
Wood preservatives
Azo dies
Electroplating
Engraving
Lithography
Petroleum refining
Water treatment (copper sulphate
Faeces:
0.5-1.96mg/pe/d 3% Cu in household WW (Chino et al 1991 Japan)
Urine: 0.006-0.01mg/pe/d
Blackwater: mean 126g/L, range 61.9 - 162g/L (Palmquist and Hanaeus 2005 - Sweden)
Greywater:
Bathroom 0.05-0.20mg/L (81% samples), laundry 0.05-0.20mg/L (70%samples) and 25% 0.21-0.32mg/L (potential leaching from plumbing)
Bath & dishwasher 0.056 mg/L (Hargelius et al 1995) 0.08-0.16mg/L (Total) (Hypes 1974) 0.010kg/h/y (Gray and Becker 2002) 0.30 mg/L (Tunaley 2004) wash basin 0.111 mg/L (Surendran and Wheatley 1998) Septic sullage 0.018 – 0.390 mg/L (Jeppesen 1993)
Laundry:
<0.05-0.27 mg/L (Christova Boal et al. 1996) 0.322 mg/L (Surendran and Wheatley 1998) 0.058mg/L (Hargelius et al. 1995) 1.8 g/d (Jenkins 1998) 0.002kg/h/y (Gray and Becker 2002)

Sources of critical contaminants in domestic wastewater 62
CONTAMINANT
DISTRIBUTION POTENTIAL SOURCES
WASTEWATER INFO
pentahydrate)
Food additives
Pyrotechnics
Copper pipes
Cookware
Brake pads
Electrical Wiring
Ornaments and Roofing
0.006 mg/L (Jefferson et al. 2004) 7 g/h/yr (Gray and Becker 2002)
Wastewater
Ave 61.78 mg/L, range (35-97mg/L), water supply :33.4 mg/L, range (12-90mg/L) (Wilkie et al 1997)
mean 0.101mg/L, geo.mean 0.0947 mg/L, range (0.0025-0.25 mg/L), Flow weighted concentration 0.1025mg/L (CWW 2006)
Water supply 15.5-638mg/pe/d (all 4 households tested >30 years old) (Lock 1994)
Household dust: 103 g/g
Distribution
Wilkie et al 1997
Water supply 25-60% load Copper pipe corrosion min. 40% load to WWTP (Wilkie et al
1997)
Gray and Becker 2002 (Australia)
Household: GW 90.1% load (0.01 kg/hh/yr ) (Kitchen 11.5%, Bathroom 60.1%, Laundry 18.5%), BW 9.9% (0.001 kg/hh/yr), TW 0% (Estimates did not consider Cu input from pipes or domestic water supply)
Residential catchment: Household 40%, Run-off 52%, Inflow 0.05%, Exfiltration 2%.
WRc 1994 in Icon 2001 (UK)
Major sources: faeces>plumbing>tap water>laundry>kitchen Domestic inputs at Shrewsbury WWTS: Faeces 20.6%>washing
machine 9.53%>Bathing 0.2%

Sources of critical contaminants in domestic wastewater 63
CONTAMINANT
DISTRIBUTION POTENTIAL SOURCES
WASTEWATER INFO
Chino et al 1991 (Japan)
Household: Tap water 15%, bathroom 78%, laundry 1%, kitchen 1%, faeces 3%
Lock 1995 (blackwater not evaluated)
Household:
Bathroom 90% load (hot water tap had higher levels than cold water)
Estimate <60% load caused by plumbing. (From supply to household tap increased concentration by 2.5 -40 times).
Taylor et al 1998 (Melbourne)
Cu concentration increases with wastewater peak flows.
Overseas data
Domestic wastewater 30-75% load to WWTP, Trade waste 30-60%, run-off 3-40 (Icon 2001) (Europe)
Cu.levels higher at new housing estate (<5years old) catchment compared to older housing estate (>30years old) (Rule et al 2006 -UK).
93% household load in domestic wastewater is caused by plumbing in hard water areas. (Comber and Gunn 1996 - UK)
64% of total load of Cu comes from domestic wastewater in hard water areas.(Comber and Gunn 1996 -UK)
Chromium (Cr)
Food intake: <200g/person/d Corrosion of welded metal, stainless steel
Taps and fittings
Dyes, paints
Faeces:
0.01-0.06mg/pe/d (Chino et al 1991, Koch and Rotard 2001) 2% Cr in household WW (Chino et al 1991 Japan)
Greywater:
Bathroom & Laundry <0.05mg/L (Christova-Boal et al 2006)

Sources of critical contaminants in domestic wastewater 64
CONTAMINANT
DISTRIBUTION POTENTIAL SOURCES
WASTEWATER INFO
Ceramics
Paper
Fire sprinkler system
Heating and cooling coils
Distribution
Chino et al 2001
Household: Tap water 28%, bathroom 25%, laundry 37%, kitchen 8%, faeces 2%
Wastewater
Wet well 90th percentile <0.05mg/L (below detection limit) (Adelaide) (Lock 1995)
Mean 3.2g/L, Range <1-8g/L, Water supply <1g/L (Wilkie et al 1997)
Distribution
Icon 2001 (Europe)
WW unaccounted uncertain, run-off uncertain, 20-60% domestic, 30-60% commercial, 46% Trade waste.
WRC 1994 in Icon 2001 (UK)
Major sources: Laundry>kitchen>faeces>bath water>tap water
Iron (Fe) Uncontaminated surface waters <1mg/L
Oxygen depleted Groundwater <100mg/L
Water through rusty pipes >5mg/L
Tap water: <4mg/L, typical 0.1mg/L
ADWG <0.3mg/L (aesthetic)
Natural element in food
Steel and iron products
Galvanised tanks
Faeces:
8.5mg/pe/d (Chino et al 1991 Japan) 8% Fe in household WW (Chino et al 1991 Japan)
Greywater:
Bathroom
56th percentile 0.05-0.97mg/L, 25% 1.1-1.4mg/L (Christova-Boal et al 1996)
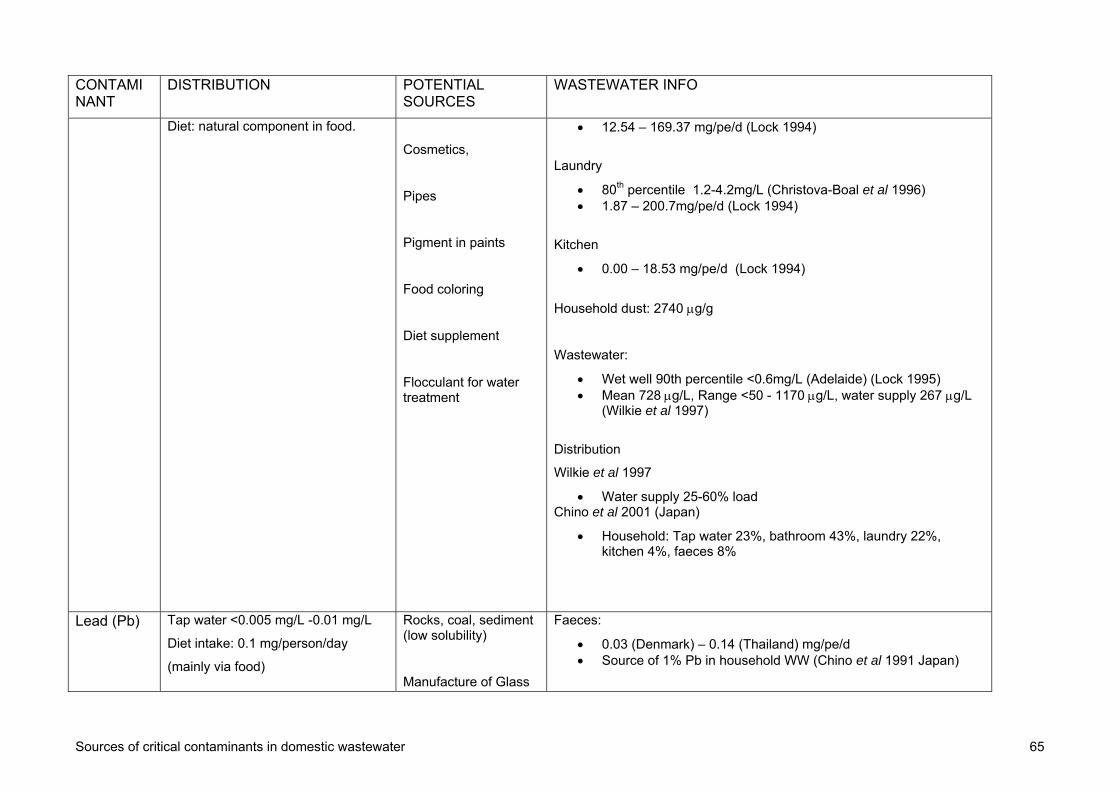
Sources of critical contaminants in domestic wastewater 65
CONTAMINANT
DISTRIBUTION POTENTIAL SOURCES
WASTEWATER INFO
Diet: natural component in food.
Cosmetics,
Pipes
Pigment in paints
Food coloring
Diet supplement
Flocculant for water treatment
12.54 – 169.37 mg/pe/d (Lock 1994)
Laundry
80th percentile 1.2-4.2mg/L (Christova-Boal et al 1996) 1.87 – 200.7mg/pe/d (Lock 1994)
Kitchen
0.00 – 18.53 mg/pe/d (Lock 1994)
Household dust: 2740 g/g
Wastewater:
Wet well 90th percentile <0.6mg/L (Adelaide) (Lock 1995) Mean 728g/L, Range <50 - 1170g/L, water supply 267 g/L
(Wilkie et al 1997)
Distribution
Wilkie et al 1997
Water supply 25-60% load Chino et al 2001 (Japan)
Household: Tap water 23%, bathroom 43%, laundry 22%, kitchen 4%, faeces 8%
Lead (Pb) Tap water <0.005 mg/L -0.01 mg/L
Diet intake: 0.1 mg/person/day
(mainly via food)
Rocks, coal, sediment (low solubility)
Manufacture of Glass
Faeces:
0.03 (Denmark) – 0.14 (Thailand) mg/pe/d Source of 1% Pb in household WW (Chino et al 1991 Japan)

Sources of critical contaminants in domestic wastewater 66
CONTAMINANT
DISTRIBUTION POTENTIAL SOURCES
WASTEWATER INFO
and steel
Copper smelting
Coal combustion
Pesticides
Fuel combustion (alkyl lead additives)
Dry cell batteries
Old plumbing
Solder at pipe joints
Lead based paint (pre-1980-90)
Ceramic glazes
Cosmetics
Alloys
Greywater:
Bath and dishwasher <0.063 mg/L (Hargelius et al 1995) <0.01 - 0.10 mg/L (Total) (Hypes 1974) 0.006 mg/L (Tunaley 2004) Septic sullage <0.050 – 0.150 mg/L (Jeppesen 1993) Greywater and urine <0.05mg/L (Fittschen and Niemczynowicz
1997) 3.9g/hh/yr (Gray and Becker 2002)
Laundry
70% readings <0.05mg/L, 1 site <1.3mg/L (Christova-Boal 1996)
0.033 mg/L (Surendran and Wheatley 1998) <0.063 mg/L (Hargelius et al.1995) 2.1 g/d (Jenkins 1998) (USA)
3.15 g/h/yr (Gray and Becker 2002)
Bathroom:
75% readings <0.05mg/L (LDL), 25% 0.28-0.56mg/L (Christova-Boal et al 1996)
0.003 mg/L wash basin (Surendran and Wheatley 1998) 480 mg/h/yr (Gray and Becker 2002)
Wastewater
Mean 13g/L, range 4 -31g/L, water supply 8.6g/L (Wilkie et al 1997)
Mean 4.6g/L, range 2 - 69 g/L (CWW 2006)
Household dust: 85.2 g/g
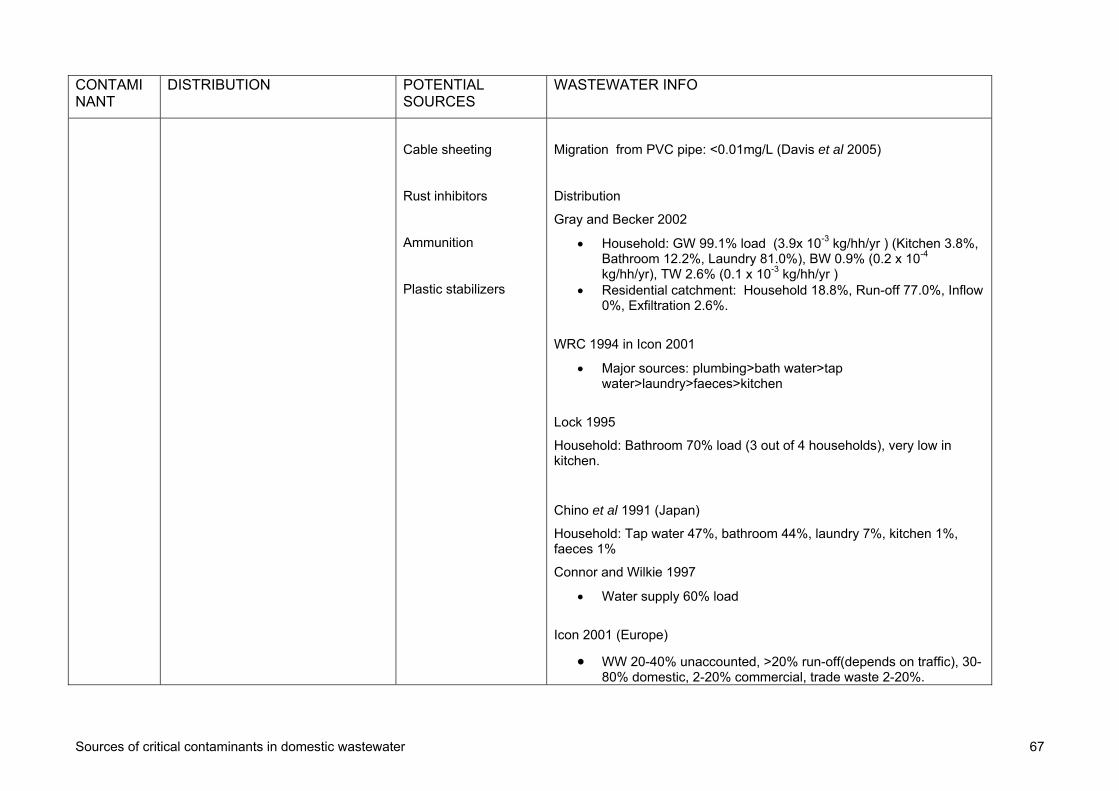
Sources of critical contaminants in domestic wastewater 67
CONTAMINANT
DISTRIBUTION POTENTIAL SOURCES
WASTEWATER INFO
Cable sheeting
Rust inhibitors
Ammunition
Plastic stabilizers
Migration from PVC pipe: <0.01mg/L (Davis et al 2005)
Distribution
Gray and Becker 2002
Household: GW 99.1% load (3.9x 10⁻³ kg/hh/yr ) (Kitchen 3.8%, Bathroom 12.2%, Laundry 81.0%), BW 0.9% (0.2 x 10⁻⁴ kg/hh/yr), TW 2.6% (0.1 x 10⁻³ kg/hh/yr )
Residential catchment: Household 18.8%, Run-off 77.0%, Inflow 0%, Exfiltration 2.6%.
WRC 1994 in Icon 2001
Major sources: plumbing>bath water>tap water>laundry>faeces>kitchen
Lock 1995
Household: Bathroom 70% load (3 out of 4 households), very low in kitchen.
Chino et al 1991 (Japan)
Household: Tap water 47%, bathroom 44%, laundry 7%, kitchen 1%, faeces 1%
Connor and Wilkie 1997
Water supply 60% load
Icon 2001 (Europe)
WW 20-40% unaccounted, >20% run-off(depends on traffic), 30-80% domestic, 2-20% commercial, trade waste 2-20%.
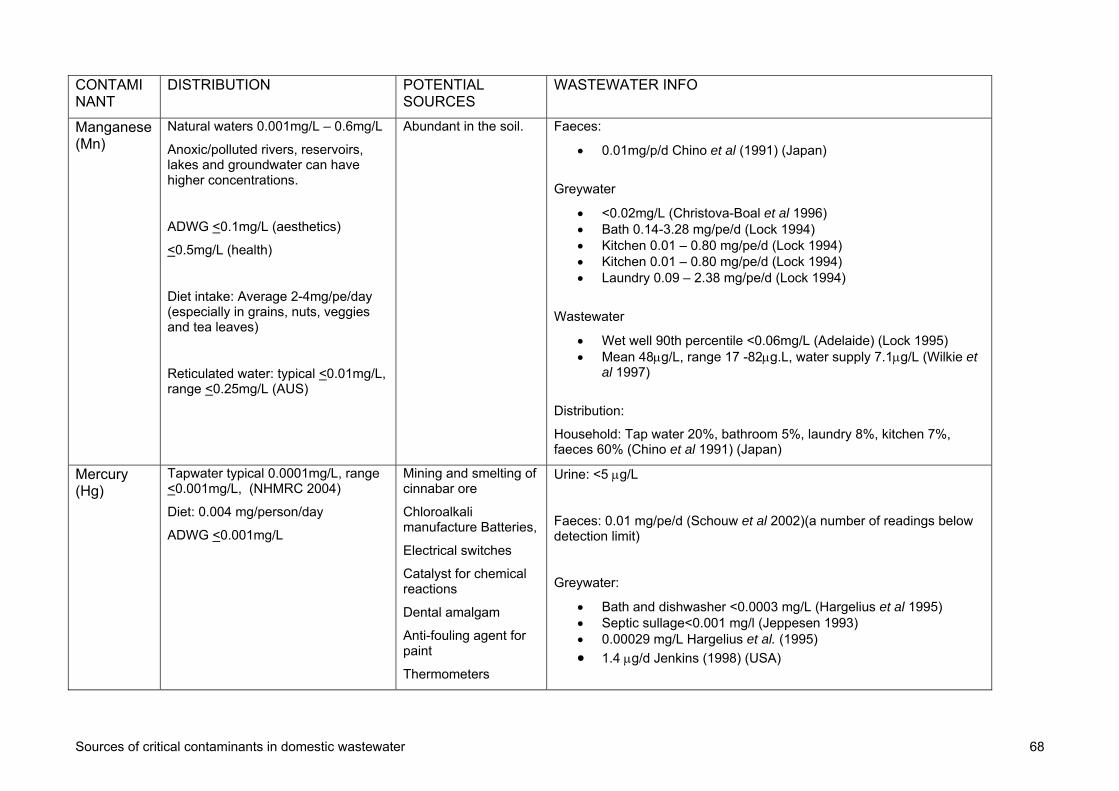
Sources of critical contaminants in domestic wastewater 68
CONTAMINANT
DISTRIBUTION POTENTIAL SOURCES
WASTEWATER INFO
Manganese (Mn)
Natural waters 0.001mg/L – 0.6mg/L
Anoxic/polluted rivers, reservoirs, lakes and groundwater can have higher concentrations.
ADWG <0.1mg/L (aesthetics)
<0.5mg/L (health)
Diet intake: Average 2-4mg/pe/day (especially in grains, nuts, veggies and tea leaves)
Reticulated water: typical <0.01mg/L, range <0.25mg/L (AUS)
Abundant in the soil.
Faeces:
0.01mg/p/d Chino et al (1991) (Japan)
Greywater
<0.02mg/L (Christova-Boal et al 1996) Bath 0.14-3.28 mg/pe/d (Lock 1994) Kitchen 0.01 – 0.80 mg/pe/d (Lock 1994) Kitchen 0.01 – 0.80 mg/pe/d (Lock 1994) Laundry 0.09 – 2.38 mg/pe/d (Lock 1994)
Wastewater
Wet well 90th percentile <0.06mg/L (Adelaide) (Lock 1995) Mean 48g/L, range 17 -82g.L, water supply 7.1g/L (Wilkie et
al 1997)
Distribution:
Household: Tap water 20%, bathroom 5%, laundry 8%, kitchen 7%, faeces 60% (Chino et al 1991) (Japan)
Mercury (Hg)
Tapwater typical 0.0001mg/L, range <0.001mg/L, (NHMRC 2004)
Diet: 0.004 mg/person/day
ADWG <0.001mg/L
Mining and smelting of cinnabar ore
Chloroalkali manufacture Batteries,
Electrical switches
Catalyst for chemical reactions
Dental amalgam
Anti-fouling agent for paint
Thermometers
Urine: <5 g/L
Faeces: 0.01 mg/pe/d (Schouw et al 2002)(a number of readings below detection limit)
Greywater:
Bath and dishwasher <0.0003 mg/L (Hargelius et al 1995) Septic sullage<0.001 mg/l (Jeppesen 1993) 0.00029 mg/L Hargelius et al. (1995)
1.4 g/d Jenkins (1998) (USA)
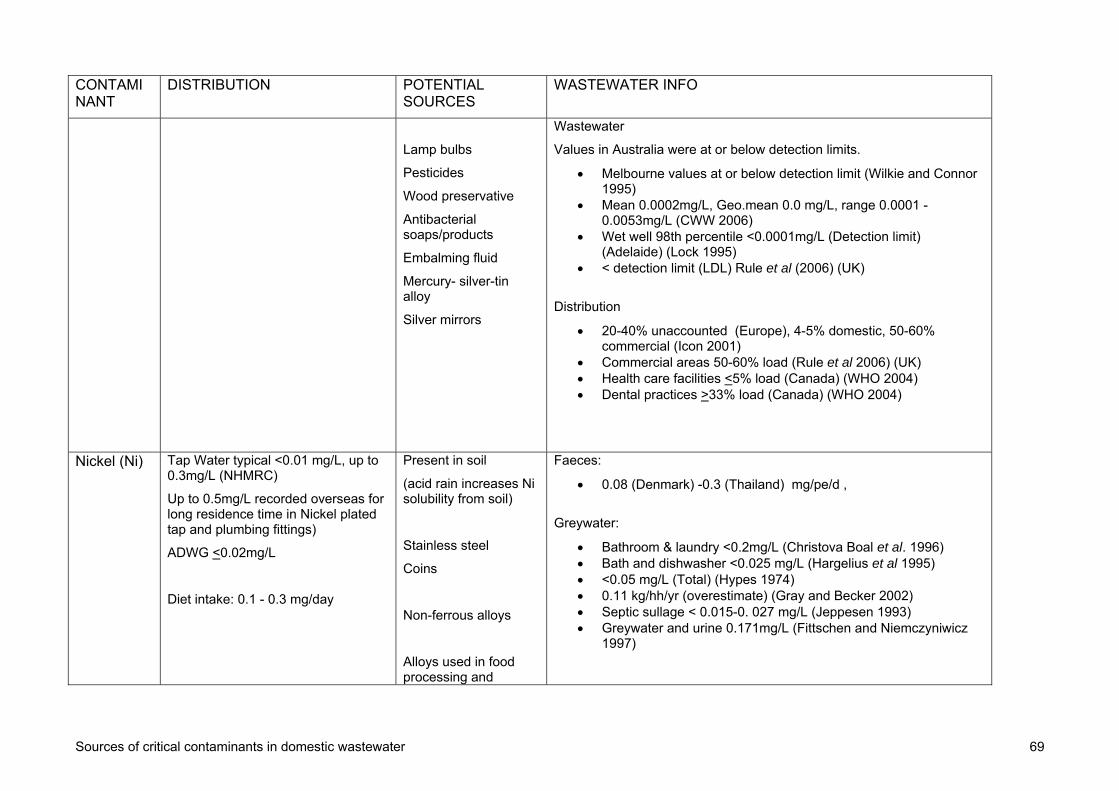
Sources of critical contaminants in domestic wastewater 69
CONTAMINANT
DISTRIBUTION POTENTIAL SOURCES
WASTEWATER INFO
Lamp bulbs
Pesticides
Wood preservative
Antibacterial soaps/products
Embalming fluid
Mercury- silver-tin alloy
Silver mirrors
Wastewater
Values in Australia were at or below detection limits.
Melbourne values at or below detection limit (Wilkie and Connor 1995)
Mean 0.0002mg/L, Geo.mean 0.0 mg/L, range 0.0001 - 0.0053mg/L (CWW 2006)
Wet well 98th percentile <0.0001mg/L (Detection limit) (Adelaide) (Lock 1995)
< detection limit (LDL) Rule et al (2006) (UK)
Distribution
20-40% unaccounted (Europe), 4-5% domestic, 50-60% commercial (Icon 2001)
Commercial areas 50-60% load (Rule et al 2006) (UK) Health care facilities <5% load (Canada) (WHO 2004) Dental practices >33% load (Canada) (WHO 2004)
Nickel (Ni) Tap Water typical <0.01 mg/L, up to 0.3mg/L (NHMRC)
Up to 0.5mg/L recorded overseas for long residence time in Nickel plated tap and plumbing fittings)
ADWG <0.02mg/L
Diet intake: 0.1 - 0.3 mg/day
Present in soil
(acid rain increases Ni solubility from soil)
Stainless steel
Coins
Non-ferrous alloys
Alloys used in food processing and
Faeces:
0.08 (Denmark) -0.3 (Thailand) mg/pe/d ,
Greywater:
Bathroom & laundry <0.2mg/L (Christova Boal et al. 1996) Bath and dishwasher <0.025 mg/L (Hargelius et al 1995) <0.05 mg/L (Total) (Hypes 1974) 0.11 kg/hh/yr (overestimate) (Gray and Becker 2002) Septic sullage < 0.015-0. 027 mg/L (Jeppesen 1993) Greywater and urine 0.171mg/L (Fittschen and Niemczyniwicz
1997)

Sources of critical contaminants in domestic wastewater 70
CONTAMINANT
DISTRIBUTION POTENTIAL SOURCES
WASTEWATER INFO
sanitary installations
Pipes & fittings
Electroplating
Rechargeable batteries (Nickel-cadmium batteries)
Protective coatings
Pigments
Electronic products
Fuel emissions
Marine, aerospace and nuclear industry
Stainless steel pipe average release
6gNi/L
Chromium plated tap
Laundry
<0.028mg/L (Hargelius et al 1995) 0.42- 0.94 mg/pe/d (Lock 1994) 0.55 g/d Jenkins (1998) (USA)
Kitchen
0.11- 0.46 mg/pe/d (Lock 1994)
Bathroom
0.18- 10.49 mg/pe/d (75% <0.35mg/pe/d) (Lock 1994)
Household dust: 15.6 g/g
Wastewater
Mean 4.2g/L, range <1 - 10g.L, water supply 2.1g/L (Wilkie et al 1997)
Mean 0.0035mg/L, Geo.mean 0.0 mg/L, range 0.0025 - 0.0130mg/L (CWW 2006)
Wet well 90th percentile <0.03mg/L (Adelaide) (Lock 1995)
Distribution
Icon 2001 (Europe)
WW >50% unaccounted, 10-50% domestic (high variability in estimates), 30% commercial, 10-20% run-off, trade waste 30%.
WRC 1994 in Icon 2001
Major sources: faeces>bath water>laundry>tap water>kitchen

Sources of critical contaminants in domestic wastewater 71
CONTAMINANT
DISTRIBUTION POTENTIAL SOURCES
WASTEWATER INFO
and fittings release Ni, but it decreases with time
Connor and Wilkie 1997
Water supply 25-60% load
Lock 1995
Household: even distribution across Bathroom, Kitchen and laundry.
Chino et al 1991 (Japan)
Household: Tap water 23%, bathroom 41%, laundry 15%, kitchen 9%, faeces 12%
Moryama et al (1989)
Faeces are source for 61% Ni load in domestic wastewater.
Zinc (Zn) Air 100-500ng/m3
Surface water and groundwater <0.01mg/litre (natural leaching)
Tap water: typical 0.05 mg/L, range up to 0.26mg/L
Rainwater tank: Typical 2-4mg/L, Range < 11mg/L (NHMRC 2004)
Food: lean red meat, whole-grain cereals, pulses, and legumes provide the highest concentrations of zinc
Electroplating industry waste
Fossil fuels
Brass
Coating on stainless steel, alloys and iron products,
(eg. Zn coated taps and fittings, plumbing)
Faeces:
9-16mg/pe/d Thailand (Schouw et al 2002), 9-16mg/pe/d (Denmark), 8.9mg/pe/d (Japan), 11mg/pe/d (Germany) 20% Zn in household WW (Chino et al 1991 Japan)
Greywater
Laundry
0.09 – 0.32 mg/L (Christova Boal et al.(1996) 0.308 ug/L (Surendran and Wheatley 1998)

Sources of critical contaminants in domestic wastewater 72
CONTAMINANT
DISTRIBUTION POTENTIAL SOURCES
WASTEWATER INFO
(25–50mg/kg raw weight) Fish, roots and tubers, green leafy vegetables, and fruits are low in zinc ( <10mg/kg)
ADWG <3mg/L (taste), <5mg/L (film deposition)
Galvanised rainwater tanks and roofs
Pesticides (zinc carbamate)
Wood preservatives
Paint, pigments and rubber products, including tyres,
Cosmetics (Zinc oxide)
Sunscreen
Antiseptics
0.44 mg/L (Hargelius et al. 1995) 45 g/d (Jenkins 1998) 4 g/h/yr (Gray and Becker 2002)
Bathroom:
0.2 - 6.3 mg/L (Christova Boal et al. 1996) 0.059 ug/l wash basin (Surendran and Wheatley 1998) 0.03mg/L (Jefferson et al. 2004) 88 g/h/yr (Gray and Becker 2002)
Wastewater
Mean 169g/L, range 52 - 348g.L, water supply 49g/L (Wilkie et al 1997)
Mean 0.1298mg/L, Geo.mean 0.0745 mg/L, range 0.0025 - 6.00mg/L (CWW 2006)
Wet well 90th percentile <0.3mg/L (Adelaide) (Lock 1995)
Household dust: geo.mean 437.7 g/g
Distribution
Connor and Wilkie 1997
Water supply 25-60% load
Lock 1995
Household: Bathroom 85-93% load From supply to household tap increased concentration by 1.3 -
18 times
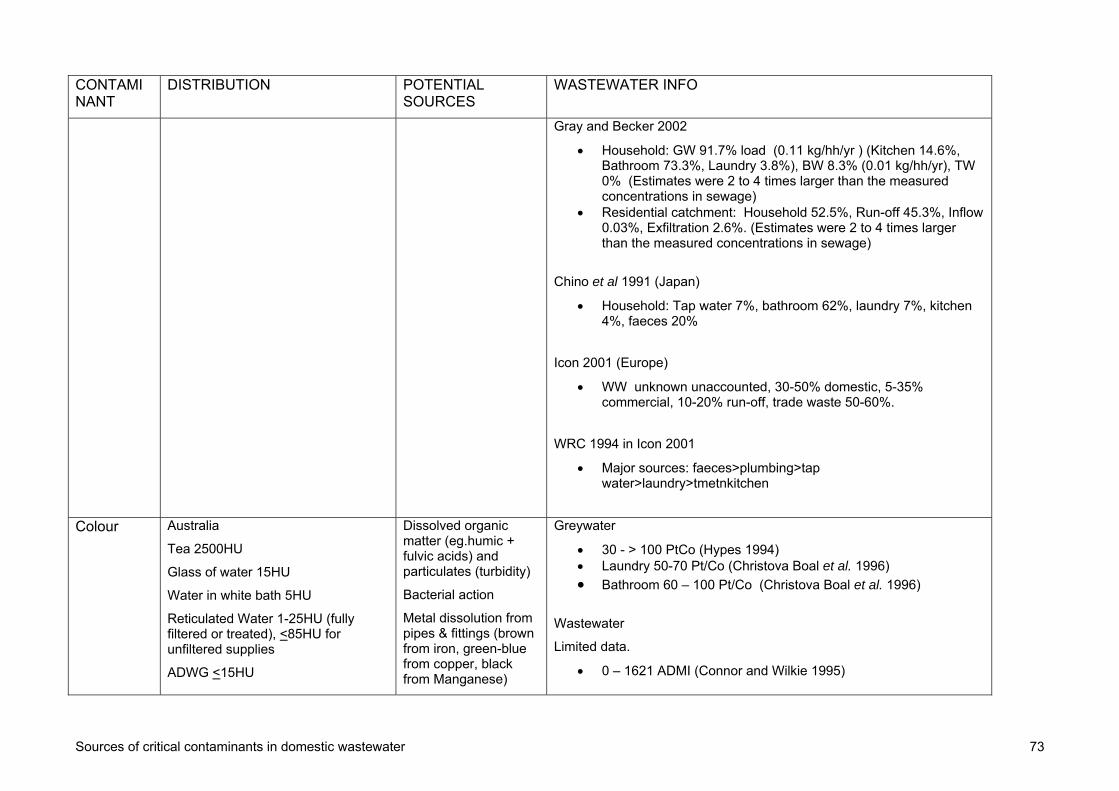
Sources of critical contaminants in domestic wastewater 73
CONTAMINANT
DISTRIBUTION POTENTIAL SOURCES
WASTEWATER INFO
Gray and Becker 2002
Household: GW 91.7% load (0.11 kg/hh/yr ) (Kitchen 14.6%, Bathroom 73.3%, Laundry 3.8%), BW 8.3% (0.01 kg/hh/yr), TW 0% (Estimates were 2 to 4 times larger than the measured concentrations in sewage)
Residential catchment: Household 52.5%, Run-off 45.3%, Inflow 0.03%, Exfiltration 2.6%. (Estimates were 2 to 4 times larger than the measured concentrations in sewage)
Chino et al 1991 (Japan)
Household: Tap water 7%, bathroom 62%, laundry 7%, kitchen 4%, faeces 20%
Icon 2001 (Europe)
WW unknown unaccounted, 30-50% domestic, 5-35% commercial, 10-20% run-off, trade waste 50-60%.
WRC 1994 in Icon 2001
Major sources: faeces>plumbing>tap water>laundry>tmetnkitchen
Colour Australia
Tea 2500HU
Glass of water 15HU
Water in white bath 5HU
Reticulated Water 1-25HU (fully filtered or treated), <85HU for unfiltered supplies
ADWG <15HU
Dissolved organic matter (eg.humic + fulvic acids) and particulates (turbidity)
Bacterial action
Metal dissolution from pipes & fittings (brown from iron, green-blue from copper, black from Manganese)
Greywater
30 - > 100 PtCo (Hypes 1994) Laundry 50-70 Pt/Co (Christova Boal et al. 1996)
Bathroom 60 – 100 Pt/Co (Christova Boal et al. 1996)
Wastewater
Limited data.
0 – 1621 ADMI (Connor and Wilkie 1995)

Sources of critical contaminants in domestic wastewater 74
CONTAMINANT
DISTRIBUTION POTENTIAL SOURCES
WASTEWATER INFO
TDS Water supply AUS: 45 mg/L to 750 mg/L (NHMRC 2004)
ADWG <500mg/L
Organic and inorganic salts from multiple sources.
Clay particles
Colloidal iron
Manganese oxides
Silica
Sodium
Potassium
Magnesium
Chloride
Sulphate,
Bicarbonate
Greywater
Mixed GW >300 S/cm 320-390 Total (S/cm) (Hypes 1974) Shower, basin, laundry < 20,000 S/cm (Santala et al 1998) Septic sullage 325-1140 (Jeppesen 1993) Mixed GW 65.6 kg/h/y (Gray and Becker 2002)
Laundry:
5.0kg/h/yr (Gray and Becker 2002) 190-1400 S/cm (Christova-Boal et al 1996) 1037 S/cm (Toowomba 2005) 300 – 800 mg/L (Lock 1995)
Bathroom
137 – 1260 mg/L shower (Burrows et al. 1991) 4.4 kg/h/yr (Gray and Becker 2002) 82 - 250S/cm (Christova Boal et al.(1996) Median 300mg/L (Lock 1994)
Kitchen
Average 500mg/L, median 300mg/L (Lock 1994)
Wastewater
Mean 375mg/L, range 124 – 596mg.L, water supply 92mg/L (Wilkie et al 1997)
Mean 304mg/L, Geo.mean 293 mg/L, range 130 - 750mg/L (CWW 2006)
Wet well 10th percentile <1000S/cm, 90th percentile 1010-1570S/cm or TDS median 700mg/L, range 560-1000mg/L (Adelaide) (Lock 1995)

Sources of critical contaminants in domestic wastewater 75
CONTAMINANT
DISTRIBUTION POTENTIAL SOURCES
WASTEWATER INFO
Carbonate
Fluoride
Iron
Manganese
Nitrate
Nitrite
Phosphate
Distribution
Lock 1995
Household: Bathroom 40% load, laundry 40% load, kitchen 10-20%load (suspicion that it might have been underestimated).
Gray and Becker 2002
Household: GW 58.3% load (65.6 kg/hh/yr ) (Kitchen 4.1%, Bathroom 3.9%, Laundry 4.4%), BW 41.7% (46.9 kg/hh/yr), TW 53.8% (60.6 kg/hh/yr )
Residential catchment: Household 63.2%, Run-off 19.7%, Inflow 0.2%, Exfiltration 3.2%.
Patterson
25% TDS load in household wastewater attributed to laundry detergents.
Sodium (Na)
Water retic: 3 mg/L - 300 mg/L, typical value 50 mg/L.
WTP: 1026mg/L
ETP: 640 mg/L
Diet intake: 4 g/person/day, <2g/pe/d for low salt diet
Natural deposits
Saline water intrusion
Water treatment chemicals
Domestic water softeners
Sewage effluent
Manufacture of paper,
Urine:
Ave 2.60g/L (Fitttschen and Hahn 1998 in Vinnerås 2001)
1.747 -3.517 g/pe/d (USA) (Schachter et al 1980)
3.195 – 4.23 g/pe/d (NZ) (Schachter et al 1980)
Sweat: <3.85g/pe/d (for a male under vigorous exercise)
Greywater:
Bath and dishwasher 21mg/L (Hargelius et al 1995) 68-93 mg/L (Total) (Hypes 1974) 16 mg/L (Tunaley 2004) Septic sullage 29-230 mg/L (Jeppesen 1993)

Sources of critical contaminants in domestic wastewater 76
CONTAMINANT
DISTRIBUTION POTENTIAL SOURCES
WASTEWATER INFO
glass
Culinary agent
Pharmaceutical
Food industry
General chemical industry
Detergents and soaps
Cleaning agents
Toiletries
Laundry
49 – 480mg/L (Christova Boal et al. (1996) 44 mg/L Hargelius et al. (1995) Ave. 178mg/L laundry wash (Toowomba 2005)
Bathroom
7.4 – 18mg/L (Christova Boal et al. 1996)
Wastewater
Mean 87.2mg/L, range 9.9 – 163mg.L, water supply 4.25mg/L (Wilkie et al 1997)
Mean 72mg/L, Geo.mean 68 mg/L, range 34 - 180mg/L (CWW 2006)
Distribution
Connor and Wilkie 1997
Water supply <25% load
Patterson
3-4% Na load in household wastewater is from laundry detergents.
Chloride (Cl-)
Surface water <100mg/L, typical <10mg/L. higher values for salt intrusion (NHMRC 2004)
Ret.water: typical 150mg/L, range up
Natural element in all plants and animals
Urine: 4.21g/L
Sweat: <0.81g/pe/d (for a male under vigorous exercise)
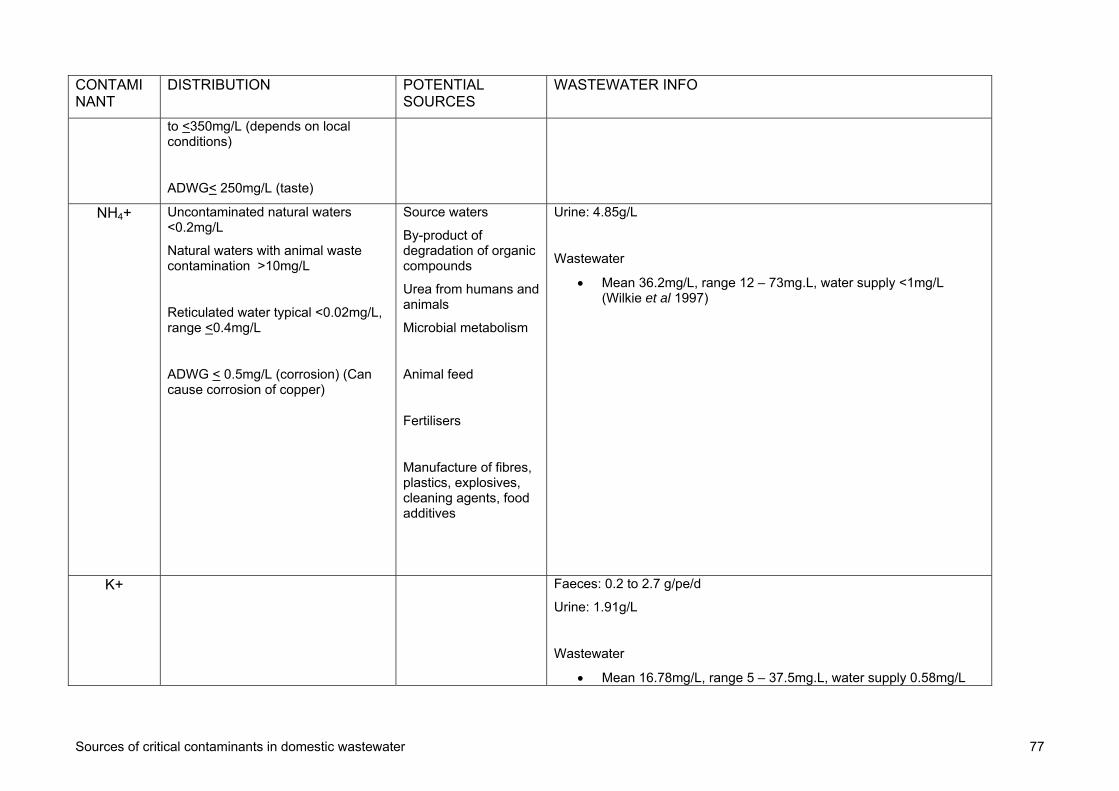
Sources of critical contaminants in domestic wastewater 77
CONTAMINANT
DISTRIBUTION POTENTIAL SOURCES
WASTEWATER INFO
to <350mg/L (depends on local conditions)
ADWG< 250mg/L (taste)
NH4+ Uncontaminated natural waters <0.2mg/L
Natural waters with animal waste contamination >10mg/L
Reticulated water typical <0.02mg/L, range <0.4mg/L
ADWG < 0.5mg/L (corrosion) (Can cause corrosion of copper)
Source waters
By-product of degradation of organic compounds
Urea from humans and animals
Microbial metabolism
Animal feed
Fertilisers
Manufacture of fibres, plastics, explosives, cleaning agents, food additives
Urine: 4.85g/L
Wastewater
Mean 36.2mg/L, range 12 – 73mg.L, water supply <1mg/L (Wilkie et al 1997)
K+ Faeces: 0.2 to 2.7 g/pe/d
Urine: 1.91g/L
Wastewater
Mean 16.78mg/L, range 5 – 37.5mg.L, water supply 0.58mg/L

Sources of critical contaminants in domestic wastewater 78
CONTAMINANT
DISTRIBUTION POTENTIAL SOURCES
WASTEWATER INFO
(Wilkie et al 1997)
Ca2 + Faeces: 0.67 to 2.1 g/pe/d (overseas data)
Urine : 0.004g/L
Wastewater
Mean 9.26mg/L, range 5 – 15.9mg.L, water supply 7.4mg/L (Wilkie et al 1997)
Mean 10.8mg/L, Geo.mean 10.17 mg/L, range 5 – 19mg/L (CWW 2006)
Mg2+ Faeces: 0.15 to 0.4g/pe/d
Wastewater
Mean 4.9mg/L, range 2.6 – 9.2mg.L, water supply 1.66mg/L (Wilkie et al 1997)
Mean 3.9mg/L, Geo.mean 3.9 mg/L, range 3 – 6.1mg/L (CWW 2006)
Cl- Urine: 4.21g/L
HPO42- Urine: 4.95g/L
SO42- Urine: 0.63 g/L
Wastewater
Mean 46.4mg/L, range 27 – 69mg.L, water supply not determined (Wilkie et al 1997)

Sources of critical contaminants in domestic wastewater 79
CONTAMINANT
DISTRIBUTION POTENTIAL SOURCES
WASTEWATER INFO
HCO3- Urine: 10.67g/L

Sources of critical contaminants in domestic wastewater 80