water erosion prediction at a national scale for south … hub documents/water sa journals...water...
TRANSCRIPT

Available on website http://www.wrc.org.zaISSN 0378-4738 = Water SA Vol. 34 No. 3 July 2008ISSN 1816-7950 = Water SA (on-line)
305
* To whom all correspondence should be addressed.Current address: Institute for Soil, Climate and Water, Agricultural Research Council, Private Bag X79, Pretoria 0001, South Africa +2712 310-2684; fax: +2712 323-1157;e-mail: [email protected] 18 December 2007; accepted in revised form 15 May 2008.
Water erosion prediction at a national scale for South Africa
JJ Le Roux1*, TL Morgenthal2, J Malherbe2, DJ Pretorius3 and PD Sumner1
1 Department of Geography, Geoinformatics and Meteorology, University of Pretoria, Pretoria 0002, South Africa2 Institute for Soil, Climate and Water, Agricultural Research Council, Private Bag X79, Pretoria 0001, South Africa
3 National Department of Agriculture, Directorate: Land Use and Soil Management, Private Bag X120, Pretoria 0001, South Africa
Abstract
Erosion is a major soil degradation problem in South Africa, confronting both land and water resource management through-out the country. Given the increasing threat of soil erosion, a need to improve techniques of estimating the soil-erosion risk at a national scale was identified by the National Department of Agriculture and forms the basic premise of this study. Principles and components of the Revised Universal Soil Loss Equation are applied here since the model combines sufficient simplicity for application on a national scale with a comprehensive incorporation of the main soil-erosion factors. Indica-tors of erosion susceptibility of the physical environment, including climate erosivity, soil erodibility and topography were improved over earlier assessments by feeding current available data into advanced algorithms. Two maps are presented: an actual erosion-risk distribution, and a potential erosion-risk map that excludes the vegetation cover factor. Actual soil-erosion risk, which relates to the current risk of erosion under contemporary vegetation and land-use conditions, was accounted for by regression equations between vegetation cover and MODIS-derived spectral index. The area of land with a moderate to severe potential risk is found to total approximately 61 m. ha (50%). Although more than 91 m. (75%) are classified as having only a very low to low actual risk, approximately 26 m. ha (20%) of land is eroded at a rate greater than a soil-loss tolerance of 10 t/ha·yr, showing the potential to target erosion control to problem areas. The Eastern Cape, Limpopo and KwaZulu-Natal Provinces have the highest erosion potential. Comparison of potential and actual erosion risk indicates that over 26 m. ha (>30% of national land) could be subject to high erosion risk without maintenance or careful management of the current veg-etation cover and land use. Although the distribution of the actual erosion risk broadly follows that outlined previously, this study provides an advance on previous assessments of erosion; results are validated more comprehensively than before, and show an overall accuracy of 77%. The paper also describes many of the limitations inherent in regional erosion studies.
Keywords: water erosion, national scale, potential risk, actual risk, RUSLE
Introduction
Soil erosion is an important form of land degradation and is among the world’s and South Africa’s most critical environmen-tal issues. Previous research indicates that more than 70% of South Africa (SA) is affected by varying intensities of soil ero-sion (Garland et al., 2000). Erosion is a process of detachment and transportation of soil materials by wind or water (Morgan, 1995) and although 25% of SA is highly susceptible to wind ero-sion (Hoffman and Todd, 2000), water is the dominant agent causing erosion in SA and forms the focus of the study. Water erosion occurs mostly through rain-splash, in un-concentrated flow as sheet erosion, as well as in concentrated flow as rill and/or gully erosion. Outcomes depend on the combined and interactive effects of erosion factors, namely rainfall erosivity, soil erodibility, slope steepness and slope length, crop manage-ment, and support practice. More detail on the factors governing erosion, specifically in a South African context, is provided by Laker (2004). Although soil erosion is a natural process, it is often accelerated by human activities such as clearing of vegeta-tion or by overgrazing (Snyman, 1999). Loss of fertile topsoil and reduction of soil productivity is coupled with serious off-site impacts related to increased mobilisation of sediment and
delivery to rivers. Eroded soil material leads to sedimentation/siltation of reservoirs, as well as an increase in pollution due to suspended sediment concentrations in streams which affects water use and ecosystem health (Flügel et al., 2003). Accord-ing to the latest State of Environment Report of SA, soil-erosion costs an estimated R2 bn. annually including off-site costs for purification of silted dam water (Hoffman and Ashwell 2001; cited in Gibson et al., 2006). Before prevention of soil erosion or remediation can be undertaken, the spatial extent of the problem should be established. Table 1 provides a summary of regional-based work undertaken on soil erosion in SA since 1990. Although some approaches are based on the collection of distributed field obser-vations and/or sediment data, most of the studies use a combina-tion of remote sensing and modelling techniques. In 1993, the Agricultural Research Council – Institute for Soil, Climate and Water (ARC-ISCW) was contracted by the Department of Agri-culture (DoA) to investigate the use of remote sensing and GIS in soil degradation management. As a result, Pretorius (1995) produced the Erosion Susceptibility Map (ESM) at a scale of 1:2.5 million by integrating a green vegetation cover map from NOAA satellite data with the sediment yield map of Southern Africa (Rooseboom, 1992). Research continued in 1998 to produce the Predicted Water Erosion Map (PWEM) at a scale of 1:2.5 million applying the widely used Universal Soil Loss Equation (USLE) within a GIS framework (Pretorius, 1998). Methodology, however, is based on a considerable simplifica-tion of the USLE, by grouping some of the erosion factors (soil and slope) as one. Furthermore, ESM and PWEM only provide percentage differences in erosion between regions without

Available on website http://www.wrc.org.zaISSN 0378-4738 = Water SA Vol. 34 No. 3 July 2008
ISSN 1816-7950 = Water SA (on-line)
306
presenting absolute values and are only suitable to prioritise problem areas on a broad scale due to the coarse resolution (1.1 km) of NOAA images. Another limitation is that both stud-ies are based on single-date imagery to test the potential of using remote sensing and GIS as monitoring tools. However, erosion occurs over a large variety of timescales, such as a single storm to many decades (Jetten et al., 2003) and single-date imagery does not account for the long-term average soil loss as required by models such as the USLE. Previous studies not only cover short or irregular research periods, they also have inconsisten-cies in their definitions and measurement procedures. For exam-
ple, the GLASOD and SANBI studies (shown in Table 1) are limited by being lumped for large districts, and due to depend-ence on apparently subjective judgments. According to Gibson (2006; cited in Gibson et al., 2006), the patterns of degradation reported in the SANBI study (Garland et al., 2000) are applicable only in a relative sense and are difficult to repeat for monitoring purposes. Perhaps the greatest problem with previous regional assessments of erosion is the lack of comparison and validation of estimates with actual soil losses. In order to improve spatial modelling of erosion in SA, a need was identified by the DoA to revise model components and tech-
TAbLe 1Summary table of regional erosion studies since 1990
Abbre-viation Name Developed by Aim Area and scale
GLASOD Global Assess-ment of Human-Induced Soil Degradation
International SoilReference and Information Centre (ISRIC)(Oldeman et al., 1991)
Actual soil erosion based on distributed point data obtained from various experts. Soil-erosion areas were delineated according to their judgment.
Global
Expert/subjective delineations
SDPM Sediment Delivery Potential Map
Water Research Commis-sion (WRC)(Rooseboom et al., 1992)
To provide spatial data on sediment yield by gathering sediment data and relevant geograph-ical information which influences sediment yield values of catchments
Southern Africa
Catchments 14 to 60 000 km2
BSI Bare Soil Index Agricultural Research Council – Institute for Soil, Climate and Water (ARC-ISCW)(Pretorius and Bezuiden-hout, 1994)
To detect bare soil and the status of extensive eroded areas on a national scale with Landsat Thematic Mapper (TM) data.
South Africa
30 m
ESM Erosion Suscepti-bility Map
Agricultural Research Council – Institute for Soil, Climate and Water (ARC-ISCW)(Pretorius, 1995)
To investigate the use of remote sensing and GIS in soil degradation management by inte-grating a green vegetation cover map produced from NOAA AVHRR satellite data with the sediment yield map.
South Africa
1:2.5 million
PWEM Predicted Water Erosion Map
Agricultural Research Council – Institute for Soil, Climate and Water (ARC-ISCW)(Pretorius, 1998)
Map erosion by integrating the main erosion contributing factors of the USLE in a GIS including the rainfall erosivity map of Smithen and Schulze (1982), the sediment yield map and green vegetation cover map to account for rainfall, soil-slope and vegetation factors.
South Africa
1: 2.5 million
NRA Natural Resources Auditing
Agricultural Research Council – Institute for Soil, Climate and Water (ARC-ISCW)(Wessels et al., 2001a)(Wessels et al., 2001b)
Map erosion by regional application of RUSLE in a GIS. Soil and topography factors were, for the first time, separately facilitated by: Applica-tion of digital elevation models with a resolu-tion of 75 m for the topography factor; and Soil maps (Soil Survey Staff, 1973-1987) were used to link erodibility values to correspond-ing soil series in the Land Type Inventories on a scale of 1:250 000 (Land Type Survey Staff, 1972-2006).
Mpumalanga & Gauteng provinces
1: 250 000
ISRDS nodes
Integrated Sus-tainable Rural Development Strategy nodes
Agricultural Research Council – Institute for Soil, Climate and Water (ARC-ISCW)(Ströhmenger et al., 2004)
As above OR Tambo and Umkhanyakude nodes in Eastern Cape and Kwa-Zulu-Natal1: 250 000
SANBI land degrada-tion review
South African National Biodi-versity Institute land degradation review
SANBI(Garland et al., 2000)
A series of maps illustrating the type and severity of soil degradation between different land-use types, using qualitative information obtained from 400 extension workers through-out SA during 1997 and 1998.
South Africa
Magisterial districts

Available on website http://www.wrc.org.zaISSN 0378-4738 = Water SA Vol. 34 No. 3 July 2008ISSN 1816-7950 = Water SA (on-line)
307
niques of estimating soil-erosion risk on a national scale. In this context the aim of this study is to improve the spatial soil-erosion indicators in SA on a national scale, including rainfall erosivity, soil erodibility, topography and vegetation cover to derive poten-tial and actual water erosion prediction maps. This study pro-vides a significant update on previous assessments of erosion by inclusion of improved or new national datasets on rainfall, soils, topography and vegetation cover which were not available until recently. Soil-erosion indicators are further improved by feeding current available data into advanced algorithms. Each factor is assessed as model inputs within a GIS framework and model out-puts are displayed by means of potential and actual water erosion prediction maps. Comparison of potential and actual erosion is important in policy terms because it indicates those areas which are inherently susceptible to erosion (potential risk), but which are presently protected at least to some extent by vegetation (actual risk) (Gobin et al., 2003). Results are also validated more comprehensively than before, followed by a description of the limitations and challenges that must be overcome in soil-erosion assessment on a national scale.
Model selection
South Africa covers an area of approximately 121 m. ha and to cope with such a large area, analysis must be carried out on a rel-atively small scale. According to Gobin et al. (2003), the avail-ability of input data is probably the most important considera-tion when selecting an erosion model on the regional or national scale. It would be impractical to use a sophisticated model if sufficient input data are not available. On the regional scale, the only means of running a complex model would be to assume certain variables and model parameters to be constant (Nearing, 1998). Prosser et al. (2001) identified this as the dominant rea-son why most soil-erosion prediction carried out on a regional scale is based on empirical relationships. The most well-known and implemented empirical model for estimating soil loss at the regional scale is the Universal Soil Loss Equation (USLE) (Wis-chmeier and Smith, 1978) developed in the 1970s by the United States Department of Agriculture (USDA), and its upgraded version the Revised USLE (RUSLE) (Renard et al., 1994). Although developed for application to hill-slopes, the (R)USLE and its derivatives have been incorporated into many regional-scale erosion studies across the globe (NRI, 2001; Gobin et al., 2003; Lu et al., 2003). In South Africa, empirical models have also been the most widely applied including the USLE (Crosby
et al., 1983; McPhee and Smithen, 1984; Snyman et al., 1986; Smith et al., 1995; Smith et al., 2000), RUSLE (Haarhoff et al., 1994; Pretorius and Smith, 1998) and the Soil Loss Estimation Method of Southern Africa (SLEMSA) developed by Elwell (1976) (Schulze, 1979; Hudson, 1987). Although (R)USLE was originally developed for sub-slope-scale soil conservation purposes, the model gained acceptance in regional-scale applications for the following reasons (Lu et al., 2003):• RUSLE distils soil erosion into a set of measurable primary
soil-erosion factors that facilitates the input data accessibil-ity over large regions
• The factor-based nature of RUSLE allows easy analysis of the role of individual factors in contributing to the estimated erosion rate
• RUSLE has a simple mathematical form facilitating the han-dling of large datasets using GIS.
Therefore it was decided to base the current study on a simpli-fication of RUSLE, the primary function of which is the esti-mation of (long-term average annual) sheet and rill erosion by runoff from slopes in specified cropping and management sys-tems. The model groups the influences on erosion into five cat-egories, namely climate, soil profile, relief, vegetation and land use, and land-management practices; the equation is (Renard et al., 1994):
A = R.K.L.S.C.P
where: A is the spatial average soil loss in t/ha·yr R is the rainfall runoff erosivity factor in MJ.mm/ha·h·yr K is the soil erodibility factor in t/ha per unit R L is the slope length factor S is the steepness factor C is the cover management factor P is the support practice factor
Factor values were estimated from the currently available natu-ral resource data in digital form.
Definitions, methodology and improvements
A water erosion prediction map was determined through process-ing and creating a series of images that represent the RUSLE
Figure 1Methodology flow chart for mapping
potential and actual water erosion

Available on website http://www.wrc.org.zaISSN 0378-4738 = Water SA Vol. 34 No. 3 July 2008
ISSN 1816-7950 = Water SA (on-line)
308
components in digital form (GIS) (see Fig. 1). The manner in which soil- erosion indicators are classified and improved for South Africa follows.
Rainfall erosivity (R). The R-factor is the mean annual sum of individual storm EI30 values (E is the total storm kinetic energy in MJ/ha·mm and I30 is the maximum 30 min rainfall intensity in mm/h). However, reliable and long-term information on rainfall intensity is not available at a regional level and it is necessary to estimate rainfall erosivity from daily rainfall. Here, daily rainfall data (Agrometeorology Staff, 1984-2000) was used as input to the daily rainfall erosivity model developed by Yu and Rosewell (1996a and 1996b) in Australia where it was shown to accurately predict the R-factor and its seasonal distribution. Australia has a climate that, similar to SA, ranges spatially between winter rainfall areas in the southwest to a summer rainfall with tropical influences over the northern parts, while large areas over the interior of both countries are classified as semi-arid. Since rain-fall is measured at fixed points (weather stations), the inverse distance weight method was used to interpolate data to an EI30 surface at 2 km resolution for the entire SA. Using more detailed (stations) and more recent rainfall data than before (e.g. Smithen, 1981) an improved rainfall erosivity algorithm was derived that also compensates for topographical influences.
Soil erodibility (K) The K-factor may be estimated from data on the soil particle size distribution, organic matter content, sur-face structure and profile permeability using the soil erodibility nomograph (Wischmeier and Smith, 1978). In the absence of soil analytical data in digital form, two alternative sources of soil information were utilised: Soil maps (Soil Survey Staff, 1973-1987) were used to obtain soil erodibility ratings for the individual soil series of the Binomial Soil Classification Sys-tem of SA (MacVicar et al., 1977); and erodibility values were linked to corresponding soil series in the Land Type Inventories (Land Type Survey Staff, 1972-2006) in order to be spatially displayed on a scale of 1:250 000. Using the Soil Loss Estima-tor of Southern Africa (SLEMSA) model, soil erodibility units were assigned based on an assessment of the surface soil texture, surface soil structure, profile permeability and soil depth of the dominant soils. Subsequently, the SLEMSA erodibility factors were used as a guide to the assignment of RUSLE K-factors (in SI units t/ha per unit R) to all land types of SA. Previously, this methodology was only used at a provincial scale or for smaller areas, including the Mpumalanga and Gauteng Provinces as well as ISRDS nodes (e.g. Wessels et al., 2001a; 2001b; Ströhmenger et al., 2004).
Topography factors (LS) The effects of topography include the effects of slope steepness (S) and slope length (L). LS-factor maps were extracted from 20 m resolution DEMs (GISCOE, 2001) by means of the widely used stream power equation of Moore and Burch, (1986; Moore and Wilson, 1992). The main difference between this equation and the RUSLE LS equation is the use of upslope contributing area in place of flow-path length. The stream power equation is the most widely used method for the extraction of stream networks; to accumulate the contributing area upslope of each pixel through a network of cell-to-cell drainage paths (Band and Moore, 1995; Gallant and Wilson, 2000). Flow-path lines are constructed from flow direction given by an aspect angle. In this study, flow tracing was calculated using a flow algorithm (combined) available in HydroTools (Schäuble, 2003), which is an add-in program for ArcView GIS 3.x. Methodology from previous erosion studies
was thus improved by using more detailed digital elevation data (20 m instead of 70 m or higher); and refining the flow trac-ing using the combined flow algorithm instead of the single flow algorithm used before. In addition, the soil and slope factors were separately accounted for, instead of grouping them into one, such as in Pretorius (1998). A potential water erosion map of SA is generated by combin-ing the above indicators, and represents the inherent susceptibil-ity of the soil to rainfall erosion, irrespective of vegetation cover or land use. Actual soil-erosion risk, which relates to the current risk of erosion under present vegetation and land use conditions, was accounted for as follows:
Vegetation cover index (C) The C-factor is the ratio of soil loss from an area with specified cover and management to soil loss from an identical area in tilled continuous fallow. How-ever, since it is not possible to take field measurements at a national scale throughout the year, it was necessary to ascer-tain how crops change with time by means of remote-sensing techniques and other sources of literature (e.g. Acocks, 1988; Low and Rebelo, 1998; National Land Cover, 2000). The widely used NDVI was used in this study as an indicator of vegetation growth determined from images between 2000 and 2004 from the Moderate Resolution Imaging Spectroradiometer (MODIS). MODIS is more advanced than NOAA data previously used with regard to its spatial (250 m2) and spectral (36 bands) resolution. Subsequently, C-values were assigned through regression equa-tions between vegetation cover and MODIS-derived spectral index. The C-factor was estimated using the equations based on data from Wischmeier and Smith (1978). Assessment of the support practice factor (P) was excluded by setting the P-fac-tor to 1. Thus, the estimated soil-loss rate for cropping lands reflects erosion rates with no support practices other than cover management. More detail on these procedures is provided by Morgenthal et al. (2006) and Le Roux et al. (2006). Finally, an actual water- erosion prediction map was derived by combining C-values with the physical indicators of erosion susceptibility mentioned above.
Results and discussion
Due to the extensive number of input parameters the RUSLE fac-tor maps are provided elsewhere (Le Roux et al., 2006) but the end product of all the input data and erosion factors is presented in the accompanying water erosion prediction maps. Two indi-cators are proposed as measures of the area affected by erosion: extent to which the total area (e.g. rough estimations per prov-ince in 106 ha) is affected by water erosion, and percentage of area. Maps are also expressed in quantitative terms and defined into soil-loss classes adopted from Bergsma et al. (1996) in t/ha·yr: very low (0 to 5); low (5 to 12); moderate (12 to 25); high (25 to -60); very high (60 to -150); and extremely high (>150).
Potential water-erosion prediction map
Partially solving the RUSLE equation using climate erosivity, soil erodibility and topography, provides the erosion suscepti-bility or potential soil-erosion risk of the physical environment. Figure 2 thus represents the worst possible situation, which is the inherent susceptibility of soil to rainfall erosion, irrespective of vegetation cover or land use. The area of land with a moder-ate to extremely high erosion risk totals approximately 61 m. ha (50%). Figure 2 clearly illustrates that the eastern parts of the country has a much higher erosion potential than the western

Available on website http://www.wrc.org.zaISSN 0378-4738 = Water SA Vol. 34 No. 3 July 2008ISSN 1816-7950 = Water SA (on-line)
309
part of the country. These areas are mostly associated with hill and mountain ranges, regions of cyclonic rain and erodible soils. Conversely, a little over 56 m. ha (46%) of the country is clas-sified as having a low to very low erosion risk, mainly in the Northern Cape (29 m. ha; 13.7%) and North-West Province (7 m. ha; 3.3%) (see Fig. 3). Areas of low erosion risk tend to coincide with level plateau areas with low rainfall erosivity.
Actual water erosion prediction map
According to the RUSLE, the product of the potential water ero-sion risk with the cover factor provides the actual water erosion prediction map of SA (see Fig. 4). As the data in Fig. 3 indicate, the area of land with an extremely high erosion risk totals over 1 million ha (over 1% of the land surface). Although more than 91 m. ha (75%) are classified as having a very low to low risk, approximately 26 million ha (20%) of land is eroded at a rate greater than the suggested soil loss tolerance of 10 t/ha·yr (dis-cussed under validation). In quantitative terms, the average pre-dicted soil loss rate for SA is 12.6 t/ha·yr. It should be stressed that results give a broad overview of the general pattern of the relative differences, rather than providing accurate absolute ero-sion rates. It is also noteworthy that differences between sedi-ment yield and soil loss can be very high (Garland et al., 2000). Research findings of Scott and Schulze (1991) suggest that soil loss within a catchment can be up to five times greater than sedi-ment yield due to the reduction of the total eroded volume by deposition within the catchment. Consequently, a soil-erosion figure of 12.6 t/ha·yr could correspond with a sediment yield of 2.5 t/ha·yr. Compared to Australia, the average predicted soil-loss rate for SA is three times as much than that estimated (4.1 t/ha·yr) by Lu et al. (2003). SA has a higher soil-loss rate than Aus-tralia presumably due to extensive cultivation and overgrazing. A total of 62% of the country is currently under commercial and subsistence farming, including areas that have slopes of 10%
or more (National Land Cover, 2000). The areas predicted to be greatly affected by soil loss when compared to the National Land Cover appear to be the degraded unimproved grasslands. Unimproved grasslands are associated with subsistence agricul-ture where overgrazing of livestock has been excessive. These regions occur widely along the eastern marginal zone, approxi-mately 42 m. ha positioned between the interior plateau and the coast, 0 to 1 200 m a.m.s.l. At the provincial level, the Eastern Cape makes the largest (28%) contribution to soil loss. As is evi-dent from Fig. 3, about one third (16 m. ha, 37%) of the province is classified as having moderate to extremely high soil loss.
Figure 3Potential and actual erosion risk of each province expressed as
a percentage
Figure 2Potential water
erosion-risk map of South
Africa

Available on website http://www.wrc.org.zaISSN 0378-4738 = Water SA Vol. 34 No. 3 July 2008
ISSN 1816-7950 = Water SA (on-line)
310
Comparison between potential and actual water erosion
Comparison of the potential risk with the actual soil-erosion risk indicates those areas which are inherently susceptible to erosion, but which are presently protected by vegetation. It is recognised that there is a huge difference between actual and potential soil erosion, especially along the eastern marginal zone, because low C-values (good cover) compensate for the high potential erosion risk. Almost 67% of marginal land has a moderate to severe erosion potential (>12 t/ha·yr), whereas approximately 23% is classified as having a moderate to severe actual erosion risk. Many of these areas are associated with areas of rapid population growth and agricultural intensification, and are thus likely to be at risk. For example, KwaZulu-Natal has large areas of moderate to extremely high potential erosion risk (90%) but relatively low actual erosion risk (18%) due to current vegetation cover. The potential erosion map identifies areas of high soil-erosion poten-tial within some of the natural vegetated areas (e.g. Drakensberg area), but these are natural conditions in steep lands experiencing high intensity rainfall, and do not produce elevated soil-erosion rates. Such comparisons serve to emphasise the importance of vegetation cover for soil-erosion control, and the dangers inher-ent in changes in land use practice. Over 26 m. ha (at least 30% of national land) would be subject to high erosion risk with-out maintenance of the current vegetation cover and land use. Importantly, around 4.7 m. ha (37%) of cultivated land surface in SA falls in the high to extremely high potential erosion class. Agricultural intensification could change the land cover, leading to poorer vegetation cover which is the major pressure indica-tor for soil erosion. The following section compares results with general erosion patterns of erosion risk previously produced.
Comparison with previous studies
Other than visual comparison of maps, there are very few pat-tern comparison techniques available at a regional scale (Jetten
et al., 2003). Only recent regional-scale studies are used for gen-eral comparison (see Table 1), since the geographic coverage of field- or plot-scale studies is incomplete and cannot provide the comprehensive information required of this study. In general, the distribution of actual erosion risk broadly follows that out-lined previously. Very large percentages of the Eastern Cape, Limpopo and KwaZulu-Natal Provinces are under severe threat of erosion, whereas Gauteng, the Northern Cape and North-West Provinces seem to be the least threatened by water erosion. The study by Rooseboom et al. (1992) of sediment yield is worthy of particular note, as it is based on measurements of fluvial sedi-ment loads and covers a wide geographic area. As with findings here, results indicated that some of the highest sediment-yielding areas in SA are situated in the north-eastern Cape and southern Free State, as well as certain areas of KwaZulu-Natal. It appears that areas of pronounced relief tend to have the highest soil-loss rates, including large tracts of the Drakensberg, the former Tran-skei and Waterberg Plateau. This predicted trend is also consist-ent with the measurements of Garland et al. (2000) who assessed different land-use types at a national scale in terms of the main types of soil degradation affecting them. Rill, and gully erosion are the most important types of land degradation on the commu-nal grazing lands of the eastern parts of the country, especially along the escarpment and coastal plain. The study of Pretorius (1998) also indicates that high soil-loss rates follow the topog-raphy in certain areas with steep terrain, especially along the escarpment. The predicted results, however, are not in agreement with all the surveys and areas in SA. Disagreements are evident in areas with grazing and subsistence farming on steep slopes. Wessels et al. (2001a; 2001b) and Ströhmenger et al. (2004) pre-dict high soil-loss rates for these areas in Mpumalanga, Gauteng and the OR Tambo and Umkhanyakude ISRDS Nodes located in northern Eastern Cape and KwaZulu-Natal. Current results indicate that not all subsistence farming areas with steep slopes are affected by high erosion rates. Large areas in the OR Tambo node, for example, are not affected by erosion. These regions
Figure 4Actual water
erosion-risk map of South Africa
Available on website http://www.wrc.org.zaISSN 0378-4738 = Water SA Vol. 34 No. 3 July 2008ISSN 1816-7950 = Water SA (on-line)
311
have a high potential erosion risk but a low actual erosion risk due to good vegetation cover. Current observations indicate that erosion sites occur commonly in subsistence farming areas on soils with high erodibility values. The results of Rooseboom et al. (1992) support the concept that areas with erodible soils tend to yield most suspended sediment. Flügel et al. (2003) confirm this trend in the Mkomazi catchment in KwaZulu-Natal where erosion sites in informal settlements are mainly located on soils with high erodibility values. More disagreements are evident in arid areas. Pretorius (1998) predicts much higher erosion rates for the Great Karoo region in the Northern Cape compared to the current study. Pos-sible explanations include the low rainfall and erosivity values for this region, leading to low predicted rates of erosion found here. Although sheet, rill and gully erosion occur commonly in large parts of the Karoo, several of these are relict erosion fea-tures. It is postulated that erosion features in some of these areas are of considerable age and may not be contributing to current sediment yields (e.g. Sneeuberg uplands north of Graaff-Reinet) (Boardman et al., 2003). Other disagreements are noticeable for the savannah region in northern Limpopo and Northern Cape. Pretorius (1998) predicts a more severe erosion risk for this region compared to the current study. His results may be reasonable since field observations indicate that arid area ground cover is frequently less than its projected vegetation crown cover, which is not always protective against erosion. C-values for savannah in northern Limpopo and Northern Cape remain questionable due to the dense tree canopy concealing the poor ground cover when monitored by satellite. Nevertheless, the distribution of the actual erosion risk broadly follows that outlined previously. Such comparisons, however, are not sufficient since the stud-ies differ in their definitions and measurement procedures. By way of validation, the actual water-erosion map was compared to data collected during field observations (n = 10 290) including the national Land Type Survey (Land Type Survey Staff, 1972 to 2006) and verification of the National Land Cover (2000) map of SA.
Validation
First, the erosion map was divided into two classes of severity, but not into different erosion types since the soil-erosion maps do not distinguish between erosion types. The two severity classes are expressed in proportion to typical soil-loss tolerance values;
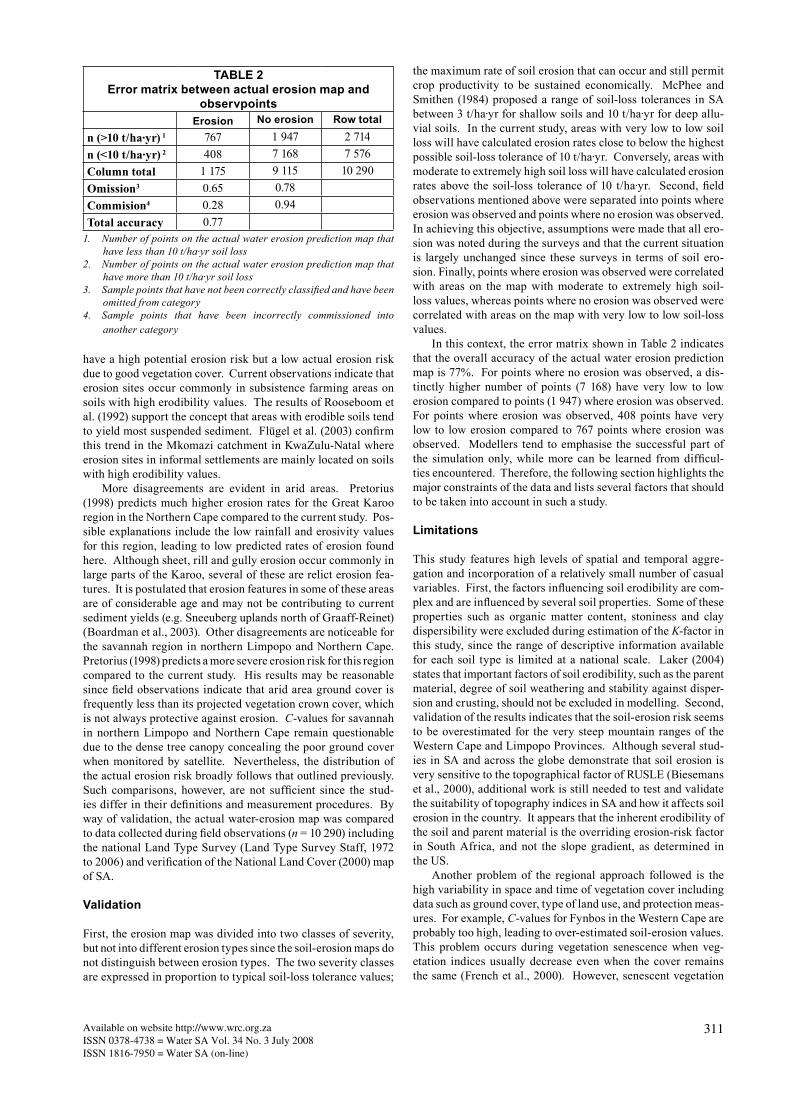
the maximum rate of soil erosion that can occur and still permit crop productivity to be sustained economically. McPhee and Smithen (1984) proposed a range of soil-loss tolerances in SA between 3 t/ha·yr for shallow soils and 10 t/ha·yr for deep allu-vial soils. In the current study, areas with very low to low soil loss will have calculated erosion rates close to below the highest possible soil-loss tolerance of 10 t/ha·yr. Conversely, areas with moderate to extremely high soil loss will have calculated erosion rates above the soil-loss tolerance of 10 t/ha·yr. Second, field observations mentioned above were separated into points where erosion was observed and points where no erosion was observed. In achieving this objective, assumptions were made that all ero-sion was noted during the surveys and that the current situation is largely unchanged since these surveys in terms of soil ero-sion. Finally, points where erosion was observed were correlated with areas on the map with moderate to extremely high soil-loss values, whereas points where no erosion was observed were correlated with areas on the map with very low to low soil-loss values. In this context, the error matrix shown in Table 2 indicates that the overall accuracy of the actual water erosion prediction map is 77%. For points where no erosion was observed, a dis-tinctly higher number of points (7 168) have very low to low erosion compared to points (1 947) where erosion was observed. For points where erosion was observed, 408 points have very low to low erosion compared to 767 points where erosion was observed. Modellers tend to emphasise the successful part of the simulation only, while more can be learned from difficul-ties encountered. Therefore, the following section highlights the major constraints of the data and lists several factors that should to be taken into account in such a study.
Limitations
This study features high levels of spatial and temporal aggre-gation and incorporation of a relatively small number of casual variables. First, the factors influencing soil erodibility are com-plex and are influenced by several soil properties. Some of these properties such as organic matter content, stoniness and clay dispersibility were excluded during estimation of the K-factor in this study, since the range of descriptive information available for each soil type is limited at a national scale. Laker (2004) states that important factors of soil erodibility, such as the parent material, degree of soil weathering and stability against disper-sion and crusting, should not be excluded in modelling. Second, validation of the results indicates that the soil-erosion risk seems to be overestimated for the very steep mountain ranges of the Western Cape and Limpopo Provinces. Although several stud-ies in SA and across the globe demonstrate that soil erosion is very sensitive to the topographical factor of RUSLE (Biesemans et al., 2000), additional work is still needed to test and validate the suitability of topography indices in SA and how it affects soil erosion in the country. It appears that the inherent erodibility of the soil and parent material is the overriding erosion-risk factor in South Africa, and not the slope gradient, as determined in the US. Another problem of the regional approach followed is the high variability in space and time of vegetation cover including data such as ground cover, type of land use, and protection meas-ures. For example, C-values for Fynbos in the Western Cape are probably too high, leading to over-estimated soil-erosion values. This problem occurs during vegetation senescence when veg-etation indices usually decrease even when the cover remains the same (French et al., 2000). However, senescent vegetation
TAbLe 2error matrix between actual erosion map and
observpointserosion No erosion Row total
n (>10 t/ha·yr) 1 767 1 947 2 714n (<10 t/ha·yr) 2 408 7 168 7 576Column total 1 175 9 115 10 290Omission3 0.65 0.78Commision4 0.28 0.94Total accuracy 0.77
1. Number of points on the actual water erosion prediction map that have less than 10 t/ha·yr soil loss
2. Number of points on the actual water erosion prediction map that have more than 10 t/ha·yr soil loss
3. Sample points that have not been correctly classified and have been omitted from category
4. Sample points that have been incorrectly commissioned into another category

Available on website http://www.wrc.org.zaISSN 0378-4738 = Water SA Vol. 34 No. 3 July 2008
ISSN 1816-7950 = Water SA (on-line)
312
offers the same protection to the soil as green vegetation and it is important also to detect relatively dry vegetation. Further-more, this study calculates mean annual erosion, an approach that neglects important seasonal patterns of rainfall erosivity and cover. More specifically, coincidence of erosive rains with low cover in some regions can be a strong control on the mean annual soil-loss rates. Finally, the RUSLE-based approach will probably underestimate soil losses in regions where gully and subsurface erosion is prominent (Biesemans et al., 2000). These errors, however, can only be challenged at the detailed level (e.g. 1: 10 000 or small catchment scale).
Conclusion and recommendations
This study based soil-erosion prediction on the principles and components defined in RUSLE because it combines sufficient simplicity for application on a national scale with a proper incor-poration of the main soil-erosion factors. It also represents a standardised approach and was chosen because of the availabil-ity of spatial input data on each of the soil-erosion factors at a national scale. Indicators of erosion, including climate erosivity, soil erodibility, topography and vegetation cover were improved over earlier assessments by feeding current available data into advanced algorithms. Two maps are presented; an actual erosion-risk distribution, and a potential erosion-risk map that excludes the vegetation cover factor. Comparison of potential and actual erosion is important in policy terms because it indicates those areas which are inherently susceptible to erosion (potential risk), but which are presently protected by vegetation (actual risk). Large areas of high potential risk occur in KwaZulu-Natal, the Eastern Cape and Mpumalanga Provinces, mostly associated with hill and mountain ranges, regions of cyclonic rain and erod-ible soils. Approximately 50% (61 million ha) of national land has a moderate to severe erosion potential (>12 t/ha·yr), whereas approximately 20% (26 million ha) of land is classified as hav-ing a moderate to severe actual erosion risk, exceeding the pro-posed soil-loss tolerance value of 10 t/ha·yr. Comparison of the potential and actual erosion risk indicates that over 26 million ha (30% of national land) would be subject to high erosion risk without maintenance of the current vegetation cover. The East-ern Cape Province makes the largest (28%) contribution to soil loss with approximately one third (16 million ha, 37%) of the province classified as moderate to extremely high. The distribution of the actual erosion risk broadly follows that outlined previously; high soil-loss rates follow the topog-raphy in certain areas with steep terrain, especially on the com-munal grazing lands of the eastern parts of the country along the escarpment and coastal plain. Results, however, are not in agree-ment with all the previous studies; current results appropriately indicate that not all subsistence farming areas with steep slopes are affected by high erosion rates. Rather, erosion sites occur commonly in subsistence farming areas on soils with high erod-ibility values. Results are also validated more comprehensively than before, indicating an overall accuracy of 77%. Certain obvious anomalies (e.g. Karoo, Fynbos and savannah regions) reflect the lack of more accurate soil and vegetative cover data for SA. This study features high levels of spatial and temporal aggregation and incorporation of a relatively small number of casual variables. The national-scale information presented here cannot be used to make decisions at a small-scale (farm-scale or on a pixel by pixel level). Despite these limitations, results remains useful for regional evaluation and serve as an important basis for the determination of areas where soil conservation should be emphasised. Further
refinement will be possible given additional research, includ-ing: • The production of more accurate erodibility maps at a
national scale by incorporating key factors such as clay dis-persibility and parent material
• Application of RUSLE on a monthly averaged basis by calcu-lating appropriate erosivity and cover factors for each month (in order to capture seasonal variations in soil erosion)
• New high-resolution satellite imagery such as Syste me Pour l’Observation de la Terre (SPOT 5) for detecting individ-ual erosion features, especially gully erosion from local to regional scales
• Establishment of a methodological framework to guide and standardise future regional soil-loss modelling and mapping efforts. In conclusion, regional studies should combine the simplicity required for application on a regional scale with a proper incorporation of the most important processes. The development of methods that preserve information across scales or quantify the loss of information with changing scales has become central in erosion studies.
Acknowledgements
The authors would like to thank Mr AJ van Zyl (formerly at the ARC-ISCW) for initiating the project. The Department of Agriculture, Directorate Land Use and Soil Management (Mr HJ Lindemann) supported and funded the research for which we are thankful. The authors would like to thank Mrs M van der Walt and Mrs E van den Berg at the ARC-ISCW for providing the data required for application in the study. Thanks also to Dr HJ Smith, Mr TS Newby, Mr JL Schoeman and Mr HL Weepener of the ARC-ISCW who gave valuable advice. The help and constant encouragement given by Mr CE Steyn is gratefully acknowledged. Editing by Dr TP Fyfield is very much appreciated.
References
ACOCKS JPH (1988) Veld types of South Africa. Memoirs of the Botanical Survey of South Africa. Government Printer, Pretoria, South Africa. 57 1-146.
AGROMETEOROLOGY STAFF (1984-2000) ARC-ISCW Agromete-orology Weather Station Network Data for South Africa, Unpub-lished. ARC-Institute for Soil, Climate and Water, Pretoria, South Africa.
BAND LE and MOORE ID (1995) Scale: Landscape attributes and geographical information systems. In: Kalma JD and Sivapalan M (eds.) Scale Issues in Hydrological Modeling, John Wiley & Sons, Chichester, UK. 159-180.
BERGSMA E, CHARMAN P, GIBBONS F, HURNI H, MOLDEN-HAUER WC and PANICHAPONG S (1996) Terminology for Soil Erosion and Conservation. ISSS, ITC, ISRIC.
BIESEMANS J, VAN MEIRVENNE M and GABRIELS D (2000) Extending the RUSLE with the Monte Carlo error propagation tech-nique to predict long-term average off-site sediment accumulation. J. Soil Water Conserv. 55 35-42.
BOARDMAN J, PARSONS AJ, HOLLAND R, HOLMES PJ and WASHINGTON R (2003) Development of badlands and gullies in the Sneeuberg, Great Karoo, South Africa. Catena 50 165-184.
BüHMANN C, BEUKES DJ and TURNER DP (2006) Clay mineral associations in soils of the Lusikisiki area, Eastern Cape Province, and their agricultural significance. S. Afr. J. Plant & Soil 23 (2) 78-86.
CROSBy CT, SMITHEN AA and McPHEE P J (1983) Introduction of the Universal Soil Loss Equation in the Republic of South Africa, Paper No. 83.2072. Proc. of the 1983 Summer Meeting of the ASAE. 26-29 June, Bozeman, Montana, USA.

Available on website http://www.wrc.org.zaISSN 0378-4738 = Water SA Vol. 34 No. 3 July 2008ISSN 1816-7950 = Water SA (on-line)
313
GOBIN A, GOVERS G, JONES R, KIRKBy MJ, KOSMAS C and GENTILE AR (2003) Assessment and Reporting on Soil Erosion, Background and Workshop Report, Technical Report 94. European Environment Agency, Copenhagen, Denmark. http://reports.eea.europa.eu/technical.
ELWELL HA (1976) Natal Agricultural Research Bulletin No. 7, Soil Loss Estimator for Southern Africa. Department of Agricultural Technical Services, Natal, South Africa.
FLüGEL W, MäRKER M, MORETTI S, RODOLFI G and SIDRO-CHUK A (2003) Integrating geographical information systems, remote sensing, ground truthing and modelling approaches for regional erosion classification of semi-arid catchments in South Africa. Hydrol. Process. 17 929-942.
FRENCH AN, SCHMUGGE TJ and KUSTAS WP (2000) Discrimi-nation of senescent vegetation using thermal emissivity contrast. Remote Sens. Environ. 74 249-254.
GALLANT JC and WILSON JP (2000) Primary topographic attributes. In: Wilson JP and Gallant JC (eds.) Terrain Analysis, Principles and Applications. John Wiley & Sons, Inc., New york, USA. 51-85.
GARLAND GG, HOFFMAN MT and TODD S (2000) Soil degrada-tion. In: Hoffman MT, Todd S, Ntshona Z and Turner S (eds.) A National Review of Land Degradation in South Africa. South Afri-can National Biodiversity Institute, Pretoria, South Africa. 69-107. http://www.nbi.ac.za/landdeg.
GIBSON DJD (2006) Land Degradation in the Limpopo Province, South Africa. M.Sc. Dissertation, University of the Witwatersrand, Johannesburg, South Africa.
GIBSON DJD, PATERSON DG, NEWBy TS, LAKER MC and HOFF-MAN MT (2006) Chapter 4: Land. In: Lickindorf E and Clark R (eds.) South Africa Environment Outlook. A Report on the State of the Environment. Department of Environmental Affairs and Tour-ism, Pretoria, South Africa. 87-106.
GISCOE (2001) GISCOE Digital Terrain Models. GISCOE, South Africa.
HAARHOFF D, SMITH HJ, BEyTELL JF and SCHOEMAN JL (1994) The Testing of Techniques for the Determination of the Erosion Potential of Areas in South Africa. ISCW Report No. GW/A/94/6. ARC-Institute for Soil, Climate and Water, Pretoria, South Africa.
HOFFMAN MT and ASHWELL A (2001) Nature Divided. Land Degra dation in South Africa. University of Cape Town Press, Cape Town, South Africa.
HOFFMAN MT and TODD S (2000) A national review of land degra-dation in South Africa: The influence of biophysical and socio-eco-nomic factors. J. South. Afr. Stud. 26 (4) 743-758.
HUDSON CA (1987) A Regional Application of the SLEMSA in the Cathedral Peak Area of the Drakensberg. M.Sc. Dissertation, Uni-versity of Cape Town, Cape Town, South Africa.
JETTEN V, GOVERS G and HESSEL R (2003) Erosion models: quality of spatial patterns. Hydrol. Process. 17 887-900.
LAKER MC (2004) Advances in soil erosion, soil conservation, land suitability evaluation and land use planning research in South Africa. S. Afr. J. Plant & Soil 21 345-368.
LAND TyPE SURVEy STAFF (1972-2006) Land Types of South Africa: Digital Map (1:250 000 scale) and Soil Inventory Data-bases. ARC – Institute for Soil, Climate and Water, Pretoria, South Africa.
LE ROUx JJ, MORGENTHAL TL, MALHERBE J, SMITH HJ, WEEPENER HL and NEWBy TS (2006) Improving Spa-tial Soil Erosion Indicators in South Africa. ISCW Report No. GW/A/2006/51. ARC – Institute for Soil, Climate, and Water, Pre-toria, South Africa.
LOW AB and REBELO AG (1998) Vegetation of South Africa, Lesotho and Swaziland. Department of Environmental Affairs and Tourism, Pretoria, South Africa.
LU H, PROSSER IP, MORAN CJ, GALLANT JC, PRIESTLEy G and STEVENSON JG (2003) Predicting sheetwash and rill erosion over the Australian continent. Aust. J. Soil Res. 41 1037-1062.
MACVICAR CN, DE VILLIERS JM, LOxTON RF, LAMBRECHTS JJN, LE ROUx J, MERRyWEATHER FR, VAN ROOyEN TH, VON M HARMSE HJ and VERSTER E (1977) Soil Classification: A Binomial System for South Africa. Department of Agricultural Technical Services, Pretoria, South Africa.
McPHEE PJ and SMITHEN AA (1984) Application of the USLE in the Republic of South Africa. Agric. Eng. S. Afr. 18 5-13.
MERRITT WS, LETCHER RA and JAKEMAN AJ (2003) A review of erosion and sediment transport models. Environ. Modell.Software 18 761-799.
MOORE ID and BURCH GJ (1986) Physical basis of the length-slope factor in the Universal Soil Loss Equation (USLE). Soil Sci. Soc. Am. J. 50 1294-1298.
MOORE ID and WILSON JP (1992) Length-slope factors for the Revised Universal Soil Loss Equation (RUSLE) simplified method of estimation. J. Environ. Qual. 22 458-466.
MORGAN RPC (1995) Soil Erosion and Conservation (2nd edn.). Long-man Group Limited, London, UK.
MORGENTHAL TL, MALHERBE J, VAN ZyL D and NEWBy TS (2006) Evaluation of MODIS Satellite Data as an Assessment Tool to Audit the State of Agricultural Resources. ISCW Report No. GW/A/2006/72. ARC-Institute for Soil, Climate and Water, Preto-ria, South Africa.
NATIONAL LAND COVER (2000) Unpublished Beta Release Sup-plied by ARC and CSIR, Pretoria, South Africa.
NEARING MA (1997) A single continuous function for slope steepness influence on soil loss. Soil Sci. Soc. Am. J. 61 917-919.
NRI (2001) National Resources Inventory, 2001 Annual NRI, Soil Ero-sion. United States Department of Agriculture – National Resources Conservation Service, USA. http://www.nrcs.usda.gov.
OLDEMAN LR, HAKKELING RTA and SOMBROEK WG (1991) Glasod World Map of the Status of Human-Induced Soil Degrada-tion (2nd revised edn.) ISRIC, Wageningen, UNEP, Nairobi.
PRETORIUS DJ (1995) The Development of a Soil Degradation Man-agement Support System. Unpublished ISCW Report. ARC – Insti-tute for Soil, Climate and Water, Pretoria, South Africa.
PRETORIUS DJ (1998) The Development of Land Degradation Moni-toring and Auditing Techniques with the Aid of Remote Sensing and GIS Technology. ISCW Report No. GW/A/98/27. ARC – Institute for Soil, Climate and Water, Pretoria, South Africa.
PRETORIUS DJ and BEZUIDENHOUT CJ (1994) Report on the Devel-opment of a Methodology to Determine the Nature, Rate and Extent of Soil Erosion in South Africa. ISCW Report No. GW1A/94/7. ARC – Institute for Soil, Climate and Water, Pretoria, South Africa.
PRETORIUS DJ and SMITH HJ (1998) The development of a GIS based land information system for developing areas. Proc. of the 21st SSSSA Conf. 21-23 January, Drakensberg, South Africa.
PROSSER IP, RUTHERFORD ID, OLLEy JM, yOUNG WJ, WALL-BRINK PJ and MORAN CJ (2001) Large-scale patterns of erosion and sediment transport in river networks, with examples from Aus-tralia. Mar. Freshwater Res. 52 81-99.
RENARD KG, FOSTER GR, WEESIES GA, McCOOL DK and yODER DC (1994) RUSLE Users Guide. Predicting Soil Erosion by Water: A Guide to Conservation Planning with the Revised Uni-versal Soil Loss Equation. USDA, Agriculture Handbook No. 703, Washington DC, USA.
ROOSEBOOM A, VERSTER E, ZIETSMAN HL and LOTRIET HH (1992) The Development of the New Sediment yield Map of South Africa. WRC Report No. 297/2/92. Water Research Commission, Pretoria, South Africa.
SCHäUBLE H (2003) Hydrotools 1.0 for ArcView 3.x. Technical Uni-versity of Darmstadt, Darmstadt, Germany. http://arcscripts.esri.com.
SCHULZE RE (1979) Soil loss in the key area of the Drakensberg – A regional application of the Soil Loss Estimation Model for Southern Africa (SLEMSA). In: Hydrology and Water Resources of the Drakensberg. Natal and Regional Planning Commission, Pietermaritz-burg, South Africa. pp. 149-167.
SCOTT DF and SCHULZE R (1991) The hydrological effects of a wildfire in a eucalypt afforested catchment. S. Afr. Forestry J. 160 67-74.
SMITH HJ (1999) Application of empirical soil loss models in southern Africa: A review. S. Afr. J. Plant & Soil 16 (3) 158-163.
SMITH HJ, HAARHOF D and SCHOEMAN JL (1995) Die Kwantita-tiewe Beraming van Bronverlies Onder Verskillende Toestande in die Sekhukhune-Distrik in Lebowa. ISCW Report No. GW/W/96/17. ARC – Institute for Soil, Climate and Water, Pretoria, South Africa.

Available on website http://www.wrc.org.zaISSN 0378-4738 = Water SA Vol. 34 No. 3 July 2008
ISSN 1816-7950 = Water SA (on-line)
314
SMITH HJ, VAN ZyL AJ, CLAASENS AS, SCHOEMAN JL and LAKER MC (2000) Soil loss modelling in the Lesotho Highlands Water Project catchment areas. S. Afr. Geogr. J. 82 64-69.
SMITHEN AA (1981) Characteristics of Rainfall Erosivity in South Africa. M.Sc. Dissertation, University of Natal, Pietermaritzburg, South Africa.
SMITHEN AA and SCHULZE RE (1982) The spatial distribution in Southern Africa of rainfall erosivity for use in the universal soil loss equation. Water SA 8 (2) 74-78.
SNyMAN HA, VAN RENSBURG WLJ and OPPERMAN DPJ (1986) Toepassing van ‘n gronderosievergelyking op natuurlike veld van die Sentrale Oranje-Vrystaat. J. Grassl. Soc. South. Afr. 3 4-9.
SNyMAN HA (1999) Soil erosion and conservation. In: Tainton NM (ed.) Veld Management in South Africa. University of Natal Press, Scottsville, South Africa. 355-380.
SOIL SURVEy STAFF (1973-1987) Soil Profile Descriptions and Soil Analyses Data. In: ARC-ISCW Soil Profile Information System, Unpublished. ARC – Institute for Soil, Climate and Water, Pretoria, South Africa.
STRöHMENGER PHE, VAN DER MERWE JPA, SMITH HJ, VAN DEN BERG HM, VAN DEN BERG EC, DEKKER C, MALHERBE J, DE NySSCHEN G, VAN DER WALT M, HAASBROEK P, MORGENTHAL TL, KELLNER K and VAN RENSBURG L (2004) Auditing the Conservation Status of the Natural Resources
in the OR Tambo and Umkhanyakude ISRDS Nodes. ISCW Report No. GW/A/2003/47/2. ARC-Institute for Soil, Climate and Water, Pretoria, South Africa.
VRIELING A (2006) Satellite remote sensing for water erosion assess-ment: A review. Catena 65 2-18.
WESSELS KJ, VAN DEN BERG HM, VAN DER MERWE JPA, SMITH HJ, VAN ZyL AJ and TWyMAN L (2001a) Mapping and Monitoring the Conservation Status of the Natural Resources of Mpumalanga Province by Means of Remote Sensing and GIS Tech-nology. ISCW Report No. GW/A/2001/9, ARC – Institute for Soil, Climate and Water, Pretoria, South Africa.
WESSELS KJ, VAN DER MERWE JPA, SMITH HJ, STRöHMENGER PHE, VAN ZyL AJ and TWyMAN L (2001b) Gauteng Natural Resources Audit. ISCW Report No. GW/A/2001/41, ARC – Institute for Soil, Climate and Water, Pretoria, South Africa.
WISCHMEIER WH and SMITH DD (1978) Predicting Rainfall Ero-sion Losses, a Guide to Conservation Planning. U.S. Department of Agriculture, Agricultural Handbook No. 537, Washington DC, USA.
YU B and ROSEWELL CJ (1996a) An assessment of a daily rainfall erosivity model for New South Wales. Aust. J. Soil Res. 34 139-152.
YU B and ROSEWELL CJ (1996b) Rainfall erosivity estimations using daily rainfall amounts for South Australia. Aust. J. Soil Res. 34 721-733.