water-energy-climate nexus : an assessment of long term ...background asia is the driest continent...
TRANSCRIPT

Anindya Bhattacharya
18th AIM International Workshop
NIES, Dec 15, 2012
Water-Energy-Climate Nexus : An Assessment of Long Term Energy Scenario
in South & South-East Asia

Background
Asia is the driest continent in the world : availability of freshwater is less than half of the global annual average of 6,380 cubic meters per inhabitant.
Asia has less than one-tenth of the waters of South America, Australia and New Zealand, less than one-fourth of North America, almost one-third of Europe, and moderately less than Africa per inhabitant.
By 2030 the word will face nearly 40% of supply shortage of water to meet the demand (WRG, 2010)
In India total water demand will increase by 100% (750 BCM) and in China it will be around 200 BCM by 2030.
80% of the glaciers in western China are in retreat (Piao et.al.) and 5 to 27% of China’s glacial area is suspected to disappear by 2050 (IESSD & CASS,2010).
12/15/20122

Climate Impact on future water availability and demand –Uncertain
Different climate models project different worldwide changes in net irrigation requirements, with estimated increases ranging from 1–3% by the 2020s and 2–7% by the 2070s.
If we use per capita water availability indicator, climate change would appear to reduce overall water stress at the global level. This is because increases in runoff are concentrated heavily in the most populous parts of the world, mainly in eastern and south-eastern Asia.
Unless extra water flow is stored in a systematic manner, additional flow of water will have very less use for human being. It may not alleviate dry-season problems if the extra water is not stored; and would not ease water stress in other regions of the world.
12/15/20123

Water Stress Indicators: Withdrawal to Availability Ratio ( Criticality Ratio)
No stress Low stress Mid stress CR 0 0.1 0.2 0.4 0.8
25% of the earth’s surface is under severe water stress. Approximately 2.1 billionpeople live in the water stressed riven basins and 50% of them live in South Asia and China.
12/15/20124
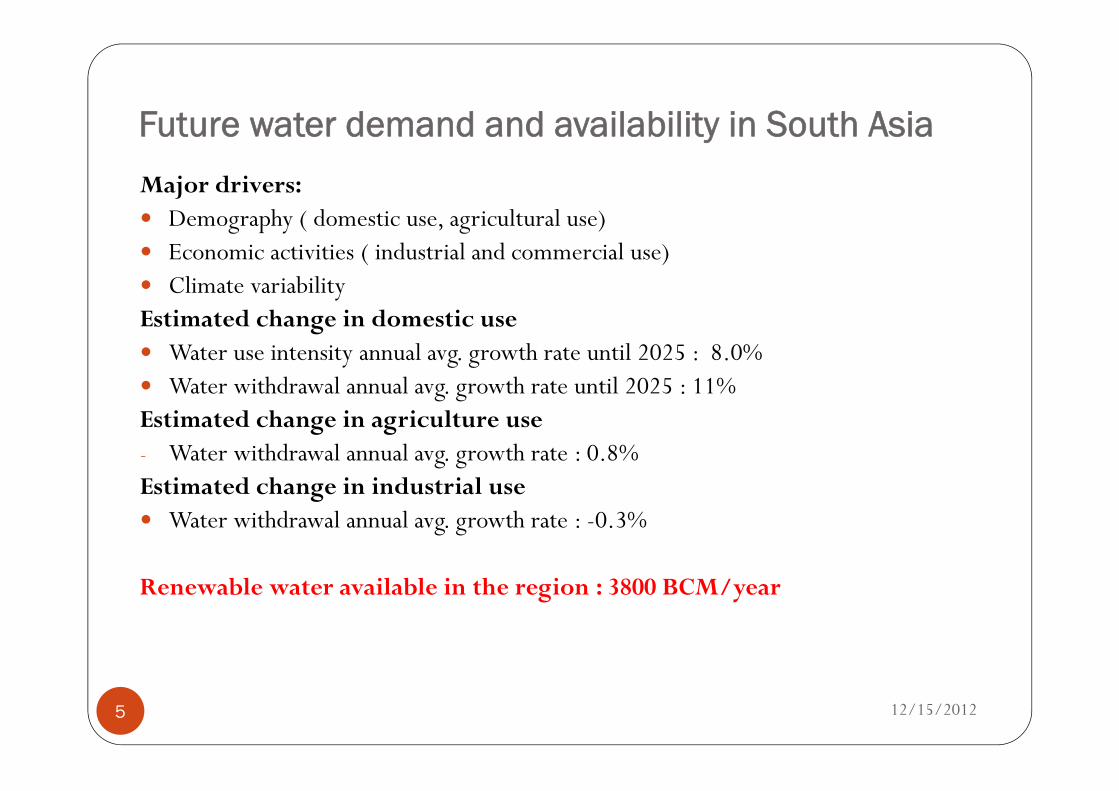
Future water demand and availability in South Asia
Major drivers: Demography ( domestic use, agricultural use) Economic activities ( industrial and commercial use) Climate variability Estimated change in domestic use Water use intensity annual avg. growth rate until 2025 : 8.0% Water withdrawal annual avg. growth rate until 2025 : 11%Estimated change in agriculture use - Water withdrawal annual avg. growth rate : 0.8%Estimated change in industrial use Water withdrawal annual avg. growth rate : -0.3%
Renewable water available in the region : 3800 BCM/year
12/15/20125

Water stress level in South Asia
Shows the impact of expected population growth on water usage by 2025South Asia region withdraws more than 40% of total available water. IGES estimates the ratio for India is around 68% by 2025.
12/15/20126

Rationale of such study
Increasing water foot-print of energy sector in Asia
Increasing threat of water shortages for energy production in future
Availability of water efficient energy generation technologies brings the option of alternative planning.
Uncertain climate impact on long term water availability.
12/15/20127

Reality picture ( water-energy user’s conflicts)
1. Opposition to Adani power projects is growing in Nagpur since localcommunity believes that this power plant will create threats not only forPench Tiger Reserves but also for drinking water and irrigation wateravailability.
2. In Kerela, power cuts ordered to deal with water scarcity in 2008 whenmonsoon rainfall was 65% less than normal
3. In Madhay Pradesh, power cuts made to alleviate the water shortage in theregion in 2006
4. In Orissa State, farmers protest the increasing rate of water allocation forthermal power and industrial use. In response to the farmer’s opposition, thestate government decided to give conditional permission to construct thermalpower plant that asking to use seawater for cooling purposes rather than riverwater to avoid placing further pressure on the Mahanadi river basin.
12/15/20128

Objectives
First, to estimate the water demand of the South Asia region for its energy supply including fossil fuel extraction, refining and use in electricity generation
and
Second, to investigate the long term energy scenario of the region under certain water availability constraint due to climate and cross sectoral water demand variation.
12/15/20129

Methodology used
Step-I
• Identification of energy technologies using water for activities • Estimating the water use coefficients for all selected technologies ( MCM/GJ or
MCM/Gwh)
Step-II• Developing the water module of the MESSAGE Model • Running a scenario to estimate the total water demand for the energy sector.
Step-III
• Estimating long term water availability for energy sector using proportional sharing of water among different sectors and econometric analysis
• Estimating impact on water availability due to climate change using RGCM and Regional Hydrological Model.
Step-IV• Identifying the water constraint mitigating technologies for energy sector.• Running the water constrained scenario • Analysis
12/15/201210

Step-I :Identification of energy technologies using water for activities and estimating the water use coefficients for all selected technologies( MCM/GJ or MCM/Gwh)
12/15/201211

Selection of energy technologies using water
Using literature review and experts’ interview we selected 75 different energy technologies that are using water for their activities.
Energy resource extraction classified in to three categories : Biomass (only plant based) , Coal, Oil and Natural Gas. Oil and NG further divided into categories of conventional and non-conventional as the future of oil and gas depends on nonconventional sources like tar oil, oil sands etc.
Clean coal technology, hydrogen and methanol production also added in the list.
All power generating thermal technologies are selected –coal, gas, oil, nuclear
Hydro ( large/medium and small) –run off the river not added.
Solar thermal and geothermal are selected under renewable energy category.
12/15/201212

Major challenges in water coefficient estimates:Wide variation in data
Technology Type of cooling IIASA Data
IGES Data Other source
m3/Gwh m3/Gwh m3/Gwh Coal
Steam turbine once-through 1135-1250 2495-4285
Avg.: 3390
Natural Gas Steam turbine
once-through 1135-1250 3790-7490Avg: 5640
Oil Steam turbine
once-through 1135-1250 3790-7490Avg: 5640
Hydro 17,000-26,000 340,000
There is no such structured information available on water requirement for energy production and generation. Wide variation is information and data. Coefficient varies from country to country and in fact within a same country.
IGES data mainly derived from power plant survey in India and Thailand
12/15/201213

Step-II :Developing the water module of the MESSAGE Model and running a scenario to estimate the total water demand for the energy sector.
12/15/201214

Model used
The Model of Energy Supply Systems Alternatives and their General EnvironmentalImpacts (MESSAGE), a systems engineering optimization model is used. MESSAGEmodel developed by the International Institute for Advanced Systems Analysis (IIASA)inVienna. IGES contributed to develop the water module.
This model finds the optimal flow of energy from primary energy resources to usefulenergy demands from the mathematical and engineering feasibility perspective andsimultaneously leads towards the least cost investment option to meet the given energydemand in the system.
MESSAGE is a 11 region model in general covering the major regions of the world.Asia is divided into three sub regions in the model.
12/15/201215

Schematic diagram of the MESSAGE Model
Water Module
• Sectoral water demand forecasting using econometrics and statistical method.
• National/regional long term water availability under climate influence using climate model and hydrological model.
• Water coefficients of energy technologies
12/15/201216

Estimated water demand for energy sector in South Asia(South Asia: India, Bangladesh, Nepal, Bhutan, Pakistan and Afghanistan)
0
20000
40000
60000
80000
100000
120000
140000
2010 2020 2030 2040 2050 2060 2070 2080 2090 2100
Estimated water demand for energy supply ( Million M3)
Oil extraction
Gas extraction
Coal extraction
Electricity generation
12/15/201217

Step-III :Estimating long term water availability for energy sector and estimating impact on water availability due to climate change using RGCM and Regional Hydrological Model.
12/15/201218
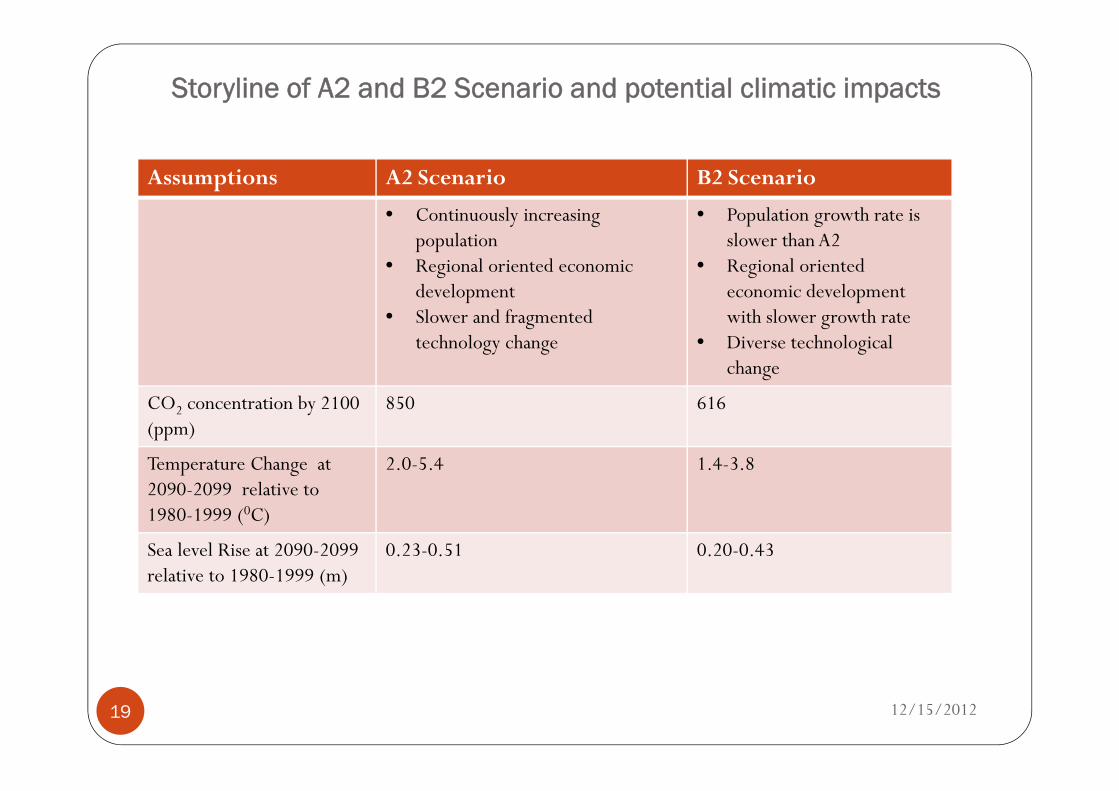
Storyline of A2 and B2 Scenario and potential climatic impacts
12/15/201219
Assumptions A2 Scenario B2 Scenario
• Continuously increasing population
• Regional oriented economic development
• Slower and fragmented technology change
• Population growth rate is slower than A2
• Regional oriented economic development with slower growth rate
• Diverse technological change
CO2 concentration by 2100 (ppm)
850 616
Temperature Change at 2090-2099 relative to 1980-1999 (0C)
2.0-5.4 1.4-3.8
Sea level Rise at 2090-2099 relative to 1980-1999 (m)
0.23-0.51 0.20-0.43

Water Availability Forecasting Modeling
HEC-HMSPredicted Future Rainfall (GCM)
Predicted Future Water Availability
20
HEC-HMS: The Hydrologic Modeling System (HEC-HMS) is designed to simulate the precipitation-runoff processes of dendritic watershed systems
Precipitation forecasting River basin run-off forecasting
Available water volume forecasting

Water availability in Ping and Wang River under A2 and B2 climate change scenarios
21

Water availability in Thailand under A2 and B2 climate change scenarios
22
0
50
100
150
200
250
300
0
50
100
150
200
250
300
2010 2020 2040 2060 2080 2100
Tota
l run
off
(BCM
)
Wat
er D
eman
d (B
CM)
Agriculture Domestic & Tourism Industry A2 scenario B2 scenario
A2: Suspected to be water stressed (CR>40%)
B2: Suspected to be water stressed (CR>40%)

Projection of long-term total water availability and demand in India (in BCM)
23
No water left to meet additional demand beyond 2055

Projection of long-term surface water demand in India (in BCM)
24
No surface water left to meet additional demand beyond 2040
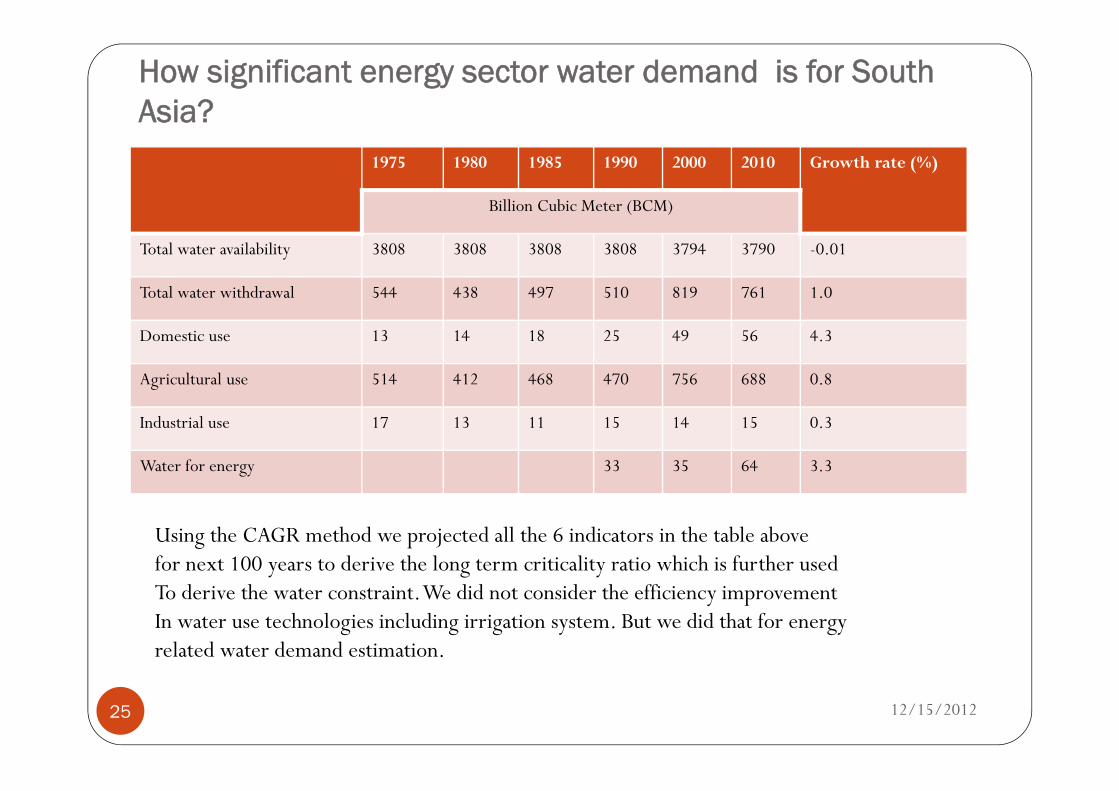
How significant energy sector water demand is for South Asia?
Using the CAGR method we projected all the 6 indicators in the table above for next 100 years to derive the long term criticality ratio which is further usedTo derive the water constraint. We did not consider the efficiency improvementIn water use technologies including irrigation system. But we did that for energy related water demand estimation.
12/15/201225
1975 1980 1985 1990 2000 2010 Growth rate (%)
Billion Cubic Meter (BCM)
Total water availability 3808 3808 3808 3808 3794 3790 -0.01
Total water withdrawal 544 438 497 510 819 761 1.0
Domestic use 13 14 18 25 49 56 4.3
Agricultural use 514 412 468 470 756 688 0.8
Industrial use 17 13 11 15 14 15 0.3
Water for energy 33 35 64 3.3

Deriving the water constraint for energy sector in the South Asia region
India projected energy sector water demand by 2050 is around 70BCM ( NCIWRD, 1999) starting from 20 BCM in 2010.
Following CR projection total water availability in the South Asia region exclusively for energy sector fixed to 90BCM / year until 2100.
Water availability variation due to climate effect is under investigation in AIT ( Some results obtained )
12/15/201226

Step-IV-A: Identifying the water constraint mitigating technologies for energy sector.
12/15/201227

Selection of water use mitigating technologies
We added mainly two different categories of technology: Dry Cooling and Sea Water Cooling for electricity generation.
Dry cooling is done with compressed air only and no water is required. This technology is commercially available.
Dry cooling system in the power plant increases the investment cost by around 10% compared to wet cooling system.
Dry cooling also decreases the thermal efficiency of the plant by around 2.5%.
Power plant also faces higher auxiliary consumption ( approx. 10%).
Sea water cooling has no impact on thermal efficiency.
Power plant with sea water cooling has higher O&M cost ( 5% more compared to fresh water cooling).
Need fresh water as make-up for boiler operation.
12/15/201228

Step-IV-B: Running the water constrained scenario and analyse the results .
12/15/201229
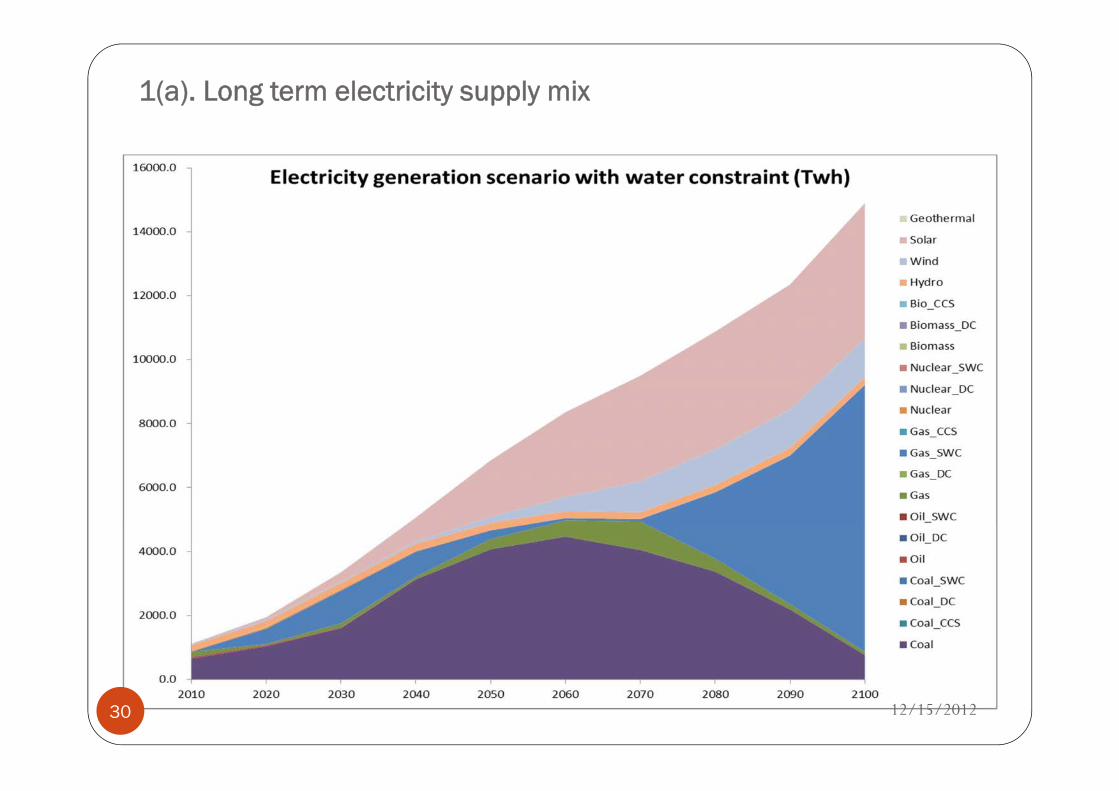
1(a). Long term electricity supply mix
12/15/201230

1 (b). Long term electricity supply mix
Total electricity generation unchanged. Water elasticity of power generation technology is found to be very high (> 2).
Due to water scarcity main technological substitution happen in gas based power generation with sea water cooling.
Renewable energy technologies (with no water requirement ) are also getting predominant. Solar PV increase at a much faster rate than solar thermal and CSP.
Gas and RE are the technology game changer in the region in the long term energy scenario with water scarcity situation.
12/15/201231

2. Long term energy price effect
Natural gas price is expected to increase significantly in the long run up to 20% due to water shortage.
Coal price is expected to decrease as its demand reduces due to water shortage but not very high decrease is expected as coal demand continues in other sectors.
Oil price remains almost unaffected.
Electricity price overall increases.
12/15/201232

3. Long term energy sector investment scenario
WWC WC WWC WC WWC WC WWC WC WWC WC WWC WC
Coal_extr 3.8 3.5 6.0 5.9 7.4 8.9 9.0 9.3 9.2 9.3 7.1 7.3Gas_extr 9.5 5.7 13.1 13.4 8.3 11.2 9.1 12.3 7.3 7.5 7.4 6.0Oil_extr 2.7 1.9 4.3 3.5 6.2 2.2 6.0 2.4 6.0 0.9 3.3 0.5Fossil Power 13.8 12.6 27.0 21.4 42.4 42.8 35.6 40.4 28.2 28.8 46.1 21.7Coal Power 10.8 9.1 22.2 14.9 37.4 38.1 26.5 32.0 11.3 17.1 25.8 0.0Gas Power 2.9 3.5 4.7 6.4 5.0 4.7 9.1 8.4 16.9 11.7 20.2 21.7Hydro_elec 1.4 1.2 1.9 1.9 2.6 2.6 3.0 3.0 2.2 2.2 6.9 3.3Elec T&D 22.1 23.0 39.6 41.4 58.5 57.9 73.5 72.3 96.2 94.4 156.2 148.9Solar 2.8 2.8 6.9 6.9 17.0 16.5 41.6 40.6 78.9 55.5 89.1 67.2Wind 0.0 0.0 0.6 0.0 1.9 1.3 1.0 2.7 15.0 5.7 6.9 12.8
Billion USD2020 2030 2040 2050 2080 2100
• All water intensive technology investment gets reduced. Nonconventional oil and gas production gets affected and subsequent investments.
• Solar thermal and CSP related investment slows down while wind investment goes up at least until 2050.
• Electricity T&D investment for new transmission and distribution system reduces.
• Infrastructure investment for cross border energy project development also reduces as hydro power generation reduces due to water scarcity. 12/15/201233
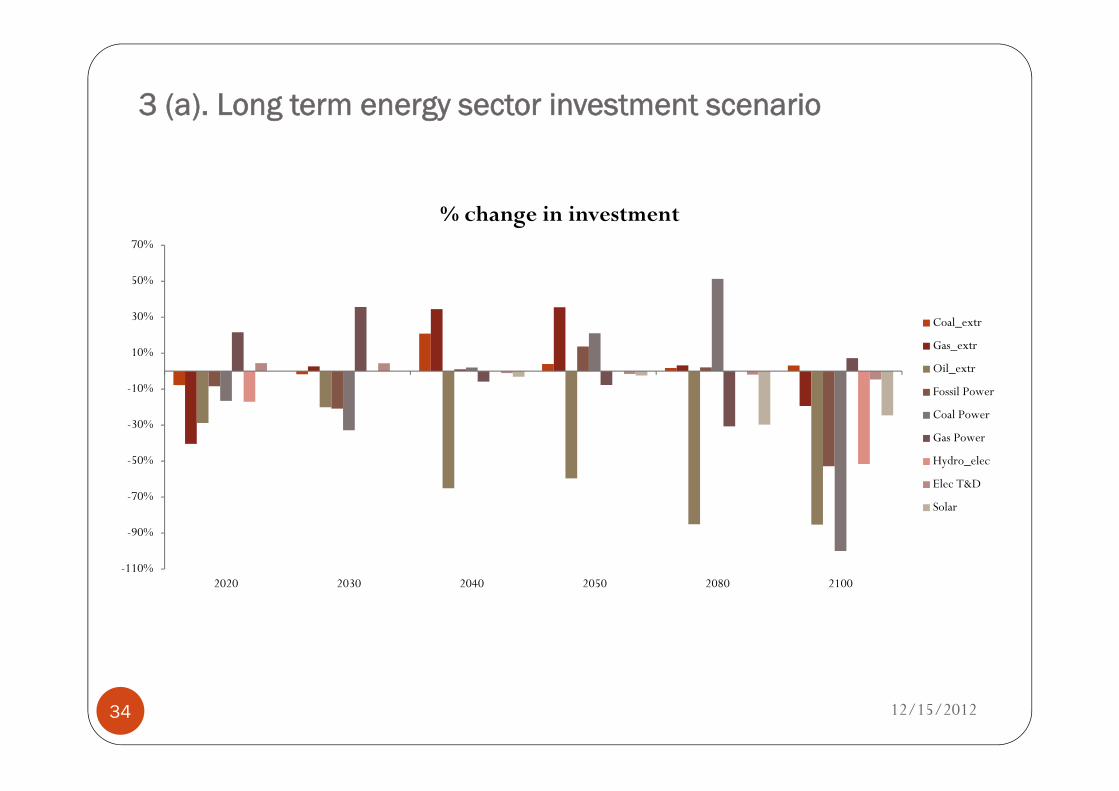
3 (a). Long term energy sector investment scenario
-110%
-90%
-70%
-50%
-30%
-10%
10%
30%
50%
70%
2020 2030 2040 2050 2080 2100
% change in investment
Coal_extr
Gas_extr
Oil_extr
Fossil Power
Coal Power
Gas Power
Hydro_elec
Elec T&D
Solar
12/15/201234

4. Long term energy trade scenario
-60%
-50%
-40%
-30%
-20%
-10%
0%
10%
20%
2020 2030 2040 2050 2070 2090 2100
% change in long term energy trade
Coal Oil Gas Elec Water availability reduction
12/15/201235

4(a). Long term energy trade scenario
Regional coal trade negatively affected as the use of coal gets reduced due to shift in electricity supply mix.
Oil trade continues to grow as its other than electricity use ( transport) remains unaltered.
Gas trade almost remains same except the last period of the simulation when the water availability reduces by more than 30%.
Electricity trade also affects adversely due to water scarcity as in this region almost 100% traded electricity is hydro.
12/15/201236

5. Long term energy resource extraction impact
Water scarcity adversely affects the non conventional fossil fuel extractions. All these technologies are highly water intensive ( tar oil, oil sand etc.)
Until 2050 non conventional fossil fuel extraction continues to grow but after that again conventional fuel extraction started picking up. Cost also increases subsequently.
Water availability thus has long term impact on investments and technological development of non conventional fossil fuels. Currently, all major energy companies across the world is heavily investing in R&D for promoting non conventional fossil fuel technologies.
12/15/201237

7. Other environmental impacts
It is observed that CO2 emissions from the electricity sector reduces significantly due to fuel shift caused by water scarcity.
SO2 and NOx emissions reduces under the water constrained scenario mainly due to fuel shift in power generation.
Back carbon and other air pollutants increases in the atmosphere.
P2.5 also increases significantly under water stressed scenario.
12/15/201238

8. Summary of findings In the long term energy planning , water needs to be considered at the
basic planning level. Water scarcity can jeopardize the energy sector investment return. Seasonal and geographical variation changes water availability in the long
run and it complicates the matter further. However, it is important to consider such variation.
Acute inter sectoral water demand conflict is envisaged. This conflict can further slow down the economic growth.
Systematic R&D funding for advanced water efficient energy supply technology is essential.
Water efficient energy technology development can be considered as climate adaptation mechanism.
12/15/201239

Thank you for your attention!
For further contact:Anindya Bhattacharya
Senior Energy Economist Institute for Global Environmental Strategies,
2108-11 KamiyamaguchiHayama, JAPAN 240-0115
E-mail: [email protected]
12/15/201240