water demand management report - new … introduction through a complex ... e v s i n k r i v e r h...
TRANSCRIPT

INTRODUCTION 1
Bill de BlasioMayorEmily LloydCommissioner
WATER DEMAND MANAGEMENT REPORTJune 2016 Update


Non-Residential Water Efficiency Program
STRATEGY 5Water Supply Shortage Management
STRATEGY 4Water Distribution System Optimization
14
16
18
STRATEGY 1
STRATEGY 2Residential Water Efficiency Program
Municipal Water Efficiency Program
TABLE OF CONTENTS
6
12
INTRODUCTION 4
STRATEGY 3
STRATEGY 6Wholesale Customers Demand Management
20
22WATER DEMAND TRACKING
4 INTRODUCTION
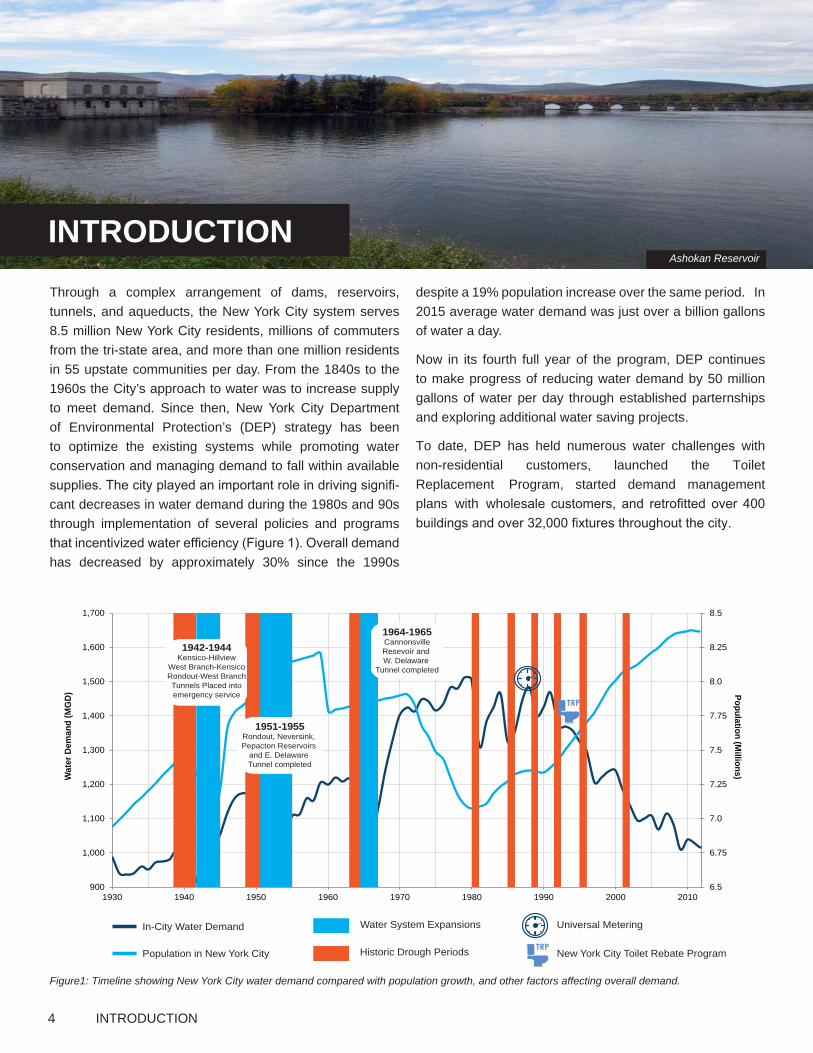
Through a complex arrangement of dams, reservoirs, tunnels, and aqueducts, the New York City system serves 8.5 million New York City residents, millions of commuters from the tri-state area, and more than one million residents in 55 upstate communities per day. From the 1840s to the 1960s the City’s approach to water was to increase supply to meet demand. Since then, New York City Department of Environmental Protection’s (DEP) strategy has been to optimize the existing systems while promoting water conservation and managing demand to fall within available supplies. The city played an important role in driving signifi-cant decreases in water demand during the 1980s and 90s through implementation of several policies and programs that incentivized water efficiency (Figure 1). Overall demand has decreased by approximately 30% since the 1990s
despite a 19% population increase over the same period. In 2015 average water demand was just over a billion gallons of water a day.
Now in its fourth full year of the program, DEP continues to make progress of reducing water demand by 50 million gallons of water per day through established parternships and exploring additional water saving projects.
To date, DEP has held numerous water challenges with non-residential customers, launched the Toilet Replacement Program, started demand management plans with wholesale customers, and retrofitted over 400 buildings and over 32,000 fixtures throughout the city.
6.5
6.75
7.0
7.25
7.5
7.75
8.0
8.25
8.5
900
1,000
1,100
1,200
1,300
1,400
1,500
1,600
1,700
1930 1940 1950 1960 1970 1980 1990 2000 2010
Population (Millions)W
ater
Dem
and
(MG
D)
1942-1944Kensico-Hillview
West Branch-KensicoRondout-West BranchTunnels Placed intoemergency service
1951-1955Rondout, Neversink, Pepacton Reservoirs
and E. Delaware Tunnel completed
1964-1965CannonsvilleResevoir and W. Delaware
Tunnel completed
In-City Water Demand
Population in New York City
Water System Expansions
Historic Drough Periods
Universal Metering
New York City Toilet Rebate Program
Figure1: Timeline showing New York City water demand compared with population growth, and other factors affecting overall demand.
Ashokan Reservoir
INTRODUCTION

INTRODUCTION 5
50 Mile
s
75 Mile
s
100 Mile
s
125 Miles
West BranchReservoir
New CrotonReservoir
Kensico Reservoir
NeversinkReservoir
PepactonReservoir
AshokanReservoir
SchoharieReservoir
RondoutReservoir
CannonsvilleReservoir
East BranchReservoir
Bog BrookReservoir
Boyds CornerReservoir
LakeGleneida
MuscootReservoir
MiddleBranchReservoir
TiticusReservoir
DivertingReservoirCroton Falls
ReservoirAmawalk
Reservoir
Cross RiverReservoir
Kirk Lake
LakeGilead
HillviewReservoir
Jerome ParkReservoir
NeversinkTunnel1954
Water Tunnel No.1 1917
Richmond Tunnel 1970
Water Tunnel No.3 1996
Delaware Aqueduct 1940s
Catskill Aqueduct 1917
West Delaware Tunnel 1964
East Delaware Tunnel 1955
Shandaken Tunnel 1927
CrotonAqueduct
1893
CatskillAqueduct
Delaware Aqueduct
Silver Lake Park(underground storage tanks)
Esopus Creek
New York Bay
Long Island Sound
Atlantic Ocean
Delaware River Nev
ersi
nk R
iver
Hudson River
Brooklyn
Staten Island
Bronx
ManhattanQueens
QueensGroundwaterService Area
Croton Filtration Plant
Cat/Del U/V Disinfection Facility
East Branch Deleware
West Branch Deleware
Catskill/DelewareWatersheds
CrotonWatershed
25 M
iles (
from
City H
all)
New Jersey
New York
Rockland County
Westchester County
Connecticut
Orange County
PutnamCounty
UlsterCounty
DutchessCounty
SullivanCounty
Pennsylvania
ColumbiaCounty
GreeneCounty
Albany County
RensselaerCounty
SchoharieCounty
OtsegoCounty
ChenangoCounty
DelawareCounty
Water Tunnel No.2 1936

6 MUNICIPAL WATER EFFICIENCY PROGRAM
Now in its fourth full year, the Municipal Water Efficiency Program has lead the way in achieving water savings, upgrading city infrastructure and improving services throughout the five boroughs. Many of the individual projects and original goals of the Water Demand Management Plan are now close to completion.
In particular, DEP has made significant progress in advanc-ing water efficiency projects in the properties of municipal entities such as the Department of Parks and Recreation (DPR), Department of Education (DOE), the Fire Department of New York (FDNY), the New York City Housing Authority (NYCHA), the City University of New York (CUNY), as well as the 14 Wastewater Treatment Plants within our own agency. As the program continues, we are looking to expand the groups we are working with to include Health and Hospitals Corporations (HHC), Department of Cultural Affairs (DCLA), and Department of Health and Mental Hygiene (DOHMH).
Through these partnerships, DEP has been actively imple-menting water efficiency measures in government-owned facilities citywide, including the replacement of older, ineffi-cient toilets and urinals and retrofits for spray showers in the
city’s parks and playgrounds. As the program has evolved, DEP has begun to investigate other opportunities for water savings, including onsite reuse.
DEP will continue to advance wide-ranging efforts that incorporates water efficiency retrofits, education, curriculum development, metering, and water benchmarking to ensure permanent water savings within municipal savings
In December 2015 DEP completed it’s second Commissioner’s Water Challenge with three participating plants, Bowery Bay, Hunts Point and Port Richmond. Two of these plants Bowery Bay and Hunts Point, have both been able to achieve greater than 10% savings year over year, and took steps to make sure these savings are permanent. The two plants combined were able to save 300,000 gpd. In 2016 DEP launched the third water challenge, with Tallman Island, Rockaway and Red Hook Waste Water Treatment Plant participating. It is estimated that these plants could
I.S. 27 School in Staten Island
MUNICIPAL WATER EFFICIENCY PROGRAMSTRATEGY 1
Initiative 1: Save Water in Wastewater Treatment Facilities

STRATEGY ONE 7
save 40,000 gpd if all achieve 10% savings.
Meter data for all plants are tracked consistently to observe long term trends, and ensure that plants continue to save water even after participating in the challenge.
Last year we saw the successful implementation of Spray Nozzles that are described in the case study on this page. Due to the success of this purchase we are double the number at each plant, completing a second purchase of the nozzles to be used by staff. In addition to this plant-wide investment, DEP has also purchased new seal pumps and repair kits for old seal pump systems that were losing water.
Standard Operating Procedure on City and Effl uent Water Use
1. Meters - City Water• Record water consumption on a weekly basis and compare to Automated Meter
Readings by logging onto “My DEP Account”. If there are discrepancies or if the meter(s) appear to be malfunctioning, contact John Sexton, Chief, Energy Analysis & Planning Section.
2. Leaks – City Water• Immediately isolate and repair in-house or submit Work Request to Engineering.
3. Effl uent Water Strainer System• Clean strainer basket once per day.• If system is malfunctioning, repair leaks in-house or submit Work Request to
engineering.• Develop maintenance plans and schedules for effl uent water pumps. Maintain
the effl uent water pumps in accordance with the developed plans and schedules and keep an inventory of spares.
4. Pump Packing – Use of Mechanical Seals• Mechanical seals are only to be used on MSPs and effl uent water pumps. They
are only to be used in these type pumps if the application meets all applicable manufacturer’s criteria. This applies to new pump purchases and when transitioning from traditional packing to mechanical seals.
5. Use of Effl uent Water* instead of City Water• Use effl uent water instead of city water in the applications listed below.• If an application could be sensitive to the use of effl uent water instead of city
water, contact the Energy Analysis & Planning Section for further evaluation.
* For cleaning/washing, utilize effl uent water only if there will be no human contact with the surfaces after they have been cleaned with effl uent water.
6. Use of City Water• Do not use city water to freshen up tanks.• When using any type of hose for washing down areas where city water must be
used, a low fl ow nozzle should be utilized.
MSPs Ring Flush WaterAeration TanksThickenersFinal TanksChlorlorine Contact TanksBlowersEnginesHeat ExchangersCentrifugesAC ChillersAC Condensers
Foam Control
Cooling Water
HypochloritePolymer
Cleaning/Washing TanksGrit WashingGrit SuspensionAgitation WaterBalance Water (Thickeners)Flushing (Centrifuges)Blockage Removal in Pipes
Miscellaneous
Dilution/Mixing
Commissioner’s Water Challenge
During the development of the Water Demand Management Plan, DEP worked to identify large capital projects that would spur water savings at waste water treatment plants. As part of the second Commissioners Water Challenge, more effort was made to work with operations staff to indentify opportunities for water efficiencies that are not neccessarily treatment plant specific.
Through this process, DEP found that the majority of its water nozzles for hosing down equipment and storage tanks were using excessive water. Current hoses use 110 gpm while the new nozzles use 55 gpm. After staff completed their tasks, staff would have to manually shut down the water through seperate controls to get the water hose to stop running. DEP purchased the Select-O-Matic water nozzle with hand controls, allowing staff to perform their tasks with sufficient pressure while also allowing them to have greater control of water flow and cutting down potential waste.
An additional benefit of the new nozzles is that they allow only one staff worker to perform the task, wheras before it required at least two people. This has led to increase efficiency of man-hours at plant, freeing up staff to work on other important tasks.
Figure 2: Standard Operating Procedures for Wastewater Treatment Plants
Figure 3: Select-O-Matic Nozzles
Case Study: Spray Nozzles

8 MUNICIPAL WATER EFFICIENCY PROGRAM
In the Fiscal Year of 2016, DEP completed the retrofit of 100 schools. DEP has now completed retrofits of 230 schools, which puts us 25 over our anticipated amount at this time. Of the 100 schools, over 6,200 toilets and 2,100 urinals have been replaced. DEP has finalized its list of 100 schools slated for retrofit in fiscal year 2017 and has completed fixture surveys to begin work in the summer of 2016. This work will replace 5,600 toilets and 1,700 urinals.
DEP is continuing to install meters and Automated Meter Reading (AMR) devices in every retrofitted school where possible. By installing meters and AMR devices DEP can track the water usage of the schools going forward, and will also allow DEP to implement leak detection. A number of pilot schools that were metered prior to their fixture retrofit showed a water use reduction of as much as 60%. DEP is continuing to track this data and is working on sharing this with educators, sustainability coordinators and custodians.
DEP furthered its partnership with DOE by co-signing a grant proposal with them for money from the National Wildlife Federation Eco Schools Program. This places sustainabil-ity coordinators at the schools who will help the students understand how to reduce energy and water consumption. As part of the grant DOE will add four schools in Greenpoint, Brooklyn to be part of the retrofit program, meter them, and
Figure 4: New York City Schools Retrofitted to date
Initiative 2: Save Water in Schools
help ensure that all four schools see a 5% reduction in water use over the period of the grant.
DEP began recycling all of the porcelain from the replaced fixtures in July of 2015. In the fiscal year of 2016 over 8,000 fixutres will be recycled and beneficially reused in both an oyster reef restoration project in Jamaica Bay as well as substrate fill for green infrastructure rain gardens being constructed in Brooklyn and Queens. DEP will be documenting these reuses and will include these examples as more in depth case studies in a future demand management reports.
Figure 5: Retrofitted urinals at P.S. 1 in Staten Island
Figure 6: Crushed Porcelain

STRATEGY ONE 9
DEP held its 30th Annual Water Resources Art and Poetry Contest from January through May 2016. This year, 1,800 students (grades 2-12) from New York City and Watershed communities created more than 1,600 original pieces of art-work and poetry. This year’s competition marked an all-time record for student participation. Submitted entries reflected an appreciation for New York’s shared water resources and the importance of water conservation. In addition, through the art and poetry submitted, students expressed an under-standing of New York City’s water supply and wastewater treatment systems.
Students from 100 public, private, independent, homes-chool, and parochial schools participated in this year’s con-test. All participants were honored as DEP Water Ambassa-dors and received a certificate recognizing their artistic and poetic contribution. In addition, from the more than 1,600 submissions, a group of judges selected 66 students as this year’s DEP Water Champions. This year’s competition marked an all-time record for student participation. Submit-ted entries reflected an appreciation for New York’s water resources, wastewater treatment systems, and the impor-
Figure 8: Art Submittal from Luyi from Brooklyn Technical High School
The Wonderful Ways of Water
Down the mountains and into the rivers,
Underneath the ice when the weather makes you shiver.
We need water to survive,
To live all powerful and thrive.
Figure 7: Art submittal by Kandra from Brooklyn Technical High School
tance of water conservation. In addition, through the art and poetry submitted, students expressed themselves creatively about healthy marine ecosystems and their role in protecting and enhancing harbor water quality.
On May 19, Water Ambassadors and Water Champions were honored at DEP’s 30th Annual Water Resources Art and Po-etry Celebration. Held at Manhattan Community College’s Tribeca Performing Arts Center, the celebration ceremony was hosted by DEP Deputy Commissioner Eric Landau, and included remarks from Patrick Dougher, Program Director at Groundswell. This year’s celebration also included a special performance by Tem Blessed, multi-talented musician, artist and poet.
Figure 9: Water Champions honored on stage at BMCC Tribeca Perform-ing Arts Center
Case Study: 30th Annual Art and Poetry Contest
Poem by Ashley from Irwin Altman M.S. 172 Queens

10 MUNICIPAL WATER EFFICIENCY PROGRAM
DEP continues to see progress with on work with the (DPR) to reduce water consumption in city parks, specifically in spray showers and recreational centers. The goal under the Water Demand Management Plan is to reduce consumption by 1.1 MGD over five years of implementation by retrofitting 400 existing spray showers with automated spray showers. The automated sprayshowers are operated by park users, to make sure that the water is only on as people are using it rather than running all day.
The summer of 2015 saw the largest number of completions of sprayshower sites, with 190 sites completed between June and November. These sites represented goals set in 2 different calender goals, and bring us to 340 completed sites. The remaining 60 sites will be retrofitted in the sum-mer of 2016. DPR included ongoing inspections of sprayshower sites in to their regular operations and are prepared to keep maintenance up on these properties.
DEP is searching for additional reduction in consumption of .026 MGD working with the DPR to retrofit DPR owned rec-reation centers. DPR completed the retrofit of 5 recreation centers in the summer of 2015. Part of this retrofit was the installation of waterless urinals, the first time parks has in-stalled such devices on their property.
Initiative 3: Save Water in Parks
Figure 11: Retrofitted Grove Hill Playground Sprayshower
DEP has partnered with the Parks Department on a new program called the Community Park Iniatiative, a program to rehabilitate 35 parks in underserved neighborhoods throughout the 5 boroughs. In addition to designing and installing greenwater infrastructure for stormwater management, DEP has also gotten commitments from Parks to install efficienct fixtures and automatic sprayshowers in any rehabilitated parks.
DEP is continuing to install meters and AMR in parks throughout the city. Currently DEP is working to meter both Central Park and Prospect Park, which will bring metering to two large previously unmetered areas. To date DEP has successfully installed meters and AMR in over 100 parks throughout the city, including multiple meters in large parks. This data helps track consumption, as well as reduce the amount of unknown non-revenue water..
Figure 10 : Parks spray showers retrofitted to date.

STRATEGY ONE 11
DEP is working with the City University of New York (CCNY) to reduce consumption in the third largest university system in the United States. DEP has proposed to reduce consump-tion of water by .75 MGD over a period of seven years in 21 colleges in the CUNY system. In 2014 DEP entered into an agreement with CCNY to replace more than 800 toilets and urinals in campus 10 buildings. Work began in November 2014 and is expected to be completed by November 2016. DEP also began an agreement with Lehman College of the CUNY system to replace 230 toilets and 120 urinals on their campus, that work will begin in July of 2016 and take about a year to complete.
Initiative 4: Save Water in Public Housing
Initiative 5: Save Water in Universities
Figure 12: Shepard Hall, The City University of New York
Under the Water Demand Management Plan, DEP proposed to reduce consumption of water at the Fire Department facil-ities by .04 MGD over a period of six years. In Fiscal Year 2013, DEP completed retrofits in 12 of the largest FDNY firehouses (Figure 13).
DEP anticipates to get the majority of reduction from FDNY by installing a water reuse system at their Randall’s Island Training Facility. The water reuse system is to recycle water they use to test and calibrate fire engine hoses and pumps. The design was complete, construction budget updated and we expect the work to begin in the fall of 2016 with a one and half year construction timeline, well before the shutdown of the Delaware Acqueduct.
Initiative 6: Save Water in Fire Department Facilities
XW
12 Retrofritted FDNY Firehouses
XW FDNY Water Recovery Facility
Figure 13: Firehouses retrofitted to date.
NYCHA is the largest public housing authority in the United States, and consequently, is one of DEP’s largest custom-ers. Over one million people live in the 1,100 plus NYCHA owned buildings. Providing specific care for these custom-ers is important, and to that end, DEP has stepped up communications and established partnerships between the two agencies to improve both metering and leak detection.
At the end of 2013, DEP held meetings to discuss proto-col when NYCHA has a leak. Rather than go through 311, NYCHA now has direct access to DEP to quickly address issues in the system on their property. In 2015, six requests have been submitted and quickly responded to by DEP. The works has been so helpful, NYCHA has also reached out about fire hydrant issues through this channel as well.
DEP has worked with NYCHA to move them from frontage billing to the Multifamily Conservation Program (MCP). An important part of this transition requires that meters and AMR devices are installed. NYCHA has identified a number of properties where DEP will partner with them to install large water meters, ranging from two to eight inches. DEP has completed site assessments on 80 developments, and is procuring job order contracts to carry out necessary metering and AMR installations. We will continue to do site assessments through 2015. We are working to replace meters and install AMR in NYCHA properties by June 2017.

12 RESIDENTIAL WATER EFFICIENCY PROGRAM
As stated in the Water Demand Management Plan, residential properties account for 78% of the city’s total water demand (Figure 14). Residential demand is driven primarily by various types of domestic end uses. We have been actively promoting incentives, creating partnerships, and promoting simple housekeeping practices to keep our residential buildings as water efficient as possible.
Multi-family buildings in Manhattan, NY.
RESIDENTIAL WATER EFFICIENCY PROGRAMSTRATEGY 2
Figure 14: Total water usage in New York City by land use (This does not include unaccounted for water, which is approximately 21%).
70, 8.3%126, 15.1%
325, 39.0%
133, 16.0%13, 1.5%12, 1.4%15, 1.7%
11, 1.3%14, 1.6%
4, 0.4%8, 1.0%8, 0.9%30, 3.6%
39, 4.6%9, 1.0%
17, 2.1%1, 0.2%
2, 0.3%
One Family DwellingsTwo-Three Family DwellingsMulti-Family BuildingsMixed Residential & Commercial BuildingsResidential InstitutionsHotelsHospitals & HealthPublic Facilities & InstitutionsEducational StructuresParking FacilitiesLight Industrial & Manufacturing BuildingsHeavy Industrial & Manufacturing BuildingsStoresOffice BuildingsOpen Space & Outdoor RecreationTransportation & UtilityVacant LandMiscellaneous & Missing Land Use Total Water Usage: 835 million gallons per day
70, 8.3%126, 15.1%
325, 39.0%
133, 16.0%13, 1.5%12, 1.4%15, 1.7%
11, 1.3%14, 1.6%
4, 0.4%8, 1.0%8, 0.9%30, 3.6%
39, 4.6%9, 1.0%
17, 2.1%1, 0.2%
2, 0.3%
One Family DwellingsTwo-Three Family DwellingsMulti-Family BuildingsMixed Residential & Commercial BuildingsResidential InstitutionsHotelsHospitals & HealthPublic Facilities & InstitutionsEducational StructuresParking FacilitiesLight Industrial & Manufacturing BuildingsHeavy Industrial & Manufacturing BuildingsStoresOffice BuildingsOpen Space & Outdoor RecreationTransportation & UtilityVacant LandMiscellaneous & Missing Land Use

STRATEGY TWO 13
Initiative 1: Save Water through Toi-let Replacement Program Phase I
Phase I of the Toilet Replacement Program was launched June 2014 to a pilot group of 1,000 residential customers working to meet the requirements established by the Multi-family Conservation Program, the remaining qualified resi-dential customers were contacted in July 2014. All qualified customers received a letter inviting them to participate in the program by logging into their My DEP Accounts and submit-ting a voucher application through the Toilet Replacement Program Website Portal. Program participants receive a voucher for $125 per toilet that can be taken to one of the five participating wholesale plumbing supply vendors located throughout New York City. Toilets purchased using the voucher must be rated 1.28 gallons per flush by appro-priate national standards and be Maximum Performance Tested with a score of at least 600 grams.
Since 2014, 1,130 voucher applications have been submit-ted for the Phase I of the Toilet Replacement Program via the program Website Portal, with the potential to replace over 133,000 toilets. Of these over 772 vouchers have been redeemed for the replacement of 9,040 toilets. The various outreach efforts undertaken since the launch of the program include: presentations at owners associations, meeting with co-op boards and building management companies, additional informational mails in multiple languages, and in-per-son sign-up events at each of the TRP authorized plumbing fixture vendor locations. 2015 saw a major increase in activ-ity in the TRP program, over 80% of all fixtures have been redeemed since January 2015. Due to recent success of the program, we have moved the original deadline of June 30th, 2016, and extended it to December 31st, 2016. This allows our staff to continue reaching out to people in the first phase of the program.
We also hope to set up an inhouse sign up desk at DEP headquarters that would allow building owners to come in and seamslessly go through the process of filling out the appropriate paperwork to recieve and redeem their vouchers.
Initiative 2: Save Water through the Toilet Replacement Program Phase II
Initiative 4: Save Water through Res-idential Water Surveys and Home Water Saving Kits
Phase II of the Toilet Replacement Program continues to be evaluated by the department. In order to move forward with this program, a fixed rate component has to be in place.
DEP has offered the service of complementary household water surveys, conducted by its contractor Honeywell, to building owners, to promote water conservation at their properties. In these surveys, Honeywell helps the build-ing owners identify opportunities for water savings, as well as any leaks which may exist. In 2015, on behalf of DEP, Honeywell conducted surveys in 2,667 apartment buildings and single family homes and in a total of 15,297 individual apartments. This program has been shown to save 0.4 MGD through reported leaks and other corrective measures, and expect to continue to realize savings through offering this service.

14 PUBLIC | PRIVATE PARTNERSHIPS
Initiative 1: Save Water through Voluntary Partnerships
Our efforts in the non-residential sector have focused on establishing partnerships aimed at developing informed, mutually-beneficial policies that incentivize water efficien-cy, reuse and alternative water use. To date, large private industry groups which manage large individual properties in New York City have formed the backbone of the non-resi-dential water efficiency efforts.
NON-RESIDENTIAL WATER EFFICIENCY PROGRAM
STRATEGY 3
In September of 2014 the DEP partnered with the US EPA, Con Edison, the New York City Chapter of the New York State Restaurant Association, NYSERDA and Alliance for Water Efficiency to develop a NYC Water Challenge to Restaurants . This public-private partnership challenged a select group of thirty NYC restaurants to reduce their annual water. DEP concluded its Water Challenge to Restaurants in September of 2015. This challenge was successful with 10 of the 30 restaurants being able to reduce consumption by at least 5%. Together, all of the winning restaurants saved 2.6 million gallons in New York City’s 2015 water consumption.
Sloan Memorial Kettering Hospital
These restaurants successfully established baseline analyt-ics of their water consuming trends. Many have also ana-lyzed their restaurants energy consumption. Most auditing their kitchen spaces for low-cost upgrades that reduce wa-ter, and in some cases energy use.
DEP launched the 2016 Water Challenge to Hospitals on January 1, 2016. Each hospital will work to reduce their campus wide monthly average water consumption by 5 percent and which can save approximately 2.2 million gal-lons of water per month. Participating hospitals include: New York Presbyterian-Queens, Memorial Sloan Kettering Cancer Center, and NYC Health + Hospitals/Harlem. The participants represent a mix of public and private hospitals that provide inpatient care, teaching and research services. These three hospitals represent a range of types that are found in New York City, from Harlem Hospital which focuses on patient care, and Memorial Sloan Kettering which has research centers. The lessons learned from the New York City Water Challenge to Hospitals will be utilized by DEP to develop a best practices guide for water management in area hospitals.
14 NON-RESIDENTIAL WATER EFFICIENCY PROGRAM

Initiative 2: Save Water through Cost Sharing
DEP will be unveiling a new cost sharing program before the Su of 2016 which will incentivize water reuse. Benefits from incentivizing water reuse and alternative use extend to the deferred capital costs of large-scale water, wastewater, and stormwater infrastructure, reduced loadings to sewers and water bodies, improved environmental stewardship, and increased capability to manage demand on the water supply system. The program will be designed to target water effi-ciency in both the residential and the non-residential sectors.
Figure 15: Havana Central a Restaurant Water Challenge participant.
Figure 16: Hospitals parcipating in the NYC Water Challenge
Participating hospitals are equipped with water meters and AMR devices which track water con-sumption in near real time. The hospitals will use 24 months of water consumption data to establish a baseline profile and track their progress in reducing water consumption and DEP will develop a toolkit of resources to help them meet their targets efficiently. Water reduction strategies may include good housekeeping techniques, such as finding and repair-ing leaks, and developing literature that encourages staff members to practice water conserving behavior. Physical upgrades will also be explored, such as the replacement of inefficient plumbing fixtures and the adoption of new tech-nologies that use water minimally, or reuse it to the extent possible.
We will be hosting four work-shops with industry professionals, tracking and sending wa-ter consumption data each month. In addition, because of the large campus footprint of each partcipant, we will work to do an audit and demand management plan for each hospital, to further commit to water savings beyond the challenge.
STRATEGY THREE 15

16 WATER DISTRIBUTION SYSTEM OPTIMIZATION
Initiative 1: Optimize the Leak Detection Program
Through the Universal Metering Program, DEP and its customers have been able to monitor water usage, detect inefficiencies, and track water demand citywide. The infra-structure that provides water to our customers every day is massive and primarily underground, hidden from view. Mains and service connections that range in size from one to 96 inches carry water from three main in-city tunnels to the city’s residences, business, and institutions. This massive infrastructure must be continually monitored, main-tained, repaired, and eventually replaced. DEP continues to search for ways to improve our water system and to ensure that New Yorkers are receiving top quality water in the most sustainable way.
In 2015, DEP surveyed 3,567 miles of water mains for leaks; as a result of leaks proactively found and repaired, DEP esti-mates that 3.74 million gallons of water per day were saved.
Crew addressing a service line leak
Figure 17: Digital correlator
WATER DISTRIBUTION SYSTEM OPTIMIZATIONSTRATEGY 4

STRATEGY FOUR 17
In addition, DEP continues to implement a more strategic approach to leak detection. In this approach, local, borough-based teams properly trained in leak detection efforts target specific areas known to be served with older network mains that are more likely to need both preventive and corrective maintenance. These teams are able to respond rapidly to any identified problems, as opposed to the slower response times experienced in many locations when DEP relied upon one consolidated resource center. Leaking and/or vandal-ized fire hydrants can also result in significant water waste, as an illegally opened fire hydrant can release more than 1,000 gallons per minute and drop pressure. In 2015, DEP repaired 9,374 hydrants, replaced 1,588, and provided other maintenance services to 8,725 more.
DEP has been working to improve maintenance of the pres-sure zones within the water distribution system. In CY2015, the number of breaks per 100 miles was 7.9, slightly above the city’s 10 year average of 7.0, but still well below the accepted industry average of 25 breaks per 100 miles annually.
Last year DEP completed 5,722 preventive maintenance inspections/ calibrations on pressure regulating valves. We then overhauled 82 of the 492 pressure regulating valves citywide. Four additional pressure zones were established in Staten Island which will allow more efficient distribution of pressure throughout the borough. The activation of City Water Tunnel No. 3 also provided 14 new pressure regulat-ing valves for increased pressure control.
Of the City’s 850,000 meters, approximately 70,000 are considered large water meters (2 inches and larger). Maintaining reliable water meters is critical given that city consumption is 1.1 billion gallons per day. 70,000 large meters represent $1.1 billion, or roughly one third of all of DEP’s revenue. These particular meters are critical points in DEP’s billing system, and have been targeted for both replacement and optimization. In 2015, a total of 9,906 large meters were replaced.
In addition, as of the end of 2015 DEP has substantially completed the installation of AMR devices, which now account for some 835,000 service connections. At the start of the AMR program, DEP had an estimated billing percent-age of 17.4%. By December of 2015, this fell to 3.2%, an 82% reduction.
Initiative 3: Replace Large Meters and Optimize Metering and AMR
Figure 19: Meter Testing Facility
Figure 18:Sonar hearing detection for leaks
Initiative 2: Optimize Pressure Management

18 WATER SUPPLY SHORTAGE MANAGEMENT
New York City has experienced approximately nine drought periods of record over the last 75 years. Over time, water efficiency and conservation measures have become increas-ingly important during drought periods. Water shortage relief efforts have played a significant role in reducing demand when water supply has been limited. In order to ensure a coordinated and rapid response to water supply shortage conditions, DEP has developed and implemented standard operating procedures and water use restrictions for periods of shortage. As our water supply infrastructure ages and as climate and weather patterns become more difficult to predict and increasingly severe in magnitude, DEP re-eval-uated existing water use restrictions in 2013 and had been working to adapt them to address the changing landscape of current and future conditions.
Initiative 1: Establish City Agency Responsibilities
When the technical study was completed in 2014, DEP coor-dinated with the Office of Emergency Management (OEM), and other city agencies to brief them on outcomes of the study and upcoming changes to the Water Shortage Rules as a result of the study. In collaboration with OEM, DEP con-tacted each of the required agencies to confirm that stan-dard operating procedures for demand management under water supply shortage conditions have been reviewed, up-dated and are in place.
DEP has also worked with OEM to develop the Hazard Mit-igation Guide (2014) which includes a detailed water short-age risk profile. This guide was designed to be accessible to NYC public officials and the public.
WATER SUPPLY SHORTAGE MANAGEMENTSTRATEGY 5
Ashokan Reservoir

STRATEGY FIVE 19
Initiative 2: Develop a Communica-tions Strategy
If water shortage is triggered during the shutdown of the Delaware Aqueduct, DEP will develop a water supply short-age public information and education campaign which will include hard copy materials to be distributed and mailed, as well as electronic communications such as DEP websites, email distribution lists, and 311 services. DEP will develop this campaign towards the end of the Water Demand Man-agement Plan implementation, in a three or four year time frame.
DEP has completed a rate study which covers the various options for establishing a framework for setting and imple-menting a water shortage rate in the event of a water supply shortage that is consistent with the provisions in the current Drought Emergency Rules
The proposed water shortage rate will have to be compatible with DEP’s billing system. DEP made a recommendation to adopt the rate, the Water Board requested that rate should be adopted.
DEP is in the process of amending the “Drought Emergency Rules” (15 RCNY Chapter 21) to address water shortage emergencies due to circumstances other than natural con-ditions (e.g., infrastructure repairs), as well as add, remove, and change certain water use prohibitions during the differ-ent stages of water shortage emergencies to better reflect DEP’s current understanding of citywide water use. Chang-es may include: authorizing DEP to impose water use re-strictions for reasons other than natural conditions; revising water use restrictions during a water emergency based on updated information on water use; amending the definitions section; clarifying the criteria and the process for applying for exemptions from water use restrictions; authorizing the Commissioner to recommend and request that the Water Board adopt an water shortage rate that encourages water
conservation during a water shortage emergency; amending signage requirements during water shortage emergencies; and changing restrictions for certain activities during differ-ent stages of a water shortage emergency.
Water Supply Shortage Rules are under review. The revi-sions are now being considered for a larger effort and envi-ronmental review process for in-city water supply resiliency project, which may change the original schedule for adop-tion of these rules. Once the rules are final and adopted, DEP will update the Water Supply Shortage Plan to reflect changes in the Rules.
DEP is working to give customers more information on their water consumption. Giving consumption information to cus-tomers empowers them to spot inefficiencies such as leaks quickly via the My DEP Account web portal.
More than 324,000 customers have signed up for My DEP Account where customers can view their water usage, bills, and payment history online. Small customers can view four meter readings a day, while larger customers can see their readings on an hourly basis. This information allows custom-ers to monitor their consumption and be more aware of their consumption patterns.
DEP has also included an option in My DEP Account that allows customers to receive a leak alert if their consumption triples for five consecutive days. This alert helps customers identify leaks and fix them, saving them water and money. Over 220,000 customers have signed up for leak alerts. Larger customers can customize their leak parameters.
Initiative 3: Adopt Water Shortage Rates
Initiative 4: Update Rules and Plan to Allow for Planned Infrastructure Repairs
Initiative 5: Provide Customers with Easy and Timely Access to Water Usage Data

20 WHOLESALE CUSTOMERS WATER DEMAND MANAGEMENT PROGRAM
Photo: Daniel Case (Wikipedia)
DEP has signed demand management planning agree-ments with nine of the 10 of the larger wholesale custom-ers it supplies water to outside of New York City. These 10 customers are: United Water of Westchester (now Suez Westcheter), Westchester Joint Water Works, the City of Mount Vernon, the Town of Greenburgh, the Village of Scarsdale, the Town of New Windsor, and the Village of Ossining, Village of Tarrytown, City of Newburgh, and the Village of New Paltz. These ten customers have been offered assistance to develop demand management plans for their water systems.
We have been working throughout 2015 to get closer to creating the water demand management plan for each of these customers, which will focus on reducting each of their consumption by 5% of a 3 year timeframe. DEP has completed the Village of Ossinging plan which is now on the DEP website.
In addition to creating water demand management plans,DEP has worked to hammer out inter government agreements to get commitments to water reduction of these customers.
Once the wholesale customers have completed their demand management plans, DEP will work to implement the measures identified in the plans to achieve a 5% reduction in consumption over a three year time frame. Implementing measures that would lead to a reduction of five percent in the consumption of these combined 10 customers would lead to a reduction in consumption of 5 MGD. As the 10 largest customers account for 90% of the total upstate wholesale consumption, or approximately 101 MGD per day, achieving a 5% reduction in this consumption by 2019 would give DEP a reduction in consumption of 5 MGD.
New Paltz, NY
Wholesale Customers Water Demand Management STRATEGY 6
Initiative 1: Water Demand Manage-ment Plans for 10 largest customers
Initiative 2: Implement Planned Demand Management Measures

STRATEGY SIX 21
NEW YORKNEW JERSEY
CON
NEC
TICU
T
Long
Island
Sound
Man
hatt
an
Bronx
Delaware Aqueduct
UlsterCounty
DutchessCounty
OrangeCounty
PutnamCounty
RocklandCounty
WestchesterCounty
East BranchReservoir
Bog BrookReservoir
West BranchReservoir
KensicoReservoir
Croton Falls
Reservoir
KirkLake
Boyds CornerReservoir
Diverting
Reservoir
LakeGleneida
MuscootReservoir
MiddleBranchReservoir
TiticusReservoirAmawalk
Reservoir
Cross RiverReservoir
New CrotonReservoir
48" L
ine
64-75HillviewReservoir
HudsonRi ver
12
7
8
9
13
12
11
10
14
17
16
15
44
57
5958
45
47
46
48
49
50
2120
19
18
53
5152
54
56
55
22
23
24
26
28
6263
2930
31
3
56
34
35
36
37
38
39
40
41
60
61
4
Catsk i l l Aquedu ct
Crot
on A
qued
uct
42/43
32/33
25/27
Delaware Aqueduct1. Marlborough2. Newburgh Town3. Greenburgh4. Blythdale Children Hospital5. Westchester Joint WW#16. Westchester County WD#1
Catskill Aqueduct7. New Paltz8. Wallkill Correction Facility9. Stewart Air Field10. St. Joseph's11. Newburgh, City12. Cornwall-on-Hudson13. New Windsor14. Cold Spring15. Graymore16. Putnam Valley17. Continental Village18. Peekskill19. Cortlandt20. Montrose WD21. Yorktown22. Orchard Hill23. New Castle (Millwood)24. New Castle25. Pleasantville26. Cottlage School27. Thornwood28. Cedar Knoll School29. Valhalla30. Hawthorne31. Westchester County WD-332. Sleepy Hollow33. Tarrytown34. Greenburgh (Knollwood)35. Elmsford36. Greenburgh (Hartsdale)37. UW New Rochelle38. Scarsdale39. UW New Rochelle40. Yonkers41. Yonkers42. Yonkers43. Mt. Vernon
New Croton Aqueduct44. New Castle45. Ossining46. Briarcli� Manor47. Sleepy Hollow48. Tarrytown49. Irvington50. UW New Rochelle
Croton Lakes & Reservoirs51. Carmel52. Putnam Hospital53. Brewster Heights WD54. Westchester County WD-255. Walter Franks56. Katonah57. Hunterbrook Cove58. Ossining59. Croton-on-Hudson
Kensico / Rye Lake60. Westchester Joint WW#161. Harrison
48" Pipe Line62. Westchester County WD#163. Westchester County WD#1
NYC/Westchecter Cnty Line64. Mt. Vernon/Bronx Distribution65. Mt. Vernon @ 19 Seton66. Mt. Vernon @ 23 Seton67. Mt. Vernon @ 45 Amondson68. Mt. Vernon @ 29 Seton69. Mt. Vernon @ 13 Seton70. Mt. Vernon @ 31 Seton71. UW New Rochelle/Bronx Dist.72. UW New Rochelle @ Split Rock73. UW New Rochelle @ Roosevelt74. Mt. Vernon/Bronx Distribution75. Mt. Vernon/Bronx Distribution
MiscellaneousOver 50 Interconnections between communities
North CastleWhite PlainsScarsdale (Eastchester)Mt. VernonYonkers
MontroseVerplankBuchanan
Amawalk HeightsSomersCortlandtYorktown
At Hillview ReservoirUptake Chamber
Bronx Residents
BronxvillePelhamNorth PelhamTuckahoeDobbs FerryArdsleyHastingsNew RochelleEastchester
MemaroneckRyePortchesterLarchmont
Catskill/Delaware Watershed
Croton Watershed
Rivers and Reservoirs
Catskill Aqueduct and Tunnels
Croton Aqueduct
Delaware Aqueduct and Tunnels
County Borders
State Bordersmap not to scale
Total typical daily consumption outside New York City is
131 million gallons per day.

22 WATER DEMAND TRACKING
Figure 21: FY14 AWWA Water Balance
Figure 20: FY14 Residential Per Capita Water Consumption
WATER DEMAND TRACKINGNew York City water consumption has continued to decline despite increases in population as shown in the figure 1 in the introduction. 2015 average water consumption was 1,009 MGD, lower than the drought of record. Some of this is attributed to cooler and wetter summers in more recent years. It is reasonable to assume that water usage will remain stable or even continue to decline over the near term due to increasing rates and customers’ ability to better track usage via AMR. Volumetric meter-based billing is a water conserva-tion pricing mechanism and water use can be expected to decrease in response to the increasing cost of water. This overall trend could be affected by a number of factors includ-ing year-to-year temperature swings and potential droughts, which tempers consumption through restrictions.
DEP uses water demand analysis and projections for many purposes including water supply and wastewater infra-structure planning, revenue analysis, affordability studies, assessing the effects of new growth and rezoning, and
understanding the effects of water demand on agency oper-ations. In 2013, DEP began using the AWWA water audit software to assess system water balance. Figure 20 below includes the results of the balance. DEP also continues to track per capita consumption of water every year. Due to the nature of New York City as a busi-ness district and tourist destination, dividing water consump-tion by population doesn’t neccessarily capture normal per capita consumption. Through tying our consumption data with local population data, DEP finds that FY15 New York City per capita daily consumption is close to 71 gallons per capita per day (gpcd). Meter-billed consumption is even lower, approximately 65 gpcd. Gpcd values are calculated based on consumption volumes and 2009-2013 US Census American Community Survey data.

