water demand factor study - ventura, ca
TRANSCRIPT

FinalWater Demand Factor Study
April 8, 2020
Prepared By:
Contact: Kevin J. Gustorf, P.E.
(916) 341-7425
City of Ventura – Ventura Water / Project No. 8703002
Water Demand Factor Study
April 8, 2020 – Final i
TABLE OF CONTENTS
I. INTRODUCTION .............................................................................................................. 1
A. Background and Purpose .............................................................................................. 1
B. Source Data ................................................................................................................... 2
II. EXISTING WATER DEMAND FACTORS ..................................................................... 2
A. Existing Demand Factors (per Land Use) ..................................................................... 2
B. Per Capita Water Use .................................................................................................... 3
III. AGENCY COMPARISON ................................................................................................. 5
A. Comparison ................................................................................................................... 5
B. Methodology ................................................................................................................. 5
IV. HISTORICAL WATER USE ............................................................................................. 7
A. Water Usage Summary ................................................................................................. 7
B. Supply / Production Summary ...................................................................................... 9
C. Water Loss Factor ....................................................................................................... 11
V. RECOMMENDED WATER DEMAND FACTORS ...................................................... 13
A. Proposed Demand Factor Categories .......................................................................... 13
B. Demand Factor Methodology and Process ................................................................. 15
C. Demand Factor Contingency ...................................................................................... 16
D. Proposed Demand Factors .......................................................................................... 17
TABLES
Table 1 - Current Water Demand Factors (from 2013 CWRR)...................................................... 3
Table 2 - 2013 Agency Demand Factor Comparison ..................................................................... 6
Table 3 - 2020 Agency Demand Factor Comparison ..................................................................... 7
Table 5 - Annual Summary of Water Billing Data (AFY) ........................................................... 11
Table 6 - Residential Water Usage Data Summary ..................................................................... 12
Table 7 - Water Supply / Production Summary (AFY) ................................................................ 13
Table 8 - Water Loss ..................................................................................................................... 15
Table 9 - Proposed Demand Factor Categories ............................................................................ 16
Table 10 - Proposed Demand Factors ........................................................................................... 20
APPENDICES
Appendix A – Residential Demand Factor Back-Up Data
Appendix B – Non-Residential Demand Factor Analysis
City of Ventura – Ventura Water / Project No. 8703002
Water Demand Factor Study
April 8, 2020 – Final ii
ACRONYMS AND ABBREVIATIONS
AB Assembly Bill
AFY Acre feet per year
AMI Advanced Metering Infrastructure
AWWA American Water Works Association
CMWD Casitas Municipal Water District or Casitas
CWRR Comprehensive Water Resources Report
CY Calendar year
DU/AC Dwelling unit per acre
DWR California Department of Water Resources
GPCD Gallons per capita per day
GPD Gallons per day
GPD/DU Gallons per day per dwelling unit
GPD/KSF Gallons per day per 1,000 square feet
HCF Hundred cubic feet
NO-DES Neutral Output Discharge Elimination System
SB Senate Bill
SWRCB State Water Resources Control Board
UWMP Urban Water Management Plan

City of Ventura – Ventura Water / Project No. 8703002
Water Demand Factor Study
April 8, 2020 – Final 1
I. INTRODUCTION
A. Background and Purpose
The City of San Buenaventura Water Department (Ventura Water) owns, operates and
maintains a potable water distribution system that distributes treated water to the customers
within its service area boundary. Ventura Water also distributes non-potable water and
recycled water to select customers within its service boundary, where the infrastructure
exists, to meet irrigation demands.
In 2013, Ventura Water updated its water demand factors for various land use categories
based on actual water usage data available at the time. The water demand factors developed
in 2013 were prepared as a part of Ventura Water’s first Comprehensive Water Resources
Report (CWRR). The CWRR is a comprehensive evaluation of Ventura Water’s current
and projected water demand and supply. The CWRR is updated annually by Ventura
Water.
The water demand factors are used to calculate future demand projections based on known
development plans and the ultimate build-out of the City per the City’s General Plan.
Water demand factors have been used in a variety of City publications, including: General
Plan, Water Master Plan, Urban Water Management Plan and the Comprehensive Water
Resources Report (CWRR). In addition, smaller more focused studies will reference water
demand factors from these City documents, such as in the use of development water
studies.
The water demand factors developed for the 2013 CWRR were based upon water
consumption data from 2012. Since 2012, water demand in the City has changed due to
aggressive water conservation, legislation, development, and changing land uses. In
addition, the water demand factor land use categories developed for the 2013 CWRR were
grouped into broad categories. These demand factors are currently used to calculate future
demands for proposed development projects, and also used to determine the Water
Resources Net Zero Fee for developers. Therefore, Ventura Water has determined the need
to update its water demand factors to reflect current water usage behavior and define the
demand factor categories in greater detail.
The primary goal of this Study is to establish water demand factors that reflect current
usage patterns and can be utilized throughout the City’s service area to calculate future
water demand projections that can be used in all water planning efforts. An additional goal
of this Study is to develop a comprehensive list of water demand factors that accurately
represent water usage per land use classification that can be used for planning purposes.
The water demand factors developed herein account for current trends, but also account for
yearly variability based upon environmental conditions.

City of Ventura – Ventura Water / Project No. 8703002
Water Demand Factor Study
April 8, 2020 – Final 2
Not included as part of this Study is an evaluation of daily or seasonal diurnal patterns or
peaking factors.
B. Source Data
The water demand factors developed as a part of this Study utilized Ventura Water billing
data and production data. The billing data provided was for the calendar years 2013
through 2018. The production (supply) data was provided for the calendar years 2013
through 2018.
Also referenced for this Study were the following reports:
➢ 2013 Comprehensive Water Resources Report (CWRR)
➢ Water Master Plan (March 2011)
➢ 2015 Urban Water Management Plan (June 2016)
➢ 2005 Ventura General Plan
➢ Ordinance 2016-004 “Water Rights Dedication, Water Resource Net Zero Fee,
and Water Resource Net Zero Requirements”
II. EXISTING WATER DEMAND FACTORS
Water demand factors are used to estimate future water use based on a land use type and unit of
measurement (such as acreage, dwelling unit count, square footage, number of persons, etc.).
Demand factors are typically calculated based on historical water use and trends. Ventura Water
last updated its water demand factors per land use in 2013 for the Comprehensive Water
Resources Report (CWRR), and its demand factor per capita in 2016 for the Urban Water
Management Plan (UWMP).
A. Existing Demand Factors (per Land Use)
The land use-based water demand factors currently being utilized by Ventura Water were
developed in 2013 as a part of the first edition of the CWRR. The land use demand factors
are summarized in Table 1.

City of Ventura – Ventura Water / Project No. 8703002
Water Demand Factor Study
April 8, 2020 – Final 3
Table 1
Current Water Demand Factors (from 2013 CWRR)
Water Demand Factor Classification Raw Consumption
Factor (CY 2012)
Adjustment for
Water Loss (+6.5%)
Adjustment for
Planning Purposes
(+20% appx.)
Res
iden
tial
Residential (0-8 du/ac) 292 gpd/du 311 gpd/du 370 gpd/du
Residential (9-20 du/ac) 189 gpd/du 201 gpd/du 250 gpd/du
Residential (21+ du/ac) 189 gpd/du 201 gpd/du 250 gpd/du
No
n-R
esid
enti
al
Commercial/Retail/Industrial/Hotel 206 gpd/ksf 220 gpd/ksf 265 gpd/ksf
Public/Institutional
Hospital/Assisted Living 424 gpd/bed 452 gpd/bed 545 gpd/bed
Park/Landscape/Irrigation 1,566 gpd/acre 1,668 gpd/acre 2,000 gpd/acre
Source: Table 3-3 of 2013 CWRR
du/ac = dwelling unit per acre
gpd/du = gallons per day per dwelling unit
gpd/ksf = gallons per day per 1,000 square feet
B. Per Capita Water Use
California state legislators passed Senate Bill 7 (SB x7-7, also known as the Water
Conservation Bill) in November 2009 requiring all municipal water suppliers to reduce per
capita water consumption by 20% by Year 2020 from an established baseline. Ventura
Water’s Year 2020 compliance target is 142 gallons per capita per day (GPCD). As of the
2015 Urban Water Management Plan (UWMP), Ventura Water has already achieved its
2020 target, with the Year 2015 usage calculated to be 117 GPCD.
In 2018, the California Legislature passed two additional water conservation bills, Senate
Bill 606 (SB 606) and Assembly Bill 1668 (AB 1668), creating the framework for
additional statewide water savings mandates that will take effect in Year 2022. SB 606 and
AB 1668 build on the state’s ongoing efforts to make water conservation a way of life in
California and create a new foundation for long-term improvements in water conservation
and drought planning. SB 606 and AB 1668 establish guidelines for efficient water use and
a framework for the implementation and oversight of the new standards.
In Year 2022, water suppliers will have to submit water budgets to the California
Department of Water Resources (DWR) and increase water recycling projects. The

City of Ventura – Ventura Water / Project No. 8703002
Water Demand Factor Study
April 8, 2020 – Final 4
legislation establishes a residential indoor goal of 55 GPCD until Year 2025, 52.5 GPCD
from Years 2025 to 2030, and 50 GPCD after Year 2030. According to Ventura Water’s
2015 UWMP, Ventura Water customers used an average of 117 GPCD in 2015. The 117
GPCD was calculated using service area population and overall water use (all water
including residential, commercial, municipal, irrigation, etc. excluding recycled water).
However, Ventura Water reports residential use to the State. From 2016 to 2018, Ventura
Water’s average indoor and outdoor residential water use was 69 GPCD. Based on the
DWR’s 2011 California Single Family Water Use Efficiency Study, the average household
uses 47% of its water indoors and 53% outdoors. Therefore, it is estimated that Ventura
Water’s average residential indoor use is 32 GPCD, indicating that Ventura Water is
already meeting the 55 GPCD goal.
A few of the provisions that will impact Ventura Water identified in the two bills include:
• Establishing water use objectives and long-term standards for efficient water use that
apply to urban retail water suppliers comprised of indoor residential water use,
outdoor residential water use, commercial, industrial and institutional (CII) irrigation
with dedicated meters, water loss, and other unique local uses.
• Providing incentives for water suppliers to recycle water.
• Requiring both urban and agricultural water suppliers to set annual water budgets and
prepare for drought.
It should be noted that the long-term standards for efficient water use are still being
developed by the State and that a report is anticipated to be completed January 2021
reviewing the 55 GPCD standard for residential indoor water use. In addition, the service
area population will need to be updated, which can impact the residential GPCD
calculations. These updates will be provided in the 2020 UWMP.
The implementation of SB 606 and AB 1668 may result in lower water demand factors for
Ventura Water in the future. It is recommended that Ventura Water review the water
demand factors after a few years of billing data has been collected after the water
conservation laws are fully implemented.

City of Ventura – Ventura Water / Project No. 8703002
Water Demand Factor Study
April 8, 2020 – Final 5
III. AGENCY COMPARISON
A. Comparison
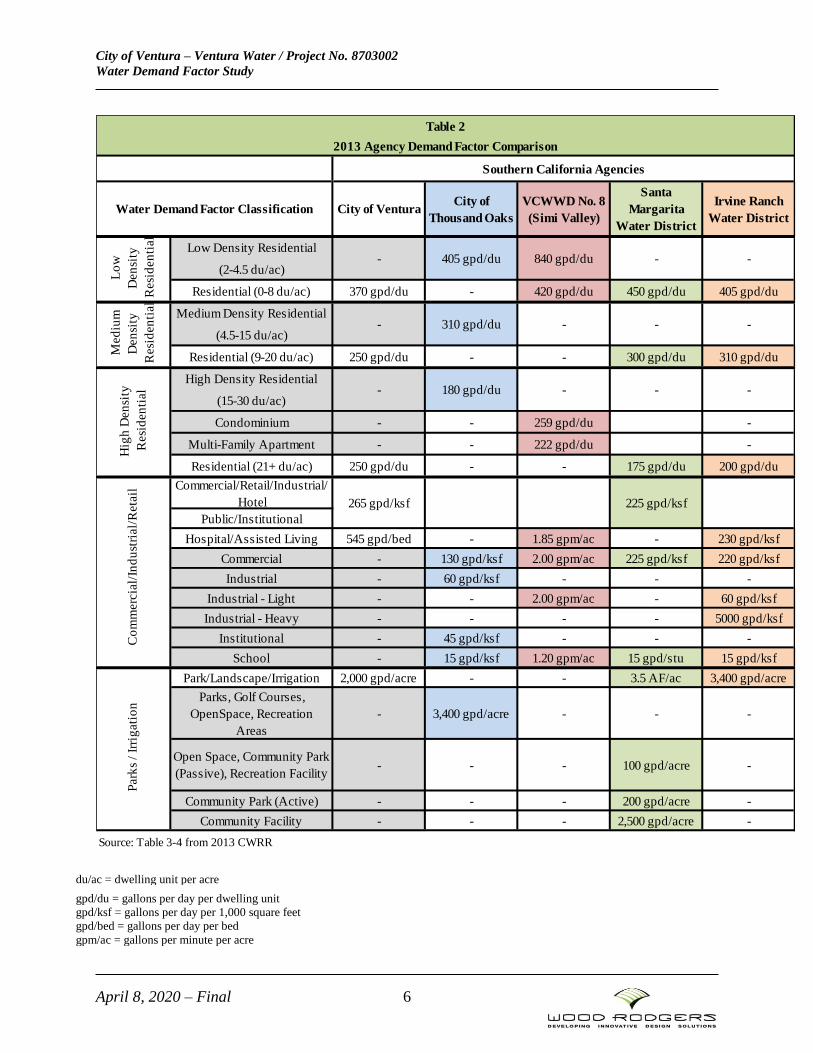
As a part of the 2013 CWRR process, the water demand factors for several local agencies
were identified for comparative purposes. The water agency demand factor comparison
from the 2013 CWRR is included herein as Table 2.
B. Methodology
For this Study, additional agencies were contacted to understand the methodology used to
calculate its water demand factors.
• The City of Santa Barbara’s demand factors were based on water consumption for
calendar years 2006 (average weather) and 2007 (driest year on record) and land
use data (square footage for commercial properties and lot size values for
residential).
• The City of San Luis Obispo’s municipal water use factors were developed in
2008. No further information was available regarding the methodology.
• Irvine Ranch Water District’s demand factors were initially developed in 1999 with
an update completed in 2012. The demand factors were based on 2000 to 2010
billing data with adjustments: 7% unaccounted water and 12% economic bounce
back and land use information.
• The City of Oxnard’s water demand factors were based on billing records from
calendar year 2012. Water demand factors for the existing system were derived
from a total system average by using geocoded billing records. The total system
demand by land use category was divided by the total area of each land use
category.
A summary of the above agencies’ water demand factors is included in Table 3.
City of Ventura – Ventura Water / Project No. 8703002
Water Demand Factor Study
April 8, 2020 – Final 6
du/ac = dwelling unit per acre
gpd/du = gallons per day per dwelling unit
gpd/ksf = gallons per day per 1,000 square feet
gpd/bed = gallons per day per bed
gpm/ac = gallons per minute per acre
Low Density Residential
(2-4.5 du/ac)
Residential (0-8 du/ac) 370 gpd/du - 420 gpd/du 450 gpd/du 405 gpd/du
Medium Density Residential
(4.5-15 du/ac)
Residential (9-20 du/ac) 250 gpd/du - - 300 gpd/du 310 gpd/du
High Density Residential
(15-30 du/ac)
Condominium - - 259 gpd/du -
Multi-Family Apartment - - 222 gpd/du -
Residential (21+ du/ac) 250 gpd/du - - 175 gpd/du 200 gpd/du
Commercial/Retail/Industrial/
Hotel
Public/Institutional
Hospital/Assisted Living 545 gpd/bed - 1.85 gpm/ac - 230 gpd/ksf
Commercial - 130 gpd/ksf 2.00 gpm/ac 225 gpd/ksf 220 gpd/ksf
Industrial - 60 gpd/ksf - - -
Industrial - Light - - 2.00 gpm/ac - 60 gpd/ksf
Industrial - Heavy - - - - 5000 gpd/ksf
Institutional - 45 gpd/ksf - - -
School - 15 gpd/ksf 1.20 gpm/ac 15 gpd/stu 15 gpd/ksf
Park/Landscape/Irrigation 2,000 gpd/acre - - 3.5 AF/ac 3,400 gpd/acre
Community Park (Active) - - - 200 gpd/acre -
Community Facility - - - 2,500 gpd/acre -
Source: Table 3-4 from 2013 CWRR
Hig
h D
en
sity
Resi
den
tial
Co
mm
erc
ial/
Ind
ust
rial/
Reta
ilP
ark
s /
Irri
gati
on
- 3,400 gpd/acre
- 180 gpd/du
Parks, Golf Courses,
OpenSpace, Recreation
Areas
Open Space, Community Park
(Passive), Recreation Facility
- - -
- - - 100 gpd/acre -
- - -
265 gpd/ksf 225 gpd/ksf
Southern California Agencies
City of Ventura
- 310 gpd/du - - -
- 405 gpd/du 840 gpd/du - -
Lo
w
Den
sity
Resi
den
tial
Med
ium
Den
sity
Resi
den
tial
City of
Thousand Oaks
Table 2
2013 Agency Demand Factor Comparison
VCWWD No. 8
(Simi Valley)
Santa
Margarita
Water District
Irvine Ranch
Water DistrictWater Demand Factor Classification

City of Ventura – Ventura Water / Project No. 8703002
Water Demand Factor Study
April 8, 2020 – Final 7
gpd/stu = gallons per day per student
gpd/acre = gallons per day per acre
Table 3: 2020 Agency Demand Factor Comparison
Water Demand Factor
Classification City of Santa
Barbara City of San Luis
Obispo Irvine Ranch
Water District* City of Oxnard
Single-Family 357 gpd/du 268 gpd/du 405 gpd/du 2,250 gpd/acre
Multi-Family 143 gpd/du 161 gpd/du 300 gpd/du 4,250 gpd/acre
Office 54 gpd/ksf 89 gpd/ksf 72 gpd/ksf -
Hotel (w/restaurant) 179 gpd/room 109 gpd/room 160 gpd/ksf - Hotel/motel (no
restaurant) 116 gpd/room -
Public & Institutional 152 gpd/ksf - 45 gpd/ksf -
School - - 28 gpd/ksf 1,500 gpd/acre
Multi-Tenant Commercial
152 gpd/ksf 268 gpd/ksf 175 gpd/ksf 2,000 gpd/acre
Single-Use Commercial 134 gpd/ksf - - -
Park/Golf Course - 1,785 gpd/acre 2,200 gpd/acre -
*Irvine Ranch Water District has been included in both Tables 2 and 3 since the water demand factors
were updated since the 2013 CWRR.
gpd/du = gallons per day per dwelling unit
gpd/ksf = gallons per day per 1,000 square feet
gpd/acre = gallons per day per acre
gpd/room = gallons per day per room
IV. HISTORICAL WATER USE
A. Water Usage Summary

City of Ventura – Ventura Water / Project No. 8703002
Water Demand Factor Study
April 8, 2020 – Final 8
In order to establish the existing (or current) water demands, Ventura Water provided
water usage (billing) data from January 2013 through December 2018. The billing data is
summarized in Table 5.
It is noted that the billing records include both treated potable water and non-potable water
(reclaimed water and untreated raw water). From 2013 through 2018, the average annual
demand for both potable and non-potable water was 14,420 acre-feet/year (AFY). The
highest water use year was 2013, and the lowest water use year was 2017.
Excluding reclaimed water and raw water, the total average annual potable water demand
was 13,736 AFY (2013-2018).
Approximately 64% of all water use is residential. In order to understand the water demand
breakdown between the single-family and multi-family residents, the categories are
summarized in Table 6. Of the residential water use, approximately 63% is associated with
single-family dwelling units. From 2013-2018, the total annual residential water demand
was an average of 9,223 AFY.
Table 5
Annual Summary of Water Billing Data (AFY)
2013 2014 2015 2016 2017 2018 Average
Total - Potable and Non-
Potable Water 16,665 15,978 13,342 13,456
13,219
164 13,549 14,359
Total - Potable Water
Only [1] 16,003 15,230 12,668 12,768 12,495 12,886 13,675
[1] Excludes untreated raw water
and reclaimed water
AFY = acre feet per year

City of Ventura – Ventura Water / Project No. 8703002
Water Demand Factor Study
April 8, 2020 – Final 9
Table 6
Residential Water Usage Data Summary
Gallons Per Day (GPD)
2013 2014 2015 2016 2017 2018 Average
Single-Family 6,325,834 5,947,067 4,725,128 4,673,664 4,671,020 4,712,252 5,175,828
Multi-Family 3,450,190 3,323,991 2,899,937 2,896,490 2,867,191 2,912,382 3,058,363
Residential Subtotal
(GPD) 9,776,024 9,271,058 7,625,065 7,570,153 7,538,211 7,624,635 8,234,191
Residential Subtotal
(AFY) 10,951 10,385 8,541 8,480 8,444 8,541 9,223 Note: See Appendix A for back-up detail
GPD = gallons per day
AFY= acre feet per year
B. Supply / Production Summary
Ventura Water obtains potable water from three primary sources: 1) the purchase of water
from the Casitas Municipal Water District (CMWD or Casitas); 2) the Ventura River; and
3) local groundwater basins. Ventura Water provided a summary of the total water
production (supply) from its various potable water sources for the calendar years 2013
through 2018, as shown in Table 7.
The highest production year was 2013, with annual declines every year until 2018, which
was the lowest production year. These numbers are in-line with the severe drought that
occurred over these 5 years and the significant conservation that occurred.
The total average annual production (excluding reclaimed water) for years 2013 through
2018 was 14,962 AFY.

City of Ventura – Ventura Water / Project No. 8703002
Water Demand Factor Study
April 8, 2020 – Final 10
Table 7
Water Supply / Production Summary (AFY)
Primary Source 2013 2014 2015 2016 2017 2018 Average
CMWD 1 2,710 2,425 3,530 1,987 913 1,383 2,158
CMWD 2 3,047 2,396 1,046 349 1,032 1,145 1,503
Casitas Direct Customers 297 279 272 298 243 188 263
Foster Park Intake Subsurface 1,076 748 449 419 1,280 897 811
Golf Course Well 5 2,527 2,197 1,819 1,352 789 356 1,507
Golf Course Well 6 2,964 2,368 1,768 2,350 1,220 561 1,872
Golf Course Well 7 0 0 0 0 1,816 2,399 703
Mound Well 1 1,717 1,147 590 805 703 910 979
Nye Well 11 0 292 0 2 119 0 69
Nye Well 2 0 0 0 0 0 0 0
Nye Well 7 856 1,064 0 414 1,277 520 689
Nye Well 8 242 1,134 850 1,014 972 459 778
Saticoy Well 2 673 629 320 0 45 31 283
Saticoy Well 3 0 0 1,998 2,898 2,549 3,065 1,752
Victoria Well 1 0 0 0 0 0 0 0
Victoria Well 2 1,596 2,073 1,734 1,866 695 1,619 1,597
TOTAL 17,705 16,751 14,376 13,752 13,651 13,534 14,962 AFY = acre feet per year
City of Ventura – Ventura Water / Project No. 8703002
Water Demand Factor Study
April 8, 2020 – Final 11
C. Water Loss Factor
From the source to the customer, all water systems experience some level of water loss.
Water loss can be attributed to many things; most typically it is associated with leaks in the
system, main breaks, and slight variations in meter accuracy. To increase efficiencies in the
water distribution system, water loss audits are conducted to trace the flow of water from
its source and treatment, through the water distribution system, and into customer
properties. The water loss audit informs water utilities of the volume of water lost and
revenue associated with that water loss. Once water loss audits are complete,
improvements can be made in water resources management, financial performance, and
operational performance.
Water loss is essentially the difference between the water supplied and consumption. A
water loss calculation is performed by calculating the difference between the water
supplied (all source water produced and supplied to the Ventura Water system including
purchases from Casitas) and consumption (billing records for all metered water that is
delivered to customers). This water loss calculation was performed for the years 2013 to
2018. The average water loss for 2013 to 2018 was 8.5%.
In September 2014, Senate Bill 1420 was adopted requiring urban retail water suppliers
such as Ventura Water to quantify and report on distribution system water loss in the
Urban Water Management Plan (UWMP). Ventura Water conducted an audit in
accordance with the methods of the American Water Works Association (AWWA) and
submitted the audit for calendar year 2015 with the 2015 UWMP.
In October 2015, Senate Bill 555 was adopted requiring Ventura Water to submit validated
water loss audits annually to the DWR. Thus, 2016, 2017 and 2018 audits were prepared in
accordance with the AWWA method, validated by a third-party technical expert, and
submitted to DWR. The average water loss rate for the three years of DWR audited data
was 7.0%. The water loss auditing process is still being refined by the State and the
standard for allowable water loss volumes will be implemented beginning in 2023
While the AWWA method breaks water loss into multiple categories to provide additional
information to the utility, it still calculates water loss as the difference between the water
supplied (water that Ventura Water produces and purchases from Casitas) and authorized
consumption (the water that is sold to customers). The audit uses the term “non-revenue
water” to define this water loss. As shown in Table 8, water loss is variable from year to
year due to the fluctuations in the number of maintenance related issues such as water main
breaks and damaged hydrants. For the purposes of developing the demand factors, staff
chose to average only the water loss percentages for the years that DWR audits were
completed. The DWR audits for the years 2016 to 2018 are the most recent data available

City of Ventura – Ventura Water / Project No. 8703002
Water Demand Factor Study
April 8, 2020 – Final 12
and are in compliance with current and upcoming regulations for water loss. The City has
also taken actions to reduce losses including operating the Neutral Output Discharge
Elimination System (NO-DES) truck to recycle water used for water distribution system
flushing, implementation of the Advanced Metering Infrastructure (AMI) project which
includes replacement of manually-read water meters with smart meters which include
advanced leak detection notification capabilities, and implementation of the City’s Capital
Improvement Plan which includes replacement of aging pipelines. These actions should
reduce the City’s water loss rate over the long-term, but year to year variability will still
occur.

City of Ventura – Ventura Water / Project No. 8703002
Water Demand Factor Study
April 8, 2020 – Final 13
Table 8
Water Loss
Year
Metered (AFY) [1] Supply (AFY) [2] Water Loss (%)
2013 16,003 17,705 9.6%
2014 15,230 16,751 9.1%
2015 12,668 14,376 11.9%
20163 12,768 13,752 7.2%
20173 12,495 13,651 8.5%
20183 12,886 13,534 4.8%
Average (Years
2013 – 2018) 13,675 14,962 8.5%
DWR Audit
Average (Years
2016-2018) 7.0%
[1] From Table 5 - Potable Water Only
[2] From Table 7 [3] Years that Level 1 validated audits submitted to DWRAFY = acre
feet per year
V. RECOMMENDED WATER DEMAND FACTORS
A. Proposed Demand Factor Categories
The primary goal of this Study is to develop water demand factors based on current water
use and across a broader designation of land use types. An iterative process was used to
determine which land-use types should have unique demand factors. The intent is to
develop water demand factors for each land use type that may use water differently and
represents a cross-section of the typical uses within the City. Through discussions and
input from Ventura Water staff (including the General Manager), the land use categories
that were selected to develop a unique water demand factor for are shown in Table 9.

City of Ventura – Ventura Water / Project No. 8703002
Water Demand Factor Study
April 8, 2020 – Final 14
Table 9
Proposed Demand Factor Categories
Residential
Single-Family
Multi-Family
Non-Residential
Office
Medical/Dental Office
Assisted Living
Hotel (w/ restaurant)
Hotel/Motel (no restaurant)
Public & Institutional
School
Restaurant (sit-down)
Restaurant (fast-food)
Brewery
Bakery/Coffee Shop
Grocery Store
Multi-Tenant Commercial [1]
Single-Use Commercial
Self-Storage
Church
Park/Golf Course
Gym (w/ pool)
Car Wash
Gas Station (w/ car wash)
Gas Station
[1] To use for proposed multi-tenant developments when tenants have not
been specified. Includes at least one higher intensity water use such as a
restaurant.

City of Ventura – Ventura Water / Project No. 8703002
Water Demand Factor Study
April 8, 2020 – Final 15
B. Demand Factor Methodology and Process
In order to develop new and updated water demand factors for the proposed land use
categories, water usage records were obtained for a cross-section of typical customers
within each category.
The methodology and process used to determine the demand factors was based on the
following:
➢ Utilized water billing data from 2013 through 2018.
➢ Single-family residential demand factor was based on all single-family accounts.
➢ Multi-family residential demand factor was based on all multi-family accounts.
➢ Non-residential demand factors were developed by obtaining billing records for
approximately 6 to 12 customers who were considered representative of the
selected category, when feasible.
➢ The customers selected for the analysis of each category were selected based on a
diverse representation of the City, and broad geographical presence across the
City.
➢ All customers were researched to determine when the business opened, or closed,
and the billing data utilized was adjusted accordingly.
➢ Separate demands factors for City and County were not developed. Ventura
Water’s service area includes customers in unincorporated Ventura County who
are within the City’s Sphere of Influence.
➢ The Thomas Fire occurred in the City in December of 2017. Due to the large (6
years) amount of data utilized, the impacts of water use during the Thomas Fire
were deemed negligible for this analysis.
➢ Water use was classified by the year of the meter read. For example, a meter read
in January of 2017 was likely for water use in November/December of 2016,
however the water use was classified in the 2017 calendar year.
➢ Land use data, such as building square footages, acreages, etc. were obtained
through City and County resources when available. Google Earth was used in
instances when City or County information was not readily available.
➢ All data from accounts identified as a “fireline” were excluded from the
calculations as the usage was negligible. Fireline accounts are for fire protection of
residential, commercial, school, and municipal properties.
➢ Dedicated irrigation meters were included in the demand factor calculations.
➢ For each customer selected, the billing data was analyzed to determine if there
were any anomalies in the data. Anomalies such as a monthly water demand that
was multiple times the normal (due to a customer water leaks or high irrigation
use) were included in the calculations to account for the variability in water usage.
City of Ventura – Ventura Water / Project No. 8703002
Water Demand Factor Study
April 8, 2020 – Final 16
➢ If data from a selected customer appeared questionable, the customer was removed
from the calculation.
➢ Data from industrial customers was analyzed and included in Appendix B, but due
to extreme variability in water use between customers and the uncertainty of which
kind of industrial activities may be proposed in the future, a demand factor for
industrial use is not included in this report. The water demands of any proposed
industrial use will be assessed on a case by case basis.
➢ The raw demand factors for each category was based on the average of all
customers in that specific category.
➢ The raw demand factors for each category were an average of the data over the
years 2013 through 2018.
➢ The DWR audited water loss factor of 7% was applied to the raw factor.
➢ A planning-level contingency factor was applied to the raw factor and the water
loss. The methodology used to develop the planning-level contingency is
discussed in Section V.C.
C. Demand Factor Contingency
Water consumption varies from year to year depending upon a number of factors, primarily
weather and drought. The water demand factors developed herein were based on the
average annual water usage from years 2013 through 2018. California experienced a
significant drought that spanned the five years from 2012 to 2017. Beginning in 2014,
statewide mandates to reduce water consumption were put into place, and water agencies
observed significant reductions in water demand, including Ventura Water. In 2014, the
State Water Resources Control Board adopted an emergency regulation calling on all
Californians to reduce their water by 20%. Therefore, the City of Ventura City Council
declared a water shortage emergency in September 2014. In June 2015, the City Council
confirmed that the City was in a Stage 3 shortage event with 20% mandatory conservation.
Former Governor Brown declared that the drought officially ended in 2017 for the state of
California; however, the City of Ventura remained in a shortage event. As of February
2020, the City remains in a Stage 3 shortage event. While many of the state’s water
consumption reduction mandates have remained in place, water demands in the City and
the state have started to move higher again. As shown in Tables 5 and 6, overall water use
in 2018 has increased from water use in 2016 and 2017. Since the water demands factors
developed herein were calculated based on actual water usage during a significant drought
period, it is prudent to account for likely increases in water demand in future years.
In order to determine the appropriate planning-level contingency to apply to the raw
demand factor, the water consumption data from 2013 through 2018 was evaluated in a
few different ways:

City of Ventura – Ventura Water / Project No. 8703002
Water Demand Factor Study
April 8, 2020 – Final 17
➢ Between 2013 and 2018, the difference between the high demand year and the low
demand year was 22%.
➢ Between 2013 and 2018, the difference between the high demand year and the
average annual demand was 17%.
➢ Between 2013 and 2018, the difference between the high demand year for all
residential customers and the average annual demand for all residential customers
was 19%.
➢ Between 2013 and 2018, the median increase in water demand for the 158 non-
residential customers evaluated in this study between the high demand year and the
annual average year was 27%.
Based upon the analysis summarized above, it is recommended to apply a planning-level
contingency of 20% to the raw factor plus water loss to account for the annual demand
variations that are likely to occur.
D. Proposed Demand Factors
Based upon the description of the process detailed above, the proposed water demand
factors for Ventura Water are shown in Table 10. The details of the analysis for the multi-
family and non-residential customers used to determine the raw demand factors are
included in Appendices.
These demand factors will be used to calculate future demands for proposed development
projects and also to determine the Water Resources Net Zero Fee for developers. The
methodology by which these factors will be utilized to calculate estimated water demands
will be detailed in other City reports including the annual Comprehensive Water Resources
Report (CWRR) and in the Net Zero Administrative Policies and Procedures document.
Demand factors will be reviewed periodically (at least every 5 years) for consistency with
current demand patterns and will be updated as necessary.

City of Ventura – Ventura Water / Project No. 8703002
Water Demand Factor Study
April 8, 2020 – Final 18
Table 10
Proposed Demand Factors
Raw Factor (gpd)
Water
Loss Contingency Proposed Factor
(gpd) 7.0% 20%
Residential [1]
Single-Family 229.0 /du 16.0 49.0 294 /du
Multi-Family 163.0 /du 11.4 34.9 209 /du
Non-Residential [2]
Office 29.7 /ksf 2.1 6.4 38 /ksf
Medical/Dental Office 130.7 /ksf 9.1 28.0 168 /ksf
Assisted Living 70.8 /bed 4.9 15.1 91 /bed
Hotel (w/ restaurant) 134.2 /room 9.3 28.7 172 /room
Hotel/Motel (no restaurant) 104.2 /room 7.3 22.3 134 /room
Public & Institutional 52.6 /ksf 3.7 11.3 68 /ksf
School 15.4 /student 1.1 3.3 20 /student
Restaurant (sit-down) 524.6 /ksf 36.5 112.2 673 /ksf
Restaurant (fast-food) 677.9 /ksf 47.2 145.0 870 /ksf
Brewery 338.6 /ksf 23.6 72.4 435 /ksf
Bakery/Coffee Shop 116.4 /ksf 8.1 24.9 149 /ksf
Grocery Store 121.2 /ksf 8.4 25.9 156 /ksf
Multi-Tenant Commercial 120.8 /ksf 8.4 25.8 155 /ksf
Single-Use Commercial 81.9 /ksf 5.7 17.5 105 /ksf
Self-Storage 223.2 /acre 15.5 47.7 286 /acre
Church 71.7 /ksf 5.0 15.3 92 /ksf
Park/Golf Course 1,339.7 /acre 93.3 286.6 1,720 /acre
Gym (w/ pool) 165.6 /ksf 11.5 35.4 213 /ksf
Car Wash 841.8 /ksf 58.6 180.1 1,081 /ksf
Gas Station (w/ car wash) 1,824.4 /ksf 127.1 390.3 2,342 /ksf
Gas Station 198.5 /ksf 13.8 42.5 255 /ksf
[1] Based on actual water billing data from Years 2013-2018. See Appendix A for details.
[2] Based on actual water billing data from Years 2013-2018. See Appendix B for details.
gpd = gallons per day
du = dwelling unit
ksf = 1,000 square feet

City of Ventura – Ventura Water / Project No. 8703002
Water Demand Factor Study
April 8, 2020 – Final 19
APPENDICES

APPENDIX A
Multi‐Family Total Units by Year
Building & Safety
Remove SCC Homes
Remove Thomas Fire
HomesTotal SF Units
Building & Safety
Remove Thomas Fire
Apts
Total MF Units
2012 22,577 67 ‐ 22,510 2012 18,511 ‐ 18,511 2013 22,589 69 ‐ 22,520 2013 18,552 ‐ 18,552 2014 22,607 69 ‐ 22,538 2014 18,652 ‐ 18,652 2015 22,660 70 ‐ 22,590 2015 18,794 ‐ 18,794 2016 22,698 70 ‐ 22,628 2016 18,951 ‐ 18,951 2017 22,734 71 ‐ 22,663 2017 18,968 ‐ 18,968 2018 22,889 71 466 22,818 2018 19,041 56 18,985
Billing Data (HCF)
Remove SCC (HCF) [1]
Remove Thomas Fire
(HCF)
Add Assessment District (HCF)
[2]
Total Usage (HCF)
Total Usage (GPD)
Billing Data (HCF)
Remove Thomas Fire
(HCF)
Total Usage (HCF)
Total Usage (GPD)
2012 3,118,335 30,025 ‐ 28,001 3,116,311 6,386,303 2012 1,801,182 ‐ 1,801,182 3,691,189 2013 3,085,754 29,821 ‐ 30,871 3,086,804 6,325,834 2013 1,683,582 ‐ 1,683,582 3,450,190 2014 2,906,732 33,928 ‐ 29,174 2,901,978 5,947,067 2014 1,622,001 ‐ 1,622,001 3,323,991 2015 2,313,418 25,895 ‐ 18,188 2,305,711 4,725,128 2015 1,415,076 ‐ 1,415,076 2,899,937 2016 2,284,926 22,810 ‐ 18,482 2,280,598 4,673,664 2016 1,413,394 ‐ 1,413,394 2,896,490 2017 2,282,594 22,669 ‐ 19,383 2,279,308 4,671,020 2017 1,399,097 ‐ 1,399,097 2,867,191 2018 2,312,130 24,824 9,644 21,766 2,299,428 4,712,252 2018 1,421,340 191 1,421,149 2,912,382
Notes:Single‐Family Multi‐Family [1] Saticoy Country Club (SCC) homes and usage were removed since they are served by a separate water system.
2012 284 199 [2] Assessment District (SC 24) usage was added since this is irrigation water used for developments with common2013 281 186 areas.2014 264 1782015 209 1542016 207 1532017 206 1512018 207 153
Single‐Family Total Units by Year
Single‐Family Total Usage by Year Multi‐Family Total Usage by Year
Demand Factors (GPD/DU)

APPENDIX B
Land Use Category User (REDACTED) DU SF Bed Students Room Acres 2013 2014 2015 2016 2017 2018 Avg. 2013 2014 2015 2016 2017 2018 Avg. 2013 2014 2015 2016 2017 2018
Office Office 1 10,128 0.56 326 340 215 336 301 340 310 32.2 33.6 21.2 33.2 29.7 33.6 30.6 159 166 105 164 147 166Office 2 15,129 1.00 547 549 498 488 627 613 554 36.2 36.3 32.9 32.2 41.4 40.5 36.6 267 268 243 238 306 299Office 3 16,369 0.42 664 943 914 928 1025 742 869 40.6 57.6 55.8 56.7 62.6 45.3 53.1 324 460 446 453 500 362Multi-tenant Offices 1 39,146 1408 1781 1322 1590 1316 1611 1505 36.0 45.5 33.8 40.6 33.6 41.1 38.4 687 869 645 776 642 786Multi-tenant Offices 2 22,491 219 248 252 287 332 305 274 9.7 11.0 11.2 12.8 14.8 13.6 12.2 107 121 123 140 162 149Chiropractic Office 1,877 39 41 37 20 18 16 29 20.7 21.8 19.7 10.9 9.8 8.7 15.3 19 20 18 10 9 8Office and Massage 9,434 186 217 299 562 287 330 314 19.8 23.0 31.7 59.5 30.4 35.0 33.2 91 106 146 274 140 161Office 4 19,427 375 367 412 322 320 318 352 19.3 18.9 21.2 16.6 16.5 16.4 18.1 183 179 201 157 156 155
29.7Medical/Dental Office Medical Office 1 31,234 2.40 3691 2951 2326 2603 2451 2664 2781 118.2 94.5 74.5 83.3 78.5 85.3 89.0 1801 1440 1135 1270 1196 1300
Medical Office 2 11,661 594 580 600 611 711 742 640 51.0 49.7 51.5 52.4 61.0 63.6 54.9 290 283 293 298 347 362Medical Office 3 4,191 352 350 1100 404 338 371 486 84.1 83.6 262.6 96.3 80.7 88.5 116.0 172 171 537 197 165 181Medical and Dental Offices 1 3,224 262 205 217 244 242 246 236 81.4 63.6 67.4 75.6 75.0 76.3 73.2 128 100 106 119 118 120Medical and Dental Offices 2 3,188 592 750 736 832 687 666 710 185.8 235.3 230.8 261.0 215.3 208.9 222.8 289 366 359 406 335 325Dental Office 5,876 1510 1244 1338 1320 1348 1285 1341 257.0 211.7 227.7 224.6 229.5 218.7 228.2 737 607 653 644 658 627
130.7Hotel w/ dining Hotel w/ dining 1 235 36166 28701 27145 24952 22987 23196 27191 153.9 122.1 115.5 106.2 97.8 98.7 115.7 17648 14005 13246 12176 11217 11319
Hotel w/ dining 2 285 37607 33617 31203 32592 31184 18005 30701 132.0 118.0 109.5 114.4 109.4 63.2 107.7 18351 16404 15226 15904 15217 8786Hotel w/ dining 3 82 12105 12626 11693 11595 12296 12163 12080 147.6 154.0 142.6 141.4 149.9 148.3 147.3 5907 6161 5706 5658 6000 5935Hotel w/ dining 4 50 12029 10413 3654 9146 6257 5619 7853 240.6 208.3 73.1 182.9 125.1 112.4 157.1 5870 5081 1783 4463 3053 2742Hotel w/ dining 5 106 22223 22797 18155 18882 20710 21337 20684 209.6 215.1 171.3 178.1 195.4 201.3 195.1 10844 11124 8859 9214 10106 10412Hotel w/ dining 6 119 9251 11866 11482 10083 8999 7253 9822 77.7 99.7 96.5 84.7 75.6 60.9 82.5 4514 5790 5603 4920 4391 3539
134.2Hotel/Motel w/o dining Hotel/motel w/o dining 1 42 3461 3627 3681 3560 3519 4113 3660 82.4 86.4 87.6 84.8 83.8 97.9 87.1 1689 1770 1796 1737 1717 2007
Hotel/motel w/o dining 2 18 2420 2207 1662 2080 1535 2074 1996 134.5 122.6 92.3 115.6 85.3 115.2 110.9 1181 1077 811 1015 749 1012Hotel/motel w/o dining 3 200 18561 17405 17044 16563 17417 15946 17156 92.8 87.0 85.2 82.8 87.1 79.7 85.8 9057 8493 8317 8082 8499 7781Hotel/motel w/o dining 4 151 20698 19499 18054 13993 12427 13150 16304 137.1 129.1 119.6 92.7 82.3 87.1 108.0 10100 9515 8810 6828 6064 6417Hotel/motel w/o dining 5 37 4658 3781 3635 4586 5306 5525 4582 125.9 102.2 98.3 124.0 143.4 149.3 123.8 2273 1845 1774 2238 2589 2696Hotel/motel w/o dining 6 142 17870 17575 13325 15761 15874 12991 15566 125.8 123.8 93.8 111.0 111.8 91.5 109.6 8720 8576 6502 7691 7746 6339
104.2Public & Institutional Public & Institutional 1 10,300 2.08 689 486 795 465 488 666 598 66.9 47.2 77.2 45.2 47.4 64.7 58.1 336 237 388 227 238 325
Public & Institutional 2 52,931 1.33 3560 2762 996 1187 1215 1121 1807 67.3 52.2 18.8 22.4 23.0 21.2 34.1 1737 1348 486 579 593 547Public & Institutional 3 37,675 4443 2933 2750 2633 3357 3693 3301 117.9 77.8 73.0 69.9 89.1 98.0 87.6 2168 1431 1342 1285 1638 1802Fire Station 1 4,550 381 361 303 283 365 385 346 83.8 79.3 66.7 62.2 80.2 84.7 76.1 186 176 148 138 178 188Fire Station 2 3,725 117 107 86 90 102 105 101 31.4 28.6 23.1 24.2 27.5 28.1 27.1 57 52 42 44 50 51Fire Station 3 7,680 279 320 135 234 518 158 274 36.3 41.6 17.6 30.4 67.5 20.5 35.7 136 156 66 114 253 77Library 41,900 703 748 1867 3183 2578 1387 1744 16.8 17.9 44.6 76.0 61.5 33.1 41.6 343 365 911 1553 1258 677Public & Institutional 4 11,575 1041 975 828 449 416 475 697 89.9 84.3 71.5 38.8 35.9 41.1 60.3 508 476 404 219 203 232
52.6School College 11,727 88625 95152 29022 72681 50596 94131 71701 7.6 8.1 2.5 6.2 4.3 8.0 6.1 43246 46431 14162 35466 24689 45933
High School 1 1,715 35220 28502 19948 26321 19743 21838 25262 20.5 16.6 11.6 15.3 11.5 12.7 14.7 17186 13908 9734 12844 9634 10656High School 2 962 3554 4086 3658 4568 3545 4767 4030 3.7 4.2 3.8 4.7 3.7 5.0 4.2 1734 1994 1785 2229 1730 2326High School 3 1,980 31623 32100 19282 27112 21139 19934 25198 16.0 16.2 9.7 13.7 10.7 10.1 12.7 15431 15664 9409 13230 10315 9727Middle School 1 892 19026 22784 8054 11249 9849 9208 13362 21.3 25.5 9.0 12.6 11.0 10.3 15.0 9284 11118 3930 5489 4806 4493Middle School 2 887 17007 18350 10488 12226 10697 15401 14028 19.2 20.7 11.8 13.8 12.1 17.4 15.8 8299 8954 5118 5966 5220 7515Middle School 3 1,107 26379 21368 11318 12933 10017 10880 15483 23.8 19.3 10.2 11.7 9.0 9.8 14.0 12872 10427 5523 6311 4888 5309Elementary School 1 432 7808 8505 4404 6408 6252 4963 6390 18.1 19.7 10.2 14.8 14.5 11.5 14.8 3810 4150 2149 3127 3051 2422Elementary School 2 211 6732 6148 4750 5002 6293 5677 5767 31.9 29.1 22.5 23.7 29.8 26.9 27.3 3285 3000 2318 2441 3071 2770Elementary School 3 547 15048 10345 7468 11544 8591 13655 11108 27.5 18.9 13.7 21.1 15.7 25.0 20.3 7343 5048 3644 5633 4192 6663Elementary School 4 431 11050 10499 9140 8644 8179 14396 10318 25.6 24.4 21.2 20.1 19.0 33.4 23.9 5392 5123 4460 4218 3991 7025
15.4Assisted Living Assisted Living 1 55,910 60 10531 4556 4799 4799 2371 5088 5358 175.5 75.9 80.0 80.0 39.5 84.8 89.3 5139 2223 2342 2342 1157 2483
Assisted Living 2 10,450 54 2451 2586 2943 2428 2334 2791 2589 45.4 47.9 54.5 45.0 43.2 51.7 47.9 1196 1262 1436 1185 1139 1362Assisted Living 3 8,000 43 1902 1894 1967 1900 1982 2019 1944 44.2 44.0 45.8 44.2 46.1 46.9 45.2 928 924 960 927 967 985Assisted Living 4 15,120 49 1873 2068 1857 1551 1666 1820 1806 38.2 42.2 37.9 31.7 34.0 37.1 36.9 914 1009 906 757 813 888Assisted Living 5 69,600 100 7220 8320 7619 7876 8527 8162 7954 72.2 83.2 76.2 78.8 85.3 81.6 79.5 3523 4060 3718 3843 4161 3983Assisted Living 6 14,607 49 2902 3127 2410 2133 2371 1814 2460 59.2 63.8 49.2 43.5 48.4 37.0 50.2 1416 1526 1176 1041 1157 885Assisted Living 7 93,486 121 17925 18749 15481 15899 15577 14374 16334 148.1 155.0 127.9 131.4 128.7 118.8 135.0 8747 9149 7554 7758 7601 7014Assisted Living 8 139,050 313 32625 34922 33523 29102 27381 30996 31425 104.2 111.6 107.1 93.0 87.5 99.0 100.4 15920 17041 16358 14201 13361 15125Assisted Living 9 26,275 96 4549 4914 5310 4949 5785 5080 5098 47.4 51.2 55.3 51.6 60.3 52.9 53.1 2220 2398 2591 2415 2823 2479
70.8Brewery Brewery 1 13,820 2646 2685 4586 3306 191.4 194.3 331.9 239.2 1291 1310 2238
Brewery 2 4,357 1777 2631 2826 2411 407.8 603.9 648.6 553.4 867 1284 1379Brewery 3 5,599 912 1297 1105 162.9 231.7 197.3 445 633Brewery 4 5,312 2240 2390 1736 1721 1980 1553 1937 421.7 449.8 326.8 324.1 372.7 292.4 364.6 1093 1166 847 840 966 758
338.6
Restaurant (sit down) Restaurant (sit down) 1 3,750 1064 1312 1504 996 805 430 1019 283.6 349.7 401.1 265.6 214.8 114.8 271.6 519 640 734 486 393 210Restaurant (sit down) 2 2,340 650 650 658 904 678 785 721 277.6 277.6 281.1 386.2 289.9 335.4 308.0 317 317 321 441 331 383Restaurant (sit down) 3 10,199 4181 4535 4468 5078 4814 4746 4637 409.9 444.7 438.0 497.9 472.0 465.4 454.6 2040 2213 2180 2478 2349 2316Restaurant (sit down) 4 9,344 6119 6070 5943 7025 7404 6279 6473 654.9 649.6 636.0 751.8 792.4 672.0 692.8 2986 2962 2900 3428 3613 3064Restaurant (sit down) 5 4,612 2765 3060 3375 3609 3648 3941 3399 599.4 663.4 731.8 782.5 790.9 854.5 737.1 1349 1493 1647 1761 1780 1923Restaurant (sit down) 6 4,000 2910 3053 2535 3365 3480 2197 2923 727.5 763.4 633.8 841.2 869.9 549.2 730.8 1420 1490 1237 1642 1698 1072Restaurant (sit down) 7 5,902 2566 2344 1892 2025 2197 2164 2198 434.7 397.2 320.5 343.1 372.2 366.7 372.4 1252 1144 923 988 1072 1056Restaurant (sit down) 8 2,829 2025 2068 1764 1699 1523 1603 1780 715.7 730.9 623.7 600.5 538.2 566.5 629.3 988 1009 861 829 743 782
524.6Restaurant (fast food) Restaurant (fast food) 1 5,250 2687 2205 1832 1855 1853 1816 2041 511.7 420.0 349.0 353.3 352.9 345.8 388.8 1311 1076 894 905 904 886
Restaurant (fast food) 2 3,132 2201 2060 1963 2295 2213 1527 2043 702.7 657.6 626.8 732.8 706.7 487.5 652.4 1074 1005 958 1120 1080 745Restaurant (fast food) 3 3,275 1703 1906 1590 1490 1494 1344 1588 520.0 581.9 485.6 454.9 456.2 410.5 484.8 831 930 776 727 729 656Restaurant (fast food) 4 3,320 1523 1508 1260 1141 1023 984 1240 458.6 454.3 379.6 343.8 308.0 296.3 373.4 743 736 615 557 499 480Restaurant (fast food) 5 2,666 4808 5023 4806 5468 5593 4672 5061 1803.3 1884.0 1802.6 2050.9 2097.7 1752.6 1898.5 2346 2451 2345 2668 2729 2280Restaurant (fast food) 6 2,418 1652 2506 1293 1275 1457 1590 1629 683.1 1036.5 534.8 527.2 602.6 657.7 673.6 806 1223 631 622 711 776Restaurant (fast food) 7 2,955 2221 2014 1629 1410 1131 2519 1821 751.8 681.7 551.3 477.1 382.8 852.3 616.2 1084 983 795 688 552 1229Restaurant (fast food) 8 3,500 1039 1162 1271 1361 1207 1010 1175 296.9 332.0 363.0 388.8 344.9 288.7 335.7 507 567 620 664 589 493
677.9
Totals (HCF)Land Use Units Water Use (GPD) Raw Factor / Year (gpd/xx)
W:\Master Plans - 2020\Demand Factors\FinalReport v.5 March 24 WC\App B_Non-Residential Group_Feb2020 REDACTED 4/7/2020

APPENDIX B
Land Use Category User (REDACTED) DU SF Bed Students Room Acres 2013 2014 2015 2016 2017 2018 Avg. 2013 2014 2015 2016 2017 2018 Avg. 2013 2014 2015 2016 2017 2018
Totals (HCF)Land Use Units Water Use (GPD) Raw Factor / Year (gpd/xx)
Bakery/Coffee Shop Bakery 1 2,100 111 135 133 197 268 141 164 52.7 64.4 63.4 93.7 127.8 67.3 78.2 54 66 65 96 131 69Bakery/Coffee Shop 3,000 424 451 465 725 430 373 478 141.4 150.3 155.1 241.8 143.5 124.3 159.4 207 220 227 354 210 182Bakery 2 2,550 98 107 113 113 98 107 106 38.6 41.8 44.2 44.2 38.6 41.8 41.5 48 52 55 55 48 52Coffee Shop 1 2,100 807 643 611 693 650 758 694 384.5 306.4 290.8 329.8 309.3 361.1 330.3 394 314 298 338 317 370Coffee Shop 2 1,500 92 98 109 115 103 61.5 65.6 72.4 76.5 69.0 45 48 53 56Bakery 3 2,100 119 131 115 94 94 115 111 56.6 62.5 54.6 44.9 44.9 54.6 53.0 58 64 56 46 46 56Bakery 4 2,100 162 164 201 176 77.1 78.1 95.6 83.6 79 80 98
116.4
Grocery Store Grocery Store 1 23,000 1662 1986 2693 2295 2250 1469 2059 72.3 86.3 117.1 99.8 97.8 63.9 89.5 811 969 1314 1120 1098 717Grocery Store 2 42,655 6363 6707 5478 5943 6740 6298 6255 149.2 157.2 128.4 139.3 158.0 147.6 146.6 3105 3273 2673 2900 3289 3073Grocery Store 3 78,410 14714 17487 12282 16659 17186 9351 14613 187.7 223.0 156.6 212.5 219.2 119.3 186.4 7180 8533 5993 8129 8386 4563Grocery Store 4 8,232 363 346 342 402 447 449 391 44.1 42.1 41.6 48.8 54.3 54.5 47.5 177 169 167 196 218 219Grocery Store 5 46,507 6748 7853 8740 7355 9531 13099 8888 145.1 168.9 187.9 158.1 204.9 281.7 191.1 3293 3832 4265 3589 4651 6392Grocery Store 6 51,078 2426 2394 3191 4191 4445 2519 3194 47.5 46.9 62.5 82.0 87.0 49.3 62.5 1184 1168 1557 2045 2169 1229Grocery Store 7 15,236 2113 2027 1752 2025 1484 1988 1898 138.7 133.0 115.0 132.9 97.4 130.5 124.6 1031 989 855 988 724 970
121.2Multi-Tenant Commercial* Multi-tenant Commercial (w/ food) 1 13,978 844 906 1080 816 789 801 873 60.4 64.8 77.3 58.4 56.4 57.3 62.4 412 442 527 398 385 391
Multi-tenant Commercial (w/ food) 2 16,519 1795 1926 2717 3711 2197 2830 2530 108.7 116.6 164.5 224.7 133.0 171.3 153.1 876 940 1326 1811 1072 1381Multi-tenant Commercial (w/ food) 3 246,928 34961 31402 29951 27772 27307 26908 29717 141.6 127.2 121.3 112.5 110.6 109.0 120.3 17060 15323 14615 13552 13325 13130Multi-tenant Commercial (w/ food) 4 9,278 762 791 744 1195 676 1141 885 82.2 85.3 80.2 128.8 72.9 123.0 95.4 372 386 363 583 330 557Multi-tenant Commercial (w/ food) 5 14,248 3320 2760 2992 2963 2826 2383 2874 233.0 193.7 210.0 208.0 198.3 167.3 201.7 1620 1347 1460 1446 1379 1163Multi-tenant Commercial (w/ food) 6 62,354 7554 7953 7515 6550 6476 7794 7307 121.1 127.6 120.5 105.0 103.9 125.0 117.2 3686 3881 3667 3196 3160 3803Multi-tenant Commercial (w/ food) 7 9,701 1588 838 627 574 637 1303 928 163.7 86.4 64.6 59.1 65.7 134.4 95.7 775 409 306 280 311 636
120.8Single-Use Commercial Bike Shop 7,000 1137 1682 512 689 734 664 903 162.5 240.4 73.2 98.4 104.8 94.9 129.0 555 821 250 336 358 324
Drug Store 28,140 850 830 881 785 205 506 676 30.2 29.5 31.3 27.9 7.3 18.0 24.0 415 405 430 383 100 247Retail 1 37,430 7433 5890 6009 5925 3576 3529 5393 198.6 157.4 160.5 158.3 95.5 94.3 144.1 3627 2874 2932 2891 1745 1722Retail 2 46,455 2500 2801 2492 1406 1797 1230 2038 53.8 60.3 53.6 30.3 38.7 26.5 43.9 1220 1367 1216 686 877 600Auto Parts Retail 6,785 684 1098 1744 2308 1516 1059 1402 100.9 161.9 257.0 340.1 223.5 156.2 206.6 334 536 851 1126 740 517Thrift Store 12,075 115 322 148 117 139 90 155 9.5 26.6 12.2 9.7 11.5 7.5 12.8 56 157 72 57 68 44Retail 3 134,625 4468 6619 3248 4381 4595 4660 4662 33.2 49.2 24.1 32.5 34.1 34.6 34.6 2180 3230 1585 2138 2242 2274Retail 4 16,400 1221 1496 1621 918 1131 1412 1300 74.5 91.2 98.8 56.0 69.0 86.1 79.3 596 730 791 448 552 689Retail 5 30,000 701 740 668 840 508 588 674 23.4 24.7 22.3 28.0 16.9 19.6 22.5 342 361 326 410 248 287Retail 6 7,707 580 527 889 932 1287 1447 944 75.3 68.3 115.4 121.0 167.0 187.7 122.4 283 257 434 455 628 706
81.9Industrial Industrial 1 169,644 42988 47337 36060 31971 29797 34053 37035 253.4 279.0 212.6 188.5 175.6 200.7 218.3 20977 23099 17596 15601 14540 16617
Industrial 2 131,495 2734 2578 2449 2084 3502 2669 20.8 19.6 18.6 15.8 26.6 20.3 1334 1258 1195 1017 1709Industrial 3 97,238 114819 123365 136378 144456 149705 133046 133628 1180.8 1268.7 1402.5 1485.6 1539.6 1368.2 1374.2 56028 60198 66548 70490 73051 64922Industrial 4 25,795 4.29 4570 9652 3722 7876 6052 6548 6403 177.2 374.2 144.3 305.3 234.6 253.8 248.2 2230 4710 1816 3843 2953 3195Industrial 5 19,227 1.14 785 1100 1055 1234 687 609 912 40.8 57.2 54.9 64.2 35.7 31.7 47.4 383 537 515 602 335 297Industrial 6 71,864 1754 2047 1760 1627 1223 1103 1586 24.4 28.5 24.5 22.6 17.0 15.3 22.1 856 999 859 794 597 538Industrial 7 14,070 1023 1344 1340 1842 1900 2447 1649 72.7 95.5 95.3 130.9 135.0 173.9 117.2 499 656 654 899 927 1194Industrial 8 8,125 4228 3043 2443 2019 1654 1836 2537 520.3 374.6 300.7 248.4 203.5 226.0 312.3 2063 1485 1192 985 807 896Industrial 9 85,770 9515 9263 8583 10318 15378 16798 11643 110.9 108.0 100.1 120.3 179.3 195.9 135.7 4643 4520 4188 5035 7504 8197Industrial 10 14,690 20188 14571 13099 13064 10497 11734 13859 1374.3 991.9 891.7 889.3 714.5 798.8 943.4 9851 7110 6392 6375 5122 5726
343.9Self Storage Self-Storage 1 72,394 600 3.31 273 152 227 350 297 316 269 82.3 45.8 68.7 105.9 89.8 95.3 81.3 133 74 111 171 145 154
Self-Storage 2 61,265 3.04 633 598 514 260 303 328 440 208.3 196.8 169.2 85.6 99.8 107.9 144.6 309 292 251 127 148 160Self-Storage 3 545 2.66 404 326 416 277 240 316 330 151.8 122.5 156.4 104.0 90.1 118.6 123.9 197 159 203 135 117 154Self-Storage 4 671 4.05 2896 2201 1230 1045 1221 611 1534 715.0 543.4 303.6 258.1 301.6 150.8 378.7 1413 1074 600 510 596 298Self-Storage 5 697 3.05 1439 1580 1154 748 1082 820 1137 471.7 518.0 378.3 245.2 354.8 268.8 372.8 702 771 563 365 528 400Self-Storage 6 8.79 5095 2941 1297 646 609 1953 2090 579.6 334.6 147.6 73.4 69.2 222.2 237.8 2486 1435 633 315 297 953
223.2Church Church 1 60,320 3988 4322 3652 4062 4127 4496 4108 66.1 71.7 60.5 67.3 68.4 74.5 68.1 1946 2109 1782 1982 2014 2194
Church 2 27,375 1498 1473 1238 984 1521 1350 1344 54.7 53.8 45.2 35.9 55.5 49.3 49.1 731 719 604 480 742 659Church 3 75,120 2652 2361 1010 484 318 418 1207 35.3 31.4 13.4 6.4 4.2 5.6 16.1 1294 1152 493 236 155 204Church 4 33,300 1355 1289 1000 951 922 898 1069 40.7 38.7 30.0 28.6 27.7 27.0 32.1 661 629 488 464 450 438Church 5 18,950 742 449 279 562 361 680 512 39.1 23.7 14.7 29.6 19.0 35.9 27.0 362 219 136 274 176 332Church 6 11,500 1459 1049 768 824 605 1582 1048 126.9 91.2 66.8 71.6 52.6 137.6 91.1 712 512 375 402 295 772Church 7 16,175 4127 3617 2627 4174 5093 1562 3533 255.2 223.6 162.4 258.1 314.8 96.5 218.4 2014 1765 1282 2037 2485 762
71.7Park/Golf Course Park 1 3.58 5244 3545 2592 3242 3439 4092 3693 1464.9 990.3 724.1 905.6 960.5 1143.2 1031.4 2559 1730 1265 1582 1678 1997
Park 2 7.18 14665 10911 6517 8746 5209 9589 9273 2042.5 1519.6 907.6 1218.2 725.5 1335.5 1291.5 7156 5324 3180 4268 2542 4679Park 3 3.35 5183 3652 3236 2746 2172 2435 3237 1547.1 1090.1 965.9 819.7 648.4 726.7 966.3 2529 1782 1579 1340 1060 1188Park 4 30.33 32848 32555 33928 32924 30307 34691 32876 1083.0 1073.4 1118.6 1085.5 999.3 1143.8 1083.9 16029 15886 16556 16066 14789 16928Park 5 18.31 39900 36689 38474 36295 38757 36668 37797 2179.1 2003.8 2101.2 1982.3 2116.7 2002.6 2064.3 19470 17903 18774 17711 18912 17893Park 6 89.70 81255 79319 86430 80897 76081 81378 80893 905.9 884.3 963.5 901.9 848.2 907.2 901.8 39650 38705 42175 39475 37125 39710Park 7 4.99 12616 10523 6134 7810 9855 9238 9363 2528.2 2108.9 1229.2 1565.1 1975.0 1851.4 1876.3 6156 5135 2993 3811 4809 4508Park 8 4.99 5468 3476 4330 4043 4039 3066 4070 1095.7 696.5 867.8 810.3 809.5 614.4 815.7 2668 1696 2113 1973 1971 1496Park 9 7.11 9890 6318 6882 8697 8814 9369 8328 1391.0 888.6 967.9 1223.2 1239.7 1317.8 1171.4 4826 3083 3358 4244 4301 4572Golf Course 1 253.50 253754 275198 270850 276123 265214 265306 267741 1001.0 1085.6 1068.4 1089.2 1046.2 1046.6 1056.2 123824 134288 132166 134739 129416 129461Golf Course 2 92.00 213682 252676 231302 223320 220785 226140 227984 2322.6 2746.5 2514.2 2427.4 2399.8 2458.0 2478.1 104270 123298 112868 108973 107736 110349
1339.7Gyms w/ pools Gym w/ pool 1 114,625 11228 9421 9527 9855 8994 9638 9777 98.0 82.2 83.1 86.0 78.5 84.1 85.3 5479 4597 4649 4809 4389 4703
Gym w/ pool 2 23,000 7435 7736 5240 6154 6236 6285 6514 323.3 336.4 227.8 267.6 271.1 273.3 283.2 3628 3775 2557 3003 3043 3067Gym w/ pool 3 42,000 4972 5420 4812 5142 6015 5947 5385 118.4 129.1 114.6 122.4 143.2 141.6 128.2 2426 2645 2348 2509 2935 2902
165.6Car Wash (only) Car wash 1 1,462 0.18 1615 1082 1068 1215 1103 1062 1191 1104.6 740.1 730.3 831.2 754.1 726.1 814.4 788 528 521 593 538 518
Car wash 2 3,555 0.60 6361 7523 8175 8140 7859 7617 7613 1789.3 2116.2 2299.5 2289.7 2210.7 2142.7 2141.4 3104 3671 3989 3972 3835 3717Car wash 3 3,225 0.36 357 293 191 232 361 1096 421 110.6 90.9 59.1 71.8 111.8 340.0 130.7 174 143 93 113 176 535Car wash 4 6,050 0.19 1371 1516 1795 2096 1842 1564 1698 226.6 250.7 296.7 346.5 304.5 258.5 280.6 669 740 876 1023 899 763
841.8Gas Station w/ Car Wash Gas Station w/ Car Wash 1 9,973 1.16 8818 11650 9976 10564 11921 13062 10999 884.2 1168.2 1000.3 1059.3 1195.3 1309.8 1102.8 4303 5685 4868 5155 5817 6374
Gas Station w/ Car Wash 2 2,854 0.54 1793 1541 1908 2246 3285 2961 2289 628.3 540.0 668.5 787.0 1151.0 1037.6 802.1 875 752 931 1096 1603 1445Gas Station w/ Car Wash 3 1,377 0.72 758 762 646 1633 1685 1926 1235 550.7 553.6 468.8 1186.1 1223.3 1399.0 896.9 370 372 315 797 822 940Gas Station w/ Car Wash 4 3,125 1.66 5578 6502 5933 6738 6402 7068 6370 1785.0 2080.8 1898.5 2156.2 2048.7 2261.8 2038.5 2722 3173 2895 3288 3124 3449Gas Station w/ Car Wash 5 2,602 0.51 2769 4170 3705 3160 1496 3381 3114 1064.0 1602.8 1424.0 1214.5 574.9 1299.5 1196.6 1351 2035 1808 1542 730 1650Gas Station w/ Car Wash 6 1,157 0.51 5576 5810 6252 6453 4968 5023 5680 4819.5 5021.4 5404.0 5577.6 4293.5 4341.3 4909.6 2721 2835 3051 3149 2424 2451
Gas Station Gas Station 1 1,274 0.25 64 195 78 64 70 68 89 49.9 152.8 61.1 49.9 54.7 53.1 70.2 31 95 38 31 34 33Gas Station 2 3,517 0.60 1164 898 1326 2084 1603 1078 1359 331.0 255.2 377.0 592.6 455.7 306.5 386.3 568 438 647 1017 782 526Gas Station 3 644 0.23 74 94 33 23 27 31 47 114.6 146.4 50.9 35.0 41.4 47.7 72.7 36 46 16 11 13 15Gas Station 4 1,848 0.51 391 445 244 201 205 201 281 211.8 240.6 132.0 108.7 110.9 108.7 152.1 191 217 119 98 100 98Gas Station 5 1,595 0.49 617 469 453 400 371 398 451 386.7 294.2 283.9 250.5 232.6 249.3 282.9 301 229 221 195 181 194Gas Station 6 1,596 0.28 482 299 324 318 346 406 362 301.7 187.5 202.9 199.0 217.0 254.2 227.1 235 146 158 155 169 198
198.5
W:\Master Plans - 2020\Demand Factors\FinalReport v.5 March 24 WC\App B_Non-Residential Group_Feb2020 REDACTED 4/7/2020