water cycle review qs - westhampton beach … · which graph best represents the relationship...
TRANSCRIPT

Water Cycle Review Qs
1. Which sediment size would allow water to flow through at the fastest rate?(A) clay (C) sand(B) silt (D) pebbles
2. Which set of surface soil conditions on a hillside would result in the most infiltration of rainfall?(A) gentle slope, saturated soil, no vegetation(B) gentle slope, unsaturated soil, vegetation(C) steep slope, saturated soil, vegetation(D) steep slope, unsaturated soil, no vegetation
3. Which graph best represents the relationship between soil particle size and the rate at which water infiltrates permeable soil?
(A) (C)
(B) (D)
4. Which soil-property measurement usually is greater when particles are fine than when particles are coarse?(A) infiltration (C) porosity(B) capillarity (D) permeability rate
5. The upward movement of water through tiny spaces in soil or rock is called(A) water retention (C) porosity(B) capillary action (D) permeability
6. When rainfall occurs, the rainwater will most likely become surface runoff if the land surface is(A) sandy (C) covered with grass(B) impermeable (D) nearly flat

Water Cycle Review Qs7. Base your answer to the following question on the bedrock cross section below, which represents part of Earth’s crust
where natural gas, oil, and water have moved upward through a layer of folded sandstone and filled the pore spaces at the top of the sandstone layer.
The natural gas, oil, and water are trapped within the top of the sandstone and do not move upward through the shale because, compared to the sandstone, the shale has(A) lower permeability (B) less foliation (C) larger pore spaces (D) larger particles
8. The diagram below shows the result of leaving an empty, dry clay flowerpot in a full container of water for a period of time. The water level in the container dropped to level A. The top of the wet area moved to level B.
Level B is higher than level A because water(A) is less dense than the clay pot(B) is more dense than the clay pot(C) traveled upward in the clay pot by capillary
action(D) traveled downward in the clay pot by capillary
action
9. During a rainfall, surface runoff will probably be greatest in an area that has a(A) steep slope and a clay-covered surface(B) steep slope and a gravel-covered surface(C) gentle slope and a grass-covered surface(D) gentle slope and a tree-covered surface

Water Cycle Review QsBase your answers to questions 10 and 11 on the diagram below. Columns A, B, C, and D are partially filled with different sediments. Within each column, the sediment is uniform in size. A fine wire mesh screen covers the bottom of each column to prevent the sediment from falling out. The lower part of each column has just been placed in a beaker of water. Sediment sizes are not drawn to scale.
10. In an experiment, the beakers of water were removed and replaced with empty beakers. The sediments were allowed to dry. Then water was poured into each column to compare the permeability of the sediments. The permeability rate of the medium sand sample was shown to be(A) less than the silt and pebble samples(B) less than the silt sample but more than the pebble sample(C) greater than the silt sample but less than the pebble sample(D) greater than the silt and pebble samples
11. In which sediment will capillary action cause the water from the beaker to rise fastest in the column?(A) small pebbles (B) large sand (C) medium sand (D) large silt
12. High concentrations of anaerobic bacteria (biologic water pollutants) are often caused by a decrease in the(A) temperature of ground water(B) growth of aerobic bacteria in the water(C) amount of organic wastes in the water(D) amount of oxygen dissolved in the water
13. What is the main reason that a high concentration of aerobic bacteria is harmful to a lake?(A) The bacteria release large amounts of oxygen.(B) The bacteria use up large amounts of oxygen.(C) The bacteria cause excessive cooling of the
water.(D) The bacteria provide food for predators.
14. As surface runoff in a region increases, stream discharge in that region will usually(A) decrease (C) remain the same(B) increase

Water Cycle Review Qs15. During a heavy rainstorm, soil samples A and B both became saturated with water. However, 10 minutes after the storm
ended, the soils appeared as shown below.
Which statement best explains the observed change in the water content of the soil samples?(A) The permeability of B is greater than the permeability of A.(B) The porosity of B is greater than the porosity of A.(C) The capillarity of B is greater than the capillarity of A.(D) The surface runoff at B is greater than the surface runoff at A.
16. Base your answer to the following question on the diagram below, which represents samples of soil and bedrock at Earth's surface. The arrows represent possible infiltration of rainwater.
The pebble-and-sand soil has greater capillarity than the pebble soil because the pebble and sand soil(A) is weathering more rapidly(B) is more loosely packed(C) has smaller pore spaces(D) has less surface area
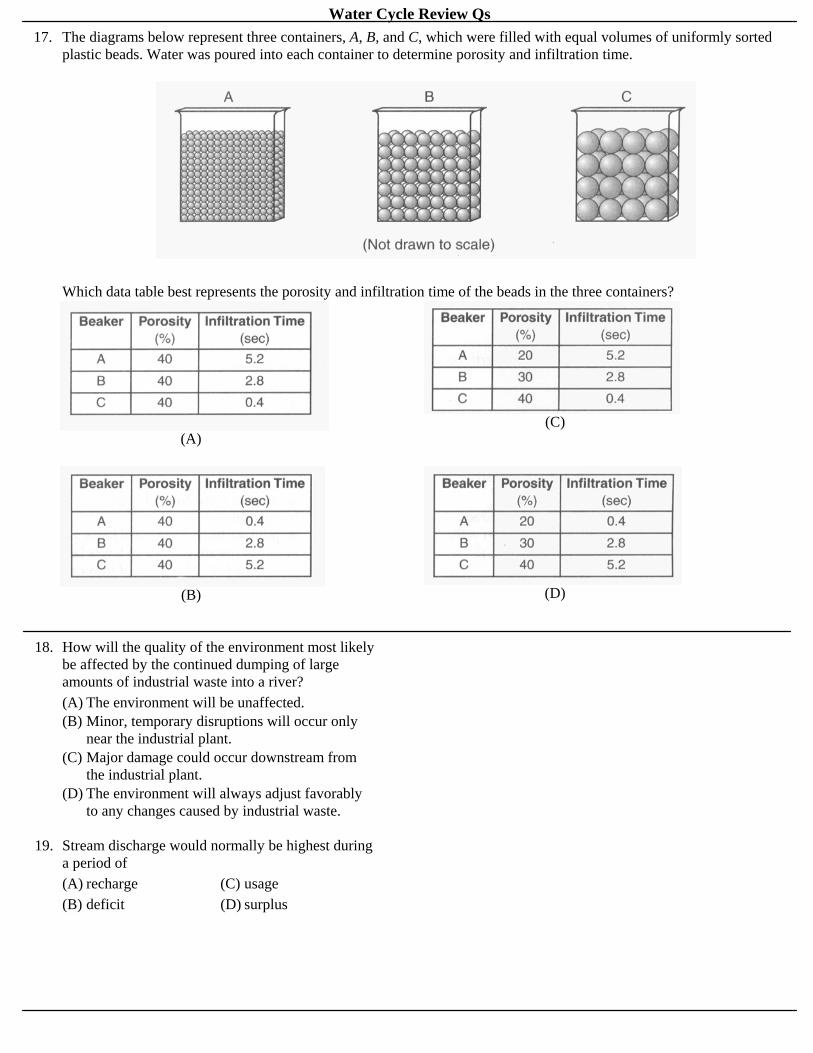
Water Cycle Review Qs17. The diagrams below represent three containers, A, B, and C, which were filled with equal volumes of uniformly sorted
plastic beads. Water was poured into each container to determine porosity and infiltration time.
Which data table best represents the porosity and infiltration time of the beads in the three containers?
(A) (C)
(B) (D)
18. How will the quality of the environment most likely be affected by the continued dumping of large amounts of industrial waste into a river?(A) The environment will be unaffected.(B) Minor, temporary disruptions will occur only
near the industrial plant.(C) Major damage could occur downstream from
the industrial plant.(D) The environment will always adjust favorably
to any changes caused by industrial waste.
19. Stream discharge would normally be highest during a period of(A) recharge (C) usage(B) deficit (D) surplus

Water Cycle Review Qs20. The diagram below shows tubes A and B partly filled with equal volumes of round plastic beads of uniform size. The
beads in tube A are smaller than the beads in tube B. Water was placed in tube A until the pore spaces were filled. The drain valve was then opened, and the amount of time for the water to drain from the tube was recorded. The amount of water that remained around the beads was then calculated and recorded. Data table 1 shows the measurements recorded using tube A.
If the same procedure was followed with tube B, which data table shows the measurements most likely recorded?
(A) (C)
(B) (D)
21. During a 3-week period without rain in June, water continued to flow in a small Maryland stream. The water in the stream most likely came from(A) the roots of trees along the stream bank(B) evapotranspiration in a region far away and
unaffected by the dry period(C) ground water flowing into the streambed(D) condensation on the surface of rocks in the
stream

Water Cycle Review Qs22. A student performed a laboratory activity in which water was poured slowly into four cups containing equal volumes of
loosely packed sediment samples, as shown in the diagram below. All particles were spherical in shape and uniform in size within a container. After the water level reached the surface of each sample, the student determined the amount of water that had been added.
The results of the activity should have indicated that approximately equal amounts of water were added to the cups of(A) silt and pebbles, only (C) pebbles and the mixture, only(B) sand, silt, and pebbles, only (D) sand, pebbles, and the mixture, only
23. According to the diagram below, at which location would the water probably be most polluted?
(A) A (C) C(B) B (D) D
24. An area with a high potential for evapotranspiration has little actual evapotranspiration and precipitation. The climate of this area is best described as(A) hot and arid (C) cold and arid(B) hot and humid (D) cold and humid

Water Cycle Review QsBase your answers to questions 25 and 26 on the cross section below, which represents part of Earth’s water cycle. Letters A, B, C, and D represent processes that occur during the cycle. The level of the water table and the extent of the zone of saturation are shown.
25. What are two water cycle processes not represented by arrows in this cross section?(A) transpiration and condensation (C) precipitation and freezing(B) evaporation and melting (D) runoff and infiltration
26. Which two letters represent processes in the water cycle that usually cause a lowering of the water table?(A) A and B (B) A and C (C) B and D (D) C and D
27. The table below shows the relationship between total yearly precipitation (P) and potential evapotranspiration (EP) for different types of climates.
The total yearly precipitation (P) for a city in Texas is 218 millimeters. The total yearly potential evapotranspiration (EP) is 951 millimeters. Which type of climate does this city have?(A) humid (C) semiarid(B) subhumid (D) arid

Water Cycle Review Qs28. Which graph best represents the relationship
between surface-water runoff and stream discharge?(A)
(B)
(C)
(D)

Water Cycle Review QsBase your answers to questions 29 and 30 on the diagram and field map below. The diagram shows an underground gasoline storage tank at a service station that is leaking gasoline into the soil. Ground-water monitoring wells were drilled to show the pattern of the leakage. The concentration of gasoline, in parts per million, at each well is indicated on the field map.
29. The gasoline that leaked from the underground tank is considered a pollutant because the gasoline(A) floats on the water table (C) reacts chemically with minerals in the soil(B) destroys nonliving organic substances (D) harms living things
30. Which statement best describes the pollution field’s size and concentration measurement if the gasoline continues to leak out of the tank?(A) The size of the pollution field will decrease, and the concentration measurement will decrease.(B) The size of the pollution field will decrease, and the concentration measurement will increase(C) The size of the pollution field will increase, and the concentration measurement will decrease.(D) The size of the pollution field will increase, and the concentration measurement will increase.
31. Two locations, one in northern Canada and one in the southwestern United States, receive the same amount of precipitation each year. The location in Canada is classified as a humid climate. Why would the location in the United States be classified as an arid climate?(A) The yearly distribution of precipitation is
different.(B) The soil-moisture storage in the southwestern
United States is more than that in northern Canada.
(C) The potential evapotranspiration is greater in the southwestern United States than in northern Canada.
(D) The vegetation of the southwestern United States is different from that of northern Canada.

Water Cycle Review Qs32. The maps show changes occurring around a small Louisiana lake over a 30-year period.
Which graph best shows the probable changes in the quality of ground water and lake water in this region as the changes indicated in the maps took place from 1967 to 1997? (Use the key above.)
(A) (B) (C) (D)

Water Cycle Review QsBase your answers to questions 33 and 34 on the two graphs below, which show the relationship between the amount of rainfall during a storm and the amount of discharge into a nearby stream. Letter A represents the time when approximately 50% of the precipitation from the storm has fallen. Letter B represents the time when peak runoff from the storm is flowing into the stream. The delay is the difference in time between letters A and B on the graph. Graph I shows data before urbanization in an area. Graph II shows data after urbanization in the same area.
33. How did urbanization affect delay time between points A and B and the maximum stream discharge?(A) The delay time decreased, and the maximum discharge decreased.(B) The delay time decreased, and the maximum discharge increased.(C) The delay time increased, and the maximum discharge decreased.(D) The delay time increased, and the maximum discharge increased.
34. The delay time between points A and B on both graphs is due mainly to the time needed for(A) groundwater to evaporate (C) green plants to absorb precipitation(B) precipitation water to move into the streams (D) rainfall rate to decrease
35. The photograph below shows a sign near the Esopus Creek in Kingston, New York.
The main purpose of the word “watershed” on this sign is to communicate that the Esopus Creek(A) is a tributary of the Hudson River (C) forms a delta in the Hudson River(B) is a flood hazard where it flows into the Hudson River (D) contains ancient fish fossils

Water Cycle Review Qs36. Base your answer to the following question on the water budget data and climate classification below. Table 1 shows
water budget data for a location in New Jersey, and table 2 describes climate types. All data are expressed in millimeters of water.
Stream discharge at this location would probably be greatest during(A) April (B) May (C) August (D) September
Base your answers to questions 37 and 38 on the data table below and on your knowledge of Earth science. The data table shows the average monthly discharge, in cubic feet per second, for a stream in New York State.
37. Explain one possible reason why this stream’s discharge in April is usually greater than this stream’s discharge in January.
38. State the relationship between this stream’s discharge and the amount of suspended sediment that can be carried by this stream.
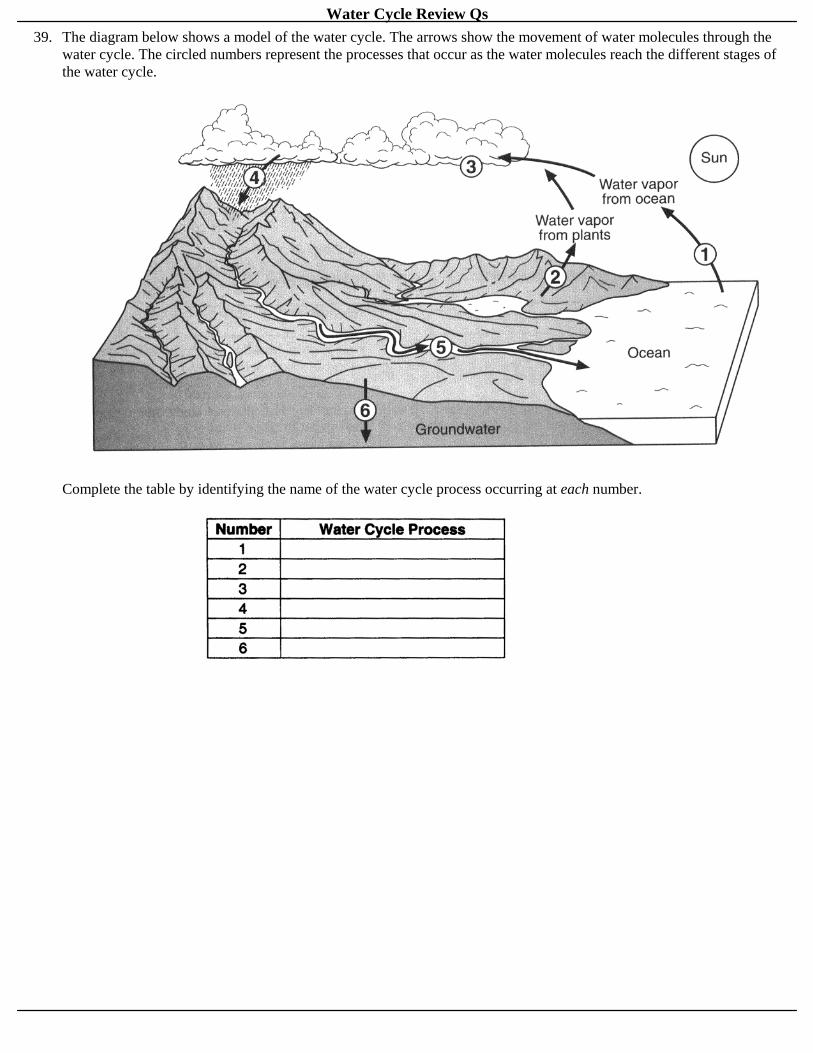
Water Cycle Review Qs39. The diagram below shows a model of the water cycle. The arrows show the movement of water molecules through the
water cycle. The circled numbers represent the processes that occur as the water molecules reach the different stages of the water cycle.
Complete the table by identifying the name of the water cycle process occurring at each number.
Water Cycle Review QsAnswer Key
Water Cycle Review QsAnswer Key
1. D
2. B
3. D
4. B
5. B
6. B
7. A
8. C
9. A
10. C
11. D
12. D
13. B
14. B
15. A
16. C
17. A
18. C
19. D
20. A
21. C
22. B
23. D
24. A
25. D
26. A
27. D
28. B
29. D
30. D
31. C
32. B
33. B
34. B
35. A
36. A
37. Examples: — Snowmelt in April results in a greater discharge. — greater rainfall in April — Saturated ground would cause more runoff in April.
38. Examples: — As stream discharge increases, suspended sediment increases. — There is a direct relationship between stream discharge and suspended sediment.
39.