water curtain behaviour in building drainage systems · water curtain behaviour in building...
TRANSCRIPT
Water Curtain Behaviour in Building Drainage Systems L. JACK [email protected] School of the Built Environment, Heriot-Watt University, Edinburgh, Scotland Abstract It is known that the behaviour of the water curtain formed at the base of a vertical stack within a building drainage system may be characterised as unsteady and oscillatory where the determinants that affect the corresponding generation of positive air pressure transients depend on a number of both fixed and variable factors. Previous research has postulated the frequency of oscillation of this naturally-forming water curtain, however, a comprehensive analysis of the flow conditions contributing to, and arising from, this phenomenon has so far not been discussed. This paper presents empirical data that allows for a full analysis of the water curtain characteristics established at the stack base when viewed within the context of varying discharge flow rates. It examines the development and progression of curtain behaviour and changes in this with imposed water flow rate. The paper confirms the presence of oscillatory behaviour and suggests that this exhibits overlapping characteristics. It also highlights the percentage coverage by the water curtain under different flow conditions, and in particular, identifies a clear reduction in coverage with an increase in discharge flow rate.
Keywords Building drainage, ventilation, water curtain behaviour, air pressure 1. Introduction The need to protect the habitable space from the miasma present within the pipework of any building drainage system is well-recognised, and most design codes offer clear advice on how networks should be configured in order to avoid pressure fluctuations that might jeopardise the integrity of the water-based trap seal[1]. Much of this guidance is, however, focussed on protecting trap seals from negative pressures. This is understandable as negative pressures typically prevail, irrespective of the type of system
CIBW062 Symposium 2013
1

used or its particular design characteristics. Despite this, it is crucial that the occurrence of positive pressures, particularly those that may be described as transient rather than steady state, are also recognised and understood. Positive pressures are most commonly generated at the base of the vertical stack, and occasionally where there is a change in direction of the pipework or where an impediment to the flow of entrained air occurs. They are known to be problematic, and most commonly arise where the system loading, in some cases due to high-density occupation, results in temporary surcharge of the receiving underground system. Previous research has also shown that the water curtain that forms naturally at the base of the vertical stack, as water makes the transition from the vertical to horizontal pipework, also creates positive pressures within the system[2]. It is for this reason that further investigations into the flow characteristics displayed at the stack base, and in the initial stages of transition from annular to free-surface flow in the receiving pipework, are important. It is worth noting that the determinants, characteristics and simulation of positive air pressure transients are generally less-well understood than those for negative pressures; in the main due to a lack of robust empirical data given the relative inaccessibility of the lower region of the stack. This paper will present the findings of laboratory investigations aimed at enhancing knowledge in the field by characterising the behaviour of the water curtain, and linking this to salient flow conditions. It also discusses a previous hypothesis that indicated a consistent frequency of oscillation of the water curtain linked to the propagation of positive air pressure transients[3]. 2. Basis for numerical simulation of air pressure transients There are many benefits to better understanding the flow characteristics exhibited by the water curtain at the base of the stack, and how these influence the generation and propagation of positive air pressure transients. In particular, there appears to be growing recognition by consultants and designers of the potential for system surcharge and trap seal loss on lower storeys of tall buildings. Additionally, it is anticipated that enhanced knowledge on, in particular, the system parameters that either introduce or exacerbate such pressures will enable a more proactive design solution to be implemented. It is recognised, however, that the transient nature of these pressures and the way in which their propagation influences the wider network, dictates the requirement for a more rigorous examination of impact facilitated by numerical simulation. The remainder of this section hence focuses on the representation of flow conditions at the base of the stack, and the influence of positive air pressure transient propagation, as set within the context of development of Heriot-Watt’s numerical simulation model AIRNET. The research techniques applied within the AIRNET model are well-documented; with the collective range of publications illustrating the application of the commonly-accepted Method of Characteristics-based finite difference approach, coupled with the definition of empirically-derived boundary conditions, to the solution of the governing equations of continuity and momentum (equations 1 and 2) descriptive of the flows within building drainage networks.
CIBW062 Symposium 2013
2
txu
xu
(1)
02
4
Dufu
tu
xuu
xp
(2)
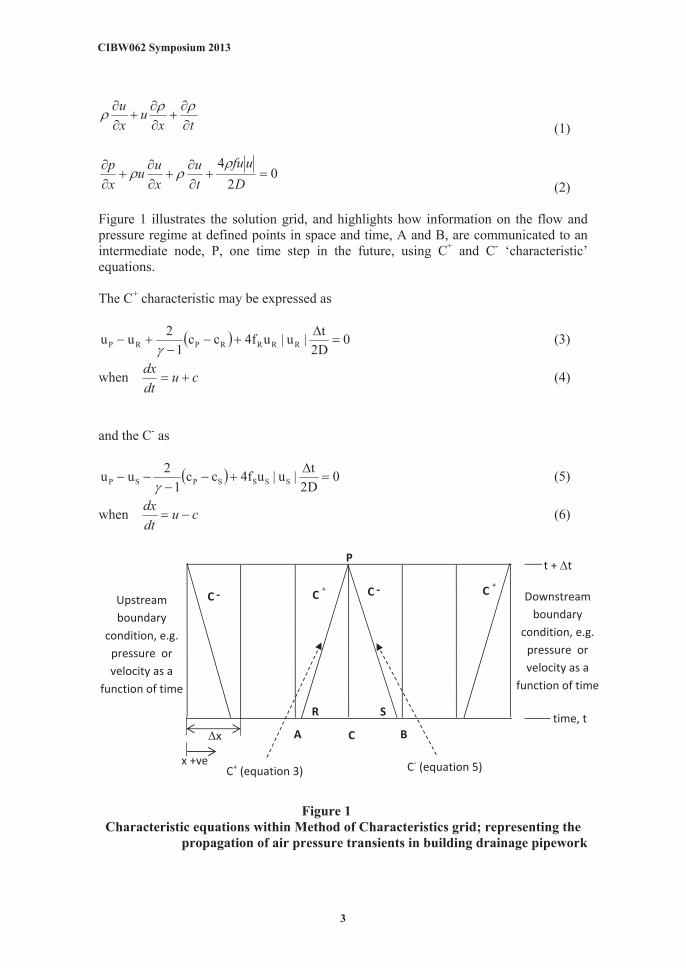
Figure 1 illustrates the solution grid, and highlights how information on the flow and pressure regime at defined points in space and time, A and B, are communicated to an intermediate node, P, one time step in the future, using C+ and C- ‘characteristic’ equations. The C+ characteristic may be expressed as
0D2t|u|uf4cc
12uu RRRRPRP
(3)
when cudtdx
(4)
and the C- as
0D2t|u|uf4cc
12uu SSSSPSP
(5)
when cudtdx
(6)
Figure 1
Characteristic equations within Method of Characteristics grid; representing the propagation of air pressure transients in building drainage pipework
x +ve C- (equation 5)C+ (equation 3)
- C C +
time, t
-C C +
P
SR
A C B
t + t
x
Upstream boundary
condition, e.g. pressure or velocity as a
function of time
Downstream boundary
condition, e.g. pressure or velocity as a
function of time
CIBW062 Symposium 2013
3
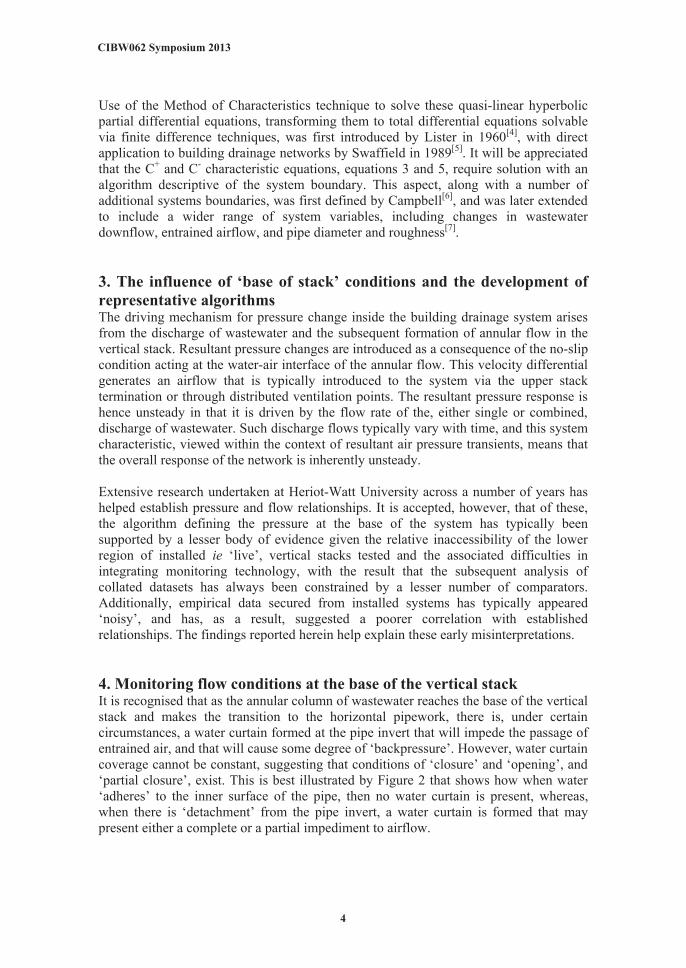
Use of the Method of Characteristics technique to solve these quasi-linear hyperbolic partial differential equations, transforming them to total differential equations solvable via finite difference techniques, was first introduced by Lister in 1960[4], with direct application to building drainage networks by Swaffield in 1989[5]. It will be appreciated that the C+ and C- characteristic equations, equations 3 and 5, require solution with an algorithm descriptive of the system boundary. This aspect, along with a number of additional systems boundaries, was first defined by Campbell[6], and was later extended to include a wider range of system variables, including changes in wastewater downflow, entrained airflow, and pipe diameter and roughness[7]. 3. The influence of ‘base of stack’ conditions and the development of representative algorithms The driving mechanism for pressure change inside the building drainage system arises from the discharge of wastewater and the subsequent formation of annular flow in the vertical stack. Resultant pressure changes are introduced as a consequence of the no-slip condition acting at the water-air interface of the annular flow. This velocity differential generates an airflow that is typically introduced to the system via the upper stack termination or through distributed ventilation points. The resultant pressure response is hence unsteady in that it is driven by the flow rate of the, either single or combined, discharge of wastewater. Such discharge flows typically vary with time, and this system characteristic, viewed within the context of resultant air pressure transients, means that the overall response of the network is inherently unsteady. Extensive research undertaken at Heriot-Watt University across a number of years has helped establish pressure and flow relationships. It is accepted, however, that of these, the algorithm defining the pressure at the base of the system has typically been supported by a lesser body of evidence given the relative inaccessibility of the lower region of installed ie ‘live’, vertical stacks tested and the associated difficulties in integrating monitoring technology, with the result that the subsequent analysis of collated datasets has always been constrained by a lesser number of comparators. Additionally, empirical data secured from installed systems has typically appeared ‘noisy’, and has, as a result, suggested a poorer correlation with established relationships. The findings reported herein help explain these early misinterpretations. 4. Monitoring flow conditions at the base of the vertical stack It is recognised that as the annular column of wastewater reaches the base of the vertical stack and makes the transition to the horizontal pipework, there is, under certain circumstances, a water curtain formed at the pipe invert that will impede the passage of entrained air, and that will cause some degree of ‘backpressure’. However, water curtain coverage cannot be constant, suggesting that conditions of ‘closure’ and ‘opening’, and ‘partial closure’, exist. This is best illustrated by Figure 2 that shows how when water ‘adheres’ to the inner surface of the pipe, then no water curtain is present, whereas, when there is ‘detachment’ from the pipe invert, a water curtain is formed that may present either a complete or a partial impediment to airflow.
CIBW062 Symposium 2013
4

Early studies, based on an analysis of 25Hz digital images of the water curtain, showed that any one of these three conditions ie closure, opening or partial blockage, may exist even when the downflow in the vertical stack is held at a steady rate[8]. Although it is more likely that flow ‘detachment’, and hence partial or complete stoppage of air, will occur when the rate of water downflow is larger, it was clear from these early studies that the water curtain displays oscillatory behaviour and that the measured frequency of ‘complete closure’ does not vary significantly. This frequency was initially measured at between 3.62 and 4.75Hz; spanning water flow-rates 0.5-1.5 litres/second[8], although it is recognised that results for higher discharge flow rates may have been less accurate at the margins given the impact of splashing and turbulent flow on the analysis of digital images. Related research undertaken by Filsell[9] later proposed an oscillatory frequency of between 4 and 5Hz. This behaviour was attributed to the presence of roll waves in the vertical stack. Roll waves are known to develop in narrow channels and spillways of sufficient slope and limited roughness, despite the imposition of a steady inflow[9-12]. Filsell identified a link between the occurrence of the water curtain formed at the stack base with the propagation of a roll wave ‘peak’ travelling downwards through the stack[9]. The oscillatory rate of the water curtain was found by Filsell to apply across the range of water and entrained air flow rates typically found within building drainage systems, thus broadly verifying earlier findings using less sophisticated equipment. An examination of the timeframe over which the passage of entrained air is halted confirms a link with the generation of positive air pressure transients. It is known that if an impediment to airflow occurs within a timescale that is less than one pipe period, this results in a Joukowsky-defined pressure change. Thus, it was hypothesised that the water curtain ‘closure’ identified in these early studies[8] and shown to have frequency of around 4-5Hz[9] will generate an associated positive air pressure transient. These transients travel through the drainage ventilation network until they reach a point of local pressure relief or attenuation, and hence have the potential to affect all connected
Figure 2a Water flow ‘adheres’ to the internal
surface of the pipe invert
Figure 2b Water flow detaches from the
pipe invert
entrained airflow
no separation of water downflow from pipe
inner radius
entrained airflow
water downflow
point of separation of water downflow from
pipe inner radius
water curtain transient
propagated from curtain
CIBW062 Symposium 2013
5
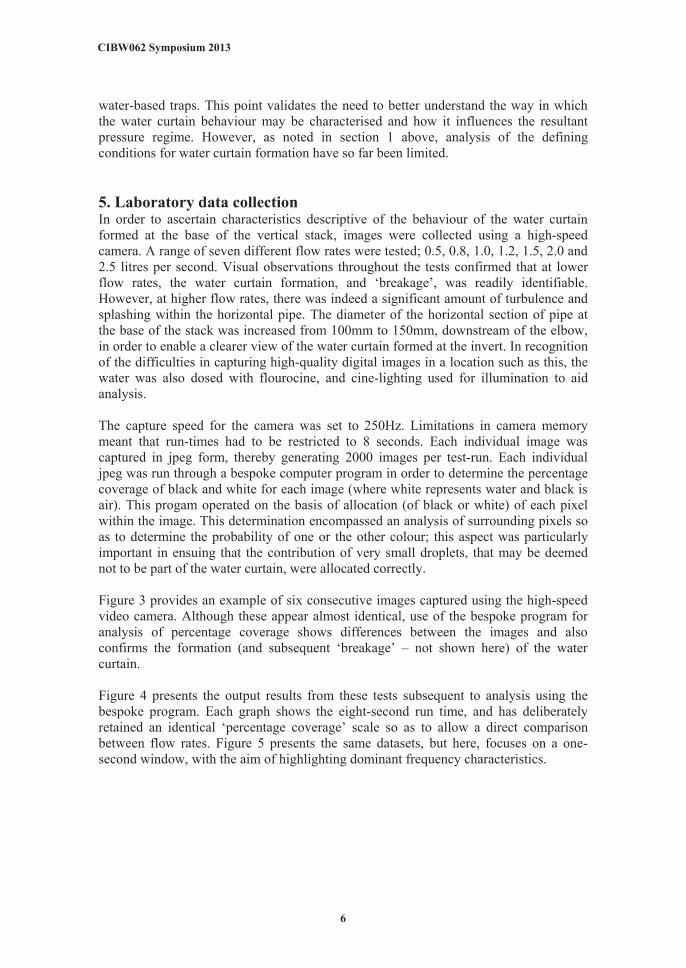
water-based traps. This point validates the need to better understand the way in which the water curtain behaviour may be characterised and how it influences the resultant pressure regime. However, as noted in section 1 above, analysis of the defining conditions for water curtain formation have so far been limited. 5. Laboratory data collection In order to ascertain characteristics descriptive of the behaviour of the water curtain formed at the base of the vertical stack, images were collected using a high-speed camera. A range of seven different flow rates were tested; 0.5, 0.8, 1.0, 1.2, 1.5, 2.0 and 2.5 litres per second. Visual observations throughout the tests confirmed that at lower flow rates, the water curtain formation, and ‘breakage’, was readily identifiable. However, at higher flow rates, there was indeed a significant amount of turbulence and splashing within the horizontal pipe. The diameter of the horizontal section of pipe at the base of the stack was increased from 100mm to 150mm, downstream of the elbow, in order to enable a clearer view of the water curtain formed at the invert. In recognition of the difficulties in capturing high-quality digital images in a location such as this, the water was also dosed with flourocine, and cine-lighting used for illumination to aid analysis. The capture speed for the camera was set to 250Hz. Limitations in camera memory meant that run-times had to be restricted to 8 seconds. Each individual image was captured in jpeg form, thereby generating 2000 images per test-run. Each individual jpeg was run through a bespoke computer program in order to determine the percentage coverage of black and white for each image (where white represents water and black is air). This progam operated on the basis of allocation (of black or white) of each pixel within the image. This determination encompassed an analysis of surrounding pixels so as to determine the probability of one or the other colour; this aspect was particularly important in ensuing that the contribution of very small droplets, that may be deemed not to be part of the water curtain, were allocated correctly. Figure 3 provides an example of six consecutive images captured using the high-speed video camera. Although these appear almost identical, use of the bespoke program for analysis of percentage coverage shows differences between the images and also confirms the formation (and subsequent ‘breakage’ – not shown here) of the water curtain. Figure 4 presents the output results from these tests subsequent to analysis using the bespoke program. Each graph shows the eight-second run time, and has deliberately retained an identical ‘percentage coverage’ scale so as to allow a direct comparison between flow rates. Figure 5 presents the same datasets, but here, focuses on a one-second window, with the aim of highlighting dominant frequency characteristics.
CIBW062 Symposium 2013
6

Figure 3 Sample images from high-speed camera 6. Discussion It can clearly be seen that from Figures 4 and 5 that the water curtain formed at the base of the vertical stack may be described as exhibiting cyclical or oscillatory behaviour. This is, of course, intuitively correct and can be ascertained from visual observations alone. However, Figures 4 and 5 also show a distinct shift in the percentage coverage with water flow rate, where an inverse relationship is found to apply. Visual observations suggest this is correct, as the conveyance of the flow appears smoother with a more complete curtain formed at lower flow rates; an aspect of the transition from the vertical to horizontal pipe that is deemed to be attributed to surface tension effects. Importantly, it can also been seen in Figure 4, but more so in Figure 5, that the identification of a dominant frequency is less straightforward than has been proposed in previous publications. Preliminary analysis suggests that two frequency characteristics may be identified. Firstly, that which determines the formation and ‘breakage’ of the water curtain and that is determined mainly through surface tension and laminar/turbulent flow effects and secondly, that which may be influenced by the presence of roll waves in the vertical stack. It is proposed that this secondary oscillation is more strongly related to the discharge flow rate than has been suggested by previous research. It is further hypothesised that the swirl component established within the annular flow in the stack is a significant contributor to the behaviour characteristics of the water curtain and that further research is required in order to define all influencing factors.
CIBW062 Symposium 2013
7
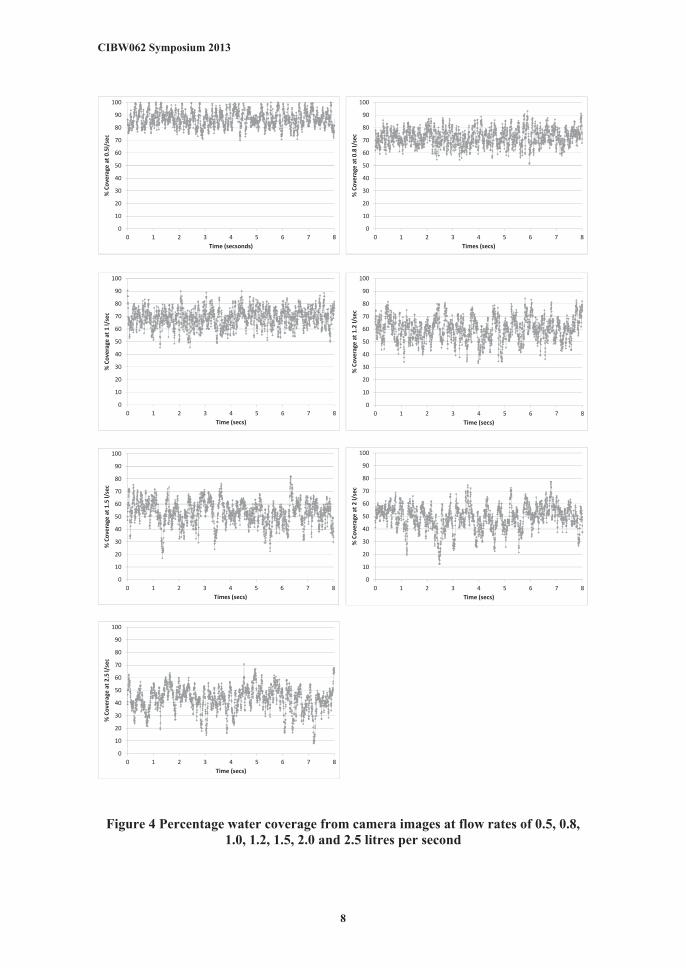
Figure 4 Percentage water coverage from camera images at flow rates of 0.5, 0.8,
1.0, 1.2, 1.5, 2.0 and 2.5 litres per second
0
10
20
30
40
50
60
70
80
90
100
0 1 2 3 4 5 6 7 8
% C
over
age
at 0
.5l/
sec
Time (secsonds)
0
10
20
30
40
50
60
70
80
90
100
0 1 2 3 4 5 6 7 8
% C
over
age
at 0
.8 l/
sec
Times (secs)
0
10
20
30
40
50
60
70
80
90
100
0 1 2 3 4 5 6 7 8
% C
over
age
at 1
l/se
c
Time (secs)
0
10
20
30
40
50
60
70
80
90
100
0 1 2 3 4 5 6 7 8
% C
over
age
at 1
.2 l/
sec
Time (secs)
0
10
20
30
40
50
60
70
80
90
100
0 1 2 3 4 5 6 7 8
% C
over
age
at 1
.5 l/
sec
Times (secs)
0
10
20
30
40
50
60
70
80
90
100
0 1 2 3 4 5 6 7 8
% C
over
age
at 2
l/se
c
Time (secs)
0
10
20
30
40
50
60
70
80
90
100
0 1 2 3 4 5 6 7 8
% C
over
age
at 2
.5 l/
sec
Time (secs)
CIBW062 Symposium 2013
8
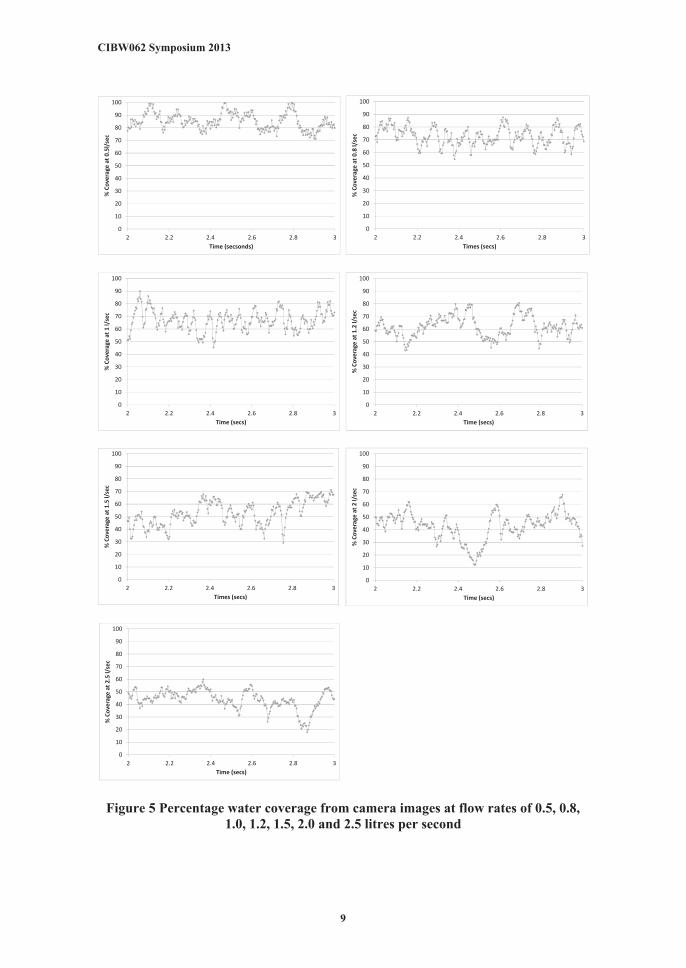
Figure 5 Percentage water coverage from camera images at flow rates of 0.5, 0.8, 1.0, 1.2, 1.5, 2.0 and 2.5 litres per second
0
10
20
30
40
50
60
70
80
90
100
2 2.2 2.4 2.6 2.8 3
% C
over
age
at 0
.5l/
sec
Time (secsonds)
0
10
20
30
40
50
60
70
80
90
100
2 2.2 2.4 2.6 2.8 3
% C
over
age
at 0
.8 l/
sec
Times (secs)
0
10
20
30
40
50
60
70
80
90
100
2 2.2 2.4 2.6 2.8 3
% C
over
age
at 1
l/se
c
Time (secs)
0
10
20
30
40
50
60
70
80
90
100
2 2.2 2.4 2.6 2.8 3
% C
over
age
at 1
.2 l/
sec
Time (secs)
0
10
20
30
40
50
60
70
80
90
100
2 2.2 2.4 2.6 2.8 3
% C
over
age
at 1
.5 l/
sec
Times (secs)
0
10
20
30
40
50
60
70
80
90
100
2 2.2 2.4 2.6 2.8 3
% C
over
age
at 2
l/se
c
Time (secs)
0
10
20
30
40
50
60
70
80
90
100
2 2.2 2.4 2.6 2.8 3
% C
over
age
at 2
.5 l/
sec
Time (secs)
CIBW062 Symposium 2013
9
Overall, these results show that, although an oscillatory frequency of between 4 and 5Hz may exist as a function of the presence of roll waves, as suggested by previous research, this is overlaid with an additional frequency-based characteristic that is directly related to the discharge flow rate in the vertical stack. Further research and data analysis are therefore required in order to accurately define the salient flow drivers that define water curtain coverage and the resultant generation of positive air pressure transients. 7. References
1. BSEN12056, ‘Gravity Drainage Systems Inside Buildings’ British Standards Institution, London, 2000.
2. Jack L.B., ‘An Investigation and Analysis of the Air Pressure Regime Within Building Drainage Vent Systems’, PhD thesis, Heriot-Watt University, 1997.
3. Filsell S., ‘Investigations of Positive Air Pressure Transients in Building Drainage Ventilation Systems’, PhD thesis, Heriot-Watt University, 2006.
4. Lister M, ‘Numerical Solution of Hyperbolic Partial Differential Equations by the Method of Characteristics’, Numerical Methods for Digital Computers, John Wiley and Sons, New York, 1960.
5. Swaffield J.A and Galowin L.S., ‘The Engineered Design of Building Drainage Systems’. Ashgate Publishing Limited, England, 1992.
6. Campbell D.P. and Swaffield J.A., ‘Air pressure propagation in building dranage and vent systems’, Proceedings of CIBW62 Water Supply and Drainage for Buildings Symposium, Portugal, 1993.
7. Swaffield J.A. and Jack L.B., “Drainage vent systems: Investigation and analysis of air pressure regime”, Building Services Engineering Research & Technology, Volume 19, Number 3, 1998.
8. Jack L.B. and Swaffield J.A., ‘The generation of positive air pressure transients in building drainage vent systems’, Water Supply and Drainage for Buildings CIBW62 symposium, Romania, 2002.
9. Filsell S., ‘Investigations of Positive Air Pressure Transients in Building Drainage Ventilation Systems’, PhD thesis, Heriot-Watt University, 2006.
10. Brock R.R, ‘Development of roll waves in open channels, PhD thesis, California Institute of Technology, 1967.
11. Stoker J.J., ‘Water waves; the Mathematical Theory with Applications’, Interscience Publishers Inc, New York, 1966
12. Mayer P.G., ‘Roll waves and Slug Flows in Inclined Open Channels’, Transactions of the ASCE, Vol 126 (1), pp 505-564, 1961.
8. Presentation of Author(s) Professor Lynne Jack is Director of Research in the School of the Built Environment and has been a member of the Drainage Research Group at Heriot-Watt University since 1993. Her research interests include the simulation of air pressure transient propagation in building drainage ventilation systems and the assessment of property drainage system performance when subject to climate change impacts.
CIBW062 Symposium 2013
10