water content and hydrate dissociation conditions for
TRANSCRIPT

International Journal of Greenhouse Gas Control 101 (2020) 103139
Available online 23 August 20201750-5836/© 2020 Elsevier Ltd. All rights reserved.
Water content and hydrate dissociation conditions for carbon dioxide rich fluid
Kayode I. Adeniyi a, Connor E. Deering a, Eugene Grynia b, Robert A. Marriott a,* a Department of Chemistry, University of Calgary, 2500 University Drive NW, Calgary, AB T2N 1N4, Canada b Gas Liquids Engineering, 300 2749 39th Avenue NE, Calgary, AB, T1Y 4T8, Canada
A R T I C L E I N F O
Keywords: Clathrates hydrate Carbon capture and sequestration Water content Carbon dioxide Equilibrium
A B S T R A C T
Water solubility data in CO2 are important for flow assurance and mitigation of corrosion issues during trans-portation in carbon capture, sequestration/storage and acid gas reinjection processes. Hydrate formation con-ditions, as well as solubility of CO2 in water, have been well studied in the literature; however, there are relatively few studies for CO2 liquid in equilibrium with a hydrate as a two-phase system. Moreover, there is a disparity between the various data regarding the pressure dependence of the water content of the CO2 in this system. In this work, we report the water content in CO2liquid at p = 7.893–50.91 MPa and T = 237.86–278.21 K, where the CO2 phase is in equilibrium with only the pure type I hydrate. Our results support a very weak dependence on pressure, which can be expected with an equilibrium involving two relatively incompressible materials. In addition, new measurements are reported for the Lw-H-CO2(g) and Lw-H-CO2(l) phase boundaries for p = 1.262–15.596 MPa and T = 273.42–284.32 K using a 25 cm3 stirred autoclave cell. A full equilibrium model is described where the fluid phase was modeled using reference Helmholtz Equations of State for CO2 and water, and the Sloan et al. (1987) model is used for the hydrate phase.
1. Introduction
Carbon capture and sequestration/storage (CCS) and acid gas in-jection (AGI) are carbon management strategies for mitigating carbon dioxide (CO2) emission to the environment. CCS differs from AGI only in the capture process and larger volumes, however, both strategies typi-cally involve gas separation, compression and transportation to injection facilities. Purified CO2 is also used for other applications, such as enhanced oil recovery for expanding reservoir production. A water wet CO2 stream can cause corrosion and also can precipitate to form solids such as ice or hydrates which can lead to flow assurance issues (Carroll, 2014; Marriott et al., 2011). To prevent solids formation, CO2 streams need to be dried to a specified level; usually below the dew point of the lowest operating temperature of a transport pipeline (Grynia et al., 2010). This can be done through compression and cooling cycles, pro-vided hydrate formation is avoided during interstage cooling and within the suction scrubbers.
There are relatively few studies for the two-phase pure CO2 fluid in equilibrium with a hydrate (Song and Kobayashi, 1987; Jasperson et al., 2015; Seo et al., 2011; Chapoy et al., 2012; Cox et al., 2013; Burgass et al., 2014; Youssef et al., 2009). As well, there is a large disagreement
between the various data reported at these conditions. In contrast, the formation/dissociation conditions for CO2 hydrates in the presence of excess liquid water are widely reported in the literature (Maekawa, 2010; Fan and Guo, 1999; Fan et al., 2000; Ng and Robinson, 1985; Vlahakis et al., 1972; Adisasmito et al., 1991; Wendland et al., 1999; Englezos and Hall, 1994; Nema et al., 2017; Unruh and Katz, 1949; Larson, 1955; Takenouchi and Kennedy, 1964; Mooijer-van den Heuvel et al., 2001; Mohammadi et al., 2005; Melnikov et al., 2011; Ohgaki et al., 1993; Deaton and Frost, 1946; Robinson and Metha, 1971; Yasuda and Ohmura, 2008). Song and Kobayashi (1987), published the first set of water content data for CO2 in equilibrium with a hydrate phase. For over twenty years, these data were the benchmark for this type of sys-tem. Recently, their data has been re-examined by other researchers, because their measured water solubility unexpectedly shows strong pressure dependence. Jasperson et al. (2015); Chapoy et al. (2012), and Burgass et al. (2014), have all independently concluded from their experimental measurements that the pressure dependence of the solu-bility is not strong at all. In order to help resolve the discrepancies and increase the available data, we have measured and modeled water sol-ubility in CO2 at hydrate forming conditions and compared our data to these previous studies.
* Corresponding author. E-mail address: [email protected] (R.A. Marriott).
Contents lists available at ScienceDirect
International Journal of Greenhouse Gas Control journal homepage: www.elsevier.com/locate/ijggc
https://doi.org/10.1016/j.ijggc.2020.103139 Received 26 November 2019; Received in revised form 17 July 2020; Accepted 10 August 2020

International Journal of Greenhouse Gas Control 101 (2020) 103139
2
In this work, we report the water content of CO2 in the presence of a hydrate phase from p = 7.893–50.091 MPa and T = 237.86–278.21 K using a tunable diode laser spectrometer (TDLAS). Furthermore, we also reported CO2 hydrate forming conditions in the presence of liquid water (liquid water-hydrate-liquid CO2 and liquid water-hydrate-gaseous CO2) for p = 1.262–15.596 MPa and T = 273.42–284.32 K using a small stirred autoclave cell. These measurements were used to define the upper boundary for the two-phase fluid-hydrate phase studies. Both the water content and the three-phase loci data were modeled using
reference quality reduced Helmholtz energy equations of state for the fluid phases and the Sloan et al. model for the hydrate phase (Sloan et al., 1976; Span and Wagner, 1996; Wagner and Pruß, 2002; Gernert and Span, 2016). The model is capable of calculating both the water content and three phase loci independently using the same optimized parameters, as opposed to using different parameters for when the different phases were present.
2. Experimental section
2.1. Materials
Laser grade (99.9995 %) CO2 was supplied by Praxair Inc. Double distilled water was polished to a resistivity of 18 MΩ cm with an EMD Millipore model Milli-Q Type 1 water purification system and further degassed by stirring under vacuum for at least 12 h.
2.2. Measurement apparatus
2.2.1. Small stirred autoclave cell A 25 cm3 stirred autoclave cell equipped with a Keller Druckmes-
stechnik PA-33X pressure transducer and an internal four-wire 100 Ω platinum resistance thermometer (PRT) was used in this work for the
Fig. 2. (a) Pressure-temperature profile showing CO2 + H2O cooling, hydrate formation and decomposition stages along the Lw-H-CO2(g) phase boundary. (b) Pressure-temperature profile showing CO2 + H2O cooling, hydrate forma-tion and decomposition stages along the Lw-H-CO2(l) phase boundary.
Fig. 1. Schematic diagram of the setup used for the water content measurement of CO2.
Fig. 3. Flowchart for CO2 water content calculation.
K.I. Adeniyi et al.

International Journal of Greenhouse Gas Control 101 (2020) 103139
3
measuring of CO2 hydrates dissociation along the Lw-H-CO2(g) and Lw- H-CO2(l) phase boundaries. The system and method of measurement has been discussed in previous studies (Adeniyi et al., 2017, 2018; Ward et al., 2015). The pressure transducer and PRT has uncertainty of δp =±0.001 MPa and δT =±0.001 K respectively.
2.2.2. Water content equilibration loop The water content apparatus (shown in Fig. 1) is comprised of coiled
stainless-steel tubing and an AMETEK 5100 HD TDLAS analyzer with a Herriott sample cell. The SS316 coiled tubing (3.18 mm O.D. and 0.71 mm I.D.) has a volume of ca. 3 cm3 and is completely submersed inside a PolyScience PP07R-40 refrigerated bath circulating a 30:70 water-glycol mixture controlling the temperature to within ±0.004 K. A four-wire platinum resistance thermometer (δT = ±0.005 K) is used to measure the temperature of the thermo-regulated water bath. Gravimetrically prepared mixtures of CO2 + H2O are delivered to the equilibration loop via a 260D Teledyne ISCO high pressure syringe pump that maintains a constant desired pressure throughout the experiment. Fluids exit the coiled tubing through a 2–way on/off poppet valve (Valco Instruments Co. Inc.). Pressure is measured with a Keller Druckmesstechnik PA-33X pressure transducer with a calibrated uncertainty of δp = ±0.001 MPa.
2.3. Procedure
2.3.1. Phase boundary dissociation method for hydrate dissociation measurement
The phase boundary dissociation method (Ward et al., 2015) was used for studying CO2 hydrate dissociation in the presence of excess liquid water. Fig. 2a and b show the pressure-temperature profiles for cooling, hydrate formation and heating stages for a CO2 + H2O mixture along the Lw-H-CO2(g) and Lw-H-CO2(l) phase boundaries respectively. For studying both the Lw-H-CO2(g) and Lw-H-CO2(l) loci, ca.10 cm3 of polished and degassed H2O was injected into the evacuated autoclave by suction followed by charging with CO2(g) or CO2(l) at a desired pressure. For both phases, water is in excess, so that a liquid water phase is always present, even after complete hydrate formation. The CO2 + H2O system was then mixed for an additional 6 h or until the pressure was stable to within ±0.005 MPa. Once the system had reached equilibrium, it was subcooled and held at 273.35 K for 18 h to form hydrates. After maximum hydrate formation which was indicated by a rapid decrease in pressure, as shown in Fig. 2a and b, temperature was increased incre-mentally by 0.2 K and 0.1 K in the gas and liquid regions, respectively, to melt the formed hydrate while logging the temperature and pressure.
2.3.2. Calibration and validation of the TDLAS analyzer Before any experiment, the accuracy of the TDLAS analyzer was
validated with different concentrations of water standards prepared
Table 1 Literature and optimised parameters for the hydrate model used for this work.
Reference Parameter Literature value Optimised value
Sloan et al., 1987 a 17.440 MPa 17.774 MPa Sloan et al., 1987 b 6003.925 K MPa− 1 6055.542 K MPa− 1
Avlonitis, 1994 v◦ 22.35 cm3 mol− 1
Avlonitis, 1994 k1 3.1075 × 10− 4 K-1
Avlonitis, 1994 k2 5.9537 × 10− 7 K-2
Avlonitis, 1994 k3 1.3707 × 10− 10 K-3
Parrish and Prausnitz, 1972
Ajm (small) 1.182 × 10− 2 K MPa-1
3.1488 × 10− 3
KMPa-1
Parrish and Prausnitz, 1972
Ajm (large) 8.396 × 10− 2 K MPa-1
9.220 × 10− 2
KMPa-1
Parrish and Prausnitz, 1972
Bjm (small) 2860.5 K 3959.7 K
Parrish and Prausnitz, 1972
Bjm (large) 3277.9 K 3404.5 K
Table 2 Calibration of the TDLAS with different concentrations of H2O in CO2 prepared gravimetrically in-house.
p / MPa
T / K yH2O (exp.) /ppma
yH2O (grav.) /ppmb
yH2O (grav.) yH2O (exp.) /ppm
20.65 296.50 4178 410 − 8 29.52 293.33 422 410 − 12 39.82 298.18 1626 1582 − 44 49.77 298.23 22467 2192 − 54 49.86 298.25 2596 2648 52 49.91 298.22 3457 3546 89 50.02 295.16 1136 1181 45
a Uncertainity for water content measurements from triplicate measurements is estimated to be ±15 ppm.
b Uncertainty from the gravimetric preparation for the mixtures is estimated to be 20 ppm.
Fig. 4. Parity plot of the experimental water content measurements against the water contents calculated by the iterative model described earlier. Dotted line is where the calculated value matches the experimental measurement.
K.I. Adeniyi et al.
International Journal of Greenhouse Gas Control 101 (2020) 103139
4
gravimetrically on a Mettler-Toledo Excellence Plus XP precision comparator (±0.001 g). The 500 cm3 SS316 vessel containing the sample was heated to 373 K during transfer into the 260D Teledyne ISCO syringe pump to prevent water dropout. For calibration of the TDLAS, the apparatus was first evacuated using a vacuum of 2.5 × 10− 7 MPa for 24 h, followed by purging with the sample three times before the final loading of the standard sample. After the stabilization of pressure to within ±0.05 MPa, the poppet valve was periodically opened every 30 s to the TDLAS analyzer until the readings stabilized to within ±10 ppmv.
2.3.3. Experimental procedure for water content measurements The coiled tubing was pressurized to the desired pressure with the
sample, and the temperature was then lowered to 238 K and maintained for 96 h in order to completely anneal the formed hydrates. After equilibration, the poppet valve was opened periodically every 120 s to the TDLAS analyzer until the reading was stable to within ±10 ppmv. For subsequent higher temperature measurements, the temperature of the cold loop was increased incrementally in steps of 5 K and maintained isothermally for 48 h before sampling. Each sample corresponds to ca. 0.6 cm3 over a sampling time of 2 min (~20 % of the cold loop volume). Lower volumetric sampling rates were not found to change the analysis.
3. Thermodynamic modeling
At two phase equilibrium conditions, the fugacities for H2O and CO2 meet the criterion of
f aqi = f b
i (1)
or
f Hi = f b
i (2)
where fi is the fugacity of component i (CO2 or H2O), the superscripts H, aq, and b represent the hydrate, aqueous phase and non-aqueous phase respectively. Note that the aqueous phase can be ice or a liquid aqueous phase, where CO2 solubility in the aqueous phase is provided through the fluid equations of state. Because the molar Gibbs energy (chemical potential) is lowest for the most thermodynamically stable phase, the lowest water fugacity also indicates the most stable phase. Thus, in our approach the equilibrium is solved for both ice and the liquid aqueous system; however, the lowest fugacity solution defines which equilibrium system is used. This is repeated for the hydrate system. For solutions at the three phase locus, the following equally exists:
f Hi = f aq
i = f bi (3)
Eq. 3 is more common when describing hydrate modeling. The steps taken to iteratively solve Eqs. 1–3 are shown in Fig. 3.
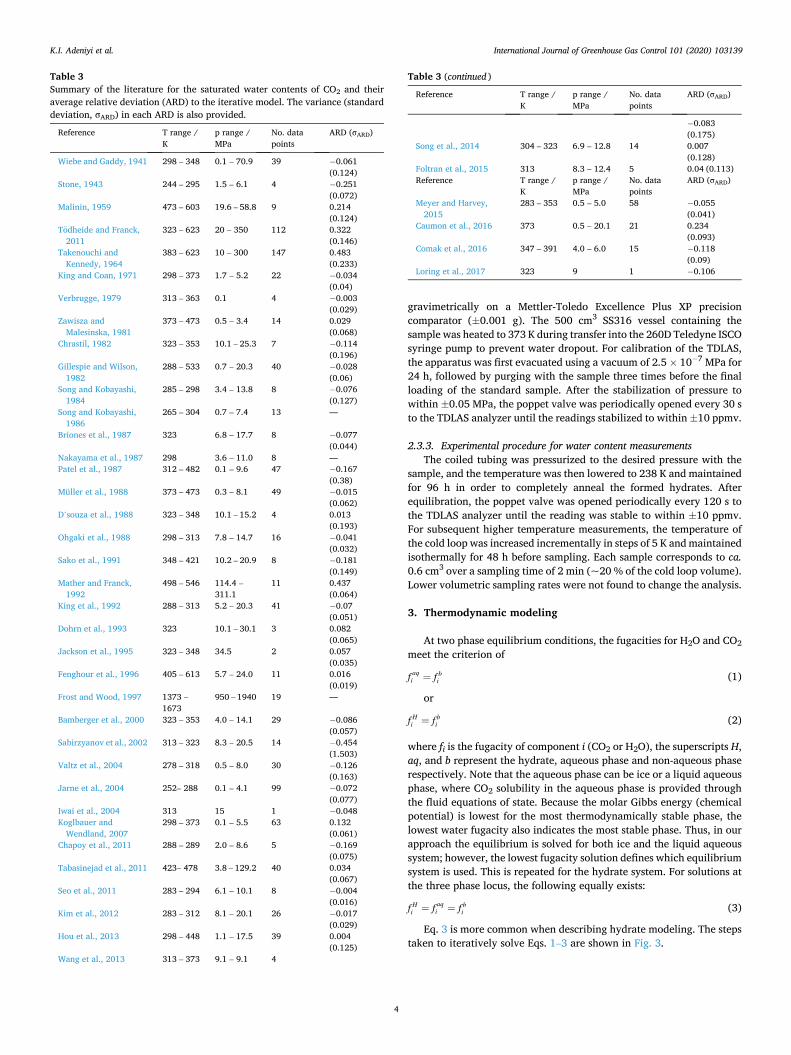
Table 3 Summary of the literature for the saturated water contents of CO2 and their average relative deviation (ARD) to the iterative model. The variance (standard deviation, σARD) in each ARD is also provided.
Reference T range / K
p range / MPa
No. data points
ARD (σARD)
Wiebe and Gaddy, 1941 298 – 348 0.1 – 70.9 39 − 0.061 (0.124)
Stone, 1943 244 – 295 1.5 – 6.1 4 − 0.251 (0.072)
Malinin, 1959 473 – 603 19.6 – 58.8 9 0.214 (0.124)
Todheide and Franck, 2011
323 – 623 20 – 350 112 0.322 (0.146)
Takenouchi and Kennedy, 1964
383 – 623 10 – 300 147 0.483 (0.233)
King and Coan, 1971 298 – 373 1.7 – 5.2 22 − 0.034 (0.04)
Verbrugge, 1979 313 – 363 0.1 4 − 0.003 (0.029)
Zawisza and Malesinska, 1981
373 – 473 0.5 – 3.4 14 0.029 (0.068)
Chrastil, 1982 323 – 353 10.1 – 25.3 7 − 0.114 (0.196)
Gillespie and Wilson, 1982
288 – 533 0.7 – 20.3 40 − 0.028 (0.06)
Song and Kobayashi, 1984
285 – 298 3.4 – 13.8 8 − 0.076 (0.127)
Song and Kobayashi, 1986
265 – 304 0.7 – 7.4 13 —
Briones et al., 1987 323 6.8 – 17.7 8 − 0.077 (0.044)
Nakayama et al., 1987 298 3.6 – 11.0 8 — Patel et al., 1987 312 – 482 0.1 – 9.6 47 − 0.167
(0.38) Müller et al., 1988 373 – 473 0.3 – 8.1 49 − 0.015
(0.062) D’souza et al., 1988 323 – 348 10.1 – 15.2 4 0.013
(0.193) Ohgaki et al., 1988 298 – 313 7.8 – 14.7 16 − 0.041
(0.032) Sako et al., 1991 348 – 421 10.2 – 20.9 8 − 0.181
(0.149) Mather and Franck,
1992 498 – 546 114.4 –
311.1 11 0.437
(0.064) King et al., 1992 288 – 313 5.2 – 20.3 41 − 0.07
(0.051) Dohrn et al., 1993 323 10.1 – 30.1 3 0.082
(0.065) Jackson et al., 1995 323 – 348 34.5 2 0.057
(0.035) Fenghour et al., 1996 405 – 613 5.7 – 24.0 11 0.016
(0.019) Frost and Wood, 1997 1373 –
1673 950 – 1940 19 —
Bamberger et al., 2000 323 – 353 4.0 – 14.1 29 − 0.086 (0.057)
Sabirzyanov et al., 2002 313 – 323 8.3 – 20.5 14 − 0.454 (1.503)
Valtz et al., 2004 278 – 318 0.5 – 8.0 30 − 0.126 (0.163)
Jarne et al., 2004 252– 288 0.1 – 4.1 99 − 0.072 (0.077)
Iwai et al., 2004 313 15 1 − 0.048 Koglbauer and
Wendland, 2007 298 – 373 0.1 – 5.5 63 0.132
(0.061) Chapoy et al., 2011 288 – 289 2.0 – 8.6 5 − 0.169
(0.075) Tabasinejad et al., 2011 423– 478 3.8 – 129.2 40 0.034
(0.067) Seo et al., 2011 283 – 294 6.1 – 10.1 8 − 0.004
(0.016) Kim et al., 2012 283 – 312 8.1 – 20.1 26 − 0.017
(0.029) Hou et al., 2013 298 – 448 1.1 – 17.5 39 0.004
(0.125) Wang et al., 2013 313 – 373 9.1 – 9.1 4
Table 3 (continued )
Reference T range / K
p range / MPa
No. data points
ARD (σARD)
− 0.083 (0.175)
Song et al., 2014 304 – 323 6.9 – 12.8 14 0.007 (0.128)
Foltran et al., 2015 313 8.3 – 12.4 5 0.04 (0.113) Reference T range /
K p range / MPa
No. data points
ARD (σARD)
Meyer and Harvey, 2015
283 – 353 0.5 – 5.0 58 − 0.055 (0.041)
Caumon et al., 2016 373 0.5 – 20.1 21 0.234 (0.093)
Comak et al., 2016 347 – 391 4.0 – 6.0 15 − 0.118 (0.09)
Loring et al., 2017 323 9 1 − 0.106
K.I. Adeniyi et al.

International Journal of Greenhouse Gas Control 101 (2020) 103139
5
3.1. Water content calculation
In this work, the fluid phase fugacities were calculated by using the reduced Helmholtz energy equations of Span and Wagner (1996), and Wagner and Pruß (2002), with the mixing model of Gernert and Span (2016), as implemented within REFPROP 10.0 (Lemmon et al., 2018). The ice phase was calculated by using the Feistel and Wagner (2006) equation of state (EOS) for hexagonal ice. Although several authors have chosen cubic equations of state for successful three phase locus calcu-lations (Herslund et al., 2012), we have chosen reference quality fluid equations which can be used at elevated liquid pressures without modification. For ease of calculation, a water content is first calculated without the hydrate phase, followed by a hydrate phase calculation if the hydrate is the m
Firstly, the compositions of the non-aqueous fluid and aqueous phases were computed while ignoring any possible hydrate phase. An initial, low guess of 1 ppm was made for both the water content in the fluid phase and the CO2 dissolved in the water phase. The state of the aqueous phase was then found by comparing the calculated aqueous fugacity at that composition, fl
H2O, to the fugacity of ice, f iceH2O, where the
lower of the two values gives the most stable phase. This lower fugacity is then used to calculate a new composition of the non-aqueous fluid
phase, y bH2O:
yH2O = fH2O
/pφ b
H2O (4)
The liquid phase composition is then fixed by the new fluid phase fugacity
f bH2O = xH2O p φaq
H2O, (5)
or the composition of an ice phase was assumed to be pure water and Eq. 5 was not used. The new composition of each phase is then compared to their previous compositions through a squared difference objective function to determine if another iteration is required as shown in Fig. 3. If the objective function conditions were not met, a new iteration was started at the comparison of aqueous phase fugacities to determine the state of the phase. If the objective function conditions are met, the compositions are fixed.
Next, the water fugacity using the aqueous phase calculation can be compared to the fugacity of water for the hydrate (described in Section 3.2). If the hydrate fugacity is less that the aqueous fugacity, then the hydrate is the most thermodynamically stable water-rich phase and the water content is recalculated using the hydrate fugacity.
Fig. 5. Saturated CO2 water content isotherms for: (A) □, literature data at 303 K and ○, literature data at 265 K; (B) □, literature data at 313 K and ○, literature data at 273 K.
Fig. 6. Saturated CO2 water content isotherms for: (A) □, literature data at 323 K and ○, literature data at 283 K; (B) □, literature data at 373 K and ○, literature data at 298 K.
K.I. Adeniyi et al.

International Journal of Greenhouse Gas Control 101 (2020) 103139
6
3.2. Hydrate phase
The fugacity of water in the hydrate phase (fHH2O) can be calculated
using Eq. 6, (Sloan et al., 1976, 1987)
f HH2O = f β
H2Oexp(
−μβ− H
H2O
RT
)
(6)
where fβH2O is the fugacity of water in the empty hydrate cage, μβ− H
H2O is the difference in chemical potential for water between a filled and empty hydrate cages, and R is the gas constant.
fβH2O can be calculated from (Dharmawardhana and Parrish, 1980;
Sloan et al., 1987)
f βH2O = φβ
H2O pβH2Oexp
∫ p
pβH2 O
(vβH2O
RT
)dp (7)
where φβH2O is the fugacity coefficient of water in the empty hydrate
lattice, pβH2O is the vapour pressure of the empty cage and vβ
H2O represents molar volume of empty cage. In Eq. 7, φβ
H2O is set to unity because the vapour pressure of water is low.
The Antoine-like equation of Sloan et al. (1987), was used to calcu-late pβ
H2O which is expressed as
pβH2O = exp
(
a −bT
)
(8)
where a and b are constants obtained by equating the fugacity of water in hydrate phase to that of ice at the vapour-ice-hydrate equilibrium condition. vβ
H2O was calculated from the correlation given by Alvonitis, (1994) obtained by fitting the X-ray diffraction data of sI hydrate (Davidson et al., 1986a):
vβH2O = v◦ (1 + k1(T − T◦ ) + k2(T − T◦ )
2+ k3(T − T◦ )
3), (9)
where v◦ is the molar volume of the sI hydrate, T◦ is the reference temperature chosen to be 273.15 K, while k1, k2 and k3 denote the thermal expansion coefficients of the empty sI hydrate.
μβ− HH2O as derived from statistical thermodynamics by van der Waals
and Platteeuw (1959), (Parrish and Prausnitz, 1972),
Table 4 Experimental and calculated water content for CO2 in equilibrium with a hy-drate phase.
p / MPaa
T / Kb yH2O(exp) / ppmc
yH2O(calc) / ppm
yH2O(exp) – yH2O(calc) / ppm
49.926 237.86 365 372 7 39.970 238.10 362 375 − 13 29.984 238.20 351 375 − 24 19.961 238.16 340 371 − 31 9.891 238.07 337 365 − 28 7.893 238.08 341 363 − 22
50.091 244.58 505 512 − 7 40.112 243.36 450 482 − 32 29.950 243.08 427 473 − 46 20.180 242.10 440 448 − 8 9.923 241.80 403 435 32 8.136 242.00 404 437 − 33
50.031 248.08 610 602 8 40.113 248.43 576 610 34 30.066 248.24 549 601 − 52 20.065 248.06 531 591 60 9.884 247.97 540 578 − 38 8.117 248.02 515 577 − 62
50.097 253.32 756 764 − 8 40.104 253.39 713 764 − 51 30.057 253.17 680 752 − 72 20.032 253.06 654 741 − 87 9.918 253.07 655 727 − 72 8.123 253.11 624 725 − 101
50.023 258.29 960 953 7 40.130 258.17 874 945 − 71 30.064 258.17 842 939 97 20.047 258.18 798 929 − 131 9.916 258.13 810 907 − 97 8.004 258.06 774 899 − 125
50.011 263.20 1102 1180 − 78 40.107 262.22 1042 1128 86 30.072 263.18 1029 1168 − 139 20.119 263.14 1026 1151 − 125 9.912 263.17 1008 1124 − 116 7.900 263.18 991 1116 − 125
p / MPaa
T / Kb yH2O(exp) / ppmc
yH2O(calc) / ppm
yH2O(exp) – yH2O(calc) / ppm
49.968 268.19 1344 1468 − 124 40.005 268.20 1312 1462 − 150 29.940 268.19 1285 1445 − 160 19.931 268.19 1260 1424 − 164 9.912 268.18 1241 1384 − 143 7.899 268.18 1245 1372 − 127
50.029 273.20 1756 1807 51 40.078 273.20 1689 1800 − 111 30.020 273.19 1637 1784 − 147 19.993 273.19 1572 1755 − 183 9.988 273.18 1511 1699 − 188 7.969 273.18 1492 1681 − 189
50.028 278.21 2107 2218 − 111 40.084 278.21 2064 2209 − 145 30.020 278.21 2005 2188 − 183 20.007 278.20 1904 2149 − 245 9.984 278.19 1834 2067 − 233 7.976 278.19 1789 2041 − 252
a Uncertainty from temperature measurements was calculated to be ±0.1 K. b Uncertainty for pressure measurements calculated to be ±0.001 MPa. c Uncertainty for water content measurements was calculated to be ±20 ppm.
Fig. 7. Parity plot of the available water content data for CO2 in equilibrium with a hydrate phase. , this study measurement; …., correlation; ×, data from Song and Kobayashi (1987); ◊, data from Korea University, Jasperson et al. (2015); Δ, data from Wiltec, Jasperson et al. (2015); □, data from Seo et al. (2011); +, data from Chapoy et al. (2012); ○, data from Burgass et al. (2014); —, data from Youssef et al. (2009).
K.I. Adeniyi et al.

International Journal of Greenhouse Gas Control 101 (2020) 103139
7
μβ− HH2O
RT=∑
mvmln
(
1 −∑
jθjm
)
− lnaH2O (10)
where vm represents the number of cavities of type m per water mole-cule, θjm is the fractional cage occupancy of the guest gas molecules inside the hydrate cages. In equation 8, θjm can be calculated from (Parrish and Prausnitz, 1972)
θjm =Cjmfj
1 +∑
jCjmfj(11)
where fj is the fugacity of pure hydrate former j in cavity m which was calculated by using the Span and Wagner EOS (Span and Wagner, 1996). The Langmuir constant (Cjm) can be calculated by using a Parrish and Prausnitz correlation (Parrish and Prausnitz, 1972; Holder et al., 1980; Herslund et al., 2012):
Cjm(T) =Ajm
Texp
Bjm
T. (12)
Where Ajm and Bjm are fitting parameters, the values of these parameters and the other coefficients used in this study are presented in Table 1.
The activity of water was calculated from the relationship given as
aH2o =f bH2O
f ◦
H2O(13)
where f ◦
H2O is the standard state fugacity of H2O at 0.1 MPa.
3.2.1. Optimization of fitting parameters for Langmuir and empty cage constants
The fitting parameters (Ajm and Bjm in Eq. 12) were optimized using our three-phase dissociation data. The empty cages constants, a and b
given by Sloan et al., 1987 in equation 8 were re-optimized using experimental water content data from this study. In both instances, the relative sum squared difference (RSSE) for the fugacities of water in the non-aqueous and hydrate phases are minimized via
RSSE =∑N
i
(f HH2O − f b
H2O
f bH2O
)2
(14)
where N is the number of experimental data points. The optimized and the literature values are presented in Table 1. Our
optimized empty cages constants, a and b, were 1.91 % and 0.86 % greater than the values reported by Sloan et al. (1987) with a RSSE =0.0000787. Also, the optimized parameters (Ajm(small), Bjm(small)) and Ajm(large)) are in good agreement with the values reported by Parrish and Prausnitz (1972), to within 28 %; however, the Ajm(large) is 86 % higher than the value reported by Parrish and Prausnitz (1972). The RSSE value associated with these optimized values is 0.000244 Pa. These optimized values can be used to iteratively calculate the hydrate dissociation
Table 5 Summary of experimental water content data and their corresponding average relative deviation to the model reported in this study.
T ranges / K p ranges / MPa Number of points Equilibrium conditions ARD (σARD) Source
274.3 – 282.3 6.1 – 10.1 20 CO2(l)-H 48.77 (22.36) Seo et al., 2011 228.15 – 268.15 4.15 – 27.66 26 CO2(l)-H − 113.42 (87.66) Wiltec, Jasperson et al., 2015 257.13 – 278.63 6.12 – 23.07 29 CO2(l)-H − 91.72 (221.18) Korea University, Jasperson et al., 2015 251.75 – 280.15 0.62 – 13.79 35 CO2(l)-H, CO2(g)-H − 426.72 (707.73) Song and Kobayashi, 1987 253.15 – 277.15 13.79 13 CO2(l)-H − 180.52 (70) Chapoy et al., 2012 223.15 – 263.15 1 – 10 22 CO2(l)-H, CO2(g)-H − 160.1 (155.66) Burgass et al., 2014 260.7 – 276.3 2.0 – 2.1 5 CO2(g)-H − 115.83 (60.13) Youssef et al., 2009 241.80 – 278.19 7.89 – 50.09 54 CO2(l)-H − 92.56 (66.69) This study
Fig. 8. Isotherm plot of water content as a function of pressure for this study and literature. Blue symbols represent this study measurement at different temperatures indicated; _________, model reported in this study; -●-, interpolated data of Song and Kobayashi (1987); , interpolated data of Cox et al. (2013); □, data from Jasperson et al. (2015); ○, data from Burgass et al. (2014). Table 6
Dissociation conditions for CO2 hydrates in the presence of liquid water.
Lw-H-CO2(g) Lw-H-CO2(l)
p / MPaa T / Kb p / MPaa T / Kb
1.262 273.42 4.750 283.23 1.322 273.82 5.444 283.29 1.386 274.22 5.882 283.31 1.453 274.62 6.549 283.41 1.523 275.01 7.352 283.50 1.590 275.28 7.780 283.57 1.268 273.42 8.237 283.60 1.328 273.81 9.201 283.70 1.391 274.21 10.238 283.81 1.457 274.61 11.300 283.91 1.526 275.01 12.406 284.02 1.602 275.41 13.424 284.12 1.680 275.81 14.480 284.22 1.763 276.21 15.596 284.32 1.849 276.61 1.941 277.01 2.040 277.41 2.144 277.81 2.253 278.21 2.368 278.61 2.494 279.01 2.624 279.41 2.764 279.81 2.916 280.21 3.078 280.61 3.253 281.01 3.441 281.41 3.648 281.82 3.872 282.22 4.060 282.62 4.474 283.06
a Uncertainty for hydrates temperature measurements was calculated to be ±0.1 K.
b Uncertainty for hydrates pressure measurements was calculated to be ±0.01 MPa.
K.I. Adeniyi et al.

International Journal of Greenhouse Gas Control 101 (2020) 103139
8
temperature and saturation water content at any specified pressure in the hydrate forming regions.
4. Results and discussions
4.1. Validation of the TDLAS analyzer
The analyzer was factory calibrated to a maximum of 1867 ppmv for water content measurements in pure CO2 fluid. In order to extend this range and verify the accuracy, different H2O + CO2 mixtures were gravimetrically prepared (ranging from 410 to 3550 ppmw) and flowed into the analyzer. The results are shown in Table 2, where the average deviation was found to be within 3%.
4.2. Validation of the fluid phase water content calculation
The reduced Helmholtz energy mixture coefficients for H2O + CO2 was developed by Gernert and Span (2016), using a large robust data-base of experimental thermophysical data. Because our iteration did not rely on their code, its performance using the iterative model described earlier for the CO2 + water system was evaluated here using saturated water content data (liquid aqueous or ice phase present) before being further used in developing the hydrate model. A parity plot using 844 experimental data is shown in Fig. 4 where the overall average relative deviation (ARD) was found to be 0.3 % with the standard deviation in this number being 2.4 %. The larger variance on the small ARD shows that the model is in statistical agreement with the experimental data. The ARD, and the variance in the ARD, between the model and indi-vidual studies is given in Table 3.
The outliers in the water content range most relevant to this study are Patel et al.’s (1987), data at yH2O (exp) = 0.02 and yH2O (calc) =0.05 as well as Sabirzyanov et al. (2002), at yH2O (exp) = 0.0005 & 0.001 and yH2O (calc) = 0.003 & 0.004. The disagreement with the former two points can also be observed in Fig. 4 as the two points at lower water content at ~8 MPa. The other data in this study are in better agreement with the model, however there is a trend in the deviation from the model which suggests systematic error. The agreement with the
data produced by Patel et al. (1987), also improved as they moved to higher water concentrations.
A number of calculated isotherms were plotted with experimental data (within ±1 K of the isotherm) in Figs. 5 and 6 to better illustrate the fit of the model. Discontinuities in the water content isotherm calcula-tions occur where the CO2 has transitioned from gas to liquid for the isotherms below the critical point of CO2 at 304.13 K. Fig. 5 was limited to p < 25 MPa for clarity because no experimental data was above this pressure for those 4 isotherms.
It should be noted that the 3-phase, Lw-CO2(l)-CO2(g), water content
Fig. 9. Summary of experimental data for CO2 hydrates dissociation conditions along the I-H-CO2(g), Lw-H-CO2(g) and Lw-H-CO2(l) loci. , this study mea-surements; ______, model reported in this study; ——, vapour pressure of CO2 calculated using Span and Wagner EOS, (Span and Wagner, 1996); ○, experi-mental measurements from various literature source, (Maekawa, 2010; Fan and Guo, 1999; Fan et al., 2000; Ng and Robinson, 1985; Vlahakis et al., 1972; Adisasmito et al., 1991; Wendland et al., 1999; Englezos and Hall, 1994; Nema et al., 2017; Unruh and Katz, 1949; Larson, 1955; Takenouchi and Kennedy, 1964; Mooijer-van den Heuvel et al., 2001; Mohammadi et al., 2005; Melnikov et al., 2011; Ohgaki et al., 1993; Deaton and Frost, 1946; Robinson and Metha, 1971; Yasuda and Ohmura, 2008).
Table 7 Summary of dissociation conditions for CO2 hydrates in the presence of liquid water.
T / K p / MPa Equilibrium conditions
ARD (σARD) / K
Source
264.1 – 283.1
1.33 – 4.54
Lw-H-CO2(g) − 0.18 (0.17)
Maekawa, 2010
273.6 – 283.6
1.31 – 12.87
Lw-H-CO2(g), Lw-H-CO2(l)
− 0.27 (0.19)
Fan and Guo, 1999
274.7 – 279.7
1.5 – 2.78 Lw-H-CO2(g) − 0.22 (0.16)
Fan et al., 2000
279.59 – 283.9
2.74 – 18.02
Lw-H-CO2(g), Lw-H-CO2(l)
− 0.28 (0.07)
Ng and Robinson, 1985
271.6 – 283.2
1.04 – 4.509
Lw-H-CO2(g) − 0.10 (0.18)
Vlahakis et al., 1972
274.3 – 282.9
1.42 – 4.37
Lw-H-CO2(g) − 0.18 (0.11)
Adisasmito et al., 1991
270.34 – 282.16
0.974 – 3.85
I-H-CO2(g) − 0.47 (0.55)
Wendland et al., 1999 Lw-H-CO2(g)
275.05 – 277.35
1.542 – 3.701
Lw-H-CO2(g) − 0.17 (0.15)
Englezos and Hall, 1994
269.45 – 275.75
0.825 – 1.708
I-H-CO2(g) − 0.33 (0.56)
Nema et al., 2017
289.73 – 294
104 – 494 Lw-H-CO2(l) 0.68 (1.2) Nakano et al., 1998
277.2 – 281.9
0.204 – 0.450 Lw-H-CO2(g)
− 0.15 (0.17)
Unruh and Katz, 1949
256.8 - 285
0.545 – 4.695
I-H-CO2(g), Lw- H-CO2(g)
− 0.04 (0.12)
Larson, 1955
283.2 – 292.7
4.5 – 186.2
Lw-H-CO2(g), Lw-H-CO2(l)
0.04 (0.14)
Takenouchi and Kennedy, 1964
276.52 – 283.36
1.82 – 7.35
Lw-H-CO2(g), Lw-H-CO2(l)
0.13 (0.20)
Mooijer-van den Heuvel et al., 2001
277.5 – 282.5
2.048 – 4.02 Lw-H-CO2(g)
− 0.04 (0.10)
Mohammadi et al., 2005
249.1 – 280.2
0.08 – 2.95
I-H-CO2(g), Lw- H-CO2(g)
9.18 (8.43)
Melnikov et al., 2011
273.36 – 283.59
1.338 – 8.93
Lw-H-CO2(g), Lw-H-CO2(l)
− 0.80 (0.59)
Ohgaki et al., 1993
273.7 – 282.9
1.324 – 4.323
I-H-CO2(g), Lw- H-CO2(g)
− 0.15 (0.17)
Deaton and Frost, 1946
273.93 – 283.32
1.379 – 4.468 Lw-H-CO2(g)
− 0.93 (2.18)
Robinson and Metha, 1971
244.5 – 275.7
0.364 – 1.628
I-H-CO2(g), Lw- H-CO2(g)
− 4.05 (2.45)
Yasuda and Ohmura, 2008
273.42 – 284.32
1.262 – 15.596
Lw-H-CO2(g), Lw-H-CO2(l)
− 0.04 (0.14)
This study
Table 8 Upper quadruple point conditions reported in the literature and this study.
T / K p / MPa Reported purity (mol%)
Source
283.1 4.65 99.99 Fan et al., 2000 283.1 4.502 – Unruh and Katz, 1949 283.27 4.48 99.95 Mooijer-van den Heuvel et al.,
2001 283.3 4.468 99.8 Robinson and Metha, 1971 282.95 4.499 – Carroll, 2014 283.19 ±
0.1 4.435 ±0.01
99.9995 This study
K.I. Adeniyi et al.

International Journal of Greenhouse Gas Control 101 (2020) 103139
9
studies completed by Song and Kobayashi (1986) and Nakayama et al. (1987), unfortunately could not be calculated using the iterative routine because the REFPROP 10.0 software, through which the Helmholtz models were used, cannot work with more than two phases at a single time. Studies by Todheide and Franck (2011), and Takenouchi and Kennedy (1964) were not included in the evaluation of the model, but are listed in Table 3, because they had a substantial number of data with large deviations at higher pressure and temperature conditions outside of where this model was being used in this work. At their higher experimental temperatures, the water content began to increase signif-icantly as the pressure was increased past p > 20 MPa which was un-expected. The work done by Frost and Wood (1997), was also at much higher temperatures and pressures, so much so that the REFPROP 10.0 software could not converge with its calculations. Sayegh and Najman (1984) included data, but only in graphical form in their 1987 publi-cation, and so the data are not used in the evaluation of the model. Other papers looking at the saturated water content of CO2 that have been mentioned in literature but whose data were unavailable to us at the time of publishing include Sidorov et al. (1952); Smith et al. (1985); Feng and Hou (1993); Cai and Wu (1996), and Jiang et al. (2014). 4.3. Experimental water content in the presence of a hydrate phase
This study experimental water content data for CO2 in equilibrium with a hydrate phase for p = 7.893–50.091 MPa and T = 237.86–278.21 K along with the calculated values using the model reported in this study are presented in Table 4. A parity plot between the experimental (this study and literature) data and calculated values using this study’s model is presented in Fig. 7. The majority of the experimental data shows good agreement with the model (R2 = 0.9918), except for the data reported by Song and Kobayashi (1987) (Jasperson et al., 2015; Seo et al., 2011; Chapoy et al., 2012; Burgass et al., 2014; Youssef et al., 2009). The ARD from this study’s model, equilibrium conditions, pressure and corre-sponding temperature ranges are presented in Table 5.
For the measured pressures of this work, the model shows a better calculation for the temperatures between 238–258 K (ARD = -47.5 ppm) than for T > 258 K which has an ARD = − 148.85 ppm, but the overall ARD for all the temperatures is within -93 ppm. Jasperson et al. (2015), reported two sets of data from different laboratories; Wiltec Research Company and Korea University. Both sets of data compared favourably with the calculated values from this study’s model to within an ARD of -114 ppm. The data reported by Chapoy et al. (2012) and Burgass et al. (2014), shows almost similar average deviations when compared to this study’s model. The highest deviation was observed for the data reported by Song and Kobayashi (1987). Note that Cox et al. (2013), re-examined the earlier measurements of Song and Kobayashi (1987), but their raw data were unavailable to us hence we are unable to compare their measurements to our model.
One of the major reasons attributed to the large difference between the data reported by Song and Kobayashi (1987) and previous literature is that their water content data shows a significant dependence on pressure. In this regard, we analysed the available data to examine the influence of pressure on solubility of water in CO2 at hydrate forming conditions. We compare this study’s data to that reported by Jasperson et al. (2015), as well as the interpolated data of Song and Kobayashi (1987); Cox et al. (2013), at the same temperature of 253.15 K. As shown in Fig. 8, for the Cox et al. (2013), and Song and Kobayashi (1987) data, the water content increases as the pressure increases, whereas the water content data of this study and Jasperson et al. (2015), are almost invariant of pressure. This observation is also consistent with that of Seo et al. (2011); Chapoy et al. (2012), and Burgass et al. (2014), who have all independently concluded from measurement and modeling results that the hydrate water content is weak function of pressure.
4.4. Experimental dissociation data in the presence of water
The same model reported in this study for the calculation of the CO2 water contents was used to calculate the hydrate formation conditions in the presence of excess liquid water phase. The dissociation conditions for this study measurements are presented in Table 6.
The pressure versus temperature plot of experimental data (Lw-H- CO2(g), Lw-H-CO2(l) and I-H-CO2(g)) and this study’s model is pre-sented in Fig. 9, while the summary of the pressures, temperatures, equilibrium conditions and the associated ARD for each experimental studies are presented in Table 7. In general, the model agrees to within ±0.2 K on average when compared to this study’s measurement and most of the literature. (Maekawa, 2010; Fan and Guo, 1999; Fan et al., 2000; Ng and Robinson, 1985; Vlahakis et al., 1972; Adisasmito et al., 1991; Englezos and Hall, 1994; Nema et al., 2017; Unruh and Katz, 1949; Larson, 1955; Takenouchi and Kennedy, 1964; Mooijer-van den Heuvel et al., 2001; Mohammadi et al., 2005; Ohgaki et al., 1993; Deaton and Frost, 1946; Robinson and Metha, 1971). The lowest ARD was observed for the data reported in this study, Mohammadi et al. (2005), and Larson (1955); although, at different equilibrium conditions as indicated in Table 7. The data reported by Melnikov et al. (2011), shows the highest overall ARD to the model reported in this work; however, along the Lw-H-CO2(g) loci, a lower ARD = -0.072 K with associated σARD of 0.12 K was observed, while the ARD =11.7 K and σARD =7.76 K for the I-H-CO2(g) phase boundary. Similarly, Yasuda and Ohmura (2008), also reported data along the I-H-CO2(g) and Lw-H-CO2(g) loci with a high overall ARD as shown in Table 7. Their calculated ARD = -0.13 K and σARD =0.07 K for the two points reported along the Lw-H-CO2(g) loci, while the ARD = -4.83 K and σARD =1.80 K for the data along the I-H-CO2(g) phase boundary.
4.4.1. Semi–empirical model for hydrate dissociation calculation This study’s experimental measurements along both the Lw-H-
CO2(g) and Lw-H-CO2(l) phase boundaries were used to fit a semi- empirical correlation based on the Clausius-Clapeyron relation for the calculation of the hydrate formation conditions. The Lw–H–CO2(g) phase boundary can be calculated from the relationship:
p = exp (38.116–10372.53 / T). (15)
Also, the Lw–H–CO2(l) phase boundary can be calculated using the expression
p = 9.7415T – 2754.33, (16)
where p and T are pressure and temperature in MPa and K, respectively. The upper quadruple point (Q2) can be calculated from the inter-
section of the semi-empirical equation of the Lw–H–CO2(g) and Lw–H–CO2(l) loci. The Q2 for this study and other literature are shown in Table 8. All the quadruple point temperatures reported in the litera-ture fall within ±0.1 K except the one reported by Carroll (2014), while all of the quadruple point pressures fall within ±0.03 MPa of each other.
5. Conclusion
In this study, we reported equilibrium dissociation data for CO2 hydrate in the presence of water from p = 1.262–15.596 MPa and T =273.42–284.32 K as well as water content data for CO2 liquid in equi-librium with a hydrate phase for p = 7.893–50.091 MPa and T =237.86–278.21 K. These results were used to optimize an equilibrium model based on the reference Span and Wagner (1996) Helmholtz EOS for the fluid phase and the Sloan et al., 1976 hydrate phase model. The same model is also capable of calculating the water content of CO2 without a hydrate phase. The calculated results using the model were compared to experimental measurements, where a reasonable deviation was generally observed. Analysis of the water content data in this study, both from experimental measurements and thermodynamic modeling
K.I. Adeniyi et al.

International Journal of Greenhouse Gas Control 101 (2020) 103139
10
show that the water content of CO2 increases as the temperature in-creases, but the pressure dependence of the CO2 liquid water content is not considerable.
These measurements are important for processes facilities handling wet CO2 fluid in order to define dehydration specifications where clathrate hydrate formation and corrosion can be problematic, espe-cially when the fluid temperature drops below the water dew point during transportation.
CRediT authorship contribution statement
Kayode I. Adeniyi: Conceptualization, Data curation, Formal anal-ysis, Investigation, Methodology, Software, Visualization, Writing - original draft. Connor E. Deering: Conceptualization, Data curation, Formal analysis, Methodology, Software, Validation, Visualization, Writing - review & editing. Eugene Grynia: Data curation, Investiga-tion, Resources, Visualization, Writing - review & editing. Robert A. Marriott: Conceptualization, Formal analysis, Funding acquisition, Methodology, Project administration, Resources, Software, Supervision, Validation, Visualization, Writing - review & editing.
Declaration of Competing Interest
The authors report no declarations of interest.
Acknowledgements
The authors are grateful for funding through the NSERC ASRL In-dustrial Research Chair in Applied Sulfur Chemistry and the sponsoring companies of Alberta Sulphur Research Ltd.
References
Adeniyi, K.I., Deering, C.E., Marriott, R.A., 2017. Hydrate decomposition conditions for liquid water and propane. J. Chem. Eng. Data 62, 2222–2229.
Adeniyi, K.I., Deering, C.E., Nagabhushana, G.P., Marriott, R.A., 2018. Hydrogen sulfide hydrate dissociation in the presence of liquid water. Ind. Eng. Chem. Res. 57, 15579–15585.
Adisasmito, S., Frank, R.J., Sloan, E.D., 1991. Hydrates of carbon dioxide and methane mixtures. J. Chem. Eng. Data 36, 68–71.
Avlonitis, D., 1994. The determination of Kihara potential parameters from gas hydrate Data. Chem. Eng. Sc. 49, 1161–1173.
Bamberger, A., Sieder, G., Maurer, G., 2000. High-pressure (vapor + liquid) equilibrium in binary mixtures of (carbon dioxide + water or acetic acid) at temperatures from 313 to 353 K. J. Supercrit. Fluids 17 (2), 97–110.
Briones, J.A., Mullins, J.C., Thies, M.C., Kim, B.U., 1987. Ternary phase equilibria for acetic acid-water mixtures with supercritical carbon dioxide. Fluid Phase Equilib. 36, 235–246.
Burgass, R., Chapoy, A., Duchet-Suchaux, P., Tohidi, B., 2014. Experimental water content measurements of carbon dioxide in equilibrium with hydrates at (223.15 to 263.15) K and (1.0 to 10.0) MPa. J. Chem. Thermodyn. 69, 1–5.
Cai, Z., Wu, Z., 1996. Measurement and correlation of vapor–liquid equilibrium with CO2 systems at high pressure. Huaxue Gongcheng (Xi’an, People’s Repub. China) 24, 71–73.
Carroll, J., 2014. Natural Gas Hydrates, A Guide for Engineers, 4th ed. Gulf Professional Publishing, Burlington, MA.
Caumon, M.C., Sterpenich, J., Randi, A., Pironon, J., 2016. Measuring mutual solubility in the H2O–CO2 system up to 200 bar and 100 C by in situ Raman spectroscopy. Int. J. Greenhouse Gas Control 47, 63–70.
Chapoy, A., Burgass, R., Tohidi, B., Austell, J.M., Eickhoff, C., 2011. Effect of common impurities on the phase behavior of carbondioxide-rich systems: minimizing the risk of hydrate formation and two-phase flow. SPE J. 16 (04), 921–930.
Chapoy, A., Haghighi, H., Burgass, R., Tohidi, B., 2012. On the phase behaviour of the carbon dioxide–water systems at low temperatures: experimental and modelling. J. Chem. Thermodyn. 47, 6–12.
Chrastil, J., 1982. Solubility of solids and liquids in supercritical gases. J. Phys. Chem. 86 (15), 3016–3021.
Comak, G., Foltran, S., Ke, J., Perez, E., Sanchez-Vicente, Y., George, M.W., Poliakoff, M., 2016. A synthetic-dynamic method for water solubility measurements in high pressure CO2 using ATR–FTIR spectroscopy. J. Chem. Thermodyn. 93, 386–391.
Cox, K.R., Chapman, W.G., Song, K.S., Dominik, A., French, R., 2013. Water content of liquid CO2 in equilibrium with liquid water or hydrate. In: GPA Convention. San Antonio, TX, 7− 10 April.
D’souza, R., Patrick, J.R., Teja, A.S., 1988. High pressure phase equilibria in the carbon dioxide-n-Hexadecane and carbon dioxide—water systems. Can. J. Chem. Eng. 66 (2), 319–323.
Davidson, D.W., Handa, Y.P., Ratcliffe, C.I., Ripmeester, J.A., Tse, I.S., Dahn, J.R., Lee, F., Calvert, L.D., 1986a. Crystallographic studies of clathrate hydrates. Mol. Cryst. Liquid Cryst. 141–149.
Deaton, W.M., Frost Jr., E.M., 1946. Gas hydrates and their relation to the operation of natural-gas pipe lines. U.S. Bureau of Mines Monograph 8.
Dharmawardhana, P.B., Parrish, W.R., 1980. Sloan, E. D. Experimental thermodynamic parameters for the prediction of natural gas hydrate dissociation conditions. Ind. Eng. Chem. Fundam. 19, 410–414.
Dohrn, R., Bünz, A.P., Devlieghere, F., Thelen, D., 1993. Experimental measurements of phase equilibria for ternary and quaternary systems of glucose, water, CO2 and ethanol with a novel apparatus. Fluid Phase Equilib. 83, 149–158.
Englezos, P., Hall, S., 1994. Phase Equilibrium data on carbon dioxide hydrate in the presence of electrolytes, water soluble polymers and montmorillonite. Can. J. Chem. Eng. 72 (5), 887–893.
Fan, S., Guo, T.M., 1999. Hydrate formation of CO2-rich binary and quaternary gas mixtures in aqueous sodium chloride solutions. J. Chem. Eng. Data 44, 829–832.
Fan, S.S., Chen, G.J., Ma, Q.L., Guo, T.M., 2000. Experimental and modeling studies on the hydrate formation of CO2 and CO2-rich gas mixtures. Chem. Eng. J. 78, 173–178.
Feistel, R., Wagner, W., 2006. A new equation of state for H2O ice Ih. J. Phys. Chem. Ref. Data 35, 1021–1047.
Feng, Y., Hou, Y., 1993. The effect of entrainer on phase equilibria of CO2-C2H5OH-H2O system. Petrochem. Technol 22, 803–807.
Fenghour, A., Wakeham, W.A., Watson, J.T.R., 1996. Densities of (water + carbon dioxide) in the temperature range 415 K to 700 K and pressures up to 35 MPa. J. Chem. Thermodyn. 28 (4), 433–446.
Foltran, S., Vosper, M.E., Suleiman, N.B., Wriglesworth, A., Ke, J., Drage, T.C., Poliakoff, M., George, M.W., 2015. Understanding the solubility of water in carbon capture and storage mixtures: an FTIR spectroscopic study of H2O + CO2 + N2 ternary mixtures. Int. J. Greenhouse Gas Control. 35, 131–137.
Frost, D.J., Wood, B.J., 1997. Experimental measurements of the properties of H2O-CO2 mixtures at high pressures and temperatures. Geochim. Cosmochim. Acta 61 (16), 3301–3309.
Gernert, J., Span, R., 2016. EOS-CG: a Helmholtz energy mixture model for humid gases and CCS mixtures. J. Chem. Thermodyn. 93, 274–293.
Gillespie, P.C., Wilson, G.M., 1982. Vapor-Liquid and Liquid-Liquid Equilibria: Water- Methane, Water-Carbon Dioxide, Water-Hydrogen Sulfide, Water-nPentane, Water- Methane-nPentane. GPA Research Report 48. Wiltec Research Company, Provo, Utah. April 1982.
Grynia, E.W., Carroll, J.J., Griffin, P.J., 2010. Dehydration of acid gas prior to injection. Acid Gas Injection and Related Technologies; Advances in Natural Gas Engineering Series. Wiley, New York, pp. 107–127.
Herslund, P.J., Thomsen, K., Abildskov, J., van Solms, N., 2012. Phase equilibrium modeling of gas hydrate systems for CO2 capture. J. Chem. Thermodyn. 48, 13–27.
Holder, G.D., Corbin, G., Papadopoulos, K.D., 1980. Thermodynamic and molecular properties of gas hydrates from mixtures containing methane, argon and krypton. Ind. Eng. Chem. Fundem. 19, 282–286.
Hou, S.X., Maitland, G.C., Trusler, J.M., 2013. Measurement and modeling of the phase behavior of the (carbon dioxide + water) mixture at temperatures from 298.15 K to 448.15 K. J. Supercrit. Fluids 73, 87–96.
Iwai, Y., Uno, M., Nagano, H., Arai, Y., 2004. Measurement of solubilities of palmitic acid in supercritical carbon dioxide and entrainer effect of water by FTIR spectroscopy. J. Supercrit. Fluids 28 (2–3), 193–200.
Jackson, K., Bowman, L.E., Fulton, J.L., 1995. Water solubility measurements in supercritical fluids and high-pressure liquids using near-infrared spectroscopy. Anal. Chem. 67 (14), 2368–2372.
Jarne, C., Blanco, S.T., Artal, M., Rauzy, E., Otın, S., Velasco, I., 2004. Dew points of binary carbon dioxide + water and ternary Carbon dioxide + Water + Methanol mixtures: measurement and modelling. Fluid Phase Equilib. 216 (1), 85–93.
Jasperson, L.V., Kang, J.W., Lee, C.S., Macklin, D., Mathias, P.M., McDougal, R.L., Rho, W.G., VonNiederhausern, D., 2015. Experimental determination of the equilibrium water content of CO2 at high pressure and low temperature. J. Chem. Eng. Data 60, 2674–2683.
Jiang, C., Wu, J., Sun, Z., Pan, Q., 2014. Solubility of water in supercritical CO2. Huaxue Gongcheng 42, 42–47.
Kim, S., Kim, Y., Park, B.H., Lee, J.H., Kang, J.W., 2012. Measurement and correlation of solubility of water in carbon dioxide-rich phase. Fluid Phase Equilib. 328, 9–12.
King Jr, A.D., Coan, C.R., 1971. Solubility of water in compressed carbon dioxide, nitrous oxide, and ethane. Evidence for hydration of carbon dioxide and nitrous oxide in the gas phase. J. Am. Chem. Soc. 93 (8), 1857–1862.
King, M.B., Mubarak, A., Kim, J.D., Bott, T.R., 1992. The mutual solubilities of water with supercritical and liquid carbon dioxides. J. Supercrit. Fluids 5 (4), 296–302.
Koglbauer, G., Wendland, M., 2007. Water vapor concentration enhancement in compressed humid nitrogen, argon, and carbon dioxide measured by Fourier transform infrared spectroscopy. J. Chem. Eng. Data 53 (1), 77–82.
Larson, S.D., 1955. Phase Studies of the Two-component Carbon Dioxide-Water System Involving the Carbon Dioxide Hydrate. Ph.D. Dissertation. University of Illinois at Urbana-Champaign, IL.
Lemmon, E.W., Bell, I.H., Huber, M.L., McLinden, M.O., 2018. NIST Standard Reference Database 23: Reference Fluid Thermodynamic and Transport Properties-REFPROP, Version 10.0. National Institute of Standards and Technology.
Loring, J.S., Bacon, D.H., Springer, R.D., Anderko, A., Gopinath, S., Yonkofski, C.M., Thompson, C.J., McGrail, B.P., Rosso, K.M., Schaef, H.T., 2017. Water solubility at saturation for CO2–CH4 mixtures at 323.2 K and 9.000 MPa. J. Chem. Eng. Data 62 (5), 1608–1614.
K.I. Adeniyi et al.

International Journal of Greenhouse Gas Control 101 (2020) 103139
11
Maekawa, T., 2010. Equilibrium conditions for carbon dioxide hydrates in the presence of aqueous solutions of alcohols, glycols, and glycerol. J. Chem. Eng. Data 55, 1280–1284.
Malinin, S.D., 1959. The system H2O-CO2 at high temperatures and pressures. Geokhimiya 3, 235–245.
Marriott, R.A., Fitzpatrick, E., Bernard, F., Wan, H.H., Lesage, K.L., Davis, P.M., Clark, P. D., 2011. Chapter 1. Equilibrium water content measurements for acid gas mixtures. In: Carroll, J.J., Wu, Y. (Eds.), Acid Gas Injection and related Technologies. Wiley.
Mather, A.E., Franck, E.U., 1992. Phase equilibria in the system carbon dioxide-water at elevated pressures. J. Phys. Chem. 96 (1), 6–8.
Melnikov, V.P., Nesterov, A.N., Reshetnikov, A.M., Istomin, V.A., 2011. Metastable states during dissociation of carbon dioxide hydrates below 273K. Chem.Eng. Sci. 66 (1), 73–77.
Meyer, C.W., Harvey, A.H., 2015. Dew-point measurements for water in compressed carbon dioxide. AIChE J. 61 (9), 2913–2925.
Mohammadi, A.H., Anderson, R., Tohidi, B., 2005. Carbon monoxide clathrate hydrates: equilibrium data and thermodynamic modeling. AIChE J. 51, 2825–2833.
Mooijer-van den Heuvel, M.M., Witteman, R., Peters, C.J., 2001. Phase behaviour of gas hydrates of carbon dioxide in the presence of tetrahydropyran, cyclobutanone, cyclohexane and methylcyclohexane. Fluid Phase Equilib. 182, 97–110.
Müller, G., Bender, E., Maurer, G., 1988. Das Dampf-Flüssigkeitsgleichgewicht des ternaren Systems Ammoniak-Kohlendioxid-Wasser bei hohen Wassergehalten im Bereich zwischen 373 und 473 Kelvin. Berichte der Bunsengesellschaft für physikalische Chemie 92 (2), 148–160.
Nakano, S., Moritoki, M., Ohgaki, K., 1998. High-pressure phase equilibrium and Raman microprobe spectroscopic studies on the CO2 hydrate system. J. Chem. Eng. Data 43, 807–810.
Nakayama, T., Sagara, H., Arai, K., Saito, S., 1987. High pressure liquid-liquid equilibria for the system of water, ethanol and 1, 1-difluoroethane at 323.2 K. Fluid Phase Equilib. 38 (1–2), 109–127.
Nema, Y., Ohmura, R., Senaha, I., Yasuda, K., 2017. Quadruple point determination in carbon dioxide hydrate forming system. Fluid Phase Equilib. 441, 49–53.
Ng, H.J., Robinson, D.B., 1985. Hydrate formation in systems containing methane, ethane, propane, carbon dioxide or hydrogen sulfide in the presence of methanol. Fluid Phase Equilib. 21, 145–155.
Ohgaki, K., Nishikawa, M., Furuichi, T., Katayama, T., 1988. Entrainer effect of water and ethanol on α-tocopherol extraction by compressed carbon dioxide. Kagaku Kogaku Ronbunshu 14 (3), 342–346.
Ohgaki, K., Makihara, Y., Takano, K., 1993. Formation of CO2 hydrate in pure and sea waters. J. Chem. Eng. Jpn. 558–564.
Parrish, W.R., Prausnitz, J.M., 1972. Dissociation pressures of gas hydrates formed by gas mixtures. Ind. Eng. Chem. Process Des. Dev. 11, 26–35.
Patel, M.R., Holste, J.C., Hall, K.R., Eubank, P.T., 1987. Thermophysical properties of gaseous carbon dioxide water mixtures. Fluid Phase Equilib. 36, 279–299.
Robinson, D., Metha, B., 1971. Hydrates in the propane− carbon dioxide− water system. J. Can. Pet. Technol. 10, 642–644.
Sabirzyanov, A.N., Il’in, A.P., Akhunov, A.R., Gumerov, F.M., 2002. Solubility of water in supercritical carbon dioxide. High Temp. 40 (2), 203–206.
Sako, T., Sugeta, T., Nakazawa, N., Okubo, T., Sato, M., Taguchi, T., Hiaki, T., 1991. Phase equilibrium study of extraction and concentration of furfural produced in reactor using supercritical carbon dioxide. J. Chem. Eng. Jpn. 24 (4), 449–455.
Sayegh, S.G., Najman, J., 1984. CO2-SO2-brine phase behavior studies. A/CERRF report, no. 2: Report 84-2. Petroleum Recovery Institute.
Sayegh, S.G., Najman, J., 1987. Phase behavior measurements of CO2-SO2-brine mixtures. Can. J. Chem. Eng. 65 (2), 314–320.
Seo, M.D., Kang, J.W., Lee, C.S., 2011. Water solubility measurements of the CO2-rich liquid phase in equilibrium with gas hydrates using an indirect method. J. Chem. Eng. Data 56, 2626–2629.
Sidorov, I.P., Kazarnovskii, Y.S., Goldman, A.M., 1952. Solubility of water in compressed gases. Tr. Gos. NIPI Azot. Prom 1, 48–67.
Sloan, E.D., Khoury, F.M., Kobayashi, R., 1976. Water-content of methane gas in equilibrium with hydrates. Ind. Eng. Chem. Fundam. 15, 318.
Sloan, E.D., Sparks, K.A., Johnson, J.J., 1987. Two-phase liquid hydrocarbon- hydrate equilibrium for ethane and propane. Ind. Eng. Chem. Res. 26 (6), 1173–1179.
Smith, R.D., Udseth, H.R., Wright, B.W., 1985. Micro-scale methods for characterization of supercritical fluid extraction and fractionation processes. Proc. IEEE Int. Symp. Signal Proc. Inf. Tech. 3, 191–223.
Song, K.Y., Kobayashi, R., 1984. Water content of CO2-rich fluids in equilibrium with liquid water or hydrate. GPA Research Report 80.
Song, K.Y., Kobayashi, R., 1986. Water content of CO2-rich fluids in equilibrium with liquid water and/or hydrate. GPA Research Report 99.
Song, K.Y., Kobayashi, R., 1987. Water content of CO2 in equilibrium with liquid water and/or hydrates. SPE Form. Eval. 2, 500–508.
Song, W., Fadaei, H., Sinton, D., 2014. Determination of dew point conditions for CO2 with impurities using microfluidics. Environ. Sci. Technol. 48 (6), 3567–3574.
Span, R., Wagner, W.A., 1996. New equation of state for carbon dioxide covering the fluid region from the triple-point temperature to 1100 K at pressures up to 800 MPa. J. Phys. Chem. Ref. Data 25, 1509–1596.
Stone, H.W., 1943. Solubility of water in liquid carbon dioxide. Ind. Eng. Chem. 35 (12), 1284–1286.
Tabasinejad, F., Moore, R.G., Mehta, S.A., Van Fraassen, K.C., Barzin, Y., Rushing, J.A., Newsham, K.E., 2011. Water solubility in supercritical methane, nitrogen, and carbon dioxide: measurement and modeling from 422 to 483 K and pressures from 3.6 to 134 MPa. Ind. Eng. Chem. 50 (7), 4029–4041.
Takenouchi, S., Kennedy, G.C., 1964. The binary system H2O–CO2 at high temperatures and pressures. Am. J. Sci. 262, 1055–1074.
Todheide, K., Franck, E., 2011. Das Zweiphasengebiet und die kritische Kurve im System Kohlendioxid–Wasser bis zu Drucken von 3500 bar. Zeitschrift für Physikalische Chemie 37 (5_6), 387–401.
Unruh, C.H., Katz, D.L., 1949. Gas hydrates of carbon dioxide – methane mixture. J. Pet. Technol. Altern. Fuels 1, 83–86.
Valtz, A., Chapoy, A., Coquelet, C., Paricaud, P., Richon, D., 2004. Vapour–liquid equilibria in the carbon dioxide–water system, measurement and modelling from 278.2 to 318.2 K. Fluid Phase Equilib. 226, 333–344.
Van der Waals, J.H., Platteeuw, J.C., 1959. Clathrate solutions. Adv. Chem. Phys. 2, 1–57.
Verbrugge, P., 1979. Vapour-liquid Equilibria of the Ammonia-Carbon Dioxide-Water System (Doctoral Dissertation). Delft University Press.
Vlahakis, J.G., Chen, H.A., Suwandi, M.S., Barduhn, A.J., 1972. The growth rate of ice crystals: properties of carbon dioxide hydrate, a review of properties of 51 gas hydrates. Syracuse University Research and Development, Report No 830 Prepared for the Office of Saline Water. U.S. Department of the Interior. November.
Wagner, W., Pruß, A., 2002. The IAPWS formulation 1995 for the thermodynamic properties of ordinary water substance for general and scientific use. J. Phys. Chem. Ref. Data 31, 387–535.
Wang, Z., Felmy, A.R., Thompson, C.J., Loring, J.S., Joly, A.G., Rosso, K.M., Schaef, H.T., Dixon, D.A., 2013. Near-infrared spectroscopic investigation of water in supercritical CO2 and the effect of CaCl2. Fluid Phase Equilib. 338, 155–163.
Ward, Z.T., Deering, C.E., Marriott, R.A., Sum, A.K., Sloan, E.D., Koh, C.A., 2015. Phase equilibrium data and model comparisons for H2S hydrates. J. Chem. Eng. Data 60, 403–408.
Wendland, M., Hasse, H., Maurer, G., 1999. Experimental pressure − temperature data on three- and four-phase equilibria of fluid, hydrate, and ice phases in the system carbon dioxide − water. J. Chem. Eng. Data 44 (5), 901–906.
Wiebe, R., Gaddy, V.L., 1941. Vapor phase composition of carbon dioxide-water mixtures at various temperatures and at pressures to 700 atmospheres. J. Am. Chem. Soc. 63 (2), 475–477.
Yasuda, K., Ohmura, R., 2008. Phase equilibrium for clathrate hydrates formed with methane, ethane, propane, or carbon dioxide at temperatures below the freezing point of water. J. Chem. Eng. Data 53, 2182–2188.
Youssef, Z., Barreau, A., Mougin, P., Jose, J., Mokbel, I., 2009. Measurements of hydrate dissociation temperature of methane, ethane, and CO2 in the absence of any aqueous phase and prediction with the cubic plus association equation of state. Ind. Eng. Chem. Res. 48, 4045–4050.
Zawisza, A., Malesinska, B., 1981. Solubility of carbon dioxide in liquid water and of water in gaseous carbon dioxide in the range 0.2-5 MPa and at temperatures up to 473 K. J. Chem. Eng. Data 93, 1857.
K.I. Adeniyi et al.