water and sewer connection fee study - civicplus
TRANSCRIPT

Water and Sewer Connection Fee Study
Final Report January 23, 2020
PO Box 3065 Oakland, CA 94609
(510) 545-3182 www.LTmuniconsultants.com


City of Tehachapi Water and Sewer Connection Fee Study
TABLE OF CONTENTS
SECTION 1: INTRODUCTION AND EXECUTIVE SUMMARY ................................................................. 1 1.1 Background ....................................................................................................................... 1 1.2 Current Connection Fees .................................................................................................. 1 1.3 Legal Requirements .......................................................................................................... 2 1.4 Connection Fee Study Process .......................................................................................... 3 1.5 Proposed Fees ................................................................................................................... 4
SECTION 2: LEGAL REQUIREMENTS AND METHODOLOGY ................................................................ 6 2.1 Legal Requirements .......................................................................................................... 6 2.2 Fee Methodologies ........................................................................................................... 7
SECTION 3: CAPACITY ......................................................................................................................... 8 3.1 City-wide Capacity ............................................................................................................. 8 3.2 Sewer Trunk Area Capacities ............................................................................................ 9
SECTION 4: COST OF CAPACITY ........................................................................................................ 10 4.1 Water Cost of Capacity ................................................................................................... 10 4.2 Sewer Cost of Capacity .................................................................................................... 13 4.3 Sewer Trunk Lines Cost of Capacity ................................................................................ 15
SECTION 5: FEE CALCULATION ......................................................................................................... 16 5.1 Water Fee Calculation ..................................................................................................... 16 5.2 City-wide Sewer Fee Calculation ..................................................................................... 22 5.3 Sewer Trunk Line Fee Calculations.................................................................................. 28
APPENDIX A: Schedule of Proposed Sewer Trunk Fees
LIST OF TABLES
Table 1: Current Connection Fees ................................................................................................................. 2 Table 2: Current and Proposed Connection Fees ......................................................................................... 4 Table 3: Water System City-wide Capacity ................................................................................................... 8 Table 4: Sewer System City-wide Capacity ................................................................................................... 8 Table 5: Capacities of the Sewer Trunk Areas .............................................................................................. 9 Table 6: Water Pipeline Adjustment ........................................................................................................... 10 Table 7: Water Buy-in ................................................................................................................................. 11 Table 8: Well Transmission Main Costs ...................................................................................................... 12 Table 9: Allocation of Water Capital Improvements .................................................................................. 13 Table 10: Sewer Buy-in ............................................................................................................................... 14 Table 11: Wastewater Treatment Plant Expansion Costs ........................................................................... 15 Table 12: Water System Unit Cost .............................................................................................................. 16 Table 13: Water Connection Fee Multipliers .............................................................................................. 18 Table 14: Proposed Water Connection Fees ............................................................................................... 20 Table 15: Sewer System Unit Cost .............................................................................................................. 22 Table 16: Cost Allocation to Sewer Flow and Pollutant Loading ................................................................ 22 Table 17: Sewer Connection Fee Multipliers .............................................................................................. 24 Table 18: Proposed Sewer Connection Fees ............................................................................................... 26

City of Tehachapi Water and Sewer Connection Fee Study
Table 19: Downtown Sewer Trunk Unit Cost of Capacity ........................................................................... 28 Table 20: Industrial Sewer Trunk Unit Cost of Capacity ............................................................................. 29 Table 21: Mountain View Sewer Trunk Unit Cost of Capacity ................................................................... 30 Table 22: Tucker Sewer Trunk Unit Cost of Capacity .................................................................................. 31 Table 23: Summary of Proposed Trunk Fees .............................................................................................. 32
LIST OF ACRONYMS
ADD – average day demand ADF – average day flow BOD – biochemical oxygen demand EDU – equivalent dwelling unit ENR CCI – Engineering News Record’s Construction Cost Index Gpd – gallons per day LF – linear feet LS – lump sum MGD – million gallons per day Mg/l – milligrams per liter MKN – Michael K. Nunley and Associates RCNLD – replacement cost new less depreciation SF – single family Sq – square feet TM – technical memoranda TSS – total suspended solids WWTP – wastewater treatment plant

City of Tehachapi Page 1 Water and Sewer Connection Fee Study
SECTION 1: INTRODUCTION AND EXECUTIVE SUMMARY
1.1 Background The purpose of this report is to update the water, wastewater treatment, and sewer trunk line connection fees charged by the City of Tehachapi (City) to new development connecting to the City’s utilities. The City’s current fees have not been updated in over a decade and no longer reflect current development projections and infrastructure needs. Lechowicz & Tseng Municipal Consultants (L&T) was selected as part of the Michael K. Nunley & Associates, Inc. (MKN) team to conduct a Water and Sewer Systems Modeling, Planning, and Fee Studies Update for the City of Tehachapi. This report draws upon information provided by MKN in the Water Model Report (Final October 2019) and Sewer Model Report (Final October 2019) to calculate updated connection fees. Connection fees (also called impact fees or capacity fees) are one-time hookup fees intended to recover the capital cost of facilities needed to serve new development. Connection fees do not collect revenues to cover the costs of maintenance, operations, or repairs. Instead, these on-going costs are recovered through rates and charges billed monthly to customers. The MKN reports provide detailed information regarding the need to provide new or expanded facilities to accommodate growth and the estimated construction cost of facilities.
1.2 Current Connection Fees The City has two types of connection fees: City-wide fees and sewer trunk service area fees. The water City-wide fee recovers the cost of water system assets throughout Tehachapi’s sphere of influence consisting of wells, tanks, and transmission and distribution lines. The wastewater (sewer) City-wide fee recovers the cost of the wastewater treatment plant and other sewer assets that benefit the entire service area. All new development throughout the City pays water and sewer City-wide fees upon connection. The City of Tehachapi also charges area-specific fees for the Downtown development area, Industrial (Dennison) area, Mountain View area, and Tucker area. These fees recover the cost of sewer trunk lines that only benefit their respective development areas. Consequently, the fees are only charged to new development in each service area. A summary of the current water and sewer connection fees is provided in Table 1. The connection fees are expressed as $/equivalent dwelling units (EDUs). One water EDU represents the estimated daily water demand of a single family residence. For the sewer system and trunk line service areas, an EDU is defined as the daily wastewater flow of a single family residence. As shown in Table 1, the connection fees have been updated at various intervals over the last 20 years. Each connection fee report used different development projections. As such, the underlying assumptions regarding the estimated water demand and sewer flow of an EDU varies across the reports. This updated report standardizes the definition of an EDU for the various fees.

City of Tehachapi Page 2 Water and Sewer Connection Fee Study
Table 1: Current Connection Fees Water and Sewer Connection Fees City of Tehachapi
Fee Development Area Last Updated Current Fee Amount per EDU
Water Connection Fee City-wide June 2007 $6,780
Sewer Treatment and Disposal Fee City-wide May 2006 $7,259
Downtown Trunk Fee Downtown sewer service area January 2006 $927
Industrial Trunk Fee
Airport area, Nunes Ranch area, and other areas generally east of
Dennison Road
November 1995 $300
Mountain View Trunk Fee Mountain View sewer service area December 2006 Not defined
Tucker Trunk Fee Tucker sewer service area January 1998 $600
EDU – equivalent dwelling unit (i.e. a single family residence)
1.3 Legal Requirements California Government Code Sections 66013, 66016, and 66022 describe the legal requirements pertaining to establishing connection fees. Absent a 2/3 vote, fees must be proportional to the cost of providing facilities to serve new development. Essentially, public agencies must identify facilities that benefit growth and determine a fair value or cost of those facilities. The cost of facilities attributable to new development must be proportional to the capacity used by new development. This report provides an administrative record to identify and document the facilities benefitting growth, the cost and capacity of such facilities, and the calculation of proposed connection fees.

City of Tehachapi Page 3 Water and Sewer Connection Fee Study
1.4 Connection Fee Study Process The fee study process is summarized in the figure below.
Step 4 - Apply the Unit Costs to the Capacity Needs of New Development
Apply the unit costs of capacity to the infrastructure needs of new development to determine equitable connection fees
Step 3 - Calculate the Unit Costs of Capacity
Calculate the unit cost of capacity by dividing the costs indentified for fee recovery in Step 2 by the capacity of those facilities identified in Step 1
Step 2 - Determine the Cost of Facilities for Fee Recovery
Determine the cost of facilities benefiting new development that will be recovered by the fees
Step 1 - Determine the Buildout Capacity of the Development Areas and Capacity of Improvements
Determine the capacity of facilities to buildout and capacity of recommended improvements

City of Tehachapi Page 4 Water and Sewer Connection Fee Study
1.5 Proposed Fees The current and proposed fees are provided in Table 2. Table 2: Current and Proposed Connection Fees Water and Sewer Connection Fees City of Tehachapi
Fee Development Area Current Fee Amount per EDU
Proposed Fee Amount per EDU
Water Connection Fee City-wide $6,780 $2,047 [1] Sewer Treatment and Disposal Fee City-wide $7,259 $4,822
Downtown Trunk Fee Downtown sewer service area $927 $552
Industrial Trunk Fee Airport area, Nunes Ranch area, and other areas generally east of Dennison Road
$300 $52
Mountain View Trunk Fee Mountain View sewer service area Not defined $612 Tucker Trunk Fee Tucker sewer service area $600 $1,935 1 – Does not include water rights or additional sources of supply that may be needed to serve growth Provided below is a chart comparing the City’s current and proposed water connection fees with the fees charged by other comparable public agencies. The City’s current fee is in the middle range of surveyed connection fees and the proposed fee is in the lower end of surveyed fees.

City of Tehachapi Page 5 Water and Sewer Connection Fee Study
The chart below compares the City’s current and proposed sewer connection fees with the fees charged by other local agencies. The City’s current fee is in the higher range of surveyed agencies and the proposed fee is in the lower range.
Provided below is a chart comparing the combined water and sewer fees with the fees of other local agencies.

City of Tehachapi Page 6 Water and Sewer Connection Fee Study
SECTION 2: LEGAL REQUIREMENTS AND METHODOLOGY This section provides a review of the economic and legal foundations for connection fees. The basic economic philosophy behind the imposition of connection fees is that the costs of providing infrastructure should be paid by new connections receiving the benefits of the infrastructure so that no one group subsidizes any other group (such as existing ratepayers subsidizing improvements that only benefit new development). In establishing any fee or charge, achieving equity is one of the primary goals. In the case of connection fees, this goal has been expressed in the form of “growth should pay for growth.”
2.1 Legal Requirements In California, Government Code Section 66013, 66016, and 66022 address the implementation of connection fees (also called capacity fees or development impact fees). Government Code 66013 states: (a) Notwithstanding any other provisions of law, when a local agency imposes fees for water connections or sewer connections, or imposes capacity charges, those fees or charges shall not exceed the estimated reasonable cost of providing the service for which the fee or charge is imposed, unless a question regarding the amount the fee or charge imposed in excess of the estimated reasonable cost of providing the services or materials is submitted to, and approved by, a popular vote of two-thirds of those electors voting on the issue. (b) As used in this section
(1) “Sewer connection” means the connection of a building to a public sewer system. (2) “Water connection” means the connection of a building to a public water system, as defined in subdivision (e) of Section 4010.1 of the Health and Safety Code. (3) “Capacity charges” means charges for facilities in existence at the time the charge is imposed or charges for new facilities to be constructed in the future which are of benefit to the person or property being charged. (4) “Local agency” means a local agency as defined in Section 66000.
(c) Any judicial action or proceeding to attack, review, set aside, void, or annul the ordinance, resolution, or motion imposing a fee or capacity charge subject to this section shall be brought pursuant to Section 66022.

City of Tehachapi Page 7 Water and Sewer Connection Fee Study
2.2 Fee Methodologies There are several industry standard methodologies for calculating connection fees. It is recommended that the City of Tehachapi use a combination of the methodologies to best reflect the status of its infrastructure. 2.2.1 Buy-in Method The buy-in concept is most appropriate for existing infrastructure that has excess capacity to serve new connections through buildout. This method is based on the premise that new development should pay an amount equal to the investment already made by existing ratepayers in the facilities. Once a new connection has paid its fee, the new connection becomes equivalent to existing ratepayers and shares the responsibility for existing facilities via the payment of utility rates. The value of existing facilities is calculated using the reproduction cost new less depreciation (RCNLD) method. 2.2.2 Expansion or Incremental Cost Method When new development connects to the City’s water and sewer systems, it either uses reserve capacity available in existing facilities or requires new capacity to accommodate its needs. Under the expansion method, new development pays the marginal cost for new facilities necessary to provide service to it. The goal of this method is to minimize or eliminate the need to increase utility rates in order to provide for system expansion. As an example, the incremental method is the recommended method for the new water production well. The well solely benefits new connections and would not be needed absent development (i.e. the project is “triggered” by growth).

City of Tehachapi Page 8 Water and Sewer Connection Fee Study
SECTION 3: CAPACITY This section determines the capacity of the water and sewer infrastructure included in the connection fees.
3.1 City-wide Capacity The water and sewer City-wide fees proposed in this report use the 10-year buildout capacities provided by MKN in the Water Model Report (October 2019) and Sewer Model Report (October 2019), see Table 3 and Table 4. The current water system average day demand (ADD) is 1.52 million gallons per day (MGD). Water demand is predicted to increase to about 2.24 MGD over the next ten years. The current sewer system capacity is about 760,000 gallons per day (average day flow; ADF). New connections are projected to add about 480,000 gallons of flow through 2029. Under a 10-year buildout scenario, new customers are estimated to make up about 32% of water demand and 39% of City-wide sewer flows.
Table 3: Water System City-wide Capacity Water and Sewer Connection Fees City of Tehachapi
Customer Category Gallons per day %
Existing Average Day Demand 1,520,000 68% Future Customers Average Day Demand 720,000 32% Total 10-year Buildout 2,240,000
Table 4: Sewer System City-wide Capacity Water and Sewer Connection Fees City of Tehachapi
Customer Category Gallons per day %
Existing Average Day Flow 760,000 61% Future Customers Average Day Flow 480,000 39% Total 10-year Buildout 1,240,000
To provide wastewater treatment for new customers, the City projects an expansion of the treatment plant from 1.25 MGD to 2.0 MGD. Expansion of 0.75 MGD is triggered by growth and does not benefit existing customers.

City of Tehachapi Page 9 Water and Sewer Connection Fee Study
3.2 Sewer Trunk Area Capacities The table below provides capacities of the sewer trunk areas expressed as average day flow. The capacities of the Downtown, Industrial, and Tucker trunk services areas were estimated by MKN based on the maximum capacity of the most downstream trunk segment for each area. The buildout flow of the Mountain View service area was taken from the prior Mountain View service area evaluation study.
Table 5: Capacities of the Sewer Trunk Areas Water and Sewer Connection Fees City of Tehachapi
Trunk Fee Area Existing
Flow Incremental
Flow 2029 Total Capacity
(ADF, gpd) Downtown Trunk 347,040 164,160 511,200 Industrial Trunk 125,280 184,320 309,600 Mountain View Trunk NA NA 580,000 Tucker Trunk 74,880 72,000 146,880 Note: Average day flow of each trunk fee area was determined by MKN; the flow for the Mountain View service area was taken from the 2006 report

City of Tehachapi Page 10 Water and Sewer Connection Fee Study
SECTION 4: COST OF CAPACITY This section calculates the cost of capacity for City-wide facilities. As described in prior sections, the proposed costs of capacity include both a buy-in component and an expansion component.
4.1 Water Cost of Capacity 4.1.1 Water Buy-in The buy-in to existing water infrastructure is calculated using the replacement cost new less depreciation (RCNLD) method of valuation. The original construction cost of facilities less accumulated depreciation (i.e. net book value) is escalated to current dollars based on the change in the Engineering News Record’s Construction Cost Index. The economic philosophy supporting the RCNLD method is the concept that value should reflect the age and condition of assets (depreciation) as well as the City’s investment and maintenance of the facilities to date (escalation to current dollars). The assets’ construction date, original cost, and accumulated depreciation was taken from the City’s fixed asset list. The RCNLD value of water system pipelines is reduced by about 3% (see Table 6) to reflect deficient mains that are proposed to be replaced. It is recommended that the City replace about 10,000 linear feet (LF) of mains that are either substandard or would be deficient under fire flow conditions. These improvements should be funded via utility rates collected from existing customers. New customers should not pay a buy-in fee for substandard water mains and then also pay to replace the same mains via utility rates after they connect.
Table 6: Water Pipeline Adjustment Water and Sewer Connection Fees City of Tehachapi Pipelines Linear Feet City-wide water distribution system 322,974
Pipelines to be replaced:
Replacement of pipelines for fire flow 3,453 Replacement of substandard mains 6,400
Subtotal 9,853
Pipelines to be replaced as % of City-wide distribution system 3.05%
The buy-in to the City’s water system is calculated to be about $6.1 million as shown in Table 7.

City of Tehachapi Page 11 Water and Sewer Connection Fee Study
Table 7: Water Buy-in Water and Sewer Connection Fees City of Tehachapi Facilities [1] Sum of RCNLD [2] Buildings $6,099 Land [3] $25,522 Machinery & Equipment $341,402 Other Improvements $114,887 Pipelines $641,111 Less Pipeline Adjustment (-3.05%) ($19,558) Tanks $2,359,893 Wells $2,613,366 Total Buy-in $6,082,723 1 - Water rights are excluded 2 - RCNLD = Replacement Cost New Less Depreciation 3 - Land does not depreciate; original purchase price shown here
4.1.2 Water Expansion Cost In the Water Model Report (Final October 2019), MKN provides a list of recommended improvements for the City’s water system. MKN provides an opinion of probable cost for these projects in current dollars (August 2019) and an escalation to August 2024. The City has elected to use 2024 construction costs for the purpose of determining the connection fees. The buildout horizon used in this report is 10 years and 2024 represents the mid-point.1 MKN report also discusses the need to secure new water rights to accommodate growth. The cost or effort required to secure new water rights are not within the scope of this evaluation. The City, MKN, and L&T allocated project costs identified in the Water Model Report between developers, existing customers, and future customers as follows:
• Costs associated with correcting fire flow deficiencies and the replacement of substandard water mains are solely allocated to existing customers. These projects will be funded via utility rate revenues and are excluded from the connection fee calculation. New customers should not pay for infrastructure that has been degraded through its service to the City’s current customer base.
• The new production well is solely allocated to future customers and will be recovered via connection fees. This project is triggered by new development.
1 The City also considered adopting fees based on the 2019 construction costs plus financing costs with an annual update based on the annual change in the Engineering News Record’s Construction Cost Index. The 2024 construction costs result in lower fees than the alternative considered and avoids uncertainty regarding how the City might finance projects.

City of Tehachapi Page 12 Water and Sewer Connection Fee Study
• Well transmission main costs are allocated across all three groups. About 55% of the well transmission project is expected to be funded by the developer as a condition of development and is not the responsibility of current or future customers (see Table 8). The remaining 45% of the project cost is allocated between existing and future customers based on the 10-year buildout water demand.
• The Curry Tank main project will benefit both existing customers and future growth. Project costs are allocated 68% to current customers and 32% to future customers based on each group’s respective demand in 2029 (see Table 3).
About $2.6 million in facility costs are allocated to future customers as shown in Table 9. Added to this expense is about $478,000 that the water capacity fee fund owes to other City funds for the prior construction of facilities that will benefit future growth. The total water expansion component is about $3.0 million.
Table 8: Well Transmission Main Costs Water and Sewer Connection Fees City of Tehachapi
Item Description Quantity Unit Unit Price Amount
Existing & Future
Customers Developer
Cost 1 Mobilization 1 LS $110,000 $110,000 $49,568 $60,432 2 Traffic Control 1 LS $110,000 $110,000 $49,568 $60,432 3 Connections 1 LS $50,000 $50,000 $37,500 $12,500 4 Surge 1 LS $80,000 $80,000 $0 $80,000 5 10" Main 3,050 LF $140 $427,000 $271,600 $155,400 6 12" Main 1,840 LF $160 $294,400 $294,400 $0 7 16" Main 1,560 LF $170 $265,200 $119,000 $146,200 8 18" Main 5,230 LF $200 $1,046,000 $252,000 $794,000
Subtotal $2,382,600 $1,073,635 $1,308,965
Soft Cost (25%) $596,000 $268,567 $327,433 Contingency (25%) $596,000 $268,567 $327,433
Total August 2019 $3,574,600 $1,610,768 $1,963,832 Total August 2024 $4,146,536 $1,868,491 $2,278,045 100% 45.1% 54.9%
Source: City of Tehachapi LS - Lump sum; LF - linear foot

City of Tehachapi Page 13 Water and Sewer Connection Fee Study
Table 9: Allocation of Water Capital Improvements Water and Sewer Connection Fees City of Tehachapi
Project Construction Cost
(August 2024) Developer Funded %
Existing Customers %
Future Customers %
New Production Well $1,523,000 0% 0% 100% Well Transmission Main $4,147,000 55% 31% 14% Curry Tank Zone 1 Water Main Upgrade $1,364,000 0% 68% 32% Projects for Fire Flow Deficiencies $912,000 0% 100% 0% Replacement of Water Mains $1,593,000 0% 100% 0% Total Water Projects $9,539,000
Project Construction Cost
(August 2024) Developer Funded %
Existing Customers $
Future Customers $
New Production Well $1,523,000 $0 $0 $1,523,000 Well Transmission Main $4,147,000 $2,278,300 $1,268,047 $600,654 Curry Tank Zone 1 Water Main Upgrade $1,364,000 $0 $925,571 $438,429 Projects for Fire Flow Deficiencies $912,000 $0 $912,000 $0 Replacement of Water Mains $1,593,000 $0 $1,593,000 $0 Total Water Projects $9,539,000 $2,278,300 $4,698,618 $2,562,082 Net of existing connection fee balance [1] $477,802 Total Expansion Cost $3,039,884
1 - Fund balance as of July 1, 2019; the water capacity fee fund owes $477,802 to other City funds for projects constructed that benefit future growth
4.2 Sewer Cost of Capacity Like the water utility, the proposed City-wide sewer capacity cost consists of a buy-in and an expansion cost. 4.2.1 Sewer Cost Allocation and Buy-in The sewer buy-in is provided in Table 10. The value of the treatment plant reflects the original construction cost less principal forgiveness from the State Revolving Fund loan program. Principal forgiveness of $2.1 million was not paid by the City and thus is not recovered in the connection fee. The buy-in excludes assets associated with the Downtown, Industrial, and Tucker sewer trunk mains as the cost of those facilities is recovered in the area specific connection fees. Recycled water assets are also excluded as they are considered water demand offset projects.

City of Tehachapi Page 14 Water and Sewer Connection Fee Study
Table 10: Sewer Buy-in Water and Sewer Connection Fees City of Tehachapi
Facilities [1] Sum of RCNLD [2] Pipelines & Pump Stations $1,610,183 Treatment $3,708,725 Office, Buildings, and Fleet Vehicles $122,068 Total Buy-in $5,440,976 1 – Does not include assets that are accounted for in other connection fees and/or recycled water assets. Excluded assets:
444-510-00571 – Sewer Trunk Main-Downtown 444-510-00534 – Sewer Main 2004 444-520-00661 – Tucker Sewer Lift Station lmprovements 444-510-00195 – Industrial Trunk Sewer Line 444-520-10619 – Sewer Reclamation Expansion 444-520-13004R – Recycled Water Pump Station
2 – RCNLD = Replacement Cost New Less Depreciation; does not include fully depreciated assets
4.2.2 Wastewater Treatment Expansion Cost As shown in Table 4, over the next ten years, the City’s flow is expected to increase from 0.76 MGD to 1.24 MGD. At about 1.00 MGD, state regulation requires the City to begin to expand the wastewater treatment plant to 2.0 MGD. MKN evaluated the City’s existing treatment plant to identify components that would need to be expanded to provide an additional 0.75 MGD capacity. Some portions of the existing treatment plant are adequate to provide 2.0 MGD of capacity while other portions must be retrofit. Thus, new customers will take benefit from both existing treatment facilities as well as the expansion. The probable 2024 expansion cost is about $20.8 million (see Table 11). This amount is reduced by about $2.5 million in existing capacity fees. In total, about $18.2 million of wastewater treatment expansion costs are recommended for inclusion in the connection fee.

City of Tehachapi Page 15 Water and Sewer Connection Fee Study
Table 11: Wastewater Treatment Plant Expansion Costs Water and Sewer Connection Fees City of Tehachapi Item Description Quantity Unit Unit Price Amount
1 Reactor Basin 1 LS $5,920,000 $5,920,000 2 Secondary Clarifier 1 LS $1,036,000 $1,036,000 3 RAS/WAS Pumping 1 LS $444,000 $444,000 4 Sludge Dewatering / Drying 1 LS $2,960,000 $2,960,000 5 Standy Power System Expansion 1 LS $592,000 $592,000 6 Site Improvements 1 LS $1,000,000 $1,000,000
Subtotal $11,952,000 Soft Cost (25%) $2,988,000 Contingency (25%) $2,988,000 Total Probable Construction Cost November 2019 $17,928,000 Total Probable Construction Cost November 2024 $20,784,000
Net of existing connection fee fund balance ($2,548,000) Total Expansion Cost (November 2024) $18,236,000 Source: MKN LS - Lump sum; LF - linear foot Notes: 1. Disposal costs have been excluded as the City is currently in development of the GSP project, which would have a separate fee structure. 2. Expansion from 1.25 to 2.0 MGD has been projected based on the City's draft evaluation of buildout conditions. 3. Unit prices from City of Tehachapi - Sewage Treatment and Disposal Connection Fee Study (May 2006) have been scaled to present using ENR CCI (where available). 4. Expansion only includes process expansions and does not include higher-quality treatment (i.e., tertiary).
4.3 Sewer Trunk Lines Cost of Capacity As part of the Sewer Model Report, MKN reviewed the improvements described in the current trunk line connection fee reports. Some of the projects have already been constructed and other projects are still recommended in order to accommodate new development. Tables showing the cost of facilities of the sewer trunk areas are provided in the following section.
City of Tehachapi Page 16 Water and Sewer Connection Fee Study
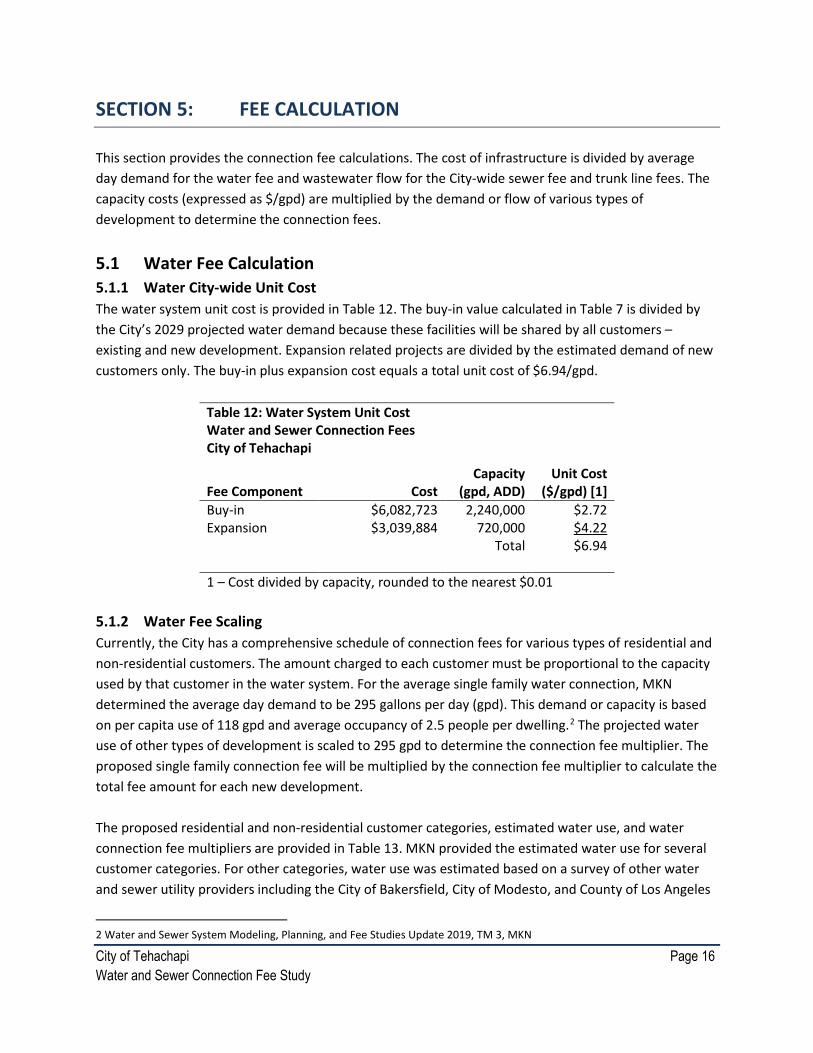
SECTION 5: FEE CALCULATION This section provides the connection fee calculations. The cost of infrastructure is divided by average day demand for the water fee and wastewater flow for the City-wide sewer fee and trunk line fees. The capacity costs (expressed as $/gpd) are multiplied by the demand or flow of various types of development to determine the connection fees.
5.1 Water Fee Calculation 5.1.1 Water City-wide Unit Cost The water system unit cost is provided in Table 12. The buy-in value calculated in Table 7 is divided by the City’s 2029 projected water demand because these facilities will be shared by all customers – existing and new development. Expansion related projects are divided by the estimated demand of new customers only. The buy-in plus expansion cost equals a total unit cost of $6.94/gpd.
Table 12: Water System Unit Cost Water and Sewer Connection Fees City of Tehachapi
Fee Component Cost Capacity
(gpd, ADD) Unit Cost
($/gpd) [1] Buy-in $6,082,723 2,240,000 $2.72 Expansion $3,039,884 720,000 $4.22
Total $6.94 1 – Cost divided by capacity, rounded to the nearest $0.01
5.1.2 Water Fee Scaling Currently, the City has a comprehensive schedule of connection fees for various types of residential and non-residential customers. The amount charged to each customer must be proportional to the capacity used by that customer in the water system. For the average single family water connection, MKN determined the average day demand to be 295 gallons per day (gpd). This demand or capacity is based on per capita use of 118 gpd and average occupancy of 2.5 people per dwelling.2 The projected water use of other types of development is scaled to 295 gpd to determine the connection fee multiplier. The proposed single family connection fee will be multiplied by the connection fee multiplier to calculate the total fee amount for each new development. The proposed residential and non-residential customer categories, estimated water use, and water connection fee multipliers are provided in Table 13. MKN provided the estimated water use for several customer categories. For other categories, water use was estimated based on a survey of other water and sewer utility providers including the City of Bakersfield, City of Modesto, and County of Los Angeles
2 Water and Sewer System Modeling, Planning, and Fee Studies Update 2019, TM 3, MKN

City of Tehachapi Page 17 Water and Sewer Connection Fee Study
Sanitation Districts (LACSD) or based on City of Tehachapi estimates. The City reviewed recent water billing records of commercial customers to estimate typical consumption patterns. Water demand data was taken from the best available source. In most cases, water demand estimates were readily available from MKN, City estimates, or other comparable utility providers and used for the water connection fee calculation. For some classifications, existing water demand information was not available so sewer flows from comparable agencies were used. In these situations, water use was approximated based on the sewer flow divided by a discharge factor (discussed further in Section 5.2.3). The current and proposed water connection fee scaling for various customer types is provided in Table 13. The table also includes new customer categories such as day care centers and medical offices. The City proposed new categories to better reflect anticipated new development. The outdoor irrigation needs of customers should be considered when assessing water connection fees. For non-residential customers, it is assumed that new customers will be required to install dedicated irrigation lines for outdoor water use. Dedicated irrigation lines are presumed to be used in new developments with significant outdoor water demand such as school or park ballfields, common areas of homeowner associations, and/or common areas of strip malls. Minor outdoor use such as a retail store with a few decorative planter boxes is not assumed to be supplied by a dedicated irrigation line. Minor outdoor use is accounted for in residential and non-residential discharge factors discussed in the subsequent section. The fees for landscaped areas served by irrigation-only water lines are based on water use assumptions of various plant types – annual flowers and bedding plants, desert adapted plants, trees and shrubs, and turf grass.

City of Tehachapi Page 18 Water and Sewer Connection Fee Study
Table 13: Water Connection Fee Multipliers Water and Sewer Connection Fees City of Tehachapi
Customer Unit Gallons Per Day Source
Proposed Multiplier
Current Multiplier
Residential Single Family Residence Each 295 [1] 1.00 1.00 Accessory Dwelling Unit Each 118 [2] 0.40 New Duplex Each 472 [3] 1.60 1.17 Triplex Each 708 [3] 2.40 1.76 Fourplex Each 944 [3] 3.20 2.35 Condominium Unit 236 [3] 0.80 0.51 Five Units or More Unit 236 [3] 0.80 0.51 Mobile Home Park Space 236 [3] 0.80 0.51 RV Park Space 120 [4] 0.41 0.31
Non-Residential Animal Kennel 1,000 SF 150 City 0.51 0.24 Auto Repair 1,000 SF 75 City 0.25 0.24 Auto Sales 1,000 SF 125 [5] 0.42 0.24 Car Wash (Tunnel Type) 1,000 SF 4000 City 13.56 8.45 Car Wash (Wand Type) 1,000 SF 875 [5] 2.97 1.62 Day Care Students 12.5 [5] 0.04 New Dry Goods Retail 1,000 SF 18.8 [5], [6] 0.06 0.09 Financial Institution 1,000 SF 150 [7] 0.51 0.24 Fueling Station 1,000 SF 125 [5] 0.42 New Fueling Station w/convenience store 1,000 SF 200 City 0.68 New Fueling Station serving freeway 1,000 SF 500 City 1.69 New Gym/Fitness w/showers 1,000 SF 350 [5] 1.19 New Hospital Beds 250 [5] 0.85 0.42 Hotel / Motel w/ Kitchen Rooms 125 City 0.42 0.29 Hotel / Motel w/out Kitchen Rooms 100 [8] 0.34 0.29 Landscape Irrigation
Annual Flowers & Bedding Plants 1,000 SF 72 [9] 0.24 New Desert Adapted Plants 1,000 SF 27 [9] 0.09 New Trees and Shrubs 1,000 SF 45 [9] 0.15 New Turf Grass 1,000 SF 72 [9] 0.24 New
Laundromat Washing Machines 163 [5] 0.55 0.42 Light Industrial 1,000 SF 50 [8], [10] 0.17 0.26 Light Manufacturing 1,000 SF 31 [5], [10] 0.11 0.10 Manufacturing 1,000 SF 250 [5] 0.85 0.48 Medical Office (Doctor, Dentist, Urgent Care) 1,000 SF 150 [8] 0.51 New Meeting Facility 1,000 SF 125 [5] 0.42 New Night Club 1,000 SF 313 [5] 1.06 0.81 Nursery / Greenhouse (City water) 1,000 SF 100 City, [11] 0.34 0.05 Nursery / Greenhouse (off City water) 1,000 SF 25 City, [12] 0.08 0.48 Nursing Home Beds 250 [5] 0.85 0.42 Office Building 1,000 SF 100 City 0.34 0.48 Open Storage 1,000 SF 19 City 0.06 0.06 Professional Building 1,000 SF 250 City 0.85 0.69 Pub/Bar/Brewery/Winetasting 1,000 SF 438 [5] 1.48 New

City of Tehachapi Page 19 Water and Sewer Connection Fee Study
Customer Unit Gallons Per Day Source
Proposed Multiplier
Current Multiplier
Public Shower Each 176 [13] 0.60 New Recreation (indoor or outdoor) 1,000 SF 156 [5] 0.53 New Restaurant 1,000 SF 400 City 1.36 NA Restaurant 24-hour 1,000 SF 850 City 2.88 NA Restaurant w/ Drive-thru (i.e. Fast Food) 1,000 SF 650 City 2.20 New Restaurant Quick-Serve 1,000 SF 600 City 2.03 New Retail Store 1,000 SF 80 City 0.27 0.24 School Students 18.8 [5] 0.06 0.08 Shopping Center 1,000 SF 250 City 0.85 0.73 Supermarket 1,000 SF 150 City 0.51 0.36 Theater 1,000 SF 156 [5] 0.53 0.30 Warehousing 1,000 SF 19 City 0.06 0.05 Other Commercial / Industrial Employees 18.8 [5] 0.06 0.04
1 – Based on 118 gallons per day per capita and 2.5 persons per dwelling unit (Water and Sewer System Modeling, Planning, and Fee Studies Update 2019, TM 3) 2 – Single occupancy with 118 gpd demand 3 – Occupancy of two people per dwelling unit and 118 gpd per capita demand 4 – Modesto uses 120 gpd. Roughly equal to single occupancy and/or a hotel room with a kitchen 5 – Based on the sewer flow estimate divided by an 80% discharge factor 6 – Bulk goods retail establishment such as ranch supply store or lumber yard 7 – Assumed to be the same as the office category identified in MKN TM3 8 – Water use based on TM3 9 – Based on US Department of Energy "Guidelines for Estimating Unmetered Landscaping Water Use", plant coefficient factors from the American National Standards Institute (ANSI) and the American Society of Agricultural and Biological Engineers (ASABE) Standard S623.1, and 80% irrigation efficiency 10 – Does not include office space at the same location. Office space is assessed a separate connection fee 11 – per 1,000 SF based on the size of the site 12 – per 1,000 SF based on the size of the building 13 – Based on a flow rate of 2.2 gallons per minute and an 8 minute shower ten times a day 5.1.3 Proposed Water Connection Fees The schedule of proposed water connection fees is provided in Table 14. The single family residential fee is calculated as 295 gpd multiplied by $6.94/gpd to equal $2,047. This is a decrease from the current fee of $6,780 per home. The decrease in the connection fee reflects the change in projects recovered by the fee. The prior fee report included over $17.3 million in project and financing costs. This fee report recommends recovery of $5.0 million of expenses3 to be recovered in the water connection fee.
3 Approximately $3.0 million of expansion costs (Table 9) and 32% (Table 3) of the buy-in value (Table 7)

City of Tehachapi Page 20 Water and Sewer Connection Fee Study
Table 14: Proposed Water Connection Fees Water and Sewer Connection Fees City of Tehachapi Customer Unit Proposed Fee Current Fee Residential
Single Family Residence Each $2,047 $6,780 Accessory Dwelling Unit Each $819 New Duplex Each $3,276 $7,933 Triplex Each $4,914 $11,933 Fourplex Each $6,551 $15,933 Condominium Unit $1,638 $3,458 Five Units or More Unit $1,638 $3,458 Mobile Home Park Space $1,638 $3,458 RV Park Space $833 $2,102
Non-Residential Animal Kennel 1,000 SF $1,596 $1,627 Animal Kennel 1,000 SF $1,041 $1,627 Auto Repair 1,000 SF $521 $1,627 Auto Sales 1,000 SF $868 $1,627 Car Wash (Tunnel Type) 1,000 SF $27,760 $57,291 Car Wash (Wand Type) 1,000 SF $6,073 $10,984 Day Care Students $87 New Dry Goods Retail 1,000 SF $130 $610 Financial Institution 1,000 SF $1,041 $1,627 Fueling Station 1,000 SF $868 New Fueling Station w/convenience store 1,000 SF $1,388 New Fueling Station serving freeway 1,000 SF $3,470 New Gym/Fitness w/showers 1,000 SF $2,429 New Hospital Beds $1,735 $2,848 Hotel / Motel w/ Kitchen Rooms $868 $1,966 Hotel / Motel w/out Kitchen Rooms $694 $1,966 Landscape Irrigation
Annual Flowers & Bedding Plants 1,000 SF $500 New Desert Adapted Plants 1,000 SF $187 New Trees and Shrubs 1,000 SF $312 New Turf Grass 1,000 SF $500 New
Laundromat Washing Machines $1,128 $2,848 Light Industrial 1,000 SF $347 $1,763 Light Manufacturing 1,000 SF $217 $678 Manufacturing 1,000 SF $1,735 $3,254 Medical Office (Doctor, Dentist, Urgent Care) 1,000 SF $1,041 New Meeting Facility 1,000 SF $868 New Night Club 1,000 SF $2,169 $5,492 Nursery / Greenhouse (City water) 1,000 SF $694 $339 Nursery / Greenhouse (off City water) 1,000 SF $174 $3,254 Nursing Home Beds $1,735 $2,848 Office Building 1,000 SF $694 $3,254 Open Storage 1,000 SF $132 $407 Professional Building 1,000 SF $1,735 $4,678

City of Tehachapi Page 21 Water and Sewer Connection Fee Study
Customer Unit Proposed Fee Current Fee Pub/Bar/Brewery/Winetasting 1,000 SF $3,036 New Public Shower Each $1,221 New Recreation (indoor or outdoor) 1,000 SF $1,084 New Restaurant 1,000 SF $2,776 New Restaurant 24-hour 1,000 SF $5,899 New Restaurant w/ Drive-thru (i.e. Fast Food) 1,000 SF $4,511 New Restaurant Quick-Serve 1,000 SF $4,164 New Retail Store 1,000 SF $555 $1,627 School Students $130 $542 Shopping Center 1,000 SF $1,735 $4,949 Supermarket 1,000 SF $1,041 $2,441 Theater 1,000 SF $1,084 $2,034 Warehousing 1,000 SF $132 $339 Other Commercial / Industrial Employees $130 $271
The chart below compares Tehachapi’s current and proposed water connection fees for single family development with the fees charged by other local public agencies. With the proposed decrease to the connection fee, the City’s fee falls in the lower end of surveyed agencies.

City of Tehachapi Page 22 Water and Sewer Connection Fee Study
5.2 City-wide Sewer Fee Calculation 5.2.1 Sewer Unit Cost The sewer connection fee unit cost is provided in Table 15. The buy-in cost is divided by the total buildout flow projected for 2029. The expansion cost is divided by the capacity added by the wastewater treatment plant expansion. The total unit cost is calculated as $28.70/gpd.
Table 15: Sewer System Unit Cost Water and Sewer Connection Fees City of Tehachapi
Fee Component Cost Capacity (gpd, ADF) Unit Cost
($/gpd) [1] Buy-in $5,440,976 1,240,000 $4.39 Expansion $18,236,000 750,000 $24.31
Total $28.70 1 – Cost divided by capacity, rounded to the nearest $0.01
5.2.2 Allocation to Flow and Loading The current sewer connection fee recovers costs from new development based on average day flow. It is recommended that the updated connection fee reflect the flow and wastewater pollutant strength of each new customer. Thus, the cost of existing facilities is allocated across flow, biochemical oxygen demand (BOD), and total suspended solids (TSS). This methodology more fairly recovers costs from customers with higher strength flow. The allocation of treatment costs is based on engineering rules of thumb for primary and secondary treatment. Pipelines and pump stations are allocated 100% to flow.
Table 16: Cost Allocation to Sewer Flow and Pollutant Loading Water and Sewer Connection Fees City of Tehachapi
Facilities [1] RCNLD
(Existing Facilities) Flow BOD TSS Pipelines & Pump Stations $1,610,183 100% 0% 0% Treatment $3,708,725 55% 20% 25% $5,318,908 $3,649,982 $741,745 $927,181
Composite 69% 14% 17% Treatment Cost Allocation
Primary Treatment 70% 10% 20% Secondary Treatment 40% 30% 30%
Recommended 55% 20% 25%
1 – Office, buildings, and fleet vehicle assets are not included in the determination of flow, BOD, and TSS percentages. Instead, these assets are allocated based on the composite calculated here.

City of Tehachapi Page 23 Water and Sewer Connection Fee Study
5.2.3 Sewer Fee Scaling The proposed City-wide sewer fees are scaled based on each customer’s estimated flows and loads. The wastewater flows of various customer classes were projected based on a percentage return rate of water consumed and discharged to the sewer collection system. Based on information provided by MKN, the return rate for single family residential connections is estimated at 57%, multi-family residential is 50%, and non-residential connections is 80%. The estimated daily flow for a single family residential customer is 168 gpd based on water use of 295 gpd. The assumed residential pollutant concentrations are 225 mg/l BOD and 180 mg/l TSS based on assumptions used by the City of Bakersfield. The flows and loads of non-residential customers were based on water use estimates and an 80% sewer discharge rate or estimates used by other comparable agencies, see Table 17. To determine the sewer fee multiplier for various customer types, the flow, BOD, and TSS of each new customer will be scaled to the flow and strength characteristics of a single family home as shown in the equation below:
𝑀𝑀𝑀𝑀𝑀𝑀𝑀𝑀𝑀𝑀𝑀𝑀𝑀𝑀𝑀𝑀𝑀𝑀𝑀𝑀 = 𝐹𝐹𝐹𝐹𝐹𝐹𝐹𝐹𝑆𝑆𝐹𝐹 𝐹𝐹𝐹𝐹𝐹𝐹𝐹𝐹
X (69% + [14% X 𝐵𝐵𝐵𝐵𝐵𝐵𝑆𝑆𝐹𝐹 𝐵𝐵𝐵𝐵𝐵𝐵
]+ [17% X 𝑇𝑇𝑆𝑆𝑆𝑆𝑆𝑆𝐹𝐹 𝑇𝑇𝑆𝑆𝑆𝑆
] )
SF – Single Family

City of Tehachapi Page 24 Water and Sewer Connection Fee Study
Table 17: Sewer Connection Fee Multipliers Water and Sewer Connection Fees City of Tehachapi
Customer Unit Flow Source BOD TSS Source Proposed Multiplier
Current Multiplier
Cost Allocation 69% 14% 17% Residential
Single Family Residence Each 168 [1] 225 180 Bakersfield 1.00 1.00 Accessory Dwelling Unit Each 59 [2] 225 180 Bakersfield 0.35 New Duplex Each 236 [2] 225 180 Bakersfield 1.40 1.15 Triplex Each 354 [2] 225 180 Bakersfield 2.11 1.72 Fourplex Each 472 [2] 225 180 Bakersfield 2.81 2.29 Condominium Unit 118 [2] 225 180 Bakersfield 0.70 0.58 Five Units or More Unit 118 [2] 225 180 Bakersfield 0.70 0.58 Mobile Home Park Space 118 [2] 225 180 Bakersfield 0.70 0.58 RV Park Space 60 [2] 225 180 Bakersfield 0.36 0.31
Non-Residential Animal Kennel 1,000 SF 120 [3] 200 200 [15] 0.72 0.37 Auto Repair 1,000 SF 60 [3] 180 280 Bakersfield 0.38 0.37 Auto Sales 1,000 SF 100 LACSD 130 80 Bakersfield 0.50 0.37 Car Wash (Tunnel Type) 1,000 SF 3200 [3] 20 150 Bakersfield 16.07 13.64 Car Wash (Wand Type) 1,000 SF 700 LACSD 20 150 Bakersfield 3.52 2.57 Day Care Students 10 [4] 130 100 Bakersfield 0.05 New Dry Goods Retail 1,000 SF 15 [5], [6] 150 150 Bakersfield 0.08 NA Financial Institution 1,000 SF 120 [3] 130 80 Bakersfield 0.60 0.37 Fueling Station 1,000 SF 100 LACSD 180 280 Bakersfield 0.64 New Fueling Station w/convenience store 1,000 SF 160 [3] 180 280 Bakersfield 1.02 New
Fueling Station serving freeway 1,000 SF 400 [3] 180 280 Bakersfield 2.55 New Gym/Fitness w/showers 1,000 SF 280 Modesto 180 150 [16] 1.57 New Hospital Beds 200 [7] 250 100 Bakersfield 1.12 0.92 Hotel / Motel w/ Kitchen Rooms 100 [3] 225 180 [17] 0.60 0.46 Hotel / Motel w/out Kitchen Rooms 80 [3] 225 180 [17] 0.48 0.46 Laundromat Washing Machines 130 Modesto 150 110 Modesto 0.69 0.64 Light Industrial 1,000 SF 40 [3], [8] 180 150 Bakersfield 0.22 0.60 Light Manufacturing 1,000 SF 25 LACSD, [8] 130 80 [18] 0.13 0.09 Manufacturing 1,000 SF 200 LACSD, [8] 180 150 [16] 1.12 0.70 Medical Office (Doctor, Dentist, Urgent Care) 1,000 SF 120 [3] 225 180 [17] 0.71 New
Meeting Facility 1,000 SF 100 [9] 130 80 [18] 0.50 New Night Club 1,000 SF 250 [10] 200 200 Modesto 1.49 1.28 Nursery / Greenhouse (City water) 1,000 SF 80 [3], [11] 130 80 [18] 0.40 New Nursery / Greenhouse (off City water) 1,000 SF 20 [3], [12] 130 80 [18] 0.10 New
Nursing Home Beds 200 same as hospital 225 180 [17] 1.19 0.92
Office Building 1,000 SF 80 [3] 130 80 [18] 0.40 0.73 Open Storage 1,000 SF 15.2 [3] 130 80 [18] 0.08 0.09 Professional Building 1,000 SF 200 [3] 130 80 [18] 1.01 1.10 Pub/Bar/Brewery/Winetasting 1,000 SF 350 [10] 225 180 [17] 2.08 New Public Shower Each 141 [3] 130 80 [18] 0.71 New Recreation (indoor or outdoor) 1,000 SF 125 [13] 200 250 Bakersfield 0.78 New Restaurant 1,000 SF 320 [3] 400 240 Modesto 2.22 3.68 Restaurant 24-hour 1,000 SF 680 [3] 400 240 Modesto 4.72 New

City of Tehachapi Page 25 Water and Sewer Connection Fee Study
Customer Unit Flow Source BOD TSS Source Proposed Multiple
Current Multiple
Restaurant w/ Drive-thru (i.e. Fast Food) 1,000 SF 520 [3] 400 240 Modesto 3.61 New
Restaurant Quick-Serve 1,000 SF 480 [3] 400 240 Modesto 3.33 New Retail Store 1,000 SF 64 [3] 150 150 Bakersfield 0.35 0.37 School Students 15 [4] 130 100 Bakersfield 0.08 0.07 Shopping Center 1,000 SF 200 [3] 180 150 [16] 1.12 1.19 Supermarket 1,000 SF 120 [3] 400 240 [19] 0.83 0.55 Theater 1,000 SF 125 LACSD 200 200 Modesto 0.75 0.46 Warehousing 1,000 SF 15.2 [3] 130 80 [18] 0.08 0.09 Other Commercial / Industrial Employees 15 [14] 130 100 [14] 0.08 0.06
1 – Water demand multiplied by a 57% discharge factor 2 – Water demand multiplied by a 50% discharge factor 3 – Water demand multiplied by an 80% discharge factor 4 – LACSD uses 20 gpd for universities; Bakersfield uses 12 gpd; Modesto uses 10 gpd for high school. 15 gpd was used for “school” and 10 was used for “daycare” as a mid-point between the surveyed agencies 5 – Taken as a mid-point between LACSD’s small and large warehousing and light manufacturing categories 6 – Bulk goods retail establishment such as ranch supply store or lumber yard 7 – Taken as a mid-point between Modesto and Bakersfield; Modesto uses 250 gpd/bed and Bakersfield uses 180/bed 8 – Does not include office space at the same location. Office space is assessed a separate connection fee 9 – Assumed to be slightly less than financial institutions to reflect lower occupancy of meeting facilities 10 – LACSD uses 350 gpd for night club; Modesto uses 350 gpd for “bars without dining”; 350 gpd is used for pub/bar/winetasting. Its assumed that a nightclub would generate less water use/sewer flow 11 – per 1,000 SF based on the size of the site 12 – per 1,000 SF based on the size of the building 13 – Data taken from LACSD; mid-point between bowling/skating and structures at a park or golf course 14 – Same as school 15 – Strength used by most commercial categories in Modesto 16 – Assumed to be the same as light industrial 17 – Bakersfield domestic strength 18 – Bakersfield combination store and office 19 – High variability in this category. Bakersfield uses 800 mg/l BOD and TSS. Modesto uses 200 BOD and TSS but shopping center strengths are much higher. It’s unclear if this category includes an on-site butcher, bakery, deli, and/or coffee shop. Modesto restaurant BOD and TSS used.
5.2.4 Proposed Sewer Connection Fee Based on an average day flow of 168 gpd and a cost of $28.70/gpd, the single family sewer connection fee is $4,822. The proposed fees for other customer classes are scaled based on the fee multipliers. The full schedule of proposed sewer connection fees is provided in Table 18.

City of Tehachapi Page 26 Water and Sewer Connection Fee Study
Table 18: Proposed Sewer Connection Fees Water and Sewer Connection Fees City of Tehachapi Customer Unit Proposed Fee Current Fee Residential
Single Family Residence Each $4,822 $7,259 Accessory Dwelling Unit Each $1,688 New Duplex Each $6,751 $8,348 Triplex Each $10,174 $12,485 Fourplex Each $13,550 $16,623 Condominium Unit $3,375 $4,210 Five Units or More Unit $3,375 $4,210 Mobile Home Park Space $3,375 $4,210 RV Park Space $1,736 $2,250
Non-Residential Animal Kennel 1,000 SF $3,472 $2,686 Auto Repair 1,000 SF $1,832 $2,686 Auto Sales 1,000 SF $2,411 $2,686 Car Wash (Tunnel Type) 1,000 SF $77,490 $99,013 Car Wash (Wand Type) 1,000 SF $16,973 $18,656 Day Care Students $241 New Dry Goods Retail 1,000 SF $386 NA Financial Institution 1,000 SF $2,893 $2,686 Fueling Station 1,000 SF $3,086 New Fueling Station w/convenience store 1,000 SF $4,918 New Fueling Station serving freeway 1,000 SF $12,296 New Gym/Fitness w/showers 1,000 SF $7,571 New Hospital Beds $5,401 $6,678 Hotel / Motel w/ Kitchen Rooms $2,893 $3,339 Hotel / Motel w/out Kitchen Rooms $2,315 $3,339 Laundromat Washing Machines $3,327 $4,646 Light Industrial 1,000 SF $1,061 $4,355 Light Manufacturing 1,000 SF $627 $653 Manufacturing 1,000 SF $5,401 $5,081 Medical Office (Doctor, Dentist, Urgent Care) 1,000 SF $3,424 New Meeting Facility 1,000 SF $2,411 New Night Club 1,000 SF $7,185 $9,292 Nursery / Greenhouse (City water) 1,000 SF $1,929 New Nursery / Greenhouse (off City water) 1,000 SF $482 New Nursing Home Beds $5,738 $6,678 Office Building 1,000 SF $1,929 $5,299 Open Storage 1,000 SF $386 $653 Professional Building 1,000 SF $4,870 $7,985 Pub/Bar/Brewery/Winetasting 1,000 SF $10,030 New Public Shower Each $3,424 New Recreation (indoor or outdoor) 1,000 SF $3,761 New Restaurant 1,000 SF $10,705 $26,713 Restaurant 24-hour 1,000 SF $22,760 New

City of Tehachapi Page 27 Water and Sewer Connection Fee Study
Customer Unit Proposed Fee Current Fee Restaurant w/ Drive-thru (i.e. Fast Food) 1,000 SF $17,407 New Restaurant Quick-Serve 1,000 SF $16,057 New Retail Store 1,000 SF $1,688 $2,686 School Students $386 $508 Shopping Center 1,000 SF $5,401 $8,638 Supermarket 1,000 SF $4,002 $3,992 Theater 1,000 SF $3,617 $3,339 Warehousing 1,000 SF $386 $653 Other Commercial / Industrial Employees $386 $436
The chart below compares Tehachapi’s current and proposed sewer connection fees for single family development with the fees charged by other local public agencies.

City of Tehachapi Page 28 Water and Sewer Connection Fee Study
5.3 Sewer Trunk Line Fee Calculations The sewer trunk line connection fees are calculated in the tables below. The fees reflect revised projects and costs developed by MKN and the City of Tehachapi. The fees include the original cost of existing assets or the construction cost for new facilities, as applicable. The Downtown sewer trunk fee is calculated in Table 19. Facilities include the existing 15-inch pipeline and proposed new pipe segments. The cost of the proposed project is reduced by the connection fee fund balance. The total cost (existing plus new facilities) is divided by the buildout capacity of the Downtown trunk area. The proposed pipe segment will benefit both existing and future Downtown customers.
Table 19: Downtown Sewer Trunk Unit Cost of Capacity Water and Sewer Connection Fees City of Tehachapi
Projects Cost Notes Capacity
(ADF, gpd) Unit Cost ($/gpd)
Existing Downtown Trunk facilities (asset # 444-510-00571): 15-inch sewer north from intersection of Valley Boulevard and Curry Street and then west along C Street ending at the intersection of Pauley Street and C Street (Phase 1) [1]
$476,732 Original Cost
15-inch trunk line beginning at the intersection of Pauley Street and C Street and continue north along Pauley Street then east along Tehachapi Boulevard connecting to the 15-inch trunk sewer at the intersection of Tehachapi Boulevard and Mill Street [2]
$1,377,000 Opinion of Probable
Construction Cost August 2024
Less existing connection fee fund balance ($173,074) Total Downtown Trunk $1,680,658 511,200 $3.29 1 – Improvement #1 from the Study of Sewer System Connection Fees Downtown Sewer Service Area (January 2006) as constructed 2 – Improvement #4 from the Study of Sewer System Connection Fees Downtown Sewer Service Area (January 2006); construction cost updated by MKN in Sewer Model Report (October 2019)

City of Tehachapi Page 29 Water and Sewer Connection Fee Study
Table 20 provides the Industrial sewer trunk fee calculation. The Industrial area’s current facilities are adequate to support development through year 2029 and no additional projects are proposed. The fee is calculated as the remaining cost of facilities (net of fees already paid and grants) divided by the remaining capacity.
Table 20: Industrial Sewer Trunk Unit Cost of Capacity Water and Sewer Connection Fees City of Tehachapi
Projects Cost Notes Capacity
(ADF, gpd) Unit Cost ($/gpd)
Existing Industrial Trunk facilities (asset # 444-510-00195): Pipeline east from WWTP on Dennison to Tehachapi Boulevard and the pipeline east from WWTP along Highway 58 to Steuber Road, then south on Steuber Road [1]
$544,951 Original cost
Less existing connection fee fund balance ($142,460)
Less RDA Fund ($345,277)
Total Industrial Trunk $57,214 184,320 $0.31 1 - Improvements #1 & 2 from the Industrial Sewer Trunk Lines Connection Fee (November 1995) as constructed

City of Tehachapi Page 30 Water and Sewer Connection Fee Study
Table 21 provides the Mountain View trunk fee calculation. Construction of the Mountain View area has not yet been triggered so there are no existing facilities. The cost of proposed sewer pipelines is divided by the buildout capacity of the area.
Table 21: Mountain View Sewer Trunk Unit Cost of Capacity Water and Sewer Connection Fees City of Tehachapi
Projects [1] Cost Notes Capacity
(ADF, gpd) Unit Cost ($/gpd)
Parallel 8-inch sewer from the intersection of Cherry Ln and Hickory Ave to the intersection of Cherry Ln and Beech St
see total below
8-inch parallel line from the intersection of Valley Blvd and Beech St to the intersection of Valley Blvd and Mountain View Ave
see total below
10-inch sewer from the intersection of Valley Blvd and Beech St to the intersection of Valley Blvd and Griffin St, then along Griffin St north to the existing 10-inch sewer pipe
see total below
Opinion of Probable Construction Cost
August 2024
15-inch parallel line from the intersection of Mountain View Ave and E St to the intersection of Mountain View Ave and Tehachapi Blvd and tie-in to the existing 18-inch sewer trunk
see total below
Mountain View Trunk Total $2,114,000 580,000 $3.64
1 - Improvements #1 - 4 from the Sewer System Evaluation Study Mountain View Sewer Service Area (December 2006); construction cost updated by MKN in Sewer Model Report (October 2019)

City of Tehachapi Page 31 Water and Sewer Connection Fee Study
Table 22 provides the Tucker area trunk fee calculation. Similar to the Industrial area, the Tucker fee area is not proposed to add any new projects through 2029. Thus, the fee is calculated as the remaining cost of existing facilities divided by the remaining capacity available for new customers.
Table 22: Tucker Sewer Trunk Unit Cost of Capacity Water and Sewer Connection Fees City of Tehachapi
Project Cost Notes Capacity
(ADF, gpd) Unit Cost
($/gpd) Sewer lift station at the intersection of Tehachapi Blvd and Tucker Rd and force main from the sewer lift station to Mulberry St (asset # 444-520-00661) [1]
$90,940 Original Cost
12-inch sewer in Tucker Rd from Conway Ave to the sewer lift station (asset # 444-510-00534) [2]
$1,046,686 Original Cost
8-inch sewer from Conway Ave and Antelope Run to the new 12” sewer in Tucker Rd $0 [3]
Less existing connection fee fund balance ($85,231) Less RDA Fund ($300,000)
Total Tucker Trunk $829,409 72,000 $11.52
1 - Improvements #1 & #2 from the Tucker Sewer Service Area Development Fee Study (January 1998) as constructed 2 - Improvement #3 from the Tucker Sewer Service Area Development Fee Study (January 1998) as constructed 3 - Improvement #4 from the Tucker Sewer Service Area Development Fee Study (January 1998) was constructed by a private developer at no cost to the City
The sewer trunk lines are part of the City’s collection system. Therefore, costs are recovered from customers on the basis of sewer flow. Wastewater pollutant strength does not factor into the calculations. A summary of the unit cost of capacity and the resulting residential connection fee (based on 168 gpd flow) is provided in Table 23. The complete list of trunk connection fees for other types of development is provided in Appendix A. It should be noted that the current trunk fee reports used various methods to project new development. Each fee study attributed a different flow generation rate to a single family home. This study standardizes the definition of a sewer EDU as 168 gpd across all trunk service areas.

City of Tehachapi Page 32 Water and Sewer Connection Fee Study
Table 23: Summary of Proposed Trunk Fees Water and Sewer Connection Fees City of Tehachapi
Sewer Trunk Fee Unit Cost ($/gpd)
Proposed Single Family
Residential Fee
Current Single Family
Residential Fee Downtown Trunk Fee $3.29 $552 $927 Industrial Trunk Fee $0.31 $52 $300 Mountain View Trunk Fee $3.64 $612 Not defined Tucker Trunk Fee $11.52 $1,935 $600
City of Tehachapi Appendix A Water and Sewer Connection Fee Study
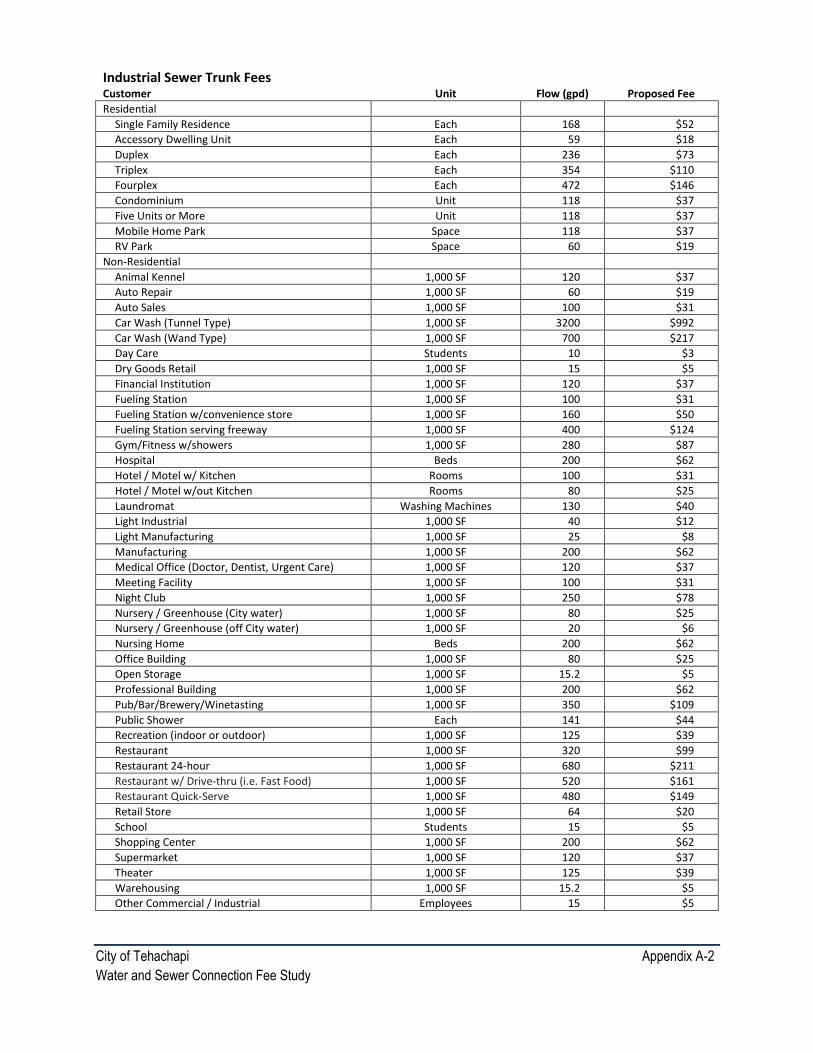
APPENDIX A: Schedule of Proposed Sewer Trunk Fees A comprehensive schedule of connection fees for each sewer trunk service area is provided below. The unit costs ($/gpd) provided in Table 23 are multiplied by the estimated wastewater flow of each customer to calculate the proposed fee.

City of Tehachapi Appendix A-1 Water and Sewer Connection Fee Study
Downtown Sewer Trunk Fees Customer Unit Flow (gpd) Proposed Fee Residential
Single Family Residence Each 168 $552 Accessory Dwelling Unit Each 59 $194 Duplex Each 236 $776 Triplex Each 354 $1,164 Fourplex Each 472 $1,552 Condominium Unit 118 $388 Five Units or More Unit 118 $388 Mobile Home Park Space 118 $388 RV Park Space 60 $197
Non-Residential $0 Animal Kennel 1,000 SF 120 $395 Auto Repair 1,000 SF 60 $197 Auto Sales 1,000 SF 100 $329 Car Wash (Tunnel Type) 1,000 SF 3200 $10,521 Car Wash (Wand Type) 1,000 SF 700 $2,301 Day Care Students 10 $33 Dry Goods Retail 1,000 SF 15 $49 Financial Institution 1,000 SF 120 $395 Fueling Station 1,000 SF 100 $329 Fueling Station w/convenience store 1,000 SF 160 $526 Fueling Station serving freeway 1,000 SF 400 $1,315 Gym/Fitness w/showers 1,000 SF 280 $921 Hospital Beds 200 $658 Hotel / Motel w/ Kitchen Rooms 100 $329 Hotel / Motel w/out Kitchen Rooms 80 $263 Laundromat Washing Machines 130 $427 Light Industrial 1,000 SF 40 $132 Light Manufacturing 1,000 SF 25 $82 Manufacturing 1,000 SF 200 $658 Medical Office (Doctor, Dentist, Urgent Care) 1,000 SF 120 $395 Meeting Facility 1,000 SF 100 $329 Night Club 1,000 SF 250 $822 Nursery / Greenhouse (City water) 1,000 SF 80 $263 Nursery / Greenhouse (off City water) 1,000 SF 20 $66 Nursing Home Beds 200 $658 Office Building 1,000 SF 80 $263 Open Storage 1,000 SF 15.2 $50 Professional Building 1,000 SF 200 $658 Pub/Bar/Brewery/Winetasting 1,000 SF 350 $1,151 Public Shower Each 141 $463 Recreation (indoor or outdoor) 1,000 SF 125 $411 Restaurant 1,000 SF 320 $1,052 Restaurant 24-hour 1,000 SF 680 $2,236 Restaurant w/ Drive-thru (i.e. Fast Food) 1,000 SF 520 $1,710 Restaurant Quick-Serve 1,000 SF 480 $1,578 Retail Store 1,000 SF 64 $210 School Students 15 $49 Shopping Center 1,000 SF 200 $658 Supermarket 1,000 SF 120 $395 Theater 1,000 SF 125 $411 Warehousing 1,000 SF 15.2 $50 Other Commercial / Industrial Employees 15 $49
City of Tehachapi Appendix A-2 Water and Sewer Connection Fee Study
Industrial Sewer Trunk Fees Customer Unit Flow (gpd) Proposed Fee Residential
Single Family Residence Each 168 $52 Accessory Dwelling Unit Each 59 $18 Duplex Each 236 $73 Triplex Each 354 $110 Fourplex Each 472 $146 Condominium Unit 118 $37 Five Units or More Unit 118 $37 Mobile Home Park Space 118 $37 RV Park Space 60 $19
Non-Residential Animal Kennel 1,000 SF 120 $37 Auto Repair 1,000 SF 60 $19 Auto Sales 1,000 SF 100 $31 Car Wash (Tunnel Type) 1,000 SF 3200 $992 Car Wash (Wand Type) 1,000 SF 700 $217 Day Care Students 10 $3 Dry Goods Retail 1,000 SF 15 $5 Financial Institution 1,000 SF 120 $37 Fueling Station 1,000 SF 100 $31 Fueling Station w/convenience store 1,000 SF 160 $50 Fueling Station serving freeway 1,000 SF 400 $124 Gym/Fitness w/showers 1,000 SF 280 $87 Hospital Beds 200 $62 Hotel / Motel w/ Kitchen Rooms 100 $31 Hotel / Motel w/out Kitchen Rooms 80 $25 Laundromat Washing Machines 130 $40 Light Industrial 1,000 SF 40 $12 Light Manufacturing 1,000 SF 25 $8 Manufacturing 1,000 SF 200 $62 Medical Office (Doctor, Dentist, Urgent Care) 1,000 SF 120 $37 Meeting Facility 1,000 SF 100 $31 Night Club 1,000 SF 250 $78 Nursery / Greenhouse (City water) 1,000 SF 80 $25 Nursery / Greenhouse (off City water) 1,000 SF 20 $6 Nursing Home Beds 200 $62 Office Building 1,000 SF 80 $25 Open Storage 1,000 SF 15.2 $5 Professional Building 1,000 SF 200 $62 Pub/Bar/Brewery/Winetasting 1,000 SF 350 $109 Public Shower Each 141 $44 Recreation (indoor or outdoor) 1,000 SF 125 $39 Restaurant 1,000 SF 320 $99 Restaurant 24-hour 1,000 SF 680 $211 Restaurant w/ Drive-thru (i.e. Fast Food) 1,000 SF 520 $161 Restaurant Quick-Serve 1,000 SF 480 $149 Retail Store 1,000 SF 64 $20 School Students 15 $5 Shopping Center 1,000 SF 200 $62 Supermarket 1,000 SF 120 $37 Theater 1,000 SF 125 $39 Warehousing 1,000 SF 15.2 $5 Other Commercial / Industrial Employees 15 $5

City of Tehachapi Appendix A-3 Water and Sewer Connection Fee Study
Mountain View Sewer Trunk Fees Customer Unit Flow (gpd) Proposed Fee Residential
Single Family Residence Each 168 $612 Accessory Dwelling Unit Each 59 $215 Duplex Each 236 $859 Triplex Each 354 $1,289 Fourplex Each 472 $1,718 Condominium Unit 118 $430 Five Units or More Unit 118 $430 Mobile Home Park Space 118 $430 RV Park Space 60 $218
Non-Residential Animal Kennel 1,000 SF 120 $437 Auto Repair 1,000 SF 60 $218 Auto Sales 1,000 SF 100 $364 Car Wash (Tunnel Type) 1,000 SF 3200 $11,648 Car Wash (Wand Type) 1,000 SF 700 $2,548 Day Care Students 10 $36 Dry Goods Retail 1,000 SF 15 $55 Financial Institution 1,000 SF 120 $437 Fueling Station 1,000 SF 100 $364 Fueling Station w/convenience store 1,000 SF 160 $582 Fueling Station serving freeway 1,000 SF 400 $1,456 Gym/Fitness w/showers 1,000 SF 280 $1,019 Hospital Beds 200 $728 Hotel / Motel w/ Kitchen Rooms 100 $364 Hotel / Motel w/out Kitchen Rooms 80 $291 Laundromat Washing Machines 130 $473 Light Industrial 1,000 SF 40 $146 Light Manufacturing 1,000 SF 25 $91 Manufacturing 1,000 SF 200 $728 Medical Office (Doctor, Dentist, Urgent Care) 1,000 SF 120 $437 Meeting Facility 1,000 SF 100 $364 Night Club 1,000 SF 250 $910 Nursery / Greenhouse (City water) 1,000 SF 80 $291 Nursery / Greenhouse (off City water) 1,000 SF 20 $73 Nursing Home Beds 200 $728 Office Building 1,000 SF 80 $291 Open Storage 1,000 SF 15.2 $55 Professional Building 1,000 SF 200 $728 Pub/Bar/Brewery/Winetasting 1,000 SF 350 $1,274 Public Shower Each 141 $513 Recreation (indoor or outdoor) 1,000 SF 125 $455 Restaurant 1,000 SF 320 $1,165 Restaurant 24-hour 1,000 SF 680 $2,475 Restaurant w/ Drive-thru (i.e. Fast Food) 1,000 SF 520 $1,893 Restaurant Quick-Serve 1,000 SF 480 $1,747 Retail Store 1,000 SF 64 $233 School Students 15 $55 Shopping Center 1,000 SF 200 $728 Supermarket 1,000 SF 120 $437 Theater 1,000 SF 125 $455 Warehousing 1,000 SF 15.2 $55 Other Commercial / Industrial Employees 15 $55

City of Tehachapi Appendix A-4 Water and Sewer Connection Fee Study
Tucker Sewer Trunk Fees Customer Unit Flow (gpd) Proposed Fee Residential
Single Family Residence Each 168 $1,935 Accessory Dwelling Unit Each 59 $680 Duplex Each 236 $2,719 Triplex Each 354 $4,078 Fourplex Each 472 $5,437 Condominium Unit 118 $1,359 Five Units or More Unit 118 $1,359 Mobile Home Park Space 118 $1,359 RV Park Space 60 $691
Non-Residential Animal Kennel 1,000 SF 120 $1,382 Auto Repair 1,000 SF 60 $691 Auto Sales 1,000 SF 100 $1,152 Car Wash (Tunnel Type) 1,000 SF 3200 $36,864 Car Wash (Wand Type) 1,000 SF 700 $8,064 Day Care Students 10 $115 Dry Goods Retail 1,000 SF 15 $173 Financial Institution 1,000 SF 120 $1,382 Fueling Station 1,000 SF 100 $1,152 Fueling Station w/convenience store 1,000 SF 160 $1,843 Fueling Station serving freeway 1,000 SF 400 $4,608 Gym/Fitness w/showers 1,000 SF 280 $3,226 Hospital Beds 200 $2,304 Hotel / Motel w/ Kitchen Rooms 100 $1,152 Hotel / Motel w/out Kitchen Rooms 80 $922 Laundromat Washing Machines 130 $1,498 Light Industrial 1,000 SF 40 $461 Light Manufacturing 1,000 SF 25 $288 Manufacturing 1,000 SF 200 $2,304 Medical Office (Doctor, Dentist, Urgent Care) 1,000 SF 120 $1,382 Meeting Facility 1,000 SF 100 $1,152 Night Club 1,000 SF 250 $2,880 Nursery / Greenhouse (City water) 1,000 SF 80 $922 Nursery / Greenhouse (off City water) 1,000 SF 20 $230 Nursing Home Beds 200 $2,304 Office Building 1,000 SF 80 $922 Open Storage 1,000 SF 15.2 $175 Professional Building 1,000 SF 200 $2,304 Pub/Bar/Brewery/Winetasting 1,000 SF 350 $4,032 Public Shower Each 141 $1,622 Recreation (indoor or outdoor) 1,000 SF 125 $1,440 Restaurant 1,000 SF 320 $3,686 Restaurant 24-hour 1,000 SF 680 $7,834 Restaurant w/ Drive-thru (i.e. Fast Food) 1,000 SF 520 $5,990 Restaurant Quick-Serve 1,000 SF 480 $5,530 Retail Store 1,000 SF 64 $737 School Students 15 $173 Shopping Center 1,000 SF 200 $2,304 Supermarket 1,000 SF 120 $1,382 Theater 1,000 SF 125 $1,440 Warehousing 1,000 SF 15.2 $175 Other Commercial / Industrial Employees 15 $173