water and graphite in the earth's crust —an …...water and graphite in the earth's...
TRANSCRIPT

W A T E R A N D G R A P H I T E I N T H E E A R T H ' S C R U S T -
A N A P P R O A C H T O I N T E R P R E T A T I O N O F
C O N D U C T I V I T Y M O D E L S
H. J O D I C K E
Institut far Geophysik, Corrensstr. 24, D-4400 Miinster, Germany
(Received 7 May 1991; accepted 12 March 1992)
Abstract. In the present discussion on the origin of highly conducting layers in the middle and lower crust, water (brines) and graphite are widely accepted as the two most promising explanations. In this review, petrophysical and petrological aspects are summarized aiming at an understanding of how the indispensable interconnectedness of these highly conducting phases within a normally insulating rock matrix may be established and maintained under conditions of the upper and the lower crust. Accord- ingly, interpretation of conductivity models will be conclusive in cases of conductance values reaching several thousand S for layers at deeper crustal level since they can not be explained other than by the existence of metaanthracitic or graphitic rocks. In cases of low to moderate conductance values as often observed, e.g., at the transition zone from the upper to the lower crust, interpretation may remain ambiguous and may need further multidisciplinary investigations.
1. Introduction
In the past 20-30 years, magnetotelluric (MT) and deep geomagnetic (GDS) soundings revealed an unexpectedly complex conductivity structure of the Earth's crust and upper mantle (for recent publications see, e.g., Hjelt 1988, and Schwarz 1990). During that time particularly the detection of highly conducting layers in the middle and lower crust, in tectonically active regions as well as in stable shield areas, stimulated many disputes about the origin of these layers. One specific reason for an early interest in such layers undoubtedly was the interpretation by Hyndman and Hyndman (1968) who proposed that a water-saturated deep crust, in contrast not only to orthodox petrological views (e.g., Yardley 1986), causes the observed high electrical conductivity.
In the present discussion it is widely accepted that besides highly saline water (brines), also partial melts, serpentinites (if containing magnetite and hematite), and graphite are possible candidates to explain high conductivity at crustal depths (e.g., Frost et al. 1989). Normally the main rock (matrix) forming minerals are highly insulating whereas a very small portion of well conducting material, usually a few percent only, may cause enhanced conductivity of the whole rock mass provided that material fills far reaching cracks or connected pore space, or covers grain surfaces. Thus, for a more detailed interpretation of crustal high conductivity anomalies it is necessary to answer the question how an indispensable intercon- nectivity of the well conducting phase is established and maintained over large distances under deep crustal conditions.
Surveys in Geophysics 13: 381-407, 1992. �9 1992 Kluwer Academic Publishers. Printed in the Netherlands.

382 u. JODICKE
The following approach to understanding of possible sources of high conductivity in the crust does not intend to summarize all aspects of this topic. General and comprehensive considerations may be found in the papers by Gough (1986), Haak and Hutton (1986), Jones (1987), or Mareschal (1989), to quote only a few of the more recent publications. The discussion presented here instead focuses on two explanations, namely water and/or graphite, and takes into consideration petro- physical and petrological evidence of conductivity models. At the present state of the art, contributions to high crustal conductivity by partial melts, serpentinites, and also zeolites (Parkhomenko 1967; Olhoeft 1986), or just temperature effects (Brace 1971; Shankland and Ander 1983) are thought to be of minor importance or to be restricted to areas of very specific tectonic or thermal situations.
Little help comes from MT or GDS methods to decide between the possible candidates for high conductivity. Although all induction methods are specifically capable of detecting rather conductive than resistive bodies in the subsurface, any petrological interpretation of conductivity models has to take into account impor- tant limitations which are due to generally low resolution. In particular, it is not the conductivity but the integrated conductivity (product of conductivity and thickness) of highly conducting layers at larger depth that is best resolved because of the "principle of equivalence" (Patra and Mallick 1980; Fischer and Le Quang 1982; Jones 1987). For example, it turns out to be almost impossible for surface induction methods to distinguish between a 5 cm thin graphite vein and a 10 km thick porous, brine filled horizon in the deep crust, if no further constraints to the values of either conductivity or layer thickness are available, e.g., from seismic results. As the parameter conductivity is not readily obtainable even sophisticated attempts to determine the origin of enhanced conductivity, for example, by esti- mating the activation energy from field observations of the depth or temperature dependence of crustal conductors (Shankland and Ander 1983), appear to be of restricted value only.
2. Electrolytical Conduction by Fluids
2.1 . UPPER CRUST
It is well known that near-surface water-saturated rocks in young sedimentary basins are often excellent conductors. The conductivity O-o of such rocks is based on an electrolytical conduction mechanism which can basically be described by the equation (Schopper 1982)
O-o = (1/F)o-w + O-qo,
where F denotes the formation factor, O-w the conductivity of the electrolytic aqueous solution (filling the open pore space) and trqo the surface conductivity (Helmholtz's double layer conductivity). The term O-go depends largely on the size

10 "1 m
T
F i g . 1.
1
10 4
103 10 -3 10 -z 10 -1 1 10
X W ~
Sm -1 10 z
WATER AND GRAPHITE IN THE EARTH'S CRUST 383
Formation factor F as a function of ~r0, crw, grain size and clay mineral content (Schopper 1982) (o- corresponds to K in Schopper 's notation).
of the hydrophilic inner surface area of the rock accessible to the electrolyte (Riepe et al. 1979) and the zeta-potential along grain surfaces (Serra 1984; Nover and Will 1988). For this reason, the term O-qo dominates the conductivity O-o mainly in clays, mudstones, marls, and weakly consolidated shales. They contain clay minerals and colloidal material to a great extent and may thus reach an inner (grain) surface area of several hundreds of m 2 because of the small size of those particles (clay grade <2-4 ixm). The conductivity O-o may easily attain or even exceed values of 1 S/m and is essentially independent of ~rw in the open pore space in cases where O-w is not too large (Figure 1).
Although the surface conduction mechanism, which exists at any interface be- tween solid state particles and electrolyte within the rock, is not yet fully under- stood, one may assume that its importance decreases with depth. One reason for that assumption is found in the transformation of the clay minerals to illite and mica with increasing temperature and pressure during diagenesis and low grade metamorphism, which is accompanied by a general coarsening of the grains, i.e., a reduction of surface area. For example, measurements of the inner surface of rock samples of the 6000 m deep Mtinsterland i borehole (FRG) resulted in values which were of the order of 1 m 2 in only weakly metamorphosed paleozoic shales in the depth range of 2-4 km (Jtintgen and Karweil 1963). Such low values are characteristic of crystalline rocks as well (Huenges 1987). A second reason is due to the salinity of the pore fluid increasing with depth. Especially in sedimentary basins, saturation or even oversaturation (>300 g/l) may be reached so that surface
384 H. JODICKE
conduction looses its dominance compared to the term of "normal" electrolytical volume conduction.
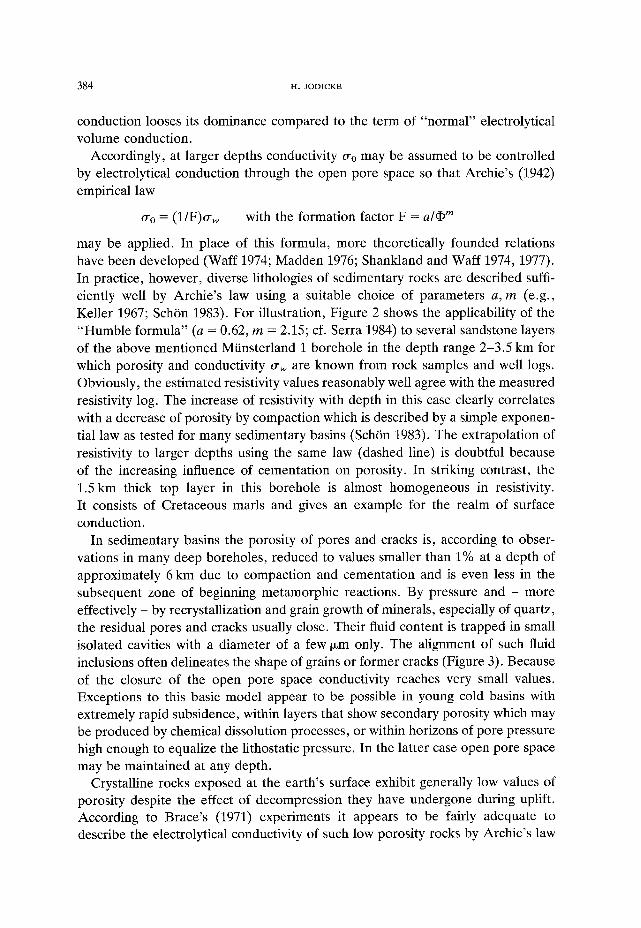
Accordingly, at larger depths conductivity O-o may be assumed to be controlled by electrolytical conduction through the open pore space so that Archie's (1942) empirical law
O-o = (1/F)o'w with the formation factor F = a/dP m
may be applied. In place of this formula, more theoretically founded relations have been developed (Waft 1974; Madden 1976; Shankland and Waft 1974, 1977). In practice, however, diverse lithologies of sedimentary rocks are described suffi- ciently well by Archie's law using a suitable choice of parameters a, m (e.g., Keller 1967; Sch6n 1983). For illustration, Figure 2 shows the applicability of the "Humble formula" (a = 0.62, m = 2.15; cf. Serra 1984) to several sandstone layers of the above mentioned Miinsterland 1 borehole in the depth range 2-3.5 km for which porosity and conductivity o-w are known from rock samples and well logs. Obviously, the estimated resistivity values reasonably well agree with the measured resistivity log. The increase of resistivity with depth in this case clearly correlates with a decrease of porosity by compaction which is described by a simple exponen- tial law as tested for many sedimentary basins (Sch6n 1983). The extrapolation of resistivity to larger depths using the same law (dashed line) is doubtful because of the increasing influence of cementation on porosity. In striking contrast, the 1.5 km thick top layer in this borehole is almost homogeneous in resistivity. It consists of Cretaceous marls and gives an example for the realm of surface conduction.
In sedimentary basins the porosity of pores and cracks is, according to obser- vations in many deep boreholes, reduced to values smaller than 1% at a depth of approximately 6 km due to compaction and cementation and is even less in the subsequent zone of beginning metamorphic reactions. By pressure and - more effectively - by recrystallization and grain growth of minerals, especially of quartz, the residual pores and cracks usually close. Their fluid content is trapped in small isolated cavities with a diameter of a few txm only. The alignment of such fluid inclusions often delineates the shape of grains or former cracks (Figure 3). Because of the closure of the open pore space conductivity reaches very small values. Exceptions to this basic model appear to be possible in young cold basins with extremely rapid subsidence, within layers that show secondary porosity which may be produced by chemical dissolution processes, or within horizons of pore pressure high enough to equalize the lithostatic pressure. In the latter case open pore space may be maintained at any depth.
Crystalline rocks exposed at the earth's surface exhibit generally low values of porosity despite the effect of decompression they have undergone during uplift. According to Brace's (1971) experiments it appears to be fairly adequate to describe the electrolytical conductivity of such low porosity rocks by Archie's law

W A T E R A N D G R A P H I T E I N T H E E A R T H ' S C R U S T 385
resistivity in C~m
E r -
r -
1000"
2000-
3000.
4000.
5000-
6000
1 m i . i i l l , I
lO0 , l , i l l = ] I I , , l t t l [ , I , l l = , l ~ i I o = h .
I
nsterland 1
|
10000
0
U o
u' t -'1 0
'2 0
r
. m t - O >
IZ]
Fig. 2. Resistivity of some sandstone layers of the Miinsterland 1 (FRG) borehole (dots) estimated by means of the Humble formula, compared with the laterolog of this borehole (after Richwien et al.
1963; J6dicke 1990); extrapolation of resistivity of sandstone layers to larger depths based on com- paction only (dashed line); carbon-rich shales with electronic conduction mechanism dominating are
indicated by arrows.

386 H. JODICKE
Fig. 3. Fluid inclusions shaping former grain boundaries (Walther and Althaus 1990).
using the power law exponent 2. By this simple way it may be estimated that the deeper part of the upper crust generally should be rather poorly conductive (highly resistive) even if pore water of high temperature and salinity close to saturation is considered (cf. Fritz and Pekdeger 1988). Under these circumstances, only permeable shear or fracture zones seem to be an effective source for at least locally enhanced conductivity because fluid concentrations often form far reaching circulation systems along such zones. Open fractures with large amounts of brines surprisingly were found in the Soviet ultradeep Kola SG3 borehole down to 11 km and in the German KTB test hole particularly at 4 km depth (Behr 1989). Sea water or meteoric water may descend to depths of 12 km or even more along such fracture systems whereas within normal dense crystalline rock it may penetrate down to only 5 km into the continental or oceanic crust (Hoers 1989).
2.2. LOWER CRUST
The transition from the upper to the lower crust is characterized by the change from brittle to ductile deformation style at temperatures of 300-350~ caused mainly by hydrolytic weakening of quartz. In the lower crust, at higher tempera- tures, at high lithostatic pressure and under normally low strain rate thermally activated processes such as crystal slip and atomic diffusion prevail during deforma- tion. Accordingly, faulting, microfracturing, and associated cataclastic effects pro- viding pore space (typical for the upper crust) are largely inhibited at lower crustal

W A T E R A N D G R A P H I T E IN T H E E A R T H ' S C R U S T 387
depths (Hobbs et al. 1976). It is to be expected, therefore, that in the lower crust open fractures and any remarkably connected pore space may not exist. The pore space is supposed by many petrologists to be smaller than 0.1% or less under normal conditions. Preferably in the transition zone between upper and lower crust, however, near-horizontal thrusts (detachments) may develop due to the significant change of mechanical behaviour in that zone, balancing differential tectonic stress in the upper and lower crust during phases of compression or extension.
Regarding the amount of 12 volume% of water released from pelitic rocks during prograde metamorphism, e.g., by increase of the sedimentary pile or by subduction (Fyfe et al. 1978; Walther and Orville 1982), there is no doubt that fluids will be one of the fundamental controlling factors in the deep crust. On the other hand, any laboratory experiment aiming at a determination of the electrical conductivity of lower crustal rocks suffers from the unavoidable restriction that content and composition of the original fluid are lost in samples taken from the earth's surface or from boreholes. Some information about fluids in the lower crust may be obtained from fluid inclusions comprised in many minerals. It remains unknown, however, to which extent these trapped fluids are representative of the former in situ open fluid system.
Studies on fluid inclusions supply evidence that brines are ubiquitous in the deep crust but CO2 is - compared to the upper crust - a major volatile phase particularly in granulites (Touret 1989). CH4, CO, H2S, N2 and H2 are further, quantitatively less important constituents. The source of fluids may be anorganic, from within the mantle or within magmatic reservoirs, or organic, originating from the decomposition of biogenic sediments during metamorphism (Behr 1989).
For the middle and lower crust conductance values between 300 and 1500 S have been reported worldwide from many places and from various geological situations (e.g., Haak and Hutton 1986). Attempts to explain such values by means of fluids using any simple form of Archie's law requires both the conductivity O-w and the porosity �9 to be as large as petrologically possible. The salinity of deep brine inclusions varies considerably between very low values and oversaturation depending on the petrology of the host rock. On average it seems to be equivalent to sea water (Roedder 1984). Thus, anomalously high pore pressure in large rock volumes providing open (connected) pore space seems to be necessary in order to match the observed values of conductance.
In Figure 4 a model is presented which schematically shows how high pore pressure followed by an opening of connected pore space may be generated. By dehydration reactions of hydrated minerals water is released, for example, from pyrophyllite at approximately 510~ according to the volume increasing reaction (Matthes 1983) at point A

388 H. JODICKE
100 ]00 500 100 900 1100 "E
kbar
Fig. 4. Simple model of a p, T pathway (dashed-dotted line) during metamorphosis; fields with differential pressure in closed fluid-filled cavities, leading to decrepitation and implosion, are shaded
(Walther, unpubl.).
A12[(OH)2]Si4Olo] ~ A12SiOs + 3SIO2 + H20. pyrophyllite disthen/ quartz V
andalusite
Following the pathway of prograde metamorphism in Figure 4 the lithostatic pressure increases only slightly near the temperature of peak metamorphism, in contrast to the sharp rise of the pore pressure in closed, water-containing cavities at temperatures higher than 510~ Within the independent pressure system of closed cavities this rise is determined by the given trend of constant density of water as displayed in Figure 4. As a consequence, the pores will decrepitate by expansion at sufficiently high temperatures creating hereby new pore and crack porosity in addition to the porosity induced by the volume increase of the metamor- phic reaction. Along the cooling branch of the p, T pathway pores may collapse in a reverse process when the lithostatic pressure exceeds the pressure inside the water containing cavities at low temperatures. Of course, much more complicate pathways in the p, T field are conceivable creating multiple opening/enclosing events in the history of pore fluids. Furthermore, it may be concluded from Figure

W A T E R A N D G R A P H I T E IN T H E E A R T H ' S C R U S T 389
Fig. 5. By explosion decrepitated fluid inclusions; standard SEM microphoto (left), cathodoluminisc- ence microphoto (right) of the same sample disclosing healed microcracks and palaeoporosity (Behr
1989).
4 that not only water as being generated by numerous dehydration reactions of pelitic rocks but also connate water (trapped sea water in sediments) will react in a similar way, possibly even at relatively low temperatures in the latter case. In quartz and feldspars traces of such events have been made visible by cathodolumi- nescence methods (Behr 1989) (Figure 5).
This pore space production process is thought to take place during prograde metamorphism. After such an event the pores should close because of the decay of pore overpressure, which may not be maintained over geologically long time. Establishing pore space out of the condition of ongoing metamorphism probably requires an impermeable cap below which anomalously high pore pressure may build up. Due to actual non-zero permeability of rocks, a continuous fluid flow from the mantle is needed in addition, to keep the pore pressure high (Rath and Haak 1986; Haak and Hutton 1986). The transition zone from the upper to the lower crust may operate this way by means of the self-sealing mechanism of quartz (Etheridge et al. 1983).
Gough (1986) and Jones (1987) worked out corresponding interpretations of conductivity models that include a conductor in the mid-crustal range (Figure 6). At first glance these models appear very convincing because they include seismic observations which sometimes exhibit low velocity layers at the depth of the conductor or reveal a principal change in the reflectivity pattern across the mid-i crustal transition zone, both of which may be produced by fluids as well.
Objections, however, come from the amount of porosity needed to explain the obtained values of conductance. Hyndman and Shearer (1989) estimated a pore porosity in the range between 0.5 and 3% for a 15 km thick lower crustal rock sequence to be necessary in order to explain the integrated conductivity valuel typically observed for a conductive lower crust, provided the salinity of the pore, fluid equals that of sea water. That thickness does not appear to be very realistic i under crustal conditions without presently ongoing metamorphosis. In a more, refined model Bailey (1990) claimed the possibility of a thin zone at the transition I

390 H. JODICKE
t ~
:I
~>
~ ~ @
o U
|
Z
t
t 7
t
t t
@
o ~ (a
0
0
i
U I i
q l d e p
u
0
�9
o
c~
6
,.o
c~
"o
c~
8
o
o
~5

W A T E R A N D G R A P H I T E IN T H E EARqq-I 'S C R U S T 391
between the brittle and ductile parts of the crust where horizontally stratified hydrolytic fractures may develop under the condition of horizontally compressive regional stress.
Nevertheless, petrological indications of large amounts of free water being trapped at mid-crustal depth are missing so far. On the contrary, lower crustal rocks like granulites exposed at the earth's surface are widely known to have conserved their lower crustal "dry" character, i.e., they do not reveal any hydrous reactions which should be expected if water had been present at any crustal level passed through during uplift (Yardley 1986). Retrograde metamorphosed fracture zones as an important exception (developed in the middle or upper crust) give evidence that such reactions would have run readily.
3. Electronic Conduction by Graphite and Metaanthracite
3.1. UPPER CRUST
The process of coalification, i.e., the gradual, mainly temperature-controlled trans- ition from organic material (wood, spores, resins, algae etc.) to peat, lignite, black coal, anthracite, and finally to graphite, has been well investigated by coal petrologists. The different stages of coalification may be measured on the basis of physical and chemical rank parameters, e.g., by the content of hydrogen, volatiles, or carbon of the dry ash-free matter, by optical reflectance, or by X-ray- and electron-diffraction methods (e.g., Stach et al. 1982).
Electrical conductivity of coals as a function of the degree of coalification is shown in Figure 7. Dried samples exhibit a slow increase of conductivity for low rank coals and a strong and sudden increase for coals in the metaanthracite (MA) range (Schuyer and van Krevelen 1955; Pope and Gregg 1961) (note the logarithmic scale of conductivity in Figure 7). The behaviour of conductivity of water-saturated natural coals (Parkhomenko 1967), also shown in Figure 7, is more complex because of complicated changes in pore volume and inner surface area occuring during the coalification process. High values of conductivity with more than 100 S/m are reached at the transition from metaanthracite to the semigraphite (SG) stage in both cases of dry and wet samples extending close to the range of polycrystalline graphite (103-107 S/m; Parkhomenko 1967; Olhoeft 1981; Beblo 1982). Obviously, high conductivity in this coalification range is a property of the coal carbon matrix.
The pronounced increase of conductivity of coal samples (Figure 7) is caused by an irreversible, stepwise loss of aliphatic chains leaving an increasing amount of aromatic complexes in the coal matrix. The abrupt increase towards a graphitoid character of the carbonaceous matter during the metaanthracite stage is character- istic of the "pre-graphitization" step of carbonaceous matter (M. Teichmtiller and R. Teichmtiller 1981). Reflectance, as a physical rank parameter, demonstrates a

392 H. JODICKE
E c,q
r-
b cn o
-2
-Z,
-6
- 8
-10
-12
Schuyer & vcm Krevelen (1955)
�9 Pope g Gregg (19611
~.;-r ~.......:....,:.:?:.:.
r ~..-.:...:-:.~ ~..'..:)-
N::i::Xi~ , Porkhomenko 11967) ~0~::1 ~.:.'::::%,, ~'.':-:.':'2 ~:.".'.'::.:'::::'~: ,~ l'~"::'.'.':~" �9
..4:::.":'r ::'."..,~ ~, ~ ~ i t
f
T
t.-
,o o'1
6
o
I I I I I I i I i
7(5 80 84. 88 92 96 100 %
carbon content (d.a. f . )
Fig. 7. Conductivity of natural coals (shaded) as function of coalification parameters carbon content (dry and ash free) and rank of coal (German DIN coal rank system) (modified after Parkhomenko 1967); compared with conductivity of dried, pulverized and pressed samples (after Schnyer and van
Kreveten 1955, and Pope and Gregg 1961).
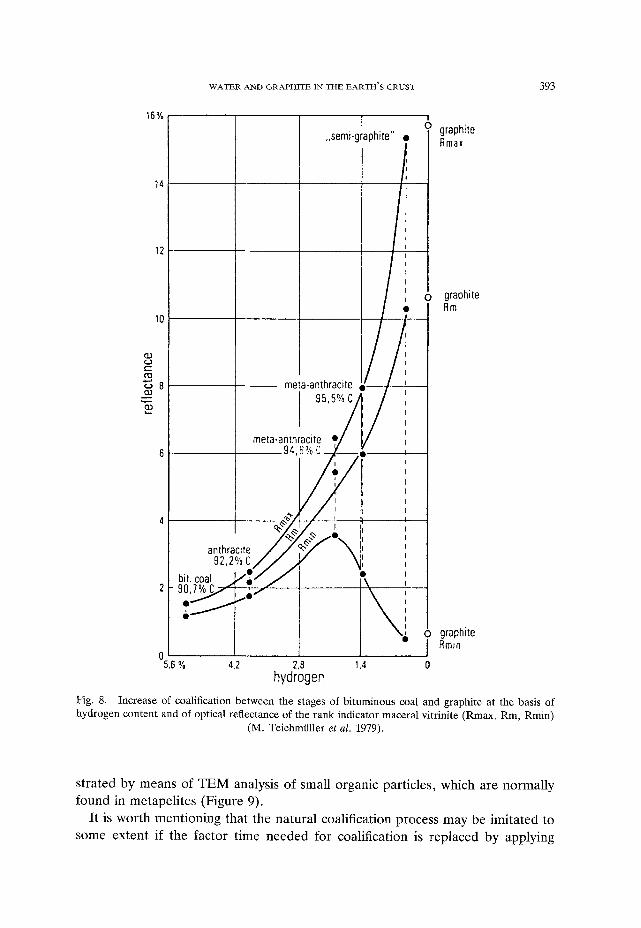
corresponding sudden enhancement of crystallinity when optical reflection ani- sotropy (equivalent of an optically negative uniaxial crystal) appears in the range of metaanthracite (Figure 8). At this coalification stage also the first " t rue" graph- ite crystals may be detected in rare cases (M. Teichmiiller et al. 1979). Graphite as a mineral is defined by a minimum reflectance value Rmin of 0.5% and and by a reflectance anisotropy of approximately 20. Even at this final coalification stage a further temperature-dependent increase of lattice perfection can be demon-
W A T E R A N D G R A P H I T E IN T H E E A R T H ' S C R U S T 393
16%
14
12
10
r - ,
~ 8
P
anthracite 92,2% C
bit. coal 2 E
0 5,6 % 4,2
[ 0 graphite ,.semi-graphite" o Rmax
met t-anthracite 95,5% C
, I
meta-anthraclte ~ / i 94,6% C --~ . o - ~ - . - ~
2,8 1.4 hydrogen
0 graphite Rm
graphite Rmm
0
Fig. 8. Increase of coalification between the stages of bituminous coal and graphite at the basis of hydrogen content and of optical reflectance of the rank indicator macerat vitrinite (Rmax, Rm, Rmin)
(M. TeichmiJller et al. 1979).
strated by means of TEM analysis of small organic particles, which are normally found in metapelites (Figure 9).
It is worth mentioning that the natural coalification process may be imitated to
some extent if the factor time needed for coalification is replaced by applying
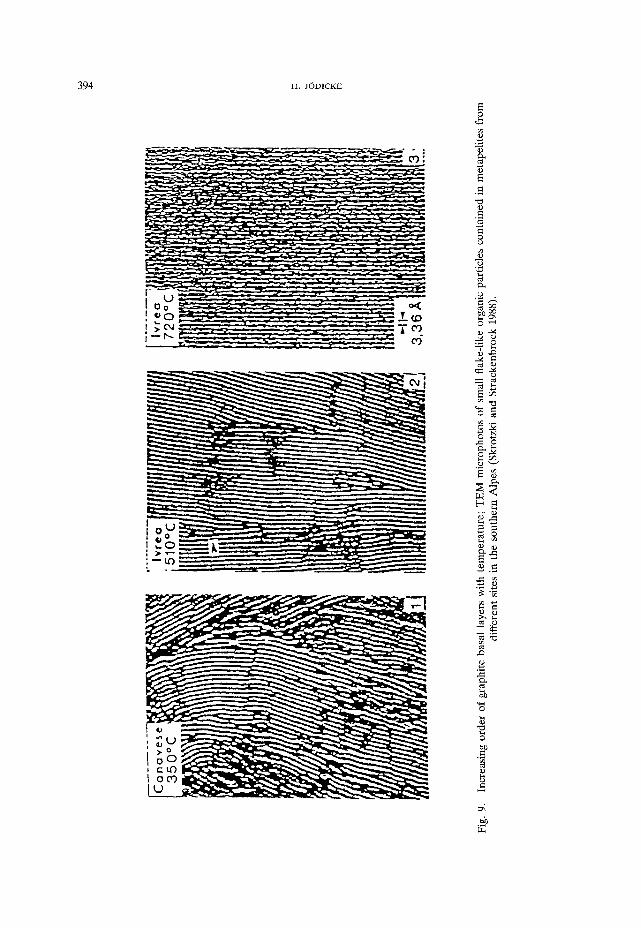
394 H. JOOICKE
E 0
&
8
e~
. ~ -
0 � 9
,.~ 0
uJ
e,

W A T E R A N D G R A P H I T E I N T H E E A R T H ' S C R U S T 395
-1
r--n -2
-3 b
I I
o _ d
-5
-6
-7
-8
-9
Fig. 10.
' I T
_]- -r
_I
I I I I I 0 200 400 600 800 1000
Temperature towhich coal was healed (~
Heating experiment with coal (Duba 1977).
accordingly higher temperatures in heating experiments with coal and coal char (Figure 10) (Duba 1977; Krfiger 1988) or by technical coking procedures.
In the discussion about the origin of conductivity anomalies in the crust, high rank coals may be considered as possible sources. For example, graphitized coal seams are known from Austria, Mexico, and Siberia (Krauss et al. 1989). In Karelia, anthracitized sapropelic coals ("shungites") have been found to cause significant electrical anomalies (Golod and Klabukov 1989). However, not macro- scopic coals but carbonaceous matter of microscopic size as found particularly in black shales appears to be of much greater importance in producing conductivity anomalies for several reasons.
Finely disseminated organic carbon (Corg) is contained in almost all pelitic rocks. Its preservation in the sediment is possible either in microscopic anaerobic environments, e.g., in pores, or under large scale reducing (euxinic) conditions at
396 H. JODICKE
the ocean bottom. The latter situation is characteristic of the formation of black carbonaceous pyritic muds, i.e., of potential oil source rocks, for which the Black Sea sediments are considered to be the classical recent example. The organic material of such muds consists mainly of dissolved organic matter (particle size <0.4-0.8 ~m) preferably adsorbed at the surfaces of clay minerals (Tissot and Welte 1984) thus impregnating the whole rock matrix at a very early stage of diagenesis. This can be shown by fluorescence methods of organic petrology (M. Teichmiiller 1986).
The initial Corg content of black shales may exceed 60% but mainly temperature- related loss of its substance is due to effects similar to the coalification process of coals described above. After oil and gas generation restitic kerogen of a few percent only remains at the grain surfaces forming a submicroscopic network which turns out to be highly conducting at the metaanthracite stage. To attain this stage, minimum temperatures of 200-250~ are needed, depending on burial history. A minimum amount of carbon of approximately 3% seems to be a prerequisite of establishing any conducting network. The remaining Corg films along the grain surfaces may be so thin that their observation by means of a light or scanning electron microscope might be a problem. In Figure 11 the existence of organic material in a highly conducting (0.1 Om) black shale is generally confirmed by SEM elemental analysis technique, but a proof that some network exists is possible only for the foliation planes where Corg is enriched.
The resistivity of rather fresh consolidated black shales is found to be normally very high. After exposure to very low grade metamorphism, however, the Corg content - similar to coals - will reach a sufficiently high coalification stage which may lower the resistivity of the whole rock to values of a f e w ~ m only (e.g., Stanley et al. 1987; Stanley 1989), in extreme cases to the order of 0.1 ~m and less (J6dicke 1985,1990). This may be illustrated by referring to the Mfinsterland 1 borehole again (Figure 2): At depths larger than 4000 m, optical reflectance values indicate that coalification has come to the required stage of metaanthracite (M. Teichmtiller et al. 1979) and, in good accordance, minima of resistivity (marked by arrows) can be attributed to carbon-rich black shales. Impedance measurements of a sample from 5500 m (Duba et al. 1988) clarified the dominance of electronic conduction mechanism (Figure 12). As to be expected in this case, the dried sample shows significantly low and almost frequency independent values of resistivity, and phase values close to zero (lower part of Figure 12). Water saturation results in a characteristic decrease of resistivity and corresponding phase shift at high frequencies. In contrast, the dried sample of a normal shale (Corg < 0.5%) exhibits a clear tendency towards dielectric behaviour (upper part of Figure 12). This "normal" shale selected from Lower Ordovician strata of the Konzen borehole (Hohes Venn, Germany) compares largely with the black shale from the Mfinster- land 1 borehole, except for its carbon content. Particularly, it has been exposed to similar thermal conditions during geological history.

W A T E R A N D G R A P H I T E IN T H E E A R T H ' S CRUST 397
Fig. 11. SEM microphoto of a highly conducting black shale (V-21 borehole, Hohes Venn, Germany) (above); distribution of element C (below) in the same field as above (J6dicke 1990); the dark particles of microscopic size in the center of upper picture proof to be carbonaceous matter, further organic material of submicroscopic size is particularly found on foliation planes trending diagonally from the
lower left to the upper right corner on the picture.

3 9 8 H . J O D I C K E
5 -
E
4 9
2 0 .....J
1 -
0 -
7
6 -
E
E ..c: 4 - -
9
c~ 3 - -
o'~ 2 - 0
_.J
I O D O O 0
0 �9
I
0 0
D O 0
�9 �9 �9 �9
0 �9 �9
U l l l l i
�9
O O
I J 10 2 10 3
Frequency (Hz)
El
0
0
j - - u
- -15
[] O D
�9 �9 �9 �9 ~45
- - -60
O �9 - - - 7 5
I 10 4 10 5
-30
c~
t - n
f I i o ~ ~ 1 7 6 1 7 6 1 7 6 1 7 6 1 7 6 1 7 6 1 7 6
~ e e o o O e e e
-15
-30 ~. "D v (b o~
-45 0..
-60
- -75
J 1 I 10 2 10 3 10 4 105
Frequency (Hz)
]Fig. 12. Impedance of normal shale from Konzen (above), and from metaanthracitic black shale from the Miinsterland borehole (below) (Duba et al. 1988); full (open) symbols indicate water-saturated
(dry) samples, circles (squares) represent phase (resistivity) values.

WATER AND GRAPHITE IN THE EARTH'S CRUST 399
Black shales with often thin-layered but widespread occurrences are known from many places in the world. As their organic content is made up mainly from algae and bacteria, their appearances go back far beyond Phanerozoic history of the earth. For this reason, highly conducting Archean black shales in Canada are well known for commonly causing problems for electromagnetic or selfpotential surveys used in sulfide exploration (Gaucher 1983). For example, in the 1850 million years old Sudbury structure of the Canadian shield a characteristic black shale is part of the filling of the Sudbury basin (Avermann, pers. comm.). Dry samples of this rock type show resistivity values far below 0.1 f~m. Widespread Early Proterozoic black shales (3-16%C) are also reported from Finland (Lou- kola-Ruskeeniemi 1989) where they may explain extended observed conductivity anomalies (Korja and Koivukoski 1990).
Another important feature of a black shale refers to its mechanical properties, i.e., to its low shear strength which often enhances development of shear zones, large scale overthrusts, and other elements of tectonic inventory. For example, the transport of the Caledonian mountain system onto the Fennoscandian Shield probably was enabled or intensified by the lubrication effect of the graphitoid carbonaceous matter contained in the "Scandinavian Alum Shale" forming the gliding horizon at the base of the rock masses (Gee 1980; Greiling 1984). Black shale horizons which played a role in this way will be heavily tectonized, having presumably lost their initial submicroscopic conducting network. However, by pressure solution along shear zones carbon may be enriched again as a result of its low mobility (Watson 1986) whereas other minerals may be dissolved and taken away. Thus, interconnectedness may form anew, provided the initial carbon content of the shale utilized as a shear horizon was high enough. Efficient supply of carbon may also come from liquid hydrocarbons which are often observed to migrate into the opened pore space of thrusts or shear zones. If these hydrocarbons are degraded by any later high temperature event the residues, i.e., films of graphite, will cover the surfaces of such zones. In this case, fractures may be detectable by seismic as well as by electrical methods (Volbers et al. 1990).
3.2. LOWER CRUST
It was shown by Duba and Shankland (1982) that a very small portion of graphite, distributed along grain boundaries, is capable of enhancing the conductivity to a large extent. However, the reaction how graphite may be precipitated from C - O - H fluid assemblages of the deep crust (CO2, CO, H20, H2, CH4) remains an open question. Most petrologists favour the reduction reaction
C O 2 = C --/- O 2
under extremely low f O 2 values of the lower crust (see, e.g., Touret 1989). For the first time, Frost et al. (1989) were able to document this reaction by Auger spectrometry carbon mapping for the Sybille Monzosyenite, a plutonic rock of the
400 H, J()DICI~E
Laramie Anorthosite Complex, which crystallized in the graphite Stability field at temperatures between 950 and 1030~ and at pressures around 3 kbar. Grain- boundary graphite was found to have a thickness of ~1000 A which would be sufficient to explain lower crustal high conductivity layers. In a second case, graphite films were detected in gabbroic rocks of the same Anorthosite Complex formed at conditions outside the graphite stability field. Here, interoxide equilib- rium during cooling is thought to have shifted the oxygen fugacity, so that graphite saturation was reached. The high resistivity of these rocks observed at the earth's surface is explained by the effect of decompression during uplift leaving irreversibly destroyed graphite films. This model may be applied to pelitic gneisses and schists or charnockitic and granulitic rocks as well (Frost et al. 1989). Possibly, the unique massive graphite deposits of Sri Lanka are of this type. Their formation under granulite facies condition was postulated by Katz (1987).
A second reaction to produce graphite from the C - O - H fluid systems has been considered by Emmermann (1989) and Walther and Althaus (1990)
CH4 + C O 2 = 2C + 2H20
in order to explain graphite impregnated cataclastic zones in amphibolite facies rocks of the 4000 m deep KTB test hole (FRG) (cf. Haak et al. 1991). The proposed reaction is almost independent of temperature but needs to be forced to the right side, e.g., by a catalyst. Even the shear heating of cataclasis itself may drive the process (Walther pets. comm.). This conception is corroborated by the observation of fluid inclusions in KTB gneisses containing graphite coexisting with CO2 and H20 (Figure 13). An organic source of CH4 seems to be probable in this case although CH4 containing fluid inclusions are rarely found in rocks of the KTB test hole. At some distance, however, CH4 metastably coexisting with CO2 was detected in inclusions of rocks in close vicinity to an important black shale horizon. Thus, degradation of organic matter may have delivered the hydrocarbon while the cataclastic horizon could have been used for its transportation (Walther pers. comm.).
Finally, one may ask what will happen to all the carbonaceous matter that is a normal constituent of pelitic rock when it is exposed to granulite facies conditions of the lower crust? Studies on metapelites from, e.g., Sri Lanka make clear that the order of magnitude of the initial average Corg content of approximately 0.5% is preserved in the rock. However, by recrystallization and grain coarsening, large isolated graphite crystals of sometimes idiomorphic shape are developed, reaching occasionally lengths of more than 1 cm (Voll pers. comm.; cf. Figure 14). In this form they do not appreciably contribute to electrical conductivity. Any identifica- tion of metapelites at deep levels of the crust based on some general electrical conductivity enhancement appears to be impeded for this reason.
Interestingly, graphite seems to be able to pass through crustal levels where it is thought not to be stable (cf. Mareschal 1989). This indicates that the reaction

W A T E R A N D G R A P H I T E IN T H E E A R T H ' S C R U S T 401
Fig. 13. Graphite within a fluid inclusion, KTB borehole, Germany (Walther and Althaus 1990).
Fig. 14. Flakelike graphite in a metapelite, Ivrea zone, Italy.

402 H. JODICKE
Fig. 15. Streaks of graphite in a cataclasite, Calabria, Italy.
kinetics of graphite, if once formed, may be very slow. As a consequence, parti- culary black shales may keep their high conductivity during subsidence (and uplift). An extremely carbon-rich stratiform layer intercalated in the metapelitic (granu- litic) series of Calabria (Italy) (Figure 15) may be an example. Resistivity measure- ments yielded minimum values of 0.02 a m for some selected unweathered samples. This shows that carbon-rich (meta)sediments may play an important role in the discussion on the origin of highly conducting layers in the upper as well as in the lower crust.
4. Concluding Remarks
In this discussion of the nature of crustal conductivity anomalies it is pointed out that the two most promising candidates examined here, water and graphite, are both capable of producing high conducting layers at deeper levels of the crust. Any a priori preference for only one of them appears inadequate in view of the great and obvious diversities of geological situations.
In some special cases, interpretation of conductivity models will be strikingly clear and conclusive. For example, conductance values of several thousand S for layers at larger crustal depths or for belt-like structures within Archean rock series of old shields may be explained only by the existence of metaanthracite or graphite bearing rocks. Any attempt of an explanation based on fluids would result in an unrealistic large pore space needed. Conductance values of such extremely high

W A T E R A N D G R A P H I T E IN T H E E A R T H ' S C R U S T 403
have been documented for several locations, e.g., in Scandinavia (Korja and Koivukoski 1990), Soviet Union (Feldman 1990), NW-Germany (Losecke et al.
1979; J6dicke 1990), or Zimbabwe (Losecke et al. 1988). On the other hand, water seems to be the most important factor controlling conductivity of subducting oceanic slabs (Kurtz et al. 1986; Waft et al. 1988) or of thermally active regions.
In case of low or moderate conductance values, interpretation of conductivity models will be much more ambiguous even if the geological and petrological settings, comprising palaeogeographic environment, tectonic framework, and evolutionary processes, are reasonably well understood. The most elucidating example seems to be the multitude of observations of increased conductivity in the middle crust, which is as remarkable as the discussion about its origin contro- versial. The conductance values typically range between several ten to a few hundred S. Preferentially in the transition zone from brittle to ductile deformation style, newly formed fractures may provide high conductivity by supporting circu- lation of brines as well as precipitation of graphite from C - O - H fluid systems. Vice versa, the development of fractures in this zone may be facilitated by the utilization of pre-existing, highly conducting Corg-rich layers for the shearing pro- cess. Furthermore, after healing of these fractures, high pore pressure may build up in the depth range just below, so that increased porosity may result. More investigation of this mid-crustal range appears desirable, therefore. On the one hand, combination with reflection seismics will be highly valuable in order to clarify whether conductors and reflectors are correlated in a certain situation. Under favourable conditions, reflection seismics may help to distinguish between water-filled pore space areas and shear zones, e.g., by analysis of phase infor- mation of reflected signals. On the other hand, most detailed conductivity studies especially in those regions where former middle crust is exposed at the earth's surface today, may be advantageous. Methods of applied geophysics, for example, geoelectrics, self-potential, VLF, slingram or audiomagnetotellurics, could be used for detection of near-surface high conductivity. Comprehensive petrophysical and petrological analysis of selected rock samples should be included as an essential part of such studies.
Multidisciplinary studies may be useful, in particular, for better understanding of the formation of graphite from organic or anorganic sources and its relation to the origin of high conductivity of rocks. At our present knowledge, it seems that graphite, herein different from water, may be able to exist at any crustal depth, if once formed. Thus, e.g., carbon-rich metasedimentary strata or graphite impreg- nated shear zones may reveal valuable information about structural details of the crust which may not be obtained by other geophysical methods.
Acknowledgements
I would like to thank all collegues who sent their latest results which was a great help for preparing this review. I also wish to thank J. Walther for his kind
404 R. JODICKE
introduction into the world of fluid inclusions and J. Untie& for critically reading the manuscript.
References
Archie, G. E.: 1942, 'The Electrical Resistivity Log as an Aid in Determining Some Reservoir Characteristics', Trans~ Am. Inst. Min., Metall., Petr. Engrs. 146, 54-62.
Bailey, R. D.: 1990, 'Trapping of Aqueous Fluids in the Deep Crust', Geophys, Res. Letters 17, 1129- 1132.
Beblo, M.: 1982, 'Die elektrische Leitf~ihigkeit (spezifischer Widerstand) der Minerale und Gesteine bei normalen Temperaturen und DriJcken', in Landolt-B6rnstein, Zahlenwerte und Funktionen aus Naturwissenschaften und Technik, Neue Serie V lb, Springer-Verlag; Berlin, pp. 239-261.
Behr, H.: 1989, 'Die Geologische Aktivitfit yon Krustenfluiden', Nds. Akad. Geowiss. VerOfftl. 1, 7- 42.
Brace, W. F.: 1971, 'Resistivity of Saturated Crustal Rocks to 40 km based on Laboratory Measure- ments', in J. G. Heacock (ed.), The Structure and Physical Properties of the Earth's Crust; AGU Geophys. Monogr. Set. 14, 243-255, Washington, DC.
Duba, A.: 1977, 'Electrical Conductivity of Coal and Coal Char', Fuel 56,441-443. Duba, A. and Shankland, T. J.: 1982, 'Free Carbon and Electrical Conductivity in the Earth's Mantle',
Geophys. Res. Lett. 9, 1271-1274. Duba, A., Huenges, E., Nover, G., Will, G., and J6dicke, H.: 1988, 'Impedance of Black Shale from
MiJnsterland 1 Borehole: An Anomalously Good Conductor?, Geophys. J. 94, 413-419. Emmermann, R.: 1989, 'The KTB Pilot Hole: Tectonic Setting, Technical Data and First Results', in
R. Emmermann and J. Wohlenberg (eds.), The German Continental Deep Drilling Program (KTB). Site-Selection Studies in the Oberpfalz and Schwarzwald, Springer-Verlag; Berlin, pp. 527-553.
Etheridge, M. A., Wall, V. J., and Vernon, R. H.: 1983, 'The Role of the Fluid Phase During Regional Deformation and Metamorphism', J. Metamorphic Geol. 1, 205-226.
Feldman, I. S.: 1990, 'Some Types of Crustal Conductivity Anomalies, their Nature and Geotectonic Significance', Paper presented at 10th Workshop on Electromagnetic Induction in the Earth, August 22-29, 1990; Ensenada, Mexico.
Fischer, G. and Le Quang, B. V.: 1982, 'Parameter Trade-Off in One-Dimensional Magnetotelluric Modelling', J. Geophys. 51,206-215.
Fritz, P. und Pekdeger, A.: 1988, 'Hydrogeochemie und Isotopenhydrogeologie an Wfissern und Gasen in kristallinen Gesteinen', Vortrag wtihrend des 1. KTB-Schweipunkt-Kolloquiums, 28-29 Januar, 1988; Giessen.
Frost, B. R., Fyfe, W. S., Tazaki, K., and Chan, T.: 1989, 'Grain-Boundary Graphite in Rocks and Implications for High Electrical Conductivity in the Lower Crust', Nature 340, 134-136.
Fyfe, W. S., Price, N. J., and Thompson, A. B.: 1978, Fluids in the Earth's Crust, Elsevier; Amsterdam, New York.
Gaucher, E.: 1983, 'Estimation of Sulfide Content of a Potential Orebody from Surface Observations and its Role in Optimising Explorations Programmes', in A. A. Fitch (ed.), Developments in Geophysical Exploration Methods - 4, Applied Science Publishers, London.
Gee, D. G.: 1980, 'Basement-Cover Relationships in the Central Scandinavian Caledonides', GFF 102, 455-474.
Golod, M. I. and Klabukov, B. N.: 1989, 'Resistivity of Rocks in the South-Eastern Part of the Baltic Shield', in S.-E. Hjelt and L. L. Vanyan (eds.), Geoelectric Models of the Baltic Shield. Final Report of Project No. 13 Between the Academy of Finland and the Academy of Science of the USSR, Department of Geophysics, University of Oulu; Report No. 16, pp. 21-22.
Gough, D. I.: 1986, 'Seismic Reflectors, Conductivity, Water and Stress in the Continental Crust', Nature 323, 143-144.
Greiling, R.: 1984, 'Structure and Metamorphism at the Base of Major, Far Travelled Nappes: An

W A T E R A N D G R A P H I T E IN T H E E A R T H ' S C R U S T 405
Example from the Middle Allochthon of the Central Scandinavian Caledonides', Sei. Geol. Bull. 37, 13-22.
Haak, V. and Hutton, R.: 1986, 'Electrical Resistivity in Continental Lower Crust', in J. B. Dawson, D. A. Carswell, J. Hall, and K. H. Wedepohl (eds.), The Nature of the Lower Continental Crust, Geological Society Special Publication, No. 24, pp. 35-49.
Haak, V., Stoll, J., and Winter, H.: 1991, 'Why is the Electrical Resistivity Around the KTB-Hole so Low?', PEPI 66, 12-23.
Hjelt, S. E.: 1988, 'Regional EM Studies in the 80s', Surveys in Geophysics 9, 349-387. Hobbs, B. E., Means, W. D., and Williams, P. F.: 1976, An Outline of Structural Geology, John
Wiley, New York. Hoefs, J.: 1989, 'Zur Herkunft und Wechselwirkung von Fluiden in kontinentaler und ozeanischer
Kruste', Nds. Akad. Geowiss. Verofftl. 1, 43-48. Huenges, E.: 1987, 'Messung der Permeabilit~it yon niedrigpermeablen Gesteinsproben unter Drficken
his 4 kbar und ihre Beziehung zu Kompressibilit/it, Porosit~t und komplexem elektrischen Wider- stand', Diss. Math.-Nat. Fak. Univ. Bonn.
Hyndman, R. D. and Shearer, P. M.: 1989, 'Water in the Lower Continental Crust: Modelling Magnetotelluric and Seismic Reflection Results', Geophys. J. Int. 98, 343-365.
Hyndman, R. D. and Hyndman, D. W. : 1968, 'Water Saturation and High Electrical Conductivity in the Lower Continental Crust', Earth Planet. Sci. Lett. 4,427-432.
J6dicke, H.: 1985, 'A Large Selfpotenflal Anomaly at the SE Flank of the Stavelot-Venn Anticline Originating from Metaanthracite Bearing Black Shales at the Salm/Revin Boundary', N. Jb. Geol. Paliiont. Abh. 171,387-402.
J6dicke, H.: 1990, 'Zonen hoher elektrischer Krustenleitf~higkeit im Rhenoherzynikum und seinem n6rdlichen Vorland', Hochsehulschriften Bd. 24, Lit Verlag; MOnster, Hamburg.
Jones, A. G.: 1987, 'MT and Reflection: An Essential Combination', Geophys. J. R. Soc. 89, 7-18. Jtintgen, H. und Karweil, J.: 1963, 'Porenverteilung und innere Oberfl~iche der Kohlen der Bohrung
Mfinsterland 1', Fortschr. Geol. RheinL u. Westf. 11, 179-196. Katz, M. B.: 1987, 'Graphite Deposits of Sri Lanka: A Consequence of Granulite Facies Metamor-
phism', Mineral. Deposita 22, 18-25. Keller, G. V.: 1967, 'Supplementary Guide to the Literature on Electrical Properties of Rocks and
Minerals', in E. I. Parkhomenko (ed.), Electrical Properties of Rocks, Plenum Press, New York. Korja, T. and Koivukoski: 1990, 'Magnetotelluric Soundings Along the SVEKA Profile in the Central
Fennoscandian (Baltic) Shield, Finland', Department of Geophysics, University of Oulu, Report No. 17.
Kxauss, U. H., Schmidt, H. W., Taylor, H. A., and Sutphin, D. M.: 1989, 'International Strategic Minerals Inventory Summary Report - Natural Graphite', U.S. Geological Survey circular 930-H; Denver.
Kr0ger, D.: 1988, 'Untersuchungen der elektrischen Leitffhigkeit von Kohle', Dipl. Arb. Inst. f. Geophys. Univ. Mtinster. [unpubl.]
Kurtz, R. D., DeLaurier, J. M., and West, G. F.: 1986, 'A Magnetotelluric Sounding Across Vancouver Island Detects the Subducting Juan de Fuca Plate', Nature 321,596-599.
Losecke, W., Kn6del, K., and Mtiller, W.: 1979, 'The Conductivity Distribution in the North German Sedimentary Basin Derived from Widely Spaced Areal Magnetotelluric Measurements', Geophys. J. R. Astr. Soc. 58, 169-179.
Losecke, W., Mfiller, W., and W. Kn6del, K.: 1988, 'A Major Conductivity Anomaly in the Northern Zambezi Valley in Zimbabwe Derived from Magnetotelluric Data', Paper presented at 9th Workshop on Electromagnetic Induction in the Earth and Moon, October 24-31, 1988; Sochi, USSR.
Loukola-Ruskeeniemi, K.: 1989, 'Early Proterozoic Metamorphosed Black Shales in the Kainuu Schist Belt and in the Outokumpu Region', Geological Survey of Finland, Special Paper 10, pp. 103-106.
Madden, T. R.: 1976, 'Random Networks and Mixing Laws', Geophysics 41, 1104-1125. Mareschal, M.: 1989, 'Electrical Conductivity: The Story of an Elusive Parameter, and of How it
Possibly Relates to the Kapuskasing Uplift (LITHOPROBE, Canada)', in M. H. Salisbury and D. M. Fountain (eds.), Exposed Cross-Sections of the Continental Crust, 453-468, Kluwer, Dordrecht.
4136 a. ~oelc~s
Matthes, S.: 1983, Mineralogie. Eine Einf~hrung in die spezir Mmeralogie, Petrologie und Lagerstat- tenkunde', Springer-Verlag; Berlin.
Nover, G. and Will, G. : 1988, 'Rock-Fluid Interaction: Interpretation by Zeta Potential and Complex Resistivity Measurements', in Bridgwater (ed.), Fluid Movements - Element Transport and the Composition of the Deep Crust, Kluwer Academic Publishers, Dordrecht, pp. 377-397.
Olhoeft, G. R.: 1981, ~Electrical Properties of Rocks', in Y. S. Touloukian, W. R. Judd, and R. E Roy (eds.), Physical Properties of Rocks and Minerals, McGraw-Hill, New York, pp. 257-330.
Olhoeft, G. R.: 1986, 'Electrical Conductivity', Review paper presented at Eighth Workshop on Electromagnetic Induction in the Earth and Moon; Neuch~tel, August 24-31, 1986.
Parkhomenko, E. [. : 1967~ Electrical Properties of Rocks, PLenum Press; New York. Patra, H. P. and MaUick, K: 1980, Geosounding Principles, 2, Time-Varying Geoelectrie 3oundings,
Elsevier, Amsterdam. Pope, M. 1, and Gregg, S. I.: 1961, 'The Specific Electrical Condnclivity of Coals', Furl nO, 123-129. Rath, V. and Haak. V : 1986, 'Ideas Concerning the Nalure o~ Crustal High-Conductivity-Nones',
Poster presented al Eighth Workshop on Electromagnetic lnductic~n in the Earth and Moon; New chgttel, August 24-31, 1986.
Richwien, J., Schuster, A., Teichmfiller, R. und Wolburg, J.: 1963, 'Uberblick fiber das Profil der Bohrung MiJnsterland 1', Fortschr. Geol. Rheinld. u. Westf 11, 9-18.
Riepe, L., Rink, M., and Schopper, J. R.: 1979, 'Relations Between Specific-Surface Dependent Rock Properties', 6th Europ. Logging Symp. Trans., London. [Manuskript].
Roedder, E. (ed.): 1984~ Fluid Inclusions: Reviews in Mineralogy 12; Min. Sac. of America; Wash- ington, DC.
Sch6n, J.: 1983, Petrophysik~ Physikalische Eigenschaften van Gesteinen und Mineralen, Ferdinand Enke Verlag; Stuttgarc
Schopper, I, R. : 1982, "Elektrisehe Leitf~ihigkeR van Ge~tetnert aufgrund van Elektrolyten im Porer~- raum', in Laadvlt-B/3r~stein (ed.), Zahlr162 und Funktionen aus NaCurwisse~ch~en trod Tech- nik, Neue Serie V lb, gpringet-Verlag; Berlin, pp, 239-261
Schuyer, J. and van Krevelen, D. W.: 1955, 'Chemical Sltuclare and Properties of Coal. IX - Semi- conductivity of High Rank Coals', Fuel 34, 213-218.
Schwarz, G.: 1990, ~Electrical Conductivity of the Earth's Crust and Upper Mantle', Surveys in Geophysics 11, 133-161.
Serra, O.: 1984, 'Fundamentals of Well-Log Interpretation, 1, The Acquisition of Logging Data', Developments in Petroleum Science lgA; Elsevier; Amsterdam; Elf Aquitaine, Pau.
Shankland, T. J. and Ander, M. E.: 1983, 'Electrical Conductivity, Temperatures, and Fluids in the Lower Crust', J. Geophys. Res. 88, 9475-9484.
Shankland, T. J. and Waff~ H. S.: 1974, 'Conductivity in Fluid-Bearing Rocks', J. Geophys. Res. 79, 4863-4868.
Shankland, T. J. and Waft, H S,: 1977, "Partial Melting and ELectrical Conductivity Anomalie~ in the Upper MantLe', J. Geophy~. Res. 89,, 5409-5417.
Skrotzki, W. und Strackenbroek, L: 1988, 'Untersuchung de~- Graphitisie~ung wfihrend tier Melamol phase mittels hochauflC~sender TEM', in Kontinentales Tiefbohrprogramm der BundesreFublik De- utschland KTB. 1. K TB- gchwerpunkt-Kolloquium ZusammenJa~tung der Beitrage, 54, 28-29. Januar, 1988, Giessen.
Stach, E., Mackowsky, M. -Th., Teichmtiller, M., Taylor, G. H., Chandra, D., and Teichmtiller, K : 1982, Stach's Textbeok of Coal Petrology, 3rd ed., Gebrfider Borntraeger Verlag; Berlin.
Stanley, W. D.: 1989, 'Comparison of GeoelectricaL/Tectonic Models for Suture Zones in the Wester~ U.S.A. and Eastern Europe: Are Black Shales a Possible Source of High Conductivities?, Phys- Earth Planet. Int. 53,228-238.
Stanley, W. D., Finn, C , and Plesha, J. L.: 1987, 'Tectonics and Conductivity Structures in the Southern Washington Cascades', J. Geophys. Res. 92, 10179-10193.
Teichmfiller, M.: 1986, 'Organic Petrology of Source Rock~, History and State of Art', in Advances in Organic Geochemistry t985; Org. Geochem, 1tl, 58t-599; Pergamon Press; Oxford.
Teicb.mliller, M. and Teichmti(ler, R.: 1981, 'q-~e Signis of Cealificatiar~ S~udies to Oeolegy - A Review', Bull, Cencres Rech Explor.-Prod, Elf-Aquitaine $, ,~91-534,
Teichmfiller, M , Teichrnuller, R. und Weber, K.: 1979, 'lnkohlung nnd Illit-Kristallinitfit, Velglei chende Untersuchungen im Mesozoikum und Pal~iozoikum van Westfalen', Fortschr. Geol. Rheinld u. Westf. 27, 201-276-

W A T E R A N D ORAPHITIG IN T H E E A R T H ' S C R U S T 407
Tissot, B. P. and Welte, D. H.: 1984, Petroleum Formation and Occurrence, Springer-Verlag, Berlin. Touret, J. L. R.: 1989, 'Fluid Control in the Lower Crust', Nds. Akad. Geowiss. Ver6fftl. 1, 57-68. Volbers, R., J6dicke, H , and Untiedt, J.: 1990, 'Magnetotelluric Study of the Earth's Crust along the
Deep Seismic Reflection Profile DEKORP 2-N' , Geol. Rundschau 79, 581-601. Waft, H. S.: 1974, 'Theoreticai Considerations of Electrical Conductivity in a Partially Molten Mantle
and Implications for Geothermometry', J. Geophys. Res. 79, 4003-4010. Waft, H. S., Rygh, J. T., Livelybrooks, D. W., and Clingmam W. W.: 1988, 'Results of a MagnetoteL
luric Traverse across Western Oregon, Crustal Resistivity and the Subduction of the Juan de Fuca Plate', Earth Planet. Sci. Lett. 87, 313-324.
Walther, J. and Althaus, E.: 1990, 'Paper presented at, Kontinentales Tiefbohrprogramm der Bundes- republik Deutschland KTB. 3. KTB-Schwerpunkt-Kolloquium~ Giessen.
Walther, J. V. and Orville, P. M~: 1982, 'Volatile Production and Transport ~ Regional Metamor- phism', Contrib. Min. Pet. 79,252-257.
Watson, E. B.: 1986, 'Immobility of Reduced Carbon along Grain Boundaries in Dunite', Geophys. Res. Lett. 13, 529-532.
Yardley, B. W. D.: 1986, 'Is There Water in the Deep Crust?', Nature 323, 111.