water and environment sector performance report 2015
TRANSCRIPT

Government of Uganda
Ministry of Water and Environment
Water and Environment Sector Performance Report
2015

Uganda Water and Environment Sector Performance Report 2015
Foreword
I am delighted to present to you the Water and Environment Sector Performance Report for the 2014/15 Financial Year (SPR 2015). The report indicates progress made in terms of delivery of water and environment services during 2014/15, and the respective trends over the previous years.
The major sector achievements include the expansion of the management of water and sanitation services by the National Water & Sewerage Corporation (NWSC) from 66 to 110 towns by the end of June 2015. One major outcome of this expansion has been the significant increase in the number of new water connections (by new users) thereby increasing access to the safe water services, and also improvement in the overall sustainability of water services in these towns. As of June 2015, the population with access to safe water in the urban areas was 73%, whereas that in the rural areas increased to 65%. The national household latrine coverage improved from 74.6% to 77%.
The sustainability of water services in the small towns (outside the NWSC towns) has also improved to 92% (from the 89% which was reported last year). The improvement is largely due to back-up support for operations and maintenance which is being provided by regionally based Umbrella Organizations.
The total existing storage capacity of water for production facilities increased from 28.4 million m3 to 31.7 million m3. The Government of Uganda procured additional equipment for construction of water for production facilities. The equipment is presently used through a public-private-partnership arrangement, under which the Government and private farmers or developers share the construction costs at below-market rates.
Important steps have been made in the planning and implementation of catchment based integrated water resources management (through the 4 Water Management Zones) and also in the implementation of water source protection activities for new and existing water infrastructure ensure long term sustainability. We however need to increase compliance to the water resources regulations in terms of compliance to waste water discharge, surface and ground water abstraction by taking legal and/or punitive action against non-compliant permit holders. This will go a long way to reduce the on-going pollution of our water sources.
The Ministry has procured water quality testing/monitoring equipment for toxic wastes from oil and gas activities in the Albertine Graben. The equipment will be used to analyse and identify any pollutants in water which result from oil and gas activities in real time.
The Government made a decision earlier this year to implement the ban on the use of plastic/polythene bags, and my Ministry, together with the National Environment Management Authority (NEMA), is implementing the ban. In addition, a decision was made by Cabinet to cancel all land titles which were issued in wetlands. The wetlands are important ecosystems, which contribute to the national economy and livelihoods. The Ministry has prepared a national Wetlands Atlas to guide this cancellation process starting with Kampala, Mukono and Wakiso (which are considered to be the hotspots).
The Uganda National Meteorological Authority (UNMA) Act, 2012, has been operationalized and the authority is now operational with a Board of Directors and key staff have been appointed.
The sector still faces a challenge of inadequate financing to meet the sector targets as stated in the National Development Plan (NDP-II), and more particularly, the funding allocated for environmental an natural resources management is grossly inadequate, mainly as a result of low prioritization of the sub-sector. The other major challenge faced by the sector is the acquisition of land by government for new water infrastructure.
Finally, on behalf of the Government of Uganda, let me express our gratitude to all the sector Development Partners, Civil Society Organizations, and the Private Sector for the support given to the sector.
For God and my country,
Prof. Ephraim Kamuntu
MINISTER FOR WATER AND ENVIRONMENT, UGANDA

Uganda Water and Environment Sector Performance Report 2015
i
Executive Summary This is the seventh Water and Environment Sector Performance Report. It provides a concise and transparent overview of investments, targets, achievements, outputs and challenges for the sector. The report includes data and analysis with respect to the access, functionality and equity of improved water supplies, sanitation and hygiene, per capita investment cost, water quality, water storage, gender and community management, water resources management compliance as well as activities and achievements on wetlands and forestry management, meteorology, climate change and environmental monitoring and compliance.
Introduction
This year, in addition to collecting the information provided by the districts, a MWE centrally managed project was started (WATSUP-2), aiming amongst others at updating the Water Supply Database. Data collectors from the districts were trained in modern techniques using GPS receivers., and closely monitored during the data collection period. The results from the work in pilot districts prove that with this methodology a better quality dataset is obtained than with annual updates for the SPR. For the annual district updates, a total of 96% of the districts submitted their information in time. A total of 5,713 ‘new‘ safe water sources were reported and entered in the water supply database for the financial year 2014/15, as compared to 5,607 in the previous year. When reading this sector performance report, the reader needs to be aware that changes in access, functionality and equity indicators from the previous year are not only due to sources constructed during this financial year. A large number of sources constructed in earlier years but not yet entered in the database have been entered this year and therefore influenced the indicators.
Progress on undertakings of 2014/15
A total of 15 undertakings were adopted at the Joint Sector Review in October 2014. To implement the undertakings, thematic groups and subgroups were formed that prepared detailed action plans with indicators/outputs to monitor progress of implementation of each undertaking, which were subsequently approved by the Water and Environment Sector Working Group (WESWG). Progress made on implementation of the 15 undertakings shows that only 2 undertakings were fully achieved, and five were partially achieved mostly due to procurement delays and/or unavailable funding; eight undertakings were over-ambitious in view of insufficient funding as well as complexity, and will need to be gradually implemented in the next year(s).
Sector Planning and Finance
In FY 2014/15, the overall budget for the water and environment sector was UGX bn 846.18, compared to UGX 542.7 bn in FY 2013/14. The increase is largely due to increased funding reflected under NWSC’s off-budget component; the latter increased from UGX 35.88 bn (in FY 2013/14) to UGX bn 248 (FY 2014/15). The off budget funding amounted to UGX bn 401.55, whereas the on budget allocation was UGX 444.66 bn, similar to the UGX bn 439.1 of the previous year. The Government (on-budget) allocation for the water and environment sector represented 3.0% of the total national budget.
MoFPED released all the approved budget funds amounting to UGX bn 67.73 for district local governments in form of conditional grants. The approved budget was identical to that of the previous year. The inflation-corrected figures show that since FY2011/12, the releases to the districts in real terms have reduced to a level below the amount in FY2002/03, against an increasing total rural population, and a situation where the areas with potential for cheaper water supply options, including protection of springs and shallow boreholes technologies have been provided.
The off budget support, of UGX bn 401.55 increased substantially from UGX bn 103.7 in FY 2013/14 and UGX bn 73.4 bn in FY 2012/13. Of the approved off budget allocation, all was actually released.
Rural Water Supply
Data from the National Census 2014 provided by Uganda Bureau of Statistics (UBOS) indicate that the population of Uganda by August 2014 was 34.8 million (less than the anticipated 36.6 million as projected

Uganda Water and Environment Sector Performance Report 2015
ii
from the National Census 2002 data); 28.4 bn (82%) are living in rural areas. The national safe water coverage for rural areas is estimated at 65%, as compared to 64% in the previous year. In FY 2014/15, the total additional population served through the sector conditional grants was 729,868 persons. The increase in persons served, compared to 632,726 people served in FY 2013/14 is attributed to the change in prioritisation in the type of technologies implemented, resulting in an increase in the number of piped water schemes that serve a larger number of the scattered rural population. The activities implemented through centrally managed projects by MWE served an additional total number of 79,500 persons. Rehabilitated boreholes restored supply to 63,300 persons and the off-budget support programmes to MWE served an additional 31,500 people in rural areas.
An estimated total of 809,368 people have been served by new water supplies in FY 2014/15. The overall per capita cost for rural water supplies is thus UGX 116,897 (US $ 41), from UGX 122, 853 for 2013/14 FY. The per capita investment is still relatively high, as about UGX 22 billion was expended on ongoing multi-year projects, centrally managed by MWE.
Over the last two years, there has been a considerable increase in functionality of rural water supplies ranging from 84% in June 2013 to 88% in June 2015. The achievements may be attributed to various reasons. Investments for rehabilitation of water facilities under DWSCDG have increased, and the budgets for rehabilitation have gone up three times in a period of two years. Additionally, MWE rehabilitated 211 boreholes, and UNICEF rehabilitated 161 boreholes. For sustainability of the rehabilitation facilities, water user committees were reinvigorated through trainings where a clear plan and schedule of O&M is developed in line with MWE’s operational manual. Hand pump mechanics were also involved in the rehabilitation works to strengthen their capacity.
As of June 2015, the estimated equity value is 162, similar to the value of 161 of FY 2014/15.
Urban Water Supply
The period 1991 – 2015 saw a rapid increase in the urban population, more than doubling from 2.92 million to 6.392 million people, an average increase of more than 6.5 % per annum. This increase is partly because of natural overall population increase (3.0% between 2002 and 2014), an increase in the number of urban centres from 75 in 2002 to 197 in 2014, and expansion in the geographical area of some urban centres.
The four regional Water and Sanitation Development Facilities (WSDFs) remain the UWSS Department´s standard implementation mechanism for new water and sanitation interventions in STs/RGCs. During the FY 2014/15, 20 new town piped water supply systems were constructed and completed while system capacities of 4 existing town water supply systems were improved, serving an additional total population of 221,555 people (design population of 367,429 by 2030). Construction of town water supply and sanitation systems commenced and is on-going in 40 Small Towns, in addition to completed detailed designs in another 29 towns.
Access to improved water supplies in urban areas, based on estimated total population served, in both large and small towns, is 73% as at 30th June 2015, similar to the 72.8% in the previous year, and 70% in FY 2012/13. The average functionality is 92%, up from 89% in FY 2013/14. The functionality has improved due to the effort put in by the Umbrella Organisations of Water and Sanitation for operation and maintenance, such as replacing stolen/damaged pumps, and quicker response to system failures and break downs.
Of the 380 operational Umbrella member schemes, 361 (95%) are functional, even though many of these have some functionality problems (such as insufficient water quantity, frequent breakdowns, management issues or – less frequently – water quality issues). Based on the 120 water supply schemes for the FY 2014/15, the indicator value stands at 78.3%, indicating an improvement from 76% in June 2014.
The average per capita investment cost for the completed 26 towns’ water supply systems in FY 2014/15, serving an additional population of 258,807 people, is US$ 45, which is significantly less than the target per capita investment cost of US$ 75. Per capita investment cost remained in the same range as compared to last year (US$ 46).
As at 30 June 2015, the NWSC operates in 110 town (Areas) with a population of 6 million people. This represents a significant increase in the task of planning, management and control from 2013/14’s 66 towns.
Uganda Water and Environment Sector Performance Report 2015
iii
NWSC continues to implement a uniform tariff structure across all its towns to ensure equity in supply and pricing.
As at 30th June 2015, the total NWSC customer base was 418,031 customers of which 372,189 were active connections. During the FY 2014/15, the average number of new connections was 2,832 per month totalling to 33,982. This reflects a percentage growth of 21% from the previous year’s monthly average of 2,339 new connections. A total length of 1,447.5 were extended during FY 2014/15 against a target of 1,261.7 km, as compared to 470 km extended in the previous year.
During FY 2014/15, the Biological Oxygen Demand (BOD) and Total Suspended Solids (TSS) compliance to National standards was only 40.2%, and 41.9 %, respectively, based on a total of 3,192 waste water samples were tested in all regions. Out of the 110 towns, 16 towns operate centralised sewerage systems collecting, treating and discharging effluent to the environment.
Over the year, 99.2% of the water samples (in total 60,471 samples, from 8,531 in the previous financial year) from all Areas complied with the National standards for potable water, with regard to bacteriological quality, exceeding the WHO and National standard, of 97% and 95% respectively. On average, the overall compliance of both physio-chemical and bacteriological parameters to the National standards was 98.7%, meeting the annual target of 98%.
During the FY 2014/15, the implementation of the revised public service structure saw the creation of a new Department of Water Utility Regulation to replace the Regulation Unit. During the year, the Water Policy Committee recommended that the scope of regulation by the regulatory authority be expanded to include rural water supply and water for production. MWE’s Department of Water Utility Regulation carries out regulation by performance contracts for the Small Towns under its jurisdiction. The performance contracts set out the approved tariffs along with service standards required. Actual performance is monitored through quarterly reports and revised performance and management contracts are used to continue the commitment of the respective water authorities to improve service quality. The Department started an effort of de-concentration of its mandate within the Northern and South-western Regions. An Engineer and Economist have been recruited to ensure the effectiveness of regulation on ground. This process of de-concentration to other areas is planned to continue to other regions in the FY 2015/16. In FY 2014/15, the unit cost of producing water increased slightly from UGX1,233 to 1,453 per m3 (based on data from 67 Small Towns), due to many leakages that have occurred in the water schemes; this has in turn increased the NRW and energy input. Non-Revenue Water increased from 22% in FY 2013/14 to 28% in FY 2014/15. This is mainly attributed to the many leakages that have occurred along the distribution and transmission mains in the water schemes resulting from the road construction/expansion works.
Water for Production The percentage of WfP facilities with actively functioning water user committees remained at 80%. This year’s functionality rate for WfP facilities is at 74.9% (including the newly constructed facilities in FY 2014/15. The total storage capacity added through investments in the FY 2014/15 (including facilities done by the Districts and private farmers using WfP Construction Equipment) was 3,328,000m3, compared to only 940,200 m3 in the previous year. The increase in the volume created is due to factors such as OPM’s financing of water for production facilities to the Karamoja region, and sensitisation of communities to apply for private tanks. Therefore, by the end of FY 2014/15, cumulative storage had increased from 28.4 million cubic meters in FY 2013/2014, to 31.7 million cubic meters (of a total demand of 499 million m3).
Water Resources Management The monitoring network consists of 91 surface water stations and 30 groundwater stations. Various parameters are monitored which include surface water and groundwater levels, discharge, rainfall, humidity and temperature. The functionality of the network for the reporting period is 87%. As the network expands, MWE has appealed to local governments to sensitise communities on the importance of hydrological

Uganda Water and Environment Sector Performance Report 2015
iv
monitoring in national development, and to facilitate acquisition of land for new monitoring facilities through a mutually negotiated Memorandum of Understanding. A total of 752 water permit holders for waste water discharge, drilling permits, groundwater and surface water abstraction permits were monitored for compliance to the provisions of Water Act. The average compliance level to surface water, groundwater and waste water discharge permits is 67%, compared to 64% last financial year, indicating an increment of 3%. 27 companies with Certificates of EIA approval were visited to assess compliance to the approved recommendations and planned environmental management, and were provided with water use applications forms. All in all, only 11 of these companies have responded by applying for various permits. As of June 2015, MWE operates a national water quality monitoring network comprising 119 stations located in major lakes, rivers, ground water and waste discharge establishments. Water quality monitoring is carried out by the four Water Management Zones. Out of the 119 monitoring stations, 105 were monitored in the financial year under review, representing 88% achievement, a slight improvement from last financial year where achievement was at 84%. In FY 2014/15, MWE procured a set of water quality monitoring equipment and accessories to detect and identify presence/absence of toxic wastes from oil and gas activities in the Albertine Graben. In response to a Typhoid fever outbreak in Kampala, over 700 different drinking water sources from schools, organised communities, informal settlements, suburbs and municipalities were sampled and tested for mainly bacteria of faecal origin (E.coli). Key issues that were identified included poor sanitation and hygiene in and around water sources, poor operation and maintenance of water points leading to contamination of ground water, degradation of water catchment areas, and uncertainty on whether bottled water is factory packaged or locally packaged. Results showed that protected springs are the most prone to contamination followed by shallow wells. Deep boreholes showed less contamination possibly due to the deep nature of the ground water aquifer as compared to the shallow aquifers for other technologies. Use of guidelines on water source protection developed by DWRM should be implemented to improve the quality of water supplied. The Directorate of Water Resources Management continued to coordinate Uganda’s participation in international transboundary water resources management programs and projects. A number of projects were coordinated under the Lake Victoria Basin Commission, principally under the Lake Victoria Environment Management Project Phase II (LVEMP II), and the Nile Basin Initiative (NBI). Two Memoranda of Understanding for the joint management and development of shared water resources in the Sio-Malaba/Malakisi and Kagera Basin are being developed by Uganda with Kenya, and Rwanda/Burundi/Tanzania, respectively. The Water Release and Abstraction Policy for Lake Victoria Basin recommends a new regime to regulate the outflow of water from Lake Victoria through the Nalubaale and Kiira hydropower generation facilities at Jinja and downstream on the Nile. In the period under review, MWE coordinated continued engagement with East-African partner states to review the Policy, to include provision of guidance on abstraction of water from the Lake Victoria Basin that contributes to Lake Victoria, and also to evaluate the impacts of the Policy to partner states. Catchment Management Planning Guidelines for guiding the process of preparation of catchment management plans in Uganda were formally approved and launched in October 2014. Currently, catchment management planning is ongoing in a total of 10 catchments in the country. Six of these catchment management plans were finalised, while 4 catchment management plans are being reviewed and will be finalised in the FY 2015/16. Work has just started in an additional 5 catchments following the Catchment Planning Guidelines. Catchment Management Organisation structures in the form of Stakeholder Forums and Catchment Management Committees have formally been created in 6 of the 10 catchments, and these are fully operational. These structures are playing a key role in guiding the preparation and implementation of the Catchment Management Plans.

Uganda Water and Environment Sector Performance Report 2015
v
Sanitation and Hygiene During FY 2014/15, UGX 2.0 bn was released under the District Sanitation Conditional Grant (DSCG), with 89 districts receiving an average of UGX 23 million. Most districts used the money to carry out Community Led Total Sanitation (CLTS) triggering of communities and follow up of triggered communities to ensure they become Open Defecation Free (ODF), while some districts carried out home improvement campaigns aimed to get 100% latrine coverage in the target communities, with improved homesteads and attainment of ODF status. Apart from the work carried out by the districts, the department of Rural Water and Sanitation under MWE also carried out activities to support the improvement of sanitation in the country. The department carried out an advocacy drive, called “Sustainable Sanitation Drive, to implement international commitments on sanitation. As a result of the advocacy, leaders from 60 districts signed commitments to implement these resolutions, which are aimed at accelerating implementation towards meeting the MDGs and prioritisation of sanitation by the local governments. In addition to funding under the sanitation budget line, 16 districts received support from UNICEF for school sanitation and implementation of Community-Led Total Sanitation (CLTS). A total of 182 villages were reported to have been triggered. The Uganda Sanitation fund programme (USF), implemented in 30 districts under the oversight of the Environmental Health Division of the Ministry of Health, has been providing funds for rural sanitation and hygiene education in Uganda for four years. During FY 2014/15, a total of 2,046 villages were triggered during the financial year, with 549 (27 %) becoming Open Defecation Free (ODF). Over 4 years, a total of 6,026 villages have been triggered with 2,534 villages (42% of those triggered) reported to be ODF. In FY 2014/15, access to sanitation, according to district reports, increased to 77.0 Percent, achieving the national target of 77 percent by 2015. Although the country as a whole achieved the national target, only 64 districts (58 percent) achieved the national target of 77 percent, which is 27 more districts than four years ago. In addition, most of these toilets do not meet the standards of the WHO/UNICEF Joint Monitoring Program (JMP), which estimates that only 35 percent of the rural people in Uganda have access to improved sanitation (defined as not shared, cleanable, sealable and durable), with an estimated 10 percent practicing open defecation. According to the district reports, the pupil: latrine stance ratio is 1:67. This is a marginal improvement on what was reported last year, as there has not been any appreciable effort to construct new facilities in schools. Only 7 districts meet the national target of a pupil: latrine stance ratio of less than 1:40. Access to hand washing facilities in schools is very low with only 38 percent of the schools reported to have hand washing facilities. The access to hand washing facilities at the toilet is estimated at 33.2 percent. The rate of hand washing is still much lower than the national target of 50 percent. District performance in sanitation is benchmarked based on data received both from the District Water office, and the District Health Department. This is the sixth year of benchmarking and the highest performing district is Mbarara. As of June 2015, the access to sanitation in urban areas is estimated at 84 %. The coverage is based on reports from small towns only, as Kampala and many large towns, including Entebbe, Fort Portal, Gulu, Kasese, Mbale and Mukono, do not have data. It should be noted that apart from the interventions under the WSDFs, there is no targeted effort to promote urban sanitation; most of the urban councils spend their funds on solid waste management. The JMP estimates that only 34 percent of the urban population has access to improved sanitation as half of the urban population uses improved but shared facilities. Only 1 percent of the urban population is estimated to practice open defecation, while 15 percent use unimproved facilities. However, although data is not available for the whole Kampala city, Kampala City Council Authority carried out a slum profile which showed that 28% of its population in slums practice open defecation, with 19.4 percent of the population in the slums using polythene bags. MWE identified and clustered small towns in the country to guide sector investment in cost-effective, shared, faecal sludge disposal facilities and better engagement of the private sector and local authorities in service

Uganda Water and Environment Sector Performance Report 2015
vi
delivery. The Sector has prioritised the construction of faecal sludge treatment facilities; for example, Water Development facility – Central has finalised designs and is procuring a contractor to construct two faecal sludge management facilities in the towns of Wobulenzi and Lugazi. Designs have been completed for facilities in Kayunga, Dokolo, Adjumani, Kyotera and Ishongororo towns, while those for Kamuli, Nakasongola, Kagadi and Kiboga towns are still under development. Also, the Lake Victoria Water Supply and sanitation Program Phase II, being implemented by MWE, has on-going construction works for faecal sludge treatment plants in the towns of Mayuge, Kayabwe, Ntungamo and Bukakata.
The Sector developed an urban sanitation implementation manual to simplify the application of the Improved Sanitation and Hygiene (ISH) strategy for Small Towns, and guide all the stakeholders in the urban sanitation sub-sector in implementation of improved sanitation investments and hygiene promotion in small towns and rural growth centres.
CSOs in Water and Sanitation
NGOs and CBOs have continued to contribute to the water and sanitation subsector, by mobilising funds for the sector, by supporting water and sanitation infrastructure development, and by capacity building of communities to demand, develop and maintain water, sanitation and hygiene facilities. The national umbrella organisation of NGOs and CBOs in the water and sanitation sector, the Uganda Water and Sanitation NGO Network (UWASNET), continues to register more NGO and CBO members joining the sector; with membership currently standing at 235.
As of June 2015, CSOs’ total investment further increased from UGX bn 37.8 to UGX bn 49.30. CSOs provided new water sources thereby improving access to safe water sources through reduction of distances to safe water sources. Most of the new water points were rainwater water tanks (1,077 No.) and rainwater jars (741 No.). In total, 463 boreholes were drilled, 423 shallow wells were constructed, 132 springs were protected, and 116 tap stands and kiosks as well as 110 house connections were made. In terms of sanitation, the greatest investment was in construction of school sanitation facilities (UGX 5.77 billion).
To ensure effective O&M, NGOs conducted a range of activities including formation and training of WUCs, training and equipping of hand pump mechanics and follow up on management structures to monitor performance. A few NGOs facilitated the formation of Sub-County Water Supply and Sanitation Boards.
Wetland Resources Management
The production of Volume I of the National Wetlands Atlas was completed and covers areas of Kampala, Mukono and Wakiso. The wetlands shape file was also provided to Ministry of Lands, Housing and Urban Development to assist in the overlays with cadastral maps to support the cancellation process.
The area of Uganda’s wetland area under approved management plans increased from 1,320 km2 to 2,130 km2.
A total of 394.2 km of wetlands boundaries were demarcated with pillars and beacons. Only 210 Ha of degraded wetlands were restored in the FY 2014/15, compared to 758.3 Ha in FY 2013/14 and 1,645.8Ha in 2012/13. The Cabinet directive to cancel titles in wetlands needs to be fast-tracked through coordination meetings with all sub-sector actors.
Forestry
The area of natural forests and woodlands is quickly reducing in Uganda as a result of change of land use to agriculture and grazing, high demand on timber, and fuel wood, and other land uses. By 2009, Uganda’s forest cover was 18%, having declined from 24% in 1990. A comprehensive national assessment of the forest landscape is being conducted, and the potential as well as area for restoration is being determined by conducting spatial and socio-economic analyses, including an analysis of the enabling environment. It is evident that the area of degraded land has increased with the current forested area at nearly 10 percent. A draft Forest Landscape Restoration assessment report was prepared during the financial year. Hot spot areas for restoration have also been delineated.

Uganda Water and Environment Sector Performance Report 2015
vii
The key forestry initiatives/programmes and projects in FY 2014/15 included the implementation of the Farm Income Enhancement and Forestry Conservation Project (FIEFOC), Saw log Production Grant Scheme (SPGS), and Reducing Emissions from Deforestation and forest Degradation (REDD+).
The REDD+ project has supported tree planting with an aim to off-set carbon footprints in the pilot Mt. Elgon region; 585,985 Seedlings have been distributed during the period under review in the districts of Mbale, Bududa, Manafwa, Sironko, Bulambuli, Kapchorwa, Bukwo and Kween.
The FIEFOC project has mainly supported the rehabilitation of the catchments of Irrigation schemes through tree planting. Additional support was provided to very critical areas outside the catchments of the scheme but with a critical function to enhance restoration of the target catchments. A total of 1,801,510 assorted tree seedlings were distributed and planted in the catchment areas of irrigation schemes (Doho, Mobuku, Agoro and Olweny) , whereas 769,699 seedlings were distributed and planted outside the catchments in the districts of Amolatar, Masaka and Mukono.
The National Forestry Authority (NFA) manages Central Forest Reserves. Management of these reserves is geared towards achieving four strategic objectives namely, improving management of Central Forest Reserves (CFRs); expanding partnership arrangements, supplying high quality products and services and attaining organisational sustainability. During the FY 2014/15, a number of achievements were made against planned actions: 748 ha of forest plantations were established, 359.9 kms of boundary length was re-opened, slash weeding of 2,491 ha was undertaken, thinning of 1,365 ha was done, 14,843,215 seedlings were raised, 2,104 m3 of round wood were harvested, and 4,136 tourists were received in the different ecotourism sites
Environmental Support Services Under the Kalagala Sustainable Management Plan (KoSMP), restoration activities for the River Nile banks in the districts of Kayunga, Buikwe and Jinja were carried out. A multi-sectoral monitoring team monitored road works, waste consolidation areas (WCAs), waste treatment and disposal facilities, ongoing restorations, sensitive ecosystems threatened due to oil and gas externalities and restored sites in the districts of Hoima, Buliisa and Nwoya. It was found out that of all oil companies, only TEPU had engaged a contractor to treat and dispose of the generated waste. It was also found out that TEPU had committed itself to restore all sites where it had left a foot print, both in the protected area and in the community, apart from Waste Consolidation Areas and Camps. NEMA engaged and built the capacity of the 30 Civil Society Organisations operating in the oil-rich Albertine Graben to understand, manage and monitor environmental issues surrounding exploration and production of oil and gas in the Graben. An average of 60% of solid waste is collected and safely disposed of in the twelve CDM project-supported Municipalities. Over the period under review, 874 projects were submitted to NEMA for approval, and 591 were approved. Over the last five years, a total of 2,087 projects were approved by NEMA out of the total of 3,533 projects for which Environmental Impact Assessment (EIA) reports were submitted to NEMA. A total of 1,154 environmental compliance audits and inspections were carried out. On average, 66% of the inspected approved development projects is compliant with the EIA approved conditions. It should be noted that only about 30% of the inspected approved development projects in or around wetlands is compliant with the EIA approved conditions.
Meteorology, Weather and Climate
In total, 50 community rain gauge stations were installed in the Western and Northern parts of the country, with the view of involving the community in appreciating the weather and climate services provided by UNMA. A total of 23 Automatic weather stations (AWS) have been installed in the Kyoga Basin. Automation of UNMA rainfall observation network is in line with the current National Development Plan’s (NDP II) recommendation of overhauling and automating the weather observing system in the country. The Upper air Sounding Station in Entebbe was reactivated.

Uganda Water and Environment Sector Performance Report 2015
viii
Climate Change
The National Climate Change Policy (NCCP) and its costed implementation strategy was approved by the Cabinet on 1st of April, 2015. The Sector has commenced the implementation of the Policy through a number of projects.
The Clean Development Mechanism (CDM) Capacity Development Project completed an assessment of the potential for CDM project development in Uganda, and trained Ugandans in CDM project development. It also developed baselines to help further reduce the transaction costs of CDM project development.
The Economic Assessment of the Impacts of Climate Change in Uganda, which provides information about the current “adaptation deficit” in Uganda and the negative consequences that climate variability has on the Ugandan economy, was conducted by the Climate and Development Knowledge Network (CDKN). The assessment concludes that there is indeed a link between the impacts of climate change and future growth prospects in the country. In the absence of adaptation actions, climate factors could compromise the Uganda “Vision 2040” targets. Climate change is predicted to have a significant impact on Uganda. The cost of inaction under climate variability and change for agriculture, water, total infrastructure, and energy is estimated at between $270 and $332 billion for these sectors over the period 2010−2050.
CSOs in Environment and Natural Resources
Outputs presented by ENR CSOs are based on data received from 55 (36%) of the 150 active CSOs that are member of the Environment and Natural Resources Civil Society Organisations Network, which is presently hosted by Environment Alert. During the FY 2014/15, ENRCSOs made a total investment of UGX bn 88.5 in the areas of forestry, wetlands, environment management, climate change and the weather and climate change sub-sectors.
ENR CSOs recommend to support district local governments with enforcement of environmental regulations and also point out the need to develop a comprehensive communication and advocacy strategy that enhances compliance and strengthens the interface between enforcement agencies, key environment institutions and the public.
Gender
Data from MWE’s Water Supply Database from 111 districts indicates that 84% of water sources have women occupying key positions. This indicates a slight increase from 83% reported last year, but falls short of the targeted 95%.
Among the town boards, 66.7% had women holding key positions, an improvement from 63% in the previous reporting period based on the 120 water supply schemes. The efforts to improve the functionality of the water supply schemes contributed to the improvement on gender consideration in the scheme, as new WSSBs for the improved schemes were formulated, during which gender mainstreaming was advocated.
Good Governance
The Good Governance Working Group of the Water and Sanitation sub-sector reviewed and updated the Good Governance Action Plan for the period 2014-2017, taking into consideration the recommendations suggested by the survey report “Assessing Governance and Integrity in the Water and Sanitation Sub-sector”. The updated Action Plan shows that 73% of the actions are on-going, while the other 27% have not yet started; most of the latter are activities beyond MWE’s mandate.
Various activities aimed at implementing the revised conditional grant allocation formula for rural water and sanitation in order to improve equity within and between districts were carried out. An on-going parallel process of reforming all the Central Government Conditional Grant transfers to District Local Governments by the Ministry of Finance, Planning and Economic Development is currently taking place, which may override the provisions and/or application of the revised water and sanitation grant (and other sector grants) allocation formulae.

Uganda Water and Environment Sector Performance Report 2015
ix
Key Sector Issues for Sector Dialogue
The following issues, listed in the final chapter of the report, summarise main challenges in the sector, and a way forward to address these: (i) deteriorating water quality issues, (ii) the need for revision of indicators, (iii) implementation of water source protection, (iv) streamlining of the transfer of town water supplies to NWSC, (v) monitoring performance of urban utilities, (vi) the future of Umbrella Organisations, (vii) stagnation in hand-washing practices, (viii) land issue, (ix) compliance and enforcement challenges in environment and natural resources management, (x) forest degradation and illegal timber harvesting, and (xi) inadequate and inequitable funding for environmental management.
Status of Golden and Platinum Indicators
The performance of the water and environment sub-sectors against the Golden and Platinum indicators respectively, is presented in the tables below and on the following page. Achievements above the target for FY 2014/15 are shaded green, while indicators shaded red highlight the non-achievement in FY 2014/15.
Water and Sanitation Sub-sector Performance against the Golden Indicators
Golden Indicators Achievements Targets
13/14 14/15 14/15 1. Access: % of people within 1,000m (rural) and 200m (urban) of an improved water source
Rural 64% 65% 77% Urban 73% 73% 100%
2. Functionality: % of improved water sources that are functional at time of spot-check (rural/WfP). Ratio of actual hours of water supply to the required hours (small towns)
Rural 85% 88% 90% Urban 89% 92% 95% WfP 74% 75% 90%
3. Per Capita Investment Cost: Average cost per beneficiary of new water and sanitation schemes (USD)
Rural 47 41 45 Urban 46 45 85
4.1 Household Sanitation: % of people with access to improved sanitation
Rural 75% 77% 77% Urban 84% 84.1% 100%
4.2 School Sanitation: Pupil to latrine/toilet stance ratio) (from DHI reports) 70:1 67:1 40:1 5. Water Quality: % of water samples taken at the point of water collection, waste discharge point that comply with national standards.
Protected Rural Source E.coli (from WQD) 53% 36% 95%
Large Towns Drinking Water (data from NWSC)
E.coli 100% 99% 100% Colour 90% 93% 100%
Wastewater (data from NWSC)
BOD5 41% 40% 60% TSS 73% 42% 67%
6. Cumulative Water for Production Storage Capacity (million m3) 28.4 31.7 29 7. Equity: Mean Sub-County deviation from the national average in persons per improved water point 161 162 150
8. Hand-washing: % of people with access to (and using) hand-washing facilities
Household (rural) 33% 33% 50%
School 38% 38% 50% 9. Management: % of water points with actively functioning Water & Sanitation Committees (rural/WfP)/Boards (urban)
Rural 71% 77% 95% Urban 76% 78% 95% WfP 80% 80% 75%
10. Gender: % of Water User committees/Water Boards with women holding key positions [Note * WfP 73% for valley tanks, 48% for dams]
Rural 83% 84% 95% Urban 63% 67% 95% WfP 69/45 73/48* 75%
11. Water Resources Management Compliance: % of water abstraction and discharge permits holders complying with permit conditions (Note: before FY 2011/12, indicator referred to permit validity only. In FY 2011/12, for wastewater discharge, % compliance was taken. In FY 2012/13, permit conditions are compliance to permitted abstraction volumes and compliance with effluent quality. From FY 2014/15, a compliance on reporting on drilling is included).
Wastewater discharge 50% 52% 55%
Surface water abstraction 68% 71% 75%
Groundwater abstraction 68% 71& 75%
Drilling - 88%

Uganda Water and Environment Sector Performance Report 2015
x
Environment Sub-sector Performance against the Platinum Indicators
No. Platinum Indicators Baseline Value
Achievements FY2013/14 FY2014/15
1. % Uganda’s land area covered by forest 18% 15% 11% 2. % natural forest under strict nature reserve 12% 12% 12% 3. % survival of tree seedlings past year 3 60% 75% 78% 4. % rural households that travel more than 1 km to collect firewood 2 km unknown unknown 5. % forest reserves under management plans 32% 32% 32% 6. % developers complying with certificate of approval conditions 60% 70% 66% 7. % solid waste disposed of safely in the 9 municipalities 50% unknown 60% 8. % meteorological rainfall observation network coverage of country 60% unknown unknown 9. % Uganda’s land area covered by wetlands 10.9% 10.904% 10.91% 10. % Uganda’s wetlands used under management plans 0.9% 4.4% Increase of
810 km2

Uganda Water and Environment Sector Performance Report 2015
xi
Table of Contents
FOREWORD .............................................................................................................................................................. I
EXECUTIVE SUMMARY ............................................................................................................................................. I
TABLE OF CONTENTS ............................................................................................................................................... I
LIST OF FIGURES ................................................................................................................................................. XVII
LIST OF TABLES .................................................................................................................................................. XVIII
LIST OF BOXES ...................................................................................................................................................... XIX
LIST OF ABBREVIATIONS ....................................................................................................................................... XX
GLOSSARY AND DEFINITIONS ............................................................................................................................ XXIV
1 INTRODUCTION .............................................................................................................................................. 1 1.1 About this Report .................................................................................................................................. 1 1.2 Sector Institutional Framework............................................................................................................. 2 1.3 Data Collection ...................................................................................................................................... 3
1.3.1 Introduction .................................................................................................................................. 3 1.3.2 Water Supply Database ................................................................................................................ 3 1.3.3 WATSUP 2 ..................................................................................................................................... 3
2 PROGRESS ON JOINT SECTOR REVIEW UNDERTAKINGS 2014 ..................................................................... 10 2.1 Environment and Natural Resources .................................................................................................. 10
2.1.1 Undertaking No. 1: Implement the ENR Sector Performance Monitoring Framework.............. 10 2.1.2 Undertaking No. 2: Demarcation and Management of Wetlands and Forests .......................... 10 2.1.3 Undertaking No.3: Oil Contingency Plan .................................................................................... 11 2.1.4 Undertaking No. 4: Local Government Capacity Building .......................................................... 12 2.1.5 Undertaking No. 5: Vote for UNMA ........................................................................................... 12
2.2 Water Resources Management .......................................................................................................... 13 2.2.1 Undertaking No. 6: Map and Plan Hotspot Catchments ............................................................ 13 2.2.2 Undertaking No.7: Murchison Bay Pollution Management ....................................................... 13
2.3 Water Supply and Sanitation .............................................................................................................. 14 2.3.1 Undertaking No. 8: Implement the Revised Conditional Grant Allocation ................................ 14 2.3.2 Undertaking No. 9: Reactivate WfP Sub-Sector Working Group ................................................ 15 2.3.3 Undertaking No. 10: National Irrigation Policy ........................................................................... 15 2.3.4 Undertaking No. 11: School Sanitation ...................................................................................... 16 2.3.5 Undertaking No. 12: Financing Framework ................................................................................ 16 2.3.6 Undertaking No. 13: Monitoring Good Governance ................................................................. 17 2.3.7 Undertaking No. 14: Urban Conditional Grant ........................................................................... 18 2.3.8 Undertaking No. 15: Appraisal of Capacity Development Plans ................................................ 18
3 SECTOR PLANNING, HUMAN RESOURCES DEVELOPMENT AND FINANCE .................................................. 19 3.1 Planning and Budgeting ...................................................................................................................... 19 3.2 Financial Performance ........................................................................................................................ 19
3.2.1 Overall Budget Performance ...................................................................................................... 19 3.2.2 On-budget Performance ............................................................................................................. 21 3.2.3 Off-budget Performance ............................................................................................................ 23
3.3 Capacity Development ........................................................................................................................ 24
4 RURAL WATER SUPPLY ................................................................................................................................. 25 4.1 Background ......................................................................................................................................... 25 4.2 Key Activities of Rural Water Supply ................................................................................................... 25
4.2.1 District Water and Sanitation Development Conditional Grant & Peace, Recovery and Development Programme............................................................................................................................ 25 4.2.2 MWE Centrally implemented Development Projects ................................................................ 26 4.2.3 Technical Support to District Local Governments ...................................................................... 28

Uganda Water and Environment Sector Performance Report 2015
xii
4.2.4 Cross-cutting activities ............................................................................................................... 29 4.2.5 WASH Activities Supported by UNICEF....................................................................................... 29 4.2.6 Appropriate Technology Centre for Water and Sanitation, Mukono ......................................... 30
4.3 Status and Trends of Key Indicators .................................................................................................... 31 4.3.1 Golden Indicator No 1: Access to Safe Water in Rural Areas ..................................................... 31 4.3.2 Golden Indicator No 2: Functionality ......................................................................................... 34 4.3.3 Golden Indicator No 3: Per Capita Investment Cost ................................................................... 36 4.3.4 Golden Indicator No. 7: Equity ................................................................................................... 36 4.3.5 Golden Indicator No. 9: Community Management .................................................................... 38 4.3.6 Golden Indicator 10 on Gender Mainstreaming ........................................................................ 40
4.4 Challenges and Recommendations ..................................................................................................... 40
5 URBAN WATER SUPPLY ......................................................................................................................... 41 5.1 Introduction and Background ............................................................................................................. 41
5.1.1 Urban Centres in Uganda and Urbanisation ............................................................................... 41 5.1.2 Water Supply, and Operation of systems in all Urban Centres in Uganda ................................. 41
5.2 Water Supply in Towns Managed by National Water and Sewerage Corporation ............................. 43 5.2.1 NWSC Tariff Structure FY 2014/15 ............................................................................................. 43 5.2.2 Unit Cost of Water Production in FY 2014/15 in Towns Supplied by NWSC .............................. 43 5.2.3 NWSC Internal Strategies ........................................................................................................... 44 5.2.4 Projects implemented by NWSC ................................................................................................ 45 5.2.5 Management and Performance of NWSC’s Town Water Supply Schemes ................................ 46 5.2.6 Status and Trends of Key Indicators ........................................................................................... 49 5.2.7 Source Protection and Environmental Safeguards ..................................................................... 51 5.2.8 Challenges .................................................................................................................................. 51 5.2.9 Recommendations...................................................................................................................... 52
5.3 Water Supply in Towns managed by MWE/DWD ............................................................................... 53 5.3.1 Planning and Development of Water Supply and Sanitation Interventions in STs and RGCs .... 53 5.3.2 Status and Trends of Key Indicators ........................................................................................... 54 5.3.3 Support to O&M of Water Supply Schemes ............................................................................... 57 5.3.4 Source Protection and Environmental Safeguards ..................................................................... 59 5.3.5 Challenges in Planning and Development and Support to Utility Management ........................ 59
5.4 Regulation of Water Supply and Sanitation Services .......................................................................... 60 5.4.1 Introduction ................................................................................................................................ 60 5.4.2 Key Initiatives ............................................................................................................................. 61
6 WATER FOR PRODUCTION ..................................................................................................................... 68 6.1 Background ......................................................................................................................................... 68 6.2 Programmes and Projects ................................................................................................................... 68 6.3 Status and Trends of Key Indicators .................................................................................................... 69
6.3.1 Golden Indicator No. 2: Functionality ........................................................................................ 70 6.3.2 Golden Indicator No. 6: Cumulative WfP Storage Capacity ....................................................... 70 6.3.3 Golden Indicator No 9: Management of Water Points............................................................... 71 6.3.4 Golden Indicator No. 10: Gender ............................................................................................... 72
6.4 Sanitation and Hygiene around WfP facilities ..................................................................................... 72 6.5 Information Management ................................................................................................................... 73 6.6 Contribution by Cross-Sectoral Projects ............................................................................................. 73 6.7 Lessons Learned and Recommendations ............................................................................................ 73
7 WATER RESOURCES MANAGEMENT ...................................................................................................... 74 7.1 Introduction ........................................................................................................................................ 74 7.2 Water Resources Monitoring and Assessment ................................................................................... 74
7.2.1 Water Resources Monitoring Network ...................................................................................... 76 7.2.2 Update of the national surface water and groundwater databases .......................................... 76 7.2.3 Dissemination of Water Resources Data and Information to Users .......................................... 80 7.2.4 Provision of Advice on Water Resources Development Projects ............................................... 80 7.2.5 Challenges .................................................................................................................................. 81

Uganda Water and Environment Sector Performance Report 2015
xiii
7.2.6 Way Forward .............................................................................................................................. 81 7.2.7 Water Information System ......................................................................................................... 82
7.3 Water Resources Planning and Regulation ......................................................................................... 82 7.3.1 Overview of Performance .......................................................................................................... 82 7.3.2 Water Use Planning and Allocation ............................................................................................ 83 7.3.3 Reservoir Regulation and Dam safety ........................................................................................ 84 7.3.4 Golden Indicator no. 11: Compliance Monitoring and Enforcement ......................................... 84 7.3.5 Environmental Impact Assessments ........................................................................................... 87 7.3.6 Water Laws, Policies and Regulations ........................................................................................ 87 7.3.7 Finalisation and Approval of the National Water Resources Strategy ....................................... 88 7.3.8 Operationalisation of the Water Source Protection Guidelines ................................................. 88 7.3.9 Implementation of Catchment-Based Water Resources Management ..................................... 90 7.3.10 Preparation and Implementation of Catchment Management Plans ........................................ 90 7.3.11 Conclusions and Way Forward ................................................................................................... 96
7.4 Water Quality Management ............................................................................................................... 97 7.4.1 Water Quality Monitoring Networks .......................................................................................... 97 7.4.2 Oil and Gas On-line Monitoring Equipment ............................................................................... 98 7.4.3 National Water Quality Database and Information System ....................................................... 99 7.4.4 Water Quality Testing Laboratories ......................................................................................... 100 7.4.5 The Laboratory Quality System and Quality Assurance ........................................................... 100 7.4.6 Non-Tax Revenue (NTR) ........................................................................................................... 100 7.4.7 Capacity Development of Local Governments ......................................................................... 101 7.4.8 Water Quality Assessments ...................................................................................................... 101 7.4.9 Golden Indicator Number 5: Water quality .............................................................................. 102 7.4.10 Challenges/Constraints............................................................................................................. 105 7.4.11 Possible Solutions to the Challenges ........................................................................................ 105 7.4.12 Way forward ............................................................................................................................. 106
7.5 International and Transboundary Water Resources Management .................................................. 107 7.5.1 Introduction .............................................................................................................................. 107 7.5.2 Trans-boundary Agreements, Laws, Policies, and Standards Developed ................................. 107 7.5.3 Support and Coordination of Trans-Boundary Organisations .................................................. 108 7.5.4 Achievements under Nile Basin Initiative (NBI) ........................................................................ 108 7.5.5 Achievements under Lake Victoria Environmental Management Project – Phase II ............... 110 7.5.6 Achievements under other Transboundary Organisations ...................................................... 113 7.5.7 Access to Trans-Boundary Water Management Tools, Knowledge, Data, Communication and Information Dissemination ........................................................................................................................ 114 7.5.8 Challenges ................................................................................................................................ 114
7.6 Way Forward ..................................................................................................................................... 114
8 SANITATION AND HYGIENE ................................................................................................................. 115 8.1 Rural Sanitation and Hygiene ............................................................................................................ 115
8.1.1 Key Programmes and Projects .................................................................................................. 115 8.1.2 Status and Trends of Key Indicators ......................................................................................... 118 8.1.3 Challenges and Recommendations .......................................................................................... 121
8.2 Urban Sanitation and Hygiene .......................................................................................................... 122 8.2.1 Key Initiatives ........................................................................................................................... 122 8.2.2 Status and Trends of Key Indicators ......................................................................................... 124 8.2.3 Challenges and Recommendations .......................................................................................... 125
9 ENVIRONMENT AND NATURAL RESOURCES ........................................................................................ 126 9.1 Wetland Management ...................................................................................................................... 126
9.1.1 Key Programmes and Projects .................................................................................................. 126 9.1.2 Status and Trends of Key Indicators ......................................................................................... 130 9.1.3 Challenges and Recommendations for Wetlands Management .............................................. 130
9.2 Forestry Management ....................................................................................................................... 132 9.2.1 Achievements in Forests Management by MWE ..................................................................... 132 9.2.2 Achievements in Central Forests Reserves ............................................................................... 133

Uganda Water and Environment Sector Performance Report 2015
xiv
9.2.3 Achievements by District Forest Services ................................................................................. 133 9.2.4 Private Sector Participation ...................................................................................................... 134 9.2.5 Key Programmes and Projects .................................................................................................. 134 9.2.6 Status and trends of Key indicators .......................................................................................... 136 9.2.7 Challenges and recommendations ........................................................................................... 137
9.3 Environmental Management by Department of Environmental Services (DESS) ............................. 138 9.3.1 Key programmes and projects.................................................................................................. 138 9.3.2 Challenges and recommendations ........................................................................................... 141
9.4 Environmental Management by National Environment Management Authority ............................ 142 9.4.1 Achievements ........................................................................................................................... 142 9.4.2 Key Programmes and Projects .................................................................................................. 145 9.4.3 Status and Trends of Key Indicators ......................................................................................... 146 9.4.4 Challenges and recommendations ........................................................................................... 147
9.5 Meteorology (Weather and Climate) ................................................................................................ 149 9.5.1 Introduction .............................................................................................................................. 149 9.5.2 Activities during the FY 2014/15 .............................................................................................. 149 9.5.3 Key Projects .............................................................................................................................. 151 9.5.4 Challenges and Recommendations .......................................................................................... 151
10 CLIMATE CHANGE ................................................................................................................................ 153 10.1 Institutional Framework .................................................................................................................... 153 10.2 Achievements in FY 2014/15 ............................................................................................................. 153
10.2.1 Develop Institutional Capacities for Climate Change Management in Uganda ....................... 153 10.2.2 Establish the Knowledge Base for Climate Change Mitigation and Adaptation in Collaboration with Makerere University Climate Change Research Institute (MUCCRI) ................................................. 153 10.2.3 Operationalize the Climate Change Policy ............................................................................... 154
10.3 Contributions and Achievements by Specific Projects ...................................................................... 154 10.3.1 The GCCA Project ..................................................................................................................... 154 10.3.2 The Low Emission Capacity Building (LECB) Project for Uganda .............................................. 154 10.3.3 CDM Capacity Development Project ........................................................................................ 155 10.3.4 Effective Participation of Uganda in the COPs ......................................................................... 155 10.3.5 Nationally Appropriate Mitigation Actions (NAMAs) ............................................................... 155 10.3.6 Second National Communication ............................................................................................. 156 10.3.7 Intended Nationally Determined Contributions (INDC) ........................................................... 156 10.3.8 Economic assessment of the impacts of climate change in Uganda ........................................ 156
10.4 Contribution by Cross-Sectoral Projects ........................................................................................... 157 10.5 Lessons Learned and Recommendations .......................................................................................... 157
11 CROSS-CUTTING ISSUES ....................................................................................................................... 158 11.1 Gender Mainstreaming ..................................................................................................................... 158
11.1.1 Capacity Building Initiatives...................................................................................................... 158 11.1.2 Gender Mainstreaming in Plans and Budgets .......................................................................... 159 11.1.3 Gender Staffing......................................................................................................................... 159 11.1.4 Gender Mainstreaming in the Private Sector ........................................................................... 159 11.1.5 Challenges and Recommendations .......................................................................................... 159 11.1.6 Recommendations to Upscale Gender Mainstreaming ........................................................... 160
11.2 Support Disadvantaged and Vulnerable Groups ............................................................................... 160 11.2.1 Key Activities to Support the Poor in Towns ............................................................................ 160 11.2.2 District Programmes to Support Women and Vulnerable Groups ........................................... 161
11.3 HIV/AIDS mainstreaming................................................................................................................... 161 11.3.1 HIV/AIDS Mainstreaming .......................................................................................................... 161 11.3.2 HIV/AIDS Mainstreaming Initiatives by Local Government ...................................................... 162 11.3.3 HIV/AIDS Mainstreaming Activities in Urban Areas ................................................................. 163 11.3.4 Challenges and recommendations ........................................................................................... 163
11.4 Provision of Water and Sanitation Services to the Poor ................................................................... 163
12 CIVIL SOCIETY ORGANISATIONS IN WATER AND SANITATION ............................................................. 166

Uganda Water and Environment Sector Performance Report 2015
xv
12.1 Overview ........................................................................................................................................... 166 12.2 CSO Investments in WASH ................................................................................................................ 166 12.3 Investments in Water Supply ............................................................................................................ 167 12.4 Investments in Sanitation and Hygiene............................................................................................. 168 12.5 Investments in Community Management......................................................................................... 168 12.6 Access to Improved Water Supply (Golden Indicator No.1) ............................................................. 169 12.7 Functionality of Water Supplies (Golden Indicator No.2) ................................................................. 170
12.7.1 Formation and Training of WUCs/WSCs ................................................................................... 170 12.7.2 Sub-county Water Supply and Sanitation Boards .................................................................... 171 12.7.3 Training and Supporting Hand Pump Mechanics ..................................................................... 171 12.7.4 Supporting the CBMS ............................................................................................................... 171
12.8 Water Quality Monitoring ................................................................................................................. 172 12.9 Integrated Water Resource Management (IWRM) ........................................................................... 172 12.10 School Sanitation .......................................................................................................................... 173 12.11 Community Dialogue Meetings .................................................................................................... 173 12.12 Generating Demand, and Improving Supply Chain for Sanitation and Hygiene Promotion ......... 174
12.12.1 Community-Led Total Sanitation (CLTS) ................................................................................... 174 12.12.2 Improving the Supply Chain ..................................................................................................... 174
12.13 Documenting Experiences, Case Studies, Information Sharing and Learning .............................. 175 12.14 Cross-cutting Issues ...................................................................................................................... 176
12.14.1 Gender Mainstreaming ............................................................................................................ 176 12.14.2 Promotion of Equity in Provision of Water Supply and Sanitation Services............................. 176 12.14.3 HIV/AIDS Mainstreaming .......................................................................................................... 176 12.14.4 Coordination and Collaboration ............................................................................................... 176
12.15 Key Observations and Lessons learnt ........................................................................................... 177 12.16 Challenges ..................................................................................................................................... 178 12.17 Recommendations ........................................................................................................................ 178
13 CIVIL SOCIETY ORGANISATIONS IN ENVIRONMENT AND NATURAL RESOURCES .................................. 179 13.1 Overview ........................................................................................................................................... 179 13.2 CSO Investments in Environment and Natural Resources ................................................................ 179 13.3 CSO Achievements in the Forestry Sub-sector .................................................................................. 180
13.3.1 Contribution to Forestry Management .................................................................................... 180 13.3.2 Awareness and Sensitisation on Environment and Natural Resources Management ............. 181 13.3.3 Community Participation in Forestry Management ................................................................. 182 13.3.4 Capacity Building ...................................................................................................................... 183 13.3.5 Policy, Planning, Lobbying and Advocacy Engagements at District and National Levels ......... 183 13.3.6 Research, Studies or Surveys .................................................................................................... 183 13.3.7 Media Engagement .................................................................................................................. 183
13.4 CSO Achievements in the Wetlands Sub-sector ................................................................................ 184 13.4.1 Contribution to Wetlands Management .................................................................................. 184 13.4.2 Awareness and Sensitisation on Wetlands Management and Wise Use ................................. 184
13.5 CSO Achievements in the Environment sub-sector .......................................................................... 185 13.5.1 Environment Management ...................................................................................................... 185 13.5.2 Environmental Awareness and Sensitisation ........................................................................... 185 13.5.3 Community Participation.......................................................................................................... 186 13.5.4 Capacity Building ...................................................................................................................... 186 13.5.5 Lobbying and Advocacy Engagements in Policy and Planning ................................................. 187
13.6 CSO Achievements in the Weather and Climate Change Cub-sector ............................................... 187 13.6.1 Climate Change Awareness and Sensitisation in Climate Change ............................................ 187 13.6.2 Climate Change Adaptation and Mitigation ............................................................................. 187 13.6.3 Policy, Planning, Lobbying and Engagements in Climate Change ............................................ 188
13.7 Governance as Cross-Cutting Issue ................................................................................................... 188 13.7.1 Civic Education and Stakeholder Awareness of holding Duty Bearers Accountable ................ 188 13.7.2 Capacity Building ...................................................................................................................... 188 13.7.3 Advocacy Engagements towards Good Governance ................................................................ 188 13.7.4 Research, Studies or Surveys in Good Governance .................................................................. 189

Uganda Water and Environment Sector Performance Report 2015
xvi
13.8 ENR Sub-Sector Challenges and Recommendations – CBO/NGO Perspective .................................. 189 13.8.1 Challenges faced by ENR CSOs ................................................................................................. 189 13.8.2 Recommendations.................................................................................................................... 190
13.9 Key issues for Engagement ............................................................................................................... 191
14 GOOD GOVERNANCE IN WATER AND ENVIRONMENT ......................................................................... 193 14.1 Introduction ...................................................................................................................................... 193 14.2 Good Governance in Water and Sanitation Sub-Sector .................................................................... 193
14.2.1 Update of the Good Governance Action Plan (GGAP) ............................................................ 193 14.2.2 Urban Water Grant Survey ....................................................................................................... 193 14.2.3 District Water and Sanitation Development Conditional Grant allocation formula ................ 193 14.2.4 Value for Money Audit of District Water and Sanitation Conditional Grant (DWSCG) ............ 194 14.2.5 Procurement Planning and Contract Management Training ................................................... 194 14.2.6 Awareness campaign ................................................................................................................ 194 14.2.7 Improving WASH governance in schools .................................................................................. 195 14.2.8 Quarterly meeting .................................................................................................................... 195
14.3 Governance Challenges in the Water and Sanitation Sub-Sector ..................................................... 195 14.3.1 Financing .................................................................................................................................. 195 14.3.2 Secretariat ................................................................................................................................ 195 14.3.3 Limited mandate ...................................................................................................................... 196
14.4 Conclusion and Recommendations Water and Sanitation Sub-Sector ............................................. 196 14.5 Good Governance in Environment and Natural Resources Sub-Sector ............................................ 196
14.5.1 ENR – Governance Activities implemented during FY 2014/15 ............................................... 196 14.5.2 Challenges and Recommendations .......................................................................................... 197
15 KEY ISSUES FOR SECTOR DIALOGUE ..................................................................................................... 198 15.1 Cross-sectoral issues ......................................................................................................................... 198
15.1.1 Water quality ............................................................................................................................ 198 15.1.2 Key sector indicators ............................................................................................................... 198 15.1.3 Water source protection .......................................................................................................... 199
15.2 Take-over of management of small town water supply to NWSC .................................................... 199 15.3 Regulation ......................................................................................................................................... 200 15.3 Future of Umbrella Organisations ..................................................................................................... 200 15.4 Stagnation in hand-washing behaviour............................................................................................. 201 15.5 Land issues ........................................................................................................................................ 201 15.6 ENR compliance and enforcement challenges .................................................................................. 202 15.7 Forest degradation and Illegal timber transection............................................................................ 202 15.8 Limited funding for environment management activities ................................................................ 202
ANNEX 1. INFORMATION SOURCES AND REFERENCES ............................................................................ - 1 - Annex 1.1 Information Sources for the Water and Environment Sector Performance Report 2014 ........ - 1 - Annex 1.2 References ................................................................................................................................ - 1 -
ANNEX 2. OVERVIEW OF THE SECTOR INSTITUTIONAL FRAMEWORK ..................................................... - 2 -
ANNEX 3. IMPLEMENTATION SCHEDULE FOR WATSUP 2 ........................................................................ - 9 -
ANNEX 4. FORMULAS USED FOR CALCULATING INDICATORS IN MIS .................................................... - 10 -
ANNEX 5. FORMULAS USED IN CALCULATIONS FOR ACCESS IN URBAN CENTRES ................................. - 14 -
ANNEX 6. FINANCIAL SECTOR PERFORMANCE FY 2014/15 .................................................................... - 15 - Annex 6.1 Details of On-Budget and Off-Budget Figures and Trends ..................................................... - 15 - Annex 6.2 On Budget Sector Funding FY 2014/15 (UGX Bn) ................................................................... - 16 -
ANNEX 7. SUPPORT PROVIDED BY UNICEF IN SANITATION AND HYGIENE, HAND PUMP MECHANICS TRAINING AND WASH EMERGENCY RESPONSE IN FY2014/15 .................................................................... - 22 -
ANNEX 8. DISTRICT PERFORMANCE - COMMUNITY MANAGEMENT AND GENDER INDICATORS ........... - 23 -

Uganda Water and Environment Sector Performance Report 2015
xvii
ANNEX 9. WSDF BRANCHES, THEIR LOCATIONS, DISTRICTS UNDER THEIR JURISDICTION AND SCHEMES COMPLETED 26
ANNEX 10. KEY DATA ON ALL SCHEMES COMPLETED UNDER WSDFS AND LVWATSAN .......................... 27
ANNEX 11. COLLABORATION OF WSDFS AND UMBRELLA ORGANISATIONS FOR O&M ...................... - 28 -
ANNEX 12. WATER BOARDS WITH WOMEN IN KEY POSITIONS AND WSSB FUNCTIONALITY .............. - 29 -
ANNEX 13. PERFORMANCE OF UMBRELLA ORGANISATIONS IN FY 2014/15 ........................................... 33
ANNEX 14. TOWNS OF WHICH THE WATER SUPPLY MANAGEMENT WAS TRANSFERRED TO NWSC OVER THE PAST 3 FINANCIAL YEARS .................................................................................................................... - 34 -
ANNEX 15. INVENTORY OF AVAILABLE SURFACE WATER AND RAINFALL MONITORING DATA ........... - 35 -
ANNEX 16. SUMMARY OF THE MAJOR ISSUES AND RECOMMENDATIONS OF THE REVIEWED EIAS.... - 37 -
ANNEX 17. RESPONSE TO TYPHOID FEVER OUTBREAK IN KAMPALA .................................................. - 39 -
ANNEX 18. DISTRICT SANITATION AND HYGIENE BENCHMARKING, JUNE 2015 .................................. - 41 -
ANNEX 19. INVESTMENTS BY CSOS IN WATER AND SANITATION ....................................................... - 49 -
ANNEX 20. PROGRESS ON THE GOOD GOVERNANCE ACTION PLAN FOR WATER AND SANITATION, JUNE 2015 - 63 -
ANNEX 21. SUMMARY OF ENR CSO GOVERNANCE ACTIVITIES WITH REGARD TO OIL GOVERNANCE . - 68 -
List of Figures
Figure 1.1 Draft of district report in the printed atlas ............................................................................................ 4 Figure 2.1 Trends in Overall Sector Funding Amounts [UGX bn] .......................................................................... 19 Figure 2.2: Visitors at the ATC stall during the National Civil Society Fair held at Hotel Africana, Kampala ........ 31 Figure 2.3: Access to Safe Water by District (June, 2015) .................................................................................... 33 Figure 2.4 Trend in average functionality of rural safe water sources between FY04/05 and FY 2014/15.......... 34 Figure 2.5 Functionality of Safe Water Sources by District, June 2015 ................................................................ 35 Figure 2.6 Equity in Distribution of Safe Water Sources by District, June 2015 ............................................... 37 Figure 5.1: No. of Urban Centres with status and management type of existing schemes ( ............................... 42 Figure 5.2: Percentage of urban population supplied by management type ....................................................... 42 Figure 5.3 Annual trend of NWSC’s unit cost of production for the past Five Years ............................................ 43 Figure 5.4 NWSC regional unit cost of production for the FY 2014/15 ................................................................ 44 Figure 5.5 Trend in per capita investment costs for Small Towns and Rural Growth Centers ............................. 56 Figure 5.6 Numbers of piped water systems in Uganda by management and O&M support arrangements ...... 57 Figure 5.7 Number of towns transferred to NWSC over the past three financial years ....................................... 63 Figure 5.8 Trends in performance of Small Towns’ Water Supply Systems over the last 8 years ........................ 66 Figure 5.9 Monthly moving 12 Month NRW % supplied performance for Kampala and the Regions over the last 5 years (NWSC) ..................................................................................................................................................... 67 Figure 7.1 Fluctuation of Lake Victoria Water Level from 2010 to present.......................................................... 77 Figure 7.2 Fluctuation of Lake Kyoga Water Level from 2010 to present ............................................................ 77 Figure 7.3 Fluctuation of Lake Albert Water Level from 2010 to present ............................................................ 77 Figure 7.4 Daily Discharge for R. Nile at Kamdini from 2010 to present .............................................................. 78 Figure 7.5 Daily Discharge for River Mpanga from 2010 to present .................................................................... 78 Figure 7.6 Groundwater Levels and Rainfall at Soroti Monitoring Station from 2010 to present ....................... 79 Figure 7.7 Groundwater Level and Rainfall at Rakai Monitoring Station from 2010 to present .......................... 79 Figure 7.8 Groundwater Level and Rainfall at Nkozi Monitoring Station from 2010 to present .......................... 80 Figure 7.9 Numbers of water permit applications and issuance over the last five years ..................................... 83 Figure 7.10 Trends of Number of Permit Holders Monitored for Compliance over the last 6 years ................... 83 Figure 7.11 Total annual non-tax revenue [UGX mn] from water use permits collected; FY10/11-14/15 .......... 83 Figure 7.12 Environmental reports reviewed in FY 2014/15 ................................................................................ 87 Figure 7.13 Seedlings being distributed to beneficiaries for catchment management ........................................ 92 Figure 7.14 Bamboo Nursery Cuttings for marking riparian land ofrivers Mubuku and Nyamwamba ................ 93

Uganda Water and Environment Sector Performance Report 2015
xviii
Figure 7.15: Untreated effluent from Waragi Distillation in Buliime being discharged into the wetland ............ 94 Figure 7.16. Impact of waragi distillation in Buliime-Kiha Catchment.................................................................. 94 Figure 7.17 Number of monitoring stations in each WMZ ................................................................................... 97 Figure 7.18 Samples received and compliance with targets (7 working days) ..................................................... 98 Figure 7.19 National Command & Control Centre ................................................................................................ 99 Figure 7.20 Mobile unit and accessories of the oil and gas monitoring system ................................................... 99 Figure 7.21 Installation of fixed monitoring stations in Pakwach water supply-Nebbi District............................ 99 Figure 7.22 NTR generation from laboratory analytical services ....................................................................... 100 Figure 7.23 Compliance for E.coli in rural drinking water supply ...................................................................... 103 Figure 7.24 Trend of Microbiological Quality Compliance of Drinking water in towns ..................................... 104 Figure 7.25 Trends in Compliance to Biological Oxygen Demand and Total Suspended Solids Standards ........ 105 Figure 7.26 Lukhuna irrigation scheme water use by local communities in Manafwa District, Uganda ............ 109 Figure 7.27 New intake for irrigation in Lukhuna (left riverbank is Uganda, right bank is Kenya) ..................... 109 Figure 7.28 Extension of the DWRM hydrological data centre .......................................................................... 111 Figure 7.29 Old leaking drums before implementation of CP (left); new set of tanning drums installed to improve productivity and reduce amount of effluent discharged from the tannery (right) .............................. 112 Figure 8.1 Poster from the National Hand Washing Initiative ............................................................................ 117 Figure 8.2: District Latrine Coverage in Rural Areas (June, 2015) ...................................................................... 119 Figure 9.1 Structure of the National Wetland Information System and linkage to Local Governments ............ 127 Figure 9.2 Extract from the Wetland Atlas showing Nakivubo wetland in Kampala District.............................. 127 Figure 9.3 Monitoring and Inspection Activities for Wetlands in FY 2014/15 .................................................... 129 Figure 9.4 Fine paid to the Environment Fund account [UGX] in FY 2014/15 .................................................... 129 Figure 9.5 Trends in Number of Proposed and Approved Projects .................................................................... 147 Figure 9.6 Newly installed weather station in Namukora-Kitgum ...................................................................... 150 Figure 9.7 Community leaders trained on installation and reading of rainfall data in Nebbi ............................ 150 Figure 9.8 Caging of Solar Panels to prevent Vandalism .................................................................................... 152 Figure 12.1Total investments FY 2014/15 (UGX bn)........................................................................................... 166 Figure 12.2 CSO investments [UGX bn] for period FY 2012/13 to FY 2014/15 ................................................... 167 Figure 12.3 Investment in water supply by technology...................................................................................... 167 Figure 12.4 Investments in water supply technologies from FY 2012/13 to FY 2014/15 ................................... 168 Figure 12.5 Investment in Sanitation .................................................................................................................. 168 Figure 12.6 Investment in Community Management activities ......................................................................... 169 Figure 12.7 New water supply sources developed FY 2014/15 .......................................................................... 169 Figure 13.1 Contribution of the ENRCSOs [US$] for the past 5 years ................................................................. 179 Figure 13.2 Nature of members contributing to the report ............................................................................... 179 Figure 13.3 Expenditure of resources per thematic area ................................................................................... 180 Figure 13.4 Distribution of resources by region ................................................................................................. 180 Figure 15.1 Trends in access to hand washing facilities over the last 6 years .................................................... 201
List of Tables
Table 1.1 Water sources entered into the WSDB in FY 2014/15 ............................................................................ 5 Table 1.2. Changes in key indicator calculations over time .................................................................................... 6 Table 1.3. Number of users per water source type ................................................................................................ 8 Table 2.1. Allocations, releases and actual expenditure [UGX bn] by Vote and budget category, FY 2914/15 ... 21 Table 2.2 Trends in sector percentage share of National MTEF Allocation from 2011/12- 2014/15 ................... 21 Table 2.3 Releases and Expenditure by Vote Function and Funding Source [UGX bn] ........................................ 22 Table 2.4 Off-budget allocations for the FY 2014/15 [UGX bn] ............................................................................ 24 Table 2.5 Targets and achievements using the DWSDCG and PRDP as of June 2015 .......................................... 25 Table 2.6 Performance of development projects managed by MWE .................................................................. 26 Table 2.7 Water facilities Constructed and Rehabilitated by UNICEF in FY 2014/15 ........................................... 29 Table 5.1: Total population figures in urban centres............................................................................................ 41 Table 5.2 NWSC Tariff Structure FY 2014/15 (Without VAT) ................................................................................ 43 Table 5.3 NWSC Provisional financial performance 2014/15, in UGX Billion ....................................................... 46 Table 5.4 Status of water connections as at June 2015 ........................................................................................ 47

Uganda Water and Environment Sector Performance Report 2015
xix
Table 5.5 Status of staff in each region, 30th June 2015 ...................................................................................... 49 Table 5.6 Status of Public Stand Pipes (PSPs) per region for the FY 2012/13-14/15 ............................................ 49 Table 5.7 NWSC’s water supply coverage trends over last five financial years .................................................... 50 Table 5.8 Overall NWSC performance 2013-2015 ................................................................................................ 50 Table 5.9 Percentage compliance with drinking water and wastewater quality standards, FY14/15.................. 51 Table 5.10 Accounts Receivable in UGX (Billion), FY 2012/13-14/15 ................................................................... 51 Table 5.11 Access to improved water supply in urban areas; FY 2010/11-2014/15 ............................................. 54 Table 5.12 Per capita cost ranges of new town water supplies, including explanation ....................................... 56 Table 5.13 Performance of Small Towns’ Water Supply Systems over the last five financial years ..................... 65 Table 6.1 Planned versus achieved outputs of Water for Production Department for FY 2014/15 .................... 68 Table 6.2 Functionality of earth dams and valley tanks as at June 30th, 2015 .................................................... 70 Table 6.3 Functionality status per facility type as at June 30th, 2015 .................................................................. 70 Table 6.4: WfP volume created by MWE in FY 2014/15. ...................................................................................... 71 Table 6.5 Community Management of WfP facilities constructed 2000 - 2015; end of June, 2015 .................... 72 Table 7.1 Planned and achieved activities as per end of June 2015 ..................................................................... 75 Table 7.2 Status of existing water resources monitoring network as per end of June 2015 ................................ 76 Table 7.3 Compliance to permit conditions, FY 2014/15 ..................................................................................... 85 Table 7.4 Numbers of Environmental Reports Reviewed (FY 2008/9- 2014/15) ................................................. 87 Table 7.5 Number of water quality samples tested in water testing laboratories in 2014/15 ............................ 97 Table 8.1 Best Performing Districts in FY 2014/15 ............................................................................................. 121 Table 8.2 summary of sanitation facilities constructed by the different WSDFs................................................ 124 Table 9.1 Platinum Indicators for Wetlands ....................................................................................................... 130 Table 9.2 Platinum Indicators for Wetlands ....................................................................................................... 136 Table 9.3 Challenges and recommendations affecting environmental management by NEMA ........................ 148 Table 10.1 Physical Performance/Achievements (As per JWESSP and 5-year Work Plan) ................................. 153 Table 10.2 The prioritised NAMAs in the four sectors ....................................................................................... 155 Table 11.1 Achievements in capacity building on gender mainstreaming ......................................................... 158 Table 11.2 Gender distribution at MWE for the different staffing levels in FY 2014/15 .................................... 159 Table 11.3 Activities to support women and vulnerable groups ........................................................................ 161 Table 11.4 HIV service providers and support offered to districts ..................................................................... 162 Table 12.1 No. of Rain Water Harvesting Tanks Constructed in FY2014/15 ...................................................... 170 Table 13.1 Capacity Building and Training in Forestry Management in FY 2014/15 .......................................... 183 Table 13.2 Research and studies conducted by CSOs in Forestry Management in FY 2014/15 ......................... 184 Table 13.3 Capacity Building and Training in Environment Management in FY 2014/15 .................................. 186 Table 13.4 Studies by CSOs in the area of good governance, FY 2014/15. ........................................................ 189 Table 13.5 Challenges faced by the ENRCSOs in FY 2014/15 ............................................................................. 189 Table 14.1 Summary of the GGAP performance ................................................................................................ 193
List of Boxes
Box 2.1 Trend in releases [bn UGX] to the District Water and Sanitation Conditional Grant .............................. 23 Box 5.1 Key audit findings of private operators (POs) .......................................................................................... 60 Box 5.2 Improving Financial Performance in Selected Small Towns, selected findings ....................................... 65 Box 7.1 Highlights of proposal for operationalisation of 3% for water source protection ................................... 89 Box 7.2 Catchment management structures ........................................................................................................ 90 Box 7.3 Infestation of Lake Kyoga with a Water weed-Salvinia molesta............................................................ 102 Box 8.1 “Sustainable Sanitation Drive” commitments signed with districts (LCV, CAO) .................................... 116 Box 8.2 Improving sanitation under SNV Project ............................................................................................... 116 Box 8.3 Latrines in use before and after provision of WASH Loans by Post bank .............................................. 120 Box 8.4 Setting up a shared faecal sludge management system in Iganga and Mbale Clusters ........................ 123 Box 9.1 Performance on Platinum Indicators for Wetlands ............................................................................... 130 Box 9.2 Performance on Platinum Indicators for Forestry ................................................................................. 137 Box 9.3 General findings from the multi-sectoral monitoring ........................................................................... 139 Box 12.1 Formation and training of WUCs/WSCs: Examples from CSOs ............................................................ 170 Box 12.2 Water User Committees ...................................................................................................................... 172

Uganda Water and Environment Sector Performance Report 2015
xx
List of Abbreviations
ADB African Development Bank AGEMP Albertine Graben Environment Monitoring Plan AIC AIDS information Centre BFP Budget Framework Paper BOD Biological Oxygen Demands CBO Community Based Organisation CBMS Community Based Maintenance System CCU Climate Change Unit CDM Clean Development Mechanism CDO Community Development Officer CF Consolidated Fund CFR Central Forest Reserves CLTS Community Led Total Sanitation CMO Catchment Management Organisation COP20 20th session of the Conference of the Parties to the UNFCCC CSO Civil Society Organisation Cu.mec Cubic Meters per second CWMP Community Wetland Management Plan DESS Department of Environment Services DHI District Health Inspector DLG District Local Government DP Development Partner DSOER District State of Environment Reports DWAP District Wetland Action Plan DWIR District Wetland Inventory Report DWD Directorate of Water Development DWO District Water Office(r ) DWRM Directorate of Water Resources Management DWSCC District Water and Sanitation Coordination Committee DWSDCG District Water and Sanitation Development Conditional Grant EAC East African Community EC European Commission ECMS Enforcement and Compliance Monitoring Strategy ED Earth Dams EHD Environment Health Division (of Ministry of Health) EIS Environmental Impact Statement ENR Environment and Natural Resources ENRSWG Environment and Natural Resources Sector Working Group EPPU Environment Protection Police Unit ESD(S) Education for Sustainable Development (Strategy) ETP Effluent treatment plant FAL Functional Adult Literacy FAO Food and Agricultural Organisation FG Forest Guard FIEFOC Farm Income and Enhancement and Forestry Conservation FMP Forest Management Plans FO Forest Officers FP Fish Ponds FSSD Forestry Sector Support department

Uganda Water and Environment Sector Performance Report 2015
xxi
FY Financial Year GBS General Budget support GEF Global Environmental Facility GFS Gravity Flow Scheme GIZ Deutsche Gesellschaft für Internationale Zusammenarbeit GGAP Good Governance Action Plan GGWG Good Governance sub-sector Working Group GIS Geographical Information System GoU Government of Uganda GPOBA Global Partnership on output Based Aid ha Hectares HIASS Health Inspectors Annual Sanitation Survey HIC Home Improvement Campaigns HIP Hygiene Improvement Programme HIV/AIDS Human immunodeficiency virus / acquired immunodeficiency syndrome HPM Hand Pump Mechanic HPMA Hand Pump Mechanic Association HWF Hand Washing Facility ICT Information Communication Technology IDAMC Internally Delegated Area Management Contract IDP Internally Displaced Persons IGAD Intergovernmental Authority on Development ISDP Infrastructure Service Delivery Plan ISH Integrated Sanitation and Hygiene INDC Intended Nationally Determined Contributions JAF Joint Assessment Framework JBSF Joint Budget Support Framework JPF Joint Partnership Fund JSR Joint Sector Review JWESSP Joint Water and Environment Sector Support Programme (2013 – 2018) KCC Kampala City Council KfW Kreditanstalt für Wiederaufbau KP Kyoto Protocol KPI Key Performance Indicators KRA Key Result Area LG Local Government LGDP Local Government Development Programme LLG Lower Local Government LVEMP Lake Victoria Environmental Management Project LVWATSAN Lake Victoria Water and Sanitation Initiative M&E Monitoring and evaluation MAAIF Ministry of Agriculture, Animal Industry and Fisheries MIS Management Information System MoEMD Ministry of Energy and Mineral Development MOESTS Ministry of Education, Science, Technology and Sports MoFPED Ministry of Finance, Planning and Economic Development MoGLSD Ministry of Gender Labour and Social Development MoH Ministry of Health MoLG Ministry of Local Government MoLHUD Ministry of Lands Housing and Urban Development MoTTI Ministry of Tourism, Trade and Industry

Uganda Water and Environment Sector Performance Report 2015
xxii
MoU Memorandum of Understanding MTEF Medium Term Expenditure Framework MWE Ministry of Water and Environment MTEF Medium Term Expenditure Framework MRV Measuring, Reporting and Verification NAADS National Agricultural Advisory Services NAPA National Adaptation Programme of Action NAMA Nationally Appropriate Mitigation Actions NBI Nile Basin Initiative NBSAP National Biodiversity Strategy Action Plan NDP National Development Plan NEC National Environment Council NEMA National Environmental Management Authority NFA National Forestry Authority NFTPA National Forestry Tree Planting Act NGOs Non-Government Organisations NPV Net Present Value NRW Non-Revenue Water NSDS National Service Delivery Survey NSOER National State of Environment Report NSWG National Sanitation Working Group NWIS National Wetland Information System NWSC National Water and Sewerage Cooperation NWQRL National Water Quality Reference Laboratory O&M Operation and Maintenance OBA Output Based Aid ODF Open Defecation Free PAF Poverty Action plan PEAP Poverty Eradication Action Plan PECS Public Education and Communication Strategy PES Payment for Ecosystem Services PHAST Participatory Hygiene and Sanitation Transformation PMA Plan for Modernisation of Agriculture PPDA Public Procurement and Disposal of Assets Authority PPEA Participating Poverty Environment Assessment PPD Policy and Planning Department PPP Public Private Partnership PTA Parent Teachers’ Association PRT Performance Review Team PWD Person(s) with disabilities PWP Public water points REDD Reducing Carbon Emissions from Forest destruction and Degradation RGC Rural Growth Centre R-PP Readiness Preparation Proposal RWHT Rain Water Harvesting Tank RWSS Rural Water Supply and Sanitation RWT Rain Water Tank SIM Sector Investment Model SIP Sector Investment Plan SPGS Saw log Production Scheme SPR Sector Performance Report

Uganda Water and Environment Sector Performance Report 2015
xxiii
SSIP Sector Strategic Investment Plan STWSS Small Towns Water and Sanitation SWAp Sector Wide Approach SWC Soil and Water Conservation SWG Sector Working Group SWSSB Sub-county Water Supply and Sanitation Boards TA Technical Assistance ToR Terms of Reference TOT Training of Trainers TSS Total Suspended Solids TSU Technical Support Unit UBOS Uganda Bureau of Statistics UDHS Uganda Demographic and Health Survey UfW Unaccounted for Water UGX Uganda Shillings UIA Uganda Investment Authority ULGA Uganda Local Governments Association UN United Nations UNMA Uganda National Meteorological Authority UNDP United Nations Development Programme UNFCCC United Nations Framework Convention on Climate Change UNICEF United Nations International Children’s Fund UPHC Uganda Population and Housing Census USAID United States Agency for International Development UWASNET Uganda Water and Sanitation NGO Network UWSS Urban Water Supply and Sanitation VCT Voluntary Counselling and Testing VfM Value for Money VHT Village Health Team VIP Ventilated Improved Pit VT Valley Tank WAG Wetland Advisory Group WAP Wetland Action Planning WASH Water, Sanitation and Hygiene WED World Environment Day WfP Water for Production WMD Wetland Management Department WMZ Water Management Zones WPC Water Policy Committee WQ Water Quality WRM Water Resources Management WSDF Water and Sanitation Development Facility WSP Water and Sanitation Programme WSC Water Source Committee WSS Water Supply and Sanitation WSSWG Water and Sanitation Sector Working Group WUC Water User Committee WURD Water Utility Regulation Department
Exchange Rate
USD 1 = UGX 2,845 EUR 1 = UGX 3,381

Uganda Water and Environment Sector Performance Report 2015
xxiv
Glossary and Definitions
Alignment: an arrangement whereby the activities and systems of a Development Partner are harmonised with the Government’s priorities and systems, thereby increasing the Government’s “ownership” of activities and systems and making implementation more effective.
Basket Funding: aid finance flowing from a Development Partners’ account, kept separate from other funding. The Joint Partnership Fund (JPF) is an example in the water sector of basket funding using on-budget project modalities.
Biomass: is the total living woody natural vegetation found above ground. It includes stems, branches and twigs. Biomass refers to their air-dry mass, measured after drying the wood for up to 15 days, until the mass is constant.
Biodiversity: the variability among living organisms from all sources including, inter alia, terrestrial, marine and other aquatic ecosystems and the ecological complexes of which they are part; this includes diversity within species, between species and of ecosystems.
Consolidated Fund: the consolidated fund is the main treasury account where all Government and external funds are received. Funds are then allocated according to approved budgets to the ministries and via fiscal decentralisation mechanisms to the local Governments.
Development Partner (DP): Bilateral, multilateral and international organisations and agencies providing support to Uganda.
(Earmarked) Sector Budget Support: financial support channelled through the Government budget that is notionally earmarked to a specific sector or sub-sector. In the water and sanitation sub-sector earmarked sector budget support includes support via the consolidated fund and Poverty Action Fund (PAF) to the District Water and Sanitation Development Conditional Grant (DWSDCG) and also to the Ministry of Water and Environment (MWE) at central level. There is no difference between earmarked sector budget support and sector budget support for the water, health and education (sub-) sectors as all sector expenditure is under the PAF.
General Budget Support: financial support given directly to the Government budget, with no earmarking of funds but accompanied with dialogue with the Government of Uganda (GoU) around the implementation of the Poverty Eradication Action Plan (PEAP).
Harmonisation: the process of rendering approaches, systems or policies between Development Partners and Government coherent.
Lead Development Partner: In any given sector or area, there are a range of leadership functions that can be taken on by one or more Development Partner (DPs). The role of the lead DP will depend on the agreements reached with Government and other DPs in the sector, but may include the following: acting as the main liaison with Government in policy dialogue and advocacy, facilitating funds and aid management, ensuring that joint reviews, monitoring and reporting take place following agreed formats, providing services to other DPs (information, communication and technical advice) and monitoring DP performance.
Large Towns: are classified as those gazetted for operation by National Water and Sewerage Corporation (NWSC), which provides water and sewerage services. NWSC currently operates in 110 “Areas”. The NWSC coverage area extends beyond the above urban boundaries.
Medium Term Expenditure Framework (MTEF): is a three-year rolling budget framework used to guide public-sector resource allocation, including Aid. At the beginning of the budget process, sectors are provided with medium-term resource ceilings, which, in aggregate are consistent with the achievement of macroeconomic objectives. Sector working groups allocate these ceilings to institutions within the sector over the medium term consistent with the achievement of sector policy

Uganda Water and Environment Sector Performance Report 2015
xxv
objectives. These allocations are articulated in the Budget Framework Paper (BFP), which represents the Government’s medium term budget strategy. The first year of the MTEF forms the basis of the annual budget allocations, which are voted by parliament.
On-budget Aid: is Aid that is included in the MTEF and presented in the GoU budget estimate books. This includes aid that flows through Government systems (such as general, sector and PAF budget support), as well as other programme aid and projects that are reported to GoU and that the Ministry of Finance, Planning and Economic Development considers should be included in the MTEF and the budget presented to Parliament. A second category of on-budget aid includes Technical Assistance (TA) and basket funds that support GoU activities and institutions whose budgets are included in the MTEF and official estimate books. On budget aid falls within the sector ceiling.
Off-budget Aid: is Aid that is not reported in the MTEF and budget estimates GoU either because it is not reported to GoU, or because it is not related to institutions included in the MTEF and GoU official budget estimates. This might include some Aid to local Governments, as well as support to parastatals and NGOs, although many DPs do provide information on such aid to MOFPED. Off-budget aid is not included within sector ceilings.
Poverty Action Fund (PAF): established by GoU in 1998 under the Medium-Term Expenditure Framework, is a ring-fenced fund aimed at protecting resources for key poverty reducing areas including water, health, education and rural infrastructure.
Poverty Action Fund Budget Support: budget support notionally earmarked to expenditures within the Poverty Action Fund areas, but not earmarked to any specific sector. Transfers are made through the Government systems.
Project Support refers to assistance that is not channelled via the Government systems. It can be on-budget (i.e. within the ceiling) or off-budget (i.e. outside the ceiling).
Sector Ceilings: are the upper limits that each sector can spend. They include all on-budget DP finance. DP finance to a particular sector will not necessarily raise the sector ceiling. Sector budget support will, generally speaking, not increase the sector ceiling and is therefore not additional funding. Sector earmarking is thus only notional. The strict imposition of sector ceilings means that earmarking only offsets the Government budget.
Sector Wide Approach (SWAP) is a mechanism whereby GoU, civil society and Development Partners support a single policy, development plan and expenditure programme, which is under Government leadership and follows a common approach. A SWAP de-emphasises donor-specific project approaches and promotes funding for the sector through general, sector earmarked budget support or through basket funding. The rural water and sanitation sub-sector is the most advanced in terms of SWAP implementation.
Small Towns urban centres as defined by UBOS that are not served by National Water and Sewerage Corporation (NWSC), also includes Town Boards and Rural Growth Centres (RGCs) with populations of more than 500 people. Currently, there are 198 Urban Councils and 1,772 RGCs.
Software: is an umbrella term used to cover the activities of awareness creation, community sensitisation mobilisation and post-construction follow-up with respect to water supply and sanitation. These activities are undertaken to change behaviour and attitudes towards hygiene and sanitation and to ensure community management of improved water supply facilities.
Undertaking: strategic action agreed on in the Joint Sector Review to be undertaken by the sector, ideally within a 12-month period (in time for the subsequent JSR).
Urban and Rural: Kampala, other municipalities and town councils are all classified as urban areas. All other areas are classified as rural. District headquarters are all classified as town councils. The formation of new districts has resulted in the creation of new town councils. Kampala is the only city council in Uganda. Other urban centres are classified as either municipalities or town councils.

Uganda Water and Environment Sector Performance Report 2015
xxvi
Water and Environment Sector Working Group (WESWG): comprising stakeholders from GoU institutions within a sector, civil society organisations and Development Partners, the WESWG meet to agree sector budget submissions and new projects proposed for the sector, as well as to review sector performance and to deliberate on key sectoral policies.

Uganda Water and Environment Sector Performance Report 2015
1
1 INTRODUCTION
1.1 About this Report
The Uganda Water and Environment Sector Performance Report (SPR) is the most important document for assessing the performance of the water and environment sector. It provides an annual assessment of investments, targets, achievements, outputs and also highlights the major challenges or strategic issues which effect performance. The report includes data and analysis with respect to the agreed key indicators in the following water sub-sector performance themes: access, functionality and equity of improved water supplies and sanitation, hygiene, per capita investment cost, water quality, water storage, gender and community management. The SPR also includes essential information on Uganda’s environment and natural resources and a description of the efforts being made to ensure sustainability of the ecosystems in the country. Annual SPRs for Water and Sanitation were produced from 2003 to 2008. Since the merger of the water and environment sectors in 2008, this is the 7th Water and Environment Sector Performance Report.
The Sector Performance Report is based on the water and sanitation sub-sector performance measurement framework developed in 2003. The environment and natural resources sub-sector performance measurement framework was developed in August 2010. A sector-wide approach to planning, implementation, reporting and accountability was first adopted in 2001, when a number of individual donor specific projects and reviews were phased out, and the first Joint Government of Uganda – Development Partners Water and Sanitation Sector Support Programme (JWSSPS, 2007 to 2013) was implemented. Currently, the five-year Joint Water and Environment Sector Support Programme (JWESSP) is ongoing, including also Environment as a sub-sector. In addition, the Joint Sector Review (JSR) for the water and environment sector has been held annually since the merger of the water and environment sectors in 2008. The SPR forms the basis for discussions at the Joint Sector Review, during which a number of Undertakings for the subsequent year are formulated and agreed.
The SPR has been prepared through a participatory process with inputs from the Ministry of Water and Environment (MWE), the National Water and Sewerage Corporation (NWSC), the National Environment Management Authority (NEMA), the National Forestry Authority (NFA), the Uganda National Meteorological Authority (UNMA), the Water and Sanitation Programme of the World Bank (WSP/WB), the Environment Health Division (EHD) of the Ministry of Health (MoH) as well as the Uganda Water and Sanitation NGO Network (UWASNET) and ENR-CSO Network. A senior management team from MWE collated, quality assured and synthesised these inputs. The primary data sources are Local and Central Government reports and databases at District Local Governments and MWE, and these are listed in Annex 1.
The urban water and sanitation sub-sector, through MWE’s Regulation Department, reports on the targets and achievements for the performance indicators under the performance contracts signed between MWE and NWSC, and the Water Authorities. Sanitation information and data is largely consolidated and provided by the sanitation sub-sector working group, based on data from the respective district local governments and the Environmental Health Division of the Ministry of Health.
Chapter 2 on Sector Planning, Human Resources Development and Finance includes an analysis of on-budget and off-budget resources, Government (GoU) and Development Partner contributions, and contributions from large cross-sectoral projects and programmes. The on-budget GoU financial data was obtained from the Integrated Financial Management System (IFMS), while the donor funding was obtained from the Joint Partnership Fund (JPF) and directly from the few development projects that are outside the JPF (like the Lake Victoria Environment Management Project and the Water Management Development Project). The off-budget financial information was obtained from the sector agencies (NWSC, NEMA, UNMA and NFA) and from the CSO umbrella organisations (UWASNET and ENR-CSO Network). Chapter 3 of the SPR provides a brief review of the status of the undertakings agreed at the last JSR in 2014.
The structure of the SPR from Chapters 4 to Section 10 considers each component within the sector in the order of the Vote Function numbering under the Sector Budget Framework and Ministerial Policy Statement, namely (Chapter 4) Rural Water Supply, (Chapter 5) Urban Water Supply, (Chapter 6) Water for Production, (Chapter

Uganda Water and Environment Sector Performance Report 2015
2
7) Water Resources Management, (Chapter 8) Sanitation and Hygiene, (Chapter 9) Environment & Natural Resources and (Chapter 10) Climate Change.
Chapters 4 to 10 of the SPR provide an overview of the objectives, strategies, achievements and challenges for each component. Each component examines the status and trends of outcomes from the work undertaken in FY 2014/15. The relevant sector indicators, which form the core of the sector performance measurement framework, are presented within the respective sections. This structure is intended to take the reader through a logical progression from the inputs, activities and outputs to outcomes and analysis. Recommendations are provided for each component.
The remainder of the SPR describes progress on cross-cutting issues (Chapter 11), the contributions from Civil Society Organisation under Chapter 12 (Water and Sanitation) and Chapter 13 (Environment and Natural Resources), and progress of implementation of Good Governance activities in the sector (Chapter 14). Finally, Chapter 15 provides some considerations on selected key issues for further dialogue and/or action during the next twelve months.
1.2 Sector Institutional Framework
The Water and Environment sector consists of two sub-sectors: the Water and Sanitation (WSS) sub-sector and the Environment and Natural Resources (ENR) sub-sector. The WSS sub-sector comprises water resources management, rural water supply and sanitation, urban water supply and sanitation, and water for production. The ENR sub-sector comprises environmental management; management of forests and trees; management of wetlands and aquatic resources; and weather and climate. The institutional sector framework consists of:
x The Ministry of Water and Environment with the Directorates for Water Development (DWD), Water Resources Management (DWRM) and Environmental Affairs (DEA);
x Local Governments (Districts and Town Councils), which are legally in charge of service delivery under the Decentralisation Act;
x A number of de-concentrated support structures related to MWE, at different stages of institutional establishment, including Technical Support Units (TSUs), Water Supply Development Facilities (WSDFs), and Water Management Zones (WMZs);
x Four semi-autonomous agencies: (i) National Water & Sewerage Corporation (NWSC) for urban water supply and sewerage; (ii) National Environment Management Authority (NEMA) for environment management; (iii) National Forestry Authority (NFA) for forestry management in Government’s Central Forest Reserves; and (iv) the Uganda National Meteorological Authority (UNMA) for weather and climate services;
x NGOs/CBOs (coordinated through UWASNET and ENR CSO Network) and Water User Committees/Associations;
x The private sector (water and sanitation infrastructure operators, contractors, consultants and goods suppliers).
Activities undertaken in Sanitation and Water for Production (mainly focusing on agricultural and animal production) require close coordination with other line ministries including the Ministry of Health, Ministry of Education and Sports and the Ministry of Agriculture.
The Water and Environment Sector Working Group (WESWG) provides policy and technical guidance and includes representatives from key sector institutions (GoU), Development Partners and NGOs). A more detailed description of the institutional set up at the national level, de-concentrated level, district level, private sector and community level is provided in Annex 2.

Uganda Water and Environment Sector Performance Report 2015
3
1.3 Data Collection
1.3.1 Introduction
Data used for the determination of the indicators is derived from a number of databases in the three directorates of MWE as well as the semi-autonomous databases. Two projects were started up with regard to improving the functionality of databases within the sector:
1. ”Detailed Assessment of Requirements For Water Resources Information System”, managed by the Directorate of Water Resources Management - The objective this assignment is to design and prepare an implementation plan to develop a sound Water Information System (WIS) covering all water-related data, under-pinned by a Hydrological Information System (HIS) including an upgraded hydrologic network to collect primary data on surface, ground water, meteorology, and water quality at the required intensity and frequency; time-effective transmission; and data processing, analysis and storage.
2. “WATSUP 2”, managed by the Water and Environment Sector Liaison Department – a project that will culminate in a new Water Atlas, and described in more detail in the following sections.
1.3.2 Water Supply Database
The MIS Unit under the Water and Environment Sector Liaison Department (WESLD) of MWE is responsible for the operation and maintenance of the Water Supply Database (WSDB), a database initially set up to store the information as collected during the WATSUP Project. This information was used to compile the Uganda Water Atlas in 2010. The same information has been updated in 2011, 2012, 2013 and 2014 to give more accurate information on the status of safe water sources in Uganda.
The WSDB contains two important sections: the point water source section and the piped water supply section. The WSDB contains geo-referenced information on point and piped water supplies in rural and urban areas. The information of NWSC schemes is updated annually by NWSC and included in the WSDB. The information for other urban areas is obtained through connections reported in MWE’s database for gazetted piped schemes.
The WESLD initiated a project with an aim to upgrade the WSDB as well an improvement of the data set. The project, named WATSUP 2, was planned to be finished before October 2015. The planning turned out to be too ambitious and is now scheduled to be finished before January 2016.
1.3.3 WATSUP 2
Introduction
The WATSUP 2 activities started in November 2014, and are implemented according to a phased approach. The implementation schedule and activities implemented thus far are shown in Annex 3. WATSUP 2 aims at achieving the following outputs:
(i) Improved list with administrative units down to village level
(ii) Each water source is linked to an existing administrative unit
(iii) Up to date information as per Form 2 on piped schemes in each district
(iv) All tap stands in the database are linked to a piped scheme
(v) Better quality data set by eliminating the double records, and correcting / adding the coordinates for sources without coordinates
(vi) A list of sources recommended for decommissioning that are non-functional as a results of being dry or having a poor water quality
(vii) A web-based database and atlas with mapping and graphic tools

Uganda Water and Environment Sector Performance Report 2015
4
The data collection exercise is still ongoing and is planned to be completed before December 2015. In the meantime, the old database was re-designed and a data entry tool was developed to allow data entry and analysis for inclusion in this sector performance report (SPR).
Status of WATSUP 2
The pilots proved that with this methodology more new sources are collected than with the annual updates provided by the districts. Furthermore, “new” piped schemes’ information was collected in the districts. By the end of August 2015, data collectors (mainly sub-county extension workers) from 35 districts had been trained. The deadline for data collection was postponed so that the remaining 76 districts are trained until mid-October 2015.
A design for the new Water Atlas 2016 has been made as can be seen in Figure 1.1.
Figure 1.1 Draft of district report in the printed atlas
Challenges WATSUP 2
The major challenges of the project are delays in its implementation, caused by:
(i) Delay in collection of data by the district local government staff. The data collection was based on the availability of approximately 50 GPS. Any delay in one district result, has an impact on the data collection in subsequent districts.
(ii) Some DWOs do not check the data submitted by the sub-county staff, resulting in further delays when the DWD collection / verification teams come to collect the information.
(iii) It was anticipated that the WATSUP2 would be providing all information in time for the SPR. Because of the mentioned delays, there was concurrent data collection for both WATSUP 2 and the sector performance report 2015, with two different methods of data collection, causing an additional delay.
(iv) The administrative units remain a big challenge. UBOS lists of administrative units are not identical to the District lists. UBOS also does not have shape files of boundaries of administrative units below district level.

Uganda Water and Environment Sector Performance Report 2015
5
For the districts already covered by WATSUP2, these problems do no longer exist. Many new sources could not be entered because the administrative units are not in the database. A temporary solution was found: all listed parishes, even not-existing ones, were made available for data entrants to enter data. Parishes in “not-existing” sub-counties were moved to their new sub-county to the best of knowledge. In unclear cases, the consultant linked up with UBOS to assure that administrative units still correspond to the newest, yet unpublished, UBOS data.
(v) For a number of towns that are now under NWSC management, no staff was available for the collection of information in the relevant town councils.
Piped Water Supplies
The database section with piped water supplies contains summary information on all piped schemes in the country. The piped water supply database has been reviewed and it now contains 863 piped supplying rural and/or urban areas schemes compared to 607 schemes in FY 2013/2014. The scheme database has been linked with the small town operational database and a temporary numbering system was put in place. During the WATSUP 2 project, missing information on the schemes is being will be collected through Form 2.
Data submission and analysis
96% of the districts submitted Form 1s in time for timely entry in the WSDB to calculate the values for golden indicators on rural water access and equity for the SPR2015. It should be noted that 26 districts have submitted less Form 1s than the number of sources reportedly constructed with government funds according to the district annual reports.
A total of 5,713 sources have been newly entered in the database this financial year. They are approximately distributed over year of construction as per Table 1.1. MWE will make sure that year of construction will be marked with the actual month of construction as well, so sources can be related to financial years.
Table 1.1 Water sources entered into the WSDB in FY 2014/15
New Old unknown Total
Boreholes 957 534 494 1985
Protected Springs 471 405 239 1115
Public Stand Post 274 147 70 491
Rainwater Harvesting Tank 346 162 221 729
Shallow Well 545 344 145 1034
Yard Tap for Public Use 58 97 155 310
Kiosks 7 8 13 28
Dams 1 1 2
Valley Tanks 12 2 5 19
2671 1700 1342 5713
47% 30% 23%
Due to late submission of information, 930 forms from 19 Districts could not be entered in time for this sector performance review. These are sources from 20 districts that were part of the WATSUP 2 project. If entered, these sources would have added approximately 0.6% to the coverage (not taking into account coverage capping). It should be noted that upon completion of WATSUP2, the national access figure may have increased.

Uganda Water and Environment Sector Performance Report 2015
6
Indicator calculations
Over the last years, names and sizes of districts, sub-counties and sources of population figures have changed, which makes the comparison between key indicators of different years difficult. Additionally, any calculation only reflects the status of the database by that time. With new WATSUP 2 data, sources constructed in previous years have been added that would have changed past values of key indicators. The new WSDB will have the option to calculate the indicators for a particular year retrospectively, with all data collected up to the date of report.
Furthermore, changes in the calculation of the key indicators have been made. Table 1.2 shows the changes for the last years. This list is not exhaustive.
Table 1.2. Changes in key indicator calculations over time Key indicator 2009/10
Atlas 2010/11 2011/12 2012/13 2013/14 2014/15
Access Officially decommissioned (confirmed by TSU staff) sources were excluded,, sources decommissioned by Districts only were included
All decommissioned sources are not considered (this attribute has not existed before)
Functionality Equity All point water sources apart from dams and VT are considered Management Ratio from all communally managed
sources - PS, DBH and SW only - Ratio from communally managed sources with a WSC only
WSC that only clean the environment/sanitation around the source are also considered a functional WSC
Gender Ratio from communally managed sources with any WSC
- PS, DBH and SW only - Ratio from communally managed sources with a functional WSC only
The calculation method of the indicator values is influenced by a number of assumptions that have been agreed upon at the start of the WATSUP 1 project, and events that occurred during the year. District annual reports may differ from the WSDB reports; when discussing this year’s performance indicators, one needs to take into consideration the following facts:
In general, changes in indicators are not only due to sources constructed during the period under review. A large number of sources constructed in earlier years but not yet entered in the database earlier have been entered this year and therefore influenced the following indicator values:
1. Coverage:
a. The WSDB calculates coverage for both rural and urban areas. The coverage can never be higher than 95% in a particular sub-county (because of ‘capping’). This means that even if the individual sources multiplied by the number of people they can serve is more than 95% of the population in a sub-county, they are believed to only serve 95% of the population. The increase of the number of sub-counties (86 extra sub-counties in FY 2014/15) may also have an impact on the number of people served and possibly on the coverage if the sub county already had a capped 95% coverage.
b. Sources that broke down in and before 2009 and were not rehabilitated, are now not contributing to coverage anymore; they are non-functional for more than 5 years and excluded in the estimation of coverage.
c. Decommissioned sources, even if not yet officially decommissioned have not been taken into consideration in the SPR2015 calculations.

Uganda Water and Environment Sector Performance Report 2015
7
2. Equity:
The changes in total population, changes in percentage urban and rural population as well as the increase in numbers of sub-counties have an impact on the equity value.
The WSDB currently has 1,381 sub-counties, as compared to 1,295 in FY213/14. The new urban sub-counties (Trading Centres) were cut out of an existing sub-county. The urban areas were usually better covered than the remaining part of the sub-county. This will consequently have a negative impact on the equity value of the district.
3. Functionality:
District reports do not always include overall water source functionality, but generally report on functionality by source type. The WSDB excludes non-functional water sources that have been non-functional for more than 5 years.
4. Gender and Management:
The WSDB calculates these indicators based on the information collected during WATSUP 1 and subsequent updates through Form 4. But the Form 4s are not submitted for all the sub-counties. The district annual reports often present the indicator based on visits to a selective number of sources.
5. Population figures:
The population figures used in this year’s calculation are based on the national 2014 census by UBOS. In some districts, these figures deviate quite significantly from the earlier projected data using the 2002 census data, in some cases the population is much higher, and sometimes much lower.
It should be noted that districts often use their own population figures. The WSDB generates population figures as per UBOS standard taking into account the growth rates and population figures per parish and aggregating these to district level. It should be noted that this year’s golden indicators are based on the Census data of (August) 2014, and have not been adjusted to be representative for June 2015, as UBOS has not yet released official growth rates.
6. Number of sources:
The WSDB reports generally show a lower number of sources than the district reports (which are usually based on the situation analysis reports that were used before WATSUP 2010). DWOs did not return a new Form 4 to MWE for every new water source. The actual coverage in the districts is expected to be higher than indicated by the WSDB (this is confirmed by activities done by NGOs like M4W, which carry out baseline surveys that indicate quite a number of sources not captured in the WSDB, and now also by the results of the WATSUP 2 project).
The paragraphs below indicate the method used this year for indicator calculation by explaining some definitions and calculations. It will also address the methods used in other years and recommendations that may be considered in future. The formulas used for the calculations are given in Annex 4 .
Rural vs. urban population
The differentiation between urban and rural is made according to administrative levels. All city councils and municipal councils are urban as well as the sub-counties named as Town Council. Rural Growth Centers are considered rural when they are located in a rural sub-county.
In earlier years, some sub-counties were considered partly urban / partly rural when there was a town council located in the sub-county. The ratio was assumed to be 50/50 if no town council population figures were available from UBOS. Otherwise ratios as reported by UBOS were used.
The biggest challenge in the urban coverage calculation is the fact that NWSC reports on the number of connections they have outside the urban administrative units, yet this is considered a rural area. Therefore, the urban coverage as calculated by NWSC includes people that have also been counted for rural coverage.

Uganda Water and Environment Sector Performance Report 2015
8
Downtime and Functionality
Sources with a downtime of more than 5 years are not considered in any of the calculations. The downtime is calculated on-the-fly based on the actual date and the date of breakdown.
Improved Water Supply Sources
Improved water supply sources include boreholes, protected springs, shallow wells, and rainwater harvesting tanks. Improved piped water supply outlets include public stand posts, yard taps, kiosks, house (domestic) connections and institutional connections. Water for production facilities (dams and valley tanks) are consequently not regarded as improved water supplies for domestic use.
Population figures
Population figures have this reporting period been taken from the provisional results of the UBOS 2014 Census at sub-county level, and are no longer based on projected population figures from the previous Census. The shift in population figures has an impact on the indicator values, in some districts these changes are significant
Access
Access is calculated for improved water sources. The calculation is based on an assumed standard number of people served for each type of water source, as listed in Table 1.3. This number is then multiplied by the total number of that source type existing in a particular area to get the total number of people served in that area. The access rate is the ratio of the total number of served people from the total population.
Table 1.3. Number of users per water source type Water source type Number of users Protected Spring 200 Shallow Well 300 Deep Borehole 300 Kiosk 150 Rainwater Harvesting Tank <10,000 l 3 Rainwater Harvesting Tank >10,000 l 6 House connection 6 Institutional connection 100
In the access calculation, “Functional”, “Functional (not-in-use)” and “Non-Functional” sources are considered. Decommissioned sources are not considered. Sources with a downtime of over 5 years are also not counted. It should be noted that not all the decommissioned sources have officially been decommissioned by DWD. In the WATSUP2 project the downtime > 5years will be taken out and 2 categories will remain: “recommended for decommissioning” and “decommissioned”.
Because yard taps are collected as point water sources/public use in Form 1, and as piped schemes/private use in Form 2, a correction factor is included. In a first step all Form 1-Yard taps are considered. In a second step only those Form 2-Yard taps are added that have not yet been included before.
A capping is implemented at sub-county level, resulting in 95 % access in cases where the calculated access is >95 %.1 The population served for the entire district is calculated based on the capped population served per sub-county.
1 “capping” of the figures is done to ensure that improved water sources in a particular sub-county do not serve more than 95% the population hence unrealistically high coverage figures at district and sub county level are avoided.

Uganda Water and Environment Sector Performance Report 2015
9
Challenges and recommendations
The calculation for the golden indicators for coverage, functionality, management and gender have undergone some slight changes over the years. It is recommended that the revised database will contain different reports for different ways of calculating the indicators allowing trend analysis for various ways of calculating the indicators.
The following changes also have an impact on the indicators:
x new population figures as per census 2014
x new administrative units (the creation of more sub-counties also have impacts on the equity indicator)
x administrative units changing from “rural” areas to “urban” areas (some sub-counties that used to be rural are now “urban” Town Councils)
A review of the indicator calculations and definitions of parameters playing a role in the calculations should be considered.
The quarterly and annual district reports are not submitted in a timely manner and do not include all WSDB forms (Form1, Form2, Form 4, and data corrections). It is recommended that district reporting to the WSDB is done quarterly in the first month of the next quarter, and actively overseen by the TSUs. In addition, individual district performance in reporting should be monitored.
Monitoring the access to the WSDB, it shows that only very few staff in the districts actually make use of the WSDB despite the efforts in training them. The WSDB has a wealth of information but this information is underutilised; more analyses can be done with the data available and even more when MWE information systems are linked.
The same challenges as mentioned in last years’ SPR. The major challenge is the lack of proper procedures and guidelines, as well as lack of a strategy for data collection, processing, analysis and dissemination. Only when these are realised the challenges regarding duplication in data collection / analysis, and delays in data collection can be overcome. It is therefore recommended that the sector come up with procedures and guidelines, as well as and a general strategy for data collection, processing, analysis and dissemination.
A national system for numbering piped schemes should be developed.
During WATSUP 2 it became clear that some of the sources were down for more than 5 years. It became also clear that some sources down for less than five years will never work again. Upon completion of WATSUP 2, it will be known which sources are recommended for decommissioning and which sources could still be repaired. At that time, the procedure may be revised from exclusion of all sources down for more than 5 years to marking sources not fit for repair as “recommended for decommissioning”.

Uganda Water and Environment Sector Performance Report 2015
10
2 PROGRESS ON JOINT SECTOR REVIEW UNDERTAKINGS 2014 Fifteen Undertakings were adopted at the 2014 Joint Sector Review. To implement these undertakings, thematic groups and subgroups were formed and charged with the responsibility for their implementation. The various thematic groups prepared detailed action plans (with indicators/outputs to monitor the progress of implementation), which were subsequently approved by the Water and Environment Sector Working Group (WESWG). This section presents the progress made on implementation of these undertakings.
2.1 Environment and Natural Resources
2.1.1 Undertaking No. 1: Implement the ENR Sector Performance Monitoring Framework
“Using the established baseline information, start implementation of the ENR Performance Measurement and monitoring framework to provide regular information as required, with effect from FY 2014/2015”.
The following has been achieved:
x The polished indicators were further reviewed by the MDAs and Local Governments; x a data collection tool was developed from the polished indicators, and piloted for usability; x Focal points were identified from selected MDAs and LGs for key polished indicators for baseline data
collection; x Baseline data collection is ongoing in selected 20 districts and MDAs (using the available resources); x National baseline data validation workshop took place from 5 to 7 May, 2015. x Review of the validated baseline data and further information gathering/analysis by the thematic focal
points plus establishment of a working (draft) database took place in July 2015 Constraints to implementation included:
x Limited Budget support to the ENR sub-sector; At least UGX 600million is required to customize the data collection in the entire country
x Limited data to operationalise the performance measurement and monitoring framework x Proliferation of new districts x Too ambitious undertaking - cannot be achieved in one FY
Next actions:
x Translate the undertaking into a bankable project proposal to solicit funding; x Strengthen partnerships with UBOS to include ENR issues into their survey
2.1.2 Undertaking No. 2: Demarcation and Management of Wetlands and Forests
»Complete demarcation of 6 new wetlands and commence the opening up of boundaries of 3 local forests reserves/finalise and implement the management framework of these ecosystems by the end of FY 2014/15.”
The following has been achieved:
x Rapid assessment of 6 wetlands Enyau (Arua), Nyangahya (Masindi), Bunambutye (Bulambuli), Walugogo (Iganga), Lwajjali (Mukono), Lumbuye (Iganga) undertaken to determine the ecological and socio-economic status.
x Rapid assessment of 6 LFRs in 4 districts undertaken to determine the ecological and socio-economic status of Jinja (Busegula, Mateme and Kamigo), Wakiso (Gunda), Bududa (Bukigai) and Luwero (Bombo).
This undertaking was not achieved.

Uganda Water and Environment Sector Performance Report 2015
11
x Demarcation action plan and TOR for the procurement of service providers prepared for Wetlands demarcation and management planning; LFRs – not reached this level.
x Services providers procured to supply branded pillars and beacons for wetlands demarcation; and management planning.
Constraints to implementation included:
x Bidders quoted higher than the budgeted estimate for wetland demarcation x Limited budget support to demarcation process
Next actions:
x Preparation of Demarcation action plan and TOR for the procurement of service providers for the Local Forestry Reserves’ (LFRs) demarcation and management planning
x Actual demarcation of the 6 wetlands with planting of branded pillars and beacons x Preparation of demarcation reports such as maps x Preparation of Wetland Management plans for the 6 wetlands
2.1.3 Undertaking No.3: Oil Contingency Plan
“Operationalise the Oil Spill Contingency Plan for the Albertine Rift Graben by the end of FY 2014/15”.
The following has been achieved:
x Hazard identification and vulnerability analysis undertaken through a consultancy with stakeholders’ participation; (Hazard identification and vulnerability analysis Report prepared).
x Environmental Risk Assessment (ERA) to oil spills has been completed and reviewed by the key stakeholders; (Environmental Risk Assessment Report prepared).
x Oil spills analysis done and reviewed by the key stakeholders. (Oil spills analysis Report Prepared). x Following the completion of the two key studies, the second and final phase of the Sustainable
Management of Oil and Gas Project (SMOGP) started in June 2015. The National Oil and Spills Contingency Plan (NOSCP) is one of the key activities under this phase. The NOSCP is being jointly developed in partnership the department of disaster preparedness in the OPM with NEMA as the lead core coordinating institution.
x A multi-stakeholder steering committee comprised of relevant agencies of government has been established.
Constraints to implementation included: x Preparation of the National Oil Spills Contingency Plan (NOSCP) was affected by the freeze of funding:
(undertaking is supported by the Royal Norwegian Government through the Strengthening the Management of Oil and Gas Project (SMOGP) under the Environmental Pillar.)
x Lack data at national level Next action:
x Development of the National Oil Spills Contingency Plan; and x Operationalization of the National Oil Spill Contingency Plan.
This undertaking, carried over from last financial year, was not achieved.
This undertaking, carried over from last financial year, was not achieved.

Uganda Water and Environment Sector Performance Report 2015
12
2.1.4 Undertaking No. 4: Local Government Capacity Building
»Develop a pragmatic mechanism for enhancing and improving Local Governments’ technical and financial capacities in the ENR by the end of FY 2014/15.”
The following has been achieved:
x Baselines report on LG capacity gaps based on: staffing needs, equipment and support for restoration completed
x Established specialized funding and programme facilities x Supported institutions and creation of regional offices x Initiated the Forestry Conditional Grants for Local Government from 2015/16FY x Integrated the undertaking into NDP II as support for the decentralized environment management
functions x Integrated the undertaking in the NEMA’s budget for FY 2015/2016 including both the GOU and the
National Environment Fund budgets
Constraints to implementation included:
x Proliferation of new districts
Next Steps:
x Develop a capacity building strategy based on skills, equipment, and staffing levels, x Develop a resource mobilisation strategy reflecting on innovative funding mechanisms. x Develop a pragmatic mechanism for enhancing and improving technical and financial capacities based
on the capacity building and resource mobilisation strategies.
2.1.5 Undertaking No. 5: Vote for UNMA
»Create a stand-alone Vote for the Uganda National Meteorology Authority by the end of FY2014/15.”
The following has been achieved:
x An application for the Vote to MFPED was made by the MWE x MFPED responded highlighting the requirements before a Vote is cleared i.e. (approved staffing structure,
recruitment of key personnel, internal financial management procedures/controls): x Recruitment for the Executive Director and key administrative and technical/professional positions
finalized. x Interim UNMA internal Financial Management controls put in place. x In the Interim, the Permanent Secretary/Accounting Officer for MWE has requested MFPED for a
Subvention Code for UNMA under the ongoing budget for 2015/16FY and this was granted (Code 1371). x MFPED Team verified the capacity of UNMA to control a separate Vote.
This undertaking, carried over from last financial year, was not achieved.
This undertaking has been achieved.

Uganda Water and Environment Sector Performance Report 2015
13
2.2 Water Resources Management
2.2.1 Undertaking No. 6: Map and Plan Hotspot Catchments
“Identify and map additional hotspot catchments in all 4 WMZs and kick start implementation in at least two catchments per WMZ in line with the Catchment Planning Guidelines by the end of FY 2014/15”.
The following has been achieved:
x Criteria was developed and was largely based on the criteria developed in 2010 as part of operationalising Catchment based Water Resources Management. This was supplemented with input from the Thematic Working Group.
x Workshops were held in each Water Management Zone where different potential hot spots were discussed and ranked according to criteria.
x Validation in the field of issues underlying the hot spot was done. The identified hotspot catchments are Ruhenzamyenda and Kiha Catchments in Albert Water Management Zone, Katonga and Kagera catchments in Victoria WMZ, Albert Nile and Aswa catchments in Upper Nile WMZ, and Mpologoma and Victoria Nile catchments in Kyoga WMZ. Catchment planning is ongoing in all the 8 catchments.
x Stakeholder awareness workshop and training sessions have been held with key stakeholders in 8 catchments.
x Information brochures and other materials have been produced and disseminated as part of awareness creation in the WMZs. Establishment of state of knowledge base in each WMZ to gather information for later dissemination is ongoing. Information packaging and dissemination will continue.
x Enforcement mechanisms for implementation of Catchment Planning Guidelines and Water Source Protection Guidelines were identified and are being provided for in the regulations for catchment based WRM that are under development.
x Step by step procedures for implementing the two guidelines are being followed in the hotspot catchments.
x Current implementation and coordination arrangements and mechanisms for catchment based IWRM have been reviewed as part of operationalizing of 3% contribution for water source protection and suggestions for improvements made based on stakeholders input and current experiences.
x Process for identification of possible funding options and mechanisms for catchment based IWRM initiated as part of developing a strategy for operationalization of 3% contribution for water source protection and also during discussions of the Finance Working Group.
Constraints to implementation included:
x Delays in getting stakeholders inputs for finalization of criteria and ranking of hotspot catchments effected progress on the undertaking.
2.2.2 Undertaking No.7: Murchison Bay Pollution Management
“Finalize the Pollution Management Strategy to improve the long term water quality of Inner Murchison Bay and initiate the implementation of its interventions by the end of FY 2014/15”.
The following has been achieved:
x Inception report x Stakeholder Workshop 1 to discuss inception Report x Draft situational Analysis/Diagnostic Report
This undertaking was substantially achieved.

Uganda Water and Environment Sector Performance Report 2015
14
x Thematic meeting x Stakeholder Consultative Workshop 2 on situation report and outline of the Pollution Management
Strategy x Present progress report during JTR 2015 x Formulation of a draft comprehensive pollution management strategy, Action plan and
Investment/Bankable Project
Constraints to implementation included:
x Delayed payment of consultant’s fees
Next Steps:
x Stakeholder consultative workshop on draft pollution management strategy, action plan and bankable project
x Submission of final pollution management strategy x Promotion and disseminate the pollution management strategy
2.3 Water Supply and Sanitation
2.3.1 Undertaking No. 8: Implement the Revised Conditional Grant Allocation
“Implement the revised conditional grant allocation formula for rural water and sanitation in order to improve equity within and between districts by FY2014/15”.
The following have been achieved:
x The Conditional Grant Allocation Formula was revised in a Consultancy assignment. x The revised formula was presented and discussed in the Good Governance Working Group, specifically
discussing the modalities and the challenges to its implementation during 2015/16FY. x The allocation formula was presented, discussed and was approved by the MWE Top Policy Committee. x It was agreed that the revised allocation formula shall be implemented starting with the Financial Year
2016/17. It should however by noted that there is an on-going parallel process of reforming all the Central Government Conditional Grant transfers to District Local Governments by the Ministry of Finance, Planning and Economic Development, which may override the provisions and/or application of the revised water and sanitation grant (and other sector grants) allocation formulae.
Constraints to progress:
(i) When presented in regional workshops, there was a continuous challenge of dealing with complaints from District Local Governments of which grant funds were drastically reduced under the revised formula. There was therefore need for a renegotiation with the Local Governments in the budgeting cycle starting with the Financial Year 2016/17 through involvement of the Local Government Finance Commission and the Advocacy Team.
(ii) As MWE was preparing for the ways of overcoming the above constraints, the Ministry of Finance, Planning and Economic Development (MoFPED) carried out a process of reforming the allocation formulae for all Central Government grants to the District Local Governments. According to MoFPED, the objectives of the parallel reforms include:
x Allowing new national policies to be funded through a transfer system that avoids future fragmentation of the central government grant transfers;
x Increasing discretion to Local Governments to deliver services in line with the local needs whilst ensuring that national policies are implemented;
This undertaking was substantially achieved.

Uganda Water and Environment Sector Performance Report 2015
15
x Shifting the focus away from fragmented input based conditions towards accountability for allocation decisions, expenditures and results;
The mentioned reforms by MoFPED have generated new parameters for determination and allocation of the District Local Government Grants, different from the sector allocation formulae.
(iii) The implementation has been affected by increases in the number of local governments.
(iv) The new allocation formula could not be implemented in FY 2015/16, as it is not yet approved by the Local Governments through the negotiations held annually.
2.3.2 Undertaking No. 9: Reactivate WfP Sub-Sector Working Group
»Re-activate and ensure functionality of the WfP Sub-sector Working Group (WfP WG) to guide planning, implementation and monitoring of water for production interventions by the end of FY2014/15.”
The following have been achieved:
x Prepare draft TOR for WfP Sub-sector Working Group x Set up Secretariat in MWE x Request the heads of institutions to nominate members to the WfP WG x 1st WfP WG meeting (approval TOR for WGG, review preliminary National Irrigation Policy report and
review WfP WG work plans (MWE and MAAIF) for FY 2014/15 x 2nd WfP WG meeting (review Q2 reports MWE/MAAIF) for FY 2014/15 x 3rd WfP WG meeting (review Q3 reports MWE/MAAIF)
Constraints to Progress
Failure of MAAIF to nominate members and their lack of participation in the WfP Sub-group meetings. This led to failure of the group to hold meetings before target completion dates on all planned actions as meetings were delayed/postponed to ensure their presence and participation.
2.3.3 Undertaking No. 10: National Irrigation Policy
“Finalize the national irrigation policy to guide planning, implementation and monitoring of water for production interventions by the end of FY2014/15.”
The following has been achieved:
x TOR was prepared by MAAIF without consulting MWE x MAAIF engaged a Consultant x Consultant submitted the draft National Irrigation Policy (NIP) to MAAIF in December 2014 x Consultant presented the draft NIP to the National Stakeholders on 22nd January 2015 x Consultant presented the draft NIP to MWE on 4th February 2015 x MWE submitted written comments to the Consultant for consideration in the final draft NIP x The Consultant submitted the final draft NIP to MAAIF in March 2015 without incorporating comments
from MWE x Draft NIP was submitted by MAAIF to Cabinet Secretariat in March 2015 x MWE recalled the draft National Irrigation Policy (NIP) in May 2015 x Draft NIP was revised by MWE on 6th August 2015
This undertaking, which was carried over from the previous year, was not achieved.
This undertaking has been achieved.

Uganda Water and Environment Sector Performance Report 2015
16
x Revised Draft NIP given to Director Crop (MAAIF for his inputs on 19th August 2015) x Revised Draft NIP submitted to the WfP-SSWG for validation x MAAIF and MWE planning to make a joint submission of the Draft National Irrigation Policy to cabinet by
end of 2015
Constraints to Progress: x Reluctance by MAAIF to consult and involve MWE in the review and finalization of the draft National
Irrigation Policy, yet the mandate for irrigation is shared between the two sectors.
2.3.4 Undertaking No. 11: School Sanitation
»Develop a framework for a holistic approach to school sanitation by the end of FY 2014/15.”
The following has been achieved:
x Consolidation of baseline information / mapping WASH in schools: areas of focus were identified, and indicators listed;
x Develop a school WASH database, preferably web based MIS: data was collected from 3 Districts (Kamwenge, Kotido and Apac).
x Develop (or Review) a WASH package (inclusive of MHM) for schools: Developed through a national dialogue.
x Develop a system of integrating emptying school latrines in sludge management: Pilot of clustering model has commenced in May 2015 in 2 clusters of Mbale and Iganga.
x Research and development of a Gulper II by Water for People is ongoing (goes up to 3m deep, can pump both thick and thin sludge as well as remove rubbish (solid waste) from the pits). Kampala gulper Association members have emptied over 30 schools in Kampala that cannot be accessed by the cesspool truck due to limited space and terrain. Other Districts where gulper entrepreneurs are emptying toilets are Kitgum and Kamwenge (Hand pump mechanics association bought a gulper).
x Define/clarify roles of Ministries and Agencies in School WASH: National Dialogue on School WASH was held.
2.3.5 Undertaking No. 12: Financing Framework
»Develop a Financing Framework to facilitate the entry of Additional/Alternative Funding Sources into the Water and Environment Sector to Bridge the Gap between Budget Provision and Sector Plans.”
The following has been achieved:
x Study on the contribution of Water Resources Development and Environmental Management to Uganda’s Economy has started, and will be completed in 2016,
x A draft advocacy strategy has been prepared to increase the share of the Water and Environment Sector in the National Budget,
x The Urban Water and Sewerage Services (UWSS) Department in liaison with the Water Utility Regulation Department are preparing a comprehensive 10-point action plan to improve the financial sustainability of small towns’ water utilities.
This undertaking was substantially achieved.
This undertaking was not achieved.

Uganda Water and Environment Sector Performance Report 2015
17
x The UWSS Department started exploring future financing options for the urban water and sanitation sub-sector in Uganda. To this end the UWSD formed an Urban Project Preparation Team that identified 11 "financing packages".
x The NWSC Water Facility has been created. The facility will be capitalized through a surcharge on the tariff, initially at set at 5%. Market Finance will be used to finance commercially viable investments with positive cash flow. The facility will be used for: mains extension (25%); asset renewal (25%); water supply stabilization (20%) and a retained fund base (30%) to leverage market and other sources of finance.
Constraints to progress:
The undertaking was too ambitious - cannot be achieved in one FY
Next Steps
x Finalization of the study on the contribution of water and environment sector to the national economy x Training of MWE staff in operation of the sector investment models x Review/compilation of the water and environment sector strategy and investment plan
2.3.6 Undertaking No. 13: Monitoring Good Governance
»Develop appropriate indicator(s) for monitoring of good governance in the water and sanitation sub-sector by the end of FY2014/15”.
The following has been achieved: x Water Integrity Network (WIN) initiated the development of the first Terms of Reference for assessing
Governance and Monitoring integrity in the Water Sector. x However, there was need to restructure these drafted TOR to reflect the concerns of the November 2014
Good Governance meeting. The governance meeting agreed that would be no need to come up with a new good governance indicator, as the existing performance monitoring framework had a strong correlation with good governance.
x The second set of Terms of Reference was redrafted to determine the reflection of good governance in the golden performance indicators that the sector uses to measure and monitor performance. The study will aim at examining the extent at which the results reported in the sector performance report appraise good governance procedures, processes and practices in the water and sanitation sub-sector and propose a review of the key sector performance indicators (both for water, sanitation and environment) to reflect sector performance in reference to good governance, and also to take into account the sector relevant aspects of the recently adopted global sustainable development goals.
x procurement of the consultant still on-going
Constraints to Progress.
x This undertaking requires more concentration and analysis. It could not be achieved in one FY
Next steps:
x Engage a consultant to review the sector indicators to include governance aspects and sustainable development goals
x Hold a workshop to engage other stakeholders to provide input into the above review.
This undertaking was not achieved.
This undertaking was not achieved.

Uganda Water and Environment Sector Performance Report 2015
18
2.3.7 Undertaking No. 14: Urban Conditional Grant
»Carry out a study to determine the effectiveness and efficiency of the Urban Conditional Grant (taking into account allocation criteria, channelling, utilization, adequacy, audit & reporting) by end FY2014/15”.
The following has been achieved: x Terms of reference were developed. The study will aim to determine the effectiveness and efficiency of
the urban water conditional grant taking into account the allocation criteria; the channelling process; utilization of the grant, its adequacy, auditing compliance and reporting. The outcome will inform the future guidelines and disbursement channels for the conditional grant.
x Funds were identified through the Joint Partnership Funding x The procurement was done, completed and contract signed between the client and the best bidder x The inception meeting was held and inception report was submitted by the consultant and discussed. x The criteria for selecting the 10 sample towns was discussed and agreed upon. x The consultant has embarked on the assignment and the inception report was presented on 23rd
September 2015.
Constraints to Progress:
Delay to finalize procurement of the consultant for the study
Next steps: x Discussion and comments on the draft study report x Hold a workshop to disseminate the findings of the study x Hold meetings with respective offices to implement the recommendations from the study.
2.3.8 Undertaking No. 15: Appraisal of Capacity Development Plans
“Appraisal of comprehensive inventory of capacity development plans in the Water and Environment Sector”.
(as revised in the first thematic working group meeting held on 18 December 2015)
The following has been achieved:
x Developed ToR for procurement of external consultant to carry out the undertaking, in consultation with members of the steering committee.
x Procurement of consultant delayed. However the consultant has now been procured. x Entry meeting held with the consultant on Tuesday 11th August 2015 to discuss the ToR. The consultant
is now in the process of preparing the inception report. Draft Inception Report submitted and presented to the CD thematic working group on 10th September 2015.
Constraints to progress:
Delays in the procurement of a consultant
Next step:
Submission of final report by the Consultant
This undertaking was substantially achieved.
This undertaking was substantially achieved.

Uganda Water and Environment Sector Performance Report 2015
19
3 SECTOR PLANNING, HUMAN RESOURCES DEVELOPMENT AND FINANCE
3.1 Planning and Budgeting
This section highlights the sector budget, allocations and resource utilisation for the financial year 2014/15. The sector planning and budgeting cycle is guided by the general government budget cycle, which indicates the steps the budget undergoes from initiation to approval. Major decisions in the budgeting process are overseen by the Water and Environment Sector Working Group (WESWG).
The budget process has the following key milestones:
x The Budget Call Circular, which is prepared and issued by Ministry of Finance, Planning and Economic Development (MoFPED) on an annual basis. This marks the start of the budget cycle, providing the indicative figures for the planning period and the government priority areas upon which the sectors should focus their interventions in the medium term. With this in place, the sector working group makes the allocations for the FY 2014/15.
x The detailed budget estimates and budget framework paper (BFP) and the Ministerial Policy Statement (MPS) as guided by the Output Budgeting Tool, which is a standard format from MoFPED.
x The quarterly performance reports, which are prepared by the ministry and submitted to both MoFPED, and the Prime Minister’s office (OPM); these form the basis for the annual performance report.
3.2 Financial Performance
This section provides the resource allocation, release and expenditure under the sector ceiling for the period under review. It should be noted that the sector receives funds from the Government of Uganda (GoU) composed of treasury releases known as on budget support including government’s own resources and development partners’ contributions, whereas off budget support is composed of mainly donor funds independently accessed by organisations. An overview of all financial data summarising the financial performance of the Sector is provided in Annex 6.
Figure 2.1 shows the government funding to the water and environment sector for the medium term FY 2011/12-2014/15. The figure shows a positive growth in both on budget and off budget funding.
Figure 2.1 Trends in Overall Sector Funding Amounts [UGX bn]
3.2.1 Overall Budget Performance
A summary of overall budget performance is provided in Table 2.1. The GoU annual sector allocation for the FY 2014/15 was UGX bn 846.18 including taxes and off budget support to the sector, of which UGX bn 340.743
0100200300400500600700800900
2011/12 2012/13 2013/14 2014/15
On-budget off- Budget Total funding

Uganda Water and Environment Sector Performance Report 2015
20
was for Vote 019, UGX bn 9.03 for vote 0150 NEMA, and UGX bn 20.825 for Vote 0157 NFA. Conditional grants allocated to local governments and KCCA amounted UGX bn 67.73, and UGX bn 6.35 UGX, respectively.
Off budget allocations increased tremendously, to UGX bn 401.55 in total, as compared to UGX bn 103.66 in the previous year; this increase is mostly the result of increased funding for NWSC and for the ENR CSOs (see also Section 3.2.3). UGX bn 297.3 was allocated to the water and sanitation (WSS) sub-sector and UGX bn 104.25 was allocated to the environment and natural resources (ENR) sub-sector. Out of the total budget (both on-budget and off-budget) of UGX bn 846.18 to the sector during the financial year 2014/15, UGX bn 749.97 was released and UGX bn 733.70 spent representing a 97.8% release, and 97.8% of release spent.
The total sector budget (on-budget) was UGX bn 444.66 and this was distributed as follows: Vote 019 UGX bn 340.7 (76.6%), Vote 0150 (NEMA) was allocated UGX bn 9.01 (2.0%), Vote 0157 NFA was allocated UGX bn 20.83 (4.7%), the Conditional Grants totalled up to UGX bn 67.73 and a budget of UGX bn 6.35 was for Kampala Capital City Authority, representing 1.4% of the total sector budget. The UGX bn 67.73 as Conditional Grants to Local Governments comprised of:
x District Water and Sanitation Development Conditional Grant for Rural Water: UGX bn 60 x Urban Water Operation and Maintenance Grant: UGX bn 2.5 x District Health and Sanitation Conditional Grant to selected districts: UGX bn 2.5 and x Natural Resources Grant, more specifically Wetlands Conditional Grant: UGX bn 1.0.
The average performance is a factor of the good performance in terms of release and expenditure on the off budget component, which compensated for the underperformance of on-budget releases as will be shown in the next section.

Uganda Water and Environment Sector Performance Report 2015
21
Table 2.1. Allocations, releases and actual expenditure [UGX bn] by Vote and budget category, FY 2914/15
Approved budget Released Spent % of budget
released % release spent Budget Category
Vote 019 (MWE)
Recurrent Component
Wage 5.356 5.107 5.003 95% 98%
Non-wage 3.839 3.395 3.376 88% 100%
Development Budget
GoU 172.219 153.057 151.958 89% 99%
Donor 155.797 80.86 66.186 53% 82%
Taxes 3.532 2.61 2.61 74% 100%
Vote 019 Total 340.742 245.029 229.133 72% 94%
Vote 0150 (NEMA)
Recurrent Component
Wage 3.742 3.654 3.634 98% 99%
Non-wage 4.221 3.632 3.61 86% 99%
Devt Budget GoU 1.05 0.89 0.868 85% 98%
Vote 0150 Total 9.013 8.176 8.112 91% 99%
Vote 157 (NFA)
Recurrent Component
Wage 5.4 4.05 4.049 75% 100%
Non-wage 0.133 0.098 0.081 74% 83%
Devt Budget GoU 0.925 0.659 0.648 71% 98%
NTR 14.367 13.623 12.618 95% 93%
Vote 157 (NFA) Total 20.825 18.43 17.396 88% 94%
Conditional Grants to LG 67.729 67.729 67.729 100% 100% Conditional Grant to KCCA 6.353 6.353 6.353 100% 100% Total on Budget 444.663 345.717 328.723 78% 95% Off Budget WSS 297.3 297.3 297.3 100% 100% ENR 26.31 26.31 26.31 100% 100% Total Off Budget 323.61 323.61 323.61 100% 100%
Total (on +Off Budget) 768.27 672.03 655.76 98% 98%
3.2.2 On-budget Performance
The total budget appropriated by Parliament as read out by the Hon. Minster of Water and Environment at the floor of Parliament was UGX bn 444.663bn which represented 3.0% of the total Government Budget for the financial year. This shows that the sector has a stable share of the national budget in the medium term.
Table 2.2 Trends in sector percentage share of National MTEF Allocation from 2011/12- 2014/15 F/Y Water &
environment Works & transport
Education Health Security Energy & mineral development
2011/2012 3.1% 13% 15% 8% 10% 14%
2012/2013 2.8% 15% 15% 8% 9% 14%
2013/2014 3.2% 19% 14% 9% 8% 13%
2014/2015 3.0% 16% 13% 9% 8% 12%
Budget, Release and Expenditure
Out of the total on-budget allocation of UGX bn 444.663 to the sector during the financial year 2014/15, UGX bn 345.717 was released and UGX bn 328.723 spent representing 78% release, and 95% of release spent. The

Uganda Water and Environment Sector Performance Report 2015
22
non-released funds to MWE accounted for 22% of the annual budget, and this mostly affected Vote 019 (Ministry of Water and Environment).
The expenditure of 95% (instead of 100%) was due to the factor that some funds to the ministry were released late hence affecting the absorption rate. The Ministry received funds in June (6th June) yet was supposed to close the expenditures entries by 21st June 2015 hence leading to 95% the level of absorption indicated above.
Budget, Release and Expenditure under vote 019 (Ministry of Water and Environment)
During the FY 2014/15, a total of UGX bn 340.742 was budgeted for Vote 019 (i.e., MWE), and UGX bn 245.029 was released representing 71.9%, while of this release UGX bn 229.13 (93.5%) was spent. The absorption rate was hampered by the release of additional funds in June 2015, leaving MWE insufficient time to spend all the funds released during that month, i.e. by the 21st of June 2015, which was the closing day for all GoU payments on the Integrated Financial Management System (IFMIS).
Table 2.3 Releases and Expenditure by Vote Function and Funding Source [UGX bn] Sub Sector
Vote Function Funders Approved budget
Released Spent % Budget released
% Releases spent
WSS VF:0901 Rural Water Supply
Total GoU + Ext Funding 72.5 46.37 44.31 64.0% 95.6% GoU 42.94 36.94 36.63 86.0% 99.2%
Ext Financing 29.56 9.43 7.68 31.9% 81.4%
VF:0902 Urban Water Supply & Sanitation (Small Towns / RGCs)
Total GoU + Ext Funding 150.7 85.13 84.14 56.5% 98.8%
GoU 55.89 52.22 51.98 93.4% 99.5%
Ext Financing 94.81 32.91 32.16 34.7% 97.7%
VF:0903 Water for Production
Total GoU + Ext Funding 31.97 22.83 22.77 71.4% 99.7%
GoU 31.97 22.83 22.77 71.4% 99.7%
Ext Financing 0 0 0 0% 0%
VF:0904 Water Resource Management
Total GoU + Ext Funding 24.04 35.45 24.46 147.5% 69.0% GoU 6.41 6.38 6.16 99.5% 96.6% Ext Financing 17.63 29.07 18.30 164.9% 63.0%
ENR VF:0905 Natural Resources Management
Total GoU + Ext Funding 31.49 22.29 22.12 70.80% 99.30%
GoU 22.69 22.29 22.12 98.2% 99.2%
Ext Financing 8.80 0.00 0.00 0.0% 0.0%
VF:0906 Weather, Climate and Climate change
Total GoU + Ext Funding 7.83 6.5 6.25 83.00% 96.30% GoU 5.63 5.47 5.42 97.2% 99.1%
Ext Financing 2.20 1.02 0.84 46.4% 82.4%
VF 0150 NEMA
Total GoU + Ext Funding 9.013 8.176 8.112 91.00% 99.00%
GoU 9.013 8.176 8.112 91% 99%
Ext Financing 0 0 0 0% 0%
VF 0157 NFA
Total GoU + Ext Funding 20.83 18.43 17.40 0.88 0.94 GoU 6.46 4.81 4.77 74.5% 99.2%
NTR 14.37 13.62 12.62 94.8% 92.6%
Ext Financing 0 0 0 0.0% 0.0%
Sector Support Services
VF:0949 Policy, Planning and Administration
Total GoU + Ext Funding 18.68 26.03 25.08 139.3% 96.4% GoU 15.88 15.44 15.26 97.2% 98.8%
Ext Financing 2.80 7.06 6.51 252.1% 92.2%
Taxes Taxes 3.53 3.53 3.31 100.0% 93.8%
Total for Vote 370.58 274.74 257.95 74.1% 93.9%

Uganda Water and Environment Sector Performance Report 2015
23
A summary of the analysis of trends in funding to the districts through the conditional grants for water and sanitation in Uganda over the last five years is given in Box 2.1.
The inflation-corrected releases show that on average, the districts have had a similar purchasing power over the years. If one looks at the trend over the last years, the inflation-corrected figures show that the releases to the districts in real terms are actually reducing to a level below the inflation-corrected amount in FY2002/03, against an increasing total rural population, and a situation where cheaper technologies having been exhausted.
Box 2.1 Trend in releases [bn UGX] to the District Water and Sanitation Conditional Grant
Water and Sanitation DP Group, January 2015
3.2.3 Off-budget Performance
The off-budget figures for the FY 2014/15 have increased from UGX bn 103.1 in FY 2013/14 to UGX bn 323.61 in FY 2014/15. A total of UGX bn 26.31 was available to the Environment and Natural Resources Sub-sector (8.1 %), while UGX bn 297.31 was availed to the water and sanitation sector, representing 91.9% share of the off-budget funds.
Off-budget funding constitutes funding to National Water and Sewerage Corporation, partly from the internally generated funds but mostly donor financing in the form of loans and grants to the Corporation (UGX bn 248), funding to 55 CSOs under the ENR subsector (UGX bn 88.52), funding to 177 active CSOs under the UWASNET umbrella (UGX bn 49.30), and UNDP funding to REDD+ (UGX bn 15.73).
- 5 10 15 20 25 30 35 40
0.00010.00020.00030.00040.00050.00060.00070.000
Mill
ions
release
adjusted in "real" terms - the purchasing power - of the baselineyear 2002/03.
Total population at end of FY

Uganda Water and Environment Sector Performance Report 2015
24
Table 2.4 Off-budget allocations for the FY 2014/15 [UGX bn] Subsector Vote Budget Availed Total Release
Water and sanitation
UWASNET (report from 177 members) 49.30 49.3 49.3
NWSC 248 248 248
Subtotal 297.3 297.3 297.3
Environment and natural resources
ENR CSOs (report from 50 members) 88.52 10.58 10.58
REDD+ 15.73 15.73 15.73
Subtotal 104.25 104.25 104.25
Total 401.55 401.55 401.55
3.3 Capacity Development
During the period under review, the guidelines for operationalisation of the Water and Environment Sector Capacity Development strategy (SCD) were developed. The guidelines consist of the “Hand Book” and a separate “Toolbox”. A sample capacity development (CD) plan for the Urban Water and Sewerage subsector was developed as a guide to sector stakeholders. An external consultant was engaged to take stock of the Capacity Development plans in the Water and Environment Sector, identification of CD gaps and establishment of the amount of financial resources currently available for CD activities in the sub-sectors and related stakeholder institutions/organisations.
Other capacity development interventions implemented include continuation of the African Development Bank (AfDB) support to strengthening of the capacities of the managers and staff of the de-concentrated structures (WSDFs, TSUs, WMZs & UOs) in the areas of procurement and contract management. A total of 141 officers attended the above mentioned training courses (85 males and 56 females). In addition, quarterly follow up on-the-job skills training and monitoring of the performance of de-concentrated structures in the area of procurement and contract management was conducted for the four WSDFs. The sector also continued to implement the standard capacity development programmes aimed at equipping the fresh graduates with practical skills through attachment to on-going projects. A total of 125 fresh graduates (72 males and 53 females) of not more than two years field experience were admitted to the program during the FY 2014/15.
To strengthen the on-going CD initiatives, a consultant supported MWE and NWSC in the implementation of CD programs in January 2015 over the next two and half years. Specifically for the MWE, the consultancy is supporting the operationalisation of the Sector Capacity Development strategy, while for NWSC the focus is on strengthening of asset management systems through design and implementation of capacity building measures and improvement of asset management in the de-concentrated structures of MWE. A particular focus is the development of learning materials for six vocational professions: industrial plumbing, electro-mechanical maintenance, water quality management, customer services (relations and accounts), and operations supervisors.
The Environment Sub-sector is a beneficiary of the 5-year project “Skills Development for Human Resources (SDHR)”. The skills development support follows a staged and integrated capacity development process that focuses on: (i) the strengthening of the organisational framework as the basis for HRD initiatives; (ii) the improvement of HRD and training plans, and (iii) the improvement of training processes. Tailor-made support processes to assist organisations in their organisational development planning and in their HRD and training planning were prepared, and will be implemented in the next financial year. The following departments were selected in 2015 by the MWE to benefit from the project: Wetlands Management Department, Forestry Support Services Department, Climate Change Department, Uganda National Meteorological Authority; the Policy and Planning Department and the Finance and Administration Department.

Uganda Water and Environment Sector Performance Report 2015
25
4 RURAL WATER SUPPLY
4.1 Background
The National Population and Housing Census 2014 established that the population of Uganda is 34.8 million, with 28.4 million (82.0%) living in rural areas (August 2014). Rural water supply provision covers communities or villages (at the level of Local Council 1 (LC1)) with scattered population in settlements up to 1,500 people, and Rural Growth Centers (RGCs) with populations between 1,500 and 5,000.
The main technology options used for water supply improvements in rural areas include protected springs (23%), shallow wells (25%), deep boreholes (41%), piped water schemes (gravity-fed) and piped water schemes (pumped) (11%), valley tanks and rainwater tanks. Boreholes are the most widespread technology whereas valley tanks are the least implemented.
4.2 Key Activities of Rural Water Supply
The major and initiatives under Rural Water Supply Department are:
(i) District Water and Sanitation Development Conditional Grant (DWSDCG) and Peace, Recovery and Development programme (PRDP): These activities are implemented by district local governments based on work plans and budgets approved by MWE. The DWSDCG and PRDP finance construction of water supply and sanitation facilities, community sensitisation and mobilisation in rural areas. The eight regionally based Technical Support Units (TSUs) of MWE provide capacity building, monitoring and technical back-up support to local governments in the implementation of the programmes
(ii) The central government through MWE’s Rural Water Supply and Sanitation Department (i) coordinates use of the DWSDCG & PRDP including resource mobilisation and allocation, setting standards, technical support, and monitoring compliance, (ii) promotes appropriate technology through action research, development and up-scaling, (iii)plans and develops water schemes that traverse local government boundaries i.e. large gravity flow schemes and large motorised piped water schemes, (iv) strengthens Improved Sanitation Hygiene service delivery in the District Local Governments (DLGs) through capacity building programmes, and (iv) carries out quality assurance of water supply designs developed by DLGs.
4.2.1 District Water and Sanitation Development Conditional Grant & Peace, Recovery and Development Programme
District Local Governments planned to implement a total of 2,907 facilities using the Conditional Grant and PRDP, and managed to achieve 2,450 water facilities, indicating 84% performance (see Table 2.5).
Table 2.5 Targets and achievements using the DWSDCG and PRDP as of June 2015
Type of water source Target Achievement taps % Achieved
Fixed no of persons per source
Persons served
Protected springs 350 335 96% 200 67,000
Shallow wells 709 673 95% 300 201,900
Boreholes 1,159 1,076 93% 300 322,800
Piped water supply schemes / GFS 115 88 910 77% 150 136,500
Rainwater Harvesting Tanks 10m3 574 278 48% 6 1,668
Total 2,907 2,450 84% 729,868
The relatively low physical performance of implementing 84% of the planned new hardware facilities is attributed to introduction of VAT on water works and services which compelled districts to readjust their

Uganda Water and Environment Sector Performance Report 2015
26
targets and accommodate taxes. The number of rain water harvesting tanks planned and implemented has gone down compared to the previous years as a result of the presidential directive stopping use of public resources for rain water harvesting at household level. The slow procurement process and poor planning led to loss of 3.6 billion which was returned to the treasury under the new Finance Management Act.
In FY 2014/15, the total population served by both Grants was 729,868 persons The increase in persons served, compared to 632,726 people served in FY 2013/14 is attributed to the change in prioritisation in the type of technologies implemented, resulting in an increase in the number of piped water schemes that serve a larger number of the scattered rural population.
In regards to financial performance, 62% of the districts absorbed 100% of the release, up from 55% in the last financial year, and only Kotido district absorbed below 60% of the release compared to the 7 in the previous year. The under performance in a few districts is mainly due to low staffing levels especially in the district water offices where 21% of the substantive district water officers double as acting district engineers and 23 districts lacking substantive water officers. Additionally, frequent transfers of CAOs affect the stability of financial management in the district and the poorly trained / equipped PDUs delay the procurement process.
4.2.2 MWE Centrally implemented Development Projects
The activities implemented through centrally managed projects by MWE are outlined in Table 2.6. An additional total number of 79,500 persons were served with MWE central government interventions2. Rehabilitated boreholes restored supply to 63,300 persons and the off-budget support programmes3 served an additional 31,500 persons.
Table 2.6 Performance of development projects managed by MWE
Description Target Achieved Comment Completion Construction of large gravity flow schemes including detailed design Nyarwodho GFS- Phase I in Nebbi district
50% 70% Project targeting a population of 85,582 persons in Jonam and Padyere counties. Meaningful involvement of district personnel in project activities has contributed tremendously to the progress so far achieved. Project ahead of schedule, and completion date projected to 2nd February 2016.
Bududa – Nabweya GFS in Bududa District
80% 52% Project to serve a population of 63,000 persons. Project progress hampered by requirements for clearance from Uganda Wildlife Authority to have facilities within the protected areas, land compensation issues for key system installations and community demands to include areas not originally catered for in the design.
Lirima GFS in Manafwa District
80% 80% The gravity flow scheme will serve a population of 173,000 persons. Project on track and completion is scheduled for December 2015.
Bukwo GFS in Bukwo District
30% 30% Project will serve a population of 54,000 persons. Project on track and completion expected in January 2017.
Butebo water supply in Pallisa District
100% 20% Project progress is delayed due to changes in water supply designs to improve system capacity. Target population to be served increased from 15,000 people to 42,000 persons as a result of the design changes.
Bukhooli RGC in Namayingo District
40% 70% Project will serve a population of 22,470 persons through 105 yard connections. Implementation on track and scheduled to be completed May 2016.
2 Singila (10,000), Wadelai (7,000)+Ongino (10,000)+175 new boreholes (52,500)
3 through JICA and Egyptian Grant

Uganda Water and Environment Sector Performance Report 2015
27
Description Target Achieved Comment Completion Geregere RGC in Agago district
100% 0% The water supply was originally planned for rehabilitation but after the field assessment it was noted that there was need to undertake a design review of the entire system to increase the system capacity. As of June 2015, final designs were developed, implementation planned during FY 2015/16.
Opyelo RGC in Agago district
100% 0% The water supply was originally planned for rehabilitation but after the field assessment it was noted that there was need to undertake a design review of the entire system to increase on system capacity. As of June 2015, final designs were developed, implementation planned during FY 2015/16.
Wadelai RGC WSS in Nebbi district
80% 95% Completed apart from commissioning, to serve a population of 7,000 persons with funding from GoU. Technical commissioning scheduled in September 2015.
Singila RGC Water Supply in Nebbi district
80% 100% Completed to serve a population of 10,000 people.
Kahama GFS – Phase II in Ntungamo District
20% 0 Final designs developed by June 2015.
Kanyampanga GFS in Kanungu district
100% 95% Completion of project delayed due to changes in transmission pipeline design and resistance from landowners to access the transmission pipeline route. Completion date projected for 30th October 2015 with 650 yard connections.
Ongino RGC water supply system in Kumi district
100% 100% Completed to serve a population of 10,000 people.
Detailed design for large water supply systems
7 No. 3No Completed designs for Ngoma-wakayato (Nakaseke) and Rwebisengo-Kanara (Rwebisengo) water supply system. The project experienced procurement delays for design consultancy services of Orom, Potika, Ogili, Nyamugasani, and Bukedea. The consultancies are now at feasibility study stage.
Detailed studies for rehabilitation of Old Gravity Flow Schemes
5No 50% Studies for Shuuku-Masyoro GFS in Bushenyi, Nyabuhikye-Kikyenkye GFS In Ibanda, Bwere GFS in Kasese and Bitsya GFS in Buhweju are at feasibility and preliminary design stage.
Solar powered mini-piped water schemes Construction of solar powered mini-piped water schemes in rural areas
20% 5% Project experienced delays in procurement process due to administrative review and investigations. 35 sites were handed over to contractors by end of June 20154. Benefitting districts and locations are attached.
Rehabilitation of chronically broken down boreholes
4 Amudat-Amudat, Geregere-Agago, Gwenotowm-Nwoya Kilanga-Yumbe, Kololo(Ofua)-Adjumani, Lolelia-Kaabong, Iningo-Serere, Kasolwe-Kamuli, Bulyakumbi-Kaliro, Nabukalu-Bugiri, Nakalanga-Mayuge, Aloka-Inomo-Apac, Tojjwe-Buvuma, Ntengeru A-Kayunga, Luweero - Ngogolo, Kikandwa-Mubende, Dwaniro-Rakai, Kashenyi-Isingiro, Kanoni-Kiruhura, Kyankwanzi, Lokorete – Moroto, Ngora – Morukakise, Nsozibiri-Jinja, Munduya – Busia, Lunyolya – Luweero, Kakubansiri – Gomba, Nakatete – Lwengo, Panyadot – Kiryandongo, Kikomazi – Mpigi, Kigalagala - Jinja and Buyuge – Kaliro, Atutur – Kumi, Rwot Konya - Otuke, Kifuyo-Namayingo and Manyamye - Butaleja

Uganda Water and Environment Sector Performance Report 2015
28
Description Target Achieved Comment Completion Rehabilitation of boreholes 1100 211 Water supply for 63,300 persons was restored5. The available
budget of 3bn could only cover a maximum of 300 boreholes in a year. (Budgets cuts by MoFPED during the 4th Quarter undermined performance in this area.
Drilling of Boreholes New boreholes with hand pumps
270 280 With GoU funding a total of 175 boreholes was achieved; 75No were drilled under the JICA funded Acholi sub – region project and 30 boreholes realised with Egyptian funding. The borehole drilling interventions served a total of 84,500 persons.
4.2.3 Technical Support to District Local Governments
During the financial year 2014/15, the 35 Technical Support Unit (TSU) staff provided support to 111 district local governments in areas of planning, budgeting, accountability, support to procurement and contract management.
Training was conducted in in groundwater development and management for the TSU 3 districts. A total of 39 participants were trained; these included District staff and drilling contractors in the region. District Water Officers were trained in the application of the Water Design Manual. 62 District Water Officers from TSUs 1, 2, 3, 5, 6 and 7 were exposed to skills/ knowledge on undertaking designs for piped water supply schemes. The skills imparted are meant to assist improve quality of designs received from Local Governments. The Hand Pump Mechanics Association (HPM) Framework was disseminated to 11 districts. The framework is a tool designed to regularise cooperation between HPMAs and district local governments. One of the key action plans developed by the districts during the dissemination was the formation of Sub-County Water and Sanitation Boards (SWSB) and identification of persons in charge of operation and maintenance at the district and sub-county level. MWE conducted an annual District Water Office meeting in Kabale District. New PPDA regulations (2014) were shared during the meeting. Transport for monitoring and supervision of water and sanitation activities in the district featured prominently as a challenge; it was resolved that districts submit justification for transport to MWE for consideration. A total of 16 districts have been cleared by MWE to procure vehicles during financial year 2015/2016. Inter- District Meetings (IDMs) were organised and conducted by TSUs 1, 2, 3 Soroti, 3 Moroto, 5, 6, 7 & 8. IDMs are fora aimed at improving coordination within and among districts, involving NGOs and other sector funding agencies within the respective regions.
TSUs organised and conducted quarterly TSU performance review meetings for Technical Support Units, to assess and evaluate the performance of TSUs and also enhance staff capacities to effectively support District Local Governments. TSU 3 Moroto that emerged as the best performer was recognised with a reward during the review.
A total of 10 best operational practices in water supply and sanitation provision were identified, assessed and documented. Napak District demonstrated the best operational practice in form of a community initiative towards hygiene, sanitation and environmental improvement.
5 West Nile and Northern Uganda covered Arua (15), Maracha (15), Yumbe (15), Otuke (15), Dokolo (15), and Amolatar (15). East & North East Uganda: Districts of Katakwi (15), Kumi (15), Serere (16), Sironko (15). Central & South Western Uganda: Butambala (10), Lyantonde (15), Wakiso (15) Buliisa (14), and Kayunga (6)).

Uganda Water and Environment Sector Performance Report 2015
29
4.2.4 Cross-cutting activities
Updating the Water Supply Database: MWE is in the process of updating the Water Supply Data Base with a focus on training of district local governments in handling management information. As of June 2015, staff from 30 DLGs had been trained in the update process. With an improved MIS, the practice of concentrating infrastructure development in particular communities and localities while neglecting other parts of the DLGs can be minimised.
Implementation of district trans-boundary water supply systems: MWE is undertaking design of 7 large piped water schemes that cut across local government boundaries. The proposed systems are based on surface water with transmission and distribution in areas of water scarcity.
Promotion of appropriate technologies: As an interim measure, MWE continues to promote appropriate technologies, i.e. scaling up of rainwater harvesting using the revolving fund approach in areas where groundwater potential is low or the water quality is poor.
4.2.5 WASH Activities Supported by UNICEF
During Financial Year 2014/15, UNICEF supported Government to deliver WASH services, through provision of water systems, rehabilitation of existing sources, supporting operation and maintenance activities of new and existing facilities, provision of sanitation through community-led total sanitation (CLTS) and construction of institutional latrines, hygiene promotion and support to water quality monitoring. Other activities included training district staff on CLTS/ PHAST (Participatory Hygiene and Sanitation Transformation), commemoration of World Water Day, Dissemination of Hand Pump Mechanic Association framework and in organising Karamoja WASH Regional meetings. UNICEF also responded to emergencies in the country, including the Typhoid outbreak in and around Kampala and the refugee influx into Uganda from South Sudan.
Water facilities were constructed and rehabilitated, serving an estimated population of 73,908 people,6 as shown in Table 2.7. Other support provided in terms of communal and institutional sanitation and hygiene, capacity development and emergency response is summarised in Annex 7.
Table 2.7 Water facilities Constructed and Rehabilitated by UNICEF in FY 2014/15
Type of Technology Number achieved
Locations Number of persons served
Direct Cost [UGX]
Piped water systems in Rural Growth Centres
6 Rengen in Kotido District, Tokora and Nabilatuk in Nakapiripirit District; Nsura and Mitandi Gravity Flow Schemes in Kabarole District and Ngwedo in Buliisa District.
21,600 2,519,094,480
Rehabilitation and major repairs of boreholes with hand pumps
161 Buikwe 6; Mukono 26; Wakiso 7; Mubende 9; Kyenjojo 12; Kasese 6: Kalungu 16; Bukomansimbi 30; Ntoroko 6; Lwengo 38; Kyegegwa 5;
48,300 201,953,960
Rainwater Harvesting Facilities in Primary Schools – 10M3 underground tanks fitted with hand pumps
7 Kabarole District 4,008 41,819,750
6 additional persons served estimated at 25,600 and water supply restored for 46,500 persons

Uganda Water and Environment Sector Performance Report 2015
30
Total 73,908 2,762,868,190
4.2.6 Appropriate Technology Centre for Water and Sanitation, Mukono
The Appropriate Technology Centre for Water and Sanitation (ATC), Mukono has continued to fulfil its mandate of conducting action research on WATSAN technologies, promoting appropriate technologies and building capacity of stakeholders.
During FY 2014/15, ATC realised achievements in different areas including: innovative applied research and development in appropriate technologies and approaches, capacity building for sector actors, building up the profile of appropriate technologies, accelerate public/private investment through innovative financing mechanisms, and identify challenges facing the adaptation of appropriate technology. A summary of achievements is provided in the following section.
Innovative applied research and development
ATC carried out the following activities in the area of research and development:
x Capacity building of TSU 8 district water officers in the design and installation of low cost first flush diverter and in some homes in Kampala.
x Review of the three pitchers filter water treatment technology built on the traditional approaches to drinking water purification and storage. The technology has been improved for better performance by increasing on the depth of sand, and has been piloted in four households in Nabbaale Sub-county, Mukono district.
x Implementation of the Tiger toilet research project, aimed at improving access to sanitation, in partnership with Water for people. Ten Tiger toilets were installed and monitored in the period under review.
x Development of demonstration unit for drip irrigation using the bucket kit to supplement rainfall, in order to meet the crop water requirements.
x Installation of a total of 40 EMAS tanks in Mukono, Mayuge, Mpigi, and Luwero Districts. The tanks were constructed by masons trained by ATC.
x Implementation of a Menstrual Hygiene Management Project in two schools (Misindye and Kabimbiri primary schools) in Mukono District. The project aims to provide low cost sanitary pads to the pupils in less privileged schools, and re-use wastes from the production of the sanitary pads to make briquettes.
Capacity building for sector actors
The ATC provided training for six under-graduate students to be ambassadors of appropriate technologies thereafter. Two groups of 30 members of Shelter and Settlements Alternatives: Uganda Human Settlements Network (SSA:UHSNET) had an exposure tour of the appropriate WASH technologies at ATC.
The ATC hosted 25 members of UWASNET’s Water and Sanitation Technologies Working Group. The visit was organised by UWASNET and was intended to expose NGOs to ATC works and research undertakings.
Build up the profile of appropriate technology
x Six Fossa Alterna latrines were constructed in Mukono, Iganga and Luwero districts by technicians trained by ATC.
x The ATC participated in the toilet day at Uganda Museum by holding a mini exhibition in order to market the technology to other sectors.
x ATC organised a National stakeholder dialogue workshop, attended by representatives from government, professional associations, NGOs and other development partners.
x In partnership with WaterAid, World Vison and Water for People, ATC organised a national conference on Equity and Inclusion in the WASH sector under the theme ‘Undoing inequity in access to water and sanitation services for Vulnerable People’. In the same event, Guidelines for inclusive WASH services at

Uganda Water and Environment Sector Performance Report 2015
31
household and community levels were launched. It provides practical solutions for improving access to WASH services by vulnerable people.
x ATC participated and showcased some of its activities at sector organised platforms including the Inter District Meetings organised by Technical Support Unit (TSUs), the national learning forum on scaling up sustainable sanitation and hygiene promotion, National Civil Society Fair and the Uganda national NGO quality Assurance certification Mechanism.
x Two inclusive toilets were constructed to serve as demonstration sites in Kikandwa model village and Soroti Water office. The latter also served as an opportunity for capacity building of TEDDO and WEDA technicians to use the technical guide.
x ATC has been involved in inclusive Water, Sanitation and Hygiene (WASH) projects in Refugee Settlements with World Vision Uganda in Kyangwali Refugee Settlement (Hoima district) and Alere Refugee Settlement (Adjumani district) with a focus on people with disabilities (PWDs).
Figure 2.2: Visitors at the ATC stall during the National Civil Society Fair held at Hotel Africana, Kampala
Accelerate public/private investment through innovative financing mechanisms
Through the ATC, the Ministry of Water and Environment is working with four NGOs7 to pilot a project on “scaling up of rainwater harvesting using the revolving fund approach” in four districts. The learning from this approach, where beneficiaries access funds for the installation of rainwater harvesting systems at affordable interest rates and favourable/realistic repayment periods will be used to eventually roll out the approach in the whole country.
The activities of ATC have been increasing since its establishment in 2010, with more recognition of the need for research and development of appropriate water and sanitation technologies and approaches in the sector. However, the continuing investments in ATC’s capacity are not matching the increasing demand. Highlighted as challenges, there is need for more investments in infrastructure like research laboratories, to institute adequate human resource capacity that matches the demand and increase the annual capitation for ATC activities until when it is capable of winning large research grants.
4.3 Status and Trends of Key Indicators
4.3.1 Golden Indicator No 1: Access to Safe Water in Rural Areas
Access / coverage refer to the percentage of people that collect water from an improved water source. The golden indicator for access for rural water supplies is defined as“% of people within 1.5km (rural) of an improved water source”. The service criteria used to estimate access for rural water supplies are provided in Table 1.3. The Water Supply Data Base of MWE was used to generate the latest access figures. The water coverage computation excludes water facilities that are non-functional for over 5 years.
7 : Shuuku Development Foundation (Sheema), Katosi Women Development trust (Mukono), Uganda Rural Muslim Development association (Namayingo) and Busoga Trust (Kaliro)

Uganda Water and Environment Sector Performance Report 2015
32
The national safe water coverage for rural areas is estimated at 65%, up from 64% recorded in June 2014 against a target of 77%. The analysis is based on the national household population census results for the rural population of August 2014. In addition, MWE is in the process of updating the Water Atlas, and many constructed water sources are mapped that have not been provided by district water officers in their yearly updates to MWE., a total of 35 districts have been covered so far, and 5,713 sources found which were not in MWE’s Water Supply Data Base (see Section 1.3.3). Therefore, more realistic figures on total number of existing water facilities shall be available at the end of the exercise. Overall, 70% of the districts have a coverage above the national average coverage figure, up from 55% of the districts estimated in June 2014. However, 10 districts were recorded with coverage below 40% up 9 recorded in June 2014.
Overall, an estimated total of 914,468persons8 have been served by new water supplies in FY 2014/15 through the DWSDCG and PRDP Grants, central government investments and UNICEF interventions. This figure excludes ongoing multi-year projects under MWE rural water department9.
8DWSDCG: 729,868+Ongino & Singila &Wadelai: 27,000+new boreholes: 84,000+Unicef 25,600+emergency solar systems:48,000
9 Lirima, Kanyampanga, Nyarwodho, Bukwo, Bududa and Namayingo

Uganda Water and Environment Sector Performance Report 2015
33
Figure 2.3: Access to Safe Water by District (June, 2015)

Uganda Water and Environment Sector Performance Report 2015
34
4.3.2 Golden Indicator No 2: Functionality
The golden indicator for functionality for rural water supplies is defined as the “% of improved water sources that are functional at time of spot-check”. The trend in average nation-wide functionality of rural water supplies is indicated in Figure 2.4. As of June 2015, the functionality for rural water supplies is estimated at 88%, up from 85% in June 2014 which is 2% points away from the target of 90% by 2015. Overall, 64% of the districts have a safe water functionality above the nationwide average, an increase of 9% percentage points compared to the figure of 55% in June 2014.
Over the last two years, there has been a considerable increase in functionality of rural water supplies ranging from 84% in June 2013 to 88% in June 2015. The achievements may be attributed to various causes. Investments for rehabilitation of water facilities under DWSCDG have increased; the budgets/expenditures for rehabilitation have gone up three times in a period of two years i.e. 1.5bn in June 2013, 2.9bn in June 2014 and 5.4bn in June 2015. Additionally, MWE rehabilitated 211 boreholes, and UNICEF rehabilitated 161 boreholes. For sustainability of the rehabilitation facilities, water user committees were reinvigorated through trainings where a clear plan and schedule of O&M is developed in line with MWE’s operational manual. HPMs were also involved in the rehabilitation works to strengthen their capacity.
The mobilisation efforts by the districts through conducting advocacy meetings for water programmes both at district and sub-county levels and holding quarterly sub-county extension workers meetings, have had significant impact in terms of water facilities information gathering and feedback, and the setting up of Hand Pump Mechanic Associations may well have been a step forward.
Figure 2.4 Trend in average functionality of rural safe water sources between FY04/05 and FY 2014/15.
76
78
80
82
84
86
88
90
Functionality of safe water sources

Uganda Water and Environment Sector Performance Report 2015
35
Figure 2.5 Functionality of Safe Water Sources by District, June 2015

Uganda Water and Environment Sector Performance Report 2015
36
Causes of non-functionality
Technical breakdowns are the major causes of non-functionality of water sources. Technical breakdowns include pipes wearing out and dropping in the wells, and wearing out of other pump parts which are beyond communities’ affordability to repair. It is noted that borehole parts wearing out relatively fast are those of water sources installed not more than three years ago, which is an indication of the use of poor quality materials available on the market.
In order to manage the quality of materials used in water projects including pipes (GI, HDPE, uPVC and Stainless Steel), a committee comprising NWSC, DWD and Uganda National Bureau of Standards (UNBS) has been set up to review the quality of existing materials on open market and thereafter establish revised standards for the materials to be used in water supply projects. These standards will also be popularised for the benefit of the public.
MWE will continue with the rehabilitation program for the next three years and urge the local government to invest up to 13% of the grant in rehabilitation.
4.3.3 Golden Indicator No 3: Per Capita Investment Cost
The golden indicator for per capita investment cost for rural water supplies is calculated as the “total MWE and District Local Governments expenditure divided by the total of new people served”. An estimated total of 809,368 people10 have been served by new water supplies in FY 2014/15, at a total cost of UGX bn 94.6111. The overall per capita cost for rural water supplies is thus UGX 116,897 (US $ 41), from UGX 122, 853 for 2013/14 FY. The per capita investment is still relatively high because about UGX 22 billion was expended on ongoing multi-year projects, centrally managed by MWE12.
4.3.4 Golden Indicator No. 7: Equity
For rural water supply, equity is defined as “the mean sub-county deviation from the district average in persons per water point”. Equity is the sector performance indicator specifically intended to promote provision of equal opportunities for the water supply delivery service and minimise differences between groups of people. A lower numeric value indicates a more even distribution between sub-counties within a district.
For the FY 2014/15, the equity value is estimated at 162 almost equivalent to 161, estimated in June 2014. The interventions in rural areas during the FY 2014/15 have seemingly not made a positive impact on the distribution of water sources between sub-counties, though the increase in administrative units also plays a negative role (see also Section 1.3.3 under Equity header). It is worthwhile to note that District Local Governments can only implement low cost water supply technologies in those areas where they are feasible leaving out the water stressed S/Cs. Equity in provision of water services in DLGs is undermined by political interference in the allocation of new safe water sources as well as insufficient knowledge of DWOs on their sub-county coverage rate differences.
The Ministry of Water and Environment together with the district local governments is undertaking the following measures to improve equity in water supply and sanitation provision:
10 i.e. 729,868 by the DWSDCG and 27,000 by the new schemes Wadelai, Singila and Ongino and 52,500 by new boreholes; the latter two categories implemented by MWE.
11 DWSCDG expended UGX bn 56.68 & MWE central projects spent UGX bn 37.93
12 i.e. Kanyampanga, Lirima, Bukwo, Bududa, Namayingo, Nyarwodho water supply system in Alwi dry corridor and Ongino.

Uganda Water and Environment Sector Performance Report 2015
37
Figure 2.6 Equity in Distribution of Safe Water Sources by District, June 2015

Uganda Water and Environment Sector Performance Report 2015
38
4.3.5 Golden Indicator No. 9: Community Management
Operation and Maintenance (O&M) of rural water facilities in Uganda is largely based on the Community Based Maintenance System (CBMS). The concept of CBMS has a strong emphasis on community responsibility and authority over the management of rural water supplies. The golden indicator on community management is defined as “% of water points with functioning water and sanitation committees (WSC)”. Within this framework, a WSC community is considered functional if it regularly collects O&M funds, holds regular meetings, undertakes minor repairs and maintains adequate sanitation around the water source.
Information from the Water Supply Data Base (June 2015) indicates that the functionality of WSCs stands at 77%, an increase from 71% last year. The increase in functionality is attributed to increased follow up of WSCs by extension staff. Detailed information regarding performance in community management by district is provided as Annex 8.
Formation and training of new committees
Local governments facilitate communities to form WSCs and equip them with basic skills in O&M of water facilities in a bid to ensure that O&M of water facilities is undertaken sustainably. District reports for FY 2014/15 indicate that 2,549 new WSCs were formed of which 97% (2,511) were trained.
Some districts, however did not form nor train new WSCs despite having constructed new water sources. These include Mukono, Buliisa, Kiboga, Lwengo, Luwero, Sembabule, Kayunga, and Buikwe. Failure to prepare and empower communities to own and manage new water facilities translates into poor O&M which invariably reduces the life span of water facilities.
Follow up / reactivation of water and Sanitation Committees
Local Governments are required to regularly follow up WSCS for purposes of ensuring that WSCS remain functional and implement activities as planned. Follow up of communities by Local Governments entails provision of advisory services, raising awareness, training, technical back stopping and reactivation of dormant WSCs among others. In cases where challenges are identified extension workers are required to engage communities to develop strategies for rectifying challenges and constraints. A review of districts and TSU reports for FY 2014/15 indicates that only 3,788 communal sources were followed up by districts. The data further indicates that 14% of the districts13 did not follow up any WSCS during the entire reporting period. The failure to follow up and support communities contributes to non-functionality of WSCs and water sources.
Commissioning of new water sources
It is a sector requirement that all new water sources are formally commissioned and handed over to the community by the district leadership. During the commissioning ceremony, the district leadership formally hands over a new water source to the community. This is meant to transfer ownership to the community and to remind the community of their roles and responsibilities regarding the operation and maintenance of a water source. A review of district reports indicates that 46% (51) of the districts14 did not commission water sources. The lack of formal transfer of the water source to the community perpetuates the belief that water source belongs to the government, and contributes to the community reluctance to undertake O&M of the water facility.
District and Sub County Advocacy Meetings
13 Amuria, Bukedea, Bukomansimbi, Buliisa, Butambala, Kaberamaido, Kalungu, Katakwi, Lyantonde, Masaka, Mpigi, Ngora, Soroti, Ssembabule, Zombo
14 Agago, Amolatar, Amuru, Apac, Bududa, Bugiri, Bukedea, Bulambuli, Buliisa, Bundibugyo, Butaleja, Butambala, Buyende, Gomba, Hoima, Iganga, Kaberamaido, Kalangala, Kalungu, Kamwenge, Kapchorwa, Katakwi, Kayunga, Kiboga, Kiryandongo, Kole, Kumi, Kween, Kyegegwa, Lamwo, Lira, Luwero, Lwengo, Lyantonde, Manafwa, Masaka, Masindi, Mbale, Mpigi, Mubende, Nakasongola, Namutumba, Otuke, Oyam, Pader, Rakai, Serere, Sironko, Ssembabule, Tororo, Wakiso

Uganda Water and Environment Sector Performance Report 2015
39
Advocacy meetings are undertaken to review the water and sanitation situation at district/ sub-county level and agree on the priorities, on water supply/sanitation coverage, operation and maintenance, critical requirements, criteria for allocation of water facilities, sector policies and guidelines, gender, and environment issues related to District Water and Sanitation Development Grant. The meetings are a good avenue for the technical and political leadership and NGOs to articulate and harmonise on key sector issues like stagnating coverage and the role of political leaders in the water and sanitation sector. A review of districts reports indicates that 89% of the districts held these meetings, an increase from 80% reported last year. The districts that did not undertake district advocacy meetings include Yumbe, Sembabule, Ntungamo, Ngora, Mukono, Kyegegwa, Kayunga, Kalangala, Iganga, Hoima, Gomba, and Buikwe.
Extension workers meetings In a bid to strengthen the community management function at Sub-County level, the sector initiated quarterly meetings for extension staff at Sub-County level. During these meetings, Sub-County extension staff present reports on the status of community management activities including WSC functionality. Extension workers also share best practices and challenges regarding community management. A review of district reports indicates that 87% of the districts held these meetings.
Factors Affecting the Effectiveness of Community Based Maintenance System (CBMS)
A study15 undertaken to assess the effectiveness of the CBMS in 2014 indicates a number of factors contributing to effectiveness:
(i) Legal status of WSC- Although the Water Act, Cap. 152, provides for the formation of the WSC, it lacks clear and detailed guidelines for their operation, including defining their obligations and limits of their power.
(ii) Voluntary nature of the WSC members – The study noted that in most cases the potential volunteers on WSC’s are already active members of the community with other roles that compete for their time. The existing law does not mention length of tenure of service of the committee for its members. In many cases WSC members overstay, which contributes to poor performance.
(iii) Vandalism of Water Source Parts- The study reported that Hand-pump parts are vandalised and sold off as scrap which demoralizes community members.
(iv) The Supply Chain for Spare parts – Districts lack spare-parts outlets as dealing in hand pump spare-parts is not commercially viable. This affects the availability, accessibility and affordability of spare parts by Communities.
(v) Availability of back-up support to WSCs –There is limited support to WSCs by LGs and sub-county extension staff. Pre and post-construction community mobilisation is not effective due to short timeframes, inappropriate methods, inadequate funding and lack of prioritisation of software activities.
(vi) Willingness and ability of water users to contribute to O&M- Only 23% of user communities make timely contributions towards O&M due to mismanagement of funds by WSCs, poor record management practices and unwillingness by users to pay.
It is therefore recommended that (i) District should adequately plan to support and follow up WSCs on quarterly basis, (ii) all newly constructed WSCs should be commissioned by the district leadership, (iii) term limits should be set for WSC members and members who become inactive or pass on should be quickly replaced, and (iv) WSCs should be registered, continuously supervised and monitored by the Sub-county and DLG and DWD in accordance with the Water Act.
15 MWE (2014). Effectiveness of the Community Based Maintenance System for Rural Water Supply and Sanitation Facilities in Uganda

Uganda Water and Environment Sector Performance Report 2015
40
4.3.6 Golden Indicator 10 on Gender Mainstreaming
The golden indicator for gender mainstreaming in rural water interventions is “the % of water and sanitation committees with at least one woman holding key position”. Key positions on WSCs include those of Chairperson, Vice Chairperson, Secretary and Treasurer. Data from MWE’s Water Supply Data Base from 111 districts indicates that 84% of water sources have women occupying key positions. This indicates a slight increase from 83% reported last year, but falls short of the targeted 95%.
4.4 Challenges and Recommendations
The main challenge is that the sub-sector has insufficient funds to accelerate water supply and sanitation coverage in the water stressed areas due to high investment requirements. The current rural water subsector access of 65% is short by 12% against a target of 77% by 2015.
As a result of budget cuts during the period of FU 2014/15, MWE’s Rural Water Supply and Sanitation Department carried forward un-cleared bills from service providers amounting to a tune of UGX 8bn in the FY 2015/16, which is going to distort the planned outputs.
The depreciation of the shilling against the dollar shall greatly affect the available departmental budget and outputs. MWE is implementing contracts in dollars amounting to US$ 4.1million (construction of solar powered mini-piped water schemes in rural areas).
Capacity gaps within the District Local Governments lead to underutilisation of the Grant; the capacity gaps are a result of high staff turnover in DLGs and creation of new districts.
It is a requirement that prior to undertaking geophysical siting of a water source (borehole or shallow well), a sanitation baseline survey is undertaken including assessing vulnerability of the proposed area to contamination resulting from flooding, proximity to latrines/toilets, burial grounds, kraals etc. In recent times, this survey is not being adhered to, and in a few cases, communities have even established developments that result into pollution of the water source close to the existing water sources, thereby compromising the quality. The following recommendations can be made:
x It is apparent that with additional financing, functionality of rural water facilities can be improved to reach the target of 90-100% functionality. MWE needs to continue with the rehabilitation program for the next three years and will urge the local government to invest up to 13% of the grant in rehabilitation.
x Continued Technical Support to the District Local Governments is required to minimize the capacity gaps in planning, budgeting, procurement, implementation and O&M of water facilities.
x The dissemination of ATC’s research for possible adoption should be stepped up. x In line with Vision 20140, the rural water subsector should increasingly invest more resources in higher
level technologies aiming at supplying over 50% of population through piped water schemes by 2040. x The sector needs to lobby for increased funding to rural water supplies, to meet the funding gap to
accelerate rural water coverage. x Multiple approaches should be applied to ensure a water source in every village i.e. large gravity flow
schemes, boreholes, springs, rainwater harvesting, self-supply etc. x Old Gravity Flow Schemes need to be rehabilitated and expanded to enhance schemes’ capacity and
improve reliability. x Investments in solar-powered mini piped water schemes using high-yielding existing and new
boreholes will improve the service levels and reduce congestion on overcrowded water points. x To improve the performance of ATC, investments in research laboratory infrastructure, establishment
of adequate human resource capacity that matches the demand, and an increase of the annual financial resources allocation for ATC activities will be required.
x On the issue of water quality, user communities should be encouraged to set by-laws that prohibit the construction of facilities within a given radius from the constructed sources. This is a campaign that the MWE should take on, to safe guard both the existing and new sources.

Uganda Water and Environment Sector Performance Report 2015
41
5 URBAN WATER SUPPLY
5.1 Introduction and Background
5.1.1 Urban Centres in Uganda and Urbanisation
The sector performance report uses the current Uganda Bureau of Statistics (UBOS) definition for the term “urban”. The National Population and Housing Census 201416 defined urban centres to include gazetted urban centres (Capital City (CC), Municipalities (M), Town Councils (TC) and Town Boards (TB)). According to the 2014 Census, Uganda has a total of 197 urban centres. Unfortunately, this total number of Urban Centres as well as the urban population of 2014 excludes population enumerated in Town Boards. Approximately 18 % of the estimated 34.86 million people in Uganda live in urban centres. Table 5.1 summarises the population figures.
Table 5.1: Total population figures in urban centres Urban Centre No. Population Capital City 1 1,516,210 Municipalities 22 1,727,206 Town Councils 174 3,149,335 Total 197 6,392,751 Town Boards Not available Not available RGC Not available Not available
The period 1991 – 2015 saw a rapid increase in the urban population, more than doubling from 2.92 million to 6.39 million, an average increase of more than 6.5 % per annum. This increase is partly because of natural population increase (3.0% between 2002 and 2014), an increase in the number of urban centres from 75 in 2002 to 197 in 2014, and expansion in the geographical area of some urban centres.
Considerable investments in urban infrastructure are therefore required to improve the access to water and sanitation services at the current rate of urbanisation.
5.1.2 Water Supply, and Operation of systems in all Urban Centres in Uganda
Out of 197 urban centres, 7717 are managed by NWSC, leaving 120 under the responsibility of the Urban Water and Sewerage Department (UWSD) of the Directorate of Water Development (DWD). 76 Urban Centres have a piped water supply scheme managed by a Private Operator, the Town Council and/or an individual Scheme Operator or the community itself. 6 Urban Centres are under construction and 34 have no piped water supply. Many of the latter ones, however are being designed and implemented by WSDFs. The same information is unfortunately not available for TBs and RGCs.
16 Republic of Uganda (November 2014): National Population and Housing Census, Provisional results, Revised Edition. 17 This figure does not correspond to the 110 towns reported by NWSC in Section 5.1, which may be related to take-over dates not coinciding with the reporting period, and/or differences between town areas as defined by NWSC, and towns as defined by MWE. Harmonised figures will be provided in the online version. A discussion on these variations is included in Chapter 15.

Uganda Water and Environment Sector Performance Report 2015
42
Figure 5.1: No. of Urban Centres with status and management type of existing schemes ( National Water and Sewerage Cooperation (NWSC), Private Operator (PO), Town Council and/or Scheme Operator or similar arrangement (TC/SO), community based management or similar arrangement (community), no information about existence of scheme and management (no information), under construction (under construction), no piped water supply scheme (no water))
Taking into account the size of the urban centres, the picture varies from the above one. Comparing the percentages of population supplied by management type shows that NWSC is serving more than three quarters of the total Urban Population. Only 16% of the urban population are covered by schemes run by Private Operators or scheme operators. 6% are going to be served with piped water in the near future.
Figure 5.2: Percentage of urban population supplied by management type (National Water and Sewerage Cooperation (NWSC), Private Operator (PO), Town Council and/or Scheme Operator or similar arrangement (TC/SO), community based management or similar arrangement (community), no information about existence of scheme and management (no information), under construction (under construction), no piped water supply scheme (no water))

Uganda Water and Environment Sector Performance Report 2015
43
5.2 Water Supply in Towns Managed by National Water and Sewerage Corporation
The NWSC geographical coverage has increased from 66 town areas on 30th June 2014 to 110 town areas on 30th June 2015. The broad aim of the transfer is to increase synergies and achieve improved performance based of NWSC’s expertise in management of water supply in urban towns.
The transfer of these towns translates into a target population within the municipal boundaries of approximately 6 million people.
5.2.1 NWSC Tariff Structure FY 2014/15
NWSC implements a uniform tariff structure across all its towns to ensure equity in pricing. Table 5.2 shows the NWSC tariff implemented for the various consumer categories during the financial year 2014/15. The tariff structure includes a subsidy across various consumer categories and across areas.
Table 5.2 NWSC Tariff Structure FY 2014/15 (Without VAT)
Customer Category Water tariff 2013/14
Water Tariff 2014/15
Tariff per 20 Litre Jerrycan
Sewerage Tariff*
[UGX/m3] Public Standpipe 1,236 1,323 26 n/a Domestic 1,912 2,046 41 1,535 Institutions / Government 2,353 2,518 50 2,518 Commercial <500 m3/month 2,887 3,089 62 3,089 Commercial >500-1500 m3/month 2,887 3,089 62 3,089 Commercial >1500 m3/month 2,307 2,468 49 2,468 Average Commercial 2,462 2,634 53 - Average Water Tariff 2,115 2,263 45 - Sewer tariff is 75% of the water tariff for domestic use and 100% of the water tariff for other categories of customers. Sewerage is not billed in isolation; it is based on volume of water consumed.
5.2.2 Unit Cost of Water Production in FY 2014/15 in Towns Supplied by NWSC
The unit cost of production increased by 5% from UGX 1,778 per cubic meter to UGX 1,866 per cubic meter. The increase in per unit cost is mainly attributed to the high cost of operation in some of the new towns taken over in the financial year under review, and the unfavourable macro-economic dynamics such as inflation and depreciating exchange rate that escalate the input costs. Figure 5.3 shows the increasing trend of unit costs of production from FY 2010/11 to FY 2014/15.
Figure 5.3 Annual trend of NWSC’s unit cost of production for the past Five Years
16381656 1671
1778
1866
1600
1650
1700
1750
1800
1850
1900
1950
2000
2010/11 2011/12 2012/13 2013/14 2014/15
Uni
t Cos
t (Sh
s)

Uganda Water and Environment Sector Performance Report 2015
44
Figure 5.4 NWSC regional unit cost of production for the FY 2014/15
5.2.3 NWSC Internal Strategies
During the financial year 2014/15, the management of the NWSC implemented the following strategic activities aimed at improving service delivery:
(a) The Infrastructure Service Delivery Plan (ISDP) 2014-2015
This programme entails the extension of water and sewer mains aimed at increasing accessibility to water and sewerage services in all NWSC Operational Areas. A total of 1,448 kms of water mains and 38.2 kms of sewer mains were extended during the review period. This represents an increase of 208% and 128% respectively over the previous year.
(b) Water Supply Stabilisation Plans (WSSP)
The programme covered the installation of reservoir tanks, generators, boosters and standby pumps with the aim of improving water supply reliability. A number of NWSC production units were refurbished and this stabilised water supply in the various Operational Areas.
(c) Stakeholder Management
Cognisant of the need to manage stakeholder expectations for effective service delivery, NWSC undertook various stakeholder engagement programmes18. These programmes were intended to increase stakeholder awareness and buy-in of NWSC activities, and increase customer loyalty. The programmes were executed through various channels including: radio talk shows, community meetings, TV documentaries, publications in the newspapers and magazines, water barazas, and social media interactions.
(d) NRW, Suppressed Accounts and Arrears Reduction Programs by Areas
During the period under review, various programs19 were implemented aimed at reducing non-revenue water, suppressed accounts and arrears. These programs have gone a long way in combatting illegal water usage, and consequently facilitated the reduced water losses from 33.7% to 31.2%.
18 WACOCO (Water Community Communication Clubs), SPOTLIGHT (Special care to our customers, Please the customer, Outstanding service provision, Loyalty of NWSC staff, Integrity of NWSC staff, Goal congruence, Honesty staff and Team work), and SWAS (School Water And Sanitation) clubs
19 Water Loss Prevention Programmes in the various Areas of Operation such as SNARP in Jinja, One Billion Sprint in Mbarara, PURGE in Mbale and WALOP (Water Loss Prevention) in Kampala.
0
500
1,000
1,500
2,000
2,500
3,000
0
20,000,000
40,000,000
60,000,000
80,000,000
100,000,000
120,000,000
Kampala Central Northern Western
Uni
t Cos
t of P
rodn
(UG
Xg S
hs)
Wat
er P
rodn
m3
& E
xp (U
GX
000)
Expenditure Production m3 Unit cost

Uganda Water and Environment Sector Performance Report 2015
45
In addition, specific programmes20 were implemented to enforce the customer credit limit of a one-month bill; the program is hinged on an incentive framework that targets a collection ratio of 103% for Areas.
(e) Energy Optimisation Programme
Given the escalating operational costs, partly driven by rocketing energy costs, management embarked on an energy reduction programme. This entailed energy-use monitoring, energy audits, water accounting and water loss reduction efforts. The major aim of the programme was to reduce operation costs and consequently apply these savings towards infrastructure upgrades. Energy costs reduced by 2% from 24% of operating costs as at June 2014, to 22% as at June 2015.
(f) Pro-Poor Strategy
NWSC installed 924 pro-poor connections. These are subsidised connections aimed at enabling the urban poor population to access clean water services at an affordable cost.
(g) Information Technology Innovations
During the FY 2014/15, the NWSC developed and rolled out a new billing system to all its Operational Areas, revamped the NWSC website, created the Mobile Office (implemented by use of Skype and WhatsApp applications), and developed the NWSC Mobile Application which has been uploaded on Google play store for easy download and access by all customers. All these applications are intended to increase efficiency and effectiveness at work through the ease of communication and accessibility to information.
(h) Performance, Autonomy & Creativity Enhancement (PACE)
NWSC continued with implementation of PACE within the Internally Delegated Area Management (IDAMC) framework. PACE is operationalised through Performance Improvement Programs (PIPs) that are aligned to five critical thematic areas of intervention: increasing revenue growth, asset management efficiency, increasing service coverage, cost optimisation, and stakeholder management.
5.2.4 Projects implemented by NWSC
The following section gives the status of projects implemented by the NWSC in the FY 2014/15:
x Kampala Water Lake Victoria WatSan Project: the project involves the rehabilitation of Gaba 1 & II treatment plants, and a new transmission mains from Gaba to Namasuba with the major aim of improving water supply reliability in the surrounding areas. By the end of the FY 2014/15, construction of the four reservoir tanks at Namasuba was almost complete and approximately 6 kms (63%) of the 9.6 kms of the Gaba-Namasuba transmission mains had been laid.
x Lake Victoria Protection Project – Nakivubo – Kinawataka Sewer Project: the project is part of the Kampala Sanitation Programme, aimed at ensuring improvements in urban hygiene, sanitation and protection of Kampala’s natural environment. It involves the construction of the Nakivubo waste water treatment plant, Kinawataka pre-treatment and pumping station, pumping mains from Kinawataka Sewerage System to Nakivubo Sewerage System, and laying a trunk sewer line of 24km and construction of feeders to the trunk sewer line of 5.8km. Other associated works include manholes and tie-in works. By the end of the FY 2014/15, civil works for administration/laboratory building were finalised, 3.4 km of sewer pipes have been laid and 79 manholes have been installed: 53 manholes in the Kinawataka sewer network and 26 along Nakivubo trunk sewer.
x New Soroti Intake Project: this project was developed to replace the old intake for Soroti water supply system that was washed away during the October-November Teso floods of 2010. It involves construction of the intake structure, construction of murram access road, and installation of 125m DN 300mm delivery main. Excavation at site for the pump house and sump is almost complete and the bell mouth was installed.
20 Arrears Wipe-out Campaign (AWOC) and Suppressed Accounts Reduction Programme (SARP)

Uganda Water and Environment Sector Performance Report 2015
46
x Buloba Water Supply Project: aimed at extending and improving water supply to Buloba and neighbouring areas, it involves the construction of reservoirs at Nakabugo and Buloba, construction of Booster station at Bulenga TC, and laying of 9.48 km transmission mains and 31.44 km distribution network. The project was completed and handed over to Kampala Water (NWSC). By the end of June 2015, 245 new connections were made out of 500 planned connections under the new connection campaign, a 49% achievement against the project target.
x Kako and Bushenyi water supply projects: the project involves extending water supply to Kako village in Masaka, and developing a bigger water production plant for Bushenyi Area. The projects were completed and officially commissioned by His Excellency the President.
x Water Management and Development Project Arua: this project involves rehabilitation of the water treatment plant, development of 6 boreholes, upgrading and extension of the existing water network, construction of a sewer network for the town, construction of 2 sets of sewerage ponds, and provision of water and sanitation services in informal settlements. By the end of the FY 2014/15, compensation of Project Affected Persons was almost complete, while works on the site sections handed over to the contractor commenced.
x Integrated Programme to Improve Living Conditions in Gulu (IPILC): The project intends to improve living conditions in Gulu through the improvement of water supply in Gulu. The project focuses on the development of additional raw water sources, water treatment and bulk transfer, and service provision to the urban poor. Three boreholes were successfully drilled (phase I) and handed over to the community. The procurement process has started for Phase II.
x Kapeeka Water Supply Project: the project is aimed at improving water supply reliability in Kapeeka town and the surrounding areas through the development of a new water supply system. The contracts for construction of the water treatment plant, intake and reservoir were awarded to the respective contractors. The topographical survey for the transmission and distribution mains is in progress, on the basis of which tender documents for the works will be prepared.
x Sewage Treatment Plants for Fort Portal & Kisoro Towns: the project is addressing wastewater disposal challenges in the towns of Kisoro and Fort Portal. Compact water and sewerage treatment plants have been installed in Kasese and Fort Portal, and preparations for both the sewerage and water treatment plants are on-going.
5.2.5 Management and Performance of NWSC’s Town Water Supply Schemes
(a) Financial Performance (provisional)
The NWSC’s provisional turnover (subject to final audit by the Auditor General) for FY 2014/15 is set out in the next table. The profit will be ploughed back in form of investment projects, extending/improving the pipe network and electromechanical equipment etc. Table 5.3 summarises the NWSC provisional financial performance during the FY 2014/15.
Table 5.3 NWSC Provisional financial performance 2014/15, in UGX Billion
Source Actual Budget Variance Var % Revenue 218.5 221.1 (2.8) (1.3) Operating Expenditure 185.8 175.1 (9.6) (5.5) Operating Profit Before Depreciation 32.6 45.2 (12.4) (27.4) NWSC Contribution to Projects 5.1 15.9 (10.7) (67.3) Government of Uganda Funding 23.3 37.4 (14.1) (37.7) Other Donor Contributions 61.0 129.3 (68.3) (52.8) Total Project Budget Performance 89.5 182.6 (93.1) (50.9) Capital Works e.g. Land, civil structures/buildings, pipe network, and electromechanical equipment
Note: Variance, and Variance Percentage is favourable unless in brackets

Uganda Water and Environment Sector Performance Report 2015
47
(b) NWSC Performance Analysis using Performance Contract Indicators
During the financial year 2014/15 , NWSC surpassed most of the key performance targets save for net profit before tax, staff costs and numbers, debt age as well as high non-revenue water in other areas outside Kampala, which is at 27% against the target of 21%. The lower-than-anticipated net profit is attributed to transfer of over 44 new towns, many of which were not yet able to break-even. The high staff costs are also attributed to transfer of new towns and resultant hiring of new staff with the necessary tools. The high level of NRW is mainly attributable to the old network, especially in Kampala. The high debt age arose from accumulation of arrears especially with the Government institutions, of which the debt age is about 20 months as compared to the domestic category of 1.9 months.
Kampala was able to make steady reductions in NRW during the period under review, from 36.9% to 33.3%. The Central Region also registered an improvement with a decrease of 4% from 34% to 30.4%, mainly due to a significant turnaround in Jinja. However, the rest of the areas registered an increase in NRW. The Eastern/Northern Region and Western/ South-western Region registered an increase in water losses of 7% and 5% respectively, a continuation of the recent rising trend.
The full annualised impact on NRW of the 44 towns/areas taken over will only emerge around December 2015, when most of the new towns will have been operating for 12 months. In addition to ageing infrastructure, the NWSC has also had to cope with the impact of urbanisation and high levels of population growth. New capital works, enhanced asset management, installation of system water meters, monitoring suppressed connections and other initiatives all have a role to play; some of these are already being addressed.
(c) New water connections and extensions
As at 30th June 2015, the total NWSC connection base was 317,292 connections, of which 90% were active. Table 5.4 shows the status of water connections for the FY 2013/14 and 2014/15.
Table 5.4 Status of water connections as at June 2015
Area 2012/13 2013/14 2014/15
Kampala Metropolitan
Total No of Connections 186,240 200,775 216,760
Number of Active 165,150 179,905 198,187
Percentage Inactive 11.3% 10.4% 8.6%
Number of Metered 186,154 200,684 216,760
Meter Coverage % 100.0% 100.0% 100.0%
New Connections 13,152 15,324 14,982
Central Region Total No of Connections 57,915 72,073 88,033
Number of Active 51,432 65,624 76,960
Percentage Inactive 11.2% 8.9% 12.6%
Number of Metered 57,873 71,641 88,033
Meter Coverage % 99.9% 99.4% 100.0%
New Connections 3,993
6,106 7,694
Northern & Eastern Region
Total No of Connections 36,341 46,222 55,118
Number of Active 34,107 37,906 44,538
Percentage Inactive 6.1% 18.0% 19.2%
Number of Metered 36,341 45,901 54,815

Uganda Water and Environment Sector Performance Report 2015
48
Area 2012/13 2013/14 2014/15
Meter Coverage % 100.0% 99.3% 99.5%
New Connections 2005 3,341 5,026
Western & Southern Region Total No of Connections 36,796 47,260 58,120
Number of Active 34,729 43,470 52,504
Percentage Inactive 5.6% 8.0% 9.7%
Number of Metered 36,753 46,411 58,120
Meter Coverage % 99.9% 98.2% 100.0%
New Connections 2084 3,297 6,280
NWSC Overall
Total No of Connections 317,292 366,330 418,031
Number of Active 285,418 326,905 372,189
Percentage Inactive 10.0% 10.8% 11.0%
Number of Metered 317,121 364,637 417,728
Meter Coverage % 99.9% 99.5% 99.9%
New Connections 21,234 28,068 33,982
During the FY 2014/15, the average number of new connections was 2,832 per month totalling to 33,982. This reflects a percentage growth of 21% from the previous year’s monthly average of 2,339 new connections.
Figure 5.3 Annual trend of new connections, FY 12/13-14/15
A total of 1,448 km of mains was extended during the FY 2014/15 against the annual target of 1,262 km compared to 470.3 km extended in the previous financial year which represents a growth of 268%. The high performance is attributed to increased demand for water services in the respective areas, takeover of new towns and also the implementation of the Infrastructure Service Delivery Plan.
(d) Gender balance in staffing
The NWSC gives due credence to gender issues when recruiting staff. The NWSC has seven Directorates, and four of these Directorates are headed by women. Overall, 28% of the total staff in NWSC (2,752) are female. This represents a 2% increase from 26% in the FY 2013/14. Table 5.5 gives the status of staff in each region as at 30th June 2015. Staff Productivity is the ratio of staff: 1,000 connections.
0
5,000
10,000
15,000
20,000
25,000
30,000
35,000
Kampala Central NE SW all
New
Con
nect
ions
FY2012/13 FY2013/14 FY2015/15

Uganda Water and Environment Sector Performance Report 2015
49
Table 5.5 Status of staff in each region, 30th June 2015
Region Male Female % of Female Total Staff Staff Productivity Kampala 687 242 26% 929 4.0 Central 387 156 29% 543 6.0 Northern & Eastern 302 85 22% 387 7.0 Western & Southern 342 115 25% 457 8.0 Total (Excluding HQ) 1,718 598 26% 2,316 6.0 Total (Including HQ) 1,978 774 28% 2,752 6.0
(e) Pro-Poor Water and Sanitation Activities
The NWSC undertakes pro-poor strategies aimed at improving the lives of the people living in poor settlements in the urban areas served by NWSC. One way of reaching out to the poor is through installation of Public Stand Posts (PSPs) with a subsidised and affordable tariff.
During the FY 2014/15, the NWSC installed 924 new pro-poor connections in form of public standpipes (PSPs), bringing the total number of PSPs to 9,082 connections.
Table 5.6 Status of Public Stand Pipes (PSPs) per region for the FY 2012/13-14/15
Area 2012/13 2013/14 2014/15 Kampala Metropolitan New PSPs/Kiosks 40 757 43 Total Active SPs/Kiosks 3,767 3,470 3,322 Total PSPs/Kiosks 5,210 4,887
4,663 4,663
Central Region New PSPs/Kiosks 36 10 243 Total Active PSPs/Kiosks 938 1,111 1,381 Total PSPs/Kiosks 1,083 1273 1,749 Northern & Eastern Region New PSPs/Kiosks 7 69 278 Total Active PSPs/Kiosks 918 922 1,012 Total PSPs/Kiosks 1026 1,155 1,628 Western & South-western Region New PSPs/Kiosks 12 64 360 Total Active PSPs/Kiosks 320 552 879 Total PSPs/Kiosks 373 691 1,042 NWSC Overall New PSPs/Kiosks 88 831 646 Total Active PSPs/Kiosks 5,943 6,055 6,594 Total PSPs/Kiosks 7,692 8,006 9,082
5.2.6 Status and Trends of Key Indicators
Golden Indicator No. 1: Access to an Improved Water Source
NWSC serves a population of approximately 4 million people against a target of 5.5 million people. This translates into water service coverage of about 76%21. The annual trend of NWSC service coverage has gradually declined over the years; this is attributed to the takeover of new towns (44 towns) whose number of connections is low and covering a limited area. This in effect lowers the service coverage given the increase in
21 Service Coverage is a function of target population (established from UBOS figures per administrative areas) and population served (based on total number of connections and average number of people served per connection category (which is estimated by the NWSC and this varies from areas to area).

Uganda Water and Environment Sector Performance Report 2015
50
target population is not matched by an increase in connectivity in the short run. The growth in service coverage is influenced by the urban population growth. Table 5.7 shows the NWSC Service Coverage by end of June 2015.
Table 5.7 NWSC’s water supply coverage trends over last five financial years
Indicator 30 June 2011 30 June 2012 30 June 2013 30 June 2014 30 June 2015 Target Population 3,239,370 3,377,240 3,838,004 4,421,084 5,281,118 Population Served 2,426,502 2,614,090 2,986,773 3,382,050 4,011,640 % Population Served 74.9% 77.4% 77.8% 76.5% 76.0% Number of Service Areas 20 20 28 66 110
It should however be noted that NWSC service coverage extends beyond the municipal boundaries. This indicates the need to redefine NWSC’s service coverage taking into consideration the stretched boundaries and areas of jurisdiction.
Table 5.8 Overall NWSC performance 2013-2015
Indicator Actual June 2013
Actual June 2014
Actual June 2015
Target June 2015
Variance June 2015
% Variance
Service Coverage (%) 78 77 76 79 (3) (4%) New Connections (number) 21,637 28,068 33,982 27,932 6,050 22% Total Connections (number) 317,292 368,313 418,031 405,140 12,891 3% Meter Coverage (%) 99.9 99.5 99.9 100.0 (0.1) 0% Mains Extensions (km) 85.8 470.3 1,447.5 1,261.7 185.8 15% Water Production (m3 millions) 87.3 94.0 99.6 96.7 2.9 3% Non-Revenue Water (%) NWSC 33.6 33.7 31.2 31.5 (0.3) (1%) NRW (%) Kampala 38.0 37.0 33.3 36 (2.7) (8%) NRW (%) Rest 23.0 26.2 26.9 21 5.9 28% Staff per 1,000 Connections 6 5 6 5 1 20% Turnover UGX (billions) 170.4 183.4 218.5 221.1 (2.6) (1%) Collections/Billing Ratio (%) 96 96 105 109 (4) (4%)
Note: Target figures are from the Revised Budget 2014/15; Variance, Variance Percentage favourable unless in brackets.
Golden Indicator No. 5: Water Quality
(a) The indicator for drinking water quality is defined as “compliance with National Standards for Drinking (potable) water 2008”. During the Financial Year 2014/15, 99.2% of the water samples (in total 60,471 samples, from 8,531 in the previous financial year) from all Areas complied with the National standards for potable water, with regard to bacteriological quality, exceeding the WHO and National standard, of 97% and 95% respectively. On average, the overall compliance of both physio-chemical and bacteriological parameters to the National standards was 98.7%, meeting the annual target of 98%.
(b) The indicator for waste water quality is defined as “compliance with all 54 Effluent discharge Parameters”. With regard to waste water, compliance is low. The Biological Oxygen Demand (BOD) and Total Suspended Solids (TSS) compliance to National standards was 40.2%, and 41.9 %, respectively. A total of 3,192 waste water samples were tested in all regions, which represented 116.6% of the set target of 2,736 for waste water. Out of the 110 towns, 16 towns operate centralised sewerage systems collecting, treating and discharging effluent to the environment.
A number of strategies were implemented that contributed to the improvement in the overall water quality performance. These included: installation of chlorine dozers in all Areas, use of a newly developed chlorine chart readers for all Areas to ensure sufficient chlorine doses on the network, adequate quality control and monitoring, adherence to O&M regimes, and training of the relevant staff. With regard to waste water, a task force has been constituted, to help with increasing compliance of waste water effluent, routine de-sludging and maintenance of ponds to better the effluent quality, and the new Lubigi plant has decreased the load on waste water treatment plant in Bugolobi (Kampala).

Uganda Water and Environment Sector Performance Report 2015
51
Table 5.9 Percentage compliance with drinking water and wastewater quality standards, FY14/15
Drinking water quality
Bacteriological Quality (%) 99.2
Colour (%) 93.1
Turbidity (%) 99.2
Chlorine residual (%) 98.3
pH (%) 99.8
Electrical Conductivity (%) 100.0
Alkalinity: Total (%) 100.0
Hardness: Total (%) 100.0
Average (%) 98.7
Waste water quality BOD (%) 40.2
Total Suspended Solids (%) 41.9
Average (%) 41.1
5.2.7 Source Protection and Environmental Safeguards
The raw water sources were affected by environmental degradation due to human activities, which have affected the quantity and quality of the sources. As a result, NWSC is spending more on treatment of water. NWSC is collaborating with other stakeholders to ensure that the water sources are protected through sensitisation, community mobilisation, planting trees and also financial contributions to source protection and other environment safeguard initiatives.
5.2.8 Challenges
The following section highlights the challenges NWSC encountered during the FY 2014/15:
(i) Dry zones especially in Kampala, due to low water pressure as a result of the hilly terrain and aged pipe infrastructure.
(ii) High levels of water losses which stand at 31.2%. This is attributed to the aged pipe network, leaks and bursts, and water crimes such as illegal connections and meter vandalism.
(iii) Inadequate infrastructure to meet the increasing demand. The rising demand for water supply is as a result of the growing construction industry and increased urban population. Whereas this demand presents an opportunity to grow, the existing infrastructure cannot adequately support it.
(iv) High level of arrears. The high level of arrears is mainly attributed to accruing arrears from domestic, institutional, and commercial customer segments. See table 10 for details.
Table 5.10 Accounts Receivable in UGX (Billion), FY 2012/13-14/15
Customer Category 2012/13 2013/14 2014/15 % of Total Increase from 2013
Ministries/Government 30.0 37.7 22.3 42% (26%) Parastatals 0.4 0.4 0.2 0.4% (35%) Institutions 1.9 2.3 2.8 5% 43% Commercial 9.7 9.5 11.0 21% 13% Local Authorities 0.3 0.3 0.2 0.4% (26%) Domestic 12.6 14.5 16.7 31% 32% Foreign Missions 0.1 0.0 0.1 0.2% 30%
Total 54.9 64.8 53.3 100% (3%)
High operational costs as a result of instability in the macroeconomic environment driven by increased depreciation of the exchange rate. The energy costs that constitute over 22% of the operational costs are mainly attributed to infrastructural growth due to the takeover of new towns and the need to match the rising demand for services amidst the limited available financial resources.

Uganda Water and Environment Sector Performance Report 2015
52
Sewer network related challenges, such as encroachment on waste water treatment plants in most parts of the NWSC areas and storm water flows into sewers and stabilisation ponds, negatively impact on treatment efficiency, along with illegal dumping of industrial effluents into sewers and treatment plants, as well as vandalism of sewer components, like manhole covers, allowing in storm water. In addition, the sewer network is limited which restricts expansion.
These challenges notwithstanding, a number of interventions are being implemented to mitigate the short falls in service delivery.
5.2.9 Recommendations
NWSC shall focus on the following four Strategic Priority Areas (SPAs):
i) SPA 1: SMART Systems, Business Continuity and Infrastructure Growth: with focus on growth in infrastructure base, preservation of existing assets, efficiency in the management of the NWSC processes, and expansion in water and sewerage service delivery. In line with infrastructure growth, priority in the first quarter shall be given to the following projects:
x Kanyanya project that aims at stabilizing water supply along Gayaza road and the surrounding areas.
x Naguru Project to enhance water supply to the Naguru reservoir and thereby ensuring adequate and sufficient water supply to the major hinterlands served.
x Kapeeka aimed at ensuring sustainable supply to surroundings of Ssemuto, Kapeeka and Nakaseke. x Soroti project to restore the water intake at Awoja which was washed away in 2010 and thereby
restore its production capacity of 8000 cum/day. x Namasuba that entails the laying of 29.8 kms of DN 300 pipework to cover the areas of Ndejje,
Lubowa, Bunamwaya, Mutundwe, Seguku, Kabojja and Kinawataka. x Public stand posts to ensure that the less privileged are catered for.
ii) SPA 2: Financial Growth and Sustainability: to ensure sustainability of NWSC services through enhancing the viability of all NWSC towns, undertaking of prudent investments, and cost efficiency in the different processes. Specific focus shall be on increased connectivity on the existing mains extended while ensuring the existing commitments are adequately addressed.
iii) SPA 3: Customer and Stakeholder Delight: NWSC shall ensure continued recognition of the importance and the role customers and other stakeholders play in ensuring sustainable service delivery. In line with this, NWSC shall continue with stakeholder engagement through various platforms including the social media platform, water barazas, SWAS clubs, WACOCO.
iv) SPA 4: Productivity and Capacity Development: NWSC shall continue with capacity enhancement programmes across all levels. However, much emphasis will be put on vocational skills among the relevant staff to ensure efficiency and effectiveness in service delivery.
Uganda Water and Environment Sector Performance Report 2015
53
5.3 Water Supply in Towns managed by MWE/DWD
5.3.1 Planning and Development of Water Supply and Sanitation Interventions in STs and RGCs
Water supply and sanitation interventions target Town Councils and Town Boards as well as Rural Growth Centres (RGCs) of above 500 people22.
The four regional Water and Sanitation Development Facilities (WSDFs) remain the UWSS Department´s standard implementation mechanism for new water and sanitation interventions in STs/RGCs23. To bring services close to the target communities and to ensure equity while decentralising they are established as four regional Branches: WSDF North (Lira), WSDF Centre (Wakiso), WSDF South-West (Mbarara) and WSDF East (Mbale). All WSDF Branches have been delegated with procurement and accounting functions. Their operations are guided by an approved Operations Manual (2014). The WSDFs are close to the Local Governments, and are in an ideal situation to support the Water Authorities and their Water Supply and Sanitation Boards (WSSBs) in the management and provision of water and sanitation services.
Water supply schemes completed by the WSDF Branches, including also the WSDF’s locations and districts they support, are listed in Annex 9.
Other investments for urban water and sanitation, carried out through stand-alone projects implemented by MWE are:
(i) Lake Victoria Water & Sanitation (LVWATSAN) Project Phase II: November 2011 to December 2015.
(ii) Water Management & Development Project (WMDP): June 2012 to December 2018
(iii) Energy for Rural Transformation (ERT) Phase II: April 2009 to June 2016.
Physical performance: Under WSDFs during the FY 2014/15, twenty five (25) new piped water supply and sanitation systems were technically commissioned. 397,952 people in ST/RGCs are benefitting from the interventions, of which 242,703 are in TCs/TBs (contributing to an increase in urban coverage) and 149,049 people in RGCs (contributing to an increase in rural coverage). Construction of water supply and sanitation systems is on-going in 22 STs/RGCs. A total of 14 STs/RGCs are ready to be implemented with detailed designs and tender documents available and approved by MWE’s Design Review Committee. Under the LVWATSAN project, Mayuge town water supply was completed and is serving 16,104 beneficiaries. The total additional population served in Urban Centres, TCs and TBs, is hence 259,431.
One of the strategies to serve urban poor is the provision of public stand posts and kiosks. The Urban Water and Sewerage Department served an additional 33,600 poor people through construction of 168 public stand posts and kiosks. The performance excludes information from NWSC.
A more detailed listing of the outputs achieved per constructed water supply scheme is provided in Annex 10.
22 Reporting on RGCs’ water supply and sanitation coverage is done under chapter 5 – rural water supply and chapter 8 - rural sanitation and hygiene respectively.
23 The four WSDFs are supported by different Development Partners through the Joint Partnership Fund (JPF), a basket fund within the framework of the Joint Water and Environment Sector Support Programme (JWESSP 2013-2018). The support to WSDF-SW and WSDF-E under the EU MDG Initiative is managed under a delegation arrangement by the Austrian Development Agency (ADA). The Government of Germany is supporting WSDF-N and E through its German Development Bank KfW, and the African Development Bank is supporting WSDF-C.

Uganda Water and Environment Sector Performance Report 2015
54
5.3.2 Status and Trends of Key Indicators
Golden Indicator No. 1: Access to an Improved Water Source
The terms access and coverage refer to the percentage of people with access to an improved water source. The golden indicator is “% of people within 200m of an improved water source”.
The urban population in the 197 urban centres in Uganda is estimated at 6.39 million24. These towns comprise a total of 77 Centres served by piped water by NWSC (population 4.90 million), and 119 urban centres under DWD (85 of which are served with piped water or are under construction, 32 to be served in the near future), with a population of about 1.49 million. As a result of schemes being handed over to NWSC, the population of towns under NWSC has increased from 4.32 to 4.90 million, whereas the population in STs under DWD has decreased from 2.23 to 1.49 million (see also footnote 17 in section 5.2.2).
Access to an improved water source in urban areas has remained at 73%. This is due to the fact that urbanisation is partly outstripping the achievements made. It also appears that in the past there was a tendency towards overestimating progress by (i) including achievements in Rural Centres in the urban performance figure, (ii) non-standardised ways of establishing numbers of additional population served at the end of a project, and (iii) generally various areas where double-counting occurred (e.g. counting population of rehabilitations as additionally served population).
For calculation of the urban access indicator in FY 2014/15, assumptions as outlined in the table blow were made. This became necessary because data clearly distinguishing between urban and rural centres was not readily available, in detail (i) total population figures in Town Boards were not included in Census 2014 report, and (ii) segregated urban/rural data for old and handed-over NWSC schemes was not available. There is hence need for a baseline and revised standard measuring system for estimating urban coverage.
Table 5.11 Access to improved water supply in urban areas; FY 2010/11-2014/15
Financial year 10/11 11/12 12/13 13/14 14/15 Comment
Served by NWSC
Total Population
3,239,370 3,377,240 3,838,004 4,421,084 4,899,489 Source of population figure: Census 2014, total of Urban Centres with NWSC schemes, excluding TBs and RGCs
CC, M, TCs Population Served
2,426,502 2,614,090 2,986,773 3,382,050 3,723,612 Calculated based on coverage reported by NWSC
(excluding TBs and RGCs)
% Coverage 75% 77% 78% 77% 76% Average rural and urban coverage reported by NWSC
Served by MWE / DWD
Total Population
2,378,544 2,492,714 2,612,364 2,228,771 2,069,559 Deducting NWSC figure from total figure
24 Republic of Uganda (November 2014): National Population and Housing Census, Provisional results, Revised Edition.

Uganda Water and Environment Sector Performance Report 2015
55
Financial year 10/11 11/12 12/13 13/14 14/15 Comment
TCs and TBs Population Served
1,284,405 1,423,340 1,518,982 1,458,360 1,382,767 Based on last year’s figure, add achievement WSDFs + LVWATSAN (258,807) in TCs/TBs, deduct served pop. in 44 schemes handed over to NWSC, assuming an average total population of 10,000, applying reported coverage.
(excluding RGCs)
% Coverage 54% 57% 58% 65% 67%
Total Total Population
5,617,914 5,869,954 6,450,368 6,649,855 6,969,048 Based on last year’s figure, assuming an annual urban growth rate of 4.8%
Urban Population Served
3,710,907 4,037,430 4,505,755 4,840,410 5,106,379
% Coverage 66% 69% 70% 73% 73%
Way forward: WSDFs have developed a new Guideline for Conducting Baseline and Completion Surveys (June 2015) which is going to harmonise among others the way to establish no. of additional population served. NWSC is planning a baseline study. Furthermore, the Umbrella Organisations (UOs) are planning an inventory of all existing piped schemes to feed into the new Utility Performance Management and Information System (UPMIS). Reporting on extensions (additional population served through new connections) implemented by UOs and Water Authorities will be streamlined through the new UPMIS. These joint efforts will lead to a situation where the Access indicator for the next reporting period will be based on a much improved data set.
Golden Indicator No. 3: per capita investment cost
The golden indicator for per capita cost for urban water supply is “the average cost per beneficiary of new water and sanitation schemes”.
The average per capita investment cost for the completed 26 towns’ water supply systems in FY 2014/15, serving an additional population of 258,807 people, is US$ 45, which is significantly less than the target per capita investment cost of US$ 75. Per capita investment cost remained in the same range as compared to last year (US$ 46).

Uganda Water and Environment Sector Performance Report 2015
56
Figure 5.5 Trend in per capita investment costs for Small Towns and Rural Growth Centers
The majority of completed schemes (17) had per capita investment costs below US$ 50; a total of 6 schemes were in the range between US$ 50 and 75, and only three were beyond US$ 75 per capita investment costs. The reasons are summarised in Table 5.12. In general, it needs to be accepted that unfavourable conditions such as remote location, low ground water potential, or no power grid available etc., require interventions with higher per capita investment cost.
Table 5.12 Per capita cost ranges of new town water supplies, including explanation Range of unit costs
List of ST/RGCs falling under that range (list starting with the lowest)
Explanation
< 50 USD 17 Kapchorwa, Lyantonde Ii, Matany, Matete, Paidha, Rushere, Omugo, Bukomansimbi, Kabango-Budongo, Namalu, Rwenkobwa, Ntuusi, Muhanga, Kinoni, Ibuje, Irundu, Purong.
x Extensions within the existing scheme capacity serving additional population and in some cases combined with rehabilitation of parts of the scheme
x Gravity flow schemes or schemes using a spring a water source
50-75 USD 6 Kakumiro, Nkoni, Kinogozi, Najjembe, Mayuge, Kiganda
n/a
> 75 USD (max. should be below 120 USD)
3 Ochero, Suam, Agweng x High costs for water source development in areas where the groundwater table is low, and/or the water source is far and long distance transmission mains need to be constructed, and scattered enrooted populations need to be served (e.g. Agweng).
x Remote location of the project town and therefore high costs for material etc. (e.g. Suam)
The per capita costs are grossely underestimated. Ideally per capita investment costs include all costs that are attributable to a project based on Navision (construction and design as well as software costs) divided by the design population. Estimations where one contract includes several projects should be permissible. It is suggested adopting this clear definition in next FY reporting and further to clearly distinguish between new schemes, extensions and rehabilitations.
Golden Indicator No. 9: Management
The golden indicator for management for urban water supply is “% of water points with actively functioning water and sanitation boards”. Based on the 120 water supply schemes for the FY 2014/15, the indicator value stands at 78.3%, indicating an improvement from 76% in June 2014 (see also Annex 12). The improved was as a result of the increased training of the Water Authorities by the WSDFs and the Umbrella Organisations.
30405060708090
100
Per CapitaInvestment…

Uganda Water and Environment Sector Performance Report 2015
57
Increased monitoring of the management of the Water Schemes as well contributed to the shift towards guided management of the water schemes. Functionality was measured based on the indicator of no. of mandatory meeting conducted by the WSSBs.
Golden indicator No. 10: Gender Mainstreaming
The golden indicator for mainstreaming gender in urban water supply is “% of water boards with women holding key positions”. Among the WSSBs in FY 2014/15, 66.7% had women holding key positions, an improvement from 63% in the previous reporting period based on the 120 water supply schemes (see also Annex 12). The efforts to improve the functionality of the water supply schemes contributed to the improvement on gender consideration in the scheme, as new WSSBs for the improved schemes were formulated, during which gender mainstreaming was advocated.
5.3.3 Support to O&M of Water Supply Schemes
Urban Water Supply and Sewerage Department of MWE is responsible for the provision of urban water and sanitation service, including infrastructure operation and maintenance (O&M), in all urban areas outside the towns managed by the National Water and Sewerage Corporation (NWSC). In addition, it has been agreed that the Department, through its newly created Division of Support to Utility Management, supports not only urban schemes (i.e. those serving gazetted Town Councils and Town Boards) but all piped water schemes including those in rural areas.
This is a significant challenge as there are at least 950 piped water schemes outside the jurisdiction of NWSC, despite the recent handovers (see Figure 5.6). Every year, at least 20 new schemes are added to this number. Many of the existing schemes are ageing and functionality problems increase as system components reach the end of their design life. Many of the rural schemes are not yet metered and do not have adequate management structures and revenue collection, even though the rural sub-sector is establishing the same management arrangements as for small towns. Many other schemes have successfully implemented user payment for water, but the socially acceptable tariffs cover day-to-day O&M and minor repairs only, not major asset replacements or refurbishments.
Figure 5.6 Numbers of piped water systems in Uganda by management and O&M support arrangements
Uganda Water and Environment Sector Performance Report 2015
58
Uganda’s main strategy to ensure sustainable functionality of piped water infrastructure outside NWSC and the larger MWE towns is the establishment of regional Regional Umbrella Organisations (UOs) that to provide O&M support to the local Water Authorities, Water Boards and scheme operators. The first UO was established in South Western Uganda in 2001. As the model proved to be effective it was later rolled out to cover all regions of Uganda. It has been decided in FY 2014/15 that Umbrella Organisations will provide support to all piped water schemes, including those that are currently not yet members (left side of the pie chart in Figure 5.6). The collaboration of WSDFs and Umbrella Organisations is summarised on Annex 10.
The water supply and sanitation infrastructure is handed over formally to Local Governments, who are expected to form a Water Board and engage a scheme operator (a company or an individual) for day-to-day scheme operations. In reality, the local technical, managerial and financial capacities are not sufficient, in most cases, to ensure effective asset management, sufficient revenue collection and sustainable service delivery. This is where the Umbrella Organisations step in. They provide technical advice and support; help to restore functionality in emergency situations; help to plan and implement scheme extensions; provide training to local Water Boards; promote preventive maintenance and payment for water services (water metering); conduct advisory financial audits; and monitor drinking water quality through regular sampling. UOs also help overcoming financial constraints by providing expensive equipment (such as pumps and generators) on credit; running credit & savings schemes for their members; or channelling earmarked government subsidies (conditional grants) for scheme extension and rehabilitation works. UOs provide their services free of charge but do not subsidise the direct costs of day-to-day O&M which are financed by the schemes’ locally collected revenue. In the future, Umbrellas will also take on O&M tasks in faecal sludge management (to be piloted by Central Umbrella).
Currently there are six regional Umbrella Organisations, based in Kabale (South West), Kyenjojo (Mid-West), Wakiso (Centre), Lira (North), Mbale (East), and Moroto (Karamoja). The full operational establishment of the recently created Karamoja Umbrella is still underway. Annex 13 summarises the performance of each of these UOs in the period under review. It can be seen that of the 380 operational Umbrella member schemes, 361 (95%) are functional, even though many of these have some functionality problems (such as insufficient water quantity, frequent breakdowns, management issues or – less frequently – water quality issues).
However, the current resources of the Umbrella Organisations are inadequate to extend their services to all piped water schemes as planned. A typical UO has 6 to 7 professional staff, one single25 vehicle to be shared, and funding of approximately 50 million UGX per month (17,600 USD, GoU and donor funding combined). This includes the UO’s owns operational costs (salaries, transport etc.) as well as the funds available to support 100 to 16026 piped schemes in their area of intervention. A significant capital maintenance and infrastructure renewal fund would be needed to maintain the long-term functionality of existing piped water schemes. User tariffs were never meant to cover asset depreciation.
In FY 2015/16, it is planned to reorganise Umbrella Organisations as government units for O&M support, i.e. as similar deconcentrated structures as the WSDFs. Currently, UOs are constituted as associations of the local Water Boards27, a set-up that has led to misunderstanding and queries regarding their legal and institutional status. Under the new arrangement, the current Umbrella Organisations with their elected statutory bodies (General Assembly, Executive Committee) will continue to exist but permanent staff may be contracted by MWE. If resources allow, it is planned to recruit Commercial Officers to address the persisting weaknesses in business planning, revenue collection and financial management.
25 Most UOs will have a second car after completion of the ongoing procurement of four additional vehicles
26 almost 400 schemes in the South West, where many small rural gravity flow schemes are located
27 Legal form: not-for profit „Company Limited by Guarantee“

Uganda Water and Environment Sector Performance Report 2015
59
During FY 2014/15, the institutional development of the Umbrella Organisations focused on the development of an Operations Manual; training on water quality monitoring supported by the UWUPP28 project; the introduction of results-based performance reporting; and the development of the concept and procurement of a web-based Utility Performance Monitoring and Information System (UPMIS). This system will provide access to utility-related information to both the Urban Water and Sanitation, and Regulation Department. The intention is to improve regular reporting and provide an up-to-date and easily accessible overview of the situation regarding functionality, management, financial viability and asset management for each scheme. UPMIS will thus become a key tool for planning, implementing and monitoring the Umbrella’s support services and replace many of the existing paper or spreadsheet based data collection tools.
5.3.4 Source Protection and Environmental Safeguards
WSDFs made great attempts towards implementation of the DWRM Framework and Guideline for Water Source Protection (2013) and contributed to the development of the corresponding strategy for operationalising stakeholder contributions towards water source protection (DWRM, draft, June 2015). All respective WSDF activities were implemented with guidance from the Water Management Zone staff in the area.
Generally, within “Water Protection Zone 1,” the land is acquired and fenced off to ensure the highest level of protection by excluding all human and animal activities within. A minimum size of 50x50 metres is acquired as a rule in all schemes being implemented by WSDFs and LVWATSAN (26 this year). With a participatory approach trees and green cover were planted, and the communities using the completed water supply and sanitation systems were trained in the importance of, and benefits gained as a result of undertaking water sources protection. Additionally, sample forests were piloted in Dokolo and Wakiso to preserve water resources.
5.3.5 Challenges in Planning and Development and Support to Utility Management
Operation and maintenance of existing schemes by Umbrella Organisations is hampered by the following challenges:
x Insufficient funding for O&M support through Umbrella Organisations x Low awareness of need to finance O&M support and major overhaul of schemes that have outlived
their design life since both aspects were never planned to be covered by the tariff x Regional presence of the Water Utility Regulation Department (so far only South-West and North) to
allow effective regulation of performance and management contracts (for more information on the Water Utility Regulation Department is referred to Section 5.4).
x Financial management in Small Towns and Rural Growth Centers operated by Private Operators or Scheme Operators is weak (see also Box 5.1).
x Despite all community mobilisation efforts being made, timely acquisition of land by the community delays the commencement of construction in many cases; more acceptance and backing of the consequences of adhering to this community obligation is needed e.g. some flexibility in work plans to move to the next project on the approved priority list where communities are not ready for implementation.
28 Uganda Water Umbrellas Partnership Project - Strengthening Regional Umbrella Organisations for Sustainable Piped Water Services

Uganda Water and Environment Sector Performance Report 2015
60
Box 5.1 Key audit findings of private operators (POs) Local banks have found it difficult to lend to the small towns’ POs due to lack of information to assess their creditworthiness. A review carried out by World Bank in July 2015 showed some key weaknesses in the management and audit of the small towns’ water supply systems across all the small urban centres reviewed, summarised as follows: Local Water Authority/Board recommendations ► Poor management of ESCROW account: All revenues collections should be banked to the Escrow account from which the PO is paid management fees and expenses per the management contract. A standard five per cent is set aside to meet the WSSB/WA expenses and a further portion retained as an investment fund that should be available to the POs for limited rehabilitation and system expansion. The accountability of monies set aside for investment is not done and no ring-fencing of revenues is enforced. ► Non-monitoring of reporting requirements of POs: Most operators did not submit all necessary reports in respect as required by the management contract. There is no evidence of evaluation by the water board relating to follow up on performance indicators and targets when assessing the performance of the POs and no audits were carried out for some POs. Non-compliance with reporting requirements is a breach of contract. The WAs themselves do not adhere to reporting requirements: The WAs are contractually required to prepare quarterly and annual reports containing their financial statements for the reporting period and operations. There was no documentary evidence received pertaining to the audited financial statements of the water authority. The WAs should comply in submitting the relevant reports themselves to DWD. ► Asset registers do not exist or updated: There is no asset registers maintained by either the private operator or the authority. A fixed asset register should be put in place and there should be timely update of the asset register. In addition, management should keep track of assets procured by the PO, the WA or the umbrella body through assigning code for each stakeholder. Private Operator Gaps ► Absence of approved Business Plans: Some POs neither drafted nor submitted any business plan to WAs as required by the management contract. Reporting is obligatory and needs to be enforced. ► Weaknesses in reporting and financial systems. The POs use Microsoft (MS) Excel spread sheets for accounting and financial reporting and these are usually not password protected. Some basic financial statement close-out procedures such as error correction through journal voucher are not being used due to this MS Excel reporting. As part of the bidding process, POs should be required to show evidence of appropriate accounting software able to segregate WSS operations. Better still a uniform accounting package standardised for PO kind of operations could be adopted/enforced for all the small towns WSS. ► Weakness in record keeping: A number of POs did not maintain proper books of account. Some of the balances could not adequately be supported. The operators are required to keep proper records and adequate accounts and records of the transactions and affairs of the water supply scheme and they are also required to keep records that are necessary to explain the financial operations and financial position of the service provider. ► Poor cash management: The overall cash management process is poor across the board and needs to be streamlined for most of the POs reviewed. There was lack of segregation of duties and no review to ensure completeness of cash collection and reporting. ► Closing Balances: The closing balances according to the bank, payables and receivables reconciliations based on figures availed by the POs as at period end indicated unexplained differences with the balances as per their respective statements of cash receipts and disbursements. ► Noncompliance with PAYE and other tax and statutory obligations. POs are limited companies employing a number of staff but there was no evidence that statutory deductions like PAYE, NSSF and other relevant taxes had either been deducted or remitted timely to Uganda Revenue Authority and NSSF respectively.
5.4 Regulation of Water Supply and Sanitation Services
5.4.1 Introduction
One of the key recommendations arising out of the Urban Water Reform Study was the strengthening of the Regulatory Framework through formation of an independent regulator for the urban water sub-sector. In May 2009, the Water Policy Committee made a strong recommendation that an independent regulator be created; in November 2009 it was decided to establish an internal regulation unit within MWE to provide technical and administrative support to the director DWD, pending the introduction of a regulatory authority. During the FY 2014/15, the implementation of the revised public service structure saw the creation of a new Department of Water Utility Regulation to replace the Regulation Unit. During the year, the Water Policy
Uganda Water and Environment Sector Performance Report 2015
61
Committee recommended that the scope of regulation by the regulatory authority be expanded to include rural water supply and water for production.
The current regime of regulation is by contract for the town water supplies under MWE’s jurisdiction, where Performance Contracts set out the service standards required. Actual performance is monitored through quarterly reports and field verification visits with performance and management contracts used to ensure the commitment of the MWE Small Towns to improving utility performance and service quality.
During the FY 2014/15, the performance of NWSC under the current Performance Contract 4A was reviewed by the Water Utility Regulation Department (WURD). NWSC submitted quarterly performance review reports which were analysed for comment and feedback. The Performance Review Team (MWE-PRT), which meets at least twice a year to give formal comment and feedback on performance against the current performance contract (PC), continued to review NWSC performance.
One of the major challenges still facing the urban water and sanitation sub-sector is the inadequate framework for effectively regulating the Urban Sub-sector to improve service delivery while protecting the interests of consumers as well as those of the public and private parties. Areas of weakness that have been identified include, but are not limited to: contract management/compliance, performance monitoring and evaluation, water quality monitoring, penalties, sanctions and rewards systems, dispute resolution mechanism, increasing transparency and accountability in the sector, pro-poor interventions, assets and investments management and tariff setting and adjustments.
The establishment of Water Utility Regulation Department (WURD) is an initiative to improve the regulation infrastructure, which is aimed at improving performance itself through improved analysis of actual and projected performance. However, over the reporting period, WURD continued to be constrained in its activities and increasingly overwhelmed with regard to its mandate due to being under-resourced in its systems infrastructure and manpower requirements. WURD has to depend on out-sourced services and development partner support, and such procurement is often delayed. The ever-increasing number of urban water authorities being developed overstretches the Department in terms of its ability to supervise and monitor urban water performance. The number of disputes and complaints from Water Authorities and Private Operators being reported to WURD is increasing, and the Department’s capacity to attend to all these disputes is insufficient. There is therefore a backlog of unresolved cases. It is largely dependent on a manual system of reporting, which gives rise to severe communication and logistical challenges (time spent on travel to/from MWE Small Towns, inadequate transport facilities for field visits). There are also challenges with getting timely performance data on time and of sufficient quality.
5.4.2 Key Initiatives
As an effort to address these challenges, MWE initiated a project in FY 2014/15 to automate the performance monitoring database. This effort, focused on an improved regulation infrastructure, has resulted in a new project to develop a web-based Utility Performance Monitoring & Information System (UPMIS) to enable the entities in the field submit data without having to bring that data to MWE physically. This will be achieved by a variety of input methods at the utilities themselves, such as at desktop computers, laptops/notebooks, tablets and smartphones; areas without Internet will use SMS to submit data. The procurement of the software developer is in advanced stages. The Key Performance Indicators will be revised as part of the on-going efforts to improve the quality of performance reporting.
In 2013, a comprehensive study on the feasibility of setting up an independent water regulator was done. Following several consultations, workshops, and study tours to neighbouring countries, it was recommended by stakeholders that work commence on the legal framework which required to change existing legislation and to set up an independent body; this is currently referred to as the Uganda Water And Sewerage Regulatory Authority (UWASRA). The draft legislation is currently being considered by parliament for approval.

Uganda Water and Environment Sector Performance Report 2015
62
The Department started an effort of de-concentration of its mandate within the Northern and South-western Regions. An Engineer and Economist have been recruited to ensure the effectiveness of regulation on ground. This process of de-concentration to other areas is planned to continue to other regions in the FY 2015/16.
Pro-poor activities in Small Towns
The Water Utility Regulation Department undertakes to implement pro-poor activities in Small Towns to ensure that people living in the poor settlements in every town receive quality and effective water and sanitation services. One way of reaching the poor is through construction of Public Stand Points (PSPs) to the effect that every Water Authority that has been gazetted by the MWE, and works with Private Operators needs to establish PSPs strategically near poor settlements.
As a first step, pro-poor interventions were implemented in selected towns in Northern Uganda (Lira, Adjumani, Yumbe, Moyo and Koboko) in previous years, and lessons learnt were documented. It studied the appropriateness of decentralised low cost technologies, for example the prepaid meter system, public water points, Eco-san toilets and other cheap sanitation innovations (emptyable pit latrines and a low cost tariff for the poor). However there is need to strengthen the regulation of water services in order to safeguard the interests of the poor; there is a proposal in place with simple and short actions, which, if implemented can safeguard the interest of the poor. Proposed approaches to serving the poor are: (i) develop an approach with criteria for establishing a pro-poor tariff, (ii) update the business planning tool to accommodate pro-poor tariffs, (iii) develop a template for a water vendors contract, (iv) disseminate/ popularise pro-poor strategies and tariff to relevant stakeholders, (v) implement Authorised Water Vending approach, (vi) carry out assessments on the ability and willingness to pay and (vii) improve the current management models of public water points (PWPs) to overcome challenges of high prices for water resale.
Commercial improvement
The commercial viability of water supply operations has continued to be a great concern. As such, a process of rolling out the QuikWater billing software has taken place in 20 small towns in the central and northern regions of the country. Preliminary findings show an almost immediate improvement in the operations of the respective utilities as a result of improved data management resulting from the billing software. Further follow up and capacity building is planned in the FY 2015/16.
Furthermore, the transfer of towns to National Water and Sewerage Corporation (NWSC) continued during the FY 2014/15. The transfer of towns to NWSC has been part and parcel of the ministry’s policy for improving sustainability of water supply operations in the small towns for several years. Over the past three financial years, a total of 71 towns has been transferred, of which 2629 were in FY 2014/15, as illustrated in Figure 5.7. The names of the towns transferred over the last three years are provided in Annex 14.
29 (NWSC reports that 44 towns were transferred; for more discussion on the discrepancy in figures see also Footnote 17 in Section 5.1.2).

Uganda Water and Environment Sector Performance Report 2015
63
Figure 5.7 Number of towns transferred to NWSC over the past three financial years
A study has been initiated by the Department to ascertain the impact of the transfer of the above towns. Preliminary findings show that significant improvements are being realised, for instance in terms of increased hours of service, improved revenue resulting from increased water sales, increased coverage from extensions and new connections. This is not surprising given the capacity and vast experience of NWSC in water supply operations compared to the Private Water Operators. This however does not mean that the Private Water Operator model is not required anymore. NWSC does not have the capacity to manage all the water supply schemes across the country. The Department remains committed to support the Private Water Operator model and other relevant management models to ensure sustainability of water supply service provision.
Results of a study on carried out on Improving Incentives for Reinvesting Revenue and Attracting Private Finance for Water Supply Systems in Small Towns in Uganda is provided in Box 5.2.
A total of 116 Small Towns operate under Performance Contracts with MWE. From the expected 1,392 reports, 520 were received and have been used for the analysis of performance of water supply services in Small Towns. The analysis from the received reports only presents the average (and not actual) performance indicators due to some data gaps that still exist in these reports. The web-based UPMIS is expected to improve the quantity and quality of reporting.
Many of the areas of performance in the small towns are indicated in Table 5.13.
(a) Performance on Golden Indicator No 2: Functionality
The Golden Indicator on functionality has been defined in terms of continuity of supply in Small Towns’ water supplies. In essence, this refers to the effective duration of water supply service defined as “the ratio of the actual hours of water supply from the system to the required hours of supply expressed as a percentage”. Data for FY 2014/15 indicates that the average functionality is 92%, up from 89% in FY 2013/14.
The functionality has improved due to the effort put in by the Umbrella Organisations of Water and Sanitation for operation and maintenance, such as replacing stolen/damaged pumps, and quicker response to system failures and break downs.
(b) Average unit cost of producing water
Data shows that overall, the average unit cost of producing water has significantly increased from UGX 1,000 per m3 in FY 2008/09 (in 70 Small Towns) to UGX 1,453 per m3 in FY 2014/15. The general increase within Uganda in the cost of doing business, coupled with aged infrastructure and increasing NRW has resulted in this trend. In FY 2014/15, the unit cost of producing water increased slightly from UGX1,233 to 1,453 per m3 (based on data from 67 Small Towns), due to many leakages that have occurred in the water schemes resulting from the road construction/expansion works; this has in turn increased the NRW and energy input.
17
2826
0
5
10
15
20
25
30
FY 2012-13 FY 2013-14 FY 2014-15

Uganda Water and Environment Sector Performance Report 2015
64
(c) Annual volume of water supplied
Overall, there has been progressive increase in annual volume supplied over the years from 2,310,000 m3 in FY 2007/08 to 3,512,000 m3 in FY 2012/13. However, over the last two financial years, there has been a decrement of 16%, and 15%, respectively from the previous financial year, partly due to less reports submitted and towns taken over by NWSC, but also due to higher water tariffs resulting in lower consumption.
(d) Non-Revenue Water
Non-Revenue Water increased from 22% in FY 2013/14 to 28% in FY 2014/15. This is mainly attributed to the many leakages that have occurred along the distribution and transmission mains in the water schemes resulting from the road construction/expansion works. The town authorities need to be continuously sensitised to follow up with the road contractors to ensure that the damaged pipelines are restored as soon as the road works are completed. This will in turn allow a continuous supply of water and reduction in NRW.
(e) Collection efficiency
Collection efficiency has continued to gradually improve, from 86% in FY 2009/10 to 92% in FY 2014-15. This improvement is attributed to the increased vigilance of private operators managing the Small Towns. The towns of Kamdini, Masafu and Koboko are among the best performers in collection efficiency.
(f) Operational viability
The operational viability of water supply schemes is attained when the revenues collected meet the operating costs (excluding major repairs). The towns’ aggregate percentage of operating costs funded by revenue dropped to 132% this financial year30. Over the previous years, this aggregate value has risen steadily. The current drop suggests an increasing reliance on subsidies for water supply services, and relates to the increasing operational cost of the systems due to aged infrastructure, high NRW and high energy costs. However, it should be noted that this only depicts the broad picture for all Small Towns. Since the town systems are managed independently with no formal cross -subsidies between them, the viability of the systems, i.e. whether the systems can sustain themselves through paid revenues, is best assessed on a system by system basis. The towns that attained operational viability were 47 out of 67 for FY 2014/15.
30 Over 100% refers to a surplus to be accumulated for systems extensions and repairs. However, it should be noted that this only depicts the broad picture for all small towns. Since the town systems are managed independently with no formal cross-subsidies between them, the viability of the systems, i.e. whether the systems can sustain themselves through paid revenues, is best assessed on a system by system basis.

Uganda Water and Environment Sector Performance Report 2015
65
Table 5.13 Performance of Small Towns’ Water Supply Systems over the last five financial years
Performance indicators FY 10/11 FY 11/12 FY 12/13 FY 13/14 FY 14/15
1. No. of appointed Water Authorities with water schemes 95 107 110 116 116
2. No. of Water Authorities reporting to the Ministry 88 83 79 73 67
3. Weighted average Unit Cost of producing water [UGX / m3 sold] (= total operation cost in all towns / total volume of water sold i n all towns)
1,245 1,329 1,186 1,233 1453
4. Arithmetic average Unit Cost of producing water [UGX / m3 sold] (= sum of all unit cost in all towns / number of towns) 1,784 2,316 1,977 1,769 2012
5. Non-revenue water (NRW) [%] 26 24 22 26 28 6. Water supplied [million m3] 3.942 3.459 3.512 2.953 2.520 7. Water sold [ million m3] 2.937 2.637 2.746 2.195 1.815 8. Percentage funded by revenue 130 110 127 135 132 9. Pipe extensions [km] 118 43 41 46 26 10. Total service connections [No] 41,130 45,858 54,404 46,082 33,502 11. Collection efficiency [%] 92 91 90 89 92 12. Functionality [%] (= number of days with water supply/ total number of days) 87 84 87 89 92
Box 5.2 Improving Financial Performance in Selected Small Towns, selected findings A study carried out on improving incentives for reinvesting revenue and attracting private finance for water supply systems in Small Towns in Uganda shows the following constraints that need to be overcome, including:
(i) Type of contract of the PO and duration: The short term nature of contracts (3 to 5) years is by its very nature only suitable for a management type of contract or delegation of a public service concession and not for a full concession. POs will only do limited investments if they are not sure that it would benefit them.
(ii) Tariff issues: A review of the scheme operations showed that limited or inaccuracy data, as well as undercutting at
the bidding stage has often resulted into less than full cost recovery tariff and unviable business for POs. (iii) Limited access to additional capital and working capital: Most POs are not creditworthy because of a number of
reasons that include poor records, poor financial management and lack of management capacity. They are not able to raise financing for capital expansion.
(iv) Inadequate maintenance: POs only perform emergency repairs due to poor cash flows with limited spent for
routine maintenance and asset replacement which threatens long term viability of the system. (v) Lack of exit strategy, worsened by the abrupt transfer of towns to NWSC. This has, in some instances, led POs to
seek court redress. Lack of exit mechanism dampens the operate interest. (vi) No economies of scale/lack of clustering: Clustering may increase some scheme’s viability but should not be
carried out blindly (vii) Limited involvement in sanitation: Sanitation should be made a part of the POs mandate especially the running of
faecal management systems and public toilets. (viii) Perceived and real competition with NWSC: The sector has transferred water supply systems previously run by
Private Water Operators to NWSC. This is rational especially in terms of economies of scale and capacity of the POs, it has certain implications for the growth of the POs. It is important to review and enforce the guidelines to bring clarity to the process. (World Bank, 2015)

Uganda Water and Environment Sector Performance Report 2015
66
Figure 5.8 Trends in performance of Small Towns’ Water Supply Systems over the last 8 years

Uganda Water and Environment Sector Performance Report 2015
67
Performance of NWSC under Performance Contract 4
WURD has been able to forge closer co-operative links with NWSC recently. This should lead to a gradual expansion of the extent of WURD’s oversight of NWSC performance.
An improved framework for Performance Contract 5 (2015 – 2018) was formulated with WURD. This is being drafted at present and will be implemented in time for the first six-months’ review to December 2015.
Figure 5.9 shows the NRW performance by region and total NWSC on a moving 12 monthly basis. As can be seen, there was an improvement in the FY 2014/15, driven largely by the gradually reducing NRW percentage for Kampala, and the significant turnaround in Jinja (Region Central) in the last financial year.
Figure 5.9 Monthly moving 12 Month NRW % supplied performance for Kampala and the Regions over the last 5 years (NWSC)

Uganda Water and Environment Sector Performance Report 2015
68
6 WATER FOR PRODUCTION
6.1 Background
Water for Production (WfP) refers to development and utilisation of water resources for productive use in crop irrigation, livestock, aquaculture, rural industries and other commercial uses. The current mandate for WfP facilities in Uganda are a shared responsibility between MWE and MAAIF. MWE is responsible for “off-farm” activities while MAAIF is responsible for “on farm” activities. “Off-farm” refers to development of water sources and transmission (bulk transfer to farm gates while “on-farm” refers to development of primary distribution and tertiary networks for irrigation systems and other on-farm irrigation infrastructure & works and water use management.
The overall goal for the development of WfP is: “To promote development of cost-effective and sustainable water supply and water management for increased production and contribution to the modernisation of the agricultural sector in Uganda with a focus on poverty reduction and minimal environmental impacts”.
6.2 Programmes and Projects
MWE is implementing several programmes to improve the livelihoods of the people in rural areas through increasing the storage volumes for WfP. It is constructing and rehabilitating earth dams and valley tanks across the country. The bulk water transfer programme aims to supply adequate amounts of water all year round for multi-purpose use. MWE is assigned the implementation of the construction of the irrigation schemes under the Farm Income and Enhancement and Forestry Conservation (FIEFOC) project. MWE also operates and manages earth moving equipment for construction of valley tanks. The equipment is hired out to individual farmers at subsidised rates. Finally, MWE plays an important role of technical backstopping to local governments and line ministries such as Ministry of Agriculture, Animal Industry and Fisheries (MAAIF). Table 6.1 presents the summary of achieved outputs, compared to the planned outputs for the period under review.
Table 6.1 Planned versus achieved outputs of Water for Production Department for FY 2014/15 Planned output Achieved Output Remarks
Sustainable management systems (32 No.) established at completed WfP sites
32 management systems have been established in the districts of Karamoja region, Nebbi, Mityana, Kiboga, Masindi and Kabale Districts.
Purchase of 3 sets of construction Equipment
Purchased 3 sets of equipment Each set of equipment has an excavator, dozer and a dump truck
Construction of Nyakiharo Water system in Kabale District (100% completion)
Construction of Nyakiharo water supply system was completed
The project was technically commissioned
Construction of Bulk water scheme in Rakai District (100%) completion)
Construction was completed. Complete
Construction of Andibo Dam in Nebbi District. (70% cumulative progress)
Construction of Andibo at 56% progress
The scope of works was increased
Construction of Nyakashashara Water system for rural industry (Amos Dairy)
1 Valley Tank was constructed, NWSC connected the Amos Diaries factory from Lyantonde
10 trials of production wells were done

Uganda Water and Environment Sector Performance Report 2015
69
Planned output Achieved Output Remarks
Construction of 12 valley tanks under KALIP/OPM MoU in Karamoja
12 sites were constructed in Karamoja region
Additional funds have been provided for 10No. more Valley tanks from OPM
Olweny Irrigation Scheme - 50% completion of civil works constructed, under FIEFOC Project
Olweny irrigation scheme construction works progress is at 50%
Procurement of 1 set of equipment and construction of 5 valley tanks
1 set of equipment was procured (excavator, dozer, wheel loader and 2 dumper trucks, 4 vehicles)
Evaluation of contractors is ongoing
6.3 Status and Trends of Key Indicators
WfP facilities are owned by the Government, communities, private individuals or companies. Management of the facilities is by both private operators and community based organisations with support from the local governments. Proper management of WfP facilities is a crucial factor for sustainability and functionality of the facilities. Therefore, if the facility is not owned by an individual, a private operator, beneficiaries, district local government and central government need to ensure that a water user committee, or water board in the case of a private operator system, at each WfP facility is formed. The functions of the water user committee/water board are: (i) to enact by-laws for the facility management, (ii) construct sanitation facilities around the WfP facility, (iii) ensure environment conservation and catchment management, (iv) arrange community contribution towards operation and maintenance, (v) fencing of the facilities to avoid direct watering of livestock in the storage reservoir and (vi) ensure maintenance of the water abstraction system.
MWE has carried out a number of activities to ensure sustainability of WfP facilities, and these include:
(i) Mobilisation and sensitisation - mobilisation and sensitisation activities were carried out in the districts of Kotido, Moroto, Kaabong, Napak, Abim, Nakapiripirit, Amudat and Kabale to sensitise beneficiaries on the importance of providing land and access routes to the facility, participatory involvement during implementation of WfP projects, effective utilisation of WfP facilities, and proper hygiene and sanitation.
(ii) Capacity Building - A three-tier training approach to build capacity is used; this includes training of trainers (District and Sub-County extension Officers), training of the management committees/associations and training of the end-users/community members.
In FY 2014/15, training in eight districts31 was conducted to enhance capacity, raise awareness of all stakeholders at District and Sub-County level as well as management committees and water users. It focused on roles and responsibilities, formation of by-laws, gender aspects, and features of WfP facilities. Change in sexual behaviour is also included as part of the training to try and reduce the spread of HIV/AIDS.
(iii) Establishment of appropriate management structures for WfP facilities: The status of the different management structures for WfP facilities varies. For most facilities constructed with funding from Central government or District Local Governments, a Community Based Management System (CBMS) is implemented where Water User Committees/water boards are formed (functions described in section 1.5.1).
31 Kotido, Moroto, Kaabong, Napak, Abim, Nakapiripirit, Amudat and Kabale

Uganda Water and Environment Sector Performance Report 2015
70
Developed a number of Information, Education and Communication (IEC) tools to better convey the messages across to the stakeholders in an effort to improve O & M of the facilities. MWE uses participatory IEC materials, posters, brochures and water for production drama to mobilise, sensitise and build stakeholders’ capacity on operation and maintenance of WfP facilities.
Analysis on management of WfP facilities only considers those under community management with support from Local Governments including private facilities constructed with support of Government. All other private facilities are not included in this analysis.
6.3.1 Golden Indicator No. 2: Functionality
Functionality was assessed for all facilities constructed between 2000 – 2015, in the fifty four (54) districts so far covered in the WfP database. The results are shown in Table 6.2. The functionality rate for WfP facilities is 74.9% (including the newly constructed facilities in FY 2014/15), slightly up from 74.4% in FY 2013/14. The data is based on a total of 640 valley tanks and 31 dams, constructed between 2000 and 2015.
Table 6.2 Functionality of earth dams and valley tanks as at June 30th, 201532 Functionality Level Description Total
Fully Functional 100% functional, i.e. without any damage
74.9%
Partially Functional Operational, reduced functionality ( e.g. siltation, pump breakdown)
23.6%
Non-Functional Not operational at all 1.5%
Table 6.3 Functionality status per facility type as at June 30th, 2015 Functionality Status Valley tanks Dams Total
No. % No % No. %
Fully Functional 483 76 20 65 503 75
Partially Functional 149 23 9 29 158 24
Non-Functional 8 1 2 6 10 1
Total 640 31 671
During FY 2014/15, MWE worked towards improving functionality status for the partially functional facilities. These facilities serve the beneficiaries but with reduced functionality due to pump breakdown, siltation, inactive water user management committee and inactive byelaws. MWE has continued to put an effort in installation of abstraction systems, formation and rejuvenation of management committees, by-laws and training of stakeholders, all aiming at improving functionality. The construction of abstraction systems, and rejuvenation of the WUCs to improve functionality is still ongoing.
6.3.2 Golden Indicator No. 6: Cumulative WfP Storage Capacity
The golden indicator for water quantity is defined as “the Cumulative WfP Storage Capacity (in million cubic meters)”. The total volume added through investments in the FY 2014/15 (including facilities done by the Districts and private farmers using WfP Construction Equipment) was 3,328,000m3,
32The database was cleaned and non-functional facilities which have not been functional for over 5 years were not considered in the calculation of functionality. These non-functional sites need new reconstruction as they are completely silted.

Uganda Water and Environment Sector Performance Report 2015
71
compared to only 940,200 m3 in the previous year. The increase in the volume created is due to factors such as OPM’s financing of water for production facilities to the Karamoja region, and sensitisation of communities to apply for private tanks. Therefore, by the end of FY 2014/15, cumulative storage had increased from 28.4 million cubic meters in FY 2013/2014, to 31.7 million cubic meters. Table 6.4 shows the volumes of storage created through construction of various WfP facilities in FY 2014/15.
Table 6.4: WfP volume created by MWE in FY 2014/15. Water for Production Facility
% Completion
30th June 2014
% Completion
30th June 2015
Progress FY
2014/15
Design Capacity
(m3)
Volume Created GoU / private [m3]
Rakai Bulk Water Scheme
32% 100% 68% 860,000 860,000
Construction of Andibo dam in Apac District
0% 56% 56% 3,300,000
1,848,000
Construction of Nyakashashara valley tank in Sanga
0% 100% 100% 10,000 10,000
MWE Equipment
Karamoja Region
0% 100% 12 no. 10,000 120,000
Western Region
0% 100% 110 no. 2,000 220,000
Northern Region
0% 100% 70 no. 2,000 140,000
Central region
0% 100% 65 no. 2,000 130,000
Sub Total 1 2,708,000 620,000 Sub Total 2 3,328,000
TOTAL VOLUME CREATED (m3) 3,328,000
6.3.3 Golden Indicator No 9: Management of Water Points
Facilities constructed and owned by the private individual/group are managed under the private management arrangement, whereas communal facilities constructed by Government and sometimes NGOs are managed under a CBMS. Using a community-based management approach, MWE forms water user committees (WUC) to enhance and promote self-driven approaches for community ownership and sustainability initiatives. Under this approach, MWE supports the Local Government to train the beneficiaries together with the management committees mainly on their roles and responsibilities and establishment of the by-laws to ensure sustainability of the facilities.
The golden indicator for management of Water for Production facilities is “the % of water points with actively functioning Water User Committees”. The functionality of WUCs for FY 2014/15 based on the reports of 294 facilities under community management is 80%, the same as last financial year.
In Table 6.5, the total number of facilities (dams and valley tanks) constructed from 2000 to 2015 is 916, for 54 districts so far covered in the WfP database; the department is in the final procurement process for collecting data from all the 112 districts in the Country. Out of 916 facilities, a total of 294 facilities are under community management system with established water user committees, and 235 water user committees were still fully functional. The rest of the facilities (622 facilities) are private, and are managed by individual farmers (constructed using MWE equipment under Public Private Partnership (PPP) arrangement).
A total of 885 valley tanks were constructed from 2000-2015; among these 263 valley tanks (30%) are under community based management system. All the 263 valley tanks under CBMS have established water user committees (WSC) and only 214 (81%) were fully functional at the time of spot check. A

Uganda Water and Environment Sector Performance Report 2015
72
total of 31 dams were constructed from 2000-2015, all are under CBMS, and 21 water user committees (68 %) were fully functional.
Table 6.5 Community Management of WfP facilities constructed 2000 - 2015; end of June, 2015 Facility Type Total No.
of Facilities Under community management
With established WUC
With functioning WUC
No. % No. % No. %
Valley Tanks 885 263 30% 263 100% 214 81%
Dams 31 31 100% 31 100% 21 68%
Total 916 294 32% 294 100% 235 80%
Source: MWE WfP Database33
Public-Private Partnership (PPP): MWE has been developing facilities under a Public Private Partnership arrangement with farmers; these farmers take responsibility of managing their facilities. To-date, 816 valley tanks have been constructed under this arrangement since 2008. This financial year, a total of 355 valley tanks have been constructed. The increase in number is attributed intensive sensitisation. Each facility is privately owned by an individual farmer. All the facilities constructed in Kiruhura, Lyantonde, Sembabule, Luwero, Kibaale, Kiboga, Kyankwanzi, Nakaseke, Kiryandongo and Nakasongola Districts are fenced and there is no direct watering of animals at the facilities. The use of both traditional and modern troughs is high, access to the facilities is no longer a problem, functionality rates are high and care of facilities is commendable, silting of facilities is limited, cleanliness at the facilities is high and this arrangement has also minimised the challenge of livestock diseases. Mechanisms have been put in place to establish an O&M framework to monitor development and maintenance of these facilities. A coordination committee is established at sub-county level, including sub-county officials, councillors and farmers’ representatives. The coordination committee, together with the other sub-county and district technical team, work with private farmers to ensure sustainability of the constructed facilities. This has gone a long way to solving the poor O&M associated with the community-managed facilities.
6.3.4 Golden Indicator No. 10: Gender
The golden indicator for gender issues in Water for Production is defined as“% of water user committees with women holding key positions”. In FY 2014/15, 35 committees were formed, and women were encouraged to participate in key positions of chairperson, vice chairperson, secretary and treasurer. For valley tanks, 73% of the water user management committees have women in key positions and 48% of the water user committees of dams have women in key positions.
Both women and men have equal access to the WfP facilities. Men are seen as the major users since they own livestock, the farm land and are more mobile than women. Equal access is encouraged through installation of fuel driven pumps at the valley tanks; the delivery system of water from dams is now by gravity flow to watering troughs compared to treadle pumps which were cumbersome for women, people with disabilities and children.
6.4 Sanitation and Hygiene around WfP facilities
Sanitation and hygiene entails maintaining clean and hygienic conditions around WfP facilities to prevent contamination of water and spread of waterborne diseases. In FY 2014/15, beneficiary communities were sensitised at WfP facilities in Kabale District and the districts of Karamoja Region. Hygiene trainings were also carried out to emphasize adherence to the safe water chain, safe disposal of waste material especially human excreta, and maintaining good hygiene practices around the
33 Fish ponds were not included in this years’ analysis because the department is not active in fish ponds construction. This has a slight impact on the functionality rate.

Uganda Water and Environment Sector Performance Report 2015
73
facilities, particularly in the catchment areas of the facilities. An inventory was made of all facilities without sanitation facilities, in order to plan for subsequent construction.
6.5 Information Management
In FY 2014/15, the WfP database software was upgraded. The database is continuously updated, and provides information regarding the operational status of the facilities, storage capacity of individual facilities, time of construction and cost of the facilities, status of management structures of the facilities, women’s involvement in Water User Committees, sanitation facilities in the catchments, and financial contribution from the private sector. Furthermore, maps of geographical distribution of WfP facilities in specific districts and the whole country can be generated.
6.6 Contribution by Cross-Sectoral Projects
MWE has constructed 12 valley tanks of 10,000m3 each in the FY 2014/1534, using funds from the Office of the Prime Minister (OPM). This arrangement was effected through a Memorandum of Understanding signed between MWE, Office of the Prime Minister and Kotido and Kaabong District Local Governments. MWE did the designs, as well as construction using government-owned WfP equipment.
6.7 Lessons Learned and Recommendations
The private operator management system is the most suitable system for the large strategic water for production reservoirs (above 40,000m3), while community based management methods such as water user committees (WUCs) and associations are suitable for small reservoirs (below 40,000m3). Use of the water for production construction equipment is very effective in areas where farmers practice settled farming, as this makes it easy to coordinate. It is thus recommended that a hybrid of management systems and implementation modalities be maintained. However, it is essential that all components of the standard designs35 are constructed to ensure sustainability of the valley tanks, even if it means adding an extra cost. It is recommended that quality should not be compromised through omission of certain elements during construction.
Funding: The annual funding for WfP is inadequate compared to the demand and investment targets. There is need to increase funding to meet the ever increasing demand. Increasing funds will enable MWE to procure more WfP equipment units to address the need from all water-stressed districts.
Land Ownership: There is a challenge in acquiring land for the construction of WfP facilities. Therefore, for sustainability of large government facilities i.e. irrigation schemes and large dams, government needs to acquire land before construction.
Use of Force account: MWE constructed 12 communal valley tanks using the Force Account36 mechanism. This has enabled MWE to increase water storage at a low cost and furthermore implement projects in hard to reach areas, where contractors/service providers would either not be willing to go, or charge exorbitant prices.
34 in the Districts of Kotido, Moroto, Kaabong, Napak, Abim, Nakapiripirit and Amudat in the Karamoja region,
35 such as fencing, abstraction systems, domestic water supply points, inlets and outlets lines in stone, sanitation facilities
36 Force account is a type of approach applied by the MWE for awareness raising, informing, selecting, leveraging contributions and implementing construction of VTs. The approach has five steps which can be described as follows: 1 Advocacy meetings on the approach for district leadership; 2 Dissemination of the concept through councillors; 3 Advocacy meetings in each sub-‐county; 4 Registration with the sub-‐county and payment of contributions by farmers (between 30% and 40% of total costs); 5 Construction of the VT upon presentation by the farmer of a receipt of deposit of contribution and fuel for the earth-‐moving machinery. The machinery used for the construction of the VTs is owned by the MWE. This machinery is either acquired from the budget of the MWE or through grants. The contributions by the farmers are used for regular O&M of the machinery, moving the machinery to new sites and other common costs (SaafConsult B.V., 2011).

Uganda Water and Environment Sector Performance Report 2015
74
7 WATER RESOURCES MANAGEMENT
7.1 Introduction
The priority water resources management interventions for the Directorate of Water Resources Management during the FY 2014/15 were as follows:
(i) Continued implementation of catchment based water resources management through the four Water Management Zones (WMZs), supporting and facilitating the respective Catchment Management Organisations under each WMZ to develop and implement catchment management plans using the recently developed guidelines.
(ii) Finalised of the national water resources strategy to guide the country in sustainable utilisation and management of water resources.
(iii) Participation in transboundary water resources management programmes under the Nile Basin Initiative, East African Community (EAC) /Lake Victoria Basin Commission and Intergovernmental Authority on Development (IGAD), to ensure that Uganda’s interests are safeguarded.
(iv) Continued implementation of the National Water Quality Management Strategy through upgrading of the Entebbe water quality laboratory to a national reference laboratory, establishment and operation of regional laboratories in WMZs and development of water quality guidelines and standards for various emerging issues such as oil drilling and emergency response etc.
(v) Provision of secretariat services to the Water Policy Committee (WPC), to enable it to provide policy advice to MWE and other government agencies on integrated and sustainable management and development of water resources of Uganda.
(vi) Continued strengthening the water resources regulatory framework through review of draft amendments to the National Water Policy and Water Act, development of a reservoir regulation and dam safety guidelines, and implementation of the strategy for compliance and enforcement of water laws and water permit conditions.
Reporting of progress under each of the above key interventions is presented following four functional areas of the directorate namely Water Resources Monitoring and Assessment, Water Quality Management, Water Resources Planning and Regulation, International and Transboundary Water Resources Management, and in a final section on cross-cutting activities.
7.2 Water Resources Monitoring and Assessment
Water Resources Monitoring and Assessments plays an important role in the country’s overall development by providing information on water resources availability and their historical trends. This is done through monitoring, assessing water resources, providing timely information for planning and decision making at the national and international levels. These activities are geared towards ensuring that water of adequate and sufficient quantity is available to all Ugandans. The availability of fresh water is the key to sustainable development and an essential element in health, food production and poverty reduction.
The water resources data and information generated is essential for quantification and allocation of national water resources to guide efficient implementation of crucial economic and social infrastructure development for example: water supply systems, irrigation systems, roads works, hydropower generation plants, etc. It also supports development and implementation of early warning systems to mitigate the effects of drought and floods. Table 7.1 shows the activities that were planned for, and achieved in the financial year 2014/15.

Uganda Water and Environment Sector Performance Report 2015
75
Table 7.1 Planned and achieved activities as per end of June 2015 Planned Achieved Reason for Variance Management and operation of 91 surface water and 30 groundwater stations
75 surface water and 29 groundwater stations were operated. Monitoring network reviewed for expansion and upgrade in technology.
Vandalism of equipment for 9 surface water stations. Lack of spare parts for 5 surface water stations Expansion of road works affected 3 surface water stations Repossession of land for 1 groundwater station in Hoima
Upgrade of 40 surface water stations to telemetry for real time data collection and automatic transmission
7 stations were upgraded Station assessments and design specifications delayed procurement for 17 stations 16 stations to be re-advertised due to unresponsiveness of bidders. Equipment specifications and civil works designs further elaborated.
17 new groundwater stations for real time data collection and automatic transmission
Nil stations were constructed. 17 stations to be re-advertised due to unresponsiveness of bidders. Equipment specifications and civil works designs further elaborated.
5 Surface water assessments for hydro power generation
2 assessments for hydro power development on rivers Bukwo and Agago undertaken
Requests received were below yearly average
8 Surface water assessments for other development projects implemented
3 flood assessments (Manafwa, Malaba and Kasese) State of R. Katonga basin assessment Water Resources Assessment on R. Ruizi for Water supply sustainability for NWSC, Coca cola and Nile Breweries
Requests received were below yearly average
2 groundwater studies in Hoima and Kalangala completed (effect of large abstractions and palm tree growing on groundwater resources)
1 groundwater assessment conducted for Hoima town water supply well field
Kalangala assessment completed in previous year and only monitoring undertaken to evaluate significant groundwater changes as a result of palm growing
Maintain and update 3 databases (Surface water, Groundwater and GIS)
Data processed, quality assured and entered into surface water and GIS databases; Rating curves refitted for conversion of gauge levels into daily flows for 8 stations
Groundwater database was corrupted and is under reconstruction
Upgrade 1 database equipped with new software to be able to receive data from new data collection platforms (DCPs)
Specifications made and procurement initiated for the upgrade of the surface water database
Delay in acquisition of equipment and licenses for software
Data dissemination and generation of NTR
Data disseminated to 96 users (54 research students in tertiary and university colleges and 42 consulting services for investment planning). UGX 26.2 million realised from consulting services as NTR
Data and information dissemination depends on requests from users

Uganda Water and Environment Sector Performance Report 2015
76
7.2.1 Water Resources Monitoring Network
The monitoring network consists of 91 surface water stations and 30 groundwater stations. Various parameters are monitored which include surface water and groundwater levels, discharge, rainfall, humidity and temperature. The status of operation of the network for the reporting period is shown in Table 7.2. This gives a functionality of 87%. Non-functionality of stations is attributed to lack of spare parts for some stations, vandalism (especially of solar panels), siltation, maintenance works on road bridges (for example R. Katonga, R. Mpanga, and R. Omunyal) and pending restoration of the monitoring network in previously war-torn Northern Uganda. The groundwater monitoring station located in Hoima hospital complex was closed when works to expand the hospital were initiated. A new site has been identified and negotiations with the owner for acquisition are underway.
Non functionality results in data gaps, which for short periods can be compensated using hydrological gap filling techniques with limited effects on data quality. However, for longer periods there is need for extensive modelling and the quality of data generated is not reliable. There have been efforts to minimise down-time of stations especially for early warning.
Table 7.2 Status of existing water resources monitoring network as per end of June 2015 Station Category Stations Functional Functionality % (14/15) Functionality % (13/14) Surface Water 91 75 82 48 Surface Water telemetric stations
19 18 95 Stations undergoing construction
Groundwater 30 29 97 82
High value stations are being converted to telemetry to improve data quality and obtain real time data for timely decision making for extreme events. A pilot project was implemented in the Kyoga Water Management Zone involving the upgrade of 14 stations during FY 2013/2014. During this reporting period, an additional seven (7) surface water stations have been upgraded to telemetry37. Data from telemetric stations is automatically transmitted from the stations to the DWRM offices in real time. This upgrade will be undertaken for a further 70 stations across the country in the next two years.
Due to increased water resources related investments, especially in hydropower and water supply, the number of stations needs to be increased to cover the non-gauged catchments and areas with large groundwater abstractions. For purposes of a wider coverage, private developers and institutions are being encouraged to establish self-monitoring stations. An optimal hydrological network consisting of 185 surface water stations and 86 groundwater stations is planned in the next 5 years.
7.2.2 Update of the national surface water and groundwater databases
Data was received from 75 surface water and 29 groundwater stations. The data was processed in accordance with data management procedures to ensure that data of high quality is available to users. Several checks were made, and data that passed all the steps was archived in the databases. An inventory of the available data is attached in Annex 15. This data was also processed to retrieve meaningful information that can be disseminated to users and provide an updated state of water resources in the country.
The following three figures present hydrographs for selected lakes showing fluctuations of water levels and averaged trends over a 5-year period.
37 The stations upgraded are L. Albert at Butiaba, R. Tochi at Lira – Kamdini, R. Kagera at Kigagati, R. Aswa at Gulu – Kitgum road, L. Edward at Katwe, Kyoga Nile at Atura and R. Ruizi at New water works.

Uganda Water and Environment Sector Performance Report 2015
77
Figure 7.1 Fluctuation of Lake Victoria Water Level from 2010 to present
Figure 7.2 Fluctuation of Lake Kyoga Water Level from 2010 to present
Figure 7.3 Fluctuation of Lake Albert Water Level from 2010 to present
11.00
11.20
11.40
11.60
11.80
12.00
12.20
12.40
01-J
an-1
0
01-A
pr-1
0
01-J
ul-1
0
01-O
ct-1
0
01-J
an-1
1
01-A
pr-1
1
01-J
ul-1
1
01-O
ct-1
1
01-J
an-1
2
01-A
pr-1
2
01-J
ul-1
2
01-O
ct-1
2
01-J
an-1
3
01-A
pr-1
3
01-J
ul-1
3
01-O
ct-1
3
01-J
an-1
4
01-A
pr-1
4
01-J
ul-1
4
01-O
ct-1
4
01-J
an-1
5
01-A
pr-1
5
01-J
ul-1
5
01-O
ct-1
5
WAT
ER L
EVEL
(M)
JAN 2010 - JUNE 2015
Daily Water - L. Victoria at Jinja Pier
10.50
11.00
11.50
12.00
12.50
01-J
an-1
0
01-A
pr-1
0
01-J
ul-1
0
01-O
ct-1
0
01-J
an-1
1
01-A
pr-1
1
01-J
ul-1
1
01-O
ct-1
1
01-J
an-1
2
01-A
pr-1
2
01-J
ul-1
2
01-O
ct-1
2
01-J
an-1
3
01-A
pr-1
3
01-J
ul-1
3
01-O
ct-1
3
01-J
an-1
4
01-A
pr-1
4
01-J
ul-1
4
01-O
ct-1
4
01-J
an-1
5
01-A
pr-1
5
01-J
ul-1
5
01-O
ct-1
5WAT
ER L
EVEL
(M)
JAN-2010 - JUNE 2015
Daily Water - L. Kyoga at Bugondo Pier
10.00
10.50
11.00
11.50
12.00
12.50
01-J
an-1
0
01-A
pr-1
0
01-J
ul-1
0
01-O
ct-1
0
01-J
an-1
1
01-A
pr-1
1
01-J
ul-1
1
01-O
ct-1
1
01-J
an-1
2
01-A
pr-1
2
01-J
ul-1
2
01-O
ct-1
2
01-J
an-1
3
01-A
pr-1
3
01-J
ul-1
3
01-O
ct-1
3
01-J
an-1
4
01-A
pr-1
4
01-J
ul-1
4
01-O
ct-1
4
01-J
an-1
5
01-A
pr-1
5
01-J
ul-1
5
01-O
ct-1
5
WAT
ER L
EVEL
(M)
JAN-2010 - JUNE 2015
Daily Water - L. Albert at Butiaba

Uganda Water and Environment Sector Performance Report 2015
78
The hydrographs for the Lake Victoria and Lake Albert show a steady increase in water level while the water level for Lake Kyoga seems to have remained stable. The rise in water level of Lake Victoria has been due to a deliberate regulation/release policy to build up the lake level for sustainable hydropower development along the Nile. As a result, hydropower generation has increased from an average of 180 Megawatt (MW) in the late 1990s and early 2000s to the current average of 1,200 MW and expected to top 2,000 MW. Lake Kyoga plays a stabilising role for the Nile flows down-stream of Lake Victoria. The behaviour of Lake Albert reflects the increase in net basin supply and especially flows from DR Congo.
Fluctuations in daily discharges of two rivers over a 5-year period are shown in Figure 7.4 and Figure 7.5. River Nile at Kamdini, and River Mpanga were selected for analysis because of their current use. Kamdini station is located upstream of the Karuma Hydropower site, while River Mpanga is used for hydropower supply (18 MW) and water supply schemes to Fort Portal and Kamwenge towns. River Mpanga station is located downstream of Fort Portal water supply but upstream to Mpanga hydropower supply and Kamwenge town water supply. Periodic assessment studies are undertaken on such rivers to determine the sustainability of flows to support these developments. These studies focus on the water balance for the critical sub-catchments, and inform watershed management activities.
The hydrographs for these rivers indicate an increased flow in the years 2012 – 2013, which is reflected in the sharp build up in water levels of Lake Victoria and Lake Albert during the same period.
Figure 7.4 Daily Discharge for R. Nile at Kamdini from 2010 to present
Figure 7.5 Daily Discharge for River Mpanga from 2010 to present
010203040506070
Flow
Dates
Daily flow for Kyoga Nile at Kamdini
020406080
01-Ja
n-10
01-M
ar-1
001
-May
-10
01-Ju
l-10
01-S
ep-1
001
-Nov
-10
01-Ja
n-11
01-M
ar-1
101
-May
-11
01-Ju
l-11
01-S
ep-1
101
-Nov
-11
01-Ja
n-12
01-M
ar-1
201
-May
-12
01-Ju
l-12
01-S
ep-1
201
-Nov
-12
01-Ja
n-13
01-M
ar-1
301
-May
-13
01-Ju
l-13
01-S
ep-1
301
-Nov
-13
01-Ja
n-14
01-M
ar-1
401
-May
-14
01-Ju
l-14
01-S
ep-1
401
-Nov
-14
01-Ja
n-15
01-M
ar-1
501
-May
-15
01-Ju
l-15
01-S
ep-1
501
-Nov
-15
Flow
Dates
Daily flow for River Mpanga

Uganda Water and Environment Sector Performance Report 2015
79
A trend analysis was carried out for three groundwater monitoring stations at Soroti, Rakai and Nkozi (Figure 7.6 to Figure 7.8). A slight drop (approximately 0.5m) was registered at Soroti and Rakai for the period 2010 to 2015. A drop of 5 meters was also registered at these stations for the period 1998 – 2008. Therefore, as a guide to water supply and additional 5.5 meters of groundwater fluctuations should always be considered during installations of pumps.
Nkozi monitoring station was set up to monitor the impact of groundwater abstraction by Nkozi University. The sharp and frequent fluctuations depicted on the hydrograph are due to the process of motorised groundwater abstraction. The impact of groundwater abstraction on this borehole is insignificant since a slight increase in groundwater levels was registered for the period 2010 – 2015, suggesting that recharge is more than abstraction and discharge in rivers and lower aquifers combined. For sustainable development, this type of aquifers are suitable for groundwater development.
Figure 7.6 Groundwater Levels and Rainfall at Soroti Monitoring Station from 2010 to present
Figure 7.7 Groundwater Level and Rainfall at Rakai Monitoring Station from 2010 to present
0
20
40
60
80
1004
6
8
10
12
14
1601-Jan-10 01-Jan-11 01-Jan-12 01-Jan-13 01-Jan-14 01-Jan-15
Rain
fall
(mm
)
Wat
er L
evel
s (m
bgl)
Months
Groundwater levels at Soroti Monitoring Station
0
20
40
60
80
100282930313233343501-Jan-10 01-Jan-11 01-Jan-12 01-Jan-13 01-Jan-14 01-Jan-15
Rain
fall
(mm
)
Wat
er L
evel
s (m
bgl)
Months
Groundwater levels at Rakai Monitoring Station

Uganda Water and Environment Sector Performance Report 2015
80
Figure 7.8 Groundwater Level and Rainfall at Nkozi Monitoring Station from 2010 to present
7.2.3 Dissemination of Water Resources Data and Information to Users
Data from the national databases (groundwater, surface water and weather) was used in the hydrological assessment of development projects, including amongst others:
� Design of ferry landing site along River Nile at Paraa
� Designs for the upgrade of Mbale – Nkokonjeru road (21km) and Mbale State Lodge Loop (6km)
� Development of irrigation schemes in central and eastern Uganda by JICA
� Rural water supply to Mpigi, Mubende, Kiboga, Pallisa, Serere, Soroti, Luuka, Kibuku and Iganga Districts by JICA.
Data was accessed at a standard fee as per data dissemination policy; through these data sales MWE was able to generate UGX 26,200,000= as non-tax revenue (NTR). The data tariff structure is under review to encourage more users to access data. Water resources data and information contributed to 10 research studies at Bachelors’ degree level for students from Makerere, Kyambogo and Busitema Universities. Information was given to users in form of reports (6) and groundwater maps for Kyoga Water Management zone, Agago, Abim, Bugiri and Kaabong Districts (30).
7.2.4 Provision of Advice on Water Resources Development Projects
Groundwater Abstraction for Hoima town water supply
Hoima town water supply has been operational for over 10 years. Water is abstracted from eight wells, situated in two well fields. Hoima District Water Office consulted MWE about groundwater resources availability after registering reduced yields in boreholes and protected springs in the catchments for the town water supply.
MWE carried out an assessment and recommended that groundwater monitoring of abstraction should be carried out in the well fields, that NWSC has to collaborate with MWE/DWRM to regulate the water abstracted for sustainability purposes, and that the catchment of the wells should be restored and protected to prevent contamination of the groundwater.
Assessment for Agago and Bukwo Rivers for Hydropower
Following preliminary water resources assessments done on the two catchments it was determined that the projects could generate 4.30 MW of power from River Bukwo and 3.81 MW of power from River Agago.
1
2
3
4
5
Wat
er L
evls
(mbg
l)
Month
Groundwater Level for Nkozi monitoring Station

Uganda Water and Environment Sector Performance Report 2015
81
Floods Analysis for Manafwa and Malaba River Catchments
MWE carried out a floods analysis assessment of the two flood-prone Manafwa and Malaba River catchments in Eastern Uganda. MWE also developed web-based versions of the tools for conversion of time series data into flood inundation maps.
Assessment of Kasese Floods
DWRM carried out assessments of floods in Kasese area following the most recent, catastrophic floods of River Nyamwamba. Causes and impacts of the floods were thoroughly investigated and assessed, and an action plan to deal with future floods was developed by DWRM, so that impacts are minimised.
7.2.5 Challenges
Acquisition and retention of plots of land (40ft x 40ft) for hydrological stations has been a major challenge because of the general appreciation of the value of land in the country. Development has meant that ownership of land is changing more frequently and hence the need for re-negotiation at higher price rates of previously secured plots. In some cases land owners are unwilling to release the small plots which they consider as fragmentation of land and prefer DWRM to negotiate for entire land strips which are often very expensive.
Poor remuneration to observers has translated into low commitment. The station observers are paid an honoraria of UGX 10,000 per month, which is too low to motivate them to conduct their responsibilities diligently. Repeated request by DWRM to ministry of public service to improve their terms and conditions of service and to recruit on pensionable terms some observers for high value stations along the R. Nile and on lake stations of Victoria, Kioga and Albert have not been successful.
Increasing cases of vandalism and especially of solar panels has affected network operations. Even at locations originally considered secure, such as near Gombolola and District headquarters and police stations, vandalism has taken place. Besides sensitisation of communities on the importance of hydrological stations, DWRM has also demarcated all sites and provided synergies with details of the function of the stations to minimise vandalism.
Hydrological monitoring stations have been affected by road and hydropower works being undertaken in many parts of the country. Although ample notification for relocation of the affected stations has been given by Uganda National Roads Authority (UNRA) and Electricity Regulatory Authority (ERA), the process of relocation means that some data is not collected. The gaps recorded in the data sets can be filled using simple hydrological techniques without severely compromising data quality.
There is a decline in groundwater yields in areas where large water supply schemes based on groundwater abstraction are competing with point water sources, for example Hoima town water supply.
Generally, there are no significant changes in the amounts of available water resources, but the demands on water resources are increasing drastically. This may have a negative impact on availability of water resources in the future, thus requiring improved water resources management at all levels.
7.2.6 Way Forward
As the network expands, MWE has appealed to local governments to sensitise communities on the importance of hydrological stations in national development, and to facilitate acquisition of land through a mutually negotiated Memorandum of Understanding.
MWE has deployed more hydrological technicians to WMZs to support the observers.
MWE regulates groundwater abstraction with a specific focus on areas where point water sources already exist in a catchment from which large groundwater schemes are developed.

Uganda Water and Environment Sector Performance Report 2015
82
In the long term, the power sources (e.g. solar panels) will be replaced with long life batteries, or supply from the national grid where it is situated within 300 metres. There are also efforts to design and construct more robust stations.
7.2.7 Water Information System
In order to enhance the water resources monitoring and information system of the country, DWRM is in the process of designing a new water information system (WIS). The WIS will encompass all water related data including those needed for water resources planning and management. This will include the functionality and coverage of the hydro-meteorological network, and the establishment of effective systems for information management, analysis, dissemination and use. Such a water information system (WIS) in the context of rational water resources management in Uganda will cover all four water WMZs and their respective catchments and aquifers.
7.3 Water Resources Planning and Regulation
During the FY 2014/15, the following were the key outputs under water resources planning and regulation:
x Improved planning for allocation and use of water resources in order to guide various water related sectors.
x Developed regulatory framework for dams and reservoirs to ensure that appropriate dam safety practices are part and partial of all plans and programs for the better management of hydroelectric power generating facilities.
x Improved compliance to regulations and conditions of Water Act, water abstraction and wastewater discharge permits.
7.3.1 Overview of Performance
The overall progress made in terms of water resources planning and regulation over the last five years continues to be assessed based on various sub-sector indicators, including numbers of permits applied for as well as assessed, and number of permit holders monitored for compliance.
Permits applications and assessment
This year 179 new, and 92 renewal permit applications were received. A total of 182 new applications (including 3 of the previous year), and all renewals were assessed. 203 permits (new and renewal) including 15 of last financial year, were issued. This year, the number of permits issued decreased from 278 to 20338. Figure 7.9 shows the numbers of water permit applications received, assessed, and issued over the last five years.
Reasons for non-issuance of some water permits were: i) some applicants had drilled many boreholes close together in the same aquifer implying that permitting of abstraction from these boreholes would lead to overexploitation of the groundwater resources in the aquifer, and ii) some boreholes were illegally drilled in gazetted Water Supply Areas and could not be licensed. There is a steady increase in the number of permit applications received and assessed since FY 2011/12 as a result of increased awareness by water users, continuous inventory of the water users and waste water dischargers and close follow up of the illegal water users and waste water dischargers through the Water Management Zones.
38 Note that the numbers of permits issued depend on the applications received and permits which have expired and needs renewal.

Uganda Water and Environment Sector Performance Report 2015
83
Figure 7.9 Numbers of water permit applications and issuance over the last five years
Compliance monitoring of permit holders
This year, 752 permit holders were monitored for compliance with permit conditions as opposed to 672 permit holders in last financial years, which is a slight decrease. However, over the last six years, the trend shows that the number of permit holders monitored for compliance has been increasing as shown in Figure 7.10.
Non tax revenue collection amounting to UGX million 603.9 was collected during the FY 2014/15 from permits application processing fees, annual water use fees and annual wastewater discharge fees. The non-tax revenue collection from permits has continued to increase over the last five (5) years as shown in Figure 7.11. The significant improvement since last financial year is attributed to intensified public awareness raising through newspaper supplements, compliance monitoring visits, scheduled meetings with water use and wastewater permit holders, meetings with drilling permit holders and other non-compliant permit holders and de-concentration of water resources management functions to the WMZs that has enabled close follow up of water users and waste water dischargers.
Figure 7.10 Trends of Number of Permit Holders Monitored for Compliance over the last 6 years
Figure 7.11 Total annual non-tax revenue [UGX mn] from water use permits collected; FY10/11-14/15
7.3.2 Water Use Planning and Allocation
Determination of water use at catchment level through mapping of water users and waste water dischargers in Lake George, Lake Edward and River Kafu basins was finalised. Similar work in Albert
0
50
100
150
200
250
300
Annual target 2014/15 FY11/12 FY12/13 FY13/14 FY14/15
New Permit Applications assessed Permits Issued (New and Renewal)New applications received
0100200300400500600700800
0 200 400 600 800
FY10/11
FY11/12
FY12/13
FY13/14
FY14/15
163.8
230.14
287.75
599.8
603.9

Uganda Water and Environment Sector Performance Report 2015
84
Nile, the Sub-catchment of the Upper Nile Water Management Zone, is to begin in the 1st quarter of FY 2015/16.
Outputs of water use and demand mapping in Lake Victoria ,Lake Albert basins, Lake George, Lake Edward and River Kafu have continued to be been used to improve compliance to the Water Act and the water resources regulations, as reflected in the significant increase in the number of new water use permits issued in the country.
7.3.3 Reservoir Regulation and Dam safety
Two large hydropower dams in Uganda, namely Owen Falls Dam Complex and Bujagali Dam were inspected to ensure that water is released efficiently and the structures are operated in a safe environment. Specifically, the trend in water levels of Lake Victoria was continuously monitored using data from Entebbe and Jinja Piers. In addition, strategic inspections were done to examine the status of infrastructure around the Owen Falls Complex such as; the Jinja pier, source of the Nile and landing sites to ensure that water does not rise above the zero-mark safe level of operation of the Owen Falls Dam Complex.
The sluice gates at the Owen Falls Dam Complex were tested as part of a dam safety measure to check the functionality of the mechanical equipment. It was found that 2 out of the 6 gates were non-functional, thus pausing a significant risk to the dam in the event of an emergency spill. Therefore, a follow-up was made to ensure that all the gates were rehabilitated and tested.
Having concluded the dam inventory and the first draft dam safety guidelines in FY 2013/14, a review was undertaken by a consultant during FY 2014/15 to incorporate stakeholders concerns in the guidelines, but also to gradually build capacity of staff in carrying out inspections. The final guidelines on Dam Safety were produced and await publication; also, dam safety inspection forms were updated, capacity building was done on dam safety inspection and a theory of dam breach analysis introduced.
In addition, 15 new dam construction permit applications were processed, and applicants given advice on the type of hydraulic structures to be installed.
7.3.4 Golden Indicator no. 11: Compliance Monitoring and Enforcement
The golden indicator for water resources management compliance is defined as “% of water abstraction and discharge permits holders complying with permit conditions”. This year, the permit conditions considered are: validity of the drilling permits, possession of wastewater treatment facilities for wastewater discharge, compliance to permitted water abstraction volumes, and quarterly submission of Borehole Completion Reports. Table 1.1 describes the performance of permit holders with respect to indicator compliance conditions.
A total of 752 water permit holders for waste water discharge, drilling permits, groundwater and surface water abstraction permits were monitored for compliance to the provisions of Water Act, Cap 152, 2000. One major area of improvement in water resources regulation has been enforcement, which is being carried out through:
x issuing of letters with permit application forms and procedures of submitting applications and paying for permits to illegal water users and waste water dischargers requesting them to apply for various permits
x writing letters to permit holders reminding them about their compliance status and warning them of the implications of non-compliance to permit conditions,
x requesting for commitment letters to comply before permits are renewed x instituting financial penalties in cases of pollution above the set standards within the
thresholds in the Water (Waste) Discharge Regulations, 1998 x signing compliance agreements or formally committing themselves through writing, and

Uganda Water and Environment Sector Performance Report 2015
85
x popularisation of the de concentrated Water Management Zone offices for ease of submission of application forms, self-monitoring data and accessing of bank payment advice forms.
Through these efforts compliance to water laws and permit conditions has continued to improve (see Table 7.3).
Performance under water resources planning and regulation continues to be assessed using the golden indicator for water resources regulation “the percentage of water abstraction and waste water discharge permit holders complying with permit conditions.” Starting this financial year, permit conditions for drilling contractors are monitored by means of “monitoring quarterly submission of Borehole Completion Reports”.
Table 7.3 Compliance to permit conditions, FY 2014/15
Type of permit Permit Condition No. of permits monitored
No. of permits complying
%
Surface water Abstracting within permitted amount 189 134 71
Groundwater Abstracting within permitted amount 371 263 71 Waste water discharge Effluent discharge 141 73 52 Average compliance - abstraction and waste water discharge 67 Drilling Quarterly submission of Borehole
Completion Reports 51 45 88
Total 752 515 68
The average compliance level to surface water, groundwater and waste water discharge permits is 67%, compared to 64% last financial year, indicating an increment of 3%. The annual target for FY 2014/15 was an increment of 2%. Inclusive of compliance of drilling permit holders, the compliance level is 68%.
Compliance to Water Abstraction Permits
With respect to water abstraction permits, 134 of the surface water permit holders complied with the condition to abstract within the maximum permitted limits, improving from last year’s 68%, to 71% compliance.
For groundwater, 263 permit holders abstracted within the permitted amount, representing 71% compliance. The main challenge faced by permit holders to comply with groundwater permit conditions is accessing water level and discharge meters, which are not readily available in the country. Many groundwater developments have faced the challenge that some drillers do not furnish them with borehole completion reports. As a result, permit issuance is a challenge as they have to redo test pumping to determine the borehole yield. DWRM is therefore providing assistance to the permit holders by giving them information on where to procure meters and providing the necessary technical assistance during their installation.
Compliance to Waste Water Discharge Permit Conditions
Compliance to waste water discharge permit conditions improved from 50% (end June 2014) to 52% (end June 2015). The biggest waste water dischargers such as NWSC facilities, sugar manufacturing companies, leather tanning industries improved their compliance, though they still do not meet the National Standards for Waste water Discharge onto/into land for some parameters. Efforts continue to ensure that measures are taken to comply with these conditions. The challenges faced by these companies relate to inadequate waste water treatment plants in terms of capacity and efficiency.
A number of measures have been taken this year to address challenges of wastewater management. These measures include (i) provision of compliance assistance to permit holders in setting up and operating waste water treatment facilities including monitoring effluent quality, (iv) strengthening enforcement by taking stringent actions on non-complaint permit holders such as heavy penalties and legal action, (v) training staff of DWRM, permit holders and other stakeholders in waste water

Uganda Water and Environment Sector Performance Report 2015
86
management, (vi) reviewing the charging system for pollution to ensure that the funds are high enough to deter permit holders from discharging as well as being able to be used to restore the polluted water bodies.
Working together with the multi-sectoral monitoring technical committee on oil and gas activities, a number of environmental issues in the Albertine Graben are being followed up in the bid to control pollution, ensure sustainable use of the water resources and increase the coordination amongst government agencies that have a stake in the Albertine Graben. To that effect, the ministry participates in the technical committee through joint inspections, sensitisation and awareness campaigns, enforcement and conflict resolution. While efforts have been put in place to treat and dispose of the waste, there is still a challenge of determining the efficiency of the waste treatment facilities due to inability to analyse and assess all effluent parameters associated with oil and gas industry within the country. In addition, efforts are being put in place to assess the effluent being transported from the consolidation area to the treatment facilities to ensure that there are no spills during transportation.
Compliance to Drilling Permit Conditions
A total of 45 drilling permit holders comprising of only those who are actively involved in drilling activities have greatly improved on Quarterly Submission of Borehole Completion Reports, representing 88% compliance. The high compliance levels are due to bi-annual meetings held with drillers and groundwater professionals, in addition to publishing of the drillers with valid drilling permits.
Pollution Control
DWRM, in collaboration with other relevant organisations / institutions (NEMA, DEA, NWSC, KCCA, UCPC and UMA39) and the private sector, has embarked on addressing and controlling pollution of the environment in the greater Kampala area. This has been done through an establishment of a Pollution Task Force with the aim of increasing coordination amongst government agencies in regulating industrial pollution. This is done through joint inspections, sensitisation and awareness campaigns, enforcement and public-private sector dialogue. The work of the taskforce includes the following; i) developing an inventory of all industries surrounding and discharging in the Murchison Bay catchment area ii) monitoring pathways / sources of likely environmental contamination by selected industries iii) environmental compliance auditing of industries to practice cleaner production iv) capacity building especially on quick self-monitoring of facility activities) performing regular joint inspections and quarterly meetings to monitor progress, and vi) developing a simple practical tool with key messages for environmental compliance monitoring in various facility processes of the Pollution Task Force.
During the reporting period, two quarterly visits were undertake to a number of industries40. All the industries visited are implementing cleaner production practices and those who did not have permits have since submitted their application forms.
39 National Environment Management Authority, Directorate of Water Resources Management, Directorate of Environmental Affairs, National Water and Sewerage Corporation, Kampala Capital City Authority, Uganda Cleaner Production Centre and Uganda Manufacturers Association
40 include Peacock Industries Limited, Kampala Pharmaceutical Limited, Ngege Fish Factory, Uganda Fish Packers, Harris International, Graphics System, Megha Foam, Macdough Foods, House of Eden, E-care Investments, Uganda Breweries Limited, Golden Harvest Industries Ltd, Fine Spinners Garment Factory, Phenix Logistics Uganda Ltd, Mukwano Industries (Oil and Soap)

Uganda Water and Environment Sector Performance Report 2015
87
7.3.5 Environmental Impact Assessments
DWRM reviewed Environmental Impact Assessment reports submitted through NEMA by various developers of water resources related projects and programs. Figure 7.12 shows the environmental reports reviewed in this reporting period.
Figure 7.12 Environmental reports reviewed in FY 2014/15
A total of 146 environmental reports, including 36 consultative meetings, were prepared during the reporting period. The review findings and recommendations were submitted to NEMA for consideration at various decision making levels and for follow up with the project developers. Additionally, 6 quarterly environmental monitoring reports of the oil and gas industry were received and reviewed. Most of the reports reviewed were related to hydroelectric power generation, oil and gas industry, water abstraction and road construction projects. Annex 16 provides the summary of the major issues and recommendation of the reviewed EIAs
Table 7.4 Numbers of Environmental Reports Reviewed (FY 2008/9- 2014/15) Report type No of Reports Reviewed over last seven years
2008/9 2009/10 2010/11 2011/12 2012/13 2013/14 2014/15 Environmental Impact Assessment
12 34 16 30 24 30 36
ToRs for planned Projects
13 19 4 6 3 8 29
Environmental Audit Reports
1 8 4 3 4 11 4
Scoping Reports 0 0 0 2 17 10 29 Consultative meetings
0 0 0 8 18 6 36
Project Briefs 3 3 2 8 18 8 12 Total 29 64 26 57 84 73 146
Twenty seven (27) companies with Certificates of EIA approval were visited to assess compliance to the approved recommendations and planned environmental management, and were provided with water use applications forms. All in all, 11 of these companies have responded by applying for various permits.
7.3.6 Water Laws, Policies and Regulations
During the reporting period, Water Policy Committee held a meeting in Kasese in May 2015 to deliberate on issues of flood management in Kasese, transboundary water resources management, operation and maintenance of Mubuku Irrigation Scheme, rural water supply strategy, National Water Resources Strategy, water and industrial development, bulk water supply, irrigation policy for Uganda, amendment of the Water Bill, and emergency risk management. This meeting was preceded by a field visit to appreciate water and related challenges for purpose of providing well informed policy advice and guidance to the sector. Recommendations of the WPC are being implemented by various
Environmental Impact AssessmentToRs for planned ProjectsEnvironmental Audit ReportsScoping ReportsConsultative meetingsProject BriefsTotal

Uganda Water and Environment Sector Performance Report 2015
88
Ministries, Departments and Agencies of Government in sectors such as Water, Environment, Energy, Agriculture, Industry, Local government, including Private sector and Academia. One of the key recommendations of the WPC is that the Urban Water Regulatory Authority should now cover also rural water supply and water for production and should be called “Water Supply and Sewerage Regulatory Authority”.
The amended Water Policy and Legislation was submitted to the First Parliamentary Counsel (FPC) of the Ministry of Justice and Constitutional Affairs for re-drafting. The latest version of the Water Bill redrafted by the FPC is being reviewed internally to address the identified inconsistencies in addition to inclusion of new regulatory aspects related to rural water supply and water for production as recommended by the WPC. The final version of the Bill is expected to be presented to Cabinet for approval by the end of 2015.
7.3.7 Finalisation and Approval of the National Water Resources Strategy
The National Water Resources Strategy (NWRS) was developed following the finalisation of the National Water Resources Assessment. The strategy aims to provide a framework for integrated management and development of the country’s water and related resources so as to effectively contribute to the realisation of the objectives of the National Development Plan. The strategy sets the stage for the development and management of Uganda’s water resources up to the year 2040. During FY 2014/15, the strategy was reviewed, finalised and approved by the Water Policy Committee for printing and dissemination.
The strategy has a vision, objectives and strategic action for water resources management in Uganda up to 2040. The vision that resulted from the stakeholder consultations is: “Water resources management in Uganda is effective in contributing to economic and social development and maintaining environmental services”. To realise the vision there are three objectives: (i) Ensure sustainable and equitable allocation and provision of water of appropriate quantity and quality, (ii) Mitigate the effects of extreme climatic events, and (iii) Strengthen the water governance framework.
The NWRS has been aligned with Uganda’s Vision 2040, and provides a long-term planning perspective for water resources (2015-2040). It is intended that the NWRS will be implemented progressively in five year tranches in line with GoU’s overall planning timetable, with reporting and review at the end of each tranche. This will allow for learning and for adjustments based on experience. Actions under the NWRS will be budgeted within the regular budgets of each implementing agency. It is proposed that in each five year period a number of priority actions would be bundled as projects and proposed for development partners’ participation and support. However, in programming, all NWRS actions will be considered but themes/outputs currently judged to be priority will receive special attention in the first round of programming.
7.3.8 Operationalisation of the Water Source Protection Guidelines
According to the Water Source Protection Guidelines (2013), each water infrastructure project is expected to provide 3% of its budget for use in catchment/source protection. However, arrangements on how these funds would be managed and utilised have not been developed.
Both the Water and Environment Sector Working Group and the Water Policy Committee, upon approval of the guidelines in 2013 requested DWRM to propose “how the source protection funds should be determined for both new and ongoing projects41, and how the funds will be managed and utilised”, for subsequent approval. Work has been ongoing to address the above directive, and this has involved extensive consultations with key stakeholders. The work is in its final stages of completion; some proposals arising out of the assessment are presented in Box 7.1.
41 Steps should be taken so that the future 3% contribution strategy will cover the existing facilities as well.

Uganda Water and Environment Sector Performance Report 2015
89
Box 7.1 Highlights of proposal for operationalisation of 3% for water source protection The principles to apply in determining the contribution to Water Sources Protection:
a. The contribution will be applied to both capital development (infrastructure development) and recurrent (operations and maintenance) cost. Capital investment costs will generate one-off contribution while O&M will provide regular contribution during the lifespan of the infrastructure.
b. Contribution to Water Source Protection shall be independent of other water charges or fees (e.g. Water Permit, EIA fees) that may be imposed by Government from time to time. This is to ensure that the contributions are directly invested in source protection activities and NOT captured as non-tax revenue to the consolidated fund.
c. The amount of contribution shall aim at being commensurate with the scope of issues to be addressed. The formula for determining level of contribution: The following factors shall be taken into account independently in determining the amount of contribution.
a. Cost of the infrastructure design, construction and commissioning (Capital development). b. Actual or projected costs for operation and maintenance.
Contribution from capital investment will amount to 3 % of the budget components as presented in the infrastructure design manual namely Land acquisition, Planning and feasibility studies, Engineering designs, Construction and Equipment and furnishings. Contribution from operation and maintenance will be computed as 3 % of budget components as presented in the infrastructure design, manual namely Cost for water purification/quality control, Cost for expansion for sustaining water quantity, Revenue (payment of water use based on volume), The priority budget components are associated with maintaining water quantity and quality as well as enhanced benefits from water use. Computation of the Contribution: Capital development and water treatment cost may not accurately reflect the scope of source protection issues. In most cases, capital development budget is based on the size of targeted consumers, mode of supply infrastructure, projected energy use, and distances from source to end user. However, being a one-off contribution, it provides funds for investment into long term source protection interventions that would be serviced by contributions from O&M. The budget for water treatment takes into account the quality of the water at source point. Fourthly, the stakeholder contribution should, at minimum, achieve tangible results in terms of reduced pollution and sustaining water quantity. On this basis, the minimum levels of contribution have been recommended. Collecting and managing the contributions: Stakeholder contributions shall be collected and managed under any of the following two arrangements:
a. Retention by Contributor: Under this arrangement, institutions will be required to allocate and declare budget for source protection but retain the money. The institutions will be required to pay directly for activities for preparation and implementation of Source Protection Plans but the overall responsibility for monitoring and follow up of this will be by the Water Source protection Committee with support of DWRM as the regulator.
b. Source Protection Fund: The fund will be created and managed by stakeholders in a catchment through the Water Source protection Committee or catchment Management Committee as the case may be. The contribution to source protection will be deposited in this fund. The management and decision making regarding use of these funds will be guided by the water Source Protection Plan approved by the committee or in its absence by the procedures as set out by the committee.
Setting priorities for the utilizing the contributions: The priority actions to benefit from the contributions towards the water source protection will be derived from the Water Source Protection Plan. It is expected that the following categories of activities will feature among the priorities:
a. Sustainable land management activities (soil and water conservation). b. Greening the water source point or catchment e.g., afforestation, reforestation, landscape /habitat restoration. c. Catchment management activities aimed at sustaining water recharge and retention capacities e.g., conservation
of wetlands, forests, aquifers recharge structures etc. d. Pollution control e.g., river bank/lake shore management, waste management, soil erosion control, etc. e. Enforcement and compliance monitoring activities e.g. meetings of Water source committee, enforcement etc. f. Securing water source through acquisition of land around abstraction point and fencing such land. g. Community mobilisation and sensitisation in aspects of water source protection.
Lessons learning and feedback mechanisms: The strategy will be implemented such that it provides opportunity for learning and consolidation. MWE shall convene regular stakeholder meeting to review progress, learn lessons and develop proposals strengthening performance.
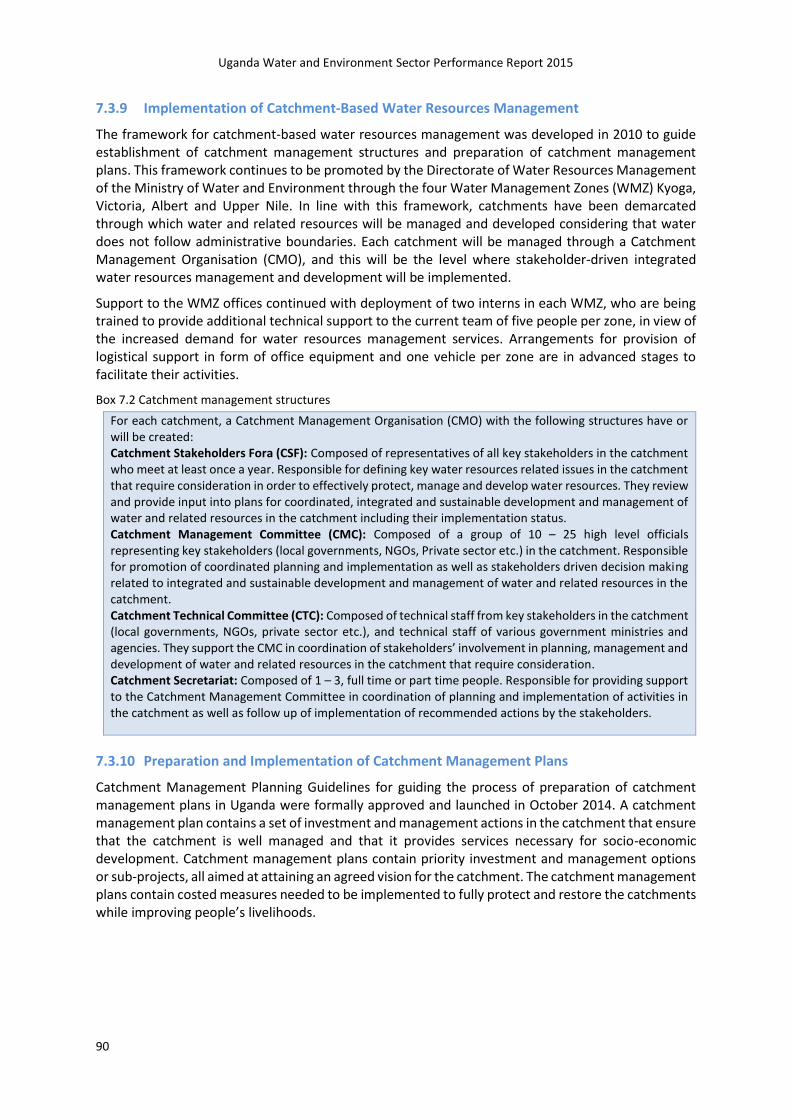
Uganda Water and Environment Sector Performance Report 2015
90
7.3.9 Implementation of Catchment-Based Water Resources Management
The framework for catchment-based water resources management was developed in 2010 to guide establishment of catchment management structures and preparation of catchment management plans. This framework continues to be promoted by the Directorate of Water Resources Management of the Ministry of Water and Environment through the four Water Management Zones (WMZ) Kyoga, Victoria, Albert and Upper Nile. In line with this framework, catchments have been demarcated through which water and related resources will be managed and developed considering that water does not follow administrative boundaries. Each catchment will be managed through a Catchment Management Organisation (CMO), and this will be the level where stakeholder-driven integrated water resources management and development will be implemented.
Support to the WMZ offices continued with deployment of two interns in each WMZ, who are being trained to provide additional technical support to the current team of five people per zone, in view of the increased demand for water resources management services. Arrangements for provision of logistical support in form of office equipment and one vehicle per zone are in advanced stages to facilitate their activities.
Box 7.2 Catchment management structures For each catchment, a Catchment Management Organisation (CMO) with the following structures have or will be created: Catchment Stakeholders Fora (CSF): Composed of representatives of all key stakeholders in the catchment who meet at least once a year. Responsible for defining key water resources related issues in the catchment that require consideration in order to effectively protect, manage and develop water resources. They review and provide input into plans for coordinated, integrated and sustainable development and management of water and related resources in the catchment including their implementation status. Catchment Management Committee (CMC): Composed of a group of 10 – 25 high level officials representing key stakeholders (local governments, NGOs, Private sector etc.) in the catchment. Responsible for promotion of coordinated planning and implementation as well as stakeholders driven decision making related to integrated and sustainable development and management of water and related resources in the catchment. Catchment Technical Committee (CTC): Composed of technical staff from key stakeholders in the catchment (local governments, NGOs, private sector etc.), and technical staff of various government ministries and agencies. They support the CMC in coordination of stakeholders’ involvement in planning, management and development of water and related resources in the catchment that require consideration. Catchment Secretariat: Composed of 1 – 3, full time or part time people. Responsible for providing support to the Catchment Management Committee in coordination of planning and implementation of activities in the catchment as well as follow up of implementation of recommended actions by the stakeholders.
7.3.10 Preparation and Implementation of Catchment Management Plans
Catchment Management Planning Guidelines for guiding the process of preparation of catchment management plans in Uganda were formally approved and launched in October 2014. A catchment management plan contains a set of investment and management actions in the catchment that ensure that the catchment is well managed and that it provides services necessary for socio-economic development. Catchment management plans contain priority investment and management options or sub-projects, all aimed at attaining an agreed vision for the catchment. The catchment management plans contain costed measures needed to be implemented to fully protect and restore the catchments while improving people’s livelihoods.

Uganda Water and Environment Sector Performance Report 2015
91
Currently, catchment management planning is ongoing in a total of 10 catchments42 in the country. All these catchments have draft catchment management plans, while 6 plans43 have been finalised following the catchment planning guidelines. The catchment management plans of the remaining 4 catchments are being reviewed and finalised. Work has just started in an additional 5 catchments44 following the Catchment Planning Guidelines.
Catchment Management Organisation structures in the form of Stakeholder Forums and Catchment Management Committees have formally been created in 6 of the 10 catchments45, and these are fully operational. These structures are playing a key role in guiding the preparation and implementation of the Catchment Management Plans46.
Implementation of catchment management plans is ongoing in a number of catchments in each of the 4 WMZs, as detailed in the following sections.
Albert Water Management Zone
Mpanga Catchment
Activities in Mpanga Catchment are jointly implemented by the Directorate of Water Resources Management/Albert Water Management Zone and Protos, a Belgium funded NGO which has been active in the catchment since 2006. A draft Catchment Management Plan (CMP) earlier developed has been updated to ensure that it is consistent with the Catchment Planning Guidelines. In addition, a 21 member Catchment Management Committee has also been re-constituted and this went ahead to approve the CMP. To move the catchment management process forward, implementation of several activities ranging from wetland demarcation, nursery bed development, reforestation of degraded landscapes, soil and water conservation has been initiated in collaboration with various partners47.
The following interventions were undertaken:
(i) Constructed four shallow wells and rehabilitated one natural spring.
(ii) Water point source protection measures for the four shallow wells using soil and water conservation measures “Fanya Chini” trenches. These are intended to minimize soil erosion and maximize water retention and recharge of shallow wells as a way of ensuring sufficient water from the wells throughout the dry season.
(iii) Established two nursery beds of capacity 30,000 tree seedlings to be planted after the on-set of rains.
(iv) Demarcated 2 km2 of Karambi wetland, a tributary of R. Mpanga in Kahunge sub-county using grevillea tree seedlings to mark off the buffer areas.
(v) Established and trained Karambi wetland management committee (IWRM committee) which developed a draft Karambi wetland management plan
(vi) Protected 7 water sources by planting trees, fencing and digging soil erosion diversion channels
42 Upper Aswa, Mpanga, Semliki, Rwizi, Ruhezamyenda, Lokok, Awoja, Maziba, Middle Malaba and Lower Malaba.
43 for Awoja, Maziba, Middle Malaba, Lower Malaba, Ruhenzamwenda and Mpanga catchments
44 Mpologoma, Victoria Nile, Aswa, Albert Nile and Kiha catchments
45 Upper Aswa, Mpanga, Maziba, Rwizi, Ruhezamyenda and Awoja catchments
46 The Catchment Management Organisation structures for the remaining catchments where catchment planning activities have been completed or are ongoing are planned to be formally created during FY 2015/16.
47 Joint Effort to Save the Environment (JESE); Tooro Botanical Gardens (TBG), Natural Resources Defence Initiative (NRDI) and Rain Foundation

Uganda Water and Environment Sector Performance Report 2015
92
Ruhezenyande Catchment
In collaboration with Kigezi Diocese Water and Sanitation Program, implementation of catchment based water resources management activities were implemented in the Ruhezenyande Catchment covering parts of Kabale and Kisoro districts. A Catchment Management Plan has been prepared. A 16 member Catchment Management Committee has been instituted to oversee implementation of the catchment management plan and the identified interventions.
Semliki Catchment
In collaboration with World Wide Fund for Nature (WWF), implementation of catchment based water resources management activities was initiated in Semliki catchment in 2008, culminating into the preparation of a Catchment Management Plan. With the development of the Catchment Planning Guidelines, and in light of emerging issues, this plan is being reviewed and updated to ensure consistency with the Guidelines. It is expected to be finalised by October 2015. Follow up activities have been undertaken in the catchment as follows:
(i) Conducted four awareness raising sessions to communities targeting the Water User Groups (WUGs) on IWRM, gender and climate change issues
(ii) Built capacities of three WUGs in group dynamics, resource mobilisation and organisational management.
(iii) Demarcated a stretch of 2.2km of R. Semliki banks with barbed wire, and local poles “Endinda Misiri”. The buffer zone was stabilised with bamboo rhizomes.
Figure 7.13 Seedlings being distributed to beneficiaries for catchment management
The private sector48 provided seedlings and funding to support conservation of the Rwenzori ecosystem in 2015. This contribution will support communities organised under five Water User Groups to enhance riverbank stabilisation, establishment of soil and water conservation measures and adoption of energy-saving technologies.
48 Tronder Power Ltd, and Hima Cement Ltd.

Uganda Water and Environment Sector Performance Report 2015
93
Figure 7.14 Bamboo Nursery Cuttings for marking riparian land ofrivers Mubuku and Nyamwamba
Fourteen awareness and sensitisation meetings were conducted with 14 WUGs in the Mubuku -Nyamwamba catchment, and Payment for Ecosystem Services was introduced as a sustainable mechanism for financing conservation of Rwenzori Mountains National Park ecosystems. The meetings involved key stakeholders in catchment management, including Kasese District Local Government, Directorate of Water Resources Management (AWMZ), private sector representatives from Hima Cement Ltd and Tronder Power Ltd and the Water User Association.
The capacities of WUGs were assessed during the meetings to find out the functionality and effectiveness of WUGs in catchment management. Specific training needs identified, included: tree planting and management, soil and water conservation practices and group structures and governance. The following activities were implemented:
(i) 911 farmers were trained in group governance/functioning and effectiveness in implementation of catchment management interventions
(ii) 25 farmers were trained in Tree planting, siltation and sediment management on L. Kahendero
(iii) 35km of Soil and water conservation structures constructed within the catchment (agronomical and Mechanical conservation measures )
(iv) 2km demarcated by Marking and vegetating the riparian land (buffer) around Mubuku-Nyamwamba rivers.
(v) Catchment rehabilitation by planting of trees and bamboo on river buffer areas
(vi) Woodlot establishment
Kiha Catchment
The Kiha Sub-Catchment, which is part of the greater Kafu Basin faces a lot of challenges that include those resulting from watershed degradation, institutional weaknesses and general lack of awareness and political will in sound environmental management. In addition to these challenges, the catchment is home to Kinyara Sugar Estates, one of the main sugar producing entities in Uganda. Makerere University College of Agricultural Engineering has undertaken several baseline studies within the catchment as part of their IWRM postgraduate programme. Furthermore, a tripartite arrangement between DWRM, GIZ and Kinyara Sugar Works has been initiated to promote IWRM interventions through the development of a water stewardship program.
The activities undertaken jointly with partners include:
(i) Mapping and training of stakeholders in IWRM and climate change adaptation. A total of about 80 participants were identified and trained in the policies, strategies and guidelines of IWRM intervention methodologies. These included the political and technical leadership of the Local

Uganda Water and Environment Sector Performance Report 2015
94
Government; civil society organisation and the media. Training on how to mainstream and adapt to the impacts of climate change was also conducted for the same participants.
(ii) A baseline survey was undertaken in the catchment to establish the levels of degradation and identify suitable intervention areas.
Figure 7.15: Untreated effluent from Waragi Distillation in Buliime being discharged into the wetland
Figure 7.16. Impact of waragi distillation in Buliime-Kiha Catchment
Upper Nile Water Management Zone
Upper Aswa catchment
Implementation of catchment based water resources management activities was initiated in Upper Aswa catchment in 2008 culminating into the preparation of a draft Catchment Management Plan. Implementation of interventions in the catchment has been ongoing. Three hotspot micro- catchments were identified, mapped and ranked in Lira, Alebtong and Otuke districts for restoration. Procurement of a consultant to implement the interventions in the three micro-catchments has been completed.
Nyimur multipurpose water resources management and development project was launched and feasibility studies initiated and these will be completed by end of 2016.

Uganda Water and Environment Sector Performance Report 2015
95
Aswa and Albert Nile catchments
Development of Catchment Management plans for Aswa and Albert Nile catchments is ongoing. As part of this process, studies for a comprehensive situation assessment and preparation of Upper Nile Water Management Zone strategy and action plan and preparation of two Catchment Water Resources Development and Management Plans in Aswa and Albert Nile Catchments have been initiated. An inception workshop was conducted comprising Political leaders, technical staff in all the Districts in UNWMZ and the line Ministries, Private Sector, Civil Society Organisations and NGOs, whereas the inception report has been prepared and shared with the key stakeholders.
Victoria Water Management Zone
Rwizi catchment
During the reporting period, the Catchment Stakeholders’ Forum (CSF), constituting of 153 members held its 3rd meeting in May 2015 to review progress on development of Catchment Management Plan (CMP) and to highlight to the Catchment Management Committee (CMC) emerging issues in the catchment. One of the main issues raised was encroachment on the wetlands, river banks and their buffer zones. The CSF recommended to the CMC to kick start demarcation of the buffer zones for ecosystems. Demarcation of River Rwizi buffer zone in Mbarara Municipality, a stretch of approximately 15 km is ongoing.
A detailed assessment of Rubara micro-catchment in Nsika Buhweju for intervention requirements has been carried out, Bills of Quantities developed and a consultancy to undertake implementation is in final stages of procurement. Other micro-catchments projected for interventions are Masholo, in Masheruka, Sheema District, and Nyabishaho in Kabingo, Isingiro District.
Through a Public Private Partnership (PPP) between MWE, GIZ and Coca-Cola, the project “Improved community livelihood and sustainable Water Resources Management in Rwizi” extends safe and clean water to approximately 2,700 community members of Masheruka in Sheema district and Bukiro in Mbarara District, as an incentive to the people for restoration of the wetland. These are areas that border Nyakambu wetland system, where 280 hectares of the wetland were restored.
Kagera Catchment
A Catchment Management Plan for Maziba catchment in Kagera basin of Uganda has been developed (see also Section 7.5.3). The Sub- catchment Management plan has been approved by Kabale District Council for implementation.
The Catchment Management Organisation for Maziba has been set up. This includes the Catchment Stakeholders Forum that was established on 4th December 2014 and a 21 member Catchment Management Committee (CMC). The CMC for Maziba had a one week induction training on its roles and responsibilities including learning visits to Mbarara, Kamwenge and Isingiro districts with the objective of having the CMC exposed to practices that could help them in guiding implementation of the developed Maziba CMP. The CMC had its first formal meeting on 10th April 2015 with the objective of prioritizing activities and areas where to carry out interventions. The priority activities and areas have since been assessed in details by a technical team.
Katonga catchment
Initiation of a consultative process with key stakeholders on the rationale and processes for development of a CMP for Katonga has been done. A reconnaissance field assessment by a team of technical officers from DWRM, VWMZ, Wetlands Department and the relevant technical staff from the District Local Governments has been carried out. This has facilitated the process for development of a Terms of Reference for development of a CMP for Katonga, and procurement for the same has already been initiated.

Uganda Water and Environment Sector Performance Report 2015
96
Additionally, VWMZ has hired a consultant to produce a state of the art information system for the Zone. The consultant has submitted an inception report. This information system will aid decisions-makers in quickly pointing out areas that require immediate interventions.
Kyoga Water Management Zone
Awoja Catchment
The Awoja Catchment Management Plan (CMP) was finalised and approved by the Catchment Management Committee (CMC) at its inaugural meeting that took place on 24th June 2015. To pave way for implementation of the plan, priority interventions in three critical hotspots in the catchment were identified and priority interventions prepared. These interventions were approved by the CMC and are now being packaged for implementation.
In addition, a one-day training workshop on Climate Change adaptation was organised for members of Awoja Catchment Management Committee (CMC). The objective of the training was to provide knowledge and understanding of challenges posed by climate change, build capacity of the CMC to understand the challenges of climate change on water resources and how they can be addressed within the framework of catchment based planning and management, and assist the CMC to identify opportunities for adapting to impacts of climate change by applying an IWRM approach.
Lwakhakha Catchment
Works related to implementation of the Lwakhakha Sub-Catchment Management Plan is on-going, and is focusing on identifying specific interventions to address water resources issues prevailing in the Sub-Catchment. As part of this work, sub-projects with bill of quantities for three priority intervention areas are being prepared and work is expected to be completed by end of October 2015.
Mpologoma and Victoria Nile catchments
Development of Catchment Management plans for Mpologoma and Victoria Nile catchments is ongoing. The plans will mainly comprise a number of agreed investments in infrastructure and other interventions prepared to prefeasibility level; and various water management interventions and actions meant to help resolve conflict, conserve and protect the catchment and its natural resources, and ensure equitable access to and use of water resources. Capacity building to the WMZ is a key component of the work in the two catchments.
In an effort to increase access to information needed for water resources planning at all levels by stakeholders, a state of the art knowledge base for Kyoga WMZ is under development.
7.3.11 Conclusions and Way Forward
Performance of water resources planning and regulation functions has continued to improve compared to previous years as a result of strengthening of the Water Management Zones. The de-concentration of water resources management functions through the four WMZs has brought services such as compliance monitoring, compliance assistance and awareness raising closer to the permit holders. This has ultimately improved performance in terms of water permits issuance and compliance monitoring and enforcement. Through the WMZs, awareness about the need for catchment based integrated water resources planning, allocation and regulation of water resources has greatly improved among the stakeholders who have responded through applying for various water permits. The increasing trend of water permits issuance will continue as the capacity WMZs improves through additional staff, facilities and financial resources.
Furthermore, finalisation of the regulatory framework for dams and reservoirs and the wide dissemination and promotion of use of the EIA guidelines continues to assist in water resources planning and regulation and hence protection of water resources.

Uganda Water and Environment Sector Performance Report 2015
97
7.4 Water Quality Management
7.4.1 Water Quality Monitoring Networks
The Ministry of Water and Environment (MWE) conducts drinking water quality assessments to ascertain compliance of these sources with National Drinking (potable) water Standards 2008, class I and II. In addition, MWE operates a national water quality monitoring network comprising 119 stations located in major lakes, rivers, ground water and waste discharge establishments. Water quality monitoring is carried out by the four Water Management Zones (WMZs which include Kyoga Water Management Zone (KWMZ), Albert Water Management Zone (AWMZ), Victoria Water Management Zone (AWMZ) and Upper-Nile Water Management Zone (UWMZ).
Figure 7.17 Number of monitoring stations in each WMZ
MWE also conducts water quality assessments on drinking and wastewater effluents for compliance with National standards checks (Standards 2008, class I and II).
Out of the 119 monitoring stations, 105 were monitored in the financial year under review, representing 88% achievement, a slight improvement from last financial year where achievement was at 84%.
The continued increase in stations monitored since FY 2010/11, when only 26% were monitored, is attributed to the de-concentration of the monitoring activities and increased funding. A total of 2,303 samples were collected and analysed out of the planned 2,000 water and wastewater samples, constituting 115% performance.
Table 7.5 Number of water quality samples tested in water testing laboratories in 2014/15
Serial Number
Sample Source Number of samples Performance (%)
Target Received
1 Kyoga WMZ 200 292 146
2 Victoria WMZ 200 229 115
3 Albert WMZ 200 380 190
4 Upper Nile WMZ 200 194 97
5 National Water Quality Reference Laboratory (NWQRL) 1,200 1,208 101
6 Grand Total 2,000 2,303 115
The remarkable improvement in performance of the WMZs in terms of sample collection in the year under review was due to increased funding for monitoring, awareness created through sensitisation, increased supervision and establishment of basic laboratories in Upper Nile WMZ and Albert WMZ, in addition to the one operating in Kyoga WMZ. Kyoga WMZ received a total of 417 samples of which 125 (30%) were from clients, and 292 samples were from the national monitoring network.
MWE received overall a total of 3,121 samples from both monitoring activities and clients. 894 (28%) of the samples were from external clients, a reduction in percentage from 38% the previous year. In absolute numbers, there was an increase in the number of client samples received. The low percentage was due the high number of samples received. The WMZs contributed 1,095 samples out of the targeted 800, representing a performance of 137% the highest performance recorded since the

Uganda Water and Environment Sector Performance Report 2015
98
establishment of the WMZs three years ago. 107 samples were received from MWE departments. More samples received and analysed were from the assessments in response to typhoid outbreak that was experienced in over 20 Districts in Uganda.
The efficiency in handling client requests has continued to increase as shown by the reduced sample turnaround time49 from 10 working days to now 7 working days. The improvements can be attributed to installation of robust water and wastewater analysis equipment, staff capacity building both in-house and externally and effective supervision. Out of 3,121 samples received, 2497 (80%) were analysed in compliance to the new targeted 7 working days and it showed an improvement from the previous year, when at the compliance was 77%.
Figure 7.18 Samples received and compliance with targets (7 working days)
In the last three years, there has been a general increase in the overall laboratory capacity to collect and process water and wastewater samples. This increased efficiency is attributed to de-concentration of monitoring activities to the WMZs, availability of funds for network monitoring and increased demand for water quality analytical services by the clients are among reasons for increased performance in this area. The acquisition and installation of 3 state-of-the-art laboratory equipment that was done two years ago has reduced work load and sample turnaround. The one year interns have helped address on a short term basis the human capacity gaps.
Sample turnaround could have reduced further, but due to challenges like delayed delivery of laboratory chemicals and reagents, low staffing levels and regular power surges it was not possible to achieve that. However, these challenges are being addressed through framework contracts, recruitment of trainees and standby backup power sources/exploration of solar power.
7.4.2 Oil and Gas On-line Monitoring Equipment
MWE procured a set of water quality monitoring equipment and accessories to detect and identify presence/absence of toxic wastes from oil and gas activities in the Albertine Graben. The monitoring equipment and its accessories comprise three components namely: National Command and Control Centre (NCCC) located at MWE’s Directorate of Water Resources in Entebbe; Mobile Unit that will be
49 Turnaround time (TAT) is one of the most noticeable signs of laboratory service and is often used as a key performance indicator of laboratory performance.
08/09 09/10 10/11 11/12 12/13 13/14 14/15Compliance to 7 working days 1,290 1,385 1,896 1,649 1,383 1,874 3,121Number of sampls recieved 83 60 45 62 73 79 80
0
10
20
30
40
50
60
70
80
90
-
500
1,000
1,500
2,000
2,500
3,000
3,500
Sam
ples
Rec
eive
d
Com
plia
nce
to 7
wor
king
days
(%)

Uganda Water and Environment Sector Performance Report 2015
99
movable from one location to another and two Fixed Stations located at Pakwach town water Supply and Bugoma, Hoima (King Fisher oil fields)on Lake Albert. The system of the three components now relays information remotely to the Water Quality Management Department in Entebbe.
Two staff from MWE completed training on the equipment’s Operation and Maintenance requirements in the United States and mobilisation of stakeholders in the Albertine Graben for installation of the equipment was conducted. The equipment was installed, tested and commissioned. The ability of this equipment to relay data online (Telemetry) to the Command and Control Centre at DWRM will help in early detection of oil pollution in lake Albert and will enable the country to respond timely and promptly to any disasters that may result from such pollution.
When the equipment is fully functional this financial year 2015/16, it will analyse and identify potential pollutants in water which are a results of oil and gas pollution in very minute concentrations.
Figure 7.19 National Command & Control Centre
Figure 7.20 Mobile unit and accessories of the oil and gas monitoring system
Figure 7.21 Installation of fixed monitoring stations in Pakwach water supply-Nebbi District
7.4.3 National Water Quality Database and Information System
The Ministry of Water and Environment completed a database needs assessment and prepared guidelines for design, development and installation of a web-based National Water Quality Database and a Laboratory Information System (LIMS) that is responsive to the stakeholder data needs and upgrades in technologies. The database will be robust and includes Geographical Information system (GIS) packages and data analyses tools for better performance. It will link all the WMZs regional databases and will produce information products useful to all stakeholders for decision making. The Ministry has launched development of a Water Information System (WIS) for all water databases in DWRM Entebbe which will be closely linked with the current NWQMD and LIMS.

Uganda Water and Environment Sector Performance Report 2015
100
7.4.4 Water Quality Testing Laboratories
MWE operates a three-tier laboratory system at national and regional levels in line with the National Water Quality Management Strategy (NWQMS) 2006. The three-tier laboratory system comprises the National Water Quality Reference Laboratory (NWQRL) at the MWE’s Directorate of Water Resources Management in Entebbe, four regional laboratories in the WMZs and satellite laboratories in drinking water treatment works. Three of the four regional laboratories are operational, with basic water quality monitoring equipment in modified enclosures, including Kyoga, Upper Nile and Albert WMZs and are operational. Establishment of a basic regional water quality laboratory in Victoria Water Management Zone is planned for this financial year 2015/16.
7.4.5 The Laboratory Quality System and Quality Assurance
MWE is following a roadmap for accreditation which is phased as follows: internal review of documentation, method validation and un-certainty, submission of documents to accreditation body for review, incorporation of the comments, applying for pre-assessment and accreditation. In order to improve performance, MWE is developing a National Laboratory Policy (NLP) for water and environmental quality services to support best practices and regulation of all laboratories providing water and environmental analytical services in Uganda. The policy will also facilitate networking, data and information sharing among relevant stakeholders. For effective implementation of the policy, accreditation of the National Water Quality Reference Laboratory (NWQRL) is key to give international recognition of the NWQRL.
7.4.6 Non-Tax Revenue (NTR)
In addition to providing laboratory services for its own monitoring networks, MWE also extends similar services to the public at a cost and collects Non-Tax Revenue (NTR) which is paid to the Consolidated Fund. Figure 7.22 shows NTR generated from the NWQRL and Mbale Regional Water Quality Laboratory (MRWQL) over the years. NRWQL started operation three years ago. The other two regional laboratories in Upper Nile and Albert WMZs have just been established and have not started rendering services to the public.
The trend in non-tax revenue shows a general increase over the years; the financial year under review showed a 166% performance, at UGX mn 82.9 million, compared to target of UGX 50 million. The increased improvement in non-tax revenue generation was attributed to increased efficiency and reliability in service delivery and awareness raised by MWE on the services offered to the public and its policy of bringing services closer to the customers through establishment of regional laboratories in Mbale, Lira and Fort Portal. It is also attributed to the operationalisation of state of the art equipment the Ministry recently acquired, which has increased the number of parameters being analysed and shortened the sample turn-around time.
Figure 7.22 NTR generation from laboratory analytical services
6.0 11.6 41.6 39.0 34.448.5 73.55.1
19.5
9.4
0.020.040.060.080.0
100.0
08/09 09/10 10/11 11/12 12/13 13/14 14/15NWQRL MRWQL

Uganda Water and Environment Sector Performance Report 2015
101
7.4.7 Capacity Development of Local Governments
MWE conducts training on water quality monitoring for Local Governments, Non-Government Organisations (NGOs) and the private sector in the areas of water quality sampling, testing and data interpretation.
In June, 2015, the department in response to outbreak of typhoid conducted training for 37 participants from 20 Districts (Mukono, Mpigi, Jinja, Kasese, Arua, Yumbe, Maracha, Adjumani, Bundibugyo, Isingiro, Manafwa, Kween, Bukwo, Kapchorwa, Bugiri, Kabaale, Kumi, Katakwi and Luwero) that had reported high suspected cases of typhoid.
Kyoga Water Management zone in collaboration with Water and Sanitation Development Facility –East (WSDF-E), conducted a similar training for private water operators in Karenga, Kaabong, Katakwi, Abim and Bukedea. In addition, the Zone trained Kween local government staff responsible for water and sanitation on water quality monitoring and testing using potable water testing kits.
7.4.8 Water Quality Assessments
Several water quality assessments were carried out. A case study of the water quality status of Lake Bisina in Eastern Uganda revealed that, although the Lake is infested with macrophytes, and the water quality is negatively impacted by cage fish farming and shoreline cultivation, the Lake water still has a good physical, chemical and biological water quality.
Also, in response to a Typhoid fever outbreak in Kampala, over 700 different drinking water sources from schools, organised communities, informal settlements, suburbs and municipalities were sampled and tested for mainly bacteria of faecal origin (E.coli). Different drinking water source types, namely bottled water, locally packed water sources, boreholes, shallow wells and protected springs were sampled and assessed for compliance to the National Drinking Water Quality Standards. Key issues that were identified included:
x Poor sanitation and hygiene in and around water sources x Poor operation and maintenance leading to contamination of ground water x Degradation of water catchment areas. x Uncertainty on whether bottled water is factory packaged or locally packaged
There were notable differences in the level of contamination of water from different water abstraction technology types. Results showed that protected springs are the most prone to contamination followed by shallow wells. Deep boreholes showed less contamination possibly due to the deep nature of the ground water aquifer as compared to the shallow aquifers for other technologies. Use of guidelines on water source protection developed by DWRM should be implemented if the quality of rural water supply technologies is to be improved (see also Annex 17).
An emergency water quality issue, in the form of a new water weed invading Lake Kyoga, is summarised in Box 7.3.

Uganda Water and Environment Sector Performance Report 2015
102
Box 7.3 Infestation of Lake Kyoga with a Water weed-Salvinia molesta In the last two to three years, there has been an invasion of lake Kyoga by a new water weed called Salvinia molesta and is commonly called Kariba-weed. This water weed has been seen in Masindi Port and Lake Kyoga. It is a floating aquatic fern that thrives in slow-moving, nutrient-rich, warm, freshwater. It spreads aggressively by vegetative fragments. It is dispersed long distances within a water body (via water currents) and between water bodies (via animals and contaminated equipment, boats or vehicles). Salvinia molesta is native to Brazil and Argentina and it grows all year round. Giant salvinia grows rapidly and produces a dense floating canopy on the surface of ponds, lakes, and rivers. It has been named a noxious weed or an invasive weed.
Salvinia molesta at Nakasongola ferry landing site Salvinia molesta at Entebbe laboratory Its Effects on the Environment
x Can alter wetland ecosystems and cause wetland habitat loss. x It has massive root system that reduces water-flow and lower the light and oxygen levels in the
water. x This stagnant dark environment negatively affects the biodiversity and abundance of freshwater
species, including fish and submersed aquatic plants. x Interferes with navigation of boats and ferries x Affects fishing activities x It is a trans-boundary problem
Recommendations Carry out surveys to find out the extent of infestation of the water bodies by the weed. Reduce pollution of water resources by nutrients to reduce proliferation of water weeds Use mechanical control to remove the weed from the water Biological control should be thought to reduce the proliferation of the weed.
7.4.9 Golden Indicator Number 5: Water quality
This golden indicator is for monitoring water quality is defined as “the percentage of water samples taken at the point of water collection, or waste discharge point that comply with National Standards for Drinking (Potable) Water (2008) and Water (Waste) Effluent Discharge Standards (1999)”. The following parameters were considered in measuring the performance of this indicator:
x Presence of Escherichia coli (E. coli) in water from protected/improved sources in rural areas x E. coli presence in water from treated drinking water supplies in urban towns x Biological Oxygen Demand (BOD5) and Total Suspended Solids (TSS) in both municipal and
industrial wastewater.

Uganda Water and Environment Sector Performance Report 2015
103
Performance indicator - rural water supplies
In the year under review, WQMD collected a total of 794 water samples from rural drinking water sources, of which 220 were collected by the WMZs while the Central Laboratory of DWRM in Entebbe collected 564 rural drinking water samples. This is the highest number of samples ever collected by the WQMD in one financial year. The increased number of sampling was due to the response to the emergence of typhoid outbreak in Kampala and the surrounding districts of Mukono, Wakiso and Mpigi. In total, 470 samples were taken from protected springs, 140 were taken from deep boreholes, 128 were taken from shallow wells, and 46 were taken from Gravity Flow Schemes (GFS). Compliance with standards in terms of bacteriological contamination was at 36%, the lowest compared to the last seven years. This trend is in most cases influenced by amount of data collected rather than increase or decrease in contamination of rural drinking water sources.
The Department of Water Quality Management has received funding from World Health Organisation (WHO) and hopes to get a better overview of the water quality in the country when this collaborative work with WHO is completed.
Figure 7.23 Compliance for E.coli in rural drinking water supply
Performance indicator - urban water supplies
This section covers large and small towns’ water supply systems. The parameter E.coli was selected to measure performance of 28 large towns out of the 110 that were managed by National Water and Sewerage Corporation (NWSC) by end of June 2015. Out of the 28 samples collected (one per town), 25 complied with the standard for drinking (potable) water specification 2008, class I (one) representing 89% compliance level.
A total of 59 samples were collected and assessed from small towns water supply systems out of 135 representing 44% coverage compared to 30% in the previous financial year. Out of the 59 samples collected, 35 complied with the standard, representing 58% compliance level. This performance was the same as last financial year indicating that there is no improvement in the quality of water supplies in small towns. The number of samples collected for assessment of performance is increasing and thus the reliability of the assessment.
The trend shows that over the years, there has been a steady decline in the quality of water supplied in small towns (see Figure xxx). The low performance of these systems could be associated with inadequate operation and maintenance of the facilities, shortage of skilled staff in the production line and in water quality matters as well as high staff turnover, aged systems , change in water quality due to increasing pollution of water resources, lack of basic laboratory facilities to guide operations,
41
7076
93 93
65
53
36
0102030405060708090
100
Compliance to drinking water standards -Escherichia coli
Com
plia
nce
(%)

Uganda Water and Environment Sector Performance Report 2015
104
process control risk management and monitoring the performance of these facilities by the operators, as well as inadequate audit and compliance checks by regulators.
Figure 7.24 Trend of Microbiological Quality Compliance of Drinking water in towns
The observed increase in number of water samples from urban water supply systems assessed is attributed to the establishment of the WMZs where staff based in these zones can easily access the town water supply systems in their zones. The establishment of regional laboratories in Upper Nile and Albert WMZs together with Mbale Regional water quality laboratory helped in timely analyses of samples. The planned establishment of a regional water quality laboratory in Victoria WMZ next financial year is expected to further expand assessment of not only drinking water but also ambient and wastewater in the regions.
Performance indicator – waste water
Monitoring of compliance of wastewater effluent discharge plants with the water (waste) effluent discharge standards (1999) was done by MWE, where a total of 37 wastewater effluent discharge plants were monitored, compared to 32 last financial year. 37 samples were taken to measure the performance of this indicator has been increasing as compared to two years ago when only two samples were collected. This is attributed to the regular compliance monitoring visits by the WMZs in addition to self-monitoring done by the industries. The challenge of self-monitoring data is its reliability as these industries sometimes use non-recognised laboratories to carry their tests. The wastewater treatment facilities monitored were from industrial and domestic/municipal origin.
Biological Oxygen Demand (BOD5) and Total Suspended Solids TSS were the focus parameters for the measurement of this indicator. BOD compliance level was at 43% up from the last financial year when it was at 32%, but still lower than the set target of 50%. The compliance of (TSS) was at 22% which is the lowest in the last 7 years and was lower than for the previous year, at 27%. Compliance of wastewater effluent with National Standards for Waste Effluent Discharge Standards (1999) is far from achieving the targeted 65%. This result means that the receiving water bodies for these effluents are susceptible to pollution from these wastes. Non-compliance to BOD leads to nutrient loading of the receiving water bodies as evidenced by algal blooms. Discharging of effluents with high TSS value is the cause of sedimentation/siltation of water bodies and reduction in the total depth and water level as seen in the Inner Murchison Bay.
020406080
100
Com
plia
nce
%
Compliance of Large and Small Towns to Escherichia coli
Large TownsSmall Towns
Standard Value: 0 CFU/100mls

Uganda Water and Environment Sector Performance Report 2015
105
Figure 7.25 Trends in Compliance to Biological Oxygen Demand and Total Suspended Solids Standards
Compliance trends have shown that in the last four years, there has been low compliance by polluters and a decline in meeting effluent standards. Total suspended solids in particular have been steadily declining in the last five years, deviating further from the standard since 2009. The decline is attributed to ineffectiveness of the wastewater treatment facilities to handle the gradually growing wastewater volumes. The designs and capacities of wastewater treatment plants are inadequate to treat high volumes of generated wastes and end up being chocked and they fail to treat the waste.
The enforcement of laws and regulations on wastewater effluent discharge into the environment has not been effective enough, partly due to loopholes in the law where only BOD5 is being used to measure compliance and issuance of permits. The on-going review of the effluent standards where banded classification is proposed and their effective enforcement, the initiative towards popularizing Cleaner Production Technologies will assist to improve the situation in the near future.
7.4.10 Challenges/Constraints
The following challenges impact on the water quality management in the country:
(i) There is increasing pollution in both type and complexity.
(ii) Procurement procedures for laboratory equipment, chemicals and reagents are still long and this affects service delivery. Procurement of laboratory equipment/machinery can take up to 3-5 years.
(iii) There is insufficient capacity in terms of both infrastructure and technical personnel at all levels of water quality management. So far Office spaces have been modified for equipment.
(iv) Limited utilisation of scientific data and information to inform decision-making for implementation of necessary required corrective actions.
7.4.11 Possible Solutions to the Challenges
The following recommendations are made to improve the water quality status in Uganda’s water resources:
x Instead of using the number of improved drinking water sources to measure safe drinking water coverage, we should use water quality parameters that qualify the safety of drinking water. Because improved sources do not necessarily guarantee safety of the water
x Fast tracking plans to construct a better laboratory block for the NWQRL, Entebbe and all the four WMZs.
0
20
40
60
80
100
2007/8 2008/9 2009/10 2010/11 2011/12 2013/14 2014/15BOD 60 15 15 26 36 32 43TSS 67 100 61 39 27 22
60
15 1526
36 3243
67
100
61
3927 22
Com
plia
nce
(%)
Percentage Compliance of Wastewater Effluents to National Standards
Standard Value:BOD 50mg/l

Uganda Water and Environment Sector Performance Report 2015
106
x Strengthening implementation of the communication strategy, joint/collaborative management, promotion of best practices, information dissemination, and awareness among stakeholders.
7.4.12 Way forward
(i) Determination of access to safe drinking water or coverage should include water quality status, an indicator to qualify safety
(ii) Technology choices for drinking water supplies require review to ensure sustainable safe water provision
(iii) A comprehensive water quality improvement programme is required to cope with the emerging water quality issues.
(iv) Promotion of best practices in sanitation and hygiene education is required
(v) All drinking water facilities/schemes require comprehensive assessment to evaluate their capacity to provide safe water or treat the deteriorating water quality before safe water supply
(vi) Capacity of private water operators and water authorities to operate and manage the schemes needs to be built to match the technology, business and goal for safe water provision
(vii) Regulation of drinking water services in urban centres should be strengthened and risk management techniques at production and supply as well as quality assurance in distribution be enhanced.
(viii) The guidelines on water source protection should be implemented to improve the quality of rural water supply technologies.
(ix) The design of small towns’ water supply schemes should be guided by a comprehensive assessment of raw water quality, bench experiments considering and potential future risks in the environment of each water source.
(x) More effort and resources should be put in to monitor the performance of golden indicator 5 on water quality, in order to come up with credible assessment results (large sample size required).
(xi) Pursue accreditation of National Water Quality Reference Laboratory Entebbe
(xii) Finalize and operationalize the National Laboratory Policy
(xiii) Complete the upgrade of National Water Quality Database and link to Regional Laboratories
(xiv) Operate and fully manage the oil and gas wastewater remote sensing equipment in Albertine Graben
(xv) Strengthen communication, education and information dissemination to target groups.

Uganda Water and Environment Sector Performance Report 2015
107
7.5 International and Transboundary Water Resources Management
7.5.1 Introduction
International and transboundary water resources issues are being handled by the newly-established International and Transboundary Water Affairs Department under the Directorate of Water Resources Management.
A number of international and transboundary initiatives, projects and programmes are implemented in Uganda, and coordinated by the Department. During the FY 2014/15, the following were the key outputs for International and Transboundary Water Affairs:
x Agreements, laws, policies, and standards on trans-boundary water resources management developed
x A total of four institutional reviews for improved management of cross-border river basins x In total, three projects prepared and funds secured, and four projects under implementation.
7.5.2 Trans-boundary Agreements, Laws, Policies, and Standards Developed
Two MoUs for the joint management and development of shared water resources in the Sio-Malaba/Malakisi and Kagera Basin are being developed by Uganda with Kenya, and Rwanda/Burundi/Tanzania, respectively. During FY 2014/15, MWE coordinated participation and approvals by all national relevant institutions and final signing by the Minister of Water and Environment on behalf of Uganda, together with ministers of other basin sharing countries. The MoUs are now ready for implementation and will enable the countries to jointly identify and prepare regionally significant investment50 projects, mobilise investment financing and undertake implementation accordingly.
Lake Victoria Basin Commission (LVBC) is coordinating the development of a Water Resources Management Bill for Lake Victoria Basin. The draft Bill is currently with the Council To the Community (CTC) for input.
The Water Release and Abstraction Policy for Lake Victoria Basin, jointly developed by the five East African Community (EAC) Partner States through the LVBC Secretariat, was concluded and adopted by the Council of Ministers of EAC in 2012. The Policy recommends a new regime to regulate the outflow of water from Lake Victoria through the Nalubaale and Kiira hydropower generation facilities at Jinja and downstream on the Nile. In the period under review, MWE coordinated continued engagement with East-African partner states of Kenya, Tanzania, Rwanda and Burundi to review the Policy, to include provision of guidance on abstraction of water from the Lake Victoria Basin that contributes to Lake Victoria, and also to evaluate the impacts of the Policy to partner states.
Uganda provided input to LVBC Regional roadmap for implementation and promotion of adherence to the Regional Standards for Discharge of Industrial and Municipal Effluent. The Standards were officially circulated to Partner States for implementation in January, 2015.
Efforts towards conclusion of the ratification of the Cooperative Framework Agreement (CFA) for the Nile Basin countries by Uganda continued during the year.
Nile Basin Initiative (NBI), in collaboration with Government of Uganda is undertaking “Preparation of Guidelines for Environmental Flows determination” with the aim of establishing a basin-wide procedure for establishing environmental flows necessary for transboundary water resources
50 The specified cooperation areas are in: water supply and sanitation, irrigation and drainage development, hydropower development and pooling, fisheries development, watershed management, sustainable management of wetlands and biodiversity conservation, sustainable management of lakes, river regulation, flood management, water hyacinth and weeds control, water quality management, and water use efficiency improvements.

Uganda Water and Environment Sector Performance Report 2015
108
development planning in Nile Basin. In the FY 2014/15, MWE coordinated national participation in procurement of a consultant and initial training of national officials for participation in the development of the guidelines. The guidelines will be of national benefit considering the downstream location of Uganda with respect to other EAC countries.
7.5.3 Support and Coordination of Trans-Boundary Organisations
A number of trans-boundary organisations have continued to be supported through both financial contributions and/or providing technical guidance.
Several Nile Basin Initiative (NBI) governance meetings of the Nile Council of Ministers and Nile Technical Advisory Committee were held, as well as the Nile Basin Development Forum. The key outcomes of the meetings are; i) Upscaling of the Power programmes (Semliki Hydro-Electric Power project) and the Natural Resources Projects (Inland water way sector investment programme on L. Albert), in the Nile Equatorial Lakes (NEL) region, ii) Ratification of Nile Basin Cooperative Framework Agreement (CFA); and iii) the approval of Memoranda of Understanding (MoUs) for cooperation in 2 trans-boundary river Basins between Uganda and other riparian countries, namely; Uganda and Kenya for Sio-Malaba/Malakisi, and Uganda and Burundi/Rwanda/Tanzania for River Kagera (see also first paragraph of Section 7.5.2).
Various Lake Victoria Basin Commission (LVBC) governance meetings of the Council of Ministers and Policy steering Committee meetings were held during the year under review. The key outcomes of the meetings were: i) extension of the Lake Victoria Environment Management Project Phase 2 (LVEMP II) by 2.5 years; ii) approval for implementation of the Regional Standards for Discharge of Industrial and Municipal Effluent. and iii) Draft Lake Victoria Water Resources Management Bill for the EAC; iii) Stay of the implementation of the New Water Release and Abstraction Policy to address Uganda’s water use concerns (see also third paragraph of Section 7.5.2).
MWE has supported and coordinated participation in governance and technical meetings as well as implementation of activities of Sio-Malaba-Malakisi (SMM) River Basin Management, Kagera River Basin Management, AMCOW, IGAD Initiatives, IHP (UNESCO)-Nile FRIEND, Operational Nile Water Resources, WMO and World Water Forum.
7.5.4 Achievements under Nile Basin Initiative (NBI)
The following project proposals were prepared within the framework of the Nile Basin Initiative:
(i) LEAF Project on Lakes Edward and Albert
The multinational Lakes Edward & Albert Integrated Fisheries and Water Resources Management Project (LEAFII) covers the Lakes Albert and Edward Basin, which is shared between the Democratic Republic of Congo and the Republic of Uganda. The lakes are characterised by overexploitation of the main fish species, deforestation and insecurity as well as degradation of water resources all compounding the poverty levels in these areas.
During the FY 2014/15, the countries participated in activities leading to approval of financing by African Development Bank and GEF, for an amount of US$ mn 10.2. The 5-year project will mainly address of fisheries resources development; and Integrated Water Resources Management in the Lake Albert and Edward Basin.
(ii) Nyimur (Aswa River Basin) Multi-Purpose Water Resources Development and Management Project
NBI/NELSAP supported partner states of Uganda and South Sudan in the River Aswa Basin Multipurpose Project Identification process. A number of water resources development and management projects were identified and those with high hydropower potential have already been taken up by the private sector through Ministry of Energy, to develop hydro-electric power facilities. The project aims at: (i)

Uganda Water and Environment Sector Performance Report 2015
109
creating a large base of high productivity cultivation of approximately 5,105 ha irrigated agriculture of which 4,000ha in Uganda and 1,105ha in South Sudan, that will lead to an increase in local income, make available enough produce to influence agro-processing and the access to markets and have a substantial impact on the economic life of the area; (ii) mitigating the recurrent flooding and drought problems by storage river regulation and watershed management, thus allowing cultivation in the Nyimur River lowlands; (iii) addressing poverty and lack of social development, which constrain agricultural intensification (iv) Improving water supply and sanitation infrastructure and thus contributing to better
public health, improved livelihoods and cleaner water bodies, and (v) strengthening trans-boundary cooperation between Uganda and South Sudan in water resources management and development.
A pre-feasibility study with the design of the Nyimur multipurpose project, Lamwo District was carried out and during the period under review. The countries carried out activities leading to approval of financing of the Nyimur Multipurpose project feasibility study by African Development Bank.
(iii) Sio-Malaba-Malakisi (SMM) River Basin Management Project
In the FY 2014/15, the project, with support from MWE, initiated development of catchment management plans for the shared catchments of Sio and Malaba/Malakisi. Lower Sio, Middle Malaba and Lwakhakha Shared Sub Catchment Management Plans were completed and commissioned by the Sector Ministers of Kenya and Uganda.
Demonstration projects identified in catchment management plans in the shared river basins of Sio and Malaba/Malakisi were implemented. In Uganda, the activities included construction of Lukhuna Irrigation Demonstration scheme in Manafwa district. Lukhuna demonstration irrigation scheme benefits 500 people.
Figure 7.26 Lukhuna irrigation scheme water use by local communities in Manafwa District, Uganda
Figure 7.27 New intake for irrigation in Lukhuna (left riverbank is Uganda, right bank is Kenya)

Uganda Water and Environment Sector Performance Report 2015
110
The project carried out identification and pre-feasibility studies for development sub projects in the shared / transboundary river basins, including completion of the feasibility studies for Busia and Malaba Cross Border Pollution Control Projects and the Transboundary Sio-Siteko Wetland Restoration Project, and identification of the Mpologoma Wetland Management Project.
The Project prepared five draft project proposals for funding. The proposals including creation of water storage to benefit people through irrigated agriculture and watershed management activities such as beekeeping, afforestation, and agroforestry, whereas Soono Small HEP project is for hydropower. Details are as follows:
(i) Nyabanja Irrigation Development and Watershed Management Project (creating a dam of 8.5 million cubic metres (MCM) storage, to serve 1,700 ha), to benefit 12,000 people with an estimated Net Present Value (NPV)51 of US$ 39.7million over a 40-year period.
(ii) Nyamatunga Irrigation Development and Watershed Management Project (2MCM, 415acres), to benefit 5,000 people with an estimated NPV of US$ 1.0 million over a 40-year period.
(iii) Lirima Gravity Fed Irrigation Development and Watershed Management Project (760acres), to benefit 5,154 people with an estimated NPV of US$ 0.37million over a 5year period.
(iv) Bukhabusi Irrigation Development and Watershed Management Project (2.8MCM, 500 acres), to benefit 6,200 people with an estimated NPV of US$ 1.14 million over a 5year period.
(v) Soono Small HEP project, to benefit over 1.0 million people with power supply (1.9 MW).
(iv) Kagera Transboundary Integrated Water Resources Management and Development (KTIWRMD) Project
During the year, two important strategic investment activities, i.e. Maziba Catchment Management Plan (CMP) and its respective implementation of the intervention areas, and the studies for Kabuyanda Multi-Purpose Dam in Isingiro District have been carried out.
The Kagera Memorandum of Understanding was signed between the Ministers responsible for Water Affairs of the four basin countries (Uganda, Tanzania, Rwanda and Burundi) and NELSAP-NBI in June 2015, during the last NILE COM in Dodoma, Tanzania. The MoU formalizes regional cooperation over the shared water resources and demonstrates countries’ commitment to cooperation.
The Project continued to work with MWE's Water for Production Department to advance the Bigasha multipurpose project in Isingiro, and is currently soliciting for consultants to finalize its detailed designs and supervise its construction, and also to identify and prioritise new regionally significant infrastructure projects to advance towards feasibility level and implementation.
The Project is updating its basin water allocation model together with the Victoria Water Management Zone (VWMZ) using the MIKE HYDRO platform, in active participation of the countries. Furthermore, the Project focuses on mobilizing funds for interventions recommended from earlier projects such as the Maziba CMP.
7.5.5 Achievements under Lake Victoria Environmental Management Project – Phase II
The Lake Victoria Environmental Management Project Phase II (LVEMP-II) is an East African Community (EAC) regional initiative coordinated by the Lake Victoria Basin Commission (LVBC) Secretariat and currently implemented by five EAC Partner States. The objectives of the Project are to contribute to: (i) the improvement of the collaborative management of the trans-boundary natural resources of the LVB among the Partner States; and (ii) the improvement of environmental management of targeted pollution hotspots and selected degraded sub-catchments for the benefit of communities who depend on the
51 The NPV measure is used to assess the profitability of the change from the grower’s point of view

Uganda Water and Environment Sector Performance Report 2015
111
natural resources of LVB. The project is implemented through four components. Outputs achieved during the period under review are described per project component:
Component 1: Strengthening Institutional Capacity for Managing Shared Water and Fisheries Resources
x The final assessment report on the development of the Water Resources Management Plan for Lake Victoria Basin was adopted in the regional meeting held in September 2014 in Kigali, Rwanda.
x A total of 14 students have been supported to undergo het an MSc degree in Environmental Science, following a collaboration between LVEMPII and the Department of Zoology, Makerere University.
x The Hydrological Data Centre (Water and Environment Knowledge Centre) situated at the Directorate of Water Resources Management (DRWM) premise was constructed and completed. Procurement of ICT infrastructure for the building is underway.
Figure 7.28 Extension of the DWRM hydrological data centre
x A total of 5 Automatic Weather Stations have been installed in Mityana, Entebbe, Sembabule, St. Kizito Primary school Buikwe, and Masaka.
x The following technical reports in relation to pollution levels in northern Lake Victoria have been produced: a) heavy metal pollution levels Report, b) algal communities, c) physic-chemical parameters report, d) nutrient status report, e) zooplankton communities report, f) macro-benthos communities report and g) fish communities report.
x Regular monitoring and active manual removal of the water hyacinth has taken place at 15 hotspots52. A water hyacinth training manual for extension staff and the communities was developed during the period under review. Subsequently, a total of 421 members in 8 Beach Management Units (BMUs) in 5 districts were trained in water hyacinth management. A report with geo-referenced maps of water hyacinth cover abundance and their hotspots on Lake Victoria has been prepared. A manuscript was published in the African Journal of Aquatic Science (AJAS) titled “Water hyacinth hotspots in the Ugandan waters of Lake Victoria in 1994–2012: implications for management”. Published online: 23 Feb 2015.
x A priority study was carried out on water, fisheries and land to fill knowledge gaps on environment, social and economic related aspects.
x A geo-referenced map was prepared for 220 grounds identified as potential fish breeding/nursery grounds for the three major commercial fishes (Nile tilapia, Nile perch and Mukene). Of these, 24 stations are recommended for protection and gazetting. Legal drafting of the statutory instrument is on-going for gazetting 23 fish breeding grounds. A total of 139
52 namely: Bunjako, Sango bay, Lwera, Murchison bay, Field bay, Thruston, Nakiwogo, Berkerly, Hannington, Mackdonald, Napoleon Gulf and Kalangala. Other sites are Luku-Kamugarura, Kikwayo and Kagoonya-Bufumira.

Uganda Water and Environment Sector Performance Report 2015
112
potential cage culture sites were identified and characterised in 15 riparian districts of Lake Victoria (Uganda) for promotion to potential local and international investors. Draft guidelines were developed on cage culture establishment and development on the lake. A technical report on stocking densities, feeding and monitoring growth performance of fish in cages and ponds has been prepared.
Component 2: Point Sources pollution control and prevention
Procurement of civil works for the rehabilitation and expansion of Kirinya sewerage treatment system was complemented and the contract awarded in June 2015. The civil works to upgrade two water quality laboratories (NWSC laboratory in Bugolobi, Kampala and DWRM-NRWQM laboratory in Entebbe) were completed. The contracts for the procurement of water quality equipment were awarded and signed. Part of the equipment has been delivered and commissioned.
To contribute towards the efforts to reduce the environmental pollution and flood frequency in Kampala, the following outputs have been achieved: (i) Procurement of civil works for dredging and maintenance of 8.7Km of Nakivubo channels and its auxiliary channels for one year was completed. Works commenced in January 2015 and 40% of the works have been completed. (ii) Two sets of equipment, including 6 tipper trucks and two double cabin pickup trucks were delivered and handed over to Kampala City Council Authority (KCCA). Other sets of equipment, of which the contracts were awarded in the period under review will be delivered in the next financial year.
For the promotion of Industrial Cleaner Production Technologies a total of 73 enterprises have been trained and 32 in-plant assessments were completed. Implementation of the Resource Efficiency and Cleaner Production (RECP) options identified during the in-plant assessments is on-going. The enterprises have improved their environmental performance in terms of reduction in Biological Oxygen Demand (BOD) and Chemical Oxygen Demand (COD) levels in their affluent. For example, Kakira Sugar works has reduced its BOD loading by 74% (i.e. from 5,000 to 1,300gm/litre), and COD by 79% (i.e. from 10,000 to 2,100mg/litre). The water consumption has reduced from 10,000 m3 to 5,000 m3 per day representing a reduction of 50%. Out of the 158 industries mapped at inception of the project, 27 industries generated cleaner production options; consequently, they have made an estimated saving of US$ 5.06m annually. A US$ 0.6m grant has attracted a private sector investment worth US$ 57.1 million.
Figure 7.29 Old leaking drums before implementation of CP (left); new set of tanning drums installed to improve productivity and reduce amount of effluent discharged from the tannery (right)
In order to improve safety of navigation for both cargo and passengers ferries as well as fishing vessels, the construction of the maritime safety and communication coordination centre at the Ministry of Works and Transport (MoWT) at Kampala industrial is in progress, now standing at 73% completion. Installation of navigation aids on Lake Victoria at 23 sites is on-going.

Uganda Water and Environment Sector Performance Report 2015
113
Component 3: Watershed management
The objective of this component is to reduce environmental stress from the Lake Victoria Basin, through the implementation of non-point sources pollution mitigation and prevention measures, through community-driven development investments.
Conditional grants, cumulatively totalling to a tune of UGX 4.23 Billion, which represent 85% of the grants were disbursed to 9 districts53 to implement the approved sub-projects. The funds were used to achieve the following;
x 1,646 Ha were planted with trees (wood trees, fruit trees or coffee trees). x 138 Ha have been protected. x 34 water harvesting tanks and 2 valley tanks were installed x 2 community latrines were constructed at Senyondo Landing site and Bivamuntuyo eco-
system group. x 19 institutional saving stoves were installed. For the households energy saving stoves, several
household energy saving stoves were also constructed. x A total of 11 bio-gas systems were installed x Income generating interventions were implemented, including provision of 402 bee-hives,
installation of 31 fish cages, establishment of 32 fish ponds, construction of 39 drying racks and two fish processing facilities, as well as four choker kilns and one bakery. A Mukene fish processing facility has been started at Senyondo landing site.
Component 4: Project coordination and management
x Developed and installed a web based data and document management system for the project. x Produced 2 e-newsletters and two issues of the Lake Victoria Basin Newsletter. x Hosted the 4th regional publicity event x Participated in 4 regional publicity events, and two national publicity events. x Continued disbursing funds to implementing agencies as per MoUs.
7.5.6 Achievements under other Transboundary Organisations
(a) The Planning for Resilience in East Africa through Policy, Adaptation, Research and Economic Development (PREPARED) Program
The project developed action plans and strategies for identification and design of biodiversity interventions in Nabugabo wetland, carried out an Economic Valuation of Nabugabo Lakes Complex, supported the preparation and implementation of the Non-Revenue Water (NRW) Reduction Strategy 2014-2015 by NWSC to reduce NRW by 20% for Jinja/Iganga, and piloting the actions proposed in the strategy in Jinja and Iganga supply areas, trained NWSC staff in management and monitoring of meters and target interventions that can reduce NRW levels; and implemented a Quality Service Improvement Program (QSIP) through Customer Feedback Instruments (CFIs) for NWSC in Jinja and Iganga.
(b) IGAD–HYCOS
The main objective of this project is to develop a shared vision of joint management of the trans-boundary water resources to underpin the sustainable development and economic integration of the IGAD sub-region.
During the last FY, the project has enhanced the capacity of Uganda National Hydrological Service (UNHS) to collect more accurate and reliable data by the provision of assorted hydrological, meteorological and data center equipment, construction of 12 telemetry stations, and related capacity building and short training courses in installation, operation and maintenance of the telemetry stations.
53 Masaka, Mpigi, Gomba, Mityana, Rakai, Kalangala, Kalungu, Namayingo, and Mubende.

Uganda Water and Environment Sector Performance Report 2015
114
(c) Global Water Partnership (GWP)
During the period under review, GWP facilitated the National Consultations on Water and Food Security and Nutrition in Uganda, trained of Young Water Professionals on Integrated Water Resources Management (IWRM) and Climate Change from NWSC, and supported Uganda in the preparation of a project proposal on “Enhancing resilience of communities to Climate Change through catchment based integrated management of water and related resources in Uganda”; and resource mobilisation for the project through African Water Facility (AWF) and Global Water Partnership Eastern Africa (GWPEA).
7.5.7 Access to Trans-Boundary Water Management Tools, Knowledge, Data, Communication and Information Dissemination
Celebrations to mark the Nile Day of 2015 were conducted in Manafwa District/Bungoma County Local Government which was preceded by the launch of the Lukhuna demonstration irrigation scheme and attended by Members of Parliament, District Political Leadership, District Technical Officers, SMM Project staff and the Embassy of Sweden in Nairobi.
A water allocation tool training was carried out for river basin organisations, and a Nile Decision Support System training was carried out for country staff. Finally, staff was trained staff in use of real time data-acquisition tools.
7.5.8 Challenges
Since the International and Transboundary Water Affairs Department was operationalised in the period under review, it is facing staffing challenges with only five staff running the Department, and insufficient logistical support.
7.6 Way Forward
Mapping water users and waste water dischargers will make water resources planning and regulation functions in the catchment more targeted and focused. Through this process the number of unlicensed water users and waste water dischargers will be identified, which will facilitate enforcement of the provisions of the Water Act and Water Resources Regulations, and hence improve compliance to water abstraction and waste water discharge conditions. The identified illegal water users and waste water dischargers and non-compliance permit holders will be brought to compliance, as efforts to upscale mapping of water users and waste water dischargers in the rest of the country are taken.
It is recommended that all stakeholders use the Water Source Protection Guidelines and operationalise the 3% contribution, to ensure that the quality and quantity of water resources for various uses are safeguarded and that integrated planning, development and management of water and related resources following a catchment is realised for improved sustainable socio-economic development.
Promotion of the public–private partnership arrangement in water resources management should be given priority in Uganda as it provides opportunities for leveraging technical and financial resources from the non-traditional sources, thus supplementing the resources available from Government and Development Partners to upscale implementation of catchment-based water resources management.

Uganda Water and Environment Sector Performance Report 2015
115
8 SANITATION AND HYGIENE
8.1 Rural Sanitation and Hygiene
Uganda had a Millennium Development Goal (MDG) target of achieving a sanitation coverage of 72 percent by the year 2015. The sector has made progress towards this goal as presented in section 8.1.2. Under the 2015 agenda for sustainable development, the United Nations reaffirmed their commitment regarding the human right to sanitation and improved hygiene. Goal 6 of the Sustainable Development Goals is to achieve access to adequate and equitable sanitation and hygiene for all and end open defecation, paying special attention to the needs of women and girls and those in vulnerable situations, by 2030. Access to sanitation and improved hygiene will also be essential to the attainment of other SDG goals, e.g. ending all forms of malnutrition, and ending epidemics of water borne diseases.
In 2006 the sector developed a strategy to improve sanitation in the country in order to achieve the national sanitation targets. The strategy is based on three pillars; improving the enabling environment, creating demand and improving the supply. There are several programs and projects that have been implemented at both national and at district level, by government and different partners to address the three pillars. The next section presents the programs that have been carried out at scale.
8.1.1 Key Programmes and Projects
Sanitation Promotion
There are several ongoing programs to support the improvement of rural sanitation in Uganda. One of the programs is the improvement of rural sanitation carried out by the local governments using funding under the District Sanitation Conditional Grant (DSCG). During FY 2014/15, UGX 2.0 bn was released under the DSCG, with 89 districts receiving an average of UGX 23 million. Most districts used the money to carry out Community Led Total Sanitation (CLTS) triggering of communities and follow up of triggered communities to ensure they become Open Defecation Free (ODF), while some districts carried out home improvement campaigns aimed to get 100% latrine coverage in the target communities, with improved homesteads and attainment of ODF status.
The Uganda Sanitation Fund (USF) Project is implemented in 30 districts under the oversight of the Environmental Health Division of the Ministry of Health. During FY 2014/15, UGX 2.18 bn (USD 764,774) was disbursed to the districts supported by the project. A total of 2,046 villages were triggered during the financial year, with 549 (27 percent) becoming Open Defecation Free (ODF). Over 4 years, a total of 6,026 villages have been triggered with 2,534 villages (42% of those triggered) reported to be ODF. Although the districts supported by the USF project receive more money than those which receive the DSCG, some of the funds under the project were released late and some districts only received funding for one or two quarters, which affected their implementation. Some project districts received the second release at the end of the fourth quarter and they were not able to use it before the end of the financial year.
In addition to funding under the sanitation budget line, several districts receive funding from UNICEF. During FY 2014/15, UNICEF provided UGX 548 million to 16 districts to support school sanitation and CLTS implementation. UNICEF also provided UGX 139 million to the Ministry of Health and MWE to support the implementation of CLTS in the country. A total of 182 Villages were reported to have been triggered with funding from UNICEF.
Apart from the work carried out by the districts, the department of Rural Water and Sanitation under MWE also carried out activities to support the improvement of sanitation in the country. The department carried out an advocacy drive, called “Sustainable Sanitation Drive, to localise international commitments on sanitation, including commitments made at the Water for All (SWA) High Level meeting, AfricaSan, Water and Sanitation for All (WSA) and others like World Toilet Day

Uganda Water and Environment Sector Performance Report 2015
116
and Sanitation Week. As a result of the advocacy, leaders from 60 districts signed commitments to implement these resolutions, which are aimed at accelerating implementation towards meeting the MDGs and prioritisation of sanitation by the local governments. In a bid to improve the supply of improved sanitation, the Ministry carried out training of masons. The Ministry also carried out CLTS triggering and hygiene promotion for communities benefiting from the new water supply systems constructed by the Ministry. A total of 72 villages were able to achieve 100 percent latrine coverage and access to hand washing.
Box 8.1 “Sustainable Sanitation Drive” commitments signed with districts (LCV, CAO)
Commitment Milestone Full and timely acceleration of implementation of district specific sanitation action plans.
Availability of plans Timely periodic/(1/4ly) progressive reports
Strengthen the district coordination and collaboration arrangements/mechanisms among the technical staff and partners.
DWSCC in place and functional Sanitation on the agenda with ¼ly minutes of meetings List of attendance with Actions against resolutions
Make efforts to increase the district financial investments for sanitation and hygiene activities.
Percentage budgetary allocation and release Joint supervisory reports Timely release of funds at district level
Adopt and scale up effective and sustainable approaches (CLTS/SanMark, Integration)
Approaches in use documented
Exemplary leadership and commitment Percentage of leaders with improved sanitation and hygiene facilities & practices A critical requirement for leadership
Greater application of the relevant legislations Availability of legislations Evidence of enforcement i.e. commitment compliance & prosecutions
SNV, working with local NGOs, is implementing a rural sanitation project in 7 districts in West Nile region and 8 districts in the Rwenzori region. The project is working on getting the target communities open defecation free (ODF), promoting behaviour change, improving the supply of improved sanitation and addressing the sanitation governance through strengthening the role of the District Coordination Committees. After one year of implementation, 1,047 villages have been triggered, of which 472 villages (45%) have been declared ODF.
Box 8.2 Improving sanitation under SNV Project The rural sanitation project is distributing informed choice materials to improve access to technology options. The options are for loose soils, rocky soils and waterlogged areas, while marketing a plastic toilet pan (SaTo pan) which is cheap and can be used in new toilets or to improve existing latrines. As part of developing the market, Young Sanitation Entrepreneur (YSE) groups are developed for making the various technology options available at scale to the villages. To improve governance, the project is supporting the 15 districts to organise more effective and inclusive District Water and Sanitation Coordination Committees, supporting the preparation of District Sanitation Plans, as part of the overall District Development Plans and the refinement of the ODF protocols.
During the FY 2014/15, a total of 1,606 villages supported by government and partners became ODF, and now Uganda has a total of 3,969 villages (43 percent of the triggered villages) reported to be ODF. The low rate of achieving ODF status is due to poor follow-up of triggered communities by districts; this may be explained by inadequate planning for follow-up of communities, coupled with the low prioritisation of sanitation by the communities.

Uganda Water and Environment Sector Performance Report 2015
117
Promotion of Improved Hygiene
The sector has continued to promote hand washing with soap. SNV is the new secretariat for the National Hand Washing Initiative (NHWI), taking over from Africare in November 2014.
The secretariat developed a revised Hand Washing With Soap (HWWS) strategy, shifting the initiative from project implementation, to supporting mainstreaming and integrating hand washing with soap into other behavioural change campaigns including sanitation, hygiene, nutrition and related interventions. The theory of action for the NHWI is hinged on three core pillars: capacity building, learning and knowledge management and coordination and alignment.
The NHWI revised the Behaviour Change Communication (BCC) campaign and tool kit. The BCC campaign is based on evidence from the Formative & Baseline study (2007) and the mid-term evaluation study of the NHWI (2012). The hand washing secretariat, in collaboration with SNV’s Sustainable Sanitation and Hygiene for All project rolled out the BCC campaign in 15 District Local Governments in Rwenzori and West Nile Regions. Some of the communications materials available include posters, stickers, jingle and radio messages on hand washing with soap. Translated BCC campaign materials are available on request at the Hand washing secretariat (Visit www.handwashing.ug for details).
Figure 8.1 Poster from the National Hand Washing Initiative

Uganda Water and Environment Sector Performance Report 2015
118
8.1.2 Status and Trends of Key Indicators
Golden Indicator No 4: Access to Household Sanitation
The golden indicator for access to rural sanitation is “the percentage of people with access to improved sanitation”. In FY 2014/15, access to sanitation, according to district reports, increased to 77.0 Percent, achieving the national target of 77 percent by 2015. Although the country as a whole achieved the national target, only 64 districts (58 percent) achieved the national target of 77 percent, which is 27 more districts than four years ago.
Although 77 percent of the rural population in Uganda is reported to have access to improved sanitation, most of these toilets do not meet the standards of the WHO/UNICEF Joint Monitoring Program (JMP), which estimates that only 35 percent of the rural people in Uganda have access to improved sanitation (defined as not shared, cleanable, sealable and durable), with an estimated 10 percent practicing open defecation.
The low access to improved sanitation as defined by the JMP is attributed to the poorly developed rural sanitation markets in most districts where most communities do not have access to affordable improved products and services. Access is also hampered by the low income of the rural communities, which in the face of competing needs, rank sanitation very low. Most rural households cannot afford to make a lump sum payment for the improved sanitation. To address this, several financing institutions have developed financing products which could be used to finance sanitation; Post Bank Ltd. lent out UGX 931,460,000 to 370 people over a period of 1 year for sanitation, under its WASH loan. Although financial products exist, most households are still not willing to borrow for sanitation and many find it hard to pay back the loans.
Golden Indicator No 4: Pupil to Latrine/Stance Ratio in Schools
The golden indicator on school sanitation is “the pupil to stance ratio”. According to the district reports the pupil: latrine stance ratio is 1:67. This is a marginal improvement on what was reported last year, as there has not been any appreciable effort to construct new facilities in schools. Only 7 districts meet the national target of a pupil: latrine stance ratio of less than 1:40.
Access to hand washing facilities in schools is very low with only 38 percent of the schools reported to have hand washing facilities. Nwoya district reported to have distributed hand washing facilities to all schools in the district with access to hand washing in schools reported at 100%.
During FY 2014/15, Kampala City Council Authorities (KCCA) constructed toilets in public schools and the pupil:stance ratio improved from 67:1 to 53:1.
UNICEF supported the construction of 23 latrines with 115 stances at primary schools in Kabarole, Lira, Ntoroko and Mukono, serving at least 4,600 pupils; and also constructed an 18 stance Biogas producing latrine in Tororo serving more than 720 pupils with sanitary facilities and cooking gas. Support was also extended to the Appropriate Technology Centre (ATC) through the Ministry of Water and Environment (MWE) towards the establishment of a low cost sanitary pad making project, so far covering 2 schools in Mukono district.

Uganda Water and Environment Sector Performance Report 2015
119
Figure 8.2: District Latrine Coverage in Rural Areas (June, 2015)

Uganda Water and Environment Sector Performance Report 2015
120
Box 8.3 Latrines in use before and after provision of WASH Loans by Post bank
Golden Indicator No 8: Hand Washing
The golden indicator on hand washing is “percentage of people with access to hand washing facilities”. The access to hand washing facilities at the toilet is estimated at 33.2 percent. The rate of hand washing is still much lower than the national target of 50 percent and the increase of 0.4% as compared to last year is very little, especially when compared to the good start upon launching the hand washing campaign five years ago, when the rate of hand washing was estimated at 21 percent.
Benchmarking of District Performance
The performance of districts was benchmarked across indicators on process and outcomes, and the results are included in Annex 18. Table 8.1 shows the best performing districts.
Some of the families assessed and the types of facilities
The improved latrine facilities constructed after provision of the WASH Loans (Photos courtesy of Post Bank – Soroti)

Uganda Water and Environment Sector Performance Report 2015
121
Table 8.1 Best Performing Districts in FY 2014/15 Rank District Score (%) 1 Mbarara 93 2 Bukomansimbi 78 2 Kyenjojo 78 2 Moyo 78 3 Kumi 75
Some of the districts that were best performers last year dropped in the ranking due to the sanitation coverage not increasing or dropping from last year’s figure, although a substantial amount of money was spent. During this financial year, the worst performing districts included Butaleja, Kaabong, Kiboga, Moroto, Nakapiripirit and Napak. These districts have both low sanitation and hand washing coverage, with no open defecation free villages.
8.1.3 Challenges and Recommendations
The districts cited several challenges to the implementation of the rural sanitation program:
(i) Lack of Resources: Most of the district environmental staff do not have transport which hampers their activities. In addition, the funding for sanitation in most districts is very poor, especially at the lower local governments; therefore, the environmental health staff cannot reach out to the communities or to follow up with triggered communities. It should be noted that there is considerable inequity in the allocation of funds available for sanitation in the country at district level, with some districts supported by NGOs and development partners receiving much more than others.
x It is recommended that all partners share with government, information on the available funding and their areas of operation so that the available funding from government is reallocated to less served areas, in order to improve equity in allocation of funding.
x A Value for Money Audit should also be carried out to establish whether the available money is optimally used, and to identify possible interventions to improve cost effectiveness.
(ii) Low Level of attainment of Open Defecation Free (ODF) status: Many districts carry out mobilisation of communities either using Community-Led Total Sanitation (CLTS) or home improvement campaigns, but most do not follow up with the communities to ensure that they become ODF, therefore health outcomes are not attained. In addition, nothing is done to ensure that those that attain ODF remain so. This is due to the limited funding and the guidelines for the DSCG, which require the districts to work in new sub-counties every new financial year. A review of the district reports shows that despite the guidelines, there is still a lack of focus, with some districts taking on activities which, given the low level of funding, makes them ineffective.
x It is recommended that the District Water and Sanitation Development Conditional Grant guidelines be revised to support output-based reporting instead of accountability being based on activities. Allocation of funds should also be based on performance to improve adherence to the guidelines.
(iii) Poorly developed sanitation market: The lack of a well-developed sanitation market hampers access to improved sanitation. The challenges in the market include; lack of demand for improved sanitation by the rural communities, mostly due to having very little disposable income; few entrepreneurs providing affordable products and services, with most entrepreneurs being interested in high profit margins; and inappropriate technology especially in areas where collapsing soils necessitate the construction of alternative designs for durable toilets, which can be expensive.
x The government, working with the financial institutions should facilitate the communities to access affordable funding products to get money to construct durable improved facilities, and

Uganda Water and Environment Sector Performance Report 2015
122
to work with entrepreneurs to build their capacity, and to facilitate their relationship with the rural communities in order for them to offer affordable services to the communities.
x The sector should also support the manufacturers of plastic products, some of which are quite cheap, to develop distribution channels to make it easier for the rural communities to access their products.
x To address the challenge of collapsing soils, the Appropriate Technology Centre should reach out to these communities to support them to develop appropriate designs of toilets.
(iv) Insufficient political support: The Prime Minister wrote to the Ministry of Local Government to direct all districts to implement programs to improve sanitation and hygiene, and despite the advocacy meetings to localise the “sustainable sanitation drive” carried out by MWE, the political will is still very low.
x It is recommended for the sector to identify areas of interest for the political leaders and implement an advocacy program based on triggers for the politicians, showing them the importance of improved sanitation and hygiene to their areas of interest, to get their buy-in to support the improvement of sanitation and the enforcement of the Public Health Act.
8.2 Urban Sanitation and Hygiene
8.2.1 Key Initiatives
Sludge Management
The urban population of Uganda has rapidly increased as a result of creating new town councils, population growth and rural-urban migration. This has led to several sanitation challenges in small towns, especially in the urban poor areas. Despite the fact that most urban households depend on on-site sanitation and therefore periodically need to empty latrines and septic tanks, faecal sludge management in small towns has overall remained very poor, mainly attributed to: absence of faecal sludge facilities in most towns; lack of cesspool/pit-emptying trucks in most small towns; high emptying charges; inadequate legal regulations and law enforcement on proper faecal sludge management; and illicit dumping of collected faecal sludge with negative environmental and public health consequences.
MWE is spearheading the construction of shared Faecal Sludge (FS) disposal facilities in small towns through the Water Supply Development Facilities (WSDFs), Urban Water and Sewerage Department. A national assessment was carried out to identify potential clusters of small towns that could be served by shared faecal sludge disposal facilities, thus providing an initial guide to prioritizing clusters for investments. Furthermore, the following documents were prepared to guide the implementation of the initiative:
x Business plans, business relationships (contracts) and financing arrangements/fees structure for 10 small towns under the Iganga and Mbale clusters.
x Study on how to integrate faecal sludge in institutions into the faecal sludge management system. x An operations manual for cesspool emptying service providers; x generic sanitation by-laws for small towns (covering licensing of service providers, containment
and emptying, transport; treatment, disposal and reuse, and penalties)
The Sector has prioritised the construction of faecal sludge treatment facilities as detailed below: x MWE, through the Water Development facility – Central (WSDF - C) has finalised designs and is
procuring a contractor(s) to construct two faecal sludge management facilities in the towns of Wobulenzi and Lugazi.
x Designs have been completed for facilities in Kayunga, Dokolo, Adjumani, Kyotera and Ishongororo towns, while those for Kamuli, Nakasongola, Kagadi and Kiboga towns are still under development.

Uganda Water and Environment Sector Performance Report 2015
123
x The Lake Victoria Water Supply and sanitation Program Phase II being implemented by MWE has on-going construction works for faecal sludge treatment plants in the towns of Mayuge, Kayabwe, Ntungamo and Bukakata.
Box 8.4 Setting up a shared faecal sludge management system in Iganga and Mbale Clusters
World Bank’s Water and Sanitation Program supported MWE to run a pilot an improved sludge management approach in two clusters engaging the private sector, National Water & Sewerage Corporation (NWSC) and Local Authorities in service delivery (i.e. collection, transportation, treatment and disposal/reuse of faecal sludge).
The initiation process entailed the following activities: (i) facilitating a stakeholders’ workshop and the signing of 10 (ten) MoUs for the collection,
transportation and disposal/treatment of FS; (ii) establishing a system for Faecal Sludge Management (FSM) demand aggregation in each town for
purposes of achieving economies of scale and making the service more affordable to households; (iii) putting in place sanitation marketing promotion strategies to improve awareness and willingness of
people to adopt and pay for improved FSM solutions; (iv) creating mechanisms for the Local Authority to supervise the performance of service providers and
periodically monitor FSM activities as a way of measuring progress.
Follow up after a month revealed the need to
x improve sensitisation and promotion of FSM at household and institutional level x strengthen collaboration amongst the stakeholders to the FSM MoU through joint planning and
execution of common activities; x ensure that the FS disposal facilities are well secured with controlled and monitored access so as to
improve the verification of data on collected and received sludge.
Based on experiences from the pilot, a step-by- step guideline for implementing a shared FSM system was developed. This includes: (i) Identifying a shared faecal sludge disposal location and clustering of small towns; (ii) Undertaking a detailed faecal sludge market assessment in each of the clustered towns; (iii) Stakeholder engagement and capacity building; (iv) Initiating collaboration platforms (MOUs or Service Level Agreements) amongst the key FSM
stakeholders; (v) Development of a monitoring system for FMS activities; (vi) Undertaking sanitation marketing and promotions; and (vii) Supervising and monitoring of FSM activities.
Improved Sanitation and Hygiene (ISH) Manual
The Sector developed an urban sanitation implementation manual to simplify the application of the Improved Sanitation and Hygiene (ISH) strategy for Small Towns, and guide all the stakeholders in the urban sanitation sub-sector in implementation of improved sanitation investments and hygiene promotion in small towns and rural growth centres. The manual details promotion approaches and timing under the different phases of project implementation with firm anchorage on the three pillars of the 10-year ISH strategy (Create an enabling framework; Promotion and communication; ensure access to hardware). The manual also provides for Operation and Maintenance approaches as a fourth pillar so as to ensure sustainability of the improved sanitation investments.
Sanitation Improvements in WSDFs
The WSDF operate with a specific objective, “To improve the socio-economic situation and the opportunities for people living in the Small Towns (STs) and Rural Growth Centers (RGC’s) through provision of safe, adequate, reliable, sustainable and accessible water supply, and hygiene promotion”.

Uganda Water and Environment Sector Performance Report 2015
124
WSDFs develop and promote appropriate technologies of sanitation facilities both at household level and public infrastructure including sludge management systems. The table below shows a summary of the facilities constructed by the different WSDFs.
Table 8.2 summary of sanitation facilities constructed by the different WSDFs.
WSDF-North
WSDF- South-West
WSDF-Central
WSDF-East
Household demonstration Ecosan toilets 51 28 30 12 Institutional toilets (VIP) 14 Public toilets (waterborne) 9 Masons trained 21 34 40 11 FSM Plant designs completed (Designs for 4 towns ongoing) 2 2 1 Number of people who gained access to sanitation* 24,661 17,000 1,700 6,084 Number of people who gained access to hand washing* 3,400 18,248
*data from town surveys.
Several sanitation and hand washing promotion activities were carried out in different small towns and rural growth centres and as a result a total of 49,445 gained access to sanitation.
Sanitation improvement in KCCA
KCCA has supported the improvement of sanitation in Kampala with the construction of 10 community toilets in the informal settlements of Kampala and providing free services at 18 toilet blocks. These public toilets are located in markets, taxi parks and along busy roads, and each is estimated to receive an average of 300 users per day.
In January 2015, there was a Typhoid outbreak in Kampala. Results of the research done to the primary contact of the disease revealed that most people got the disease at their workplaces. Further testing of the water consumed at the work places revealed that the water was contaminated (see also Section 7.4.8). Hence, KCCA closed 17 shallow wells, most of which were serving public buildings. Open wells were replaced with stand pipe water supply and public building owners (arcades) were instructed to connect water supply to their buildings using the NWSC water supply network.
KCCA also carried out sensitisation drives, which included celebrations of the sanitation week and the world water day. “Keep Kampala Clean” activities were also held in all divisions on every last Saturday of the month.
8.2.2 Status and Trends of Key Indicators
Golden Indicator No. 4: Access to Improved Sanitation
The golden indicator for sanitation is “the percentage of people with access to improved sanitation”. The access to sanitation in urban areas is estimated at 84 percent. The coverage is based on reports from small towns only, as Kampala and many large towns, including Entebbe, Fort Portal, Gulu, Kasese, Mbale and Mukono, do not have data. The sanitation coverage in urban areas has increased by 7 percentage points over the last five years, although there was no noticeable improvement from last year. It should be noted that apart from the interventions under the WSDFs, there is no targeted effort to promote urban sanitation; most of the urban councils spend their funds on solid waste management.
The JMP estimates that only 34 percent of the urban population has access to improved sanitation as half of the urban population uses improved but shared facilities. Only 1 percent of the urban population is estimated to practice open defecation, while 15 percent use unimproved facilities. However, although data is not available for the whole Kampala city, Kampala City Council Authority carried out a slum profile which showed that 28% of its population in slums practices open defecation, with 19.4 percent of the population in the slums using polythene bags.

Uganda Water and Environment Sector Performance Report 2015
125
Hand Washing
According to reports from urban councils, only 35 percent of people in urban areas have access to hand washing facilities, the same as for the previous reporting period. Access to hand washing has not improved over the years, and more needs to be done to improve hand washing in urban areas.
8.2.3 Challenges and Recommendations
There is still much that needs to be done to improve faecal sludge management in urban areas, including:
(i) Continued investment in the construction of faecal disposal facilities as only 13 are in place and 5 are under construction out of the 50 clusters required in the country.
(ii) The pilot demand aggregation Faecal Sludge Management (FSM) model, which started in May 2015 needs to be implemented for at least one year to in order to implement all the different stages of the system, and to identify required adaptations.
(iii) Some households and schools may not be able to afford to use the faecal sludge management system even with the eventual reduction in costs expected due to aggregation. Therefore the sector should consider funding the faecal sludge management. This is important as any illicit disposal is detrimental especially for water quality.
(iv) The use of the ISH manual, the generic by-laws and the operational manual for cesspool emptiers need to be promoted. In particular, enforcement of construction of lined pits or septic tanks is critical as many existing facilities are not lined and therefore cannot be emptied.
(v) The sector should design and implement a hand washing program for urban areas as the rate of hand washing is still very low.

Uganda Water and Environment Sector Performance Report 2015
126
9 ENVIRONMENT AND NATURAL RESOURCES
9.1 Wetland Management
The Wetland Sector Strategic Plan (2011-2020) highlights as key objectives enhancing the knowledge base on wetlands for informed decision making; reinforcing public and stakeholder awareness; improving the planning, management and conservation of wetlands; strengthening compliance mechanisms and governance systems; and improving institutional and technical capacity for sustainable wetland management at all levels.
9.1.1 Key Programmes and Projects
This section describes the achievements in wetland management per identified key objective.
(i) National Wetlands information system (NWIS)
The National Wetlands information system was upgraded from Arc GIS 9.3 to Arc GIS 10.1. Twenty pilot districts from Eastern Uganda were connected to the NWIS. Data categories for wetlands management were incorporated into NWIS and a prototype decision support system developed. Map production to both external clients and staff increased from 84 in the previous year to 176 in FY 2014/15, and this has enhanced reporting. However, linkage to other Local Governments and the upgrade of ArcGIS from 10.1 to 10.2 was not achieved due to insufficient funding.

Uganda Water and Environment Sector Performance Report 2015
127
Figure 9.1 Structure of the National Wetland Information System and linkage to Local Governments
With support from JICA, detailed wetland resources assessments were conducted for Awoja and Doho-Namatala wetland systems and achievements made to a level estimated at 94%. These studies included Ecosystem assessment, Livelihoods assessment, Flood control function, soil erosion and sediment yield, water quality assessment, sedimentation monitoring in Awoja wetland system, and rural biomass assessment. Assessments provided scientific information to guide wetlands management but also provided additional information for the decision support tool.
(i) Wetlands Atlas
MWE was tasked to prepare a Wetland Atlas to guide the cancellation of titles starting with Kampala. To this effect, the production of Volume I of the Atlas was completed and covers areas of Kampala, Mukono and Wakiso. The wetlands shape file was also provided to Ministry of Lands, Housing and Urban Development to assist in the overlays with cadastral maps to support the cancellation process.
Note the plots that have been parcelled out / titled in the wetland
Figure 9.2 Extract from the Wetland Atlas showing Nakivubo wetland in Kampala District

Uganda Water and Environment Sector Performance Report 2015
128
Volume II of the Uganda National Wetland Atlas, which has a national coverage is in advanced stages with 60% of the work completed but only awaiting provision of satellite imagery by UNEP.
The Economic valuation for Nyaruzinga wetland in Bushenyi District was conducted up to a level of 60% and the Department is in the process of preparing the report for dissemination. Preliminary analysis shows that the wetland contributes significantly in terms on water provision for domestic use and livestock.
(ii) Restoration of Wetlands
Out of the 120 hectares of degraded section of 6 wetlands in Pallisa, Dokolo, Hoima, Kisoro, Wakiso, Luwero planned for restoration54. The Department was able to restore a total of 70 hectares in Pallisa, Kampala, Wakiso and Mukono. 12 hectares of degraded sections of Limoto wetland in Pallisa, 20ha of wetlands in Kampala, 15ha in Wakiso and 5ha in Mukono were restored which reflects an achievement of up to 58%.
In addition, working with district local governments, 109.12 acres (44.2 Ha) of degraded sections of wetlands were restored; 48 in Kambuga wetland system, 40.47 in Orusindura wetland in Sheema district, 8.094 in Kamwenge district, and 12.5457 in Kabarole were also restored. This makes an overall wetland restored to 210Ha during reporting period.
(iii) Demarcation of wetlands
A total of 173 kms of wetlands were demarcated with pillars and mark stones, way above the 150Km2 which was planned for. The areas demarcated were 28 km of Nyaruzinga wetland in Bushenyi, 12km of Namatala wetland in Mbale, 20km of Pece wetland in Gulu, 54km of Okole wetland in Lira, 11km of Kirinya wetland in Jinja, 30km of Walugogo wetland in Iganga and 18km of Budumbuli-Masese wetland in Jinja. Rapid assessments for Pallisa, Dokolo, Hoima, Kisoro, Wakiso wetlands were also undertaken.
A total of 90 km of buffer zones in different wetlands from nine districts of Palisa, Kibuku, Bududa, Butaleja, Manafwa, Kapchorwa, Sironko Budaka and Katakwi have been zoned and demarcated with live markers (tree seedlings) as first step in restoring the targeted wetlands under pilot project arrangement. The Department working with Districts and partners further demarcated 108.2Km of critical wetland boundaries using live markers in Kasese District, 8 km in Mpigi District and 15 km around Lake Victoria, supported by LVEMPII. This makes the total length of wetland boundary demarcated 394.2Km during the reporting period.
(iv) Strengthening of Wetland Legislation and Ordinances
Progress was made on preparation of the Wetland Bill; the Bill was not finalised as had earlier been planned. A Cabinet paper addressing the draft institutional arrangements has been prepared and is awaiting re-submission to Cabinet for consideration. Districts were supported in the preparation and drafting of the Environment and Natural Resources Ordinances. The plan was to support four districts, but the Department was able to support 6 districts, Sembabule, Mityana, Kasese Kiruhura Ntungamo and Kibuku registering an achievement level of 150%.
(v) Development of District Wetland Action Plans
District Local Governments were technically supported to prepare District Wetlands Action Plans (DWAPS) according to agreed guidelines. A total of 16 DWAPS were prepared compared to the planned 32, hence 50% achievement as follows; 4 DWAPS were prepared for Lwengo, Masaka,
54 Restoration refers to re-establishment of wetland conditions to as near as possible the original conditions in an area where the wetland state had been altered by past human activities. The Department undertakes this activity by removal of illegal structures and alien species, removal of reticulation of water to allow for natural regeneration and sometimes re-planting of wetland vegetation. The before and after conditions of the wetland are noted and the restoration is measured in terms of number of hectares restored.

Uganda Water and Environment Sector Performance Report 2015
129
Sembabule, Kiboga Districts in Central Region, 3 DWAPS for the districts of Kamwenge, Mitooma, and Kisoro in (South-)Western Uganda; 5 DWAPS for Northern Region and 4 For Eastern Region.
(vi) Coordination, Monitoring, Inspection, Mobilisation and Supervision
WMD monitored and inspected 182 wetland sites for compliance, far above the targeted 104, where 50 improvement notices were issued to non-complying entities and 30 compliance agreements signed with regulated communities. A total of 268 suspects were arrested, 745 assorted tools and 60 engineering plants were impounded as exhibits, 9 court case files were sanctioned, 75 case files were under inquiry, 20 court cases were with the Resident State Attorney, 17 community policing exercises were conducted and 2 convicts were acquitted (see also Figure 9.3). 25 Environment Protection Police Unit (EPPU) were facilitated to conduct monitoring and enforcement for compliance to regulations.
Despite all the enforcement action, wetland degradation still remains a big challenge. WMD and EPPU need to intensify monitoring and surveillance 24 hours a day.
Figure 9.3 Monitoring and Inspection Activities for Wetlands in FY 2014/15
Figure 9.4 Fine paid to the Environment Fund account [UGX] in FY 2014/15
MWE’s Wetlands Department undertook EIAs and project brief reviews for proposed developments in or near wetlands in order to enhance compliance. 31 EIAs out of the planned 48 were reviewed registering a success-rate of 65%. Out of all those reviewed, 11 EIAs were not recommended for approval due to the location in fragile and vital ecosystems. WMD also carried out post EIA monitoring for 35 sites, and only 11 were found to be complying with conditions of approval. To that effect, the Department also recommended the cancellation of 3 EIAs.
A total of 67 Local Governments were supervised out of the planned 111 Local Governments. This performance dropped from the previous year, which was 100%, to 60% mainly as a result of insufficient funding. The monitoring and supervision has enhanced the timely submission of Memorandums of Understanding, reporting and work planning by Local Government.
(vii) Capacity Building and Technical Backstopping
MWE’s Wetlands Department continued with capacity building for Local Governments and this Financial Year, 30 District natural resources Officers, Wetlands/ Environment Officers from Northern Uganda were trained in wetland management planning and assessment.
With support from JICA, 111 District Local Governments and 20 WMD staff were trained in wetland management planning. With this enhanced capacity building for Local Governments, the delivery on their outputs has greatly improved. Other planned trainings for 6 WMD enforcement staff in
050
100150200250300 Achieved
2014/15Achieved2013/14
46,000,000
25,000,000
Fine paid to the Environment Fund
Achieved2014/15
Achieved2013/14

Uganda Water and Environment Sector Performance Report 2015
130
compliance monitoring, database and administrative law and 10 WMD staff trained in investigative GIS mapping did not take place as a result of insufficient funds.
9.1.2 Status and Trends of Key Indicators Wetlands Management Department uses 2 platinum indicators to measure its performance. One is wetlands coverage and area under approved management plans. Some work has been done during the period under review contributing to the status of the indicators, as indicated Table 9.1. Additional information on how these indicators were established, and status of other Wetlands indicators is provided in Box 9.1.
Table 9.1 Platinum Indicators for Wetlands
Platinum Indicator Achievement Indicator No 9: Wetlands Coverage 10.91% Indicator No. 10: % Wetland Area under Approved Management Plans Increase of 810 km2
Box 9.1 Performance on Platinum Indicators for Wetlands
Platinum Indicator No 9: Wetlands Coverage The percentage of Uganda’s land area covered by wetlands is now estimated at 10.91% (26316.2) Km2, very slightly up from 10.90% (26,315.1Km2) in 2013/14 and compared to 10.9% (26,307.7km2) in 2008. This calculation is based on the wetland area restored which was 210 Ha (2.1 km2).
Platinum Indicator No. 10 % of Wetland Area under Approved Management Plans The area of Uganda’s wetland area under approved management plans increased from 1,320 km2 to 2,130 km2 .
Status of other Wetlands Indicators
Km of wetland boundaries demarcated is at 394.2 kms up from 311.2 kms in 2013/14 and making a cumulative marked boundary of 983.5 kms over the last 4 years.
Number of DWAPs developed 16 DWAPs down from 24 in 2013/14, making a cumulative total of 42 DWAPs. So far the indicator stands a 38% of total DWAPs for the whole country.
Area (Ha) of degraded wetlands restored 210 Ha of wetlands restored in the FY 2014/15, compared to 758.3 Ha in FY 2013/14 and 1,645.8Ha in 2012/13 making an overall Cumulative total of 4616.9 Ha.
Number of wetland management plans developed 16 Management Plans were developed (11 by JICA, 4 by WMD and 1 by Nature Uganda) making a cumulative total of 90 wetlands management plans in the country. This is an improvement compared to the 7 that were developed in FY 2013/14.
Number of LGs monitored/inspected for wetland management: 67 (60.4%) LGs out of the 111 DLGs were monitored and supervised for compliance, down from 91.9% recorded last financial year.
9.1.3 Challenges and Recommendations for Wetlands Management
Wetland management is hampered by the following challenges:
(i) Inadequate coordination among the national institutions and agencies that have a stake in wetland management, coupled with conflicting mandates to manage wetlands has resulted into limited performance as well as blame games within the sub-sector.
(ii) Political interference has continued to encumber some of the enforcement efforts throughout the country. Political leaders tend to side with communities to achieve the short term gains vis-à-vis the benefits from wetlands management.

Uganda Water and Environment Sector Performance Report 2015
131
(iii) Delays in the procurement processes that hindered the completion of some of the outputs as had been planned.
(iv) EIA process is not transparent and sometimes projects are approved in fragile ecosystems without the consent of the Department which has resulted into clashes on ground and a clear sign of poor coordination.
(v) Impunity and open resistance by some individuals and communities who are utilizing the wetlands.
(vi) Delays in finalisation of the wetland bill which a big stumbling block in wetland management given that the existing legal frameworks are weak and do not address key wetland issues.
(vii) Delays in the completion of court cases and execution of offenders which can be attributed to backlogs in the Judiciary and no interest to execute environmental cases.
Recommendations to address these challenges include:
a) Creation of an environmental court to fast track execution of the environmental cases community policing around the hot spot wetlands
b) The District Land Board Committees should incorporate staff from Wetlands/Environment Officers to provide technical guidance before issuance of land titles.
c) Harmonize and clearly spell out the mandates of the different ENR institutions
d) Increase awareness across all levels.
e) Initiate procurement early enough but also build capacity of staff to handle procurement
f) Approval of EIAs should not be left to one institution but a team comprising of relevant stakeholders
g) Increase monitoring and enforcement and Environment Protection Police Unit (EPPU should step up community policing especially in the hot spot areas

Uganda Water and Environment Sector Performance Report 2015
132
9.2 Forestry Management
The Forestry sub-sector is managed by three main institutions: Forestry Sector Support Department (FSSD) of MWE, National Forestry Authority (NFA), the semi-autonomous agency that manages the Central Forest Reserves, and District Forestry Services (DFS) in district Local Governments. In addition, the Private Sector plays an important supporting role, as well as the Civil Society Organisations (CSOs). The CSOs’ performance in forestry management is discussed in Section 13 of this report. Finally, there are a number of key projects, including the National REDD+ Plus Project, Sawlog Production Grant Scheme, Farm income Enhancement and Forestry conservation Project, and Enhancing forest tenure and governance in Uganda. Performance in forestry management is described in the following sections.
9.2.1 Achievements in Forests Management by MWE
The following key achievements are reported for MWE’s Forestry Sector Support Department:
x A comprehensive national assessment of the forest landscape is being conducted, and the potential as well as area for restoration is being determined by conducting spatial and socio-economic analyses, including an analysis of the enabling environment. It is evident that the area of degraded land has increased with the current forested area at nearly 10 percent. A draft Forest Landscape Restoration assessment report was prepared during the financial year. Hot spot areas for restoration have also been delineated.
x The International Day of Forests was commemorated on the 21st March 2015 in Rukungiri district. This commemoration involved raising awareness of the people on forestry management in the country through radio talks shows on Rukungiri radio and Radio one, TV talk shows on NBS TV. A total of 23,000 seedlings of Eucalyptus and Pine were planted during this commemoration in Rukungiri, and Makerere University’s Kabanyoro Research Institute in Wakiso District.
x Information on regulation of harvesting of forest products was disseminated in the period under review, with 500 copies of the guidelines for regulating forest products produced and disseminated, and 50 copies of Forest Produce Movement Permits distributed to the districts of Kyegegwa, Kyenjojo, Kibaale, Kaberamaido, Moyo, Hoima and Mpigi.
x A total of 74 timber harvesting licenses were issued for pit sawyers in the districts of Kibaale, Hoima, Kyegegwa, Kyenjojo and Moyo.
x A total of 32 Districts55 were inspected and monitored for compliance to the guidelines for forest management, provision of extension services to beneficiaries of a number of programs and projects.
x Registration and declaration of private and communal forests has been initiated in the districts of Lamwo, Masindi and Bushenyi, and 367 farmers and communities managing community forests were trained in the process of registering and declaration of private and community forests.
x Activities to restore degraded areas of the Mabira and Kalagala ecosystem were initiated with training of 300 farmers and 25 district staff in the districts of Kayunga, Buikwe and Jinja.
x In a bid to enhance the integrity of the Local Forest Reserves in the country that have been encroached on, FSSD initiated activities to engage different stakeholders in sensitisation drives
55 Kibaale, Kyenjojo, Kyegegwa, Moyo, Zombo, Luwero, Kasese, Butaleja, Bududa, Manafwa, Mbale, Budaka, Tororo, Lira, Kitgum, Lamwo, Masindi, Hoima, Kalangala, Bushenyi, Sheema, Rubirizi, Mayuge, Jinja, Iganga, Namutumba, Masaka, Mbarara, Kabale, Kisoro, Soroti and Nakapiripirit.

Uganda Water and Environment Sector Performance Report 2015
133
on the importance of sustainable management of these reserves in the districts of Luweero, Jinja, Wakiso and Bududa district.
9.2.2 Achievements in Central Forests Reserves
The National Forestry Authority (NFA) manages Central Forest Reserves. Management of these reserves is geared towards achieving four strategic objectives namely, improving management of Central Forest Reserves (CFRs); expanding partnership arrangements, supplying high quality products and services and attaining organisational sustainability. During the FY 2014/15, a number of achievements were made against planned actions: 748 ha of forest plantations were established56, 359.9 kms of boundary length was re-opened57, slash weeding of 2,491 ha was undertaken58, thinning of 1,365 ha was done59, 14,843,215 seedlings60 were raised, 2,104 m3 of round wood were harvested61, and 4,136 tourists were received in the different ecotourism sites62.
Through collaborative forest management, NFA continued to demonstrate to forest dependent communities the relevance of forests to their livelihood. Meetings were held with forest adjacent communities to discuss issues relating to encroachment, fire awareness and CFM related activities. Restoration planting of 300 ha was also undertaken through partnerships with corporate organisations such as Uganda Breweries Limited, Serena Hotel and Standard Chartered Bank. 315 ha was restored by enrichment planting in Mabira CFR.
9.2.3 Achievements by District Forest Services
Forestry management at the local government level is implemented through the District Forestry Services (DFS). During the FY 2014/15, of the 112 local governments, only 39 district reports have been received, reporting the following achievements:
x In total 3,194,161 assorted tree seedlings were distributed to farmers and institutions, the equivalent of approximately 4,898h a. Of this, the average survival rate was 80.3percent.
x A total length of 30.75 kms of road reserves were planted with trees in the 4 districts of Bulambuli, Pallisa, Yumbe and Kaberamaido.
x A total area of 48 ha of Local Forest Reserves were maintained in the districts of Masindi and Tororo while 80.2ha was planted and restored in 6 districts.
56 in the reserves of Mafuga (223 ha), Lendu (200 ha), Mwenge (21), Mbarara (251ha), NTSC (7.9) and South Busoga (45 ha).
57 with 6 kms opened in Kulobia CFR, 70 kms in Luwunga CFR, Ibambaro (10 km), Kitechura (12 km), Matiri (28.1 km), Namwasa (79.8 km), Kanaga (13.2 km), Kikonda (98 km), Alungamosimosi (29.6 km) and Soroti (13.2km).
58 in plantations of Mafuga (900ha), Mwenge (239ha), Katugo (11ha), North Rwenzori (163ha), South Busoga (262ha), NTSC (13ha) and Lendu (645ha) and the natural forests of Kyoga (86 ha), Nyakunyu CFR (6.5 ha), West Nile (10ha) and Victoria Lake shore (155.5ha).
59 in Mwenge (680ha), South Busoga (113ha), Lendu (145ha), Muzizi (343.86ha), West Nile (10ha), 30ha in Lakeshore in Kifu CFR and Kyoga (43ha); while pruning of 793ha was conducted in Mafuga (500ha), Kasana-Kasambya (102ha), Lukuga (93ha) and Nakwaya CFR (98). This was work contracted under GOU supplementary budget allocation in Kasana-Kasambya, Lukuga and Nakwaya CFR.
60 7,047,279 seedlings were raised for sale, 1,577,947 for NFA’s own planting and 6,217,989 for Community Tree Planting Program.
61 In total 2,073m3 from way-leaves for electricity and expansion of roads in CFRs of Mpigi (607.2ha), Zirimiti (30.7ha), Nkenda-Hoima (831.6ha), Budongo (34ha) and Kawanda-Masaka (569.7ha)). A total of 1,716 trees with a volume of 633m3 of round wood were marked for thinning and milling in Kifu CFR.
62 Lakeshore 2,042 tourists; Budongo 1,910 tourists and Kalinzu CFR 184 tourists. A total of 795 guided walks were undertaken in the ecotourism sites of Lakeshore (607), Budongo (146) and Kalinzu- Nkombe (42).

Uganda Water and Environment Sector Performance Report 2015
134
x All in all, 5,295 farmers and 136 institutions were trained in different aspects of forestry management. In total, 169 community members were trained in the use of efficient energy technologies in the districts of Amolatar, Bukwo, Busia and Adjumani. An amount of 124 private Nursery Operators were supported with capacity building in the districts of Kapchorwa, Oyam, Mayuge, Busia and Isingiro.
x UGX 286.79 million was collected as revenue from trade in forest produce as well as through fining illegal transactions in forestry in 12 districts.
9.2.4 Private Sector Participation
Private sector participation is mainly through tree growers brought together through the Uganda Timber Growers Association (UTGA). UTGA has 280 members.63
UTGA has continuously engaged government and local governments to promote commercial forestry in the country. UTGA organised 6 field cluster meetings, and two sensitisation meetings for tree nursery operators and contractors, respectively. The Association has advanced plans to transform into a Company limited by Guarantee so as to give it legal status. Working with Environmental Alert and FSC, the Association carried out a pilot for the small and medium tree planters in the Mubende cluster for Forest Stewardship Council group certification using the Modular Approach (MAP). The Association also carried out a cost benefit analysis for pine and clonal eucalyptus along the value chain to source and share indicative costs of activities, financial and profitability information and productivity work studies.
9.2.5 Key Programmes and Projects
(a) Reducing Emissions from Deforestation and forest Degradation (REDD+)
During the FY 2014/15, the National REDD+ Project has raised awareness of the project to different stakeholders, and recruited the relevant consultants. The awareness raising has been carried out through the National Technical Committees, taskforces, and the Expanded Climate Change Policy Committee. Key achievements are the following:
(i) The Expanded Climate Change Policy Committee and the National Technical Committees (REDD+ national baseline scenario and national forest monitoring system, and SESA/Safeguards) were mobilised and sensitised on REDD+ Processes.
(ii) The National REDD+ Secretariat participated in the climate change awareness campaign across the country in selected districts64 .
(iii) There is increased understanding and appreciation of REDD+ Programme as a key contribution to forestry resources development and management, climate change mitigation and or adaptation measures among the stakeholders, including development and CSO partners. In this regard, the REDD+ Secretariat prepared Uganda’s application (Inception Note) to participate in the Climate Investment Funds (Forest Investment Plan). Uganda’s Inception note was approved in May 2015 with a budget of USD 250,000 to support the preparation of a detailed Forestry Investment Plan (FIP).
63 spread out in the following clusters: Mubende (Mityana to Fort Portal); Victoria (Along the shores of the lake from Rakai to Mayuge); West Nile (Arua, Nebbi, Yumbe, Koboko, Zombo, Moyo); Northern Uganda (Gulu, Lira, Amuru, Dokolo, Soroti, Serere); Western Uganda (Mbarara, Bushenyi, Kabale, Ntungamo,); Central (Luweero, Nakasongola & Nakaseke); Albertine (Kiboga, Kyankwanzi, Hoima & Masindi).
64 Ntungamo, Mbarara, Ssembabule, Rakia, Masaka, Kayunga, Nakaseke, Kiboga, Hoima, Mubende, Kamuli, Pallisa, Nakasongola, Masindi, Apac, Soroti, Katakwi, Kotido, Moroto and Nakapiripirit

Uganda Water and Environment Sector Performance Report 2015
135
(iv) Four trainings/awareness raising workshops were held65, targeting stakeholders’ ownership of the Readiness Preparation Proposal (R-PP), increased understanding of REDD+ and the commitment by the staff to participate in the implementation of the R-PP, understanding the process of establishing a national forest baseline scenario and a functional National Forest Monitoring System, and the development and implementation of a Safeguards Information System (SIS) for REDD+ in Uganda.
(v) Three capacity strengthening meetings have been held and a set of deliverables agreed in the establishment of National Forest Emissions Reference Levels and National Forest Reference Levels for a National Forest Monitoring System.
(vi) Initial interpretation of the remotely sensed forestry data is almost complete and its results have formed the basis for ground truthing activities being undertaken by NFA66.
(vii) Commenced the development of the Monitoring, Evaluation and Reporting Framework for REDD+.
(viii) The REDD+ project has also supported tree planting with an aim to off-set carbon footprints in the pilot Mt. Elgon region. Up to 585,985 Seedlings have been distributed during this FY in the districts of Mbale, Bududa, Manafwa, Sironko, Bulambuli, Kapchorwa, Bukwo and Kween.
(b) Farm Income Enhancement and Forestry Conservation Project (FIEFOC)
The FIEFOC project is now in a bridging phase, as phase 2 is under preparation. The project has mainly supported the rehabilitation of the catchments of Irrigation schemes through tree planting. Additional support was provided to very critical areas outside the catchments of the scheme but with a critical function to enhance restoration of the target catchments.
A total of 1,801,510 assorted tree seedlings were distributed and planted in the catchment areas of irrigation schemes (Doho, Mobuku, Agoro and Olweny)67, whereas 769,699 seedlings were distributed and planted outside the catchments in the districts of Amolatar, Masaka and Mukono.
(c) Sawlog Production Grant Scheme (SPGS)
SPGS is a programme to support private sector involvement in commercial tree growing. The overall target of SPGS II was to support the establishment of 30,000 ha of timber plantations. The project performed very well by supporting the establishment of 32,177ha (107%) by 389 clients. Phase II of the project officially closed on 27th December 2013. A no cost extension period (from 27th December 2013 to 31st March 2015) was secured to enable the project to continue operating mainly focusing on completing payments of 2nd and 3rd grant instalments for tree farmers in the period under review. The following activities were implemented:
(ix) Plantation establishment: SPGS inspected forest plantations in June/July 2014. The 2nd payment for 1,790.5ha and 3rd payment for 1,254.0ha under medium category planters were approved as well as for 533.5ha and 2,034.5 ha, respectively under large scale category planters.
65 with: (1) Staff of the Directorate of Environmental Affairs, (2) all relevant stakeholders including government institutions, NGOs, CSOs and private sector, (3) the Multi-stakeholder National Technical Committee on the national Forest Baseline Scenario and the National Forest Monitoring System (NFMS) and (4) the Multi-stakeholder National Technical Committee on the development of the Safeguards Information System (SIS)
66 The interpreted are covered so far includes the greater Mt Elgon Ecosystem/Landscape area (Greater Bugisu, Tororo and Kapchorwa), covering 500,000 Ha; Northern Eastern Uganda Ecosystem/Landscape area (Greater Karamoja & Teso) covering 4,000,000 Ha; Western Proper Uganda Ecosystem/Landscape area (Greater Bunyoro & Toro) partially done under Norway support to the oil sector covering 3,000,000 Ha., thus the total area covered is 7,500,000 Ha.
67 in the districts of Butaleja, Tororo, Mbale, Manafwa, Bududa, Kasese, Bushenyi, Rubirizi, Mitooma, Buhweju, Sheema, Ibanda, Lamwo, Kitgum, Gulu, Nwoya, Amuru, Lira, Alebtong, Otuke and Dokolo.

Uganda Water and Environment Sector Performance Report 2015
136
(x) Woodlots: 20 ha was established for Shuuku Farm in Kiruhura district.
(xi) Training and raising awareness: This particular output is aimed at promoting knowledge and skills for sustainable management of commercial forest plantations and also raise the profile of the commercial forestry industry through media and information sharing. Nine courses were conducted and 179 participants were trained in weed control, forest contracts management, teak nursery establishment and management, and chain saw use. Eleven participants went to Kilombero Valley Teak Company in Tanzania to learn about teak growing business. Following this exposure tour, 4 of the tree growers on the team started their own nurseries producing teak planting material, using the knowledge gained from the study tour.
(xii) Research and Development and other support to Growers:
x In July 2014, SPGS initiated a process of testing the strength properties of clonal eucalyptus poles for power transmission suitability. The activity was carried out in collaboration with New Forests Company and the results showed the poles were suitable.
x SPGS supported UTGA, through technically facilitating all cluster meetings organised by UTGA.
x Through development of commercial tree nursery operators and forest contractors, 54 nurseries and 14 forest contractors were certified for 2014 under SPGS standards. Audits were done to generate certified nurseries and contractors for 2015.
x SPGS partnered with National Forestry Resources Research Institute (NaFORRI) to establish the first lot of tree species trials in Albertine and Victoria Clusters during the October/ November 2014 season to provide information on new tree species growth across selected sites country wide.
(d) Enhancing Forest Tenure and Governance in Uganda
This project is aimed at supporting and facilitating the registration and declaration of private and communal forests in the Lamwo, Bushenyi and Masindi Districts, to enhance forest governance, and support printing and dissemination of forest management guidelines. The project has in the period under review (i) prepared management plans for two communal forests in Lamwo and Masindi, (ii) trained 20 managers of the community forests and 6 district staff in conflict management, processes for registration and declaration of forests, (iii) prepared popular versions of the guidelines for management of private and community forests, and (iv) Initiated the process to prepare the annual status of forests report for Uganda; a draft has been prepared.
9.2.6 Status and trends of Key indicators Five platinum indicators relevant to forest management were developed under the ENR Performance Assessment Framework and need to be further fine-tuned. Some work has been done during the period under review contributing to the status of the indicators, as indicated as indicated in Table 9.3. Additional information on how these indicators were established, and status of other Wetlands indicators is provided in Box 9.2.
Table 9.2 Platinum Indicators for Wetlands
Platinum Indicator Achievement Indicator No. 1: % of Uganda’s land area covered by forest 11% Indicator No. 2: % of natural forest under strict nature reserve 12% Indicator No. 3: % survival rate of tree seedlings (past year 3) 78% Indicator No. 4: % of rural households travel avg 1.0 km to collect firewood for their use n.d. Indicator No. 5: % of forest reserves under management plans 32%

Uganda Water and Environment Sector Performance Report 2015
137
Box 9.2 Performance on Platinum Indicators for Forestry
Platinum indicator No. 1: % of Uganda’s land area covered by forest
Using 2010 spatial data, the forest coverage in the country is now 11 percent.
Platinum indicator No. 2: % of natural forest under strict nature reserve
This indicator has remained at 12 %, although some of the areas have been illegally harvested.
Platinum indicator No. 3: % survival rate of tree seedlings (past year 3)
The survival rate of the planting across the whole country is difficult to register given the participation of different players in tree planting with limited information sharing on progress. The average survival rate has been provided under SPGS (80%), NFA (80%), DFS (80.24%) and FIEFOC (70%) based on both monitoring and actual validation. This has remained during the period under review. Using a combination of these records, the average survival is at 78 percent.
Platinum indicator No. 4: % of rural households travel avg 1.0 km to collect firewood for their use
Since the last household survey at national level, no such survey has been conducted to establish the baseline. However, validation of the results of FIEFOC project showed that average distance covered in the project areas was 0.7km indicating that tree planting interventions could produce positive results in reducing the distances travelled to collect firewood at national level if tree planting is intensified across the country.
Platinum indicator No. 5: % of forest reserves under management plans
Forest reserves with management plans remained at 32% during the period under review.
9.2.7 Challenges and recommendations
Encroachment and illegal timber/tree extraction are the main threats to effective management and conservation of CFRs. Illegal allocation of land titles is taking place in Local Forest Reserves in the districts of Kalungu, Nwoya, Bududa, Luwero, Masindi and Dokolo. Both encroachment and illegal issuance of land titles has to be addressed through boundary opening and demarcation of the forest reserves, and prosecution of those who are involved through establishing environment courts. Furthermore, illegal trade may be addressed by enhancing tracking of timber and other forestry products, and coordination of the different actors.
Poor governance is a challenge, which needs to be improved through enhanced sector coordination and transparency.
The issue of inadequate information and data on forest resources should be addressed through conducting forest inventories and the use of satellite imagery and GIS.
Inadequate financing needs to be addressed through resource mobilisation.

Uganda Water and Environment Sector Performance Report 2015
138
9.3 Environmental Management by Department of Environmental Services (DESS)
9.3.1 Key programmes and projects
Monitoring and inspection of local governments
In FY 2014/15, MWE’s Environmental Support Services Department (DESS) carried out monitoring, inspection and supervision of 12 local governments68 (compared to 11 local governments in FY 2013/14), as well as consultations on local government conditional grants in 12 local governments, and consultation with 9 local governments69 on a proposal for hilly and mountainous areas. Findings are the following:
Funding: Some local governments receive funds to undertake environment related activities from existing grants, mostly the Peace and Recovery Development Plan (PRDP) and the Local Government Management and Service Delivery (LGMSD) project. Otherwise, the Conditional Grant for Wetlands provided to each district Local Government is in practice used for all environment activities, and is insufficient to cater for all environmental works.
Environment initiatives: tree nurseries have been established using local revenues. For example, Lwengo district planted 50,000 seedlings from National Forest Authority in schools, whereas a fruit orchard has been established at Budaka district headquarters.
Environmental mainstreaming: capacity to undertake environmental mainstreaming has been built in the mentioned 12 District Local Governments. In Bukedea District, environmental certification has been made mandatory before payments are made to contractors.
Office space and transport: Most local governments have provided adequate office space with computers and furniture. The biggest challenge is lack of transport facilities.
(a) Kalagala Sustainable Management Plan (KoSMP)
Restoration activities for the River Nile banks in the districts of Kayunga, Buikwe and Jinja continued in the FY 2014/15.
x River bank demarcation was undertaken in Wakisi Sub-County (13.6 km) in Kayunga district and Butagaya Sub-County (6.5km) in Jinja district. Pillars and beacons were planted to mark the 100 m protection zone. Boundary assessment of 7.0 km in preparation for demarcation was done in Njeru Town Council.
x Mobilisation and sensitisation of farmers in preparation for tree planting activities was undertaken. A total of 47 farmer groups were formed, comprising of 941 members in the Sub-Counties of Butagaya and Budondo (Jinja district), Wakisi (Buikwe district) and Kangulumira (Kayunga district). This was followed by assessment of their tree planting needs and availability of land.
x Preparation of restoration plans was initiated in consultation with communities within the river banks in the four sub-counties of Butagaya, Budondo, Wakisi and Kangulumira.
x Identification and assessment of bare hills within the R. Nile catchment in the districts of Jinja, Buikwe and Kayunga for restoration and tree planting activities was accomplished. Status of the
68 Nwoya, Apac, Oyam, Lwengo, Bukomansimbi, Bukedea, Budaka, Butaleja, Kumi, Ngora, Masaka Municipality and Gulu Municipality
69 Manafwa, Bulambuli, Kapchorwa, Kween, Kabale, Kisoro, Kanungu, Sironko and Bududa Districts

Uganda Water and Environment Sector Performance Report 2015
139
identified hills was recorded including: ownership status, acreage, ongoing activities and assessment of willingness of owners to plant trees.
(b) Environmental Monitoring of Oil and Gas Activities
MWE continued with monitoring of oil and gas activities in the Albertine Graben to provide a basis for public confidence about the safety and environmental responsiveness of the oil exploration and development activities. Monitoring the implementation of the strategic plan for the Northern Albertine region was carried out in the districts of Kyenjojo, Kibale, Kyegegwa, Masindi, Hoima and Buliisa.
A multi-sectoral monitoring team monitored road works, waste consolidation areas (WCAs), waste treatment and disposal facilities, ongoing restorations, sensitive ecosystems threatened due to oil and gas externalities and restored sites in the districts of Hoima, Buliisa and Nwoya. The team comprised of officials from the Ministry of Water and Environment, Ministry of Energy and Mineral Development, Ministry of Lands, Housing and Urban Development and Ministry of Agriculture, Animal Industry and Fisheries as well as government agencies including; the National Environment Management Authority, the National Forest Authority and the Uganda Wildlife Authority. The findings of the monitoring trip are summarised in Box 9.3.
Box 9.3 General findings from the multi-sectoral monitoring
Various support infrastructure to oil and gas activities exists at Kingfisher development area, which are close but separate, with independent approval certificates such as camps, airfield, roads, drilling pads among others, each of which impacts on the environment during construction and use. The cumulative and incremental impacts of projects at Kingfisher are not certain on environment management, peoples’ livelihoods and health, and aquatic biodiversity of Lake Albert.
By the time of the monitoring activity, it was found out that of all oil companies, only TEPU had engaged a contractor to treat and dispose of the generated waste. None of the other companies had contracted any company to treat and dispose of the waste, and yet drilling waste constitutes one of the critical environment management issues of the sector.
It was also found out that TEPU had committed itself to restore all sites where it had left a foot print, both in the protected area and in the community, apart from Waste Consolidation Areas and Camps. In the other Exploration Areas, restoration works was either going on or yet to be done.
Not all restored sites were recovering well. Some sites, despite being restored earlier, were poorly recovering compared to those restored later. An example was Gunya – 1, which was restored in 2014 doing much better in terms of recovery than Ngiri – 5, restored earlier in 2013. Biodiversity and integrity of the sites doing poorly was under threat.
Poorly recovering restored Jobi East 4 site with gullies forming
All sites from which drilling waste had been evacuated, lacked a weigh bridge to take measurements at the point of evacuation. This raises concern over traceability of the waste, which may have been pouring out on the way to Nyamasoga Waste Treatment and Disposal Area in Hoima.
Weigh bridges should be used to ascertain quantities leaving the consolidation sites and these quantities should be verified with those at the receiving facility.
The Nyamasoga Waste Treatment Facility was still undergoing construction and yet at the same time, drilling waste was being received, leading to temporal storage of the waste at site as it was not immediately

Uganda Water and Environment Sector Performance Report 2015
140
Treated, especially drilling fluids. Receiving and treatment rates of the waste were not synchronised.
None of the Waste Consolidation Areas had a retention / evaporation pit for storm water for it to be tested before discharge into the receiving environment. This means that even contaminated water gets into the environment with negative impacts on both terrestrial and aquatic biodiversity.
Oil and gas activities had undoubtedly resulted into increased human population in Albertine Graben. Unplanned population increase had resulted into pressure of existing social infrastructure and indiscriminate settlements resulting into conflicts over land ownership rights in some places such as Kingfisher Development Area and Sebagoro among others. The high population influx and displacements had also threatened biodiversity of protected areas through encroachments and poaching.
Coloured water pooling on a protective liner covering drill cuttings
(c) Other Projects and Programs
MWE/DESS participated in the following projects and programs:
Improving Policies and Strategies for Sustainable Environment, Natural Resources Management and Climate Risk Management Project; DESS continued with coordination of the project to finalize the review of the National Environment Management Policy and preparation of an implementation framework for the policy as well as preparation of the electronic waste management guidelines in collaboration with the Ministry of Information and Communications Technology.
Transboundary Agro-Ecosystem Management Project in the Kagera Basin; DESS participated in Project Technical Steering Committee meetings both at national and regional levels. The project was to support the adoption of integrated land resources management in the Kagera Basin to generate local, national and global environmental and socio-economic benefits. The project ended in May 2015.
Integrated Landscape Management for Improved and Ecosystem Resilience in Mount Elgon; MWE in collaboration with the Ministry of Agriculture, Animal Industry and Fisheries (MAAIF), Ministry of Lands, Housing and Urban Development, the National Agricultural Research Organisation, the National Environment Management Authority and the local governments of Mbale, Manafwa and Bulambuli developed the project document.
Uganda Climate Smart Agriculture Programme; the programme is to be jointly implemented by MAAIF and MWE. The programme intends to promote adoption of climate smart technologies and sustainable land management practices among others.
Ecosystem Based Adaptation Project (EBA); the project is implemented by MWE in partnership with the International Union for Conservation of Nature and Natural Resources (IUCN), the United Nations Environment Program (UNEP) and the United Nations Development Program (UNDP) in the districts of Sironko, Kween, Kapchorwa and Bulambuli. The project aims to strengthen the capacities of Uganda to build ecosystem resilience, promote EBA options and reduce vulnerability of communities with particular emphasis on mountain ecosystems. Key achievements include training of district local governments on integration of EBA into District Development Plans, development of a public policy and Financing Framework for EBA in mountain ecosystems, Cost Benefit Analysis of EBA options in

Uganda Water and Environment Sector Performance Report 2015
141
Mount Elgon region, and development of a training manual for implementation of EBA in Mount Elgon region.
9.3.2 Challenges and recommendations
A number of challenges were faced during the period under review. These are summarised per activity, whereby also recommendations are provided to overcome the challenges.
(a) Monitoring and inspection of local governments
(i) Low levels of coordination among local government staff, especially the Environment Officers with the Planners, Engineers and Chief Administrative Officers
(ii) Lack of facilitation to undertake field activities in form of transport facilities and allowances
(iii) Low levels of appreciation of the need to mainstream environment in other development projects, plans and programs
(iv) Low levels of staffing: most of the available local government posts are not filled.
MWE (particularly the Directorate of Environment Affairs) should engage Chief Administrative Officers to improve the commitment towards environment activities and support to the staff.
(b) Kalagala Sustainable Management Plan (KoSMP)
The main challenge with implementation of the KoSMP is the negative perception of some of the community members that the project is aimed at evicting them in the name of conservation. Sensitisation activities and involvement of local leaders should be increased in all project activities.
(c) Monitoring of Oil and Gas activities
(i) Drilling waste has not been treated by most of the drilling companies
(ii) Most companies do not restore exploration areas
(iii) Restored sites show a poor recovery
(iv) There are no weigh bridges at evacuation sites
(v) There are no retention/ evaporation pits for storm water.
The following recommendations can be made:
a) there is need to undertake comprehensive impact studies of the modifications caused by projects;
b) oil and gas exploration companies should provide an road map for disposal of drilling waste;
c) all oil companies should provide information of status and plans for all sites in their areas of operation;
d) oil companies should identify poorly recovering sites and engage experts to restore problematic sites;
e) Enviroserv, the firm that was contracted to manage hazardous oil waste, should ensure that the rate of waste receipt at the site is synchronised with the rate of treatment. An environment audit of the facility also needs to be done including waste excavation and transportation;
f) for Waste Consolidation Areas that are not going to be decommissioned soon, evaporation pits should be constructed to retain and test any runoff before discharge to the receiving environment; and
g) physical plans that are sensitive to environment management and biodiversity conservation should urgently be produced for towns and growing urban centers in Albertine Graben.

Uganda Water and Environment Sector Performance Report 2015
142
9.4 Environmental Management by National Environment Management Authority
9.4.1 Achievements
This section describes the highlights of the performance of NEMA in FY 2014/15 for key programmes and projects, described per Key Result Area as identified in NEMA’s strategic plan.
(a) Environment and Natural Resources (ENR) management integrated at national and local government levels
NEMA carried out support supervision and compliance monitoring in 30 Districts/Councils70 out of the 40 planned, representing a performance of 75%.
A total of 7 Districts71 were engaged to integrate an ecosystem approach into local development initiatives within Lake Kyoga Basin through stakeholder meetings and community sensitisation programs. In total, 10 selected District Local Governments72 were supported to kick-start the review and/or development of District Environment Action Plans in the Albertine Graben. These Plans were further monitored and assessed on the progress of mainstreaming oil and gas impact mitigation into the District Development Programs (DDPs).
Environment management capacity building workshops were organised for the Technical and Political Leadership of Namasale Town Council and Amolatar District Local Government with a focus on fragile ecosystems management. The technical and political leadership of Ngora, Serere and Kaberamaido were trained on integration of management and protection of fragile ecosystems in Local Government initiatives. Consequently, the sensitised and trained local governments have appreciated the consequences related to fragile ecosystem degradation, and have attempted to identify the degraded sites for restoration.
NEMA engaged and built the capacity of the 30 Civil Society Organisations operating in the oil-rich Albertine Graben to understand, manage and monitor environmental issues surrounding exploration and production of oil and gas in the Graben. NEMA participated in planning and coordination meetings with key Sector Working Groups73 to guide lead agencies on integration of environmental sustainability concerns in plans and budgets. Through NEMA’s participation, the visibility of environmental issues in sector plans has improved. The Budget Call Circular issued by Ministry of Finance Planning and Economic Development (MoFPED) has incorporated Environment and Natural Resources (ENR) issues.
A draft tool kit for mainstreaming ENR issues was developed and shared with desk officers at MoFPED. In total 40 participants from key financial institutions received training and guidance on integration of ENR issues in their financial products. Furthermore, Uganda Manufacturers Association (UMA) managers and members were trained in environmental concepts, integration and sustainability reporting. A total of 40 participants, representing a cross-section of industries, received training under the theme enhancing profitability and competiveness through environmental compliance. NEMA received feedback on best practices received from the leather and tanning industry in Jinja, and Tororo Cement. A one week long training was organised in partnership with the office of the Auditor General
70 The inspected and monitored local governments include Kayunga, Jinja Municipal Council, Buikwe, Mukono, Budaka, Butaleja, Bugiri, Mayuge, Kapchorwa and Bulambuli in the eastern region, Buliisa, Masindi, Kole, Lira, Oyam, Apac, Dokolo, Pader, Gulu, and Nwoya in the northern region, and Kalangala, Kisoro, Kalungu, Sembabule, Masaka, Rakai, Kiboga, Hoima, Mpigi, Bukomansimbi in the western region.
71 Serere, Ngora, Kaberamaido Amolatar, Nakaseke, Nakasongola and Buyende
72 Hoima, Buliisa, Nebbi, Nwoya, Kiryandongo, Kanungu, Rubirizi, Kasese, Ntoroko and Rukungiri.
73 Water and Environment, Energy, Accountability, Agriculture, Public Sector Management

Uganda Water and Environment Sector Performance Report 2015
143
for their staff, to build the capacity of the office of Auditor General in ensuring value for money budgeting and implementation of ENR integration by the sector votes.
NEMA, in partnership with National Planning Authority, MWE, MoFPED, Ministry of Foreign Affairs and civil society representation has continued to coordinate and participate in discussions on development of Sustainable Development Goals (SDGs). A draft report A for the Post Rio+20 National Action Plan containing SDGs has been prepared and submitted for stakeholders review and this process has influenced the development of the National Development Plan II, making Uganda one of the first countries to integrate SDGs in its development framework.
(b) Environmental compliance and enforcement enhanced
Inspections
A total of 1,154 environmental compliance audits and inspections were carried out (1,200 planned; 96% performance). The inspections focused on prioritised follow-up actions, red and yellow flagged industries with focus on the major sectors which include among others; industrial facilities for chemicals, paints, foods and beverages, tanneries, and projects within oil and gas sector through multi-sectoral, multi-media and multi-disciplinary inspections, monitoring and surveillances especially by NEMA, key Lead Agencies and the Environment Protection Police (EPP).
The inspected facilities, especially the tanneries, cement industries, food processing and breweries have responded positively by introducing self-regulatory systems and mechanisms like introduction of waste treatment facilities, recycling and re-use, staffing for environment management, self-auditing, environmental sustainability reporting, corporate and social responsibilities, and other innovations.
Environmental inspections, enforcement and community sensitisation meetings were carried out (i) in the lower catchment of Lake Wamala and its associated wetlands in the districts of Gomba and Mityana, (ii) in Amolatar and Apac districts for the management of Lake Kyoga and Kwania, (iii) in Aligoi ( Nyero Sub-County and Akisil-Kabwele Villages in Kayum Sub-County – Kumi District) on the sustainable use and management of Akadot wetland and its catchment, (iv) Bududa District and Mt. Elgon National Park, and (vii) the wetlands of Mayanja, Lubanve, Temangalo, Katonga, Mlutamidwa, Nakyetema, Songai, and Nabajuzzi for the proposed construction and maintenance of the Kawanda – Masaka 220KV Power line.
NEMA gazetted a total of 375 environmental inspectors, 60 of who have been trained while others will be trained in phases. The Environment Inspectors are expected to complement the efforts of NEMA in environmental compliance and enforcement within their mandates.
Ban on polyethylene carrier bags
NEMA has illustrated that it is possible for polyethylene carrier bags (Kaveera) to be eliminated without adverse impact on the economy as was initially feared. The enforcement of the Finance Act 2009 through Environmental Compliance Inspections, confiscation of the illegal plastic bags and public awareness on the use and distribution of plastic carrier bags within Kampala and neighbourhoods have significantly reduced distribution and use with a corresponding increase in the use of environmentally friendly alternative packaging for the conveyance of purchases by the public.
Clean Development Mechanism (CDM) project
Quarterly supervision and monitoring of the Clean Development Mechanism (CDM) project was conducted in all the CDM-supported municipal councils74; consequently, waste management has relatively improved from 25-30% before the project to 55-60% during the project implementation in the 12 municipalities. However, the urban authorities still face challenges in ensuring the efficient and
74 Arua, Lira, Soroti, Mbale, Jinja, Mukono, Fort Portal, Kasese, Mbarara, Masindi and Hoima

Uganda Water and Environment Sector Performance Report 2015
144
effective management of the CDM project; the institutional and financial sustainability of the project needs to be addressed by both NEMA and the urban authorities.
Oil spill plan
In the oil and gas sector, an Environmental Risk Analysis and Contingency Analysis for the Oil Spill Plan was finalised and a draft report produced. Furthermore, a consultant has been engaged to develop economic instruments to regulate the exploration and production of oil and gas; collect baseline data for the implementation of the environmental monitoring plan of the Albertine Graben; develop IEC materials on oil & gas exploration, and carry out stakeholder sensitisation workshops on new and emerging developments and environmental issues.
(c) Access to environmental information and education/awareness, public participation increased
Information and knowledge communication gaps on oil and gas and other emerging issues was documented and is electronically accessible from the NEMA library.
The process for the production of the 2014 National State of Environment Report (NSOER) commenced and data collection is on course. The NSOER provides a range of information and policy options/strategies for effective environment management in Uganda.
A total of 100 schools75 were trained in the practice of environmental education in schools and communities; 200 inspectors of schools, head teachers and teachers were trained in the practice of environmental education in schools and communities; 60 schools76 were monitored for compliance; and best practices in environmental education were documented.
A number of Information, Education and Communication (IEC) materials were produced to commemorate the World Environment Day (WED) that had a national celebration in Rakai District with a focus on the national theme ‘35 Million People, Limited Resources, Consume with Care.” One of the major WED 2015 activities was to exhibit environmental-friendly technologies, practices and materials being promoted by different stakeholders from Government institutions, CSOs, the Private sector and communities. Over 70 Exhibitors came from Uganda, Kenya, Burundi and Rwanda and from different districts.
Besides, NEMA produced and disseminated other IEC materials on key and salient environmental issues and challenges like impacts of climate change on livelihoods, green economy, wetland degradation, waste management, oil and gas, and biodiversity loss.
The NEMA Library is being digitised in order to enhance electronic access to environmental information, which can be accessed through the NEMA LAN by all staff for information access and research purposes. Documents stored will also contribute to enhanced access to information as well as production of different publications such as environmental reports, pictures, maps and atlases.
In total, three public policy dialogues were organised with a focus on industrial pollution, green economy (cleaner production) and management of Lake Victoria as a security issue.
75 in the five districts of Bugiri, Jinja, Kiryandongo, Buyende and Budaka
76 in Kamwenge, Ibanda, Kiboga, Hoima, Mubende and Kibaale Districts

Uganda Water and Environment Sector Performance Report 2015
145
(d) Institutional capacity of NEMA and its partners enhanced
NEMA coordinated the review of the National Environment Management Policy (NEMP) to take care of the new and emerging developments and environmental issues/challenges. As a result, the draft policy has been produced, the NEA has been amended and the regulations reviewed/developed. The implementation strategy, monitoring and evaluation framework, and communication strategy are being developed to enhance effective implementation of the policy.
Besides, the National Environment Act (NEA) and the related regulations have been reviewed to enhance institutional capacity in environmental compliance and enforcement.
Draft guidelines and criteria for the cancellation of illegal land titles, issued in wetlands, were completed and submitted for review and approval by Policy Committee on Environment (PCE).
NEMA funded the establishment of baseline data and information to enhance the implementation of the ENR Performance Measurement Framework through performance indicators and targets that will be used to realize the ENR Platinum Indicators. The set performance indicators and targets will enhance efficient and effective planning and reporting in the ENR Sub-Sector.
(e) Partnerships and network for effective environment management strengthened
In partnership with the African Forum on Biodiversity, NEMA shared Uganda’s experiences in developing the National Biodiversity Strategy and Action Plan (NBSAP), and mainstreaming it in the national development frameworks, in a conference held in Namibia. NEMA continues to represent the country in regional and international meetings including the Multilateral Environmental Agreements (MEAs) and Conventions such as the UNFCCC, UN Convention on Biological Diversity, Montreal Protocol and the Stockholm Convention, while partnerships with UNEP and UNDP were consolidated. NEMA coordinated the national participation in COP12 held in South Korea.
NEMA reviewed and updated the National Biodiversity Strategy Action Plan (NBSAP), including the development of guidelines and action plan for financing biodiversity. The revised NBSAP has addressed the following new and emerging issues which are not in NBSAP1: climate change; biotechnology and biosafety; oil and gas; taxonomy, biofuels; pollution; invasive alien species; and green procurement.
NEMA successfully coordinated the post 2015 Development Agenda through the UN Open Working Group (OWG) sessions that finally gave rise to the 2030 Development Agenda for Sustainable Development, and NEMA has continued to participate in international obligations such as the Rio+20 initiatives and processes, Convention on Biodiversity (CBD), Stockholm Convention, Montreal Protocol and Basel Convention on Mercury.
9.4.2 Key Programmes and Projects
Other interventions, including achievements, through projects and partnerships are mentioned in the following paragraphs.
(a) Kidepo Critical Landscape Conservation (KCL) Conservation project
KCL project focuses on the conservation of the Shea Tree within and around Kidepo valley National Park, and wildlife within the protected area. The KCL project has created knowledge and understanding about environmental laws among the local governments and law enforcement agencies. Besides, capacity has been built among the local governments and law enforcement agencies on the enforcement of environmental laws to enhance protection of the Shea Trees.
Cultural leaders in biodiversity management in National Parks, CFRs and wildlife dispersal areas have been integrated in decision-making governance of land-use management in the project area. This has also created a common understanding of planned measures for handling pressure on savannah

Uganda Water and Environment Sector Performance Report 2015
146
woodland resources in the Kidepo critical landscape, with specific reference to Shea Trees and megafauna (large animals).
(b) Strengthening the Management of the Oil & Gas Project (SMOGP) in Uganda
NEMA coordinates the Environmental Pillar of the project and is planned to (i) develop the necessary and robust regulatory framework for environmental management in the Oil and Gas sector, (ii) develop a National Oil Spill Contingency Plan (NOSCP) for Uganda, (iii) undertake a Strategic Environmental Assessment for the Albertine Graben, (iv) create an Environmental Impact Assessment and Information management database in NEMA, and (v) implement the Albertine Graben Environment Monitoring Plan (AGEMP) that was developed in 2013.
The following are the achievements from SMOG:
x Review of the National Environment Act is in advanced stages of completion.
x Several regulations (waste management, noise & vibrations, Environmental Impact Assessment and Environmental Audit) are under review.
x New Regulations (petroleum waste, oil spills, and air quality) are being developed.
x The Strategic Environmental Assessment (SEA) for the Albertine Graben has been completed, presented to Cabinet and subsequently approved.
x Baseline data collection for the implementation of the environmental monitoring plan of the Albertine Graben has been initiated.
x Well aware that oil spills can at times inevitably occur where there is petroleum production and processing, two important studies have been completed: the Environmental Risk Assessment and Contingency Analysis. The next step will be the completion of the National Oil Spill Contingency Plan (NOSCP), which will clearly guide and provide for systematic management of any spill from the oil and gas production.
(c) The Stockholm Convention on Persistent Organic Pollutants (POPs)
The Stockholm Convention on POPs77 is a global treaty adopted on 22 May 2001 and it entered into force on 17 May 2004. Uganda acceded to the Stockholm Convention on 20 July 2004.
Through a five-year regional project (2011-2016) ‘Capacity Strengthening and Technical Assistance for the Implementation of Stockholm Convention National Implementation Plans (NIPs) in African Least Developed Countries (LDCs)’, NEMA successfully implemented the following tasks: (i) the revision of National Environment Act to incorporate POPs and other chemical management aspects; (ii) the preparation of draft sound chemical management regulations; (iii) awareness raising of POPs and other chemical-related multilateral environmental agreements among district level staff; and (iv) commence the establishment of a national network for chemical information exchange.
9.4.3 Status and Trends of Key Indicators
Platinum indicator No 6: environmental compliance
The platinum indicator for environmental compliance is defined as “% developers complying with certificate of approval conditions”. An average of 66% of the inspected approved development projects is compliant with the EIA approved conditions. It should be noted that only about 30% of the
77 The Stockholm Convention on POPs seeks to protect human health and the environment from chemicals that remain intact in the environment for long periods, become widely distributed geographically and bio-accumulate in the fatty tissue of humans and wildlife. These chemicals include: Agricultural Pesticides, Industrial Chemicals and some are unintentionally produced by anthropogenic processes.

Uganda Water and Environment Sector Performance Report 2015
147
inspected approved development projects in or around wetlands is compliant with the EIA approved conditions.
Platinum indicator No. 7: solid waste disposal
The platinum indicator for solid waste disposal is defined as “% solid waste disposed of safely in the 9 municipalities”. An average of 60% of solid waste is collected and safely disposed of in the twelve CDM project-supported Municipalities (55-60% across the municipalities).
Trends in the Review and Approval of Environment Impact Assessments
Figure 9.5 shows the trends of EIA reports submitted to NEMA by developers during the period FY 2010/11 – 2014/15. A total of 2,087 projects were approved by NEMA over the FY 2010/11 – 2014/15 out of the total of 3,533 EIA reports submitted by developers to NEMA for consideration.
Figure 9.5 Trends in Number of Proposed and Approved Projects
The 2014/15 work plan indicates that a target of 512 EIAs reviews was set to be achieved during this period; however, a total of 591 EIAs were reviewed – a 115% achievement. The figure shows that implementation of the Act and the EIA Regulations has culminated into increased awareness among the regulated communities/entities, and increased submission of proposed projects to NEMA for approval.
The categories of projects that dominated the approvals are (in descending order): information communications technology (ICT), infrastructure (roads, housing, commercial facilities), processing / manufacturing industries, fuel stations including fuel depots, and minerals (explorations /mining /quarries / oil and gas), respectively. These five categories of projects account for 86.8% of total approvals realised during the FY 2010/11 – 2014/15.
Overall, there has been a relatively steady increase in number of projects approved by NEMA, from 76 in FY to the current 591; this has put an increasing stress on the few personnel available to review the EIAs.
9.4.4 Challenges and recommendations
The main challenges affecting performance of environmental management by NEMA are listed in Table 9.2. Planned mitigation actions, and actions being implemented to that, are mentioned for each of the challenges identified.
622572
633
832874
405 373
281
437
591
0
100
200
300
400
500
600
700
800
900
2010/11 2011/12 2012/13 2013/14 2014/15EIA Reports Submitted Projects Approved

Uganda Water and Environment Sector Performance Report 2015
148
Table 9.3 Challenges and recommendations affecting environmental management by NEMA Performance Issue Planned mitigation
actions Progress on actions Remarks
The emerging development challenges and the related environmental issues/challenges
Review of the National Environment Management Policy and the National Environment Act with the related the Regulations
Draft policy document produced; policy implementation strategy, monitoring and evaluation framework are being developed. Draft NEA Bill produced and is being reviewed; and The key Regulations such as on EIA, Audits, air quality, chemicals management, noise, waste management, oil spills, effluent have been reviewed/developed
The new policy and legislation will enhance effective environment management through sector integration, institutional re-engineering and more effective legal mechanisms in environmental compliance and enforcement.
Weak enforcement of environmental legislation
Building the capacity of all Lead Agencies (MDAs) Multi-pronged approaches and mechanisms
Policy, legal and institutional frameworks are being reviewed Multi-disciplinary, multi-media and multi-sectoral approaches and mechanisms have been successful in areas of oil and gas and infrastructure development projects
The conflicting roles and duplications within some institutions have adverse impacts on the coordination of environmental compliance and enforcement activities.
Inadequate support to local governments
Continue lobbying for ENR conditional grants and increased local government allocations to the entire ENR sector Develop a fundable proposal for an integrated ENR Management Program for both sectors and local governments.
Lobbying for increased funding for LGs for ENR management has continued and some District Local Governments that are implementing programmes such as PRDP, NUSAFII, and CAIIP have increased funding for ENR. There is an undertaking to develop an integrated program for ENR management.
There is an urgent need for an integrated program for ENR management.

Uganda Water and Environment Sector Performance Report 2015
149
9.5 Meteorology (Weather and Climate)
9.5.1 Introduction
Uganda National Meteorological Authority (UNMA) is now a semi-autonomous government authority under Ministry of Water and Environment for weather and climate services (UNMA Act. 2012), and a focal institution to Inter-Governmental Panel on Climate Change (IPCC), an international body mandated to carry out scientific research on climate change.
The operationalisation of Uganda National Meteorological Authority (UNMA) Act, 2012 is on-going. The Board of Directors were inaugurated during the period under review and recruitment of top management as well as all auxiliary staff was done. UNMA is operating through a subvention for the FY 2015/16, and its Acting Executive Director has been appointed by Permanent Secretary as a Sub-Accounting Officer.
9.5.2 Activities during the FY 2014/15
The following activities were implemented during the period under review:
x Preparation of seasonal forecasts: This was done with continuous support from IGAD climate prediction and applications centre (ICPAC) in Nairobi-Kenya. UNMA translated this quarterly/seasonal report into 22 different local languages so that is can be understood in most parts of the country. Dissemination of information was done through the newspapers, local FM radio stations as well as through as government and non-government agencies.
x Establishment of Electronic Data Archives: The climate data laboratory was established to facilitate electronic digitisation of weather data. This has enabled provision of electronic ready-to-use data sets for numerical weather prediction and seasonal climate outlooks.
x Aeronautical meteorological services for aviation: The Authority provided specialised aeronautical meteorological services for aviation in the country. At least 13,400 International Route Forecasts were prepared and issued as well as 1,456 Terminal Aerodrome Forecasts (TAFs) for Entebbe International Airport (EIA). The increased numbers of aviation reports prepared is caused by an increased volume of unscheduled flights in and out of Entebbe International Airport. Due to increased volume of flight operations at Soroti Aerodrome, UNMA has, in addition to providing the routine aviation reports, commenced issuing of Terminal Aerodrome Forecasts for Soroti.
x Specialised weather advisories: UNMA issued specialised advisories to 15,000 registered farmers in Kasese, through mobile phones. The main products sent to the famers include among others, the daily forecasts, dekadal (10-day) forecasts, monthly updates and seasonal forecasts.
x Modernisation Plan: The phased implementation of the modernisation plan for Uganda’s meteorological services and its subsidiary 15-year development plan is on-going. UNMA last year secured services of an Organisational Development Expert (Technical Advisor) and the expert will commence work starting FY 2015/16. Services of the Technical Advisor are strategic for the overall implementation of the UNMA modernisation plan.
x Inspection and maintenance of stations: 10 Synoptic stations, 10 Agro-meteorological stations and 4 Hydro-meteorological stations were serviced and 20 Rainfall stations were newly installed. Rehabilitation of Mbarara station office block was completed, and five (5) new Automatic Weather stations were installed in Kitgum, Agago, Lira, Otuke and Amuru Districts. An Automatic Weather station was installed at the stations of Kasese, Gulu and Arua to cater of airport operations.

Uganda Water and Environment Sector Performance Report 2015
150
Figure 9.6 Newly installed weather station in Namukora-Kitgum
x The Quality Management System: The implementation of a Quality Management System (QMS) for Aeronautical Meteorology and the process of obtaining ISO9001:2008 certification is continuing. At least two more audits of Meteorological services were conducted; one by Civil Aviation Authority-Uganda (CAA) and the other by International Civil Aviation Organisation (ICAO). The Authority is currently working to fix the non-conformities identified in the two audits as we prepare for the final external Audit and subsequently, ISO 9001: 2008 Certification.
x Expansion of Monitoring Network: Installation of 50 community rain gauge stations was also carried especially in Western and northern parts of the country with the view of involving the community in appreciating the weather and climate services provided by UNMA.
Figure 9.7 Community leaders trained on installation and reading of rainfall data in Nebbi
A total of 23 Automatic weather stations (AWS) have been installed in the Kyoga Basin. Automation of UNM’s rainfall observation network is in line with the current National Development Plan’s (NDP II) recommendation of overhauling and automating the weather observing system in the country. The Upper Air Sounding Station in Entebbe has been rehabilitated and reactivated with support from the UNDP/GEF Strengthening Climate Information and Early Warning Systems (SCIEWS) project.
x Popularising Meteorology in Schools: The Directorate of Training and Research (DRT) developed simplified educational manuals on weather, climate and climate change that are suitable for use in schools. The DTR carried out popularisation programs in 4 secondary schools in western Uganda and 5 schools in Eastern Uganda.
x Low Level Wind shear Observation Station (LLWOS): Procurement of the LLWOS was completed and equipment delivered to our stores in Entebbe. Currently civil works for constructing the bases for mounting the equipment is 75% complete.

Uganda Water and Environment Sector Performance Report 2015
151
9.5.3 Key Projects
The Uganda National Meteorological Authority continues to advocate for the application of weather and climate information and its integration into national planning activities. Below are highlights of specific projects implemented during the period under review:
x Mobile Weather Alert (MWA): Under this initiative, severe weather alerts tailored for fishermen and users of Lake Victoria are issued to registered fishermen using mobile phone SMS service. This initiative was designed to reduce on accidents resulting from severe storms over the lake and this is envisaged to save lives lost due to bad weather on the lake. Under this initiative UNMA obtained two mobile weather observation equipment to be installed on vessels plying Port Bell / Kalangala route to improve weather monitoring over Lake Victoria. It is expected that with the improved monitoring of weather conditions, UNMA’s forecasting capability of severe storms over the Lake will be enhanced.
x The automated weather stations network established in the Karamoja and Teso regions to monitor the weather in this semi-arid region continued to operate. The data generated by these stations is being utilised to improve on planning and mitigation of frequent droughts and floods in the region. This network was expanded to other regions especially the cattle corridor districts of Rakai, Sembabule, Nakasongola, Luweero and Kiboga.
x UNMA has developed a communication strategy to improve the institutional efforts of systematically dissemination weather and climate information to stakeholders in near real-time. In addition, a website for UNMA has been developed and users can access all products and information from this site. Daily TV weather broadcasts are accessible through the website.
x Weather studio: The weather studio at the National Meteorological Centre in Entebbe was upgraded with modern equipment and software for graphics editing and recording. Daily weather forecasts on TV were revived.
x Training: Several officers attained higher qualifications mainly in the field of Applied Meteorology78.
9.5.4 Challenges and Recommendations
The National Meteorological Authority (UNMA) is being established and requires support from government and development partners in order to fulfil its mandate. UNMA still has a number of challenges which include the following;
(i) Inadequate Network: Outdated observation instruments and inadequate coverage of the observation network. Most of the important weather equipment is either grounded or not available. Since the purchase of weather equipment, for example the Weather Radar, is expensive separate funding needs to be identified to acquire such equipment
(ii) Breakdown of Equipment: The field weather observing station network has continued to seriously deteriorate due to frequent breakdown of equipment without replacement, hampering accurate monitoring of weather and climate. However, some automatic weather stations were received from German International Cooperation (GIZ) and Under GEF/UNDP funding. These are now being installed to monitor weather along Lake Kyoga and Lake Victoria basins. Additional funds need to be provided so as to overhaul and automate the weather observing system in line with the current National Development Plan (NDP) recommendations.
78 One officer attained a Doctorate in Climate Modelling at Nanjing University in China, two Officers attained Masters of Science in Climate Change and Applied Meteorology from University of Nairobi and Reading University (UK) respectively; and five Officers attained Bachelor of Science in Meteorology from Makerere University.

Uganda Water and Environment Sector Performance Report 2015
152
Vandalism of Installations; Copper Rain gauges are vandalised for making bangles in some regions of the country especially Karamoja. With changes in technology leading to installation of solar powered automatic weather stations, vandalism and theft of the solar power system is common and UNMA is forced to incur additional costs of burglar proofing the solar panels. See photo on the right.
Figure 9.8 Caging of Solar Panels to prevent Vandalism
Competing National Priorities; Key stake holders in Government are unaware of the Significance of Meteorological Service to development until they are faced with related hazards (Drought, Floods and landslides etc.). Ironically, adverse weather is always cited as one of the major causes of poor budgetary performance, however, inadequate resources are allocated to the weather and climate sub-sector.
Climate Change Challenge: Climate change is affecting spatial variability of rainfall which disrupts community adaptation to the changes.
Vacant posts in the UNMA structure are affecting the full implementation of the UNMA functions.

Uganda Water and Environment Sector Performance Report 2015
153
10 CLIMATE CHANGE
10.1 Institutional Framework
During the previous reporting period (FY 2013/14), The Climate Change Unit was upgraded to a Department (CCD) under the Office of the Permanent Secretary, Ministry of Water and Environment. The Department is mandated with the coordination of the implementation of the United Nations Framework Convention on Climate Change (UNFCCC), and it’s Kyoto Protocol (KP). In order to achieve the above mandate, three thematic areas have been highlighted under the CCD 5 year strategic planning matrix as follows:
x Develop institutional capacities for climate change management in Uganda x Establish the knowledge base for climate change mitigation and adaptation x Operationalize the Climate Change Policy.
Performance is reported per thematic are in the following sections.
10.2 Achievements in FY 2014/15
10.2.1 Develop Institutional Capacities for Climate Change Management in Uganda
Construction of the Climate Change Resource Centre and Offices
The National Climate Change Resource Centre and CCD office, constructed under the Global Climate Change Alliance (GCCA): Agriculture Adaptation to Climate Change, was finalised and handed over to the MWE in January 2015.
Development of the Performance Measurement Framework
The draft national overall Performance Measurement Framework (PMF) was developed in consultation with the sector stakeholders. The overall objective of the PMF is to measure and track the progress of the implementation of the National Climate Change Policy (NCCP) across sectors.
Table 10.1 Physical Performance/Achievements (As per JWESSP and 5-year Work Plan) 5yrs outcome Indicator
description Target for the year Achieved
yr to date Ultimate target
1.1 CCU is effectively assuming its institutional role
Uganda maintain high level of representation at international level
1.COP 20 follow-up actions implemented (YES) 2. Intercessional meetings COP 21 preparatory, attended (YES)
100% 30%
100% 100%
1.2 Capacity of relevant partner organisations is increased to enable achievement of the outcomes of the national climate change policy
ALL sectors have mainstreamed Climate Change into Work Plans and budgets
CC Mainstream guidelines (1 document) finalised and disseminated to relevant stakeholders at central and district level
100% 100%
10.2.2 Establish the Knowledge Base for Climate Change Mitigation and Adaptation in Collaboration with Makerere University Climate Change Research Institute (MUCCRI)
The CCD, in collaboration with MUCCRI initiated the process of establishing the National Climate Change Knowledge Management Information System (KMS). A prototype for the KMS has been developed and the pretesting period has commenced.

Uganda Water and Environment Sector Performance Report 2015
154
Establishment of the Green House Gases (GHG) Inventory Office
The GHG inventory office has been established. The office will collect data on sector emissions to support the preparation of National Communications in respect to emission factors for Uganda in order to regularly fulfil the Uganda’s obligations to the UNFCCC and IPCC.
Climate Change Atlas Landscape
The CCD has developed the third version of the National Climate Change Atlas Actors Landscape, which is robust and easy to update. The Atlas Actors Landscape maps out all the key stakeholders in the CC arena in Uganda to facilitate information sharing such as CC interventions, avoidance of duplication of activities and financing.
10.2.3 Operationalize the Climate Change Policy
The National Climate Change Policy (NCCP) and its costed implementation strategy was approved by the cabinet on 1st of April, 2015. As a way forward to operationalize the policy, the CCD will embark on the process of awareness creation amongst the stakeholders at both national and regional levels through:
x Translation of the NCCP into the major languages in the country x Preparation of the Popular version of the of the NCCP for dissemination to stakeholders x Packaging of awareness materials and messages for dissemination to the stakeholders x Capacity building of the CC desk officers on their sector specific policy responses x Identify sector specific policy extracts for printing and dissemination x Upscale the dissemination of the Climate Change mainstreaming guidelines to inform sectors
to integrate CC policy responses into their sector plans and budgets
10.3 Contributions and Achievements by Specific Projects
10.3.1 The GCCA Project
The purpose of the four-year Global Climate Change Alliance (GCCA) project is to strengthen the resilience of rural populations and agricultural production systems in the central part of the Cattle Corridor, and build capacities of communities, commercial farmers and the Government of Uganda to cope with climate change. The project aims to achieve the following results: (i) Knowledge and capacities for climate change adaptation strengthened; (ii) Better access of livestock and crops to water through water for production investments; and (iii) Resilience of agricultural production systems improved. The project interventions are implemented at national and sub-national levels, covering six districts of the Central Cattle Corridor. The CCD carried out result area 1 (Knowledge and capacities for climate change adaptation strengthened in 10 cattle corridor districts) successfully, and the project is the process of being renewed.
10.3.2 The Low Emission Capacity Building (LECB) Project for Uganda
The Project is focusing on strengthening Uganda’s technical and institutional capacity in the development of Green House Gas (GHG) inventory systems and Nationally Appropriate Mitigation Actions (NAMAs) with in-built Measuring, Reporting and verification (MRV) systems.
The project began the institutionalisation of the inventory system in May 2014 by sensitizing the Climate Change Desk Officers in the different government institutions. The project has developed eight priority NAMAs for four sectors, as listed in Table 10.2.

Uganda Water and Environment Sector Performance Report 2015
155
Table 10.2 The prioritised NAMAs in the four sectors
Sector Nationally Appropriate Mitigation Actions
Agriculture Sector Promotion of Upland Rice;
Livestock Mitigation;
Energy Sector Implement institutional stoves in Educational Institutions;
Improve Vehicle Fuel Efficiency
Transport Sector Ensure Bus Rapid Transit for Kampala
Enforce periodic vehicle inspection for emissions and roadworthiness
Waste Sector Implement Municipal Solid Waste Composting for Smaller Urban Areas
Integrated Waste Water treatment
The first step towards a national Measuring, Reporting and verification (MRV) strategy was taken during the first MRV workshop where the participants were trained in: MRV of Emissions, MRV of NAMAs, MRV of co-benefits, and Integration of MRV settings into a robust national MRV System
10.3.3 CDM Capacity Development Project
The project has implemented the following activities to support Clean Development Mechanism (CDM) development in Uganda: (a) completed an assessment of the potential for CDM project development in Uganda; (b) trained Ugandans in CDM project development; (c) provided financial support (including, identification of potential projects and CDM financing sources) to projects; (d) provided Emission Reduction Purchase Agreement (ERPA) negotiation support; (e) built capacity of the Ugandan CDM Designated National Authority (DNA), including uploading the DNA website with CDM information, information on DNA procedures and other climate change mitigation/adaptation-related information; (f) developed two standardised baselines to help further reduce the transaction costs of CDM project development; and (f) completed updating of the national Grid Emission Factor (GEF) and the development of user-friendly GEF tools.
This project will come to a conclusion in December 2015.
10.3.4 Effective Participation of Uganda in the COPs
The 20th Session of the Conference of Parties to the United Nations Framework Convention on Climate Change (COP20) and the 10th Session of the Conference of Parties Serving as the Meeting of Parties (CMP) to the Kyoto Protocol was held in Lima-Peru, from 1st – 12th, December 2014.
COP20 was particularly significant as it laid a strong foundation for the forth-coming UN Climate Conference in Paris, France (COP21), where world leaders are expected to conclude and adopt a new legally binding climate change agreement applicable to all countries. Certain outcomes in Lima were necessary to ensure readiness of the member governments to conclude a new deal. To this end, there were a number of events held in the run up to COP20, including high-level ministerial meetings held in June 2015 in Bonn, and the UN Secretary General's Climate Leaders' Summit in New York in September 2014.
10.3.5 Nationally Appropriate Mitigation Actions (NAMAs)
Nationally Appropriate Mitigation Actions have been prepared for Agriculture, Forestry and Land use (AFOLU) sectors for submission to the United Nations Framework Convention on Climate Change (UNFCCC). These NAMAs are voluntary engagement proposals showing the Government‘s prioritised actions aimed at reducing or limiting greenhouse gas (GHG) emissions. The Agriculture, Forestry and Land use NAMAs for Uganda are targeting agriculture and forestry, and address the challenges of implementing sustainable development strategies.

Uganda Water and Environment Sector Performance Report 2015
156
10.3.6 Second National Communication
The Second National Communication (SNC) was finalised and the document was submitted to UNEP and UNFCCC, and disseminated to various stakeholders. This document is a requirement for all UNFCCC member countries, and communicates the actions and status of climate change with possible impact emission projects.
10.3.7 Intended Nationally Determined Contributions (INDC)
The main objective of the United Nations Framework Convention on Climate Change (UNFCCC) is to stabilise atmospheric concentrations of greenhouse gases. By signing and ratifying the Convention the country commits to undertake and implement decisions to fulfil its obligations under the Convention.
Development of Intended Nationally Development Contributions INDC’s is in response to COP decisions inviting parties to intensify domestic preparations to submit their contributions. Under this new system, parties submit their individual plans for reducing emissions at the same time as collectively agreeing to limit temperature rise to below two degrees. Hence by embarking on developing its INDC, Uganda is committing to emission reductions at national level.
A highly consultative process was undertaken to develop the initial draft INDC to be submitted to the UNFCCC by end of August 2015.
Two parallel processes have been undertaken to facilitate this process: The process of developing the initial draft INDC was widely consultative and the roadmap involved engagements with Permanent Secretaries in their weekly forum, Water and Environment Sector Working Group (WESWG), Climate Change Desk officers, 5 Regional consultations of various technical officers from local governments and members of civil society and the media.
The various stakeholder consultations provided a platform for mobilisation a variety of stakeholders around the INDC process, so that the final document is built on solid ground taking into consideration a variety of views and its scope is well understood locally and nationally. In addition, a presentation, discussion and analysis of priority key sectors and actions for Uganda’s INDC was held.
The process has resulted in the development of a fair and ambitious contribution, with the cumulative impact of policies and measures ultimately resulting into approximately 22% reduction in national GHG emissions by 2030. The final report is to be submitted to the United Nations Framework Convention on Climate Change in fulfilment of Uganda’s reporting requirements to the Convention.
10.3.8 Economic assessment of the impacts of climate change in Uganda
The Economic Assessment of the Impacts of Climate Change in Uganda, which provides information about the current “adaptation deficit” in Uganda and the negative consequences that climate variability has on the Ugandan economy was conducted by the Climate and Development Knowledge Network (CDKN). The study was conducted from December 2013 – June 2015, and the final report presented to the stakeholders on 18 June 2015.
Five sectors (agriculture and livestock, energy, water and transport infrastructure) were analysed at the national level, and five case studies were conducted at the local level, in different regions of Uganda: Kampala (focusing on infrastructure), Kabale and Tororo (health/malaria), Karamoja (agriculture and livestock), Mount Elgon (coffee), and Mpanga river catchment (water and electricity). The assessment was carried out under two of the latest Representative Concentration Pathways (RCPs) developed as part of the Fifth Assessment Report (AR5) under the Intergovernmental Panel on Climate Change (IPCC).
The assessment concludes that there is indeed a link between the impacts of climate change and future growth prospects in the country. In the absence of adaptation actions, climate factors could compromise the Uganda Vision2040 targets. Climate change is predicted to have a significant impact

Uganda Water and Environment Sector Performance Report 2015
157
on Uganda. The cost of inaction under climate variability and change for agriculture, water, total infrastructure, and energy is estimated at between $270 and $332 billion for these sectors over the 40-year period 2010−2050.
Policy Recommendations Priorities for immediate action include:
x Prioritize the National Climate Change Policy (NCCP)’s Costed Implementation Strategy as a matter of urgency.
x Mainstream climate change into sector development plans, including inclusion of key priorities in sector annual plans and budgets.
x Mainstream adaptation priorities into the District Development Plans that will rise out of the National Development Plan II.
x Ensure that implementation of all action is monitored and enforced.
10.4 Contribution by Cross-Sectoral Projects
The Ministry of Agriculture, Animal husbandry and Fisheries (MAAIF) is in the final stages of mainstreaming climate change into its sector plans, budgets and activities, well as the Ministry of Energy and mineral Development is in its initial stages of mainstreaming climate change.
Working with partners, the Department is supporting the development of national climate change indicators for use in the Output Budgeting Tool (OBT) of Ministry of Finance, Planning and Economic Development and to put in the Ministry of Local Government Assessment Tool. This will enable sectors and institution’s mainstreaming of climate change with proper measurable indicators.
10.5 Lessons Learned and Recommendations
The operationalisation of the Department is still on-going, but it is expected to be completed during the FY 15/16. When fully operational the Department will offer suitable/appropriate staffing level.

Uganda Water and Environment Sector Performance Report 2015
158
11 CROSS-CUTTING ISSUES Cross-cutting issues are issues that touch on general principles such as human rights (for water and sanitation), gender equality and mainstreaming, environment sustainability, HIV/AIDS, inclusion of the disabled and children rights. During this financial year, a number of activities of cross-cutting nature were implemented as indicated in the following paragraphs.
11.1 Gender Mainstreaming
In a bid to integrate gender in water and environment activities, MWE developed a water and sanitation gender strategy (2010) and an environment gender strategy in 2015. The aforementioned strategy documents provide guidelines for mainstreaming gender in the sector. The gender mainstreaming activities implemented in FY 2014/15 are summarised in the following sections.
11.1.1 Capacity Building Initiatives
MWE has continuously built the capacity of sector stakeholders in gender mainstreaming to ensure that gender concerns in the sector are addressed in budgeting, planning, implementation and monitoring of water and environment activities. During the financial year, 245 sector stakeholders benefited from gender training sessions conducted with technical support from Ministry of Gender, Labour and Social Development (MoGLSD) and Ministry of Finance, Planning and Economic Development (MoFPED). In Table Table 11.1 the training conducted for sector stakeholders is shown.
Table 11.1 Achievements in capacity building on gender mainstreaming Category of Sector
Staff Trained Areas of Gender Training Staff Trained Facilitating
Institutions 1. Local Government
staff including District Water Officers, Community Development Officers and District Health Inspectors
Key concepts in gender mainstreaming, Gender in the International and National legal framework, key gender issues in water and sanitation, gender and equity budgeting and strategies for gender mainstreaming in the water and sanitation sector
81 staff from 2779 districts
MWE and MOGLSD
2. ENR staff including District Environment Officers, Community Development Officers and District Natural Resources officers.
Key concepts in gender mainstreaming, gender in the international and national legal frameworks, key gender issues in environment, gender and equity budgeting and development of gender strategies for input into the draft ENR gender strategy.
88 staff from 3480 districts
MWE and MoGLSD
3. DWRM staff including center staff and Water Management Zones staff.
Key concepts in gender and Integrated Water Resource Management (IWRM) in the legal framework, gender and equity budgeting, and strategies for mainstreaming gender in IWRM.
36 staff from all the Water Management Zones
MWE and MoGLSD
4. Budgeting Officers/ Economists from all the MWE departments.
Legal framework for gender and equity, identifying and prioritizing gender and equity issues, integrating gender and equity issues in a budget framework paper, gender and equity- responsive reporting.
40 staff from all the MWE departments
MWE, MoFPED and MoGLSD
79 Butaleja, Pallisa, Budaka, Kamuli, Busia, Manafwa, Tororo, Bulambuli, Bukwo, Mbale, Sironko, Kapchorwa, Abim, Amudat, Amuria, Bukedea, Kaabong, Kaberamaido, Katakwi, Kotido, Kumi, Moroto, Nakapiripirit, Napak, Ngora, Serere and Soroti. 80 Bududa, Budaka, Bugiri, Bukwo, Bulambuli, Busia, Butaleja, Buyende, Iganga, Jinja, Kaliro, Kamuli, Kapchorwa, Kibuku, Kween, Luuka, Manafwa, Mayuge, Mbale, Namayingo, Namutumba, Pallisa, Sironko, Tororo, Masaka, Lwengo, Rakai, Sembabule, Gomba, Butambala, Lyantonde, Kalangala, Bukomansimbi, and Kalungu.

Uganda Water and Environment Sector Performance Report 2015
159
11.1.2 Gender Mainstreaming in Plans and Budgets
The Public Finance Management Act (2015) calls for consideration of gender and equity issues while planning and budgeting for the sector. The sector has taken deliberate efforts aimed at ensuring that the sector Budget Framework Paper (BFP) for FY 2016/17 complies with the aforementioned requirement, more specifically that the unserved districts and sub-counties are allocated more financial resources as a way of reducing inequity in access to services.
11.1.3 Gender Staffing
The distribution of gender in the staffing at MWE is provided in (source: MWE’s human resource unit) indicates that the Ministry has 336 established staff, a significant reduction from 459 staff reported last year. The reduction in number of staff is largely attributed to the concluded restructuring process that resulted into having the meteorology department become a semi-autonomous agency. A gender analysis of the staffing structure is provided in Table 11.2.
Table 11.2 Gender distribution at MWE for the different staffing levels in FY 2014/15 Staff level Female Male No. % No. % Total No. Top Management 5 16% 27 84% 32 Middle Management 21 22% 74 78% 95 Operational staff 47 44% 61 56% 108 Support staff 39 39% 62 61% 101 Total 112 224 336
11.1.4 Gender Mainstreaming in the Private Sector
Data from the district annual software reports indicates that local governments have continuously trained hand pump mechanics (HPMs) to support the operation and maintenance of water and sanitation facilities in rural areas. Out of the 158 trained HPMs, from 10 districts81, only 8% were women, a considerable reduction from the 10% reported in financial year 2013/14. The districts that had women trained as HPMs include Rubirizi (6), Tororo (4) Mityana (1), and Gulu (1).
Within the urban water and sanitation sub-sector, 50 masons in 9 towns82 were trained TO construct Ecosan toilets. A gender analysis of the masons trained indicates that only 4% of the trained masons were women. The towns where women were trained include Bugoingo (1) and Ssunga (1).
11.1.5 Challenges and Recommendations
Gender mainstreaming efforts are hampered by a number of factors including the following among others:
x Cultural prejudices that hinder/limit the participation of women in the development and management of water and environment resources.
x Inadequate funding for gender skills enhancement and livelihood improvement activities. x Low appreciation of gender mainstreaming by some of the sector stakeholders.
81 Gulu, Bukwo, Kamuli, Mbale, Tororo, Masindi, Rakai, Rubirizi, Mityana, Kumi
82 Bugoingo, Walukuba, Butiaba, Ssunga, Nyeihanga, Rwenkobwa, Gasiiza, Kinoni-Kirihura.

Uganda Water and Environment Sector Performance Report 2015
160
11.1.6 Recommendations to Upscale Gender Mainstreaming
The sector will continuously strive to build capacity of staff more especially in gender and equity budgeting, in order to ensure efficient and effective allocation of resources in the sector.
Communities will be continuously sensitised on the importance of involving women in the planning and management of water and natural resources for sustainable use.
The sector will put in place affirmative action measures to ensure that women are deliberately targeted for skills enhancement, as this will translate into sustainable management of water and environment resources.
11.2 Support Disadvantaged and Vulnerable Groups
11.2.1 Key Activities to Support the Poor in Towns
(a) Sanitation facilities for the Urban Poor
In a bid to promote sanitation in towns, public sanitation facilities have been constructed in 12 towns83. The sanitation facilities are located in highly populated areas like markets in order to enhance access to sanitation of the poorest members of the community. The new facilities have separate stances for men and women with 5 towns84 allocating more stances for women. All the public sanitation facilities constructed have access ramps for wheel chairs and wide doors to ease entry for the disabled.
(b) Sanitation facilities for poor households in towns
Water and Sanitation Development Facilities (WSDFs) constructed 128 sanitation facilities for the poorest members of the community in 18 towns85. The poorest members of the community targeted include child-headed and women-headed households, the disabled, widows, and the elderly. The constructed sanitation facilities also act as demonstration facilities. It is envisaged that other households within the community will take on the demonstrated technology.
(c) Sanitation facilities for school Children
Improved sanitation contributes to high attendance rates in schools and more especially for the girl- child. In a bid to enhance sanitation in schools, the sector constructed 24 sanitation facilities in 14 towns86. Stances were separated for boys and girls, and for the case of 9 towns in WSDF Central, more stances were constructed for girls. For the 10 facilities constructed in WSDF- North, access ramps for the disabled were included.
(d) Water Kiosks for the Poor
MWE’s Pro-Poor Policy (2006) calls for establishment of kiosks or public taps for urban poor who do not afford ordinary house/ yard connections and can only access water through public water kiosks. During the reporting period, 136 new kiosks were established in 22 towns87. The reason for
83 Rwenkoba, Kinoni, Ovujo, Purongo, Ibujo, Opit, Patongo, Najjembe, Walukuba, Butiaba, Kiganda and Kyamulibwa
84 Najjembe, Walukuba, Butiaba, Kiganda and Kyamulibwa
85 Gombe, Kiganda, Kyamulibwa, Ssunga, Butiaba, Walukuba, Kinogozi, Najjembe, Kakumiro, Patongo, Opit, Ibuje, Purongo, Gombe, Ovujo, Gasiiza, Nyeihanga, Kinoni and Rwenkobwa.
86 Gombe, Kinogozi, Ssunga, Butiaba, Walukuba, Kiganda, Kyamulibwa, Kakumiro, Najjembe, Patongo, Opit, Ibuje, Purongo, Ovujo.
87 Purongo, Opat, Patongo, Ovujo, Ibuje, Kinigozi, Najjembe, Kyamulibwa, Kakumiro, Buliisa, Bukomansimbi, Kabango- Budongo, Kiganda, Rwenkobwa, Kinoni- Kirihura, Nyeihanga, Ntusi, Kasensero, Muhanga, Nyarubongo, Bugongim, Gasiiza- Kisoro

Uganda Water and Environment Sector Performance Report 2015
161
establishing public water points is to ensure that the poor do not pay more for water than other better served.
11.2.2 District Programmes to Support Women and Vulnerable Groups
A review of district reports indicates efforts by districts to undertake gender and equity considerations through provision of support to women and vulnerable groups as indicated in Table 11.1. Table 11.3 Activities to support women and vulnerable groups
No. District Vulnerable group supported
Nature of support No. Supported Location
1 Koboko Women groups
Provided professional fee for training women drama groups, and providing drama materials.
7 women groups (105 women)
Sub-Counties of Ludara and Kuluba
2 Manafwa Buyina P/S and Bukikayi P/S
Connection of tap stands 1200, 1500 respectively
Sub-Counties of Bunabwana and Mubutu
3 Kanungu Batwa community
Provision of water jars 13 households Batwa community
4 Sheema Children in schools
construction of a shallow well 323 Pupils Katojo Primary School
5 Mbarara Women groups
Rainwater Harvesting tanks 8 women groups
in Sub-Counties of Ndiza, Kagongi and Mwiza
Kayakatara P/S
1 rain water harvesting tank 250 pupils Ruhindi Sub-County
People with disabilities
Rainwater harvesting tanks 7 people with disabilities
Nyamiro Parish, Ruhindi Sub-County
Elderly Rainwater harvesting tanks 3 elderly groups, each has 17 beneficiaries
Bukiro Sub-County
6 Nakapiripi-rit
Children in primary schools
Rehabilitation of a deep borehole
Lokale Primary School
11.3 HIV/AIDS mainstreaming
MWE developed an HIV/AIDS strategy in 2005 to guide HIV/AIDS mainstreaming efforts in the sector. During FY 2014/15 a number of HIV/AIDS mainstreaming interventions have been implemented, summarised in the following sections.
11.3.1 HIV/AIDS Mainstreaming
During this reporting period, HIV/AIDS workshops were conducted to build the capacity of sector staff to mainstream HIV/AIDS activities and budgets in their programmes, and equip them with HIV/AIDS prevention skills. A total of 180 staff benefited from the training including 149 District Water Office staff and 31 MWE head-quarters staff.
MWE collaborated with AIDS Information Centre [AIC] to conduct HIV/AIDS counselling, testing and safe male circumcision sessions. The counselling and testing covered 150 MWE staff, while 20 male staff were circumcised. To increase knowledge and awareness on HIV/AIDS in the Sector, a total of 2,000 posters and 4,000 stickers were produced and printed. The materials were launched in June

Uganda Water and Environment Sector Performance Report 2015
162
2015 and are ready for dissemination. In addition to the IEC materials 4000 condoms were distributed in MWE wash rooms and during HIV/AIDS counselling and testing sessions.
11.3.2 HIV/AIDS Mainstreaming Initiatives by Local Government
A review of 99 district annual reports revealed that 51% of the districts (50) undertook HIV/AIDS mainstreaming activities. HIV/AIDS sensitisation was undertaken by 51% of the districts and condoms were distributed by 25% of the districts. In line with the HIV/AIDS strategy, 24 districts partnered with established service providers for purposes of getting support in HIV/AIDS related service. Table 11.4 shows the organisations and the nature of support provided to the districts.
Table 11.4 HIV service providers and support offered to districts No District Organisation Nature Of Support 1 Gulu United Nations
International Children’s Emergency Fund
Capacity building of District staff in HIV/AIDS mainstreaming
2 Bugiri Society to Uplift Rural Economy (SURE), European Commission(EC), MUCCBADI
Capacity building of District staff in HIV/AIDS mainstreaming
3 Bulambuli District Health Office (DHO) Sensitisation of staff and communities on HIV/AIDS 4 Kamuli DHO Sensitisation, condom distribution 5 Kapchorwa The AIDS Support
Organisation (TASO), Programme for Accessible health, Communication and Education CE, KIPCHOMBE
Health education trough drama shows and provision of IEC materials on HIV/AIDS
6 Mbale Namayingo Women's Group
Sensitisation and capacity building in HIV/AIDS
7 Pallisa Kibbo, Busoga Trust Sensitisation of staff and community members on HIV/AIDS 8 Kiryandongo DHO Sensitisation of staff and community members on HIV/AIDS
9 Luwero DHO Sensitisation of staff and community members on HIV/AIDS 10 Nakaseke Uganda AIDS Commission Sensitisation of staff and community members on HIV/AIDS 11 Nakasongola World Vision Sensitisation of staff and community members on HIV/AIDS 12 Masaka RACOBOA, SSF Voluntary Counselling and Testing (VCT)
13 Rakai UNICEF, Caritas Maddo Sensitisation, capacity building 14 Kabale DOK, USAID Sensitisation, condom distribution and capacity building in
HIV/AIDS 15 Kanungu DHO sensitisation, voluntary testing and counselling 16 Rukungiri The AIDS Support
Organisation Sensitisation of community members on HIV/AIDS
17 Mbarara The Aids Support Organisation, Hospice Uganda, AIDS Information Centre
Provision of Sensitisation materials, VCT, and sensitisation
18 Rubirizi DHO Sensitisation of staff and community on HIV/AIDS 19 Kyegegwa DHO Sensitisation of staff and community on HIV/AIDS 20 Mityana BAYLOR Uganda Sensitisation and Capacity building Health Workers 21 Mubende Agape International
Missions Mobilisation and sensitisation of communities
22 Ntoroko CAWODISA, MILD MAY Sensitisation, increase capacity of staff in HIV/AIDS care 23 Nakapiripirit Friends of Christ Ministries Community sensitisation and Condom distribution 24 Soroti The AIDS Support
Organisation Training of NUSAF contractors, mobilisation of communities on HIV/AIDS

Uganda Water and Environment Sector Performance Report 2015
163
11.3.3 HIV/AIDS Mainstreaming Activities in Urban Areas
The WSDF-North undertook community sensitisation activities on HIV/AIDS with support from the AIDS Information Centre (AIC). The target communities were in the towns of Arua, Gulu and Lira, Okollo, Midigo, Kalongo, Pajule, Opit and Patongo. Under WSDF- South West, drama shows and training were conducted in 25 towns88 . WSDF-Central conducted sensitisation meetings on HIV/AIDS in the towns on Najjembe, Kakumiro, Kiganda, Kinogozi and Kyamulibwa. Education and information posters on HIV/AIDS were distributed in the towns of Kyamulibwa, Najjembe, Kinogozi, Budongo, Kiganda and Kakumiro. The progress reported above indicates the sector commitment towards ensuring that all community sensitisation activities integrate HIV/AIDS mainstreaming activities.
A Voluntary Counselling and Testing session for HIV/AIDS and Hepatitis B virus was undertaken for all members of staff of WSDF-North. All member of staffs were in addition vaccinated against Hepatitis B virus. The willingness by all WSDF- North staff to undertake Voluntary and Counselling and Testing shows a positive change in attitude within staff in the facility.
11.3.4 Challenges and recommendations
The sector has made significant strides in mainstreaming HIV/AIDS in their programmes and activities; however there are various challenges experienced in implementation at all levels. Key implementation challenges include inadequate technical capacity, inadequate funding, and lack of sector specific training manuals on HIV/AIDS.
It is recommended that the sector develops sector specific trainer’s manuals on HIV/AIDS to guide mainstreaming efforts in districts.
11.4 Provision of Water and Sanitation Services to the Poor
A study of how and to what extent the practices outlined in that strategy have helped to provide safe water and improved sanitation to Uganda’s poor and economically disadvantaged was carried out with support from the World Bank in 2015. The study findings are summarised in this section.
Poor people comprise 19.7% of the Ugandan population. Of the 6.7 million poor people, 6.0 million (89%) live in rural areas, and 700,000 in urban areas. Most of the urban poor live in small towns (600,000). Similarly, 90% of economically disadvantaged people live in rural areas, and those in urban areas live mostly in small towns. The overwhelming majority (84%) of poor people live in Eastern and Northern Regions.
Progress in services to the poor: The analysis of the Uganda National Household Survey (UNHS) data shows that Uganda has been remarkably effective in delivering services to the poor and economically disadvantaged. Nationally, 73% of the non-poor have access as compared to 72% of the poor. In the Rural areas 67 % of the non-poor have access as compared to 71% of the poor (it is 87% and 79% respectively in the urban areas). In essence, the poor and economically disadvantaged people lack access to improved water and sanitation primarily because they live in rural areas, and not due to their income levels. The access to improved sources in rural areas is 68% as compared to 86% in the urban.
Enabling approaches: Uganda pursued a pro-poor approach to rural water supply, without explicitly labelling it as such, long before the 2006 Pro-Poor Strategy appeared. The overall guiding principle of the 1999 policy (which was applied earlier) was “some for all rather than more for some.” In other words, equity and serving first those in most need was to be the primary consideration. Other significant strategies include the use of low-cost and appropriate technology, and community
88 Kinyamaseke, Kisinga/Kagando/Kiburara, Kibuuku, Kanaara, Kijura, Kiko, Karago, Katooke, Kyenjojo, Butunduzi, Nyamunuka, Rwashamaire, Mpara, Bethlehem, Kibaale, Lwamagwa, Nambirizi, Rushango, Igorora, Kajaho, Kabuyanda, Nsiika, Sheema and Rubirizi

Uganda Water and Environment Sector Performance Report 2015
164
participation in all phases of the project cycle as well as the introduction of cost recovery measures for both rural and urban areas.
However, even targeting funds to the poorest districts does not necessarily reach the poorest households. When a poor district receives funds, sometimes political considerations may take precedent. Other weaknesses found was lack of definition and mapping of the poor, lack of clear targets, and lack of a monitoring system
Allocation of sub-sector budget: The share of rural water and sanitation of the sector budget falls between 33% and 45% for the period 2009/10-2012/13. Although there has been some increase in nominal terms, in real terms the grants are below 2002/03 levels. Decreased funding to rural water supply has resulted in falling access to improved water supplies in the rural areas, where the poor and Bottom 40% are concentrated. MWE access figures show that urban coverage increased fairly steadily from 61% in 2007/08 to 73% in 2013/14. By contrast, rural coverage fell from 65%, 2008/09-2010/11, to 64%, 2011/12 – 2013/14.
Nationally, 19% of households use piped water and in rural areas it is only 9%; 20% (Western Region), 2% (Northern Region), 5% (Central Region), and 7% (Eastern Region).
In Uganda, as is the case globally, any type of subsidised tariff for piped schemes benefits primarily wealthier households mostly because many more of them use piped schemes as their principal source of drinking water. In urban areas, piped schemes are used predominately by the higher income groups. For example, 51% of the urban non-poor use piped schemes compared to 15% of the urban poor.
Conversely, boreholes remain the principal technology for delivering improved water in Uganda. Nationally, 35% of households get their water from a borehole, 40% of rural households and 22% of urban households. It is therefore the principal type of water supply used by the poor and Bottom 40%, both in rural and urban areas. This is part of the great success story in Uganda, that the majority of households in poverty and the Bottom 40% get their drinking water from a borehole rather than an unimproved supply.
Pro-Poor Practices in Small Towns: The WSDFs have no directives concerning pro-poor practices. The selection and monitoring procedures in the WSDF operations manual do not include poverty considerations. The DWD design manual for piped schemes, used by WSDFs, states that affordability must guide technical design. However, affordable designs are not necessarily pro-poor. Following construction, the private operators and individual operators who run the schemes have little scope for introducing pro-poor practices, as these require investment funds, subsidies, or changes in tariff policies. Furthermore, the performance indicators for private operators, as laid out in the standard management contract developed by DWD, do not monitor pro-poor practices.
Affordable Connections Policy in large towns: Most (77%) of the new connections in Kampala were domestic, that is, yard and house, and most of these new residential connections were for house connections. Thus, the main beneficiaries were households which had water piped inside their homes and commercial and industrial connection holders. Lowering the fees for a domestic connection, and introducing instalment plans for paying the fees, have been extremely popular and effective measures for increasing domestic consumption for water utilities in other African countries and should be emulated.
The Policy increased the number of yard connections and public water points (PWPs) along with private connections. Out of the total number of beneficiaries provided piped scheme water through this policy, 2004-2010, 99,146 people (21%) were served through active yard connections and PWPs in low-income settlements. The main problem facing service through yard connections and PWPs has been disconnection for non-payment. In 2010, the percentages of inactive new connections (2004-2010) were 21% of yard connections and 53% of PWPs.
Prepaid meters: To meet the challenges facing PWPs and shared yard connections, particularly non-payment, NWSC piloted prepaid PWPs in Kampala. The advantages to the consumer are in principle

Uganda Water and Environment Sector Performance Report 2015
165
24/7 water availability at the point and no middleman mark-up in price, and to NWSC of virtually eliminating non-payment problems. The challenges are the much higher costs of installation (about USD1,350 compared to USD380 for a PWP and USD170 for a yard connection), repairs and maintenance to the meters and vendor machines that charge the tokens, and the continuing problem of locating suitable sites due to land ownership. Prepaid meters were found not to be suitable for small towns currently because of the reasons mentioned above. Study recommendations:
(i) include to revise the Sector’s Pro-poor Strategy to include measurable objectives and outcomes, and to plan for regular progress reporting,
(ii) protect water services to the poorest and most economically disadvantaged, by channelling additional assistance to the sub-counties where poverty and economic disadvantage are highest, and improved water access lowest,
(iii) assist local Water Authorities, WSSBs, private operators and individuals to integrate the management of hand pumped supplies and piped schemes,
(iv) develop targeted programs to improve access and other aspects of improved water services to both the poor and the bottom 40%,
(v) collaborate with UBOS to identify the sub-counties with the highest levels of poverty and economic disadvantage and the worst water access rates, and
(vi) reduce piped scheme tariff subsidies.

Uganda Water and Environment Sector Performance Report 2015
166
12 CIVIL SOCIETY ORGANISATIONS IN WATER AND SANITATION
12.1 Overview
Civil society organisations (CSOs) continued to be key players in complementing government efforts to deliver WASH services. This section presents CSOs contribution presents during the FY 2014/15. It presents an overview of financial investments in, and contributions to the sector. Data presented is based on data received from 117 member organisations under the Uganda Water and Sanitation Sector NGO Network (UWASNET), compared to 105 organisations that reported in FY 2013/14. More detailed information for each organisation that reported is provided in Annex 19.
12.2 CSO Investments in WASH
During the FY 2014/15, CSOs made a total investment of UGX 49.30 billion in the areas of water supply, sanitation and hygiene promotion, activities related to community management, water for production and integrated water resources management (Figure 12.1). This investment is inclusive of the administrative costs incurred by members during implementation.
Figure 12.1Total investments FY 2014/15 (UGX bn)
Most investment was made for water supply, UGX (32.95 billion), constituting 66.8% of the total investment. Investment in sanitation was UGX 12.39 billion (25.1%), in community management UGX 2.85 billion (5.8%), in water for production UGX 0.73 billion (1.5%) and in integrated water resources management (IWRM) UGX 3.9 billion (0.8%). Figure 12.2 reflects total CSO investment in WASH over the last three years.
32.95
12.39
2.85 0.73 0.39
49.30
-
10.00
20.00
30.00
40.00
50.00
60.00
Water Supply Sanitation Community Management
WfP IWRM Total

Uganda Water and Environment Sector Performance Report 2015
167
Figure 12.2 CSO investments [UGX bn] for period FY 2012/13 to FY 2014/15
Investment in water supply increased by 49%, from UGX 22 billion in FY 2012/13 to UGX 32.95 billion in FY 2014/15. Increase in investment has also been realised under sanitation. Total investments have increased from UGX 29.4 billion to UGX 49.30 in FY 2024/15 reflecting CSOs increased support to the sector.
12.3 Investments in Water Supply
Investment in water supply by technology is reflected in Figure 12.3.
Figure 12.3 Investment in water supply by technology
Highest investments were made in boreholes construction, totalling to UGX 16.8 billion; this constitutes 51% of the total water supply investment. Figure 12.4 reflects that, whereas there has been a steady increase of investment in borehole construction, there is no clear pattern of investments in other technologies.
22
4.5 2.50.1 0.3
29.4
22.1
11.4
3.40.5 0.5
37.932.95
12.39
2.850.73 0.39
49.30
Water Supply Sanitation Community Management
WfP IWRM Total
UGX 'bn FY 2012/13 UGX 'bn FY 2013/14 UGX 'bn FY 2014/15
16.80
5.55
3.44
2.37
1.48
1.36
0.91
0.54
0.31
0.08
0.07
0.05
0.00 2.00 4.00 6.00 8.00 10.00 12.00 14.00 16.00 18.00
Borehole Construction
Shallow well construction
Rain water harvesting
Gfs
Water filters
Extension of piped water systems
Borehole repairs
Shallow well repairs
Spring protection
Repair to pumped and piped water schemes
Spring repairs
Gfs repair
UGX (billion)

Uganda Water and Environment Sector Performance Report 2015
168
Figure 12.4 Investments in water supply technologies from FY 2012/13 to FY 2014/15
12.4 Investments in Sanitation and Hygiene
Figure 12.5 reflectS investment in sanitation and hygiene components in terms of actual investments (UGX billion).
Figure 12.5 Investment in Sanitation
The greatest investment was in construction of school sanitation facilites (UGX 5.77 billion). Investment in the construction of household toilets (largely for the disadvantaged households) amounted to UG 3.25 billion.
12.5 Investments in Community Management
Community management activities range from establishment of a Community Based Management System of developed facilties, capacity building, targeting vulnerable groups, formation and training of various community based organisations as in health clubs, or handpump mechanic associations, among many others. CSOs engage in a wide rage of activities that include preparing communities to own water and sanitation facilities, conducting mobilisation activities for community participation and involvement, and a host of activities that target sustainability of programmes/projects or facilities developed. Figure 12.6 presents CSOs’ investments in community management.
9.31
3.834.73
3.451.98
11.39
2.74 2.61.76 1.88
16.80
5.55
3.442.37
1.48
0
2
4
6
8
10
12
14
16
18
Borehole Construction
Shallow well construction
Rain water harvesting
Gfs Water filters
UGX (billion) FY 2012/13 UGX (billion) FY 2013/14 UGX (billion) FY 2014/15
5.77
3.25
1.66
0.93
0.28
0.14
0.10
0.09
0.08
0.05
0.04
0.00 1.00 2.00 3.00 4.00 5.00 6.00 7.00
School sanitation (excreta mgt)
Household toilet construction
Public toilets construction
CLTS triggering and follow-up
Production of sanplats and slabs
Provision of waste disposal facilities
Installation of HWF at households
Installation of drying racks - households
School sanitation (HWF)
Drainage cleaning equipment
Construction of drainage channels
UGX billion

Uganda Water and Environment Sector Performance Report 2015
169
Figure 12.6 Investment in Community Management activities
Under community management, highest investment was in the formation and training of WUCs/WSCs (UGX 946.89 million), constituting 33% of the total investment in community management.
12.6 Access to Improved Water Supply (Golden Indicator No.1)
With investment in development of new water and repairs/rehabilitations of existing sources, CSOs have continued to make a significant contribution in improving access to safe water supply sources. Figure 12.7 reflects the number of new water sources constructed by CSOs during FY 2014/15.
Figure 12.7 New water supply sources developed FY 2014/15
Foramtion & training of WUCs / WSCs
Follow up support activities
Community dialogue meetings
Learning events
Formation and training of VHT
Formation & training of Sch health clubs
Training of school staff
Formation & training of comm health clubs
Spare parts to communities
Training of HPM
Functional community health clubs
Other*
Training of masons/artisans for sanitation
Tools for HPM
Training of masons/artisans for water
946.89
632.47
559.47
126.36
102.77
93.15
78.94
71.69
50.31
43.48
43.10
33.90
27.98
18.50
17.13
UGX (million)
0
200
400
600
800
1000
1200
Community Institutional Total
New watersources (No.)
755
322
1077
723
18
741
423
40
463
404
19
423
123
9
13294
22
116
8030
110
Rainwater harvesting Tanks
Rainwater harvesting Jars
Borehole Construction
Shallow wells
Spring protection
Tapstands/Kiosks
House connections

Uganda Water and Environment Sector Performance Report 2015
170
Most of the new water points were rainwater water tanks (1,077 No.) and rainwater jars (741 No.). In total, 463 boreholes were drilled, 423 shallow wells were constructed, 132 springs were protected, and 116 tap stands and kiosks as well as 110 house connections were made.
During the computation of the access figures specific to rainwater harvesting tanks, the Ministry of Water and Environment recognizes rainwater tanks with and above the capacity of 6000 litres. UWASNET members constructed a total of 1,077 rainwater harvesting tanks, the detailed breakdown of their capacities is presented in Table 12.1
Table 12.1 No. of Rain Water Harvesting Tanks Constructed in FY2014/15 S/N Tank Capacity (Litres) Units Constructed 1 20,000 180 2 10,000 275 3 6,000 113 4 5000 133 5 4000 376 1,077
12.7 Functionality of Water Supplies (Golden Indicator No.2)
Effective Operation and Maintenance is very important in ensuring sustainable functionality of water points. Routine maintenance of facilities greatly minimizes the need for major repairs of water points. To ensure effective O&M, NGOs conducted a range of activities including formation and training of WUCs, training and equipping of hand pump mechanics and follow up on management structures to monitor performance. A few NGOs facilitated the formation of Sub-County Water Supply and Sanitation Boards.
12.7.1 Formation and Training of WUCs/WSCs
A total of 3,402 WUCs were formed with membership ranging from 5 to 10 persons. These democratically elected committees will ensure ownership and sustainable functionality of the water points. WUCs were trained on their roles and responsibilities. Users agreed to pay monthly user fees89. In some cases, communities agreed to open bank accounts (BUVAD). The community commitment to collect monthly fees for O&M will ensure sustainable functionality of water points. In addition to training WUC, NETWAS formed 57 Village Saving and Loan Associations (VSLAs) and guided integration of WASH into VSLA activities as well as liquid soap marketing skills.
Box 12.1 Formation and training of WUCs/WSCs: Examples from CSOs NETWAS trained 12 borehole Water User Committees (7 in Luwero district and 5 in Lira/Alebtong districts on pre and post construction. Water user committees were reconstituted, comprising men, women and youth representatives. In addition, 57 VSLAs and 21 WSCs mentored in the integration of WASH into VSLA while mentoring on liquid soap marketing skills was conducted for 4 WSC groups in Tororo district, 2 in Kamuli district, 4 in Lira/Alebtong district and 8 in Luwero district. Four WSC groups that expressed interest in liquid soap making were also trained. SNV working with its partners supported the formation and trainings of 120 WUCs/WSCs. The objective is to improve functionality of water sources and improved collection of O & M funds BUVAD facilitated the democratic election of WUCs. They were trained and guided on the development of by-laws. Water users also agreed to pay a monthly user fee of UGX 1000 and agreed to open a bank account to ensure proper financial management. A wooden fence was constructed around the water point to further protect the water point against vandalism.
89 based on information from the following CSOs: BUVAD, PAMO Volunteers, World Vision Kamwenge, PAG Kumi, and VAD.

Uganda Water and Environment Sector Performance Report 2015
171
12.7.2 Sub-county Water Supply and Sanitation Boards
IRC supported operations of four Sub-County Water Supply and Sanitation Boards through regular monitoring and supervision. The boards were re-oriented on their roles and responsibilities. A number of issues e.g. recruitment of board members, financing and accountability were clarified. IRC Uganda is now in the process of updating the guidelines for rolling out SWSSBs.
12.7.3 Training and Supporting Hand Pump Mechanics
The importance of hand pump mechanics (HPM) in ensuring routine O&M of water points is recognised. HPMs provide maintenance services to water users in rural and peri-urban areas. HPMs provide general handling, maintenance and repair services of hand pumps. NGOs carried out a number of activities in order to strengthen the operations of HPMs. For example:
x IRC conducted training on the Local Government and HPMA engagement framework that prescribes relationship between local governments and HPMAs. The training, targeted 12 districts in Northern Uganda attracted HPMAs and Local Government representatives. As a result of this engagement, the HPMs and Local governments were able to comprehend the engagement framework, and committed themselves to signing MoUs and framework contracts for engaging HPMAs on operation and maintenance of water supply facilities.
x World Vision and Water for people also trained HPMs. While World Vision equipped HPMs, Water for People trained HPMs who acquired tools on their own.
x The HPMA of Kamwenge DLG, supported by Water For People, was also trained in the use of the gulper for faecal sludge emptying. This is a new business idea to further enhance their employment opportunities.
x JESE built the management capacity of HPMs. Training was conducted in areas of governance, financial management, business planning, group dynamics, contract management and public procurement procedures. Consequently, HPMA for Kyenjojo and Kabarole engaged in contract management and bidding for district water and sanitation works. They also won tenders to rehabilitate and construct point water sources.
x SNV provided HPMs in the districts of Dokolo, Alebtong, Lira and Apac with refresher trainings. SNV worked closely with the TSUs and DWOs
x It should be noted that it is mainly international NGOs that trained and equipped HPMs. Other NGOs e.g. Caritas MADDO used services of hand-pump mechanics previously trained by the local government. WaterAid engaged in strengthening private sector engagement in O&M of piped schemes. Training of Private Water Operators, public stand post attendants and water kiosk operators in Amuria and Namalu small towns was conducted to ensure sustainable public private partnership in WASH service delivery in small towns. Sessions focused on the roles and responsibilities of private sector; guidance on tariff settings for piped water schemes as well as record keeping; meter reading and management; sanitation marketing; and how to promote the safe water chain.
12.7.4 Supporting the CBMS
Follow up support activities were conducted to ensure that community management systems are properly entrenched. These were to ensure that established structures (e.g. WUC, sanitation committees/champions, VHT, child health clubs) perform their roles.
As a result of this follow up (which some NGOs, e.g. JESE, VAD conduct on a quarterly basis), households have adopted appropriate hygiene and sanitation behaviours, whereas water points have remained functional due to active WUCs as indicated in Box 12.2.

Uganda Water and Environment Sector Performance Report 2015
172
Box 12.2 Water User Committees
VAD carried out 300 follow–up support activities, i.e. 65 visits for WUCs, 86 visits for community management teams/village health teams ( CMT/VHTs), 5 visits for community based masons, all from the four sub-counties of Wakiso district, and 108 visits for school health clubs (SHCs) and 36 visits for school management committees (SMCs) in 12 target schools. These visits were conducted to trigger the committees/ structures to effectively perform their roles and responsibilities.
12.8 Water Quality Monitoring
NGOs conducted water quality tests to ensure that water is fit for human consumption. For example, World Vision carried out physio-chemical tests on water sources constructed in Kamwenge district; Link To Progress obtained the services of NWSC to carry out water analyses for all the boreholes constructed; KWDT promoted the use of bio-sand water filters emphasizing its added advantage of economizing fuel/firewood and also conserving the environment; and JESE supplies household water filters at a subsidised cost as well distributing safe drinking water containers to primary schools.
VAD carried out physical and bacteriological tests on water in newly constructed community water points. However, they also encouraged the community to continue using other methods of water purification/treatment.
Water for People carried out bacteriological water quality testing as part of their water quality testing on water points in Kamwenge district. All in all, 12% of the water sources were found to have an unacceptable level of faecal coliforms mainly due to:
a) Location of latrines: Some water sources have latrines within the minimum safe distance allowable for pathogen movement or uphill of the water source
b) Poor drainage: Poor drainage of storm water around the shallow wells – some of the existing wells are silted/poorly draining while other sources don’t have storm water cut off drains
c) Lack of fencing: Inadequate or lack of proper fencing around the wells to keep away animals, as animal dung was found within the minimum safe distance around the well
d) Poor masonry works: Some of the slabs/spring boxes are broken allowing ingress of dirty water into the wells.
e) Unhygienic Practices: Some sources were found with users washing dirty clothes and beddings and the waste water being poured within the Minimum Safe Distance of the well.
AEE trained Primary schools on how to keep and give their pupils safe water for drinking. Schools were also encouraged to have water filtration mechanisms to purify their drinking water. Many schools with AEE support have adopted and bought water purification machines while others boil drinking water.
12.9 Integrated Water Resource Management (IWRM)
The following examples depict initiatives undertaken by some NGOs to promote Integrated Water Resource Management:
x PAG Kumi encouraged the communities to plant and properly manage trees by watering them. They were encouraged to plant trees to protect the water catchment and they were also sensitised to use water from the water sources for production purposes; e.g. establishment of vegetable gardens around the water sources and kitchen gardens at household levels.
x Diocese of Kigezi engaged in catchment management planning, formation and training of community based management structures; demarcation and protection of water bodies; construction of energy saving stoves to combat pollution and lessen destruction of forest cover (2 institutional and 20 domestic stoves); soil and water conservation facilities (check-dams, channels, hedge rows); and training in nursery establishment and tree planting.
However, NGOs need to be sensitised more about Integrated Water Resources Management so that it mainstreamed into their WASH projects.

Uganda Water and Environment Sector Performance Report 2015
173
12.10 School Sanitation
A cross-section of NGOs promoted primary school sanitation through various activities. All these activities aimed at providing a conducive/clean learning environment, keep the girl child in school, and improve student knowledge, attitude and practice in regard to hygiene and sanitation.
In other instances, teachers, parents and pupils were targeted whilst promoting child friendly hygiene and sanitation in schools (JESE, World Vision, and VAD). Participatory hygiene and sanitation transformation (PHAST) tools were used to enhance reflection and understanding of appropriate hygiene and sanitation practices. School health clubs were formed and trained on operation and maintenance of water facilities, latrine facilities and Child to Child Approach. The schools developed hygiene and sanitation O&M plans and set up an O&M fund. Involvement of parents motivated them to rehabilitate RWH tanks and hand washing facilities in schools in Kyenjojo district; and construct a 4-stance VIP latrine in a school in Bundibugyo district. Overall, involvement of parents in school sanitation activities has a positive impact on hygiene and sanitation promotion. Largely, the large numbers of schools targeted by NGOs will create a multiplier effect on reach out to pupils and eventually the wider community.
Menstrual hygiene and management in schools is essential for ensuring that adolescent girls’ education is not interrupted during menstruation. In this sense, maintaining proper menstrual hygiene is important for their wellbeing and development. NGOs engaged in promoting menstrual hygiene and management in schools through activities such as:
x Equipping senior women and men teachers with skills and knowledge on menstruation hygiene management, and setting up talking compounds (related messages on placards mounted in the school compounds) (EINTEDEF).
x The training of school staff in sanitation hygiene has helped improve awareness on menstrual hygiene management. This has resulted in increased awareness among pupils in 604 primary schools where SNV is implementing the “Girls in Control Menstrual Hygiene Management” project in the districts of Dokolo, Lira, Mubende and Mukono.
These capacity building sessions created a knowledge base on menstrual hygiene, sanitation and influence attitudes and practices in schools. The following achievements have been registered:
x There is a reduction is school dropout and / or skipping classes by girls due to menstruation. This is attributed to availability of menstruation hygiene materials, supplies and equipment that include soap, water, reusable san pads etc.
x There is better and improved perception towards menstruation among community members including men.
x There is an increase in income for women involved in the supply chain for menstrual hygiene materials that include local tailors, social markets and door to door distributors. (EINTEDEF)
x There is an increase of pupils attending school especially the girls, because there is reduced stigma about girls having their menstruation. Therefore there is great improvement in education performance and less school drop outs, or girls who miss school because of their periods.
12.11 Community Dialogue Meetings
Community dialogues/ meetings are conducted in order to generate demand for services within the community as well as enlighten the community about its responsibility in regard to WASH services. NGOs (World Vision, PAG Kumi) facilitated community dialogues related to issues such as water, hygiene, functionality of water points, and user fees.

Uganda Water and Environment Sector Performance Report 2015
174
As a result of community dialogues, communities are aware of their roles and responsibilities regarding water use and management; dangers of open defecation to their lives, water users now demand for accountability from WUCs for money they collect to repair water sources.
NETWAS continued using the Community Score Card to promote service delivery. It organised SMS review dialogues to review the incoming messages from water users on the state on water services in the community. These culminated into repair of broken pipes on the water scheme in Bombo.
WaterAid Uganda, through the Civil Society Budget Advocacy Group (CSBAG), facilitated two stakeholder dialogues on SWASH in Pallisa and Kibuku DLGs. This was informed by the two field visits in the worst and best schools for each district. Participants included the WASH Parliamentary Committee, NGOs, Local Governments and schools. The WASH Parliamentary Committee committed to influence parliament to have clear budget votes for WASH and increased allocations for schools.
Water for People initiated a Water as a Business (WAAB) programme where it conducts “At what cost” trainings. Such sessions are used by community members to set tariffs for piped water in a participatory manner.
12.12 Generating Demand, and Improving Supply Chain for Sanitation and Hygiene Promotion
12.12.1 Community-Led Total Sanitation (CLTS)
WaterAid Uganda (WAU) and partners use the Umoja approach to promote better hygiene and sanitation. This approach is a combination of three different approaches i.e. Community led total Sanitation (CLTS), Cluster approach and Participatory Hygiene and Sanitation Transformation (PHAST) approach. It is participatory and encourages joint community effort in up-scaling sanitation and hygiene promotion in clustered households. The approach enhanced adequate knowledge, active community participation and ownership which are key to sustainability of projects. WAU is engaging the sector to embrace Umoja and scale it up as a national approach for sanitation and hygiene promotion.
EINTEDEF trained women groups and local tailors in making reusable sanitary materials as well as developing business skills helping them earn a living and be able to meet basic domestic requirements. Alternative menstruation hygiene materials including menstrual caps were introduced to the women groups increasing choices for improved/better health.
NGOs facilitated CLTS initiatives in villages. A total of 3,100 villages were triggered and by the end of the year, a total of 1,080 villages were certified Open Defecation Free (ODF) by the respective districts. Follow up is being made on those which were triggered and not yet ODF (World Vision; JESE, PAG Kumi). Enforcement of by-laws was carried out in communities for households that do not comply with the community sanitation and hygiene improvement plans. (PAG Kumi). Access to water has also been a stepping stone to improved hygiene and sanitation, hence NGOs constructed / rehabilitated a number of water facilities (Protected springs, RWH Tanks etc.). Under sanitation marketing, women trained in making sanitary pads have improved their incomes and can now save at their local levels (EINTEDEF).
12.12.2 Improving the Supply Chain
Masons received training in construction and maintenance of water points. Specific training was conducted on fabrication of a kit for manual drilling and installation of a manual drilling well in Kyenjojo district (JESE); RWH tanks (NAPE) and construction of tarpaulin-lined ground tanks (Caritas MADDO). The Diocese of Kigezi built capacity of artisans from NGOs (PAG Soroti), institutions (Kabale Technical Institute), and individuals in communities in the construction of 4000ltr Ferro cement tanks and rain water jars. NETWAS, in collaboration with the Appropriate Technology Centre built Busoga Trust’s and other artisans’ capacity in construction of EMAS tanks and Pump Tanks. As a result, Busoga

Uganda Water and Environment Sector Performance Report 2015
175
Trust got a 5-year contract from Mpigi District Local Government to construct 25 EMAS tanks with pumps. Some of these masons have since then got an opportunity to practice their trade.
Masons were also trained in construction of sanitation facilities. For example, JESE trained masons in construction of Fossa Alterna Ecosan facilities and these have provided services to households and schools in Kabarole and Kyenjojo districts. NETWAS also equipped artisans from 3 districts (Namutumba, Sironko and Bududa) with skills in the construction, operation and maintenance of Fossa Alterna toilet. On the other hand, SNV trained artisans in 15 districts in the construction of sanitation facilities using Sato Pans, while Plan Uganda trained masons latrine construction, slab making and sanitation as a means of raising income. The masons trained by SNV are helping reach out to over 10,000 households.
12.13 Documenting Experiences, Case Studies, Information Sharing and Learning
Documentation of experiences was done with a purpose of enhancing learning and advocating for change. These included:
(i) A budget tracking study in Lira and Kabarole districts by IRC Uganda. The purpose was to analyse the allocation and expenditure of the conditional grant on different cost categories for delivery of rural water supply over a period of three years (2010 – 2013).
(ii) A water service monitoring survey in Kabarole district by IRC/Triple-S. The purpose was to establish the level of water service received by users. The survey was done within the framework of the new Service Delivery Indicators, which were proposed by the Triple-S Initiative to complement the existing Golden Indicators.
(iii) Documentation of cases on school and community WASH by NETWAS Uganda and partners. The documentation, focused on good governance, captured cases from four districts i.e. Lira/ Alebtong, Kamuli, Tororo and Luweero.
(iv) A handbook for water user committees in both Luganda and English was developed by NAPE.
(v) Video documentation of Rwambu catchment by NETWAS. The documentary was aired on UBC as well as shared online. Process documentation of the change envisaged in Rwambu was also captured and shared in briefs. The project is being implemented by JESE.
(vi) Catalogue for sanitation technologies and working paper was developed by ATC. The purpose was scaling up of appropriate sanitation technologies.
(vii) A documentary ‘New Actors of Change’ by KWDT. This short documentary features success and challenges women face as they engage in increasing access to, construction and management of Water and Sanitation at household, group level and in the community. It showcases how rural women have been empowered in lobbying and advocacy, as well as how rural women have been equipped with good governance skills to enable them influence and participate in decision making at sub-county level, and how they can engage local leaders on issues concerning WASH. This has given a clear picture of the efforts of rural women in ensuring access to WASH and attracted masses to further support women’s efforts.
Overall, NGOs have shared such experiences through different learning fora, Joint Technical Reviews, Inter=District Meetings, DWSSC, fliers, newsletters etc. NGOs also conducted exchange visits (e.g., KWDT) as a way of promoting learning, improving performance and promoting peer support. The visits provide opportunity for hands-on experience to further enhance implementation skills.

Uganda Water and Environment Sector Performance Report 2015
176
12.14 Cross-cutting Issues
12.14.1 Gender Mainstreaming
Gender mainstreaming has continued to be a key factor during the formation of WUCs. During community sensitisation much emphasis was put on the importance of equitable gender representation; therefore, women and men were encouraged to fully participate in all project activities including airing out their views. As such, all WUC had women representatives while some NGOs included slots for youth and children. School Health Clubs were also formed putting into consideration the gender distribution.
As a result, women and girl children were empowered to take on leadership skills and can therefore ably air out the views in the community/schools.
12.14.2 Promotion of Equity in Provision of Water Supply and Sanitation Services
Rain water harvesting (RWH) jars were provided for the most vulnerable households (people with disabilities, HIV/AIDS, elderly, child-headed households). Identification of these vulnerable households was done by the sub-county, local councils and the communities. WAU supported households without suitable rainwater harvesting structures by providing them with iron sheets and guttering system while the beneficiaries contributed locally available materials.
WAU community sensitisation messages have been packaged to capture equity and inclusion aspects. In addition, drainable VIP latrines constructed in primary schools with the support of WAU have inclusive designs, with one stance each designed for the pupils with physical disability.
WAU, in partnership with ATC, NETWAS-U and the Ministry of Gender Labour and Social Development engaged in advocacy for equity and inclusion by organizing a national conference with the theme “Undoing inequity in access to water and sanitation services for vulnerable people”. The key areas that were identified and agreed for urgent action were; the recognition and clear articulation of the importance of equitable and inclusive WASH provision, translating this recognition to policy and backing it up with adequate, targeted and timely financial resources.
Water for People interventions in Kamwenge district are focused on the most needy sub-counties and communities.
12.14.3 HIV/AIDS Mainstreaming
There have been efforts by some NGOs (YES in Busia) to distribute condoms. This has been done through community structures. NGOs such as VAD provided water jars to people infected or affected by HIV/AIDS. However other NGOs had no clear mechanism of reaching out specifically to people affected or infected with HIV/AIDS, though the provision of non-discriminatory WASH services ensured that all persons were served.
12.14.4 Coordination and Collaboration
Coordination and collaboration amongst NGOs and between them and Government is driven by the degree of convergence in their development objectives. To this effect, the WASH sector NGOs have continued to be coordinated by UWASNET.
In addition, coordination has been done at Local Government level where NGOs participated in District Water and Sanitation Coordination Committees (DWSCC). During the DWSCC meetings, NGOs shared experiences and information with different WASH stakeholders which improves their services, improves planning and minimizes duplication of efforts.
Some NGOs work with partners as a core value. NGOs such as World Vision, IRC, SNV, WAU and NETWAS implemented some of their activities through local NGOs/CBOs with a purpose of building

Uganda Water and Environment Sector Performance Report 2015
177
local capacity and reaching out to a wider population. Others, such as Child Fund worked with Local Government extension staff and VHTs to mobilise and sensitize communities. Overall, these organisations tapped into each other’s competences in order to effectively deliver WASH services.
12.15 Key Observations and Lessons learnt
(i) Although most existing sector policies and implementation guidelines are well-developed. Most of them are not effectively implemented. There is still a challenge of lack of awareness by local leadership of sector policies and guidelines, hence they mislead the community because their opinions are held in high esteem. However, some sector policies have helped to guide smooth implementation of WASH services, for instance NGOs regularly make reference to sector policies while engaging with the community, especially around issues of O&M, access to a water facility, land issues when siting a water points, providing school sanitation facilities, etc.
Whereas sector policies demand that the community should make monetary contribution to the cost of construction as well as be responsible for O&M, the current household poverty levels curtail meaningful contribution and investment in WASH services by households. In addition many households prioritize other social economic needs such as health, education and food, with less emphasis on water and sanitation. This is coupled with societal perception that WASH services are free of charge. Local by-laws are also very weak on the financial obligations of water users and the level of service they are expected to get. All this compromises O&M of the WASH facilities, hence sustainable services.
(ii) The current sector monitoring framework (based on golden indicators) provides little information on potential sustainability of water facilities, and does not capture the key background indicators that can be used to assess the reliability, the actual levels of water services being delivered to the population in rural areas, user satisfaction and technical backstopping to service providers. Lessons from Kabarole and Lira show that there is a gap in delivering services in accordance with sector practices. The sector faces a risk of continuing to provide a substandard level of service, unless data on service levels is continuously collected to inform decision making (IRC).
(iii) The District Water and Sanitation Conditional Grant (DWSCG) guidelines provide a clear process for planning and budgeting for Water and Sanitation activities with an explicit formula for allocation of resources for different cost categories i.e. capital expenditure, operation and maintenance, capital maintenance expenditure and direct support. However, there is no strict adherence to the guidelines.
(iv) Much as the sector has developed other appropriate water and sanitation technologies (e.g. ecological sanitation), uptake by the community is still low and this is partly attributed to their socio-cultural orientation.
(v) There are weak partnerships between Local Governments and NGOs. This is evidenced through minimal support from local leaders in the enforcement or implementation of by-laws on sanitation, O&M and provisions of the Public Health Act.
(vi) Sanitation interventions of actors mainly focus on two areas, i.e. demand creation and production of latrines, leaving out key stages in the sanitation value chain like marketing and distribution of different sanitation options to consumers. Business development has also been largely left in the hands of masons who do not have the required entrepreneurial capabilities to take their operations to scale.
(vii) Public private partnerships are good drivers for achieving and sustaining water security through self-supply. Investment in rainwater harvesting provides immediate benefits, and is a long term strategy for adaptation that will build a more resilient world in the future. Efforts for self-supply are affected by the issue of ability to pay, and this is a serious one with the potential to undermine the development of sustainable water supply systems. There is need to identify issues related to

Uganda Water and Environment Sector Performance Report 2015
178
ability and willingness to pay at project inception, and thereby develop a comprehensive communication strategy that promotes self-supply. There is need for a government policy to support scaling up of water harvesting technologies at households and institutions.
(viii) Menstrual Hygiene Management in households and schools remains a taboo subject that is not being discussed publicly to improve hygiene of women and girls. This is affecting gains being made in improving household and school water, sanitation and hygiene.
(ix) Utilisation of contemporary information and communication technology (ICT) is a very efficient mechanism for documentation, monitoring and evaluation that can enhance improved sharing of knowledge and services delivery.
12.16 Challenges
There is no harmonised approach to the implementation of the sector guidelines, and operation and maintenance plans at district level. This will require further capacity building especially in the form of mentoring.
The proposed new NGO Legislation poses a threat to NGOs. It will reduce the space for CSO engagement and ability to hold Government to account. The bill requires all MOUs signed between NGOs and Districts to be submitted to the Solicitor General’s office for approval as well as annual renewal of registration of CSOs which is not realistic given the present bureaucracy that exist in Government offices. CSOs are currently engaging the Government and Development Partners to amend some of the restrictive provisions.
12.17 Recommendations
The guidelines set by MWE for use of the District Water and Sanitation Development Conditional Grants (DWSDCGs) should be closely monitored. The Technical Support Units at regional level, should report on the adherence of district local governments to the grant guidelines.
As part of efforts to ensure harmonised reporting and uniform data definitions, UWASNET members should adopt the standardised templates and forms designed by the Ministry of Water and Environment and utilised by the District Local Governments. This requires continuous dialogue between UWASNET and the Ministry of Water and Environment, considering that most NGOs and CBOs operate in the rural areas.
Government should make it a minimum requirement of any local leader to promote improved household sanitation and hygiene. This will accelerate community action and galvanise gains made in improved household sanitation and hygiene promotion.
Government should expand the primary school curriculum on menstrual hygiene management to entrench awareness, openness. Children from middle to upper primary classes should be educated on menstrual hygiene thereby addressing this currently taboo subject affecting women and girls in households and schools.
Rain water harvesting policies and allocate necessary financial, institutional and human resources for to promote rain-water harvesting technologies for increased access to safe water for domestic use, and for water for production.
Given the challenges of the Community-Based Maintenance System for water supply systems, which is characterised by non-payment of water user fees, there is need for continued support to the Hand Pump Mechanic Associations and the Sub-County Water Supply and Sanitation Boards in order to strengthen institutional support for O&M.
The Ministry of Education issued a directive to schools to provide emergency sanitary pads for girls in school. NGOs need to come out and support schools to operationalise that directive. This will ensure that girls will not miss school when they are menstruating.

Uganda Water and Environment Sector Performance Report 2015
179
13 CIVIL SOCIETY ORGANISATIONS IN ENVIRONMENT AND NATURAL RESOURCES
13.1 Overview
This chapter sets out the Environment and Natural Resources Civil Society Organisations (ENRCSOs)’ contribution to development of the sector during the FY 2014/15. It presents an overview of financial investments in, and contributions to the sub-sector, impacting on the sub-sectors’ key indicators. Outputs presented are based on data received from 55 (36%) of the 150 active CSOs that are member of the Environment and Natural Resources Civil Society Organisations Network, which is presently hosted by Environment Alert.
13.2 CSO Investments in Environment and Natural Resources
During the FY 2014/15, ENRCSOs made a total investment of UGX 88,519,017,218 equivalent to USD 25,291,148 in the areas of forestry, wetlands, environment management, climate change and the weather and climate change subsectors. Figure 13.1 shows the contribution of ENRCSOs over the last 5 years. This contribution comes from only 55 members (36% of the total membership of the ENRCSO network). Out of the 55 members, 68% are registered as Local Non-Government Organisations (see Figure 13.2).
Figure 13.1 Contribution of the ENRCSOs [US$] for the past 5 years
Figure 13.2 Nature of members contributing to the report
Similar to the previous years, ENRCSOs continued spending most of their resources in forestry (45%) and environment (22%) thematic areas as shown in Figure 13.3. In terms of coverage, most resources are spent in projects located in Western Uganda (49%) with least resources going to Eastern (5%) and
-
5,000,000
10,000,000
15,000,000
20,000,000
25,000,000
30,000,000
2010/2011(29 NGOs)
2011/2012(35 NGOs)
2012/2013(42 NGOs)
2013/2014(48 NGOs)
2014/2015(55 NGOs)

Uganda Water and Environment Sector Performance Report 2015
180
Northern Uganda (12%), as shown in Figure 13.4. ENRCSOs are challenged to increase resources expenditure in Eastern and Northern Uganda.
Figure 13.3 Expenditure of resources per thematic area
Figure 13.4 Distribution of resources by region
13.3 CSO Achievements in the Forestry Sub-sector
13.3.1 Contribution to Forestry Management
ENRCSOs promoted agro-forestry at community level, distributing approximately 4,500,000 million seedlings to individual farmers, women and youth groups. At a conservative spacing of three metres by three metres, these seedlings covered 4,050 hectares, with an estimated potential to sequester approximately 607,00090 tonnes of carbon over a period of 15 years. The participating ENRCSOs in this sub-sector included ARUWE in Kyankwanzi District, AUPWAE in Mpigi District, BIRUDO in Buliisa District, ECO in Nakapiripirit District, RAC in Kyenjojo and Rwenzori Diocese in the districts surrounding Mt. Rwenzori. It is estimated that the survival rate for the planted trees stands at 60%.
In addition, ENRCSOs spent resources to maintain trees established in the previous years. For example SWAGEN spent resources to maintain 35 hectares of newly planted Pinus Ocarpa as well as pruning and spot weeding 60 Hectares of Pinus Ocarpa plantation in Rwoho Forest. Nature Uganda and Tree Talk spent resources maintaining planted trees planted by tobacco growing communities in the
90 One hectare is estimated to sequester 150 tonnes of carbon in a period of 15 years.
Northern12%
Central27%
Country wide7%
Western49%
Eastern5%
Districts of Operation

Uganda Water and Environment Sector Performance Report 2015
181
districts of Oyam, Kole, Lira and Apac, including maintaining restored sections of Kulu-Obia and Opit Central Forest Reserves.
The Uganda Timber Growers Association held 4 training sessions on various aspects of forest resources management, bringing together 25 participants per training, and distributed materials on raising awareness on management of woodlots for commercial purposes. VEDCO trained communities on conflict resolution and mediation for farmers living near forest reserves in Moyo District. It is through capacity building initiatives of this nature that our forest estate can be maintained.
The Uganda Forestry Working Group, with support from FAO, and through its members, promoted the enhancement of forest tenure and governance among communally owned forests in the district of Lamwo, Masindi and Bushenyi. In Masindi, Environment Alert together with CODECA supported the Communal Land Associations of Alimugonza, Ongo, Tengele and Motokai to develop memoranda of association with encroachers to vacate sections of the encroached communally owned forests in Pakanyi and Budongo Sub-Counties in Masindi District. Tree Talk and Environment Alert engaged communities to develop forest management plans for communally owned forests in Lamwo District and COVOID supported the development of forest management plans in the greater Bushenyi District.
Under the USAID Uganda Biodiversity Programme, the Jane Goodall Institute supported the maintenance of 57 kilometres of forest patrol trail in Budongo Central Forest Reserve. Assorted equipment was provided to Collaborative Forest Management Groups who opened up 19.5 kilometres of new forest patrol trail in Kalinzu Central Forest Reserve. A dynamic forest monitoring and alert system was developed for NFA, to improve on data collection, storage, analysis and management for action.
Environmental Alert in partnership with IUCN have taken lead in implementing the pro-poor REDD+ project activities in Agoro-Agu landscape. This is part of the ´Towards pro-poor REDD+ (Phase II), ´ that is implemented in Cameroon, Ghana, Guatemala, Indonesia and Uganda. The purpose of the project in Uganda is to integrate pro-poor principles and rights-based approaches into the National REDD+ Strategy, and other frameworks for sustainable management of forest resources in the country.
The key lessons are that:
x Direct engagement with encroachers by applying conflict resolution mechanisms builds mutual trust and promotes a positive attitude towards ownership and conservation.
x Support towards nursery management by the community builds their capacity for sustainability and is cost-effective.
x Promoting community-based extension service is cost-effective and instils a sense of ownership and voluntarism among community members.
x Land for tree planting is reducing in the rural areas and therefore communities should be enticed into agroforestry (mixing agricultural crops with trees).
x Re-survey and opening of forest boundaries and forest patrol trails with the participation of communities should be encouraged in order to reduce conflicts and further encroachment.
13.3.2 Awareness and Sensitisation on Environment and Natural Resources Management
Jane Goodall Institute, IUCN, UWS, EMLI, LEU, WWF, AUPWAE, ECO, A Rocha, CARE, Tree Talk, WWF, Environment Alert, and Nature Uganda among others, in collaboration with various district local governments have held sensitisation meetings and trainings with schools and communities adjacent to forests, in a bid to raise awareness for integrated natural resources management, conservation agriculture and restoration of biodiversity and ecosystems services.
ENRCSOs have now taken their initiatives to the village level. For example, BIRUDO conducted environmental education in 14 villages in Buliisa District. ECO held 10 community awareness and sensitisation meetings in Nakapiripirit District. KANCA conducted 6 dialogue meetings with

Uganda Water and Environment Sector Performance Report 2015
182
communities surrounding Nyakinoni and Nyakigumba Local Forest Reserve (LFR) on the importance and need to conserve the forest reserves.
Several CSOs produced awareness materials on various aspects. Tree Talk produced 2 issues of Tree Talk Magazine (with a print run of 250,000 copies each), distributed through the New Vision newspaper. The Uganda Timber Growers Association issued a monthly electronic newspaper circulated through the Uganda Forestry Working Group’s Google Group that reaches over 500 members.
In addition, UTGA organised 4 field cluster meetings, and 2 sensitisation meetings for tree nursery operators and contractors. SWAGEN designed and produced awareness materials about forest resources, REDD+ and regenerative afforestation, and conducted an exchange visit study tour between the forest-edge communities of Rwoho in Mbarara District, and West Bugwe in Tororo District.
At International level, ENR CSOs, with EMLI taking the lead, have raised awareness about climate change, reduction of emissions from deforestation and forest degradation and the related funding mechanisms to help Uganda address catastrophes arising from climate change.
13.3.3 Community Participation in Forestry Management
The Anti-Corruption Coalition for Uganda (ACCU), CARE, and JESE, together with 190 community monitors, conducted routine monitoring using Information and Communication Technology (ICT) in the management of forests and chain of custody within the forest sector. Over 537 cases were reported by the Community Based Monitors under the following categories: sighting, encroachment, illegal timber harvesting, timber transportation, use of power saws, illegal charcoal burning and transportation, and extortions, among others. The use of ICT in monitoring the forestry chain of custody increases civic consciousness and vigilance over forest resources as observed around Bugoma, Matiri, and Wambabya Forest Reserves, among others.
The other community interventions have been engagement of Collaborative Forest Management (CFM) groups and Communal Land Associations (CLAs):
x CODECA – engaged 3 CLAs, conducted boundary reopening and planted live forest boundary markers with communities in Budongo Sub-county, Masindi district. Once community members are involved in boundary demarcation, they will always remember the grid points and this helps in reopening of the boundaries in case of alteration by encroachers.
x CRIP – engaged communities in Jinja, Kamuli and Buyende Districts to reduce forest fires in established forest plantations.
x ECO – supported the Local Environment Committees of Busi, Jagusi in Mukono and Nabilatuk & Lolachat (Nakapiripirit district) to develop bye-laws with specific interest to benefit forest adjacent communities.
x The Jane Goodall Institute trained 10 CFM and community group members around Budongo and Kalinzu Central Forest Reserves respectively, in the use of mobile technologies for forest monitoring. Consequently regular joint forest patrols with NFA and the CFM groups have been revived and this is empowering communities to have a say over the resource.
x SWAGEN has supported the CFM group in Rwoho to guard Rwoho Central Forest Reserve in partnership with NFA officials.
x IUCN supported communities in enhancement of restoration actions and reduction of forest degradation on community lands surrounding landscapes of Agoro-Agu and Mt Elgon in Northern and Eastern Uganda, respectively.

Uganda Water and Environment Sector Performance Report 2015
183
13.3.4 Capacity Building
Capacity building in forestry management and related practices was carried out by various CSOs; details are provided in Table 13.1.
Table 13.1 Capacity Building and Training in Forestry Management in FY 2014/15
Number trained Category Thematic area of training Responsible institution 240 Forest user Groups Grafting fruit trees AUPWAE
4,503 Farmers Sustainable Agriculture Approaches CAPCA
2 Communal Land Associations (Groups) Forest Tenure CODECA
2 Private Forest Owners Forest Management Planning CODECA
30 Farmers Tree Nursery establishment ECO
3 CFM Groups Apiculture as a low-impact forest activity JGI
64 forest monitors, NFA staff and CFM groups
use of mobile technologies for monitoring threats to chimpanzee habitats
JGI
120 Farmers Environment management skills LIPRO
13.3.5 Policy, Planning, Lobbying and Advocacy Engagements at District and National Levels
ENRCSOs continuously held policy dialogues with parliamentarians, academia, private sector, government and the general public on topical forestry issues like resources allocation, governance of sector institutions, and the integration of ENR in National Development Plans and District Development Plans. Specific results of these engagements include:
x CARE facilitated Otuke District Local Government to develop an ordinance on environment and natural resources.
x ACCU held strategic meetings with NFA, FSSD and law enforcement bodies with a view to increase responsiveness in handling forestry crime.
x AUPWAE held 3 multi-stakeholder workshops at district level for 120 district and community members aimed at enhancing gender in natural resources management.
x IUCN conducted meetings on REDD+ Gender Mainstreaming and Safeguards in collaboration with the Ministry of Water and Environment.
x UTGA has continuously engaged government and local governments to promote commercial forestry in the country.
13.3.6 Research, Studies or Surveys
Various organisations conducted studied related to forestry management, as detailed in Table 13.2.
13.3.7 Media Engagement
Over 90% of the ENRCSOs spent part of their resources in media engagements aimed at informing the public about the need to refocus attention towards protection of environment and natural resources. The most outstanding innovation is by ACCU, which developed animated messages to be shared on the social media to stop the practice of possession of land titles in forest reserves.

Uganda Water and Environment Sector Performance Report 2015
184
Table 13.2 Research and studies conducted by CSOs in Forestry Management in FY 2014/15
Organisation Research/study Purpose
CARE Mapping indigenous tree species and their uses in Otuke District.
Information sharing, reference and awareness raising in the community
CARE Impact of forest land conversion on food security to the forest adjacent communities
Reference material for project implementation
CARE/WWF Forest product taxation - options for Uganda
Influencing policy on taxation of forest products
ACCU
Investigative research on the Illegal Possession of land titles in Central Forest reserves
Profiling illegal land titles, exposing connivances
AUPWAE
Global Comparative Study on Forest Tenure and Forest Dependent Communities: Study areas in Uganda: Lamwo, Kibaale and Masindi.
Shape forest tenure and governance in Uganda
UCSD
How can a tale of two carbon projects inform Uganda’s developing REDD+ strategy?
Learn lessons from early-established carbon forestry projects
UTGA Piloting certification of small and medium tree planters for group certification using the Modular Approach
Shaping investment decisions in tree planting
IUCN
National Restoration Opportunity Assessment for forest and landscape restoration that contributes to multiple sustainable development objectives
Informing forest restoration initiatives
13.4 CSO Achievements in the Wetlands Sub-sector
13.4.1 Contribution to Wetlands Management
IUCN supported the district local governments of Mbarara, Sheema, Ntungamo, Otuke, Lira, and Alebtong to restore and demarcate wetland and river buffer areas within Rwizi and Aswa-Agago sub-catchments. A total of 187 hectares of wetland were restored and 168km of river buffer areas demarcated using sisal and other local materials in these respective catchments. This was done in partnership with Victoria and Upper Nile Water Management Zones.
In addition, IUCN facilitated a monitoring mission by Wetlands Department staff to restored wetland systems of Nyakambu (Sheema and Mbarara districts), Kibingo-Bujaga-Kashasha (Mbarara), Nyakaikara - Nkongoro-Bujaga (Mbarara), and Nyaruteme-Itojo (Ntungamo) to ensure wetland guidelines are adhered to. This was done in partnership with the Water Management Zone for the Central Region (Victoria WMZ).
13.4.2 Awareness and Sensitisation on Wetlands Management and Wise Use
CARE facilitated and conducted awareness and sensitisation on sustainable and wise use of wetlands in Otuke District. These meetings were attended by over 705 people (417 male and 288 female).
BIRUDO carried out puppet theatre performances in villages along shores of Lake Albert targeting fishermen with a view to reduce wastage along the Lake.
IUCN facilitated a radio campaign program with Radio West to sensitize communities and the general public on wetland management. The programs focused on the benefits of wetland management and restoration with lessons drawn from Rwizi catchment management planning. IUCN also produced a

Uganda Water and Environment Sector Performance Report 2015
185
video entitled Stewards Rising, which highlighted approaches and achievements in water and wetland management in the Upper Aswa-Agago sub-catchment.
13.5 CSO Achievements in the Environment sub-sector
13.5.1 Environment Management
“A Rocha Uganda”, CAPCA, ECO, Tree Talk, ARC, LEU, EMLI, UWS, CSCO, Nature Palace have reached out to schools on solid waste management, recycling of biodegradable waste into the making of charcoal briquettes, recycling of waste paper to make egg trays, crafts and decorations. JGI, through the Forest Corridor Project (FCP) and Kigaaga Environmental Education Project (KEEP) in Hoima District, reached out to 500 community members and over 800 school children on deforestation, water conservation, conservation, agriculture and human-wildlife co-existence. Environmental education booklets, environmental videos and lessons were used to raise awareness.
Environment Alert supported 5 Sub-national coalitions in Hoima, Masindi, Kiryandongo, Kabarole and Buliisa districts to develop and analyse the state of the environment with forests as the entry point and developed advocacy plans for implementation. These included building capacity at local government level to monitor compliance of projects to Environmental Impact Assessments. This has been useful for monitoring of the coalition’s activities implementation and also providing strategic guidance on the subsequent engagements.
The Constitution Right to a clean environment guides ENRCSOs on this service delivery in environment management. Members of the ENRCSOs such as A Rocha Uganda, ARUWE, and ECO have been involved in: a) Training households in making and using fuel briquettes from biodegradable waste. b) Fabrication of fireless cookers (an insulated basket that continues to cook pre-heated food) c) Solid waste management with an emphasis of recycling waste to make crafts. d) Promoting bamboo based green technologies for fuel (bio gas) and solar drying e) Promoting energy saving technologies to reduce the load of gender roles faced by women
especially in the rural areas. f) Training small scale miners in sustainable mining (cover /restore pits dug). g) Promotion of Bio-right Approach for Habitat through (Trees & Grass) Restoration and Protection
with incentivised Livelihoods (Apiary, Goats)
13.5.2 Environmental Awareness and Sensitisation
ENRCSOs engaged in raising environmental awareness on a number of issues and observed that use of local leaders, women and youth in community mobilisation is critical for sensitisation campaigns, whereas stakeholder engagement is very crucial for successful awareness campaigns.
ENRCSOs joined the rest of the world to commemorate the World Environment Day, during which celebrations pubic information and education materials were availed to communities in over 70% of the districts that celebrated this day.
Environment Alert has profiled respective coalition members, conducted member’s forums, participated in the World Environment Day celebrations on 5th June 2015, supported engagements with Local Government leadership and conducted community awareness meetings with forest adjacent communities.
In addition, Environment Alert has participated in technical planning committees and council meetings at the sub-county and district levels by selected members of the coalitions in Kabarole, Masindi and Buliisa Districts. This paved way for engagement of local government officials in conducting public awareness through interactive radio programs on selected district based radio stations in Kabarole (i.e. KRC radio and Voice of Tooro), Masindi (i.e. Bunyoro Broadcasting Services), Kiryandongo (i.e. VCC

Uganda Water and Environment Sector Performance Report 2015
186
FM 103.6 FM), Hoima (i.e. Uganda Community Green Radio) and Buliisa (i.e. King Broadcasting Services).
13.5.3 Community Participation
CARE, Tree Talk, Nature Uganda, built the capacity of community groups in the districts of Otuke, Oyam, Apac, Kole, Kitgum, Lamwo, Gulu, Adjumani, and Nwoya in the use of rural energy saving stoves. Over 90 youth were trained to become Energy Service Providers that construct energy saving stoves. CARE continued to support Village Saving and Lending Associations that are also used as entry points for community sensitisation
In Kampala, Green Hope Uganda (Kawempe division), Wisdom and Insight (Nansana TC), and Urban Cleaners Limited (Rubaga Division) were supported with seed money to obtain trucks for garbage collection with funding support from LEU. In Kawempe Living Earth Energy Developers’ SACCO with support from LEU signed a contract with Kyebando Primary school, Nabagereka Primary school and Old Kampala Primary schools, to construct institutional stoves that use briquettes and supply briquettes.
UCSD engaged communities in Kamuwunga and Ssenyondo landing sites in Kalungu and Mpigi districts, respectively. The campaigns involved community members, district natural environment officers, LC chairs and the beach management unit officers.
13.5.4 Capacity Building
Capacity building and training in environmental management was carried out by various NGOs, as outlined in Table 13.3.
Table 13.3 Capacity Building and Training in Environment Management in FY 2014/15
Number Category Type of capacity building Responsible CSO
22 Teachers Integration of Environmental Education (EE) into school curriculum
JGI
500 School children Tree Nursery establishment and management (at least 12 tree nursery sites were established)
JGI
276 Community members
Functional skills of charcoal briquette production, energy saving stoves production, waste plastic collection and sorting, compost manure and handcraft making
LEU
25 Local government officials
M&E transparency & accountability, good practices in contract management and procurement procedures.
LEU
40 Medium/Small Enterprises Solid waste management services LEU
160 Teachers Managing school woodlots Tree Talk 32 Youth Fabrication of energy saving stoves Tree Talk
CDRN conducted a capacity assessment of ENR CSO Network (180 people consulted during the survey) between the months of January to May. One of the findings is that without proper research, documentation and issue analyses, CSO networks will face an uphill task to convince the respective ministries and bodies to take them seriously. A comprehensive report as well as a Capacity Development Plan has been shared with the respective members for adoption and implementation.
The Uganda Wildlife Society is currently hosting nine interns from Makerere University and Busitema University to enable students gain knowledge and experience to be future leaders and managers of our environment and natural resources.

Uganda Water and Environment Sector Performance Report 2015
187
13.5.5 Lobbying and Advocacy Engagements in Policy and Planning
ENR CSOs have lobbied government and various aspects of environment management which include:
x Green Watch petitioned TOTAL E&P to remove mud cuttings from oil drilling deposited in Pabet East-Purongo Sub-County, Nwoya District.
x EMLI participated at the 15th session of AMCEN in Dusit Thani, Egypt from 2-6 March 2015 at the African group of negotiators that updated Africa common negotiating position on environment and natural resources and African countries adopted an African Common Strategy on combatting illegal trade in wild fauna and flora.
The Uganda Wildlife Society (UWS) is currently engaged in research on factors underpinning technology adoption and lessons for the Albertine Graben. The research will inform future related interventions in the oil era. The UWS is a policy dialogue platform through which members hold national level discussions that inform policy. Between January and June 2015, the Society has convened three policy dialogues in partnership among others with, the National Forestry Authority, Uganda Wildlife Authority, Ministry of Tourism, Wildlife and Antiquities (MTWA), Makerere University School of Forestry, Environment and Geographical Sciences, and the College of Veterinary Medicine on various topical issues on environment and natural resources management. Oil and gas development in the Albertine region, promotion of tourism in West Bugwe, restoration actions for Bugoma Forest Reserve and Wildlife Crimes have been the popular topics of discussion.
13.6 CSO Achievements in the Weather and Climate Change Cub-sector
13.6.1 Climate Change Awareness and Sensitisation in Climate Change
ENRCSOs have been centres of disseminating quarterly weather forecasts to communities. Signed copies of the forecast are also printed and shared on public notice boards, radio stations and distributed through the network. ENRCSOs have also produced visual and educational material like posters for effective communication.
Most of the community education activities carried out in schools and communities have always endeavoured to raise awareness about climate change. In some instances raising awareness has been accompanied by demonstration. For example AUPWAE availed 53 water tanks to 12 groups in Mpigi for purposed of demonstrating rainwater harvesting.
SWAGEN has raised awareness about climate change adaptation and mitigation and funds available for adaptation activities such as the Global Environment Facility, Climate Investment Fund, Green Climate Fund, Post 2015 Development Agenda, and the Climate Agreement that are expected to be signed in December 2015 at COP 21.
EMLI, together with Tree Talk, convened a capacity building workshop on climate change planning and budgeting, which attracted 50 participants including CAOs, DEOs, and DNROs from northern and eastern Uganda. Over 1,500 copies of climate change mainstreaming guidelines were distributed to district local governments (Gulu, Pader, Kitgum, Kumi, Katakwi, Ngora, Kole, Amuru, Bukedea, and Nwoya).
13.6.2 Climate Change Adaptation and Mitigation
IUCN continued promoting an Ecosystem Based Adaptation approach to climate change in Mt Elgon Conservation area. WWF has been active in providing support to local governments, the private sector on ecosystem-based approaches for sustainable financing of tourism and ecosystem services around Mt. Rwenzori.

Uganda Water and Environment Sector Performance Report 2015
188
IUCN, ECO-Trust, Uganda Carbon Bureau, Nature Harness, Tree Talk, UCSD, and JGI have continued building awareness, capacity and governance mechanisms for private forest owners and community groups to plant, grow and protect trees as mitigation measure.
13.6.3 Policy, Planning, Lobbying and Engagements in Climate Change
ENRCSOs have participated in a number of fora for purpose lobbying and advocacy.
x SWAGEN - participated in the UN Open Working Group Sessions 4 and 7, in which the Gender and Climate Change and Ecosystem Goals were drafted and a “language” agreed on gender in the Adaptation, Technology Transfer, Loss and Damage Sections.
x EMLI Developed a briefing paper on COP20 Issues and collaborated with CAN Uganda to convene a CSO Pre-COP 20 Workshop attended by 60 participants.
x ENRCSOs developed and presented a CSO position statement on COP20 to the 10th Climate Change Forum and participated at the COP 20 climate change negotiations in Lima, Peru.
x ENRCSOs convened a CSO Post COP 20 workshop which doubled as the Oil and Gas Nexus workshop to disseminate resolutions from COP 20 but also provide earlier understanding of the oil and gas industry.
13.7 Governance as Cross-Cutting Issue
13.7.1 Civic Education and Stakeholder Awareness of holding Duty Bearers Accountable
Advocates Coalition for Development and Environment (ACODE) in partnership with Joint Effort to Save the Environment (JESE) organised a regional forestry governance forum under the theme “Strengthening the Role of Local Leaders and Actors in Advocating for better Forestry Governance and Improved Livelihoods”.
Green watch undertook civic engagements with 6 Communities in Buliisa, Hoima and Nwoya Districts on rights and issues related to oil and gas. The community sensitisation meetings also provided a platform for locals to interface with their local leaders.
13.7.2 Capacity Building
The Civil Society Coalition on Oil (CSCO), in collaboration with NEMA, and with funding support from Tetra Tech-USAID participated in building capacity of 36 NGOs and CSOs on environment management concerns that will arise during oil and gas production.
In addition, CSCO organised training sessions for their members on oil and gas revenue tracking and management, petroleum development for business people and farmers, and a field learning event in Hoima on enhancing environmental compliance in Uganda’s oil and gas sector.
Green watch conducted 12 awareness raising and sensitisation meetings for communities in Buliisa, Hoima and Nwoya on property rights, environmental and social rights, land rights, human rights, economic rights with respect to oil governance and developments. Related to this, was the training on EIA for local leaders in Butiaba-Buliisa District and impacts of oil developments on wildlife in Nwoya District.
13.7.3 Advocacy Engagements towards Good Governance
The Uganda Forest Governance Learning Group (FGLG), hosted by ACODE held a meeting to discuss forestry sector priorities for FY 2014/15 which included among other on-going initiatives and emerging issues, identification of critical governance challenges and develop consensus and soliciting for input into a regional study on access to justice in the forestry sector in Uganda, Kenya and Tanzania.

Uganda Water and Environment Sector Performance Report 2015
189
CARE is supporting the Civil Society Coalition on Oil website through which information on oil and gas governance is shared. In addition, CARE supported the strategic meetings on human displacement in the Albertine Graben, and transparency and accountability in the oil and gas sector. Green Watch spearheaded an online interactive campaign aimed at protecting Uganda’s elephants from extinction and developed info sheets on land rights with respect to oil governance to empower communities on land rights.
13.7.4 Research, Studies or Surveys in Good Governance
Various study reports were conducted and are available as reference materials at CARE and ACODE in the area of good governance, as listed in Table 13.4.
Table 13.4 Studies by CSOs in the area of good governance, FY 2014/15.
Nature of study Purpose Where to find it
Operationalisation of Uganda’s National Tree Fund
Targeting policy makers and addressing the justification of the Tree Fund
ACODE
Promoting good forestry governance in Uganda; an information sheet
Exploring mechanisms for improving governance of the forest sector in Uganda
AODE
Making public procurement work for sustainable forest use: excluding illegal timber from Uganda’s market
It provides recommendations for the exclusion of illegal timber from the Ugandan market.
ACODE
Review of National Oil Revenue Management Policy.
Provides guidance on management of oil revenue in Uganda
ACODE, Green Watch
Best Practices in the Management of National Oil Companies.
Inform sector actors on options for managing national oil companies
ACODE
13.8 ENR Sub-Sector Challenges and Recommendations – CBO/NGO Perspective
13.8.1 Challenges faced by ENR CSOs
The overall challenges faced by the ENRCSOs are summarised as external challenges and internal challenges in Table 13.5. Thereafter, specific challenges are discussed under their specific section headers.
Table 13.5 Challenges faced by the ENRCSOs in FY 2014/15 Key challenges to ENR-CSO in FY 2014/15 Targeted solutions for effectiveness External The complex political context with limited focus on environment and natural resources, which constrain CSO work.
Engaging the political leadership and technocrats to raise profile and interest in ENR to improve the governance context.
Inability to fundraise especially for CSOs operating at local government level
Build the capacity of CSOs at the LG level to be in position to raise funds for their activities.
Internal Limited understanding of specific engagement processes at national and LG level
Assess and understand policy processes, identify opportunities for policy engagement especially at local government level.
Working in the mode of “opposition” to government, especially so at local government level.
Identifying opportunities of partnering with government without compromising the watch dog role.

Uganda Water and Environment Sector Performance Report 2015
190
Inadequate use of evidence and inaccurate reporting by some members creating doubts among stakeholders.
Scale up relevancy, objectivity, credibility and practical evidence to convince policy makers
Weak culture of sharing experiences and lessons within the network and with other stakeholders.
Explore opportunities for information sharing amongst members; using of social media platforms for information sharing.
Capacity to influence policy at LG level Capacity building for CSOs on how to engage LGs – an opportunity for mentoring by national level CSOs.
Insufficient funding is a major challenge which compromises service delivery in the sub-sector. Furthermore, it results in weak policy implementation and law enforcement. The poor services delivery in the sub-sector is clearly exhibited by the district natural resources departments that are ill-funded. District Forestry Services are non-functional in the majority of the 112 districts of Uganda. Many of these districts do not have substantive environment officers. Additionally, the limited funding to the sub-sector is associated with non-implementation of some legislative provisions such as the National Tree Fund to support tree planting in ecologically fragile ecosystems, and the establishment of Local Environment Committees to oversee environment action planning at lower level local governments among others.
Uganda’s forestry cover reduces by 90,000 Ha annually91. A large proportion of the forest loss and degradation occurs on private land, which constitutes about 64% of the area of Uganda’s forest cover. Some of the key causes of forest loss include: conversion to agriculture, charcoal burning and urbanisation. At this rate of deforestation, without interventions with ambitious targets Uganda’s current forest cover of 3,594,462 Ha92 will be no more in about 40 years (i.e. by 2055). The current population of 36 million people in Uganda results in a high pressure on the environment and natural resources with challenges such as waste management, pollution, and food insecurity among others. The projected population of 130 million people by 205093 will certainly increase the rate of forest loss and environmental abuse.
More than 93% of Ugandans depend on biomass energy derived from forestry. Besides, the household energy needs, institutions like schools, hospitals, bakeries, prisons and brick laying are known to use large amounts of fire wood.
Environment and Natural Resources Governance is poor, largely due to weak institutional capacity for environment and natural resources; lack of transparency and accountability on the part of duty bearers during execution of their roles/responsibilities; weak mechanisms for effective monitoring of individual and institutional performance; and limited support for effective participation of various key actors in the management of environment and natural resources. Subsequently, this results in inefficiencies in delivery of products and services; illegal activities; high corruption tendencies; low revenue generation and increased degradation of the environment.
There is limited research in the sub-sector. Research should be should be demand-driven, targeting to address several research gaps to generate the required information for decision-making during policy and program implementation. Besides this, research should result in appropriate technologies and practices that are required for sustainable management.
13.8.2 Recommendations
In the coming Financial Year 2015/16, ENRCSOs advocate for:
91 See Uganda National Development Plan, 2010/11- 2014/15. Available on http;//npa.ug/development-plans.
92 See also the Uganda National Forest Plan 2013, Available on http;//www.mwe.go.ug.
93 Mari-Lisedu Preez & Romy Chevallier, The Timber Trade in Africa’s Great Lakes: Implications for Uganda and the Region, SAIIA, Policy Briefing 52, July 2012.

Uganda Water and Environment Sector Performance Report 2015
191
(i) An increased financial investment in the sub-sector. The increased funding should be prioritised for the delivery of extension services.
(ii) Political leaders should put a firm stand on encroachment in forest reserves, wetlands, and national parks and take deliberate efforts in monitoring the compliance of the law as one of the mechanisms of promoting effective implementation of policies and programs for improved service delivery and good governance.
(iii) Promoting urban forestry through establishment of green belts in towns and planting trees along road reserves; agroforestry through supporting plating of trees on farm and boundary tree planting. This will augment efforts towards enhancement of the forest cover country-wide.
(iv) Build the capacity of Ugandans on environment management for oil and gas sector, since oil and gas will get depleted, yet tourism will continue being the main source of revenue over the years.
(v) Advance the implementation of the National Reducing Emissions for Deforestation and forest Degradation plus (REDD+) strategy and program, to curb the current high rates of deforestation and forest degradation country-wide, and deliver incentives for responsible forest management by stakeholders.
(vi) Promote livelihood diversification as a mechanism of contributing to food security and also reducing pressure to convert forest land into other land uses.
(vii) Promote catchment approach in the management of natural resources as a mechanism of increasing agricultural productivity through proper land use practices, and sustainable utilisation of forest and wetland resources.
13.9 Key issues for Engagement
The following key issues for engagement by ENR-CSOs can be identified:
x One of the key challenges to ENR management is weak governance. It was agreed that governance will require governance indicators so that it is monitored, and its annual performance in this area assessed. This is what informed the Undertaking number 13 - Develop appropriate indicator(s) for monitoring of good governance in the water and environment subsector by the end of FY 2014/15. There is no evidence that progress has been made in this area. It was also noted that there are no indicators for this component at all levels and it is difficult to measure progress. It is recommended that this Undertaking should be taken seriously during the FY 2015/2016.
x The proliferation of new districts calls for the need to re-evaluate the decentralised environment management policy.
x Considering the above, some undertakings cannot be accomplished in one year considering the limited Budget support to the ENR sub-sector. In addition, departmental budgets are not aligned to the agreed Undertakings and therefore become an implementation dilemma. The Joint Sector Reviews should be utilised to match budgets with undertakings.
x Much of the ENR sub-sector is outside the Joint Budget Support Framework and its Joint Assessment Framework (JAF), and consequently the sub-sector does not have resources to achieve the Vision 2040 and NDP II targets.
x The National Environment Action Plan (NEAP) and the District Environment Action Plans should be guiding investment. However, these are out of date, as is the Sector Investment Plan.
x Law enforcement has remained a challenge with the Environment Protection Force (EPF) being decentralised to meet interests of NEMA, NFA, and Wetlands Management Department as opposed to the original holistic design. There is need to review its performance to ascertain what has changed since its establishment.

Uganda Water and Environment Sector Performance Report 2015
192
x It is critical that Uganda undertakes an economic valuation of its protected areas (specific to Wetlands, Forest Reserves and Wildlife Conservation Areas) in a bid to improve the profile and understand their contribution to GDP.

Uganda Water and Environment Sector Performance Report 2015
193
14 GOOD GOVERNANCE IN WATER AND ENVIRONMENT
14.1 Introduction
The Ministry of Water and Environment (MWE) promotes good sector governance through the multi-sector players working group, which was established in 2006. Good governance is critical in ensuring that services reach the intended population, particularly the poor who have less access to services and less influence to demand for them. The Good Governance Working Group (GGWG) aims to strengthening governance, transparency, accountability, integrity and participation in the water and sanitation sub-sector through identification of governance issues in the sector, and designing measures to combat them.
14.2 Good Governance in Water and Sanitation Sub-Sector
During the financial year 2014/15, the achievements registered are summarised in the next sections.
14.2.1 Update of the Good Governance Action Plan (GGAP)
The members of the GGWG reviewed and updated the GGAP for the period 2014-2017, taking into considerations the recommendations suggested by the survey report94 “Assessing Governance and Integrity in the Water and Sanitation Sub-sector”. The updated Action Plan (see Annex 20) shows that 73% of the actions are on-going, while the other 27% have not yet started; most of the latter are activities beyond MWE’s mandate. For example, no department has a concrete measure of implementing incentives and sanctions. The available sanction to ministry staff is through staff appraisals and reprimand by writing to the staff. Rural water supply department can only inform the Chief Administrative Officer in writing of a District Water Office not meeting performance standards. The Regulation Department and the Urban Water and Sanitation Department are equally challenged by the existing public service regulations. The "Name & Shame" may be the only available incentive/sanction that can be applied.
Table 14.1 Summary of the GGAP performance
Objective No. of actions
Actions on track
Average performance
Governance oversight strengthened 19 13 68% Improvement in procurement processes, project implementation and contract management within the sector
2 2 100%
Access to information and empowerment of water users 5 4 80% Total 26 19 73%
14.2.2 Urban Water Grant Survey
The GGWG embarked on a study to establish the efficiency and effectiveness of the Urban water and sanitation Conditional Grant, taking into account the allocation criteria, the channelling process, utilisation of the grant, its adequacy, auditing compliance and reporting. The outcome will inform the future guidelines and disbursement channels for this conditional grant. The consultant submitted an inception report, and the final report is expected by end of October 2015.
14.2.3 District Water and Sanitation Development Conditional Grant allocation formula
In 2012, the GGWG supported the review of the allocation formula for the District Water and Sanitation Development Conditional Grant. The formula was designed to ensure that the underserved
94 WSS Services (U) Ltd, September 2013

Uganda Water and Environment Sector Performance Report 2015
194
sub-counties catch up with the national service average. The formula takes into consideration population, investment costs of the appropriate technology, and the water supply coverage at sub-county level within a district.
Although the formula was presented to and approved by top policy level in the Sector, the rural water and sanitation department has not yet implemented it, using the argument that the formula brings out drastic changes in the current allocations, which are anticipated to bring numerous complaints from the districts, especially those of which the grant will reduce drastically. At the same time, there is need to ensure that districts of which the grant will increase by the implementation of the new formula are equipped with the relevant resources to absorb the increased income. The Department would thus need to first prepare for the implementation of the new formula and provide for its likely effects, in terms of preparing the districts, and developing new guidelines to match the changes. The Department is currently liaising with the districts and has carried out trainings and awareness workshops for the same, to balance the districts’ expectations with the changes in allocations. In the period under review, activities for Undertaking 8, formulated at the Joint Sector Review, were implemented (see also Section 2.3.1); this Undertaking aimed at implement the revised conditional grant allocation formula for rural water and sanitation in order to improve equity within and between districts by FY 2014/15. It was noted that there is an on-going parallel process of reforming all the Central Government Conditional Grant transfers to District Local Governments by the Ministry of Finance, Planning and Economic Development, which may override the provisions and/or application of the revised water and sanitation grant (and other sector grants) allocation formulae.
14.2.4 Value for Money Audit of District Water and Sanitation Conditional Grant (DWSCG)
MWE requested the Office of the Auditor General to undertake a Value for Money audit of the District Water and Sanitation Development Conditional Grant to assess the economy, effectiveness, and efficiency with which the funds of the Grant have been utilised. An inception meeting was held and the consultant has already embarked on the assignment. The final report is expected to be out in December 2015.
14.2.5 Procurement Planning and Contract Management Training
MWE’s Procurement and Disposal Unit team and the Principle Training Officer implemented a training for 120 officers in procurement planning and contracts management. The training was scheduled into four regional trainings targeting staff from WSDFs, Umbrella Organisations, Ministry Head Quarters, Procurement and Disposal Unit in DWD. The overall objective of the training was to equip staff from WSDFs, technical support units (TSUs), Umbrella Organisations, Water Management Zones (WMZs) and District water officers with relevant knowledge and skills in procurement and contracts management to enable them execute their mandates in accordance with the Public Procurement and Disposal of Public Assets Act, Regulations and Guidelines.
14.2.6 Awareness campaign
Water Sector governance is still challenged by lack of knowledge about governance, its principles and how it can be practiced. The limited awareness is highly attributed to Good governance as a cross cutting issue with no independent activities and direct visible outcomes. To increase sector knowledge in good governance, the GGWG has developed a good governance awareness campaign 2015-2017. The overall goal of the awareness raising campaign is to increase the efficiency and effectiveness of water service provision through awareness of good governance practices. The group has resumed the annual newsletter for the ministry (Water Governance), called applicants for an online governance

Uganda Water and Environment Sector Performance Report 2015
195
awareness training organised by Water Integrity Network (WIN) in collaboration with SIWI Cap-Net95, and has carried out a Training Needs Assessment with the Regulation Department.
14.2.7 Improving WASH governance in schools
The survey96 “Perception survey on Water, Sanitation and Hygiene” that covered 31 schools in six sub-counties in Kibuku and Pallisa Districts found that there is a conflict between the Universal Primary Education (UPE) Policy and its practicability. Article 9 subsection 3 of Pre-primary, Primary and post Primary Act 2008 states that “No pupil or student shall be sent away from school or an institution or denied access to education for failure to pay any contribution” which presents a practical challenge on the schools management on how to manage school sanitation without necessities.
The survey further affirmed that the ambiguity in the ministerial mandate for provision of WASH services in schools remains a major impediment to improving the quality of service delivery. The implementation of WASH programmes in schools is still fragmented among many local and central government institutions/departments and none of them can be legally held accountable. The lack of clarity in institutional mandate for school WASH poses a challenge for long term planning, investment and performance accountability. The findings showed that the pupil stance ratio ranged from 32 pupils per stance to 244 per stance with only two schools meeting the WHO recommended ratio of 40:1, and 22 out of the 31 schools had latrines which were nearly full but with no immediate plans to replace them.
14.2.8 Quarterly meeting
The GGWG has continued with its quarterly meetings. The meetings have not only improved in attendance but also in the level of discussion and time management. This level of activism has consequently resulted into increased ownership of the activities by the group and increase in the number of participating organisations/departments.
14.3 Governance Challenges in the Water and Sanitation Sub-Sector
14.3.1 Financing
A GGWG study to assess the governance and integrity challenges related to implementation of the agreed action plan and regulation within the sector established that the activities are not mainstreamed with sufficient budgetary provision. The issue of lack of dedicated budgets, no institutionalised follow-up mechanisms and integration into other routine or planned activities were the main causes of lack of achievement on some actions. The findings further recommended that the GGWG secretariat should monitor achievements based on targets set by the individual departments and CSOs but this is hindered by the lack of finances to do so. The governance group has embarked on developing a funding proposal for good governance activities, including funding gaps and potential funders for such actions.
14.3.2 Secretariat
The secretariat of the governance group has few staff who have other functional assignments according to their core job descriptions. In FY 2014/15, the GGWG secretariat was supported with a Good Governance Advisor, to strengthen the good Governance secretariat and support the activities of the group, but the absence of an active secretariat limits the potential support. The Regulation
95 Cap-Net is an international network for capacity development in sustainable water management. It is made up of a partnership of autonomous international, regional and national institutions and networks committed to capacity development in the water sector.
96 WaterAid and NETWAS, November 2014

Uganda Water and Environment Sector Performance Report 2015
196
Department has seconded one trainee to the good governance secretariat, but there are still logistical challenges that limit the maximisation of the trainee’s productivity.
14.3.3 Limited mandate
MWE has a limited mandate in enforcing governance in the sector. The ministry is mandated with the provision of water and sewerage services yet the mandate on Local Government management, civil servants regulations, finance distribution and finance audit is given to the Ministry of Local Governments, Ministry of Public Service, Ministry of Finance Planning and Economic Development and Office of the Auditor General, respectively. This limited mandate affects the implementation of direct incentives and sanctions that are very important in enforcing good governance practices. There are still evidenced challenges especially towards the implementation of incentives and sanctions, implementing the rule of law, and governance at lower levels of administration.
14.4 Conclusion and Recommendations Water and Sanitation Sub-Sector
Monitoring and follow-up of governance interventions; There are insufficient resources to cater for monitoring and evaluation of the GGAP. This is further hindered by the limited mandate of the group to enforce governance practices.
Strengthening the Secretariat; there is need to include the support roles to the good governance secretariat to the job description of any appointed staff providing support to the secretariat of the working group, such that actions are part of the assignments to be reported by the selected staff. This will not only act as a motivator to the appointed staff but will also enable accountability of the time allocated to GGWG.
Immediate implementation of the new DWSDCG allocation formula; The GGWG warned the Rural Water and Sanitation Department on the delay in implementing the DWSDCG allocation formula. The process of preparing for the likely effects has gone on for two years, too long a period, yet continuing to subject the underserved to water insecurity. The Department is advised on the risk of the negotiations with the districts and should be firm enough not to be trounced by the powerful districts with better service delivery.
14.5 Good Governance in Environment and Natural Resources Sub-Sector
The Ministry of Water and Environment instituted the Environment and Natural Resources Good Governance Working group (ENR-GG-WG) in 2011, comprising of representatives from the departments within the Directorate of Environment Affairs, environment agencies within the ministry, civil society and academia. The working group developed a governance action plan for the period 2013-2016, which spells out the actions and interventions of the Government of Uganda designed to address the current governance challenges in the Environment and Natural Resources Sub sector.
14.5.1 ENR – Governance Activities implemented during FY 2014/15
The following activities were implemented relating to governance in ENR: a) Training in environmental enforcement; trainings were undertaken for Magistrates, State
Attorneys and Environmental Protection Police Unit from Central and Mid-Western regions of Uganda. The trainings resulted in a strengthened capacity of environmental law enforcement officers to enable them better adjudicate over environmental crimes and disputes.
b) Rebranding the ENR Sub sector; the ENR actors met to review the performance of the ENR subsector, identify challenges and propose a way forward for improved performance and better service delivery at all levels. During the retreat, the players made commitments that all have signed and now embarked on fulfilling those commitments.

Uganda Water and Environment Sector Performance Report 2015
197
c) Commissioning of studies on social, economic and environmental implications of policy actions on restorations and conservation of wetlands.
d) Environmental inspections; inspections were carried out to determine the level of compliance by regulated communities and detection of any violations of the provision of legal regimes. Negotiations with non-compliant entities to develop mutual agreed schedules and approaches for achieving compliance were undertaken. Those adamant to compliance assistance provided to them were taken to courts of law for prosecution.
e) Cancellations of titles, EIAs and payments of fines; those found to be in breach of the conditions of approval in the EIAs, their certificates were cancelled. Some land titles in fragile ecosystems (especially wetlands) have been cancelled. Some tools and equipment were impounded and this was followed with payment of fines to the Environment Fund.
f) Oil Governance; a number of actors, especially civil society participated in oil governance activities and details of the achievements are reflected Annex 21.
14.5.2 Challenges and Recommendations
Governance challenges in the ENR Sub-sector include:
(i) Long court processes, sometimes resulting in disappearance of evidence
(ii) Some environmental degraders become hostile to enforcement officers
(iii) Environmental crime occurs usually at night, during weekends or public holidays when the inspectors are not at work
(iv) Some environmental degraders secure court injunctions deterring environmental inspectors from taking action
(v) Unprofessional behaviour of environmental practitioners with regard to environmental impact studies, and
(vi) Penalties in courts of law are not deterrent enough
To overcome these challenges, more sensitisation of judicial officers is needed to handle court courses expeditiously, as well as provision of adequate resources in terms of personnel and funds. Finally, inspections need to be carried out day and night.

Uganda Water and Environment Sector Performance Report 2015
198
15 KEY ISSUES FOR SECTOR DIALOGUE
15.1 Cross-sectoral issues
There are various challenges experienced in the water and environment sector, which require a holistic approach, as indicated in the following paragraphs.
15.1.1 Water quality
The trend of analysis for bacteriological compliance over the last five years implies increasing contamination of rural drinking water sources. The compliance of rural safe drinking water sources to the national water quality standards, in terms of bacteriological quality, is only 53%, against a target of 95%. Of the different types of rural water sources assessed, protected springs were most contaminated, while deep boreholes were least contaminated.
Also the water quality for piped schemes in the urban areas is low, with a compliance of only 67%. This is linked to some extent to the absence of faecal sludge treatment facilities in most towns and lack of adequate sanitation/sewerage facilities.
According to data from the MWE’s Rural Water and Sanitation Department, the major source of poor water quality in rural areas is from shallow wells. MWE plans to stop financing construction of shallow wells starting next year and to set up stringent measures for siting of wells to avoid contamination.
15.1.2 Key sector indicators
Progress on the golden and platinum indicator values is analysed/collated by the respective MWE departments and sector semi-autonomous agencies overseeing the activities which have an impact on the indicator(s). Until now, the procedure for data collection, source of information, and the responsible department and/or agency and the indicator definitions/calculation methods, as well as frequency of monitoring has not been documented. This has led to more than one sector institution measuring the same indicator with different resulting values, for instance the water quality indicator. Changes in sample size, source of information and interpretation have led to variations in trends and unexplainable changes in indicator values over the years. One of the many examples where the indicator is subject to challenges is the hand-washing indicator: do we measure access to/existence of hand-washing facility, or its actual use with water and soap, as well as position next to a latrine? The need for metadata97 has therefore increasingly been aired both by development partners and implementing organisations.
FY2014/15 has been particular challenging: x All urban water indicators were affected by the gradual takeover of water supplies of rural growth
centers and small towns by NWSC, as this meant rural and small town population coverage shifted to large town coverage. Also, NWSC covers both urban population and rural population served by extensions outside the urban administration, yet golden indicators for large towns are seen as urban indicators. The population served by the various sector institutions need to be clearly demarcated.
x In addition, the average per capita investment cost for new urban water supply is currently determined including also costs for rehabilitations done in that financial year.
x With the targets for Millennium Development Goals set for 2014/15, it has been replaced by the Sustainable Development Goals (SDGs). With Government subscribing to these goals, it is opportune to revise the sector goals and targets to be in line with the SDGs.
x Plans were made in the previous year to introduce an indicator for drinking water access for the urban poor through low-cost public connections within 400m.
97 Data describing the meaning of data

Uganda Water and Environment Sector Performance Report 2015
199
x MWE’s Directorate of Water Resources Management has been discussing the introduction and revision of its indicators to measure the progress made in integrated catchment-based water resources management.
x One of the current indicators for progress made in water for production provision is total cumulative storage capacity, which is a process indicator rather than an outcome indicator. The sector feels that an attempt should be made at estimating outcomes, e.g. total area under irrigation and/or animals served as a result of the provision of water.
x There are some indicators that are largely outside the control of the sector, for instance rural sanitation, school sanitation, and water for production indicators. Other sectors may need to be involved to determine the metadata, or monitor the progress. They may also be monitored outside the framework of the golden / platinum indicators.
x Part of the platinum indicators may need to be monitored on a less than yearly basis, as the process of monitoring is costly, and yearly changes may be small.
Some ideas have been suggested to tackle the urban indicator issues. NWSC is planning a baseline survey, Umbrella Organisations are planning an inventory of all existing piped schemes to feed into the planned new regulation database of small towns, and WSDFs have developed a new guideline for conducting baseline and completion surveys especially to establish the number of additional population served.
15.1.3 Water source protection
Important steps have been made in the implementation of catchment planning and water source protection guidelines. The general purpose of the guidelines is to support water users and stakeholders to identify risks to their water source, and engage the investors and users in reducing the risks in a mutually agreed way. Operationalisation of the 3% cost contribution of new infrastructure for water source protection measures however remains a hurdle to be taken, whereas water source protection is equally important for existing water sources, for which no water source protection plans are in place.
NWSC is currently setting the stage for actual development and implementation of water source protection plans in three of the towns they serve: Arua, Bushenyi, and Mbale Areas. Whereas it is NWSC’s mandate to implement source protection for its investments, the challenge it has is that catchments usually cover large areas. Thus, the catchments are of interest to many stakeholders, some of which the corporation may not necessarily have a mandate to coordinate with. This implies the need for a close collaboration with MWE/DWRM.
15.2 Take-over of management of small town water supply to NWSC
Since 2013, NWSC is gradually taking over the management of town water supplies (from 30 towns by June 2012, to 110 towns by end 2015). The broad aim of the takeover is to improve the operation and maintenance and accelerate the increase in urban water coverage through improvements in performance and expansion of customer base through connections. This has been achieved through improvements in customer care, recruitment and training of staff, purchase of assets and expansion of services to new areas, improved maintenance of infrastructure, and increases in efficiency by reductions in Non-Revenue Water and improvements in billing and collection. In summary, the towns taken over have, as of now, benefitted from the proven managerial policies and systems of NWSC with its access to various economies of scale.
Earlier on, during the Joint Technical Review 2014, it was noted that substantial improvements had are already been made within the towns taken over. The NWSC water consumption tariffs are the same for all towns, thereby cross-subsidising expensive water supplies with cheap water supplies. There are a number of challenges that need to be overcome, including amongst others broken down

Uganda Water and Environment Sector Performance Report 2015
200
infrastructure, unwillingness to hand over some of the schemes by the existing private water operators and/or town councils, land ownership issues and high O&M costs.
The criteria for handover of specific small towns’ water supplies to NWSC exist but have not been strictly adhered to for the transfer process. In order to ensure a smooth transition process, in some cases, the private operator’s staff is taken on by NWSC, and they work hand in hand with counterpart staff from NWSC to accelerate capacity building.
For the new towns specifically, government subsidy to the NWSC will be required in order to improve the viability of the schemes in terms of operational efficiency. The biggest challenge for the urban water supply sub-sector will be that while NWSC will receive an investment subsidy specifically targeting the New Towns taken over by the Corporation, there will still be insufficient funding for O&M in the towns that are not taken over.
The transfer criteria and the whole process of takeovers by NWSC, as well as the guidelines need to be reviewed to ensure that both parties carry out the required activities, such as initiation, justification, due diligence, asset transfer, and post-transfer review.
15.3 Regulation
Although the Regulation Unit was elevated to the Water Utility Regulation Department (WURD) under the new structure of MWE (2014), there is much work to be done to increase its capacity to cope with an ever-increasing workload. This has to be done taking into account the recommendation by the Water Policy Committee to expand WURD’s scope beyond urban utilities to include rural water supply and water for production facilities.
The process of receiving and processing urban utility data for monitoring performance has been inadequate in terms of time and the ability to monitor and deal with performance issues. This has been a primary reason for the Utility Performance Monitoring & Information System (UPMIS) initiative that is already under way, and which is about to commence with development of a pilot version using web-based access, inputs and outputs (reports, charts, queries).
This will not be an event, but more of an evolution process. In the year ahead and beyond, there is nothing more important than testing the UPMIS pilot, developing a working version and implementing UPMIS across, initially, all urban utilities. Nearly all current business processes will need to be reviewed and improved or replaced. Ministerial and stakeholder support will facilitate the progress.
15.3 Future of Umbrella Organisations
The current resources of the Umbrella Organisations (UO) are inadequate to extend their services to all piped water schemes as planned. A typical UO has 6 to 7 professional staff, one single vehicle to be shared, and funding of approximately 50 million UGX per month (13,000 USD, GoU and donor funding combined). This includes the UO’s owns operational costs (salaries, transport etc.) as well as the funds available to support 100 to 160 piped schemes in their area of intervention. A significant capital maintenance and infrastructure renewal fund would be needed to maintain the long-term functionality of existing piped water schemes. User tariffs were never meant to cover asset depreciation.
In FY 2015/16, it is planned to reorganise Umbrella Organisations to become government MWE structures for O&M support, i.e. similar de-concentrated structures like the WSDFs and WMZs. Currently, UOs are constituted as associations of the local Water Boards, a set-up that has led to issues and queries regarding channelling of government to the UOs. Under the new arrangement, the current Umbrella Organisations with their elected statutory bodies (General Assembly, Executive Committee) will continue to exist but their staff will be engaged or contracted by MWE. If resources allow it is planned to recruit Commercial Officers to address the persisting weaknesses in business planning, revenue collection and financial management.

Uganda Water and Environment Sector Performance Report 2015
201
15.4 Stagnation in hand-washing behaviour
The golden indicator to measure progress in hygiene is the “percentage of people with access to hand washing facilities”. The access to hand washing facilities at the toilet has been improving over the years for both rural and urban households as well as schools, but the trends shows a gradual stagnation, and the current indicator values are far below the national target of 50 percent, as is shown in Figure 15.1.
Figure 15.1 Trends in access to hand washing facilities over the last 6 years
15.5 Land issues
Whereas Government is committed to compensate landowners for construction of water facilities, the process of compensating or acquiring land is very lengthy compared to available time for implementation within a financial year. Compensation can only be done after designs have been approved showing the location and size of land required. This challenge is mostly felt in water for production facilities, and new town water supply schemes. Also, land owners are often unwilling to release small plots, for instance for hydrological stations or for prepaid meters, which they consider as fragmentation of land and prefer to negotiate for bigger land strips which are often very expensive.
Despite all the community mobilisation effort been made, acquisition of land by the community is not done in time and thus delays the commencement of construction in many cases; more acceptance and backing of the consequences of adhering to this community obligation is needed e.g. some flexibility in work plans to move to the next project on the approved priority list where communities are not ready for implementation.
A policy brief of Budget Monitoring and Accountability Unit (BMAU) explored the issues of land acquisition for the sector in Uganda (May 2015), and concluded that the Central Government through MWE budgets for land acquisition and compensates land owners for centrally implemented projects. Local governments on the other hand do not have budgets for land acquisition and compensation yet they are required to avail land for the construction of water supply and sanitation components.
Several projects have been delayed due to land acquisition challenges. Practices such as early involvement and sensitization of communities on land issues, involvement of political and cultural leaders has eased the land acquisition burden.
Specific donor requirements for environment and social safeguards (Environmental and Social Impact Assessments and Resettlement Action Plans have to be finalized and implemented before tendering and commencement of construction further delaying absorption of funds
20
25
30
35
40
45
50
09/10 10/11 11/12 12/13 13/14 14/15
%Hand-washing; rural households %Hand-washing; urban households% Hand-wasching; schools trend rural HHtrend urban HH trend schools

Uganda Water and Environment Sector Performance Report 2015
202
15.6 ENR compliance and enforcement challenges The Environment and Natural Resources Sub-sector experience compliance and enforcement challenges at all levels despite the existing legal and institutional framework. The reasons for this are many, and include a (i) continuous disregard to the existing laws and policy with impunity making enforcement extremely difficult, (ii) continued issuing of land titles and EIA certificates by the regulating authorities despite instruction by Cabinet to stop any further encroachment in wetlands abating ENR degradation and abuse, (iii) the unprofessional recommendations from some EIA practitioners in disregard to the integrity of forestry and wetland and coupled by the lack of adherence to EIA certificates of approval by the developers, (iv) the delayed harmonization of institutional roles and responsibilities among institutions creates rooms for encroachers to manoeuvre their way for non-compliance, (v) insufficient human and logistical capacity to handle effective enforcement country wide, (vi) a new degradation strategy where encroachers operate during odd hours at night to dodge enforcement officers, and (vii) delayed investigation, prosecution and conviction by the law enforcement personnel. To ensure compliance to environmental regulations, it is recommended to (i) create an environmental court to fast track execution of the environmental cases, (ii) to stimulate community policing around the hot spot wetlands, to train and retool more Environment Protection Police officers and technical officers on environmental law enforcement strategies, (iii) to have the District Land Board Committees incorporate staff from Wetlands/Environment Officers to provide technical guidance before issuance of land titles, (iv) to harmonize and clearly spell out the mandates of the different ENR institutions, (v) to have approvals of EIAs not to one institution but a team comprising of relevant stakeholders, (vi) to suspend the process in support of the Cabinet directive under minute 114 (CT2014) to cancel all titles in in wetlands and stop any further degradation of wetlands country wide, (vii) to increase human and logistical support to intensify monitoring, enforcement and community policing by the Environmental Protection Police Unit (EPPU), (ix) to increase awareness across all levels, and to finalize the Wetland legislation as wetlands ecosystems are now the most targeted ecosystems for various development activities.
15.7 Forest degradation and Illegal timber transection
MWE has noted the widespread encroachment and degradation of forest reserves through issuing of titles in forest reserves, timber harvesting and charcoal burning without following legal procedure. The allocation of forest reserves by local governments is illegal and contravenes legal regimes governing forest reserves management in Uganda, unless the degazettement of forest reserves has been approved by Parliament.
It is recommended that the enforcement of the Forestry and Tree Planting Act, 2003, and operationalisation of the timber harvesting guidelines should be fast tracked, with increased funding.
15.8 Limited funding for environment management activities
The funding for environmental management is grossly inadequate, as a result of low prioritization of the Sub-Sector. Also, there is a lack of equitable sharing of existing ENR funds between Central and Local Governments, and inadequate transparency and accountability of access and use of the existing funds for environmental management. Major recommendations are that the Tree Fund should operationalised and a Forestry Conditional Grant should be established, that equitable sharing of the National Environment fund under the NEA Cap 153 between local and central sub-sector institutions is ensured, and that bankable ENR projects be developed to attract funding.

Uganda Water and Environment Sector Performance Report 2015
Annex, - 1 -
Annex 1. Information Sources and References
Annex 1.1 Information Sources for the Water and Environment Sector Performance Report 2014
Issued by Document/Database Year of
Issue
Useful Data for SPR
UBOS Statistical Abstract 2014 Population Data for Urban Councils and Rural Sub-Counties
NEMA State of Environment Report
2012 Information on environment and natural resources
MWE Water and Sanitation Sub-Sector Investment Plan (SSIP)
2009 Investments
UBOS Uganda Population and Housing Census (UPHC)
2002 Population Figures
UBOS Uganda Demographic and Health Survey
2011 Access, collection time, burden and water treatment
UBOS National Population And Housing Census 2014
2014 Access
District Local Governments
District Water & Sanitation Situational Analysis Reports
2015 Access, functionality, investment, equity and gender
MWE WSDB Database and NWSC-MIS Database
2015 Access, functionality, equity, gender, outputs, investment, WfP, performance, compliance and water quality
UWASNET NGO Group Performance Report for 2013/14
2015 NGO Inputs and Performance
Environmental Alert
CSO Report for Environment and Natural Resources
2015 NGO Inputs and Performance
Annex 1.2 References
Mari-Lisedu Preez & Romy Chevallier (2012). The Timber Trade in Africa’s Great Lakes: Implications for Uganda and the Region, SAIIA, Policy Briefing 52.
MWE, 2014. Effectiveness of the Community Based Maintenance System for Rural Water Supply and Sanitation Facilities in Uganda
SaafConsult BV, 2011. Water for Production: Review of recent implementation experience and identification of strategic options to support the WfP subsector as a component of the planned Joint Water and Environment Sector Support Programme (JWESSP 2013-18).
UBOS, 2014. National Population and Housing Census – Provisional Results.
World Bank, 2015. Water and Sanitation for the Poor and Bottom 40% in Uganda: A Review of Strategy and Practice since 2006. GWASA, Africa.
World Bank, 2015. Improving Incentives for Reinvesting Revenue and Attracting Private Finance for Water Supply Systems in Selected Small Towns in Uganda –Final Report.

Uganda Water and Environment Sector Performance Report 2015
Annex, - 2 -
Annex 2. Overview of the Sector Institutional Framework
The Water and Environment Sector consists of the water and sanitation sub-sector and the environment and natural resources sub-sector. The water and sanitation sub-sector comprises water resources management and water development. The environment and natural resources sub-sector comprises environmental management; management of forests and trees; management of wetlands and aquatic resources; and climate, weather and climate change.
In July 2008, the Water and Sanitation Sector Working Group (WSSWG) merged with the Environment and Natural Resources Working Group (ENRWG) to form the Water and Environment Sector Working Group (WESWG). The WESWG provides policy and technical guidance for the sector and comprises representatives from key sector institutions.
National Level
The Water Policy Committee (WPC) was established under the Water Act Cap 152 and Water Resources Regulations (1998) of Uganda to assist and advise the Minister of Water and Environment and to promote inter-Ministerial and inter-sectoral coordination over a wide range of water resources management and development issues. The WPC provides an avenue for promoting IWRM at national level and guiding the strategic management and development of water resources of the country. The WPC also coordinates the preparation of national water quality standards; and mediations and undertakes conflict resolution between national authorities on water resources matters.
The Policy Committee on the Environment was established by the National Environment Act Cap 153 as a sub-committee of cabinet. It is chaired by the Prime Minister and consists of ten ministers responsible for natural resources; agriculture and fisheries; finance and economic planning; education; health; land, housing and urban development; local Government; gender and community development; wildlife; and trade and industry. The Policy Committee on Environment provides policy guidance and oversight to the National Environment Management Authority (NEMA). It also harmonises the sectoral roles and responsibilities over the range of environmental issues across its jurisdiction. The committee plays a critical role in integrating environmental considerations into the policies, plans and programmes of the respective sectors and sub-sectors under its jurisdiction.
The Ministry of Water and Environment (MWE) has the responsibility for setting national policies and standards, managing and regulating water resources and determining priorities for water development and management. It also monitors and evaluates sector development programmes to keep track of their performance, efficiency and effectiveness in service delivery. MWE has three directorates: Directorate of Water Resources Management (DWRM), Directorate of Water Development (DWD) and the Directorate of Environmental Affairs (DEA). The mandate of the MWE regarding sanitation and hygiene activities is stipulated in the Memorandum of Understanding that was signed by MoH, MoES, and MWE. The role of MWE is limited to development of public sanitary facilities and promotion of good practices of hygiene and sanitation in small towns and rural growth centres.
MWE is the lead agency for water for production and development of off-farm water facilities. The Ministry of Agriculture, Animal Industry and Fisheries is the lead agency for water use and management of on-farm agricultural water facilities. The mandate of the Ministry of Tourism, Trade and Industry covers water use and management of industries, commerce, wildlife and tourism. The mandate of the Ministry of Energy and Mineral Development is water use and management for hydropower generation.
The Directorate of Water Resources Management (DWRM) is responsible for developing and maintaining national water laws, policies and regulations; managing, monitoring and regulation of water resources through issuing water use, abstraction and wastewater discharge permits; Integrated
Uganda Water and Environment Sector Performance Report 2015
Annex, - 3 -
Water Resources Management (IWRM) activities; coordinating Uganda’s participation in joint management of transboundary waters resources and peaceful cooperation with Nile Basin riparian countries.
While the traditional institutional arrangements for water resources management have been centralised, de-concentration of these functions to regional and local levels has been initiated. Thus, institutional arrangements for management of water resources in Uganda now exist at three levels, namely the national level (DWRM and WPC, mentioned above), the regional and transboundary level, and the local level.
Water Management Zones (WMZ) where some of the central level water resources management functions will be de-concentrated as a way of moving closer to the stakeholders. Uganda has been divided into four WMZs (Victoria, Albert, Kyoga and Upper Nile) based on hydrological (water) basins and this is a regional level top down framework through which water resources will be managed and developed.
Transboundary Level Institutions such as Lake Victoria Basin Commission (LVBC) and Nile Basin Initiative (NBI) under which parts of Ugandan fall. LVBC is a legal entity, linked to the East African Community (EAC), responsible for the sustainable management of the water resources of Lake Victoria basin. Similarly, the Nile Basin Initiative is a transitional institutional arrangement responsible for sustainable management and development of the Nile basin water resources. Some 98% of Uganda lies within the Nile basin and the active participation of Uganda in the Nile Basin Initiative activities is therefore key to the sustainable management and development of Uganda’s water resources.
Catchment Management Organisations (CMOs) which are based on water sub-basins or catchments and form parts of WMZs. CMOs provide bottom up frameworks through which stakeholders participate in water resources management. Catchment based water resources management plans will be implemented however at the district level.
Directorate of Water Development (DWD) is responsible for providing overall technical oversight for planning, implementation and supervision of the delivery of urban and rural water and sanitation services across the country, including water for production. DWD is responsible for regulation of provision of water supply and sanitation and the provision of capacity development and other support services to Local Governments, Private Operators and other service providers. DWD comprises three Departments; Rural Water Supply and Sanitation; Urban Water Supply and Sewerage and Water for Production. The Regulation Department of MWE is regulating urban water supply services. The Water and Environment Sector Liaison Department is mandated to ensure effective planning, coordination and management of the Water and Environment sector.
Directorate of Environmental Affairs (DEA) is responsible for environmental policy, regulation, coordination, inspection, supervision and monitoring of the environment and natural resources as well as the restoration of degraded ecosystems and mitigating and adapting to climate change. DEA comprised the three departments of Environmental Support Services (DESS), Forestry Sector Support Department (FSSD), and Wetlands Management (WMD). DEA works in collaboration with the National Environmental Management Authority (NEMA), the Uganda National Meteorological Authority (UNMA), and the National Forestry Authority (NFA).
Under the National Forestry and Tree Planting Act, 2003, NFA is mandated to manage Central Forest Reserves (CFR) in partnership with private sector and local communities; advisory, research and commercial services on contract; supply of quality seeds; and national forest inventory and other technical services. FSSD is charged with formulation and oversight of appropriate policies, standards, and legislation for the forest sector; coordination and supervision of technical support and training to local governments; inspection and monitoring of local governments; monitor NFA using a performance contract; coordination of the National Forest Plan (the sector’s investment plan) and

Uganda Water and Environment Sector Performance Report 2015
Annex, - 4 -
cross-sectoral linkages; resource mobilisation for the sector; and promotion, public information and advocacy for the sector.
Climate Change Unit (CCU) was created in 2008, directly under the office of the Permanent Secretary within MWE. The main objective for the establishment of the CCU is to strengthen Uganda’s implementation of the United Nations Framework Convention on Climate Change (UNFCCC) and its Kyoto Protocol. In FY 2013/14, the Climate Change Unit has been upgraded to Climate Change Department.
The National Water and Sewerage Corporation (NWSC) is a parastatal that operates and provides water and sewerage services in 66 large urban centres across the country including Kampala. NWSC’s activities are aimed at expanding service coverage, improving efficiency in service delivery and increasing labour productivity. Key among its objectives is to plough back generated revenue surplus for infrastructure improvements and new investments.
The National Environment Management Authority (NEMA) is responsible for the regulatory functions and activities that focus on compliance and enforcement of the existing legal and institutional frameworks on environmental management in Uganda. NEMA’s mandate covers both green and brown issues of environmental management. It oversees the implementation of all environment conservation programmes and activities of the relevant agencies both at the national and local Government level.
The National Forestry Authority (NFA) is responsible for sustainable management of Central Forest Reserves (CFRs), supply of seed and seedlings, and provision of technical support to stakeholders in the forestry sub-sector on contract. NFA is a semi-autonomous business entity and generates most of its own revenues and finances its activities, i.e. NFA’s support is contingent upon payment for its services.
A number of other line ministries have important roles in the sector as described briefly below.
The Ministry of Health (MoH) is responsible for hygiene and sanitation promotion for households through the Environmental Health Division (EHD).
The Ministry of Education and Sports (MoES) is responsible for hygiene education and provision of sanitation facilities in primary schools. It also promotes hand washing after latrine use in the schools.
The Ministry of Gender, Labour and Social Development (MGLSD) is responsible for gender responsiveness and community development/mobilisation. It assists the sector in gender responsive policy development, and supports districts to build staff capacity to implement sector programmes.
The Ministry of Agriculture, Animal Industry and Fisheries spearheads agricultural development. This includes the on-farm use and management of water for production (irrigation, animal production and aquaculture).
The Ministry of Lands, Housing and Urban Development was created in June 2006 and is responsible for the management of land affairs including physical planning, surveys and mapping, valuation, land registration, urban development and housing as well as the Uganda Land Commission.
Uganda Wildlife Authority under Ministry of Tourism, Trade and Industry (MTTI) manages the forests in National Parks and Wildlife Reserves, especially under the Uganda Wildlife Act, 1996 (CAP 200).
The Ministry of Finance, Planning and Economic Development (MOFPED), mobilises funds, allocates them to sectors and coordinates development partner inputs. MOFPED reviews sector plans as a basis for allocation and release of funds, and reports on compliance with sector and national objectives.
The Uganda Water and Sanitation NGO Network (UWASNET) is a national network organisation established in 2000 to strengthen the contribution of NGOs/CBOs in achieving the Water and Sanitation Sector goals. By June 2014, the Network had a membership of 235 NGOs and CBOs. There

Uganda Water and Environment Sector Performance Report 2015
Annex, - 5 -
is a strategic framework for cooperation between local Governments and NGOs for water and sanitation. It guides Local Governments and NGOs on how to jointly plan and implement community mobilisation/software activities with respect to water supply and sanitation. It also provides guidance to districts on how to procure NGOs to undertake software activities.
ENR Civil Society Organisations (CSOs) are active in service delivery and advocacy for sustainable forest sector development. They work especially at the grassroots levels, mobilising and sensitising local people, supporting active local participation in managing forests and trees, providing forestry advisory services, and advocating for the concerns of the underprivileged in national development processes. Most of the local NGOs/CBOs working in the forestry sub-sector operate under an umbrella organisation, the Uganda Forestry Working Group (UFWG), with Environmental Alert housing UFWG’s Secretariat. An estimated 200 Civil Society Organisations (CSOs) are involved environment and natural resources. ENR CSOs are organised under a network that is hosted by Environment Alert. By, membership stood at 120 member organisations.
De-Concentrated Level
In response to the increasing number of districts and the need to provide support to local government, MWE have established a number of deconcentrated entities which are outlined in brief below:
Water Sector Development Facility (WSDF)
WSDF branch offices are currently established in Mbarara (South West); Lira (North); Mbale (East) and Wakiso (Centre). Each office is headed by a senior staff member of the Urban Water and Sanitation Department. In two cases (South West and North) the branch offices are supported by contract employed staff financed through the JPF. The branch office carries out all the contract management functions of the UWSD, including procurement. Simplified functions include:
Implementation management: x Zonal level planning and scheme identification x Feasibility study and detailed design of piped schemes where financed through MWE x Tendering, procurement and supervision of construction contracts x Financial management and reporting
Capacity building: x Support to Town Councils for water authority function, establishment of water and sanitation
boards and selection/appointment of private operators x Support to UOs
The head of the WSDF branch office is delegated as the accounting officer for the funds under their responsibility. A government bank account is set up to receive funds and enable local disbursement. In two branch offices, a separate bank account has also been set up to receive DP funds from the JPF.
The WSDF branch office in South West has piloted different approaches to the management and supervision of investments in Small Towns and RGCs and developed an interim operations and procedures manual that has now been adopted by MWE as a national manual.
Technical Support Units (TSU)
TSUs were established in 8 locations in 2002 with a ninth being established for Karamoja in 2009. At present there are approximately 35 professional staff employed in the 9 units. The TSUs were established to build capacity at the districts following decentralisation of rural water supply and sanitation and the channelling of government grants to the sub-sector via the DWSCG. Simplified functions of the TSU include:
x Quality assurance x Monitoring of adherence to guidelines, standards

Uganda Water and Environment Sector Performance Report 2015
Annex, - 6 -
x Capacity building of local governments x Planning, budgeting and reporting x Procurement and contract management x Financial management and reporting x Software activities implementation including establishing management structures at user
levels x Sanitation and hygiene promotion x Support to record keeping, management information systems including the WATSUP x Promotion of coordinated capacity building including inter-district efforts x Promotion of effective private sector use x Support to local governments and NGOs in service provision and IWRM
The TSUs were intended to be temporary and to gradually withdraw from well performing districts. The TSU functions were originally contracted out to private sector companies and/or NGOs but more recently the staff have been hired on individual contracts by the MWE and paid through the JPF. Over time, TSU’s roles have also expanded to provide support to RGCs and also water resources and water for production.
Umbrella Organisations (UOs)
Umbrellas Organisations are Uganda’s model to support local Water Authorities, Water Boards and scheme operators in providing sustainable piped water supply services. They were created in recognition of the fact that often local capacities are insufficient to ensure effective asset management, preventive maintenance, sufficient revenue collection and water quality monitoring. The model, which had been successfully piloted in South West Uganda since 2001, was subsequently rolled out and covers today all regions of Uganda. The six regional Umbrella Organisations are based in Kabale (South West), Kyenjojo (Mid-West), Wakiso (Centre), Lira (North), Mbale (East), and Moroto (Karamoja). Together the UOs have about 380 member schemes (excluding those that are still under construction). However, it has been decided that UOs should provide support to all piped water schemes outside of NWSC jurisdiction, which increases the number of schemes to be supported to at least 950. The UO’s current resources are insufficient to extend their services to all these schemes, many of which are not metered, do not have regular revenue collection and require rehabilitation.
UOs provide on-demand O&M backup support as well as training, technical advice and managerial support, planning and supervision of rehabilitation and extension works as well as regular water quality monitoring. They channel conditional GoU grants for major repairs, rehabilitation and extension works. Most UOs have also developed credit and/or savings schemes for their member schemes and keep a stock of frequently needed spare parts.
At present UOs are established as associations of the local Water Authorities/Boards, with the legal status of a Company limited by guarantee. The Executive Committee of each UO formally employs the permanent staff of the UO Secretariats, even though the funding of both UO operations (including salaries) and of the services they provide to member schemes is essentially public. Only a small fraction of the costs (less than 5%) is covered by membership fees.
This setup has led to misunderstanding and queries regarding the UO’s status as “private” organisations, even though they are in fact associations of local government bodies. It is therefore planned to reorganise the UO Secretariats as deconcentrated government units for O&M support under the MWE/UWSSD. Under this new arrangement the bottom-up structures of the UOs (General Assembly, Executive Committee) would continue to exist as “Umbrella Associations of Water Boards” whereas day-to-day support operations would become a government responsibility.
Water Management Zones

Uganda Water and Environment Sector Performance Report 2015
Annex, - 7 -
WMZ offices are operational in the 4 WMZs (Victoria, Albert, Kyoga and Upper Nile). The main purpose of the WMZs is to de-concentrate WRM closer to where action is needed in order to mobilise local community efforts and other stakeholders to achieve catchment-based IWRM and to ensure effective coordination with other water resources related activities being implemented at district level such as environment, forestry and water supply.
Simplified functions are shown include: x Zonal assessment of permit applications; x Zonal compliance monitoring x Regional level laboratory services x Zonal monitoring and data management; x Zonal water resources mapping, assessment and planning; x Contribution to national assessments, planning and coordination including environmental
impact assessments and international waters x Support to catchment stakeholders in a local water resources management
WMZs are supposed to be a permanent operational arrangement for effective water resources management and development. Catchment-based Water Resources Management (WRM) activities have been mainly undertaken on a pilot basis and thus the WMZ offices are not yet fully operational.
District Level
Local Governments (Districts, Town Councils, sub-Counties) are empowered by the Local Governments Act (2000) to provide water services and manage the Environment and Natural Resource base. Local Governments, in consultation with MWE appoint and manage private operators for urban piped water schemes that are outside the jurisdiction of NWSC. The District Water Offices manage water and sanitation development and oversee the operation and maintenance of existing water supplies in the District.
The District Environment Office is responsible for the environment and natural resources. District Forest Services of local Governments (LGs/DFS) manage Local Forest Reserves (LFRs); carry out support and quality control of forest extension for private and community forests; develop and enforce bye-laws; strengthen forestry in production and environment committees and district development plans; as well as land administration, surveying, and approval of Community forests; among others.
Local Governments receive funding from Central Government in the form of Conditional Grants as follows:
x District Water and Sanitation Development Conditional Grant (DWSDCG). x Environment and Natural Resources Conditional Grant to cover forestry, wetlands and lands
was established in 2004. Although funds for forestry were allocated for FY 2004/05, it was not accessed and has subsequently ceased. There is limited funding for wetlands management under the grant.
Local Governments can also mobilise additional resources for water and environment related activities.
The District Environment Committee coordinates the activities of the district councils relating to the management of the environment and natural resource base.
District Water and Sanitation Coordination Committees (DWSCCs) have been were established in all districts. The committee provides a platform for coordinating and overseeing the activities of the water and sanitation sector in the Local Governments and strengthens collaboration across sectors and between different players. The DWSCC comprises all political leaders, relevant district

Uganda Water and Environment Sector Performance Report 2015
Annex, - 8 -
departments (District Water Office, the Planning Office, the District Directorate of Community Based Services, the District Finance Office, the District Directorate of Health Services, and the District Education Office), NGOs and development partners at the Local Government Level.
Private Sector
Private sector firms undertake design and construction in water supply and sanitation under contract with local and central Government. Private hand pump mechanics and scheme attendants provide maintenance services to water users in rural and peri-urban areas. Private Operators manage piped water services in small towns and rural growth centres. Private Forest Owners, including Local Communities with registered forests, are legal forest management authorities. In addition, the private sector plays an important role in terms of commercial tree plantation development as well as promoting wood based industries and trade.
Community Level
Communities are responsible for demanding, planning, contributing a cash contribution to capital cost and for the O&M of rural water supply and sanitation facilities. A water user committee (WUC), which is sometimes referred to as a Water and Sanitation Committee (WSC) should be established at each water point.
With respect to the environment and natural resources, over the years, community members have been encouraged to form user groups at local level, i.e. Beach Management Units (BMUs), Forestry Resource User Group, Land Committees and Environment Committees. These structures are intended to enable oversight of the environment and natural resources at the lowest level.

Uganda Water and Environment Sector Performance Report 2015
Annex, - 9 -
Annex 3. Implementation Schedule for WATSUP 2
Phase ID Phase description Output Duration (weeks)
Period
D1 Desk study for design Data collection plan 2 17-Nov-14 01-Dec-14 D2 Comparing databases Lists with wrong,
duplicated, and missing sources in WSDB
8 17-Nov-14 12-Jan-15
D3 Preparing field work data collection tools
A set of 8 tools to be used for data improvement
10 12-Jan-15 23-Mar-15
D4a Pilot study I (3 DWD teams in 1 District, 3 DWD teams in 3 Districts)
Try out of data collection exercise and suggestions for adaptations
4 10-Feb-15 07-Mar-15
D4b Pilot study II In 7 districts
Try out adapted data collection exercises
4 04-May-15
28-May-15
D5 Fieldwork (8 DWD teams in 100 Districts for training and data collection / verifications)
Updated information for WSDB
12 09-Mar-15 01-Jun-15
D6 Data processing All information entered in WSDB
9 30-Mar-15 30-May-15
D7 Dissemination / Training Stakeholders aware of information and DWO trained in updating information
5 06-Jun-15 12-Jul-15
D8 Digital Atlas Production (web based and pdf version)
Digital, web based atlas and in pdf format based on a new database system with improved database interface for report generation
35 10-Jan-15 10-Sep-15
Activities
The databases of Busoga Trust, Drillcon, DWRM, GOAL, Link to Progress (LTP), Ruwasa, Sumadhura, TGS Water Ltd., UNICEF, and World Vision were analysed and all sources featuring in these databases but missing in the WSDB were listed for verification during the field training and visits.
Tools have been prepared for data collection, and 35 GPS receivers were procured for the training and data collection.
A pilot study was carried out in February 2015, to test the tools that had been designed have been designed for the data improvement exercise. The pilot study consisted of a training of the sub-county staff and 12 DWD staff in collecting the missing information and the actual field work in four districts (Iganga, Kyenjojo, Buikwe and Rukungiri). The results of the pilot study were collected and reviewed. Some data was missing and some forms were not submitted to DWD. Follow-ups were needed to get all missing data.
Due to the amount of encountered challenges, it was agreed to run a second pilot before proceeding with the national data collection. With adapted tools and more in-depth orientation of the SC staff, a second pilot was rolled out in Mukono, Kamuli, Kaliro, Masaka, Kayunga, Buyende and Lwengo Districts in May and June 2015.

Uganda Water and Environment Sector Performance Report 2015
Annex, - 10 -
Annex 4. Formulas Used for Calculating Indicators in MIS
Access
1. Calculate the number of people served based by multiplying the number of sources per type with the number of users given for each type in Table 1.3.
a. For Point water Sources 𝑷𝒐𝒑𝑷𝑾𝑺 = 𝑷𝑺 ∗ 𝟐𝟎𝟎 + 𝑺𝑾 ∗ 𝟑𝟎𝟎 + 𝑫𝑩𝑯 ∗ 𝟑𝟎𝟎 + 𝑲𝑺𝑲 ∗ 𝟏𝟓𝟎 + 𝒀𝑻𝑭𝟏 ∗ 𝟏𝟓𝟎
+ 𝑹𝑯𝑻𝒔𝒎𝒂𝒍𝒍 ∗ 𝟑 + 𝑹𝑯𝑻𝒃𝒊𝒈 ∗ 𝟔
Where PWS= Point Water Source, Pop=population, PS=protected spring, SW=shallow well, DBH = deep borehole, KSK=kiosk, YTF=yard tap for public use, RHT=rainwater harvesting tank
b. For Piped Schemes 𝑷𝒐𝒑𝑷𝑺 = 𝑯𝑪 ∗ 𝟔 + 𝑰𝑪 ∗ 𝟏𝟎𝟎 + (𝒀𝑻𝑭𝟐 − 𝒀𝑻𝑭𝟏) ∗ 𝟐𝟒
Where: Pop=population, PS=piped scheme, HC=house connection, IC=institutional connection, YTF=yard tap for public use
c. For NWSC served areas a total population served figure is provided by NWSC on scheme level (PopServedNWSC). The covered sub counties, resp. counties were identified and the served population was assigned/apportioned if needed.
2. Calculate the total number of people served on SC level. If NWSC provided data it is assumed that it took over the piped scheme and the piped scheme data is not considered.98
𝒕𝒐𝒕𝒂𝒍 𝒔𝒆𝒓𝒗𝒆𝒅𝑵𝑾𝑺𝑪 𝒔𝒖𝒃𝒄𝒐𝒖𝒏𝒕𝒚 = 𝑷𝒐𝒑𝑷𝑾𝑺 + 𝑷𝒐𝒑𝑺𝒆𝒓𝒗𝒆𝒅𝑵𝑾𝑺𝑪
𝒕𝒐𝒕𝒂𝒍 𝒔𝒆𝒓𝒗𝒆𝒅𝒐𝒕𝒉𝒆𝒓 𝒔𝒖𝒃𝒄𝒐𝒖𝒏𝒕𝒚 = 𝑷𝒐𝒑𝑷𝑾𝑺 + 𝑷𝒐𝒑𝑷𝑺
3. Divide the number of served people by the total population on sub county level. If the result is higher than 95% it is capped (capped is assumed maximum access which is 95%, so if ratio below is >95% still 95% will be reported).
𝑨𝒄𝒄𝒆𝒔𝒔 𝑺𝑪 = 𝒕𝒐𝒕𝒂𝒍 𝒏𝒖𝒎𝒃𝒆𝒓 𝒐𝒇 𝒑𝒆𝒐𝒑𝒍𝒆 𝒔𝒆𝒓𝒗𝒆𝒅 𝒂𝒄𝒄𝒐𝒓𝒅𝒊𝒏𝒈 𝒕𝒐 𝟐.𝒕𝒐𝒕𝒂𝒍 𝒑𝒐𝒑𝒖𝒍𝒂𝒕𝒊𝒐𝒏
4. Calculate the capped population served on county level. This only occurs if capping takes place, otherwise the values from 2 will summed up on county level. If NWSC
98 On sub county level the population served by point water sources is added to the population served from NWSC. This can lead to slightly higher population served because Kiosks and Tap Stands providing water from the NWSC scheme are counted in both data sets.

Uganda Water and Environment Sector Performance Report 2015
Annex, - 11 -
provided data for a Municipality it is assumed that it serves the entire county and the data calculated with the WSDB is ignored.99
𝒕𝒐𝒕𝒂𝒍 𝒔𝒆𝒓𝒗𝒆𝒅𝑵𝑾𝑺𝑪 𝒄𝒐𝒖𝒏𝒕𝒚 = 𝒔𝒖𝒎(𝑺𝑪 𝒑𝒐𝒑𝒖𝒍𝒂𝒕𝒊𝒐𝒏) ∗ 𝟗𝟓%
𝒕𝒐𝒕𝒂𝒍 𝒔𝒆𝒓𝒗𝒆𝒅𝒐𝒕𝒉𝒆𝒓 𝒄𝒐𝒖𝒏𝒕𝒚 = 𝒔𝒖𝒎(𝑺𝑪 𝒑𝒐𝒑𝒖𝒍𝒂𝒕𝒊𝒐𝒏 ∗ 𝑨𝒄𝒄𝒆𝒔𝒔 𝑺𝑪)
5. On district level the population served based on capped access is summed up:
𝑨𝒄𝒄𝒆𝒔𝒔 𝑫𝒊𝒔𝒕𝒓𝒊𝒄𝒕 = 𝒔𝒖𝒎 𝒕𝒐𝒕𝒂𝒍 𝒔𝒆𝒓𝒗𝒆𝒅𝒄𝒐𝒖𝒏𝒕𝒚𝒔𝒖𝒎(𝑺𝑪 𝒑𝒐𝒑𝒖𝒍𝒂𝒕𝒊𝒐𝒏)
Where: Pop=population, PS=piped scheme, HC=house connection, IC=institutional connection, YTF=yard tap for public use, SC=sub county
Functionality Functionality is the number of functioning improved water sources divided by the total number of improved water sources. Only point water sources are considered (all beside of dams or valley tanks). A separate WfP Functionality is calculated considering dams and valley tanks only. On district level the calculation is done twice counting sources from urban and rural sub-counties separately. With this method a rural and an urban functionality on point sources is calculated. This urban functionality as calculated through the WSDB is different from the golden indicator “urban functionality” which is described and is provided by the urban department in the ……………...
Formula 1. count all functional PWS 2. count all PWS 3. calculate ratio
𝑭𝒖𝒏𝒄𝒕𝒊𝒐𝒏𝒂𝒍𝒊𝒕𝒚 = 𝑺𝒖𝒎 𝒐𝒇 𝒇𝒖𝒏𝒄𝒕𝒊𝒐𝒏𝒂𝒍 𝒑𝒐𝒊𝒏𝒕 𝒘𝒂𝒕𝒆𝒓 𝒔𝒐𝒖𝒓𝒄𝒆𝒔𝒔𝒖𝒎 𝒐𝒇 𝒇𝒖𝒏𝒄𝒕𝒊𝒐𝒏𝒂𝒍 + 𝒔𝒖𝒎 𝒐𝒇 𝒏𝒐𝒏 𝒇𝒖𝒏𝒄𝒕𝒊𝒐𝒏𝒂𝒍 𝒑𝒘𝒔
Sources marked as “Functional (not in use)” (Fniu) are considered as functional if the downtime is less than 5 years or not specified.
Equity Equity determines the deviation between the numbers of persons per improved water point at sub-county level. Therefore the sub-county and district population is divided by the number of sources in that sub-county resp. district. The equity is then the difference between the district and sub-county ratios. National and district equity are also based on sub-county level and give the average of considered sub-counties.
Formula � count all point water sources per rural SC � count all point water sources in rural SC per district
99 This can lead to lower population served because there might be people in a county which still depend on rural water supply/point water sources. They are not counted here.

Uganda Water and Environment Sector Performance Report 2015
Annex, - 12 -
� count all population of rural SC per district � calculate sub-county equity
𝑬𝒒𝒖𝒊𝒕𝒚 𝑺𝑪 = 𝒓𝑷𝒐𝒑𝑫𝒊𝒔𝒕𝒓𝒊𝒄𝒕
𝒔𝒖𝒎 𝒐𝒇 𝒅𝒊𝒔𝒕𝒓𝒊𝒄𝒕 𝑷𝑾𝑺 −𝑷𝒐𝒑𝑺𝑪
𝒔𝒖𝒎 𝒐𝒇 𝑺𝑪 𝑷𝑾𝑺
� calculate district equity 𝑬𝒒𝒖𝒊𝒕𝒚 𝒅𝒊𝒔𝒕𝒓𝒊𝒄𝒕 =
𝒔𝒖𝒎 𝒐𝒇 𝒂𝒍𝒍 𝒅𝒊𝒔𝒕𝒓𝒊𝒄𝒕′𝒔 𝒔𝒖𝒃 𝒄𝒐𝒖𝒏𝒕𝒚 𝒆𝒒𝒖𝒊𝒕𝒊𝒆𝒔𝒕𝒐𝒕𝒂𝒍 𝒓𝒖𝒓𝒂𝒍 𝒔𝒖𝒃 𝒄𝒐𝒖𝒏𝒕𝒊𝒆𝒔 𝒊𝒏 𝒕𝒉𝒆 𝒅𝒊𝒔𝒕𝒓𝒊𝒄𝒕
� calculate national equity 𝑬𝒒𝒖𝒊𝒕𝒚 𝒏𝒂𝒕𝒊𝒐𝒏𝒂𝒍 =
𝒔𝒖𝒎 𝒐𝒇 𝒂𝒍𝒍 𝒔𝒖𝒃 𝒄𝒐𝒖𝒏𝒕𝒚 𝒆𝒒𝒖𝒊𝒕𝒊𝒆𝒔𝒕𝒐𝒕𝒂𝒍 𝒓𝒖𝒓𝒂𝒍 𝒔𝒖𝒃 𝒄𝒐𝒖𝒏𝒕𝒊𝒆𝒔
Remarks � Only rural sub-counties are considered, hence population and
sources are only counted from those sub-counties. � Sub-counties with only one or two sources are not considered,
these are new sub-counties. The new sub counties are not yet part of the set of administrative units that are being used in the database, and including these sub-counties with very low number of sources (high equity) would create an unrealistic picture.
� District Equity is the simple average of SC equity figures and not the difference from district average to national ratios.
Management The management indicator gives the percentage of communally managed water sources (PS, SW, and DBH) in rural areas with a functioning Water Source Committee
Formula 1. count all springs, boreholes and shallow wells which are
a. functional b. in a rural SC c. communally managed d. and where a WSC is established
2. of those sources count the ones which have a functioning WSC (the WSC collects fees or undertakes repairs or holds meetings or cleans environment/sanitation around the source)
3. calculate the ratio
𝑴𝒂𝒏𝒂𝒈𝒆𝒎𝒆𝒏𝒕 = 𝒕𝒐𝒕𝒂𝒍 𝒄𝒐𝒎𝒎𝒖𝒏𝒂𝒍𝒍𝒚 𝒎𝒂𝒏𝒂𝒈𝒆𝒅 𝒔𝒐𝒖𝒓𝒄𝒆𝒔 𝒘𝒊𝒕𝒉 𝒂 𝒇𝒖𝒏𝒄𝒕𝒊𝒐𝒏𝒊𝒏𝒈 𝑾𝑺𝑪𝒕𝒐𝒕𝒂𝒍 𝒄𝒐𝒎𝒎𝒖𝒏𝒂𝒍𝒍𝒚 𝒎𝒂𝒏𝒂𝒈𝒆𝒅 𝒔𝒐𝒖𝒓𝒄𝒆𝒔 𝒘𝒊𝒕𝒉 𝒆𝒔𝒕𝒂𝒃𝒍𝒊𝒔𝒉𝒆𝒅 𝑾𝑺𝑪
Remarks � Only springs, boreholes and shallow wells are considered.
RHT, PSP, KSK and YTF1 were taken out in 2013 calculation. � Only functional (in use) sources are considered � Only rural sub-counties are considered � Only communally managed sources are considered � Only sources with a WSC are considered. In the 2010 Atlas all
communally managed sources were considered.

Uganda Water and Environment Sector Performance Report 2015
Annex, - 13 -
� As functional WSC only WSC were considered which collect fees, undertake repairs or hold meeting. This was changed in 2015 to also consider WSC as functional if they clean the environment/sanitation around the source only.
Gender The gender indicator is restricted to communally managed water sources in rural areas and gives the ratio of WSCs with at least one woman in a key position versus the total number of functional WSCs in the same area
Formula 1. count all springs, boreholes and shallow wells which are
a. functional b. in a rural SC c. communally managed d. and where a WSC is functional
2. of those sources count the ones which have a women in a key position of the WSC
3. calculate the ratio
𝑮𝒆𝒏𝒅𝒆𝒓 = 𝒕𝒐𝒕𝒂𝒍 𝒄𝒐𝒎𝒎𝒖𝒏𝒂𝒍𝒍𝒚 𝒎𝒂𝒏𝒂𝒈𝒆𝒅 𝒔𝒐𝒖𝒓𝒄𝒆𝒔 𝒘𝒊𝒕𝒉 𝒂 𝒘𝒐𝒎𝒂𝒏 𝒊𝒏 𝒂 𝒌𝒆𝒚 𝒑𝒐𝒔𝒊𝒕𝒊𝒐𝒏𝒕𝒐𝒕𝒂𝒍 𝒄𝒐𝒎𝒎𝒖𝒏𝒂𝒍𝒍𝒚 𝒎𝒂𝒏𝒂𝒈𝒆𝒅 𝒔𝒐𝒖𝒓𝒄𝒆𝒔 𝒘𝒊𝒕𝒉 𝒂 𝒇𝒖𝒏𝒄𝒕𝒊𝒐𝒏𝒂𝒍 𝑾𝑺𝑪
Remarks � Functional water sources that are not used are not considered. � Gender was calculated from sources with any established WSC
in 2010. This was changed in 2013 to be calculated from sources with functioning WSC only. Both gender indicators are calculated in the database.
� As functional WSC, only WSCs were considered which collect fees, undertake repairs or hold meeting. This was changed in 2015 to also consider WSC as functional if they clean the environment/sanitation around the source only.

Uganda Water and Environment Sector Performance Report 2015
Annex, - 14 -
Annex 5. Formulas Used in Calculations for Access in Urban Centres
1. Calculate the number of actual additional people served through piped schemes in Urban Centres based on data obtained from WSDFs and other urban development projects. Additional refers to the fact that beneficiaries of rehabil itations are not counted since their access to safe water has been improved only but not established. Actual refers to the number being the actual number at time of handover.
𝑷𝒐𝒑𝑨𝒅𝒅 = 𝑷𝒐𝒑𝑵𝒆𝒘𝑻𝑪 + 𝑷𝒐𝒑𝑵𝒆𝒘𝑻𝑩+ 𝑷𝒐𝒑𝑬𝒙𝒕𝑻𝑪 + 𝑷𝒐𝒑𝑬𝒙𝑻𝑩
Where Pop=actual population served, Add=additional, PS=Piped Scheme, New=in new schemes developed, TC=in schemes that serve Town Councils (administrative status time of handover), TB= in schemes that serve Town Boards (administrative status time of handover)
2. Calculate the total number of people served 𝑷𝒐𝒑 = 𝑷𝒐𝒑𝑨𝒅𝒅 + 𝑷𝒐𝒑𝑳𝒂𝒔𝒕𝑭𝒀 − 𝑷𝒐𝒑𝑵𝑾𝑺𝑪
Where: Pop= actual population served, Add=additional, LastFY=already served in last FY, NWSC=handed over to NWSC; note that PopNWSC has been estimated at 10.000 * 0,76 (coverage rate as reported by NWSC) for each of the 44 handed over Centres.
3. Calculate the total number of population in Urban Centres
𝑻𝑷𝒐𝒑 = 𝑻𝑷𝒐𝒑𝑳𝒂𝒔𝒕𝑭𝒀 ∗ 𝟏, 𝟎𝟒𝟖
Where: T=total population in Urban Centres, 4,8%=average urban growth rate
4. Calculate the total number of population in Urban Centres where schemes are operated by NWSC
Sum of population figures according to Census 2014 for all Urban Centres with NWSC schemes, excluding TBs.
5. Calculate the total number of population under DWD
𝑻𝑷𝒐𝒑𝑫𝑾𝑫 = 𝑻𝑷𝒐𝒑 − 𝑻𝑷𝒐𝒑𝑵𝑾𝑺𝑪
Where: T=total population, DWD=under DWD, under NWSC
6. Calculate coverage for Urban Centres under DWD
𝑪𝒐𝒗𝒆𝒓𝒂𝒈𝒆𝑫𝑾𝑫 = 𝑻𝑷𝒐𝒑𝑫𝑾𝑫𝑷𝒐𝒑

Uganda Water and Environment Sector Performance Report 2015
Annex, - 15 -
Annex 6. Financial Sector Performance FY 2014/15
Annex 6.1 Details of On-Budget and Off-Budget Figures and Trends
On-Budgeting Funding - Status and Trend
Financial Year Budget Release Payments % Released
2008/09 183.9 172.46 170.95 93.80%
2009/10 238.44 205.66 191.02 86.20%
2010/11 256.43 200.25 187.25 78.10%
2011/12 281.57 244.01 225.33 86.70%
2012/13 308.27 203.7 198.47 66.10%
2013/14 439.09 386.19 347.96 88.00%
2014/15 444.65 345.717 325.7 78.00%
Sector Off-Budget Component
Budget Release Expenditure % Released
WSS
UWASNET (177 members) 49.3 49.3 49.3 100.00%
NWSC (Internally Generated Rev. & Investment
248.0 248.0 248.0 100.00%
Total WSS Off-Budget 297.3 297.3 297.3 100.00%
ENR
REDD+ 15.73 15.73 100.00%
ENR CSOs REPORT (50 members) 88.52 88.52 88.52 100.00%
Total ENR Off-Budget 104.25 104.25 104.25 100.00%
WSS as % of Total Off-Budget Component
74.04% 74.04% 74.04% 100.00%
ENR as % of Total Off-Budget Component
25.96% 25.96% 25.96% 100.00%
Off-Budget Funding- Status and Trend
Financial Year Budget Release Expenditure % Released
2009/10 79.68 64.35 62.75 80.80%
2010/11 207.77 84.61 84.61 40.70%
2011/12 207.77 84.61 84.61 86.70%
2012/13 73.7 70.01 70.01 95.00%
2013/14 103.66 91.37 91.37 88.10%
2014/15 401.55 401.55 401.55 100.00%

Uganda Water and Environment Sector Performance Report 2015
Annex, - 16 -
Overall Sector Finance
Budget Release Payments % Released
On-
Budg
et
WSS 279.21 189.78 175.68 92.57%
ENRS 69.16 55 54 98.18%
SPS 22.21 29.56 28.39 96.04%
Conditional Grants to LG 67.729 67.729 67.729 100.00%
Conditional Grants to KCCA 6.353 6.353 6.353 100.00%
Total (On-Budget) 444.662 348.422 332.152 95.33%
Off-
Budg
et WSS 297.3 297.3 297.3 100.00%
ENRS 104.25 104.25 104.25 100.00%
SPS 0 0 0
Total (Off-Budget) 401.55 401.55 401.55 100.00%
Ove
rall
Tota
l
WSS+KCCA &CGs 650.592 561.162 547.062 97.49%
ENRS 173.41 159.25 158.25 99.37%
SPS 22.21 29.56 28.39 96.04%
Total (On + Off-Budget) 846.212 749.972 733.702 846.212
% On-Budget 53% 46% 45%
% Off-Budget 47% 54% 55%
Annex 6.2 On Budget Sector Funding FY 2014/15 (UGX Bn)
Vote Vote function
Budget Type
Funding source
Programme /project
Budget Release Expenditure FY 2015/16 projection (million)
MWE Rural Water Supply and Sanitation
Recurrent GoU Rural Water Supply and Sanitation
0.51 0.49 0.49 0.51
Donor 0.00 0.00 0.00 0.00
Development
GoU School & Community Water-IDPs
15.98 12.97 12.94 0.00100
Donor 0.00 0.00 0.00 0.00
GoU 25.94 23.04 22.80 27.94
100 Project closed and funds reallocated under new project-large rural piped water schemes in Northern Uganda.

Uganda Water and Environment Sector Performance Report 2015
Annex, - 17 -
Vote Vote function
Budget Type
Funding source
Programme /project
Budget Release Expenditure FY 2015/16 projection (million)
Donor Support to RWS Project
3.56 9.44 7.68 19.16
GoU Provision of Improved Water Sources for Returned IDPs-Acholi
0.51 0.43 0.40 0.51
Donor 26.00 0.00 0.00 1.56
GoU Solar powered Mini-Piped water schemes
NEW PROJEC
T
0.10
Donor 0.00
GoU Piped water in rural areas
NEW PROJEC
T
18.77
Donor 0.00
GoU Large rural piped water schemes in Northern Uganda
NEW PROJEC
T
0.10
Donor 0.00
Urban Water Supply and Sanitation
Recurrent GoU Urban Water Supply & Sewerage
0.41 0.39 0.38 3.39
Donor 0.00 0.00 0.00 0.00
GoU Urban water regulation
NEW PROGRAMME
0.02
Donor 0.00
Development
GoU Energy for Rural Transformation
0.20 0.13 0.13 0.19
Donor 2.29 0.00 0.00 0.00
GoU Support to small town WSP
4.04 3.98 3.84 4.04
Donor 1.23 0.00 0.00 2.05
GoU Urban Water Reform
0.64 0.58 0.58 2.64
Donor 1.49 1.19 1.19 1.08
GoU Water and Sanitation Devt Facility-North
1.57 1.58 1.58 3.97
Donor 15.54 13.79 13.93 18.54
GoU Water and Sanitation
1.48 1.83 1.83 4.98
Donor 9.15 0.00 0.00 15.50

Uganda Water and Environment Sector Performance Report 2015
Annex, - 18 -
Vote Vote function
Budget Type
Funding source
Programme /project
Budget Release Expenditure FY 2015/16 projection (million)
Development Facility - East
GoU WSDF central 4.32 4.51 4.51 6.92
Donor 15.58 4.83 4.83 19.51
GoU Protection of Lake Victoria-Kampala Sanitation Program
26.43 24.51 24.49 30.13
Donor 12.58 0.00 0.00 22.00
GoU Lake Victoria Water and Sanitation (LVWATSAN)Phase II Project
3.85 3.40 3.39 4.35
Donor 1.37 0.00 0.00 1.37
GoU Kampala Water Lake Victoria Water and Sanitation Project
7.37 6.92 6.92 9.37
Donor 10.53 0.00 0.00 20.56
GoU Water Management and Development Project
0.63 0.60 0.60 0.63
Donor 3.29 1.00 0.00 35.00
GoU Water Management and Development Project II
0.60 0.51 0.46 0.90
Donor 1.20 1.25 0.48 5.90
GoU Water and Sanitation Development Facility-South Western
1.35 1.20 1.20 3.65
Donor 20.56 10.85 11.73 18.56
GoU Investment Subsidy to NWSC
3.00 2.08 2.08 0.00101
Donor 0.00 0.00 0.00 0.00
Recurrent GoU 0.32 0.02 0.02 0.32
101 Project closed and funds reallocated as recurrent budget under urban water supply and sewerage programme.

Uganda Water and Environment Sector Performance Report 2015
Annex, - 19 -
Vote Vote function
Budget Type
Funding source
Programme /project
Budget Release Expenditure FY 2015/16 projection (million)
Water for Production
Donor Water for Production
0.00 0.00 0.00 0.00
Development
GoU Water for Production
31.65 22.81 22.75 36.30
Donor 0.00 0.00 0.00 10.20
Water Resources Management
Recurrent GoU Water Resources M & A
0.41 0.41 0.40 0.41
Donor 0.00 0.00 0.00 0.00
GoU Water Resources Regulation
0.28 0.27 0.27 0.28
Donor 0.00 0.00 0.00 0.00
GoU Water Quality Management
0.51 0.45 0.38 0.49
Donor 0.00 0.00 0.00 0.00
GoU Trans-boundary water resources management programs
NEW PROGRAMME
0.02
Donor 0.00
Development
GoU Lake Victoria Env’t Mgt Project
0.62 1.10 1.10 1.62
Donor 10.00 23.64 14.64 23.64
GoU Operational Water Res. Mgt NBI
0.48 0.41 0.41 0.58
Donor 1.00 0.00 0.00 0.00
GoU Support to WRM
2.86 2.57 2.46 2.99
Donor 3.00 4.43 3.40 6.19
GoU Mapping of Ground Water Resources in Uganda
0.14 0.14 0.13 0.14
Donor 1.53 0.00 0.00 0.00
GoU Water Management and Development Project
0.62 0.59 0.57 0.62
Donor 2.10 1.00 0.25 4.99
GoU Support for Hydro-Power Dev’t and Operations on River Nile
0.50 0.43 0.42 0.50
Donor 0.00 0.00 0.00 0.00

Uganda Water and Environment Sector Performance Report 2015
Annex, - 20 -
Vote Vote function
Budget Type
Funding source
Programme /project
Budget Release Expenditure FY 2015/16 projection (million)
GoU Water Management Zones
NEW PROJEC
T
0.37
Donor 0.00
Natural Resources Management
Recurrent GoU Environment Support Services
0.23 0.22 0.22 0.23
Donor 0.00 0.00 0.00 0.00
GoU Forestry Support Services
0.59 0.42 0.42 0.74
Donor 0.00 0.00 0.00 0.00
GoU Wetland Management Services
0.35 0.34 0.33 0.60
Donor 0.00 0.00 0.00 0.00
Development
GoU National Wetland Project Phase III
2.59 2.45 2.43 2.99
Donor 0.00 0.00 0.00 0.00
GoU FIEFOC - Farm Income Project
17.21 17.23 17.17 18.46
Donor 0.00 0.00 0.00 0.00
GoU Saw log Production Grant Scheme Project
0.88 0.88 0.79 0.88
Donor 8.80 0.00 0.00 0.00
GoU The National REDD-Plus Project
0.85 0.84 0.76 1.40
Donor 0.00 0.00 0.00 0.00
Weather, Climate and Climate Change
Recurrent GoU Meteorology 1.17 1.13 1.13 12.78
Donor 0.00 0.00 0.00 0.00
GoU Climate Change
NEW PROGRAMME
0.02
Donor 0.00
Development
GoU Meteorological Support for PMA
3.66 3.64 3.61 0.00102
Donor 0.00 0.00 0.00 0.00
GoU Climate Change Project
0.80 0.70 0.68 0.80
Donor 2.20 1.02 0.84 1.08
102 Project was closed and reallocated to Meteorology programme.

Uganda Water and Environment Sector Performance Report 2015
Annex, - 21 -
Vote Vote function
Budget Type
Funding source
Programme /project
Budget Release Expenditure FY 2015/16 projection (million)
Policy, Planning and Support Services
Recurrent GoU Finance and Administration
2.58 2.58 2.57 5.23
Donor 0.00 0.00 0.00 0.00
GoU Office of Director DWD
0.21 0.20 0.19 0.21
Donor 0.00 0.00 0.00 0.00
GoU Planning 0.98 0.97 0.96 1.38
Donor 0.00 0.00 0.00 0.00
GoU Office of Director DWRM
0.11 0.10 0.10 0.19
Donor 0.00 0.00 0.00 0.00
GoU Office of the Director DEA
0.10 0.09 0.09 0.19
Donor 0.00 0.00 0.00 0.00
GoU Internal Audit 0.13 0.13 0.13 0.58
Donor 0.00 0.00 0.00 0.00
GoU Nyabyeya Forestry College
0.32 0.29 0.29 0.52
Donor 0.00 0.00 0.00 0.00
GoU Water and Environment Sector Liaison
NEW PROGRAMME
0.02
Donor 0.00
Development
GoU Policy and Management Support
10.17 9.85 9.72 10.67
Donor 2.00 5.65 6.15 4.61
GoU Support to Nyabyeya Forestry College Project
0.84 0.80 0.80 0.84
Donor 0.00 0.00 0.00 0.00
GoU Water Management and Development Project
0.44 0.44 0.40 2.44
Donor 0.80 1.41 0.35 1.75

Uganda Water and Environment Sector Performance Report 2015
Annex, - 22 -
Annex 7. Support provided by UNICEF in sanitation and hygiene, hand pump mechanics training and WASH emergency response in FY2014/15
(a) Community Sanitation and Hygiene
UNICEF supported 16 Districts103 to carry out Community Led Total Sanitation; 182 villages were triggered. Ministry of Health and Mubende District were supported to carry out Open Defecation Free verification and certification.
The National Hand washing Campaign Secretariat was supported through provision of funds for hand washing promotion activities.
(b) Institutional Sanitation
A total of 23 latrines with 115 stances were constructed at primary schools in Kabarole, Lira, Ntoroko and Mukono, serving at least 4,600 pupils.
One 18-stances biogas-producing latrine was constructed in Tororo serving more than 720 pupils with sanitary facilities and cooking gas.
Support was also extended to the Appropriate Technology Centre (ATC) towards the establishment of a low cost sanitary pad making project. This project has expanded to include 2 schools in Mukono district, where equipment has been installed and skills training in pad making using banana fibre waste conducted at the two schools.
(c) Capacity Development
District Local Governments were supported in training hand pumps mechanics104. 123 Water and Sanitation Committees at point water sources were retrained, while the Water and Sanitation Boards at 6 piped water systems were trained in operation and maintenance.
(d) Emergency Response
In collaboration with OPM and UNHCR, UNICEF supported the provision of safe water, hygiene and sanitation in the refugee affected areas:
x 13 solar powered systems were constructed (3 in Kiryandongo refugee settlement, 3 in Rhino camp refugee settlement and 7 in Adjumani district), serving 48,000 refugees;
x 1,800 latrines were constructed at household level in Rhino camp, Kiryandongo and Adjumani refugee settlements through provision of latrine digging kits, latrine slabs, logs and poles.
x 120 hygiene promoters were supported in carrying out hygiene promotional activities in Kiryandongo, Rhino camp and Adjumani refugee settlements. x UNICEF supported Government in responding to the Typhoid outbreak in and around Kampala through:
9 Supporting KCCA in Desludging latrines and Septic tanks; Coordination of interventions, 9 House to house health promotion and Household water treatment using water treatment tablets
through the Uganda Red Cross Society, 9 Supporting KCCA in provision of tap water in affected areas in Kampala through payment of water
bills at 24 tap stands. 9 Supporting MWE to train district staff from 20 districts most affected by typhoid in water quality
monitoring and surveillance
103 Mukono, Mubende, Wakiso, Buikwe, Lwengo, Bukomansimbi, Kalungu, Kasese, Kyegegwa, Kyenjojo, Gulu, Amuru, Nwoya, Kitgum, Lamwo and Yumbe,
104 in Buikwe, Mubende, Kyegegwa, Amuru, Nwoya, Lamwo, Kitgum, Yumbe and Napak

Uganda Water and Environment Sector Performance Report 2015
Annex, - 23 -
Annex 8. District Performance - Community Management and Gender Indicators
District Management [%] Gender [%] 1 Abim 82 82 2 Adjumani 66 91 3 Agago 99 95 4 Alebtong 71 82 5 Amolatar 81 97 6 Amudat 97 100 7 Amuria 73 84 8 Amuru 55 93 9 Apac 90 86 10 Arua 2 100 11 Budaka 88 89 12 Bududa 46 90 13 Bugiri 86 93 14 Buhweju 73 65 15 Buikwe 75 89 16 Bukedea 94 96 17 Bukomansimbi 78 69 18 Bukwo 96 95 19 Bulambuli 77 77 20 Buliisa 89 99 21 Bundibugyo 73 66 22 Bushenyi 97 96 23 Busia 85 82 24 Butaleja 96 85 25 Butambala 59 87 26 Buvuma 86 89 27 Buyende 93 61 28 Dokolo 85 91 29 Gomba 84 78 30 Gulu 66 78 31 Hoima 98 79 32 Ibanda 77 83 33 Iganga 95 87 34 Isingiro 46 96 35 Jinja 12 76 36 Kaabong 90 93 37 Kabale 66 79 38 Kabarole 64 68 39 Kaberamaido 81 88

Uganda Water and Environment Sector Performance Report 2015
Annex, - 24 -
District Management [%] Gender [%] 40 Kalangala 82 59 41 Kaliro 95 87 42 Kalungu 92 57 43 Kamuli 25 69 44 Kamwenge 59 94 45 Kanungu 73 87 46 Kapchorwa 95 94 47 Kasese 21 99 48 Katakwi 69 90 49 Kayunga 87 65 50 Kibaale 62 75 51 Kiboga 68 76 52 Kibuku 92 88 53 Kiruhura 65 94 54 Kiryandongo 84 67 55 Kisoro 72 91 56 Kitgum 85 94 57 Koboko 60 76 58 Kole 97 97 59 Kotido 73 92 60 Kumi 96 90 61 Kween 88 98 62 Kyankwanzi 83 78 63 Kyegegwa 95 79 64 Kyenjojo 88 78 65 Lamwo 95 96 66 Lira 93 88 67 Luuka 79 74 68 Luwero 90 75 69 Lwengo 97 80 70 Lyantonde 95 57 71 Manafwa 71 89 72 Maracha 90 97 73 Masaka 84 88 74 Masindi 73 80 75 Mayuge 93 90 76 Mbale 84 80 77 Mbarara 88 92 78 Mitooma 96 80 79 Mityana 53 98 80 Moroto 32 100 81 Moyo 92 90 82 Mpigi 97 71 83 Mubende 97 53

Uganda Water and Environment Sector Performance Report 2015
Annex, - 25 -
District Management [%] Gender [%] 84 Mukono 96 89 85 Nakapiripirit 85 90 86 Nakaseke 99 81 87 Nakasongola 83 93 88 Namayingo 90 90 89 Namutumba 94 96 90 Napak 98 99 91 Nebbi 78 91 92 Ngora 93 92 93 Ntoroko 35 100 94 Ntungamo 70 85 95 Nwoya 91 74 96 Otuke 60 90 97 Oyam 96 95 98 Pader 90 99 99 Pallisa 66 74 100 Rakai 28 89 101 Rubirizi 91 97 102 Rukungiri 79 80 103 Serere 96 89 104 Sheema 82 96 105 Sironko 79 95 106 Soroti 83 78 107 Ssembabule 57 62 108 Tororo 79 79 109 Wakiso 91 58 110 Yumbe 88 87 111 Zombo 13 96 National Level 77 84 Source is Water Supply Data Base 2015

Uganda Water and Environment Sector Performance Report 2015
Annex, 26
Annex 9. WSDF Branches, their locations, districts under their jurisdiction and schemes completed
WSDF Branch Location Districts Covered Completed Schemes 2014/2015
WSDF-North Lira 23 Agago, Alebtong, Kole, Lamwo, Nwoya, Otuke, Zombo, Apac, Lira, Dokolo, Amolatar, Oyam, Amuru, Gulu, Pader, Kitgum, Adjumani, Moyo, Yumbe, Koboko, Maracha-Terego, Arua and Nebbi
Amugo, Agweng, Paidha, Ibuje, Purong
WSDF-East Mbale 39
Amuria, Kotido, Kaabong, Abim, Moroto, Katakwi, Soroti, Kaberamaido, Kumi, Bukedea, Bukwo, Kapchorwa, Namayingo, Buikwe, Nakapiripirit, Sironko, Manafwa, Bududa, Mbale, Butaleja, Serere, Kibuku, Napak, Ngora, Kween, Luuka, Tororo, Amudat, Bulambuli, Busia, Buyende, Pallisa, Budaka, Namutumba, Bugiri, Kaliro, Iganga, Mayuge, Kamuli and Jinja
Namalu, Irundu, Matany, , Ochero, Suam, Kapchorwa,
WSDF-Central Wakiso 25
Hoima, Buliisa, Kayunga, Kibaale, Kiboga, Buikwe, Bukomansimbi, Butambala, Buvuma, Gomba, Kalangala, Kalungu, Kyankwanzi, Mityana, Nakaseke, Nakasongola, Masindi, Luwero, Masaka, Mpigi, Lwengo, Kiryandongo, Mubende, Mukono, and Wakiso
Nkoni, Kinogozi, Najjembe, Kakumiro, Kiganda, Bukomansimbi, Kaboango-Budongo,
WSDF-South West Mbarara 24
Kisoro, Kanungu, Kabale, Rukungiri, Ntungamo, Bushenyi, Mbarara, Isingiro, Kiruhura, Ibanda, Kamwenge, Kyenjojo, Kasese, Bundibugyo, Ntoroko, Rubiriizi, Buhweju, Sheema, Kyegegwa, Mitooma, Kabarole, Rakai, Lyantonde and Sembabule
Lyantonde II, Rwenkobwa, Kinoni, Matete, Rushere, Ntuusi, Muhanga
Other Projects Location Districts Covered Completed Towns
2014/2015 LVWATSAN Mayuge

Uganda Water and Environment Sector Performance Report 2015
Annex, 27
Annex 10. Key data on all schemes completed under WSDFs and LVWATSAN
InvestmentCost (UGX)
Per Capita Investment Cost (UGX)
Per Capita Investment Cost (USD)
Institl Tap stands
H/H Kiosks Total Exch: 3,327
1 NKONI RGC N 4.976 8.450 BOREHOLE 9 162 120 5 200 0 GRID / GEN. 40,0 1.544.609.200 183.000 55 102 KINOGOZI RGC N 4.721 8.120 BOREHOLE 62 992 100 10 200 0 GRID / GEN. 25 1.798.665.376 222.000 67 53 NAJJEMBE RGC N 10.503 17.360 BOREHOLE 10 180 120 6 200 0 GRID / GEN. 33 1.910.337.963 221.100 67 4 KAKUMIRO UC N 14.814 24.486 BOREHOLE 28 504 280 10 250 0 GRID / GEN. 60 4.054.450.158 166.000 50 105 KIGANDA UC N 7.446 12.308 BOREHOLE 25 450 200 10 250 0 GRID / GEN. 35 2.999.698.713 244.000 74 106 BUKOMANSIMBI UC R 10.662 18.151 BOREHOLE 16 279 100 2 0 0 GRID / GEN. 13,5 1.764.493.062 97.000 29 07 KABANGO-BUDONGO RGC R 7.126 15.095 BOREHOLE 18 324 120 6 200 0 GRID / GEN. 12 1.494.449.715 99.000 30 108 MATETE UC N 20.522 36.940 BOREHOLE 40 690 320 38 353 5 DIESEL/GRID 29,3 1.871.261.124 50.657 15 8 12049 RUSHERE UC N - 6.200 BOREHOLE 6 116 65 0 - 0 DIESEL/GRID 3,3 461.060.905 74.365 22 1 0
10 NTUUSI RGC N 9.075 16.214 BOREHOLE 16 384 100 12 157 5 DIESEL/GRID 25 1.965.714.633 121.236 36 8 48711 LYANTONDE II UC N 15.000 96.043 LAKE 50 481 250 0 - 0 DIESEL/GRID 14 1.926.187.631 20.055 6 0 012 RWENKOBWA RGC N 8.765 15.461 BOREHOLE 10 240 144 15 150 5 DIESEL/GRID 28,0 1.822.083.182 117.850 35 8 1 32713 KINONI RGC N 8.152 14.674 BOREHOLE 6 132 65 0 - 5 DIESEL/GRID 9 1.880.682.055 128.164 39 9 1 014 MUHANGA UC N 14.746 19.157 SPRING 15 360 90 20 180 12 Gravity 82 2.349.970.413 122.669 37 0 015 NAMALU RGC R 8.014 12.486 BOREHOLE 0 192 80 2 100 0 GENERATOR 26 1.133.038.385 90.745 35 016 KAPCHORWA UC N 15.828 25.450 SURFACE 0 1064 430 0 0 0 GFS 5 427.023.220 16.779 6 017 OCHERO RGC N 4.235 7.257 BOREHOLE 0 147 50 3 150 0 GRID & GEN. 11,9 1.548.347.169 213.359 82 018 MATANY RGC N 7.974 10.716 BOREHOLE 0 128 80 4 90 0 GRID & GEN. 6,4 364.165.775 33.983 13 019 IRUNDU RGC N 8.333 15.682 BOREHOLE 0 240 138 3 150 0 GENERATOR 6 1.787.557.843 113.988 44 020 SUAM RGC N 5.143 8.131 SURFACE 0 303 165 3 150 0 GFS 19,7 2.030.104.280 249.675 96 021 OMUGO RGC N 11.588 20.695 BOREHOLE 0 1040 384 0 0 0 GRID & GEN. 27,3 1.920.000.000 92.776 28 6 222 PAIDHA UC N 30.500 66.691 BOREHOLE 0 336 100 0 1000 0 GENERATOR 37,6 3.457.357.145 51.841 16 5 523 AGWENG RGC N - 2.410 BOREHOLE 0 100 100 0 200 0 GEN. & SOLAR 19,6 1.100.645.441 456.699 137 1 524 IBUJE RGC N 5.209 12.139 BOREHOLE 0 192 100 0 0 0 GEN & SOLAR 11,5 1.585.919.049 130.647 39 3 725 PURONG UC N 6.721 9.408 BOREHOLE 0 240 100 0 200 0 GENE. & GRID 19,5 1.465.998.820 155.825 47 3 726 MAYUGE UC N 19.378 40.296 BOREHOLE 870 0 450 15 GRID & GEN. 56,7 9.775.000.000 242.580 73
Total 259.431 540.020 309,5 8.408 4671 149 2.040 32 656,5 35.133.900.802 3.715.993 45 64
NO. Town
No. of Househo
ld Demonstration Toilets
Current Population
Design Population
WaterSource
Type
Pipeline Length
(km)
Urban Centre (UC) or
Rural Groth Centre
New or rehabilitatio
n
SourceYield
(m3/h)
No. of Ecosan Toilets
SystemCapacity(m3/day)
StorageCapacity
(m3)
Points of Service (No.)Energy Source
No. of Public Toilets
Uganda Water and Environment Sector Performance Report 2015
Annex, - 28 -
Annex 11. Collaboration of WSDFs and Umbrella Organisations for O&M
The Water and Sanitation Development Facility (WSDF) is the programme of the Urban Water and Sewerage Department (UWSS) of the Directorate of Water Development (DWD) under the Ministry of Water and Environment. WSDFs are Uganda’s standard implementation mechanism for water and sanitation interventions in Small Towns and Rural Growth Centres (STs/ RGCs). To bring services close to the target communities and to ensure equity while decentralising, they are established as four regional branches i.e. WSDF-North (Lira), WSDF-Centre (Wakiso), WSDF-South West (Mbarara) and WSDF-East (Mbale). WSDF Branches have delegated procurement and Accounting Authorities and operate following an Operations Manual updated and approved in 2014.
WSDFs set up the Operation and Maintenance (O&M) system for the new piped schemes constructed. The schemes are generally supervised by Water Supply and Sewerage Boards (WSSBs) and operated either by private companies (Private Operators) or individuals (Scheme Operators) based on management contract.
However, ensuring sustainability of the investment made through reliable O&M remains a daunting challenge in STs/ RGCs. This is mainly due to lack of capacity and marginal financial viability particularly to cover capital maintenance and expansion investments. The institutional responsibility for O&M support is with the Directorate of Water Development (DWD), Ministry of Water and Environment (MWE).
It is in this context that the Umbrella Organisations for Water and Sanitation (UOs) model has been set up to provide O&M support to WSSBs and thereby increase functionality rates of piped water systems. The model has become a national reference and the six regional branches are covering the whole of Uganda by now. These regional O&M Support structures are necessary to compensate the loss of capacity due to decentralised management of schemes.
The Water and Sanitation Development facilities (WSDFs) and the Umbrella Organisations (UOs) support WSSBs in setting up and maintaining appropriate management systems for O&M. The UOs provide follow up and support the O&M issues by training in managerial and planning skills, support in contractual and technical issues and assistance in the procurement of extension works.

Uganda Water and Environment Sector Performance Report 2015
Annex, - 29 -
Annex 12. Water Boards with Women in Key Positions and WSSB Functionality
No. Town Water Board in Place
No. Members
Active Water Board
Women with key Positions
1 Abim No 0 No No
2 Adjumani No 0 No No
3 Agago Yes 5 Yes No
4 Alebtong Yes 0 No Yes
5 Amolatar Yes 5 Yes Yes/
6 Amudat Yes 5 Yes Yes
7 Amuru Yes 0 No Yes
8 Anaka Yes 5 Yes Yes
9 Ayer No 5 No Yes
10 Binyiny Yes 5 Yes Yes
11 Budaka Yes 5 Yes Yes
12 Bududa Yes 5 Yes Yes
13 Bugongi Yes 6 Yes Yes
14 Buikwe Yes 5 Yes No
15 Bukedea Yes 5 Yes Yes
16 Bukomasimbi Yes 0 No Yes
17 Bukomero Yes 5 Yes No
18 Bukwo No 5 Yes Yes
19 Bulambuli Yes 7 Yes Yes
20 Bulegeni Yes 5 Yes No
21 Buliisa Yes 5 Yes Yes
22 Bundibugyo Yes 5 Yes Yes
23 Busembatia Yes 6 Yes No
24 Busia Yes 5 Yes Yes
25 Busolwe Yes 7 Yes Yes
26 Butaleja Yes 5 Yes No
27 Butogota Yes 0 No No
28 Butunduzi No 0 No No
29 Buvuma No 0 No No
30 Buyende Yes 5 Yes No
31 Dokolo Yes 5 Yes Yes
32 Gombe Yes 5 Yes No.

Uganda Water and Environment Sector Performance Report 2015
Annex, - 30 -
No. Town Water Board in Place
No. Members
Active Water Board
Women with key Positions
33 Hamurwa-karuka Yes 5 Yes Yes
34 Hima Yes 5 Yes Yes
35 Igorora No 0 No No
36 Ishongoro Yes 5 Yes Yes
37 Kaabong Yes 5 Yes No
38 Kachumbala Yes 5 Yes Yes
39 Kagadi No 0 No No
40 Kakiri Yes 5 Yes Yes
41 Kalangala No 0 No No
42 Kalongo Yes 5 Yes No
43 Kanara No 0 No No
44 Kanoni Yes 5 Yes No
45 Kapchorwa Yes 6 Yes Yes
46 Karugutu Yes 5 Yes Yes
47 Kashenshero Yes 5 Yes Yes
48 Kasilo No 0 No No
49 Katakwi Yes 6 Yes Yes
50 Katerera Yes 5 Yes Yes
51 Katooke Yes 5 Yes Yes
52 Katuna Yes 5 Yes Yes
53 Katwe–kabatooro
Yes 5 Yes Yes
54 Kayunga Yes 5 Yes No
55 Kazo Yes 5 Yes Yes
56 Kibale Yes 6 Yes Yes
57 Kibibi Yes 5 Yes Yes
58 Kibiito Yes 5 Yes Yes
59 Kibingo Yes 5 Yes No
60 Kiboga Yes 5 Yes Yes
61 Kibuku Yes 6 Yes Yes
62 Kigorobya Yes 5 Yes Yes
63 Kiruhura Yes 5 Yes Yes
64 Kiwoko Yes 5 Yes Yes
65 Koboko Yes 5 Yes Yes
66 Kotido Yes 5 Yes Yes
67 Kumi Yes 5 Yes Yes

Uganda Water and Environment Sector Performance Report 2015
Annex, - 31 -
No. Town Water Board in Place
No. Members
Active Water Board
Women with key Positions
68 Kyaitamba Yes 5 Yes Yes
69 Kyankwanzi Yes 5 Yes Yes
70 Kyamuliibwa Yes 5 Yes Yes
71 Kyarusozi Yes 5 Yes Yes
72 Kyazanga Yes 0 Yes Yes
73 Kyegegwa No 0 No No
74 Kyenjojo Yes 5 Yes Yes
75 Lamwo No 5 No No
76 Lorengecora Yes 5 Yes No
77 Lukaya Yes 5 Yes Yes
78 Luuka Yes 5 No No
79 Lwakhakha Yes 5 Yes Yes
80 Lwengo Yes 5 Yes Yes
81 Manafwa Yes 5 Yes No
82 Maracha Yes 5 Yes Yes
83 Mateete No 0 No No
84 Moyo Yes 5 Yes Yes
85 Mpigi Yes 5 Yes No
86 Mpondwe-lhubiriha
Yes 5 Yes Yes
87 Muhanga Yes 5 Yes Yes
88 Nagongera Yes 6 Yes Yes
89 Nakapiripiti Yes 5 Yes No
90 Nakasongola Yes 5 Yes Yes
91 Namasale Yes 5 Yes Yes
92 Namyingo No 0 No No
93 Namutumba Yes 5 Yes Yes
94 Nebbi Yes 5 Yes Yes
95 Ngoma No 0 No No
96 Ngora Yes 5 Yes Yes
97 Nkokonjeru Yes 5 Yes Yes
98 Nsiika Yes 5 Yes No
99 Ntoroko No 0 No No
100 Ntwetwe Yes 5 Yes Yes
101 Nyadiri Yes 5 Yes Yes
102 Nyahuka Yes 5 Yes Yes

Uganda Water and Environment Sector Performance Report 2015
Annex, - 32 -
No. Town Water Board in Place
No. Members
Active Water Board
Women with key Positions
103 Otuke Yes 5 Yes Yes
104 Oyam Yes 0 No Yes
105 Pakwach Yes 5 Yes Yes
106 Pallisa Yes 5 Yes Yes
107 Patongo Yes 5 Yes Yes
108 Rakai Yes 5 Yes No
109 Rubare Yes 5 Yes Yes
110 Rubirizi Yes 5 Yes Yes
111 Rubona Yes 5 Yes Yes
112 Rushango No 0 No No
113 Rwashameirwe Yes 5 Yes Yes
114 Rwebisengo Yes 5 Yes Yes
115 Rwimi Yes 5 Yes Yes
116 Sanga No 0 No No
117 Sembabule Yes 5 Yes Yes
118 Serere Yes 5 Yes Yes
119 Yumbe No 0 No No
120 Zombo No 0 No No
Functionality of the WSSBs x 94No. WSSBs were functional out of the 120 WSSBs
x (94/120)*100 = 78.3%
Gender x 80 WSSBs out of the 120 WSSBs had women in key positions of Chairperson, Treasurer and
Secretary / Town Clerk/Senior Assistant Secretary
x (80/120)*100=66.7%
Note: Activeness of Water Board is based on mandatory meetings held.

Uganda Water and Environment Sector Performance Report 2015
Annex, 33
Annex 13. Performance of Umbrella Organisations in FY 2014/15
Central Eastern Kara-moja
Mid-Western
Northern South-Western
All Umbrellas
Explanations
Total no. of operational member schemes 89 87 21 65 67 51 380 All current Umbrella members including non-functional schemes
% functional schemes 99% 98% 81% 98% 84% 100% 95% Including significant numbers of schemes with functionality problems
No. of non-functional schemes repaired during FY 2014/15
18 2 3 17 13 13 66 Major repairs or replacement of components
Total amount of credits granted [UGX mn 72 33 29 9.4 20.4 29.5 193 Average % of member schemes visited per quarter for back-stopping /supervision
66% 47% 90% 57% 60% 29% UGX Insufficient resources and transport for quarterly visits at all schemes
Average % of member schemes where water quality analyses were made per quarter
74% 51% 85% 60% 55% 89% 54% Insufficient resources and transport for quarterly water quality testing at all schemes
No. of WSSBs trained 55 24 15 20 19 16 67% All types of training, full day trainings only No. of advocacy meetings held 10 34 16 5 14 4 149 Meetings with local leaders or
communities % of utilities with locally collected revenues exceeding O&M costs
63% n/a n/a 59% 66% 80% 92 Data not yet available for all Umbrella Organisations
% of water utilities having saved at least 10% of the annual revenue
31% n/a n/a 27% 27% n/a n/a Data not yet available for all Umbrella Organisations
% of Umbrella members submitting regular reports on scheme performance
45% 12% 18% 69% 80% 63% n/a
No. of advisory financial management audits conducted in member schemes
10 7 0 43 22 9 48%
Network extensions constructed [km] 4 km 5 km 5 km 16 km 4 km 4 km 91 No. of new service connections 200 n/a n/a 119 164 214 38 km Data incomplete No. of water meters provided 1890 900 0 294 495 479 n/a Water meters provided free of cost % of all connections that are metered 70% n/a n/a 62% 68% 96% 4,058 Data not yet available for all Umbrella
Organisations % of schemes with functional bulk water meter
50% n/a n/a 53% 29% 61% n/a

Uganda Water and Environment Sector Performance Report 2015
Annex, - 34 -
Annex 14. Towns of which the Water Supply Management was transferred to NWSC over the Past 3 Financial Years
FY 2012-13 FY 2013-14 FY 2014-15 Mityana Nebbi Adjumani Aduku Kihihi Buwenge Apac Lyantonde Mpondwe-Lhubiriha Kitgum Kalisizo Kalungu Pader Kiryandongo Kamuli Bombo Kaliro Semuto Paidha Rukungiri Moroto Kamwenge Kanungu Ntugamo Mayuge Kitagata Mbulamuti Amuria Sironko Kagoma Wakiso Budadiri Pajule Wobulenzi Kigumba Kakuuto Luwero Kanyantorogo Kangole Kabwohe/Itendero Kambuga Matany Kisoro Rwerere Kiganda Abim Kebisoni Bugongi Nyaihanga Buyanja Zirobwe
Kinoni Bugiri Butogota Ibuje Kyotera Buwuni Ibanda Kapeeka Sanje Kasana Mutukula Nyamutaba Rubindi Nakaseke Kanyampanga Lukaya Katete/ Nyamirima Kakiri
Paidha Bweyale Kakuuto

Uganda Water and Environment Sector Performance Report 2015
Annex, - 35 -
Annex 15. Inventory of available surface water and rainfall monitoring data
Station No Station Name Period of coverage
81201 L. Victoria at Entebbe Pier 1948-2015
81202 L. Victoria at Jinja Pier 1948-2015
81266 L. Wamala at Lubajja 1997-2015
82201 L. Kyoga at Bugondo Pier 1948-2015
82205 L. Kwania at Kachung 1965-2014
84206 L. Edward at Katwe 1965-2015
84207 L. George at Kasenyi 1965-2015
85201 L. Albert at Butiaba 1948-2015
81302 Owen Falls Releases at Jinja 1970-2010
81216 R. Kakinga Index Catchment 1968-2014
81223 R. Kagera at Masangano 1950-2015
81224 R. Ruizi at Mbarara Water Works 1954-2015
81248 R. Nyakizumba at Maziba 1956-2015
81259 R. Katonga at Kampala - Masaka Road 1965-2010
81260 R. Kibimba at Kinoni - Mubende Road 1965-2011
81267 Nakivubo Channel at 5th Street. Bridge 1997-2010
81268 Nakivubo Channel at Railway Bridge 1997-2010
81269 R. Sio 1998-2015
81272 R. Ruizi at New Waterworks (81272) 2000-2015
82203 R. Victoria Nile at Mbulamuti 1956-2015
82212 R. Manafwa at Mbale - Tororo Road 1948-2015
82213 R. Namatala at Mbale - Soroti Road 1948-2015
82217 R. Mpologoma at Budumba 1949-2015
82218 R. Malaba at Jinja - Tororo Road 1955-2015
82220 R. Enget at Bata - Dokolo Road 1970-2015
82221 R. Agu at Kumi - Serere Road 1948-2015
82222 R. Abuket at Kumi - Serere Road 1948-2015
82225 R. Sezibwa at Falls 1960-2015
82227 R. Kapiri at Kumi - Soroti Road 1948-2011
82228 R. Namalu at Mbale - Moroto Rd 1959-2015
82231 R. Kelim (Greek) at Mbale - Moroto Rd 1956-2015
82240 R. Sironko at Mbale - Moroto Road 1953-2015
82241 R. Simu at Mbale - Moroto Road 1953-2015
82243 R. Sipi at Mbale - Moroto Road 1953-2015
82245 R. Akokorio at Soroti - Katakwi Road 1969-2015
82251 R. Wambuli - Nakasongola 2000-2015
82252 R. Omunyal Upper at Tiririri - Otuboi Rd. 2002-2008
82253 R. Lumbuye at Kaliro - Nawaikoke Road 2003-2004
82254 R. Mpologoma at Mbale - Tirinyi Rd 2003-2007
82255 R. Sezibwa at Kayunga 2003-2004

Uganda Water and Environment Sector Performance Report 2015
Annex, - 36 -
Station No Station Name Period of coverage
83203 R. Kyoga Nile at Masindi Port 1947-2015
83206 R. Kyoga Nile at Kamdini 1950-2015
83209 R. Kyoga Nile at Paraa 1963-2015
83212 R. Tochi II at Gulu - Atura Road 1963-2015
83213 R. Kafu at Kampala - Gulu Road 1952-2015
83218 R. Mayanja at Kapeeka - Kakunga Road 1997-2015
83219 R. Kigwe at Semuto - Wobulenzi Road. 2000-2015
84212 R. Mpanga at Kampala - Fort Portal Rd 1956-2015
84215 R. Mpanga at Fort Portal - Ibanda Road 1966-2012
84227 R. Chambura at Kichwamba 1954-2015
84228 R. Nyamugasani at Katwe - Zaire Road 1954-2015
84267 R. Mitano at Kanungu - Rwensama Road 1958-2015
85205 R. Semliki at Bweramule 1950-2012
85211 R. Muzizi at Kyenjojo - Hoima Road 1956-2011
85212 R. Nkussi at Kyenjojo - Hoima Road 1956-2015
85217 R. Waki II at Biiso - Hoima Road 1969-2015
87206 R. Anyau at Arua - Moyo Road 1955-2015
87208 R. Oru at Arua - Yumbe Road 1958-2015
87212 R. Ora at Inde - Pakwach Road 1956-2015
87217 R. Albert Nile at Laropi (87217) 1958-2013
87218 R. Nyagak at Nyapea 1967-2015
87222 R. Albert Nile at Panyango. (87222) 1969-2015
RAINFALL STATION/AWS
8832022 Nabiswera Primary School - Nakasongola 1964-2015
88330450 Bugondo HYDROMET - Soroti 1943-2015
8631005 Moyo FAO AWS 02/11/02-14/05/15
8734001 Moroto FAO AWS 05/11/01-16/08/02
8832901 Nakasongola FAO AWS 17/08/02-13/05/15
8834002 Mbale FAO AWS 20/02/04-20/05/15
8930901 Kasese FAO AWS 20/02/04-05/05/15
9030001 Mbarara FAO AWS 03/11/01-07/05/15
9031901 Masaka FAO AWS 07/08/99-27/04/15
9032901 Bukasa FAO AWS 18/07/98-03/06/15
9033901 Lolui FAO AWS 10/07/98-31/07/15
9034901 Kome FAO AWS 24/10/04-03/06/15

Uganda Water and Environment Sector Performance Report 2015
Annex, - 37 -
Annex 16. Summary of the Major Issues and Recommendations of the reviewed EIAs
Project description
Major issues/ratings Recommendations
Small HEP Projects
x EIAs have generally improved x Most of the EIAs reviewed by the Directorate
have been on SHEP x Environmental Audits reflect that most of the
SHEPs do not comply to submission of self-monitoring data
x Estimation of Environmental flow is inconsistent and problematic
x Water user audits especially for downstream users not usually comprehensive. Only types/kinds of water users are usually mentioned rather than an inventory of water uses/amounts
x Hydrological assessments and water user audits need to be improved on
x Ensure source protection guidelines are consulted and followed.
x Come up with an agreed criteria of estimating environmental flows
Oil and Gas (Exploration & Development)
x Improvement continues to be made x 2 of the 3 companies in Oil and Gas Exploration
and Development are submitting quarterly environmental reports though not comprehensive enough.
x Uncertainty on how drill cuttings will be handled in EIA reports
x Improvement on the content of the reports
x CNOOC to be advised to also submit quarterly reports
x More environmental/water monitoring audits and access to oil and gas facilities required
Roads x Many EIA reports do not reflect the need to acquiring the various permits/and or licenses
x Few EIA reports for roads reach DWRM despite the many road projects ongoing
x Design reports especially for bridges are not usually included in the reports
x There is no plan for washing facilities for road construction fleet provided which likely leads to pollution of open water resources as it’s a common site
x Road designs should be submitted for assessing the no and type of hydraulic structures/bridges constructed on a road.
x Road projects rarely apply for temporary water abstraction despite large water withdrawals. Scheduled environmental audits should be carried out to ensure abstraction permits are acquired
x UNRA should submit the list of ongoing projects/bridges to DWRM
Quarrying and Mining
x Geological assessments are not usually done x Most mining/quarrying projects do not
propose/implement water quality monitoring plans despite the high potential of such projects polluting the environment
x Assessment of the geology of the site and groundwater table is necessary in order to avoid water logging and groundwater pollution
x Water quality monitoring is key for mining and quarry operations and should be promoted
Effluent treatment facilities
x Hydrology and assessment of the catchment upon which effluent will be disposed is not done
x Baseline constructions before waste discharge are not usually established
x Impact assessment on water resources should be done, comparing with baseline conditions

Uganda Water and Environment Sector Performance Report 2015
Annex, - 38 -
Project description
Major issues/ratings Recommendations
Water Supply projects
For GW:
x For groundwater issues, water availability reports/drilling reports are not substantive enough with no drawdown curves and effects on surrounding water resources reflected.
x For surface water, water use audits are not detailed enough thus not possible to establish environmental flows and impacts of the abstraction on other water users
x Generally, EIAs/PBs usually limited to water supply and distribution. Drainage and sanitation not included
x EIA should assess impacts of
abstraction on GW resources x Comprehensive hydrological
assessments and water user audits are required
x EIA should cover both supply, distribution, drainage and sanitation
Large HEP projects
Environmental Audit
x Submission of self-monitoring data not done generally
x Water quality monitoring/analysis after HEPs not usually done
x Agree on the format and ensure submission of data
x Ensure a water quality monitoring plan is in place and ensure analysis of water quality is done

Uganda Water and Environment Sector Performance Report 2015
Annex, - 39 -
Annex 17. Response to Typhoid fever Outbreak in Kampala
In February 2015, Ministry of Health (MoH) confirmed an outbreak of typhoid fever in Kampala, and later 20 districts reported unusually high suspected cases. A total of 9,046 suspected typhoid cases were managed at three (Kisenyi HC IV, Kisugu HC III and Kiswa HC IV) health facilities in Kampala by March 30th 2015. Following the confirmation of this outbreak by the Ministry of Health, it set up a National Task Force (NTF) that was constituted by various stakeholders including MoH, MWE, Unicef, KCCA and other key stakeholders. The NTF then formed sub-committees and assigned them different tasks. The sub-committee on water and sanitation was chaired by MWE and one of this sub-committee’s tasks was water quality monitoring of drinking water sources in Kampala and surrounding districts. Preliminary water quality results had confirmed the transmission route of the typhoid to be drinking water. However, due to financial constraints, the number of sources sampled and tested by MWE were very few. Unicef, then provided funding to take more samples from Kampala and surrounding districts and also funded a training workshop on water quality monitoring to improve the capacity of affected Local Governments for drinking water quality monitoring. Comprehensive water quality assessments were carried out in Kampala, Mukono, Mpigi and Wakiso using funds from both MWE and UNICEF. Over 700 different drinking water sources from schools, organised communities, informal settlements, suburbs and municipalities were sampled and tested for mainly bacteria of faecal origin (E.coli). Different drinking water source types namely bottled water, locally packed water sources, boreholes, shallow wells and protected springs were sampled and assessed for compliance to the National Drinking Water Quality Standards. The results of this assessment are presented below: Bacteriological Quality of drinking water in Mpigi District

Uganda Water and Environment Sector Performance Report 2015
Annex, - 40 -
Key issues that were identified included:
x Poor sanitation and hygiene in and around water sources x Poor operation and maintenance leading to contamination of ground water x Degradation of water catchment areas. x Uncertainty on whether bottled water is factory packaged or locally packaged
There were notable differences in the level of contamination of water from different water abstraction technology types. Results showed that protected springs are the most prone to contamination followed by shallow wells. Deep boreholes showed less contamination possibly due to the deep nature of the ground water aquifer as compared to the shallow aquifers for other technologies. These results challenge the policy of the Ministry that prefers cheaper technology options for rural water provision. Use of guidelines on water source protection developed by DWRM should be implemented if the quality of rural water supply technologies is to be improved. In 2004, the contamination level of water sources (protected springs) in Kampala was already bad However, in 2015, the contamination level has become worse. This is due to destruction of the water catchment through construction and unplanned settlement. Population increase is the City has put more pressure on land while issues of sanitation and hygiene are worsening every day leading to contamination of water sources.

Uganda Water and Environment Sector Performance Report 2015
Annex, - 41 -
Annex 18. District Sanitation and Hygiene benchmarking, June 2015

Uganda Water and Environment Sector Performance Report 2015
Annex, - 42 -

Uganda Water and Environment Sector Performance Report 2015
Annex, - 43 -

Uganda Water and Environment Sector Performance Report 2015
Annex, - 44 -
PROCESS INTERMEDIATE OUTCOME OUTCOME
Max 10 10 15 25 15 10 15 100
Nat'l Target/Avg 2.5% 10,000 UGX 01:40 77% 50% Required Required
>=3% = 10 Top 10 - 10 <=40, 15 >70% = 25 >=50% = 15 >=51 = 10 >=51 = 15 >=76
2% = 5 11th to 20th - 7 41-50 = 10 50-69% = 20 23-49% = 10 21 to 50 = 8 21 to 50 = 10 51-75
1% = 3 21st to 30th - 3 51-60 = 5 25-49% = 15 10-22% = 5 1 to 20 = 5 1 to 20 = 5 26-50
<1% = 0 >=31 - 0 >61 = 0 <24% = 0 <9% = 0 Nil = 0 Nil = 0 0-25
# District
Repo
rtin
g
Submitting Annual Report
Avg Increase in HH San Cvg (2010-15)
SCO
RE Financial
Efficiency: Software Cost per HH Toilet
Financial Efficiency Rank
SCO
RE
Pupil: Latrine Stance Ratio
SCO
RE
% HH
San Cvge
SCO
RE
% HW Coverage
SCO
RE
# of ODF villages
SCO
RE %age of
Triggered villages that are ODF
SCO
RE
GRAND SCORE
1 Abim 1 Yes 3.7 10 22,292 0 0 44.0 10 56.6 20 38.0 10 45 8 69% 15 73
2 Adjumani 1 Yes -0.3 0 (196,109) 0 0 56.0 5 83.0 25 46.2 10 0 0 40
3 Agago 1 Yes 4.7 10 4,604 0 0 55.0 5 47.0 15 16.5 5 0 0 0% 0 35
4 Alebtong 1 Yes 3.5 10 9,261 0 0 48.0 10 81.4 25 22.6 5 11 5 9% 5 60
5 Amolatar 1 Yes 1.0 0 147,304 0 0 60.0 5 78.2 25 45.0 10 201 10 87% 15 65
6 Amudat 1 Yes 2.4 5 33,105 0 0 40.0 15 10.3 0 3.1 0 2 5 6% 5 30
7 Amuria 1 Yes 13.6 10 59,680 0 0 78.9 25 62.1 15 240 10 43% 10 70
8 Amuru 1 Yes 2.9 5 69,511 0 0 58.0 5 72.0 25 46.0 10 4 5 6% 5 55
9 Apac 1 Yes 3.6 10 19,369 27 3 86.0 0 78.3 25 20.0 5 4 5 2% 5 53
10 Arua 1 Yes 2.7 5 4,094 0 0 117.0 0 69.8 20 35.0 10 15 5 22% 10 50
11 Budaka 1 Yes -5.1 0 (7,644) 0 0 15.0 0 58.4 20 24.0 10 0 0 0 30
12 Bududa 1 Yes 4.0 10 20,847 29 3 100.0 0 75.0 25 24.0 10 0 0 48

Uganda Water and Environment Sector Performance Report 2015
Annex, - 45 -
13 Bugiri 1 Yes -0.1 0 15,283 17 7 86.0 0 82.2 25 23.3 10 23 8 24% 10 60
14 Buhweju 1 Yes 14.4 10 3,935 0 0 52.0 0 78.3 25 16.0 5 0 0 40
15 Buikwe 1 Yes 2.9 5 22,880 0 0 50.0 0 75.0 25 40.2 10 0 0 40
16 Bukedea 1 Yes 3.9 10 30,548 0 0 53.0 0 80.8 25 39.2 10 117 10 92% 15 70
17 Bukomansimbi 1 Yes 3.7 10 11,301 2 10 70.0 0 91.6 25 40.6 10 21 8 72% 15 78
18 Bukwo 1 Yes 8.5 10 21,184 30 3 89.0 0 80.0 25 30.0 10 0 0 48
19 Bulambuli 1 Yes 1.7 3 33,249 0 0 200.0 0 69.9 20 21.3 5 0 0 0% 0 28
20 Buliisa 1 Yes 5.2 10 15,651 19 7 47.0 0 68.6 20 22.0 5 9 5 60% 15 62
21 Bundibugyo 1 Yes 0.9 0 19,530 28 3 70.0 0 72.0 25 26.0 10 9 5 5% 5 48
22 Bushenyi 1 Yes 1.1 3 12,479 9 10 48.0 0 91.8 25 42.0 10 239 10 60% 15 73
23 Busia 1 Yes 3.4 10 7,501 0 0 55.0 5 87.5 25 49.4 10 0 0 50
24 Butaleja 1 Yes 0.2 0 (6,031) 0 0 92.0 0 68.0 20 15.0 5 0 0 0% 0 25
25 Butambala 1 Yes 2.0 5 46,900 0 0 80.0 0 67.0 20 46.0 10 3 5 14% 5 45
26 Buvuma 1 Yes 4.7 10 11,454 4 10 75.0 0 36.0 15 12.0 5 0 0 40
27 Buyende 1 Yes 2.7 5 4,832 0 0 100.0 0 85.0 25 44.0 10 4 5 0 45
28 Dokolo 1 Yes 3.2 10 28,685 0 0 60.0 5 86.0 25 62.0 15 330 10 0 65
29 Gomba 1 Yes 0.6 0 84,586 0 0 73.0 0 55.0 20 27.0 10 0 0 30
30 Gulu 1 Yes 5.3 10 16,810 25 3 57.0 5 73.0 25 20.0 5 114 10 100% 15 73
31 Hoima 1 Yes 0.7 0 7,196 0 0 75.0 0 74.0 25 19.0 5 8 5 80% 15 50
32 Ibanda 1 Yes -0.7 0 272,099 0 0 60.0 5 87.0 25 20.9 5 0 0 35
33 Iganga 1 Yes 1.3 3 9,983 0 0 80.0 0 75.0 25 18.7 5 2 5 33% 10 48
34 Isingiro 1 Yes 2.3 5 8,393 0 0 65.0 0 90.4 25 75.0 15 18 5 69% 15 65
35 Jinja 1 Yes 0.2 0 338,907 0 0 43.0 10 81.3 25 24.5 10 0 0 45
36 Kaabong 1 Yes 8.3 10 (22,664) 0 0 60.0 0 19.1 0 17.9 5 6 5 9% 5 25
37 Kabale 1 Yes -16.6 0 (4,377) 0 0 56.0 5 87.1 25 21.0 5 4 5 10% 5 45
38 Kabarole 1 Yes -2.8 0 1,020 0 0 80.0 0 81.0 25 29.0 10 4 5 11% 5 45
39 Kaberamaido 1 Yes 13.5 10 15,932 21 3 62.0 0 77.6 25 38.0 10 70 10 25% 10 68

Uganda Water and Environment Sector Performance Report 2015
Annex, - 46 -
40 Kalangala 1 Yes 3.1 10 28,029 0 0 29.0 15 69.0 20 3.0 0 5 5 42% 10 60
41 Kaliro 1 Yes -2.0 0 (5,927) 0 0 101.0 0 70.0 25 16.0 5 1 5 0 35
42 Kalungu 1 Yes 5.2 10 5,859 0 0 68.0 0 90.8 25 49.6 10 20 5 74% 15 65
43 Kamuli 1 Yes -1.4 0 14,373 14 7 70.0 0 78.0 25 48.0 10 65 10 56% 15 67
44 Kamwenge 1 Yes 1.6 3 12,415 8 10 68.0 0 78.1 25 23.5 10 3 5 2% 5 58
45 Kanungu 1 Yes 1.1 3 21,332 0 0 75.0 0 93.0 25 49.0 10 6 5 15% 5 48
46 Kapchorwa 1 Yes 3.7 10 25,118 0 0 65.0 0 77.0 25 28.0 10 0 0 45
47 Kasese 1 Yes 2.0 5 14,488 15 7 95.0 0 84.8 25 30.6 10 103 10 43% 10 67
48 Katakwi 1 Yes 2.8 5 14,547 16 7 70.0 0 73.2 25 21.9 5 55 10 42% 10 62
49 Kayunga 1 Yes -0.7 0 13,455 13 7 48.0 0 71.2 25 38.3 10 0 0 42
50 Kibaale 1 Yes 3.4 10 9,923 0 0 78.0 0 78.8 25 42.0 10 24 8 38% 10 63
51 Kiboga 1 Yes -2.1 0 28,862 0 0 60.0 0 51.0 20 10.6 5 0 0 0% 0 25
52 Kibuku 1 Yes 0.8 0 582,630 0 0 79.0 0 81.6 25 25.0 10 143 10 92% 15 60
53 Kiruhura 1 Yes 1.8 3 6,892 0 0 49.0 10 90.5 25 41.0 10 6 5 23% 10 63
54 Kiryandongo 1 Yes -2.3 0 (22,391) 0 0 70.0 0 67.5 20 25.0 10 15 5 28% 10 45
55 Kisoro 1 Yes 2.8 5 2,748 0 0 70.0 0 75.0 25 18.5 5 0 0 0% 0 35
56 Kitgum 1 Yes 1.4 3 (15,705) 0 0 50.5 20 21.2 5 1 5 1% 5 38
57 Koboko 1 Yes 2.0 5 31,793 0 0 65.0 0 78.0 25 31.0 10 18 5 41% 10 55
58 Kole 1 Yes 7.9 10 10,448 1 10 62.0 0 86.0 25 38.0 10 0 0 55
59 Kotido 1 Yes 5.2 10 15,506 18 7 47.0 0 25.1 15 18.0 5 2 5 7% 5 47
60 Kumi 1 Yes 6.1 10 106,152 0 0 91.0 25 78.0 15 72 10 70% 15 75
61 Kween 1 Yes 4.6 10 22,461 0 0 51.0 5 83.5 25 11.2 5 0 0 45
62 Kyankwanzi 1 Yes -4.3 0 (10,397) 0 0 55.0 5 55.0 20 19.0 5 0 0 0% 0 30
63 Kyegegwa 1 Yes -1.0 0 4,164 0 0 77.0 0 81.6 25 27.3 10 0 0 35
64 Kyenjojo 1 Yes 5.2 10 11,905 6 10 65.0 0 86.0 25 38.0 10 48 8 60% 15 78
65 Lamwo 1 Yes 0.5 0 (110,658) 0 0 46.0 0 40.0 15 12.0 5 4 5 12% 5 30
66 Lira 1 Yes -0.5 0 123,714 0 0 80.0 0 80.8 25 18.0 5 0 0 0% 0 30

Uganda Water and Environment Sector Performance Report 2015
Annex, - 47 -
67 Luuka 1 Yes 2.0 3 15,921 20 7 117.0 0 65.0 20 30.0 10 0 0 40
68 Luwero 1 Yes -2.5 0 (20,938) 0 0 73.0 0 78.0 25 56.0 15 30 8 42% 10 58
69 Lwengo 1 Yes -5.5 0 (4,221) 0 0 60.0 5 76.0 25 45.0 10 4 5 40% 10 55
70 Lyantonde 1 Yes 0.0 0 48,960 0 0 43.0 0 86.0 25 43.0 10 21 8 0 43
71 Manafwa 1 Yes 0.1 0 22,707 0 0 110.0 0 75.0 25 50.0 15 5 5 0 45
72 Maracha 1 Yes 4.1 10 512,081 0 0 86.0 0 70.0 25 31.0 10 38 8 26% 10 63
73 Masaka 1 Yes 0.9 0 5,867 0 0 58.0 5 84.0 25 35.0 10 5 5 21% 5 50
74 Masindi 1 Yes 2.4 5 13,133 12 7 87.0 0 77.0 25 32.0 10 4 5 13% 5 57
75 Mayuge 1 Yes -0.5 0 3,607 0 0 95.0 0 67.2 20 24.8 10 0 0 30
76 Mbale 1 Yes 11.3 10 1,266 0 0 120.0 0 93.2 25 24.0 10 0 0 0% 0 45
77 Mbarara 1 Yes 1.2 3 11,914 7 10 38.0 15 98.0 25 52.0 15 395 10 78% 15 93
78 Mitooma 1 Yes 2.3 5 24,734 0 0 100.0 0 91.1 25 37.5 10 0 0 40
79 Mityana 1 Yes 0.8 0 13,025 11 7 89.0 25 26.0 10 16 5 40% 10 57
80 Moroto 1 Yes -1.4 0 (82,264) 0 0 29.0 15 2.2 0 0.1 0 2 5 5% 5 25
81 Moyo 1 Yes 3.4 10 1313,505 0 0 42.0 10 91.0 25 50.0 15 32 8 24% 10 78
82 Mpigi 1 Yes 1.1 3 31,111 0 0 70.0 0 65.3 20 42.9 10 13 5 17% 5 43
83 Mubende 1 Yes 0.4 0 12,694 10 10 71.0 0 82.0 25 27.0 10 158 10 25% 10 65
84 Mukono 1 Yes 2.0 5 123,240 0 0 55.0 0 81.0 25 48.0 10 8 5 25% 10 55
85 Nakapiripirit 1 Yes 4.1 10 11,337 3 10 70.0 0 22.3 0 10.0 5 0 0 0% 0 25
86 Nakaseke 1 Yes 0.4 0 16,484 24 3 65.0 0 83.8 25 33.1 10 0 0 38
87 Nakasongola 1 Yes 1.8 3 164,420 0 0 34.0 15 87.0 25 27.6 10 9 5 23% 10 68
88 Namayingo 1 Yes -6.9 0 (3,065) 0 0 48.3 15 28.7 10 18 5 60% 15 45
89 Namutumba 1 Yes 4.4 10 4,441 0 0 82.0 0 84.1 25 38.1 10 2 5 50% 10 60
90 Napak 1 Yes -2.1 0 (9,457) 0 0 58.0 5 13.1 0 5.4 0 4 5 13% 5 15
91 Nebbi 1 Yes 0.5 0 100,508 0 0 85.0 0 77.0 25 34.7 10 37 8 22% 10 53
92 Ngora 1 Yes 2.0 5 39,605 0 0 52.0 5 83.0 25 43.0 10 29 8 53% 15 68
93 Ntoroko 1 Yes 5.6 10 235,568 0 0 60.0 5 66.9 20 10.4 5 0 0 0% 0 40

Uganda Water and Environment Sector Performance Report 2015
Annex, - 48 -
94 Ntungamo 1 Yes -1.0 0 (12,533) 0 0 50.0 5 94.6 25 23.0 10 11 5 24% 10 55
95 Nyowa 1 Yes 4.0 10 9,488 0 0 49.0 10 74.6 25 15.8 5 13 5 17% 5 60
96 Otuke 1 Yes 1.5 3 36,435 0 0 77.0 0 58.0 20 11.0 5 9 5 25% 10 43
97 Oyam 1 Yes 3.6 10 7,316 0 0 33.0 0 89.9 25 26.1 10 20 5 20% 5 55
98 Pader 1 Yes 6.2 10 7,455 0 0 50.0 0 54.0 20 26.0 10 16 5 33% 10 55
99 Pallisa 1 Yes 4.4 10 26,951 0 0 53.0 5 82.9 25 35.9 10 210 10 47% 10 70
100 Rakai 1 Yes 2.8 5 11,518 5 10 63.0 0 86.0 25 38.6 10 3 5 75% 15 70
101 Rubirizi 1 Yes 2.7 5 18,950 26 3 45.0 0 83.7 25 45.5 10 0 0 43
102 Rukungiri 1 Yes 0.2 0 44,705 0 0 45.0 10 98.9 25 47.1 10 25 8 93% 15 68
103 Sembabule 1 Yes 1.5 3 16,291 23 3 69.0 0 71.0 25 25.0 10 0 0% 0 41
104 Serere 1 Yes 4.1 10 46,336 0 0 65.0 0 80.0 25 49.6 10 80 10 45% 10 65
105 Sheema 1 Yes 1.8 3 210,981 0 0 55.0 5 88.9 25 49.0 10 281 10 64% 15 68
106 Sironko 1 Yes -0.8 0 (40,077) 0 0 90.0 0 77.0 25 31.0 10 0 0 35
107 Soroti 1 Yes 1.9 3 16,050 22 3 92.0 0 78.6 25 57.0 15 84 10 30% 10 66
108 Tororo 1 Yes 0.9 0 3,736 0 0 93.0 0 82.1 25 42.0 10 194 10 62% 15 60
109 Wakiso 1 Yes 0.9 0 7,378 0 0 65.0 0 89.5 25 38.0 10 45 8 59% 15 58
110 Yumbe 1 Yes -2.0 0 53,142 0 0 0 53.5 20 4.7 0 34 8 39% 10 38
111 Zombo 1 Yes 2.3 5 28,219 0 0 60.0 5 76.0 25 41.0 10 20 5 9% 5 55

Uganda Water and Environment Sector Performance Report 2015
Annex, - 49 -
Annex 19. Investments by CSOs in Water and Sanitation
Name of NGO Districts Budget (UGX) Expenditure (UGX)
Abarilela Community Development Organization
Acholi Child And Family Programme
Action Africa Help (AAH)
Action Against Hunger (ACF- International)
Action Against Hunger (ACF)
Action for Rural Women's Empowerment (ARUWE)
Action For Slum Health And Development
Action Line For Development (ALFOD)
African Agency for Integrated Development (AAID)
African Evangelistic Enterprise Uganda (AEE-U) Kampala 1,112,905,015 927,914,013
African Medical and Research Foundation (AMREF)
African Community Technical Service Mbarara 363,291,900 380,024,400
AFRICARE
Agency For Accelerated Regional Development (AFARD) Nebbi, Zombo, Arua, Yumbe and Moyo. 104,880,000 101,600,000
Agency For Capacity Development
Agency For Community And Development Welfare
Agency for Cooperation and Research in Development (ACORD) Mbarara, Rukungiri, Kabale, Isingiro, Kiruhura, Kisoro, Kanungu, Bushenyi, Ntungamo, Ibanda, Bushenyi
168,321,100 166,221,100
Agency For Integrated Rural Development (AFIRD) Wakiso
Agency For Integrated Rural Development
All Nation Children's Care
Alliance For Youth Achievement

Uganda Water and Environment Sector Performance Report 2015
Annex, - 50 -
Name of NGO Districts Budget (UGX) Expenditure (UGX) Allied Support For Rural Empowerment And Development(ASURED)
AMREF Health Africa
Kampala, Luwero, Nakasongola, Nakaseke, Kyankwanzi, Kiboga, Gulu, Kitgum, Pader, Agago, Lamwo, Soroti, Serere, Kabale, Kanungu, Kisoro, Rukungiri, Adjumani
2,330,063,777 1,998,247,364
Ankole Diocese
Apac Town Community Association Appropriate Revival Initiative for Strategic Empowerment (ARISE) Ntungamo 17,460,000 17,010,000
Aquafund International (U) LTD
Arbeiter-Samariter Bund (ASB)
Arua Rural Community Development (ARCOD)
Association For Social Economic Development Associations of Uganda Professional Women in Agriculture and Environment (AUPWAE)
AVSI FOUNDATION
Ayivu Youth Effort For Development
Bogoriet Tap Kaa Riwo
Brick by Brick Uganda Rakai, Masaka, Lwengo 129,079,430 98,779,370
Buganda Cultural And Development Foundation (BUCADEF)
Build Africa Uganda Kumi, Ngora, Bukedea, Pallisa, Kibuku, Masindi, Kiryandongo, Buliisa, Oyam 42,000,000 43,000,000
Bukedea Development Foundation
Busia Area Communities Federation
Buso Foundation
Busoga Trust Jinja, Mpigi, Nakaseke, Luwero, Namutumba, Iganga, Mayuge, Luuka, Bugiri, Kamuli
1,334,601,300 1,255,445,952

Uganda Water and Environment Sector Performance Report 2015
Annex, - 51 -
Name of NGO Districts Budget (UGX) Expenditure (UGX)
Busoga volunteers for community development (Buvocod) Buyende, Kamuli 1,176,000,000 563,000,000
Butakoola Village Association for Development (BUVAD) Kayunga 7,600,000 8,005,000 Buvuma Islands LV & Community Protection Association (BULVECPA)
Bwindi Mgahinga Conservation Trust (BMCT)
Canadian Physicians For Aid And Relief (CPAR)
Care International
Care International –Lira
Caritas Arua Diocese Arua Maracha Koboko Yumbe Moyo Adjumani 31,150,000 31,230,000
CARITAS Gulu diocese
Caritas Kasese Kasese 46,218,000 63,821,600
Caritas Kiyinda Mityana Mubende, Mityana, Kyankwanzi and Gomba 1,807,800,000 894,220,435
CARITAS Masaka Diocesan Development Organisation (MADDO)
Masaka, Rakai, Bukomansimbi, Kalungu, Lwengo, Lyantonde, Kalangala, Sembabule
655,320,000 380,840,000
CARITAS Mbarara
CARITAS Mityana SDD
CARITAS Nebbi
Caritas Kasanaensis Luwero Nakasongola and Nakaseke 337,000,000 202,000,000
Caritas Lira
Catholic Relief Services(RCS)
Centre for Governance and Economic Development (CEGED) Arua, Yumbe, Adjumani, Koboko, Moyo, Nebbi and Zombo 165,000,000 98,000,000
CESVI
CESVI UGANDA (Kaabong Field Office)
Children Vision Uganda (CVU)

Uganda Water and Environment Sector Performance Report 2015
Annex, - 52 -
Name of NGO Districts Budget (UGX) Expenditure (UGX)
Christ the King Health Care Centre for the Needy Buikwe 2,000,000 2,000,000
Child Fund Gulu
Child Fund Busia
Child Fund Kyankwanzi
Child Fund Jinja
Child Fund Dokolo
Child Fund Kiryandongo
Child Fund
Christian Children Fund
Christian Engineers In Development Rukungiri, Kiruhura - -
Christian Women and Youth( CWAY) Development Alliance Sironko, Mbale, Manafwa, Palisa and Bududa 154,080,000 1,470,000
Church Of Uganda -Karamoja Dioceses Development Alliance
Church of Uganda Teso Dioceses Planning and Development Office (COU-TEDDO)
Soroti, Kumi, Katakwi, Amuria, Kaberamaido, Serere, Bukedea, Ngora, Napak, Nakapiripirit
284,001,900 275,283,700
Ciforo Women's Association
Clear Water Initiative Gulu, Nyowa, Alebtong and Otuke 478,780,000 489,000,000 Community Based Options for Social Welfare Responses (Open Palm COWESER)
Community Development Action Community Efforts For Child Empowerment(CECE)
Community Based Health Care Programme Kibaale, Kiboga, Mukono, Buikwe and Nakaseke 84,480,000 27,697,240
Community Empowerment for Rural Development (CEFORD) Arua, Adjumani, Koboko, Yumbe, Moyo, Maracha, Zombo, Nebbi. - -
Community Health Concern

Uganda Water and Environment Sector Performance Report 2015
Annex, - 53 -
Name of NGO Districts Budget (UGX) Expenditure (UGX) Community Initiative for the empowerment of vulnerable people (CIFOVUP) Arua 500,000 100,000
Community Integrated Development Initiatives(CIDI) Kampala, Katakwi, Amuria, Napak. 1,146,563,101 657,849,421
Community Shelters Uganda (CSU)
COMPASSION INTERNATIONAL all except In Karamoja region and Kalangala district 1,837,986,192 2,045,299,000
Concern World Wide Pader and Agago 566,000,000 -
Conservation And Development Of Peoples Initiative (CODEP)
Conservation Effort For Community Development (CECOD)
Cooperaziona Internazionale
Deliverance Church Uganda-J.O.Y Drilling Program
Development Foundation For Rural Areas Kyenjojo, Kabarole, Kamwenge, Kyegegwa and Ntoroko 42,630,000 31,995,100
Divine Waters Uganda Lira, Alebtong 1,000,500,000 759,700,000
Drop In The Bucket
Ecological Christian Organisation
Efforts Integrated Development Foundation Mukono, Mubende, Wakiso and Kalangala - -
Emesco Development Foundation Kibaale 726,285,000 669,722,708
Environmental Teachers Association (ENVITA)
Fairland Foundation
Faith Action Development Organisation –Teso (FADO-T)
FARD
Faith Based Efforts Integrated Development Foundation
FIRD Kotido
Fontes Foundation Kasese and Rubirizi 77,159,000 72,000,000
Foundation for Rural Development (FORUD)
FORMER SEMINARIANS INITIATIVE FOR DEVELOPMENT-FOSID Arua, Adjumani 24,120,000 18,487,000

Uganda Water and Environment Sector Performance Report 2015
Annex, - 54 -
Name of NGO Districts Budget (UGX) Expenditure (UGX)
Gabula Attude Women's Group
General Relief Services (GERES) Tororo 35,975,000 13,850,000
Gisoro Twibuke Association (GTA)
Goal Uganda Bugiri, Namayingo, Agago, Abim, Kaabong 1,761,095,000 1,487,520,000
GOAL-Bugiri
Good Hope Foundation For Rural Development
Good Samaritan Community Development Programme Kisoro and Kabale 35,050,000 66,450,000
Grassland Foundation
Health Counterpart International (HCI)
Healthy Environment For All (HEFA)
Health through Water and Sanitation (HEWASA) Programme
Kabarole, Kyenjojo, Kyegegwa, Bundibugyo, Ntoroko, Kasese, Mubende, Kiboga, Luweero, Masindi, Kibaale, Hoima, Buliisa, Kiryandongo, Ibanda, Bushenyi, Kiruhura
796,214,404 777,017,404
Hope for Orphan (HOFO)
Hope for youth
HORIZONT3OOO
HOW Uganda
Institute For International Cooperation And Development
Integrated Family Care Support Uganda (IFACASU)
Integrated Family Development Initiatives (IFDI)
Integrated Health And Development Organization
Integrated Rural Development Initiative
International Aid Services Arua, Pader, Agago, Abim 450,565,997 340,559,239
International Institute of Rural Reconstruction (IIRR) Katakwi, Amuria, Bulambuli, Bududa, Kasese, Ntoroko, Bundibugyo, Gulu, Nwoya, All Karamoja districts, Lira,
21,514,000 21,514,000

Uganda Water and Environment Sector Performance Report 2015
Annex, - 55 -
Name of NGO Districts Budget (UGX) Expenditure (UGX) Kitgum, Pader, Kanungu, Kisoro, Amuru, Nebbi, Arua, Oyam, Apac, Sironko, Manafwa, Mbale, Soroti, Kumi, Ngora, Kanungu and Kisoro
International Lifeline Fund Apac, Lira 794,028,080 847,321,257
International Rescue Committee
International Water and Sanitation Centre (IRC) Kabarole, Lira 9,500,000 9,500,000
J.O.Y Drilling Deliverance Church Uganda Gulu, Lira, Dokolo, Alebtong, Otuke, Kole, Luwero, Moyo, Mbarara 1,118,830,000 400,910,000
Jinja Area Communities' Federation (JIACOFE)
Jinja Diocese To Save Environment
Joint Efforts to Save the Environment (JESE) Kabarole, Kyenjojo, Kamwenge, Ntoroko, Kyegegwa 468,590,000 444,116,500
Kagadi Women And Development Association (KWDA)
Kagando Rural Development Centre (KARUDEC) Kasese 209,059,250 62,353,191 Kampala Area Federation of Communities With Funding From Child Fund International
Kamwokya Community Health And Environmental Association (KACHERA)
Kamuli Community Development Foundation Kaliro 31,770,000 18,270,000
Kaproron PHC Programme Kween
Karambi Action for Life and Development Kasese and Kamwenge 29,000,000 29,000,000
Karamoja Agro-pastoral Development programme Moroto and Nakapiripirit 183,343,186 182,843,186
Karamoja Dioceses Development Services
Kasanga PHC/CBHC
Katosi Women Development Trust Mukono 140,960,300 142,992,700
Kibaale Youth and Women Development Agency Kibaale 8,900,000 6,600,000
Kibuka Rural development Initiative
Kigezi Diocese Water and Sanitation Programme Kabale - -

Uganda Water and Environment Sector Performance Report 2015
Annex, - 56 -
Name of NGO Districts Budget (UGX) Expenditure (UGX)
Kinkiizi Diocese Integrated Rural Development Programme Kirinda Youth Environment Management and Poverty Alleviation Program Uganda (KYEMPAPU) Bukomansimbi - -
Kisenyi Community Health Workers Association (KICHWA)
Kisomoro Tweyombeke Farmers Association
Kitovu Mobile Aids Organisation Masaka, Ssembabule, Lyantode, Lwengo, Rakai, Bukomansimbi, Kalungu 34,929,000 34,929,000
Kokwech Agro Based Youth Project (KABYP) Bukedea
Knowledge Support And Research Centre, KSRC Tororo 11,939,000 4,840,000 Ktosiga Community Christian Association for Development (KACCAD)
Kokwech Agro Based Youth Project Bukedea 605,000,000 227,000,000
Kumi Human Rights Initiative Kumi, Bukedea and Ngora districts 9,500,000 3,300,000
Kyakulumbye Development Foundation Butambala, Gomba, Mpigi 2,100,000 15,050,000
Kyera Farm Training Centre
Kyetume Community Based Health Care Programme (KCBHCP) Kyosiga Community Christian Association for Development (KACCAD) Wakiso, Gomba 82,700,000 27,700,000
Lango Child And Community Development Federation
Link To Progress Amuria, Alebtong, Lira, Kole, Apac, Oyam, Pader 1,886,299,934 1,619,234,716
Literacy Action And Development Agency(LADA) Rukungiri, Kanungu, Mitooma 276,455,555 33,566,665
Livelihood Improvement Programme Of Uganda Bushenyi and Mbarara 310,900,000 254,690,000
Living water International Uganda Ntungamo, Kiruhura 3,605 605
Lodoi Development Fund
Lutheran World Federation, Katakwi Sub Program
Maganjo Farmers Association (MAFA)
Makondo Health Centre

Uganda Water and Environment Sector Performance Report 2015
Annex, - 57 -
Name of NGO Districts Budget (UGX) Expenditure (UGX)
Mariam Foundation Centre
Masindi Child Development Federation (MACDEF)
Masiyompo Elgon Movement for Integral Development Sironko 11,600,000 1,420,000
Mbale Area Federation of Communities Mbale, Sironko, Butaleja, Budaka, Kibuku, Bulambuli 53,282,000 53,759,000
Mbarara District Farmers Association
Medical Assistance Programme (MAP)
Medicine Sans Frontieres Holland (MSF-H)
Mission For Water Throughout Uganda 400,000 109,060,600
Mt Elgon Christian Development Foundation (MECDEF) Sironko, Mbale 504,000 210,000
Mpolyabigere RC
Mubende Rural Development Association
Mukono Multipurpose Youth Organisation(MUMYO) Mukono 24,540,000 6,090,000 Multi-Community Based Development Initiative Ltd (MUCOBADI)
Bugiri, Mayuge, Butaleja, Budaka, Bududa, Kitgum, Abim, Lamwo, Pader 26,031,000 25,941,000
NAGONGERA YOUTH DEVELOPMENT PROGRAMME Tororo 54,150,000 26,600,000
National Association for Women's Action in Development Mbarara, Kampala, Wakiso, Mukono, Buliisa, Kumi, Nakapiripirit, Amuru, Kamuli
- -
National Association of Professional Environmentalists (NAPE) Hoima, Buliisa, Kampala, Wakiso, Buikwe, Mbarara, Kasese, Kalangala, Mukono, Luweero
20,560,000 20,155,200
Nature For Life Conservation Initiatives(NALCO)
Ndeeba Parish Youth Association (NPYA)
Needy kids Uganda Yumbe - -
Network For Holistic Community Development (NEFHCOD)
Network for Water and Sanitation (NETWAS) Uganda Kamwenge, Mpigi, Mayuge, Ntungamo, Palisa, Kibuku, Nebbi, Kampala, Kabarole, 31,820,000 31,230,000

Uganda Water and Environment Sector Performance Report 2015
Annex, - 58 -
Name of NGO Districts Budget (UGX) Expenditure (UGX) Lira, Gulu, Kasese, Luwero, Amuria, Kamuli, Tororo, Alebtong
Ngonge Development Foundation
Noah's Ark Children's Ministry (NACMU)
North Ankole Diocese Rainwater Harvest (NADS) North Kigezi & Kinkiizi Dioceses Water and Sanitation Programme (NKKD WASTSAN)
Rukungiri & Kanungu (North Kigezi & Kinkiizi Dioceses respectively) 33,045,100 39,851,250
Nutricare International Limited (CBO) Yumbe - -
Off To Mission
OPEN PALM COWESER Rakai, Masaka, Mpigi 43,693,500 43,653,500
Organisation for Development and Solidarity (ODS) Soroti, Amuria 96,000,000 22,250,000
Orungo Integrated Development Organisation(OIDO)
Oxfam GB-Uganda
PAG-Soroti Mission Development Department
Paidha Water And Sanitation Association
Pakele Women's Association
Pakwach Development Forum
Pamo Volunteers Kumi 10,500,000 10,500,000
Partners for Children Worldwide (PfCW)
Partners In Community Transformation(PICOT) Koboko 4,430,000 3,250,000
Participatory Rural Development Organisation (PRDO)
Pentecostal Assemblies of God-Planning and Development Secretariat Kumi (PAG-PDS Kumi)
Bukedea, Kumi, Ngora, Pallisa Serere, Amuria and Abim districts with the mandate to operate country wide
81,671,000 30,954,000
Plan international Uganda Kamuli, Lira, Alebtong, Luwero, Tororo 976,612,625 903,182,000 Programme For Accessible Health, Communication And Education (PACE-formerly PSI Uganda)
Protos-Uganda

Uganda Water and Environment Sector Performance Report 2015
Annex, - 59 -
Name of NGO Districts Budget (UGX) Expenditure (UGX)
Rakai Counsellors’ Association (RACA)
Rakai-CBHP
Relief International Uganda
Rotary Club Of Masaka
Rural Gender And Development Association Rukungiri 1,580,000 1,270,000 Rukungiri Women Integrated Development Foundation (RWIDF) Rukungiri, Mitooma 230,300,000 150,300,000
Rural Community Strategy For Development (RUCOSDE)
Rural Country Development Organization
Rural Country Integrated Development Association (RUCIDA)
Rural Health Care Foundation Uganda Mubende, Mityana 1,580,000 1,270,000 Rural Initiative For Community Empowerment West Nile (RICE-WN) Maracha and Koboko 50,050,000 48,366,559
Rural Welfare Improvement For Development (RWIDE)
Rwenzori African Development Foundation Kasese and Bundibugyo 24,700,000 24,680,000
Rwenzori Youth Concern Association (RYCA)
Safe Water Works Association (SAWA) Rakai 102,650,000 7,250,000
Safer World International
Samaritan's International Relief
Samaritan's Purse International Relief Kiruhura, Isingiro, Kyegegwa, Oyam, Apac and Napak 1,004,200,000 1,010,213,000
Save the Vulnerable and Orphaned Children Initiative Bugiri, Namayingo 4,880,000 3,765,000
Shuuku Development Foundation Sheema 299,200,000 54,600,000
SNV-Netherlands Development Organisation
Alebtong, Apac, Arua, Dokolo, Lira, Mukono, Mubende, Kibaale, Kabarole, Kasese, Kyegegwa, Kyenjojo, Ntoroko, Maracha, Buliisa, Kampala, Yumbe,
- -

Uganda Water and Environment Sector Performance Report 2015
Annex, - 60 -
Name of NGO Districts Budget (UGX) Expenditure (UGX) Adjumani, Koboko, Moyo, Nebbi and Zombo
Sole Integrated Development Organisation (SIDO) Tororo 10,624,000 35,724,000 Soroti Catholic Diocese Integrated Development Organisation (SOCADIDDO)
Amuria, Kaberamaido, Katakwi, Kumi, Ngora, Serere and Soroti 419,571,414 376,710,448
Sustainable Sanitation and Water Renewal Systems (SSWARS)
TEMELE Development Organization(TEMEDE) Teso Environmental Sanitation And Hygiene Improvement Initiative
The Environment And Community Development Organization
Toro Development Agency (Kabarole)
Tororo District NGO Forum (TONGOF)
Two Wings Agro-forestry Network (TWAN)
Uganda Association for social economic progress
Uganda Cooperative Consultancy Firm
Uganda Domestic Sanitation Services (UGDOSS)
Uganda Environmental Education Foundation Mukono, Kayunga, Buikwe 65,475,408 60,098,850
Uganda Japan Association (UJA)
Uganda Muslim Rural Development Association (UMURDA)
Bugiri, Namayingo, Mayuge, Iganga, Mbale, Bududa, Manafwa, Butaleja, Palisa, Kibuku, Tororo, Busia, Kamuli, Kween, Bukwo, Kapchorwa, Namutumba, Sironko.
1,985,910,000 1,874,472,000
Uganda Rainwater Association Nation wide 12,000,000 11,160,000
Uganda Red Cross Society
Uganda Society Of Hidden Talents
UMREF
Union of Community Development Volunteers (UCDV) Rakai, Lwengo, Kalungu Bukomansimbi, Kampala, Mukono, Masaka, Namutumba, 429,100,000 357,200,000

Uganda Water and Environment Sector Performance Report 2015
Annex, - 61 -
Name of NGO Districts Budget (UGX) Expenditure (UGX) Mubende, Nakaseke, Sembabule, Hoima, Nakasongola, Mbale, Tororo
UWESO Masaka/Rakai
Voluntary Action For Development (VAD) Wakiso 44,710,000 1,125,520,000
Water School Uganda
Water Aid Uganda Kampala, Amuria, Pallisa, Kibuku, Nakapiripirit and Napak 7,959,781,530 7,246,324,195
Water For People Kamwenge, Masaka, Lira, Kitgum, Soroti 738,600,000 744,800,000
Water For Production Relief
Water Missions Uganda
Arua, Adjumani, Buikwe, Buliisa, Buyende, Jinja, Kamwenge, Luuka, Mukono, Mayuge, Masindi, Namayingo, Nebbi, Wakiso, Sheema
3,263,786,887 3,456,793,210
Water School Uganda - Eastern Region Nebbi, Zombo, Soroti, Ngora, Busia, Namayingo, Wakiso, Nakaseke, Kisoro 25,679,496 86,192,246
Welthungerhlife
Wera Development Agency (WEDA) Katakwi, Amuria, Pallisa and Kibuku 388,220,000 343,933,040
Women Alliance and Children Affairs(WAACHA) Iganga 41,500,000 26,500,000
World Vision – Buliisa Buliisa - -
World Vision – Hoima Hoima 228,468,336 7,584,138,764
World Vision Bundibugyo Bundibugyo 199,727,100 31,860,000
World Vision Kaabong FFK/KLEP Kaabong 160,500,000 157,500,000
World Vision Kibaale Kibaale 256,666,000 837,514,000
World Vision Mpigi Mpigi and Butambala 113,656,740 60,000,000
World Vision Nakasongola Nakasongola 2,036,980,000 2,051,010,700
World Vision Uganda Kamwenge and Bundibugyo 233,880,000 229,600,000
World Vision Uganda Kotido Kaabong Abim 35,423,681 35,584,723
WORLD VISION(BUIKWE) Buikwe 426,616,399 249,127,610

Uganda Water and Environment Sector Performance Report 2015
Annex, - 62 -
Name of NGO Districts Budget (UGX) Expenditure (UGX)
YES Busia
Youth Alive
Youth Development Organisation (YODEO)
Youth Environment Service
Youth Environment Service- yes Busia 40,000,000 34,600,000
Youth Initiative For Development Association (YIFODA)
Youth Social Work Association Uganda (YSA)
ZOA Uganda
Total 48,245,274,242 49,303,756,761
Legend
No report submitted for FY 2014/15
Report submitted for FY 2014/15

Uganda Water and Environment Sector Performance Report 2015
Annex, - 63 -
Annex 20. Progress on the Good Governance Action Plan for Water and Sanitation, June 2015
Recommendation Actions Responsible Expected Action FY 2014/15 or proposed strategy
Progress as at end of June 2015 Progress (+, =, -)
Remark/ Comment
Source of Action
Objective 1: Governance Oversight Strengthened 1.1.Raise political will so that GoU commits itself to drive the reform process
1.1.1Keep progress of GGAP on the agenda for the WESWG and top policy meetings, as well as JTR and JSR
GGWG/ PS/ WESLD
Progress reported Quarterly to WESWG, and rolling audit action plan on agenda for WSSSWG meetings
GGWG has been represented by the chairperson in all subsequent meeting of the WSSWG and the WESWG.
On course
GGAP/09/1/1.1
1.1.2 Include a progress GGWG report in SPR
GGWG/ PS/ WESLD
A comprehensive section on Good Governance included in SPR 2015
A comprehensive section on Good Governance has been included in SPR 2015
Done GGAP/09/1/1.2
1.2.Link water sector with anti-corruption institutions, policies and laws
1.2.1 Ensure adequate representation of oversight agencies (e.g. DEI, PPDA, AG, IG etc.) in GGWG
GGWG/ WESLD
Representative of DEI, PPDA, AG, IG take part in GGWG meetings and activities as well as Head PDU, Principal Internal Auditor, Public Relations Officer.
The Principal Internal Auditor represents the OAG, while the concerns of PPDA are taken care of by the PDU. Both bodies (OAG and PPDA) can be invited at any time for specific assignments when need arises.
On course
GGAP/09/1/2.1
1.3. Monitor the efficiency and use of the conditional grants and other existing funds.
1.3.1 Conduct a survey on efficiency and effectiveness of the Urban water grant.
Regulatory Department (RD)
Survey conducted and recommendations availed.
There was a delay in the procurement process. However, the contract was awarded to the best bidder and contract signed.
On course
JSR 2014 1.3.2 Conduct a survey on efficiency and effectiveness of the district sanitation grant.
WESLD Survey conducted and recommendations availed.
The ToR where developed. The implementation of the survey shall be after ensuring funding probably from the WESLD.
Stagnant Awaiting identification of funds
JSR 2014 1.3.3 Conduct periodic internal and external financial and technical audits.
PIA/ OAG/ PS/ RD/ FMA
Principal Internal Auditor and the office of the Auditor General provides audit reports to the MWE
The Internal Audit section carries out periodic internal financial and technical audits. The publicity of these audit reports is done by the MoFPED.
On course
There is need for public awareness on these reports
GGAP/09/2/6.3 1.3.4 New instruments to appraise and monitor full cost of investment.
Urban Water Department
Update the design manual and the WSDF operational manual to incorporate optimization of full cost.
All WSDFs are supposed to use Cost Center Accounting, a mechanism that inputs and sums all the cost incurred towards a utility. However, some costs like administration costs cannot be traced to a particular water utility/system.
On course
Need to find out how and if all WSDFs comply with it.
GGAP/09/2/6.3

Uganda Water and Environment Sector Performance Report 2015
Annex, - 64 -
Recommendation Actions Responsible Expected Action FY 2014/15 or proposed strategy
Progress as at end of June 2015 Progress (+, =, -)
Remark/ Comment
Source of Action
1.4. Enforce sector guidelines.
1.4.1 Create incentives for better management and governance. E.g. Public recognition for good performers, and an Integrity Award.
All ministry department / ULGA
Award best performers of the year at JSR, IDMS, District Water Officers meetings and bringing out those that are not compliant.
All ministry departments do not have a concrete measure for incentives and Sanctions. The available sanction to ministry staff is through staff appraisals and reprimand by writing to the staff. In the Rural dept, attention is made to the CAO and copied to the political leadership where a district is not meeting performance standards. The regulation dept is equally challenged given the institutional arrangement. The "Name & Shame" may be the only available sanction given the technicalities in the institutional arrangement. Regulation department will need support from GIZ-RUWASS
Stagnant Design a mechanism that collects and records governance issues as a basis for Name and Shame, and recognition of good performance. ULGA to take part
GGAP/09/1/3.3 1.4.2 Impose penalties and sanctions, e.g. withhold funds to non-performing districts, publicize non-compliant actors.
All ministry department / ULGA
GGWG receives compliance reports from commissioners on sanctions imposed in 2014/2015.
Stagnant
GGAP/09/1/3.1 1.5. Improve the capacity of both institutions and individuals to strengthen the oversight role.
1.5.1 Training WAs on institution & monitoring.
PTO Trained WAs WSDFs train Water Authorities when handing over a town and WDSF-C has contracted a consultant to develop a training manual, tools and material necessary to conduct an effective training for both new and old Water Authorities. The tools shall be used by both WSDFs and the Umbrella Organisations.
On course
Need to have a look into the manual and training material to ensure they achieve the desired objectives. GGAP/09/2/6.1
1.5.2 Build District Local Government capacity on certification of works
Rural Water & San Dept.
Districts are supported to effectively monitor and supervise the works
Stagnant Districts need support from TSUs. Need to involve ULGA
GGAP/09/10.4 1.9 Improve planning and management of water supplies.
1.9.9 Implement and report on the district grant allocation formula that was developed to address equity in hard to reach areas.
RWSD Implement formula The formula was presented and approved by Top level policy. However, the formula brings out drastic changes that the department would need to first prepare for its implementation and provide for its likely effects.
On course
The Rural department seem to be slow on this. It is more than two years of preparing for implementation. GGAP/09/3/11.3
1.6 Strengthen the GGWG and avail sufficient resources to support its activities
1.6.1 Provide specific budget line for GGWG activities under JPF sector program support
WESLD Ongoing annually from GoU and DPs
The GGWG activities are being implemented under the JPF sector program support. The Urban Water Grant survey and teas during the GGWG meetings are some of the activities funded under this support.
On course
GGAP/09/1/5.2 1.6.2 Review the TOR for the group
GGWG Review and operationalize GGWG TOR
The ToR where developed and approved by the GGWG and are being implemented.
Complete New

Uganda Water and Environment Sector Performance Report 2015
Annex, - 65 -
Recommendation Actions Responsible Expected Action FY 2014/15 or proposed strategy
Progress as at end of June 2015 Progress (+, =, -)
Remark/ Comment
Source of Action
1.6.3 Deepen the analysis of relevant golden indicators that have governance implications and report progress in SPR annually.
GGWG Develop measures, guidelines and indicators to be used in determining good governance in the water sector.
A taskforce composed of Stephen Greenhalgh, Finn Lauritsen, Rosemary Nakaggwa and Paul Bisoborwa was formed. The taskforce has done the mapping of governance issues in the sector and issue that are likely to have stronger impact on others to develop a framework for the indicator/ indices. A workshop shall be held with the GGWG and services of a consultant will be hired to make in-depth analysis into different processes.
On course
JSR 2014 1.6.5 Training for members to appreciate governance principles
PTO/ IGG/ DPP
Identify high profile people with good knowledge of the JLOS to make speeches (Water as a human right).
The Administration and Finance Department together with the Principle Training Officer of MWE are organizing governance event during the Friday teas with guest speakers on good governance.
On course
Invite speakers from IGG, ACCU, Prison and others
New PTO/PDU Conduct training on procurement
planning and contracts management
Procurement officers, Engineers and contracts committees from the WSDFs, TSUs and ministry Head Quarters were trained in procurement planning & Contracts Management.
On course
Planning to conduct an online training on governance
1.7 Improve data and record management
1.7.1 Review management model of rural water supplies to address poor financial record keeping with community contributions; pilot alternative model based on review outcomes
Comm. Rural Water Dept./ SNV
Ongoing review of Community Based Management System to inform actions on the way forward on operation and maintenance.
SNV is piloting a new management model on behalf of the Rural Water and Sanitation Dept. The model aims at promoting Sub-County Water and Sanitation Boards (SWSB) to improve on reporting especially on the non-functionality of water sources.
On course
GGAP/09/11.2
1.7.2 Dedicate staff to follow up on documentation of completed works to strengthen certification of rural water service processes
Comm. Rural Water Dept.
TSUs should back up soft copy documentation / record which should ensure that records have gone up to water resources management. Evaluate performance of district water office as regards documentation of completed works
The department may not be able to dedicate staff to follow on the documentation of completed works, however, TSUs has been providing support when need arises. Verification of works of all completed sources is done by the districts and a report on permits by the contractors is given to the DWRM.
Stagnant
This should be taken on by the District Local government with support from ULGA.
GGAP/09/10.1

Uganda Water and Environment Sector Performance Report 2015
Annex, - 66 -
Recommendation Actions Responsible Expected Action FY 2014/15 or proposed strategy
Progress as at end of June 2015 Progress (+, =, -)
Remark/ Comment
Source of Action
1.7.3 Include records management as part of the MoU between MWE and Local Government
MWE MoU clause should be drafted and endorsed by stakeholders
The Rural Dept can only enter into an MOU where the funding is given from the center. But in cases where the Local Government is using DWSCG or support from NGOs, then this MOU cannot be in place.
Stagnant Clauses on record mgt can be included where possible.
GGAP/09/3/9.2
Objective 2: Improvement in procurement processes, Project Implementation and contract management within the sector 2.1. Improvement in procurement processes and control measures.
2.1.3 Conduct regular procurement audits, at least every two years
PPDA/ Principal Internal Auditor
PPDA responsible to keep on track and encouraged to publish on their web site
The Internal Audit section carries out procurement audits every year. The publicity of these audit reports is done by the MoFPED.
On course
The need for public awareness on these reports
GGAP/09/12.2
2.3.4 Information should be made publicly available on procedures for appointment of members of Evaluation Committees
PDU
PPDA should commit to undertake this.
The procedures are laid in the PPDA Act of 2003(37). The procedures for appointing members of Evaluation Committees were shared in the GGWG meeting. More publication has been done with the GGWG newsletter.
On course
Provided in the law / under the act GGAP/09/15.3
Objective 3. Bridging the implementation gap through access to information and empowerment of water users 3.1 Enhance and increase constructive involvement by media using findings from CSOs and sector actors.
3.1.1 Conduct frequent dialogue in Water and sanitation subsector and social accountability
GGWG/ UWASNET/ TIU/ IGG/ ENR
Governance Workshop, Formation of the Good Governance Week or Day
The GGWG has developed an awareness strategy with the aim of introducing a positive perception towards good governance in the water fraternity. Governance workshops, seminars, dialogues, publications and a conference shall all be used to create awareness and change the negative perception about governance.
On course
New 3.1.2 LGs and CSOs have access to reliable information on flow of funds
MoFPED - BMAU, CSBAG
MoFPED to provide accurate funding flow figures on water & sanitation from national to S/C level
UWASNET disseminates budget releases to the districts and do quarterly monitoring of these budgets.
On course
The CSOs are able to access the information easily GGAP/09/19.1
3.2. Improve record keeping at District, regional and national level
3.2.1Districts to prepare and store technical and financial completion reports in soft and hard copies
Rural Water & San Dept.
Assess infrastructure at district level for record keeping. Those who do not have computers and cabinets make proposal and budgets for computers, cabinets and staffing for record keeping
Districts report to the ministry in hard copy form yet they all have computers to send a softcopy of the same report. Rural is to design a mechanism that allow both soft and copy reports.
Stagnant The reports from the districts are performance reports and not completion reports.
GGAP/09/9.1

Uganda Water and Environment Sector Performance Report 2015
Annex, - 67 -
Recommendation Actions Responsible Expected Action FY 2014/15 or proposed strategy
Progress as at end of June 2015 Progress (+, =, -)
Remark/ Comment
Source of Action
3.3. Implementing NGOs become transparent and accountable using QA in operations
3.3.2 CSOs provide information on funding flows and budget performance to the NGO board and UWASNET
UWASNET Performance report by UWASNET, which is then reported in the Sector Performance Report.
UWASNET called for reports from all its members on funding flows and budget performance.
On course
Some CSOs don't report. The NGO Board should enforce for all CSOs to report.
GGAP/09/18.2
3.4 Ensure that CSOs capacity is built to have a respected position and their voice taken seriously by all stakeholders
3.4.4 CSOs supported to demand for, analyse and report on sector funding flows and utilisation
ACCU Capacity building in budget tracking and resource monitoring.
WaterAid in collaboration with CSBAG have strengthened the capacity of other CSOs in analysing and reporting on sector funding flows and utilization.
On course
BMAU does not do capacity development, is only focused at monitoring. Need to talk to CSBAG
GGAP/09/19.2
Progress Measurement: + means: positive developments (progress);
= means: no progress, but also not getting worse (stagnation)
- means: negative developments (getting worse);

Uganda Water and Environment Sector Performance Report 2015
Annex, - 68 -
Annex 21. Summary of ENR CSO Governance activities with regard to Oil Governance
Broad ENR CSO Governance activities
Specific activities implemented Lessons learnt
Civic education and stakeholder awareness of holding duty bearers accountable
Civic engagements on rights and issues 6 Community outreach and dialogues meetings held in Buliisa, Hoima, Nwoya Districts.
The community sensitization meetings provided a platform for locals to interface with their local leaders and amplify their issues of concern within their environs.
Capacity Building 12 Awareness raising and sensitization meetings for communities in Buliisa, Hoima and Nwoya on property rights, environmental and social rights, land rights, Human rights, economic rights with respect to oil governance Conducted a capacity strengthening training on EIA for local leaders in Butiaba- Buliisa District. Conducted 4 Sensitization meetings on impact of oil developments on wildlife in Nwoya District. Conducted 2 Training of Trainers for environmental CBO practitioners in Masindi and Hoima. Conducted a regional training for lawyers in East Africa on Public Interest Environmental Litigation
Continuous engagements and knowledge building have not only improved debates and negotiation skills for the community members but also built a critical mass of locals to demand for transparency and accountability in the oil and gas sector. Knowledge on EIA is key in applying EIA as a tool to monitor likely negative impacts of oil and gas developments on the environment. Issue of human-wildlife conflicts featured prominently in Nwoya District. Engagement of UWA oil and gas technical officers commended Training of Trainers for CBOs is important for imparting knowledge and skills to as many recipients as possible. Practicing environmental law is not very popular with many lawyers and therefore not many lawyers take on environmental cases because they are not lucrative.
Advocacy engagements towards good governance
Developed info sheets on land rights with respect to oil governance to empower communities on land rights. Disseminated and piloted a community based tool on monitoring oil developments on the environment as a means of promoting access to information. Held strategic meetings with District Local Governments in Buliisa, Nwoya and Hoima Districts on different aspects of oil governance.
Info sheets in form of simplified literature with illustrations on fundamental issues that the communities face is critical. Communities need to be empowered to actively get involved in monitoring oil developments and hold duty bearers accountable and appreciate their roles. Strategic meetings with local leaders are important in creating partnerships and also ownership and recognition of the project activities within the district.
Media Engagement e.g. TV/Radio/press release
Conducted an interview on oil revenue management which was televised on NBS TV. Held radio talk shows on environmental aspects of oil governance, land rights, local participation in oil and gas industry on a quarterly basis for 2 years. TV airing of community outreach work
Engagements through local media are instrumental for their wide listenership and outreach of the messages broadcasted to villages that were never targeted or physically engaged.

Uganda Water and Environment Sector Performance Report 2015
Annex, - 69 -
Developed and aired pre-recorded messages in local languages on oil and gas governance on Kitara F.M, Radio King F.M to raise awareness for communities
Cross cutting issues livelihood improvement e.g. Food and income security Gender HIV/AIDS
Gender dialogue sessions on oil governance for Youths and women in Buliisa, Ngwedo, Sub-counties, Buliisa District. Issues discussed include participation of women and youths in the oil industry, HIV and AIDS, agriculture and food security.
Mainstreaming gender considerations and the role the different gender actors play in oil and gas developments was important in identifying issues of great concern to different gender aspects.
Challenges 1. Long court processes, sometimes resulting in disappearance of evidence 2. Some environmental degraders become hostile to enforcement officers 3. Environmental crime occurs usually at night, during weekends or public holidays
when the inspectors are not at work 4. Some environmental degraders secure court injunctions deterring environmental
inspectors from taking action 5. Unprofessional behaviour of environmental practitioners in regard environmental
impact studies 6. Penalties in courts of law are not deterrent enough
Recommendations x There is need for more sensitization of judicial officers on the need to handle court courses
expeditiously x There is need for provision of adequate resources in terms of personnel and funds x Inspections should be carried out all the time