water accounting standards board - bureau of … awas are issued by the water accounting standards...
TRANSCRIPT
Water Accounting Standards Board An independent advisory Board to the Bureau of Meteorology
Associated Model Reports for the Exposure Draft of Australian Water Accounting Standard 1
Associated Model Reports for the Exposure Draft of Australian Water Accounting Standard 1: Preparation and Presentation of General Purpose Water Accounting Reports (ED AWAS 1) are available online at: www.bom.gov.au/water/wasb
Copyright
Commonwealth of Australia (Bureau of Meteorology) 2010
First published by the Water Accounting Standards Board in 2010.
The Exposure Draft of Australian Water Accounting Standard 1: Preparation and Presentation of General Purpose Water Accounting Reports (ED AWAS 1) and associated model reports were approved by the Water Accounting Standards Board on 9 June 2010. Their development and publication was funded by the Raising National Water Standards program (RNWS) administered by the National Water Commission.
Water Accounting Standards Board members:
• Michael RL Smith (Chairman)
• W Peter Day
• Denis W Flett
• Jayne M Godfrey
• Thomas L Vanderbyl
Suggested reference:
Water Accounting Standards Board, Associated Model Reports for the Exposure Draft of Australian Water Accounting Standard 1: Preparation and Presentation of General Purpose Water Accounting Reports, Commonwealth of Australia.
ISBN: 978-0-642-70613-3
Contents
Introduction
The Model Reports
Wallaroo Water System
Energetico Hydro Corporation
Terra Firma Water Supply System
Minton Environmental Water Holder
1
Introduction
The enclosed group of model reports are illustrations of General Purpose Water Accounting Reports (GPWAR) prepared in accordance with the Exposure Draft of Australian Water Accounting Standard 1: Preparation and Presentation of General Purpose Water Accounting Reports (ED AWAS 1).
The model reports included in this publication are demonstrations of different types of water accounting reports under varied physical and administrative situations for fictitious water report entities. They are intended to illustrate the application of the ED AWAS 1 in these varied situations. While the model reports are intended to provide a useful base from which practitioners can obtain an understanding of the concepts in ED AWAS 1, they should not be used as templates or comprehensive checklists of the presentation and disclosure requirements of the ED AWAS 1.
To gain an understanding of the information described in the model reports, the model reports need to be read in full. There is significant information in the note disclosures that is not necessarily cross-referenced from the water accounting statements, such as information about water used in the pursuit of environmental benefits and the future prospects of the water report entity.
The model reports contained in this document will require continual updating as new and amended AWAS are issued by the Water Accounting Standards Board. The model reports in this publication do not include changes arising from new or amending AWAS issued after June 2010.
2
The Model Reports
The enclosed model water accounting reports are for four fictitious water report entities that represent four different types of water entities:
• a water supply system
• a major user of water
• an urban utility supply system
• an environmental water rights holder.
Accordingly, the model reports demonstrate different types of water assets, water liabilities and note disclosures.
The Wallaroo Water System
The Wallaroo Water System (Wallaroo) water accounting report is an updated version of the water accounting report released with the Preliminary Australian Water Accounting Standard. This report has been updated to reflect a more realistic water report entity and illustrates some of the more complex aspects of the ED AWAS 1.
The Wallaroo water accounting report illustrates the application of the ED AWAS 1 to a regulated river system.
The Wallaroo water accounting report has been prepared by the government regulator – the Department of Water and the Visual Arts (DWVA) – although the day-to-day operational management responsibility for the regulated Wallaroo Water System has been delegated to Testcorp, a government-owned water resource management body. Therefore the report preparer and the organisation with management responsibilities for the water report entity are different, which is a situation contemplated by the ED AWAS 1:55.
Under different governance arrangements, the report might have been prepared by Testcorp and included information provided by DWVA, or alternatively prepared by Testcorp to reflect only the part of the system managed by Testcorp.
Energetico
The Energetico water accounting report illustrates the application of the ED AWAS 1 by a hydropower organisation (i.e. a major user of water). It is equally relevant for other organisations that are major users of water.
Terra Firma
The Terra Firma water accounting report illustrates the application of the ED AWAS 1 for an urban utility supply system for which Terra Firma Corporation has management responsibility. It is equally relevant to rural utilities.
Minton Environmental Water Holder
The Minton Environmental Water Holder water accounting report illustrates the application of the ED AWAS 1 by an environmental water rights holder with management responsibilities for water entitlements to provide defined environmental benefits. It is equally relevant for other water report entities without physical water assets and only water rights and obligations.
2 3
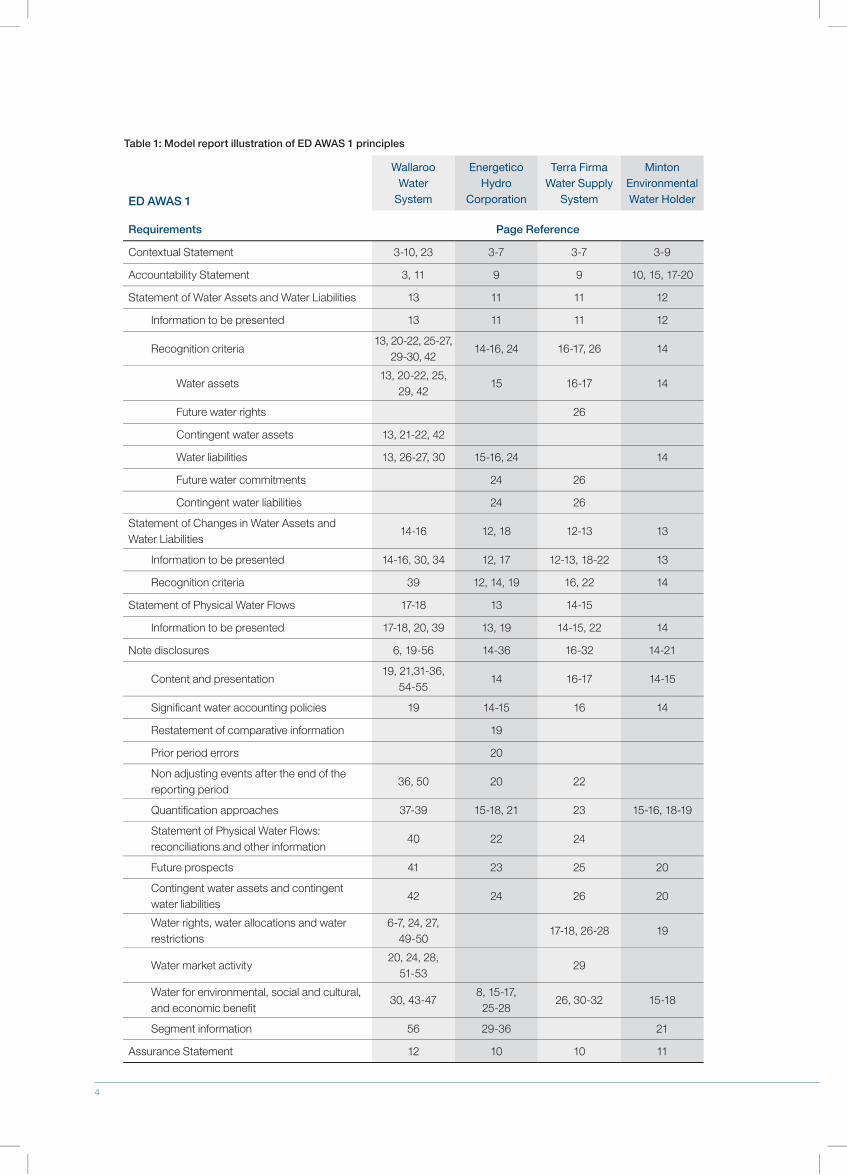
Table 1: Model report illustration of ED AWAS 1 principles
ED AWAS 1
Wallaroo Water
System
Energetico Hydro
Corporation
Terra Firma Water Supply
System
Minton Environmental Water Holder
Requirements Page Reference
Contextual Statement 3-10, 23 3-7 3-7 3-9
Accountability Statement 3, 11 9 9 10, 15, 17-20
Statement of Water Assets and Water Liabilities 13 11 11 12
Information to be presented 13 11 11 12
Recognition criteria13, 20-22, 25-27,
29-30, 4214-16, 24 16-17, 26 14
Water assets13, 20-22, 25,
29, 4215 16-17 14
Future water rights 26
Contingent water assets 13, 21-22, 42
Water liabilities 13, 26-27, 30 15-16, 24 14
Future water commitments 24 26
Contingent water liabilities 24 26
Statement of Changes in Water Assets and Water Liabilities
14-16 12, 18 12-13 13
Information to be presented 14-16, 30, 34 12, 17 12-13, 18-22 13
Recognition criteria 39 12, 14, 19 16, 22 14
Statement of Physical Water Flows 17-18 13 14-15
Information to be presented 17-18, 20, 39 13, 19 14-15, 22 14
Note disclosures 6, 19-56 14-36 16-32 14-21
Content and presentation19, 21,31-36,
54-5514 16-17 14-15
Significant water accounting policies 19 14-15 16 14
Restatement of comparative information 19
Prior period errors 20
Non adjusting events after the end of the reporting period
36, 50 20 22
Quantification approaches 37-39 15-18, 21 23 15-16, 18-19
Statement of Physical Water Flows: reconciliations and other information
40 22 24
Future prospects 41 23 25 20
Contingent water assets and contingent water liabilities
42 24 26 20
Water rights, water allocations and water restrictions
6-7, 24, 27, 49-50
17-18, 26-28 19
Water market activity20, 24, 28,
51-5329
Water for environmental, social and cultural, and economic benefit
30, 43-478, 15-17, 25-28
26, 30-32 15-18
Segment information 56 29-36 21
Assurance Statement 12 10 10 11
4
Model Water Accounting Report
Wallaroo Water System
General Purpose Water Accounting Report30 June 2X10
Prepared by the Department of Water and the Visual Arts An illustration of an Australian general purpose water accounting report for a fictitious water report entity

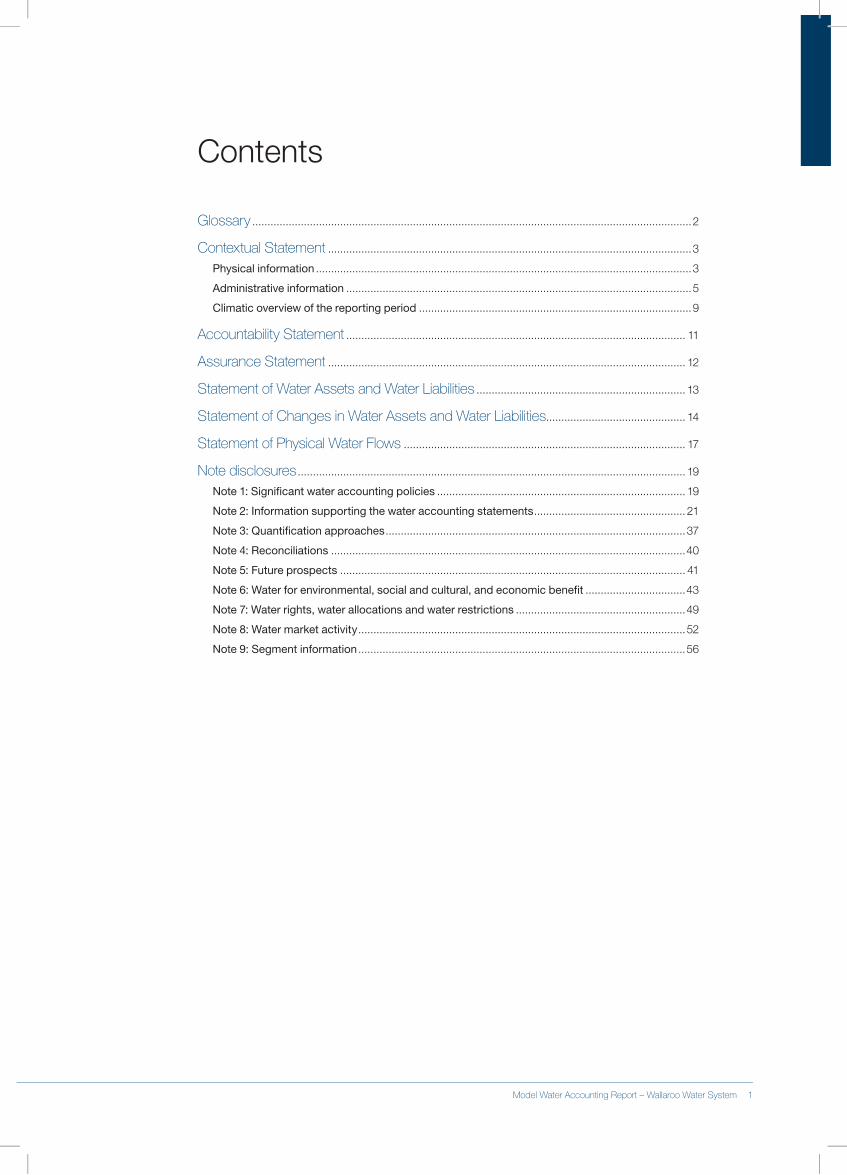
Contents
Model Water Accounting Report – Wallaroo Water System 1
Glossary..................................................................................................................................................2
Contextual Statement.........................................................................................................................3Physical information.............................................................................................................................3
Administrative information...................................................................................................................5
Climatic overview of the reporting period...........................................................................................9
Accountability Statement................................................................................................................. 11
Assurance Statement....................................................................................................................... 12
Statement of Water Assets and Water Liabilities...................................................................... 13
Statement of Changes in Water Assets and Water Liabilities.............................................. 14
Statement of Physical Water Flows.............................................................................................. 17
Note disclosures................................................................................................................................. 19
Note 1: Significant water accounting policies................................................................................... 19
Note 2: Information supporting the water accounting statements...................................................21
Note 3: Quantification approaches....................................................................................................37
Note 4: Reconciliations......................................................................................................................40
Note 5: Future prospects................................................................................................................... 41
Note 6: Water for environmental, social and cultural, and economic benefit..................................43
Note 7: Water rights, water allocations and water restrictions.........................................................49
Note 8: Water market activity.............................................................................................................52
Note 9: Segment information.............................................................................................................56
Glossary of terms used in this report not defined in ED AWAS 1
The.terms.listed.below.are.additional.terms.to.ED.AWAS.1.used.in.this.General.Purpose.Water.Accounting.Report.but.are.not.inconsistent.with.ED.AWAS.1.
•. Water system.–.A.system.that.is.hydrologically-connected.and.described.at.the.level.desired.for.management.purposes.(e.g..sub-catchment,.catchment,.basin.or.drainage.division.and/or.groundwater.management.unit,.sub.aquifer,.aquifer,.groundwater.basin).1
•. Entitlement.–.Short.version.of.‘Water.access.entitlement’:.A.perpetual.or.ongoing.entitlement.to.exclusive.access.to.a.share.of.water.from.a.specified.consumptive.pool.as.defined.in.the.relevant.water.plan.2
•. Allocation.–.Short.version.of.‘Water.allocation’:.The.specific.volume.of.water.allocated.to.water.access.entitlements.in.a.given.season,.given.accounting.period,.defined.according..to.rules.established.in.the.relevant.water.plan.3.
•. High/General security entitlement.–.The.frequency.with.which.water.allocated.under.a.water.access.entitlement.is.able.to.be.supplied.in.full.4
•. Allocation announcement.–.The.obligating.event.that.creates.the.legal.right.to.access.a.water.allocation,.and.the.corresponding.obligation.to.deliver.the.water.
•. Entitlement trade –.A.transfer.of.an.entitlement.from.one.legal.entity.to.another,.with.or.without.a.change.in.location.5
•. Allocation trade.–.An.assignment.of.water.allocation.from.one.authorised.water.user.to.another,.or.between.water.accounts.held.by.the.same.water.user,.with.or.without.a.change.in.location.6
•. Regulated storage.–.A.water.storage.on.a.regulated system.
•. Regulated system.–.River.system.where.the.flow.of.the.river.is.regulated.through.the.operation.of.large.dams.or.weirs.7
•. Unregulated storage.–.A.water.storage.on.an.unregulated system.
•. Unregulated system.–.River.system.where.flows.are.not.regulated.by.the.operation.of.structures.such.as.major.dams.or.weirs.8
•. Environmental/social/cultural benefit.–.Part.of.‘Environmental.and.other.public.benefit.outcomes’:.Environmental.and.other.public.benefit.outcomes.are.defined.as.part.of.the.water.planning.process,.are.specified.in.water.plans.and.may.include.a.number.of.aspects,.including:.–.environmental.outcomes:.maintaining.ecosystem.function.(e.g..through.periodic.inundation.of.floodplain.wetlands);.biodiversity,.water.quality;.river.health.targets;.–.other.public.benefits:.mitigating.pollution,.public.health.(e.g..limiting.noxious.algal.blooms),.Indigenous.and.cultural.values,.recreation,.fisheries,.tourism,.navigation.and.amenity.values.9
1. National.Water.Initiative2. Ibid3. Ibid.4 Ibid.5. Australian.Water.Markets.Report.2009-09,.National.Water.Commission6. Ibid7. Australian.Water.Resources.2005,.National.Water.Commission.8. Ibid.9. National.Water.Initiative
Glossary
2 Wallaroo Water System – Model Water Accounting Report
ED AWAS 1 Ref
Para 48-49 Contextual Statement
Para 49 Physical information
Description of the water report entity
The.water.report.entity.for.which.this.General.Purpose.Water.Accounting.Report.is.prepared.is.Wallaroo.Water.System..This.system.is.contained.within.a.catchment.in.the.State.of.Minton.and.the.principal.economic.activity.is.agriculture..The.main.river.in.the.catchment.is.the.Wallaroo.River,.which.is.regulated.by.Pierre.Jour.Reservoir.in.order.to.provide.water.to.the.residents.for.domestic.use,.agriculture.and.other.commercial.activities.
The.Wallaroo.Water.System.is.defined.according.to.the.geographical.features.listed.below..
•. the.river.channel.and.catchment.area.of.the.section.of.the.Wallaroo.River.and.Smith..Creek.(including.associated.minor.on.and.off.stream.catchment.storages).that.is.an.unregulated.system..
•. the.river.channel.and.catchment.area.of.the.section.of.the.Wallaroo.River.(including.the.Pierre.Jour.Reservoir,.Lake.Humphrey.and.the.Cherant.and.Nirvana.Weir.pools).that.is..a.regulated.system..
•. the.Vanderbelt.groundwater.management.area.(suitable.for.non-potable.use),.which.lies.beneath.and.also.extends.beyond.the.surface.water.catchment.areas.identified.above..
The.water.assets.that.are.recognised.in.this.general.purpose.water.accounting.report.are..those.from.which.the.stakeholders.of.Wallaroo.Water.System.will.draw.future.benefits..However,.certain.water-related.aspects.that.are.present.within.the.geographical.features.listed.above.and.for.which.Testcorp.does.not.have.management.responsibility.have.been.excluded.from.this.report.on.the.basis.that.they.are.not.water.assets.of.the.water.report.entity..These.are.listed.below:.
•. the.Helgaville.urban.supply.and.wastewater.system.
•. the.Longford.Irrigation.supply.and.drainage.collection.network.
•. the.Namatjira.Native.Title.area.
•. soil.moisture.
Connections.with.these.excluded.water.aspects.occur.and.are.recorded.in.the.Statement.of.Changes.in.Water.Assets.and.Water.Liabilities.and.Statement.of.Physical.Water.Flows..Other.connections.with.external.water.report.entities.include.cross-boundary.physical.water.flows.and.intervalley.water.trade.accounts.with.the.entities.listed.below:
•. Menace.River.–.located.in.the.adjacent.catchment,.with.an.upper.river.diversion.into.the.regulated.section.of.the.Wallaroo.River.
•. Baxter.River.–.located.in.the.adjacent.catchment,.with.the.Wallaroo.River.being.one.of.the.tributaries.to.the.regulated.Baxter.River.
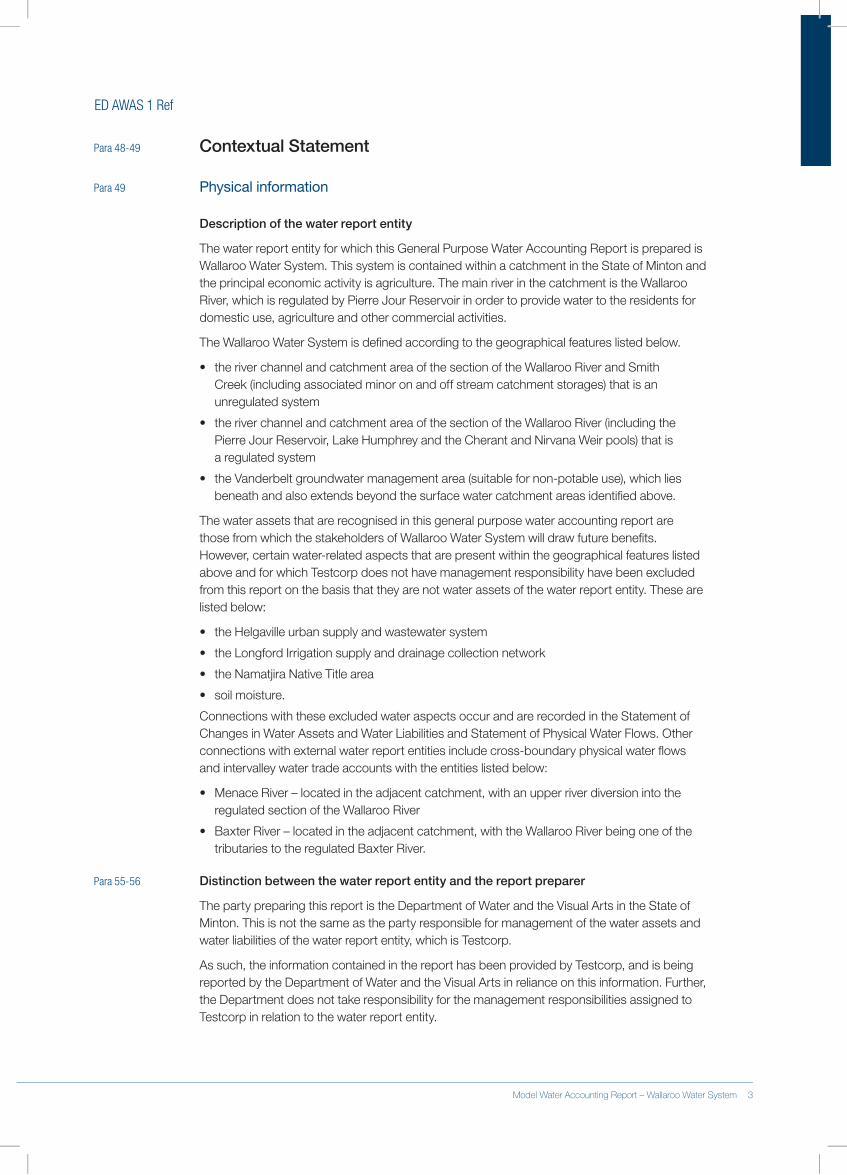
Para 55-56 Distinction between the water report entity and the report preparer
The.party.preparing.this.report.is.the.Department.of.Water.and.the.Visual.Arts.in.the.State.of.Minton..This.is.not.the.same.as.the.party.responsible.for.management.of.the.water.assets.and.water.liabilities.of.the.water.report.entity,.which.is.Testcorp.
As.such,.the.information.contained.in.the.report.has.been.provided.by.Testcorp,.and.is.being.reported.by.the.Department.of.Water.and.the.Visual.Arts.in.reliance.on.this.information..Further,.the.Department.does.not.take.responsibility.for.the.management.responsibilities.assigned.to.Testcorp.in.relation.to.the.water.report.entity..
2 Wallaroo Water System – Model Water Accounting Report Model Water Accounting Report – Wallaroo Water System 3
ED AWAS 1 Ref
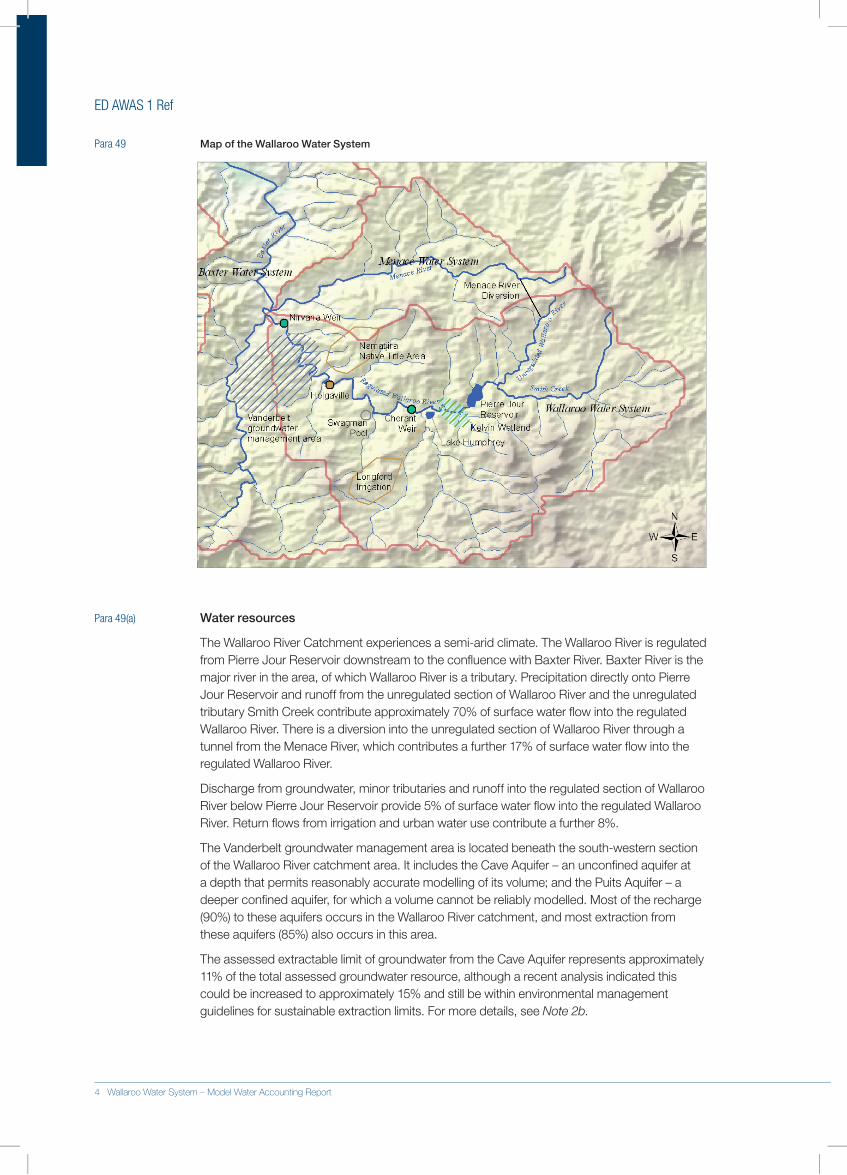
Para 49 Map of the Wallaroo Water System
Para 49(a) Water resources
The.Wallaroo.River.Catchment.experiences.a.semi-arid.climate..The.Wallaroo.River.is.regulated.from.Pierre.Jour.Reservoir.downstream.to.the.confluence.with.Baxter.River..Baxter.River.is.the.major.river.in.the.area,.of.which.Wallaroo.River.is.a.tributary..Precipitation.directly.onto.Pierre.Jour.Reservoir.and.runoff.from.the.unregulated.section.of.Wallaroo.River.and.the.unregulated.tributary.Smith.Creek.contribute.approximately.70%.of.surface.water.flow.into.the.regulated.Wallaroo.River..There.is.a.diversion.into.the.unregulated.section.of.Wallaroo.River.through.a.tunnel.from.the.Menace.River,.which.contributes.a.further.17%.of.surface.water.flow.into.the.regulated.Wallaroo.River..
Discharge.from.groundwater,.minor.tributaries.and.runoff.into.the.regulated.section.of.Wallaroo.River.below.Pierre.Jour.Reservoir.provide.5%.of.surface.water.flow.into.the.regulated.Wallaroo.River..Return.flows.from.irrigation.and.urban.water.use.contribute.a.further.8%.
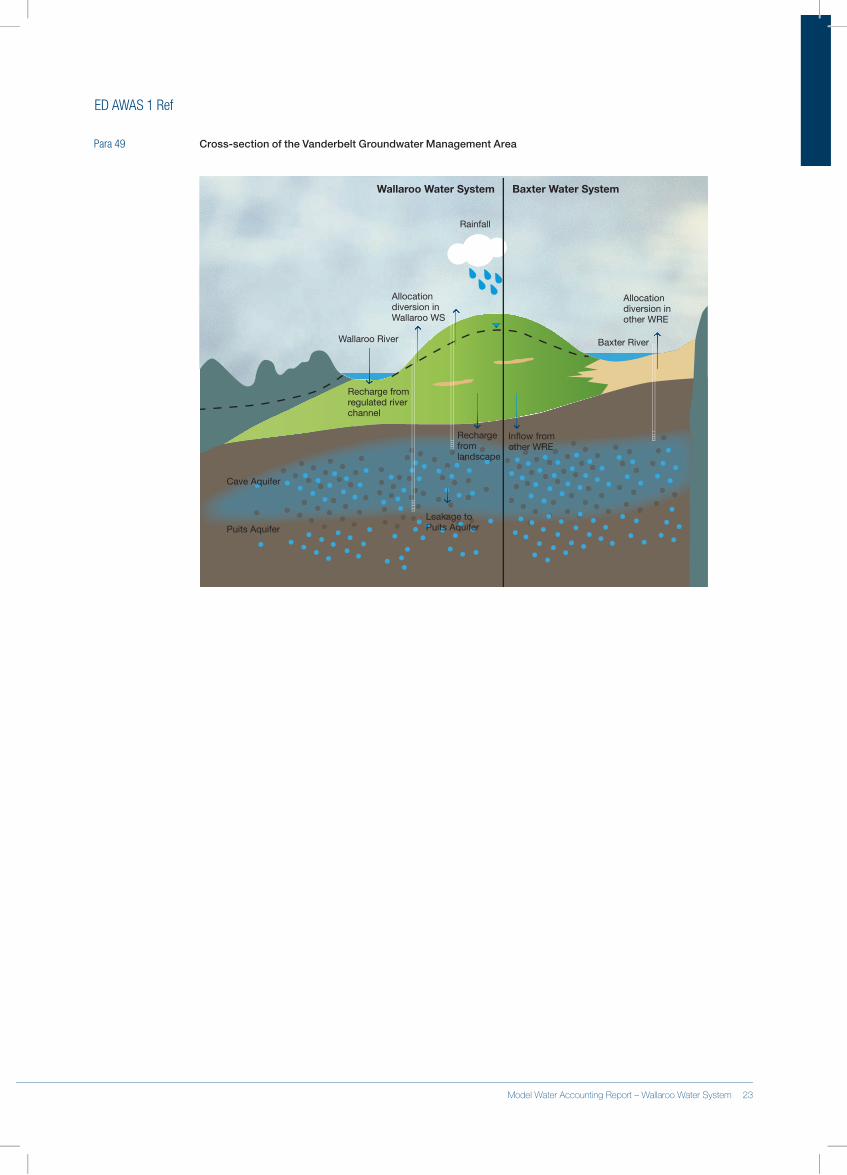
The.Vanderbelt.groundwater.management.area.is.located.beneath.the.south-western.section.of.the.Wallaroo.River.catchment.area..It.includes.the.Cave.Aquifer.–.an.unconfined.aquifer.at.a.depth.that.permits.reasonably.accurate.modelling.of.its.volume;.and.the.Puits.Aquifer.–.a.deeper.confined.aquifer,.for.which.a.volume.cannot.be.reliably.modelled..Most.of.the.recharge.(90%).to.these.aquifers.occurs.in.the.Wallaroo.River.catchment,.and.most.extraction.from.these.aquifers.(85%).also.occurs.in.this.area..
The.assessed.extractable.limit.of.groundwater.from.the.Cave.Aquifer.represents.approximately.11%.of.the.total.assessed.groundwater.resource,.although.a.recent.analysis.indicated.this.could.be.increased.to.approximately.15%.and.still.be.within.environmental.management.guidelines.for.sustainable.extraction.limits..For.more.details,.see.Note 2b.
4 Wallaroo Water System – Model Water Accounting Report
ED AWAS 1 Ref
Para 49(a) Water infrastructure of the regulated river system
The.principal.storage.is.Pierre.Jour.Reservoir,.which.is.located.on.the.regulated.Wallaroo.River.below.the.confluence.with.Smith.Creek.and.the.diversion.from.Menace.River..This.reservoir.has.a.capacity.of.3.000.000.ML..
There.are.two.weirs.and.associated.pools.in.the.catchment..Cherant.Weir.(capacity..20.000.ML).is.the.principal.source.of.water.for.Lake.Humphrey.and.the.Longford.Irrigation.supply.network..End.of.system.flows.are.measured.below.Nirvana.Weir.(capacity.10.000.ML).at.Gauging.Station.30032010.before.the.Wallaroo.River.enters.Baxter.River..
Lake.Humphrey.(capacity.500.000.ML).is.a.major.off-stream.water.storage.managed.by.Testcorp,.and.is.used.as.a.holding.storage.to.supply.Longford.Irrigation.with.its.share.of..the.inflows.to.Pierre.Jour.Reservoir,.according.to.a.capacity.share.agreement..
Para 49(b) Administrative information
Water resource management instruments
The.Wallaroo.Water.Resources.Management.Plan.2X05.(WRMP).is.the.principal.instrument..for.water.sharing..This.plan.was.developed.by.the.Department.of.Water.and.the.Visual.Arts..in.accordance.with.provisions.of.the.Minton Water Act and.was.approved.by.the.Minton.State.Government..The.WRMP.sets.out.environmental,.social.and.cultural.river.flow.objectives;.the.parameters.for.the.extraction.of.groundwater.and.for.the.diversion.and.storage.of.unregulated.surface.water;.and.the.supply.reliability.objectives.for.the.diversion.of.regulated.surface.water..
Under.the.WRMP,.Testcorp.and.the.Longford.Irrigation.Cooperative.access.water.from.Pierre.Jour.Reservoir.under.a.capacity.share.agreement.whereby.Longford.Irrigation.receives.20%.of.inflows.and.Testcorp.receives.80%..Pierre.Jour.Reservoir.is.operated.by.Testcorp,.and.the.bulk.rural.entitlement.held.by.Longford.Irrigation.represents.its.share.of.the.capacity.of.the.reservoir..All.other.entitlements.for.the.regulated.Wallaroo.Water.System.are.supplied.from.Testcorp’s.share.of.the.capacity.of.the.reservoir.and.any.flows.occurring.downstream.of.the.reservoir.
The.Longford.Irrigation.share.of.Pierre.Jour.Reservoir.is.transferred.and.stored.in.Lake.Humphrey..Testcorp.is.responsible.for.managing.the.water.levels.in.this.lake.to.ensure.that.Longford.Irrigation.has.access.to.its.entitlement,.and.must.also.ensure.that.the.level.does.not.fall.below.a.minimum.volume.of.100.000.ML..This.volume.is.set.at.this.level.in.order.to.maintain.facilities.for.recreational.swimming,.boating.and.fishing.activities..Evaporation.from.Lake.Humphrey.comes.out.of.Testcorp’s.capacity.share..
The.Wallaroo.Resource.Operations.Plan.2X07.(ROP).is.the.instrument.that.sets.out.the.procedures.for.annual.water.allocation.or.restriction.as.well.as.rules.for.the.trading.of.both.entitlements.and.allocations..The.ROP.was.approved.by.the.Department.of.Water.and.the.Visual.Arts.after.a.rigorous.process,.which.ensured.that.its.provisions.were.consistent.with.the.provisions.of.the.WRMP..Accordingly.the.ROP.permits.entitlements.to.be.traded.with.hydrologically-connected.locations.within.the.specific.limits..All.water.entitlement.and.licence.details.are.kept.in.a.State-wide.register.by.the.Department.of.Water..Under.the.ROP,.both.allocation.and.entitlement.trading.is.permitted.between.entitlement.holders.supplied.by.Testcorp.and.entitlement.holders.supplied.by.Longford.Irrigation,.with.permanent.trades.resulting.in.an.adjustment.to.the.capacity.share.arrangements.between.Testcorp.and..Longford.Irrigation.
4 Wallaroo Water System – Model Water Accounting Report Model Water Accounting Report – Wallaroo Water System 5
ED AWAS 1 Ref
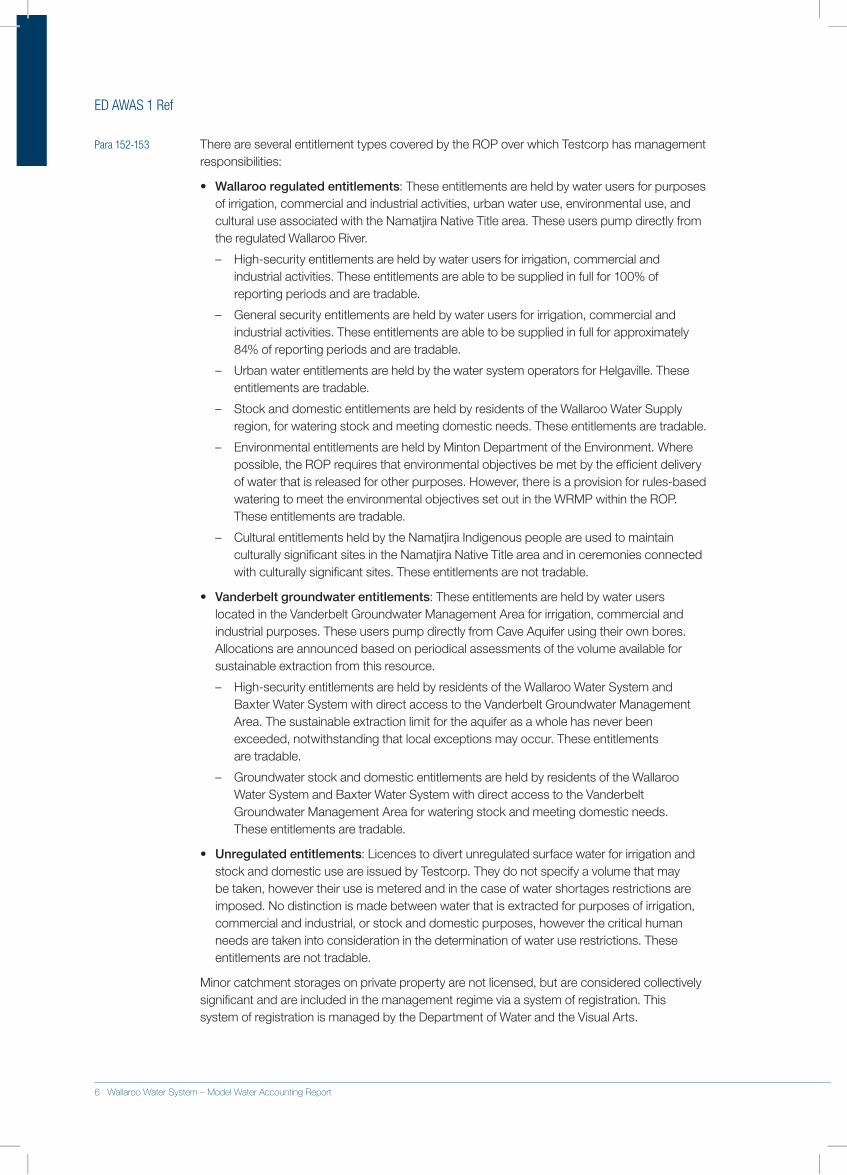
Para 152-153 There.are.several.entitlement.types.covered.by.the.ROP.over.which.Testcorp.has.management.responsibilities:
•. Wallaroo regulated entitlements:.These.entitlements.are.held.by.water.users.for.purposes.of.irrigation,.commercial.and.industrial.activities,.urban.water.use,.environmental.use,.and.cultural.use.associated.with.the.Namatjira.Native.Title.area..These.users.pump.directly.from.the.regulated.Wallaroo.River.
.– High-security.entitlements.are.held.by.water.users.for.irrigation,.commercial.and.industrial.activities..These.entitlements.are.able.to.be.supplied.in.full.for.100%.of.reporting.periods.and.are.tradable.
.– General.security.entitlements.are.held.by.water.users.for.irrigation,.commercial.and.industrial.activities..These.entitlements.are.able.to.be.supplied.in.full.for.approximately.84%.of.reporting.periods.and.are.tradable.
.– Urban.water.entitlements.are.held.by.the.water.system.operators.for.Helgaville..These.entitlements.are.tradable.
.– Stock.and.domestic.entitlements.are.held.by.residents.of.the.Wallaroo.Water.Supply.region,.for.watering.stock.and.meeting.domestic.needs..These.entitlements.are.tradable.
.– Environmental.entitlements.are.held.by.Minton.Department.of.the.Environment..Where.possible,.the.ROP.requires.that.environmental.objectives.be.met.by.the.efficient.delivery.of.water.that.is.released.for.other.purposes..However,.there.is.a.provision.for.rules-based.watering.to.meet.the.environmental.objectives.set.out.in.the.WRMP.within.the.ROP..These.entitlements.are.tradable.
.– Cultural.entitlements.held.by.the.Namatjira.Indigenous.people.are.used.to.maintain.culturally.significant.sites.in.the.Namatjira.Native.Title.area.and.in.ceremonies.connected.with.culturally.significant.sites..These.entitlements.are.not.tradable.
•. Vanderbelt groundwater entitlements:.These.entitlements.are.held.by.water.users.located.in.the.Vanderbelt.Groundwater.Management.Area.for.irrigation,.commercial.and.industrial.purposes..These.users.pump.directly.from.Cave.Aquifer.using.their.own.bores..Allocations.are.announced.based.on.periodical.assessments.of.the.volume.available.for.sustainable.extraction.from.this.resource..
.– High-security.entitlements.are.held.by.residents.of.the.Wallaroo.Water.System.and.Baxter.Water.System.with.direct.access.to.the.Vanderbelt.Groundwater.Management.Area..The.sustainable.extraction.limit.for.the.aquifer.as.a.whole.has.never.been.exceeded,.notwithstanding.that.local.exceptions.may.occur..These.entitlements..are.tradable.
.– Groundwater.stock.and.domestic.entitlements.are.held.by.residents.of.the.Wallaroo.Water.System.and.Baxter.Water.System.with.direct.access.to.the.Vanderbelt.Groundwater.Management.Area.for.watering.stock.and.meeting.domestic.needs...These.entitlements.are.tradable.
•. Unregulated entitlements:.Licences.to.divert.unregulated.surface.water.for.irrigation.and.stock.and.domestic.use.are.issued.by.Testcorp..They.do.not.specify.a.volume.that.may.be.taken,.however.their.use.is.metered.and.in.the.case.of.water.shortages.restrictions.are.imposed..No.distinction.is.made.between.water.that.is.extracted.for.purposes.of.irrigation,.commercial.and.industrial,.or.stock.and.domestic.purposes,.however.the.critical.human.needs.are.taken.into.consideration.in.the.determination.of.water.use.restrictions..These.entitlements.are.not.tradable.
Minor.catchment.storages.on.private.property.are.not.licensed,.but.are.considered.collectively.significant.and.are.included.in.the.management.regime.via.a.system.of.registration..This.system.of.registration.is.managed.by.the.Department.of.Water.and.the.Visual.Arts.
6 Wallaroo Water System – Model Water Accounting Report
ED AWAS 1 Ref
Para 153(c) The.ROP.also.has.provisions.to.guide.the.roles.of.a.Water.Resource.Manager.and.an.Environmental.Water.Manager..The.role.of.the.Water.Resource.Manager.is.to.make.allocation.determinations.for.Wallaroo.regulated.entitlements.and.Vanderbelt.Groundwater.entitlements,.and.to.make.restriction.determinations.for.unregulated.licences..The.role.of.the.Environmental.Water.Manager.is.to.prepare.and.implement.an.Environmental.Watering.Plan.including.the.management.of.environmental.water.entitlements.and.allocations,.which.allows.discretion.in.the.way.they.are.held.and.applied..
Annual.allocation.determinations.and.announcements.for.Wallaroo.regulated.entitlements.and.Vanderbelt.groundwater.entitlements.are.carried.out.in.accordance.with.a.schedule.and.process.specified.in.the.ROP..Entitlement.holders.are.notified.by.mail.or.email.of.their.allocation.balance.after.each.determination.and.can.also.access.balances.online.on.the.day.of.the.announcement..The.dates.of.scheduled.determinations.are.published.in.the.local.newspaper.and.determination.decisions.are.published.the.day.after.they.are.made.
Allocation.carryover.is.only.allowed.for.Wallaroo.regulated.high-security.entitlements,.within.the.limit.established.by.the.WRMP..This.limit.is.currently.set.at.50%.of.the.volume.of.an.entitlement,.regardless.of.the.allocation.announced.in.that.reporting.period..A.reduction.of.5%.is.applied.at.the.end.of.the.financial.year.to.the.volume.of.allocation.carried.over.to.the.following.period,.to.account.for.water.lost.in.evaporation.while.it.is.being.stored.
Intervalley.trade.is.permitted.between.Wallaroo.Water.System.and.other.hydrologically-linked.catchments;.however,.the.volumes.that.are.permitted.to.be.traded.are.dependent.on.the.intervalley.transfer.balance..The.intervalley.transfer.from.Menace.River.to.Wallaroo.River.is.set.at.a.baseline.of.180.000.ML.per.year..Similarly,.the.intervalley.transfer.baseline.volume.from.Wallaroo.River.to.Baxter.River.is.set.to.150.000.ML..The.actual.volume.transferred.varies.from.year.to.year.due.to.trading.activity.and.unregulated.flows..
There.were.no.adjustments.made.to.either.the.WRMP.or.the.ROP.during.the.reporting.period.
Para 49(b) Water management bodies
Testcorp.has.been.issued.an.operating.licence.by.the.Department.of.Water.and.the.Visual.Arts.to.manage.the.water.resources.of.the.Wallaroo.Water.System.and.to.ensure.stakeholders.gain.the.greatest.environmental,.social,.cultural,.and.economic.benefits.from.those.resources.in.line.with.the.ROP..
Essential.water.services.are.provided.in.the.region.by.Longford.Irrigation.Corporation.Ltd,.which.operates.the.Longford.Irrigation.supply.and.collection.network,.and.Minton.Watercorp.Ltd,.which.supplies.urban.potable.and.wastewater.services.to.Helgaville.
The.Namatjira.Aboriginal.Corporation.is.responsible.for.managing.the.cultural.entitlement.related.to.the.Namatjira.Native.Title.area.
The.Minton.State.Government.is.responsible.for.approving.and.reviewing.the.WRMP..The.Department.of.Water.and.the.Visual.Arts.is.responsible.for.approving.and.reviewing.the.ROP,.managing.a.register.of.farm.dams.and.private.storages,.and.monitoring.and.assessing.compliance.with.the.ROP.provisions..The.Department.of.Water.and.the.Visual.Arts.is.responsible.for.preparing.ROP.water.accounting.reports.for.the.Minton.State.Government.
Testcorp.was.established.in.1984.and.its.functions.have.evolved.to.cover.most.water.resource.management.functions.within.the.Wallaroo.River.Catchment..It.is.responsible.for.managing.the.water.infrastructure.of.the.Wallaroo.Water.System,.operational.management.of.water.resources,.including.the.administration.associated.with.water.trading,.and.maintaining.the.virtual.entitlement.and.licence.register.of.the.Wallaroo.River.Catchment.under.delegations..and.provisions.in.the.ROP.
6 Wallaroo Water System – Model Water Accounting Report Model Water Accounting Report – Wallaroo Water System 7

ED AWAS 1 Ref
Testcorp.is.a.government-owned.corporation.and.has.a.Board.of.Directors.with.non-executive.directors.appointed.by.the.Minton.Minister.for.Water..The.Board.comprises.three.senior.executives.of.Testcorp.and.four.independent.directors..Antoinette.Dimmett.is.the.current.Chairman.of.the.Board..The.Board.is.responsible.for.governance.of.Testcorp.and.for.meeting.its.responsibilities.under.its.operating.licence,.the.ROP.and.the.Water Act,.including.facilitating.the.implementation.of.the.Environmental.Watering.Plan.(EWP)..Senior.management.comprises:.Sven.Hannover.(Chief.Executive.Officer),.Samuel.Crusoe.(Chief.Financial.and.Water.Accounting.Officer),.and.Terry.O’Donnell.(Chief.Technical.Services)..The.Head.Office.is.located.in.Helgaville.
The.Water.Resource.Manager.is.a.nominated.independent.position.within.Testcorp.with.delegations.under.the.ROP.to.independently.make.allocation.and.restriction.determinations.and.announcements.and.to.work.closely.with.other.areas.within.Testcorp.to.ensure.timely.and.efficient.implementation.of.operational.water.resource.administration.
The.Environmental.Water.Manager.is.a.nominated.position.within.the.Minton.Department.of.Environment.with.delegations.under.the.Minton.Environment.Act.and.the.ROP.
8 Wallaroo Water System – Model Water Accounting Report
ED AWAS 1 Ref
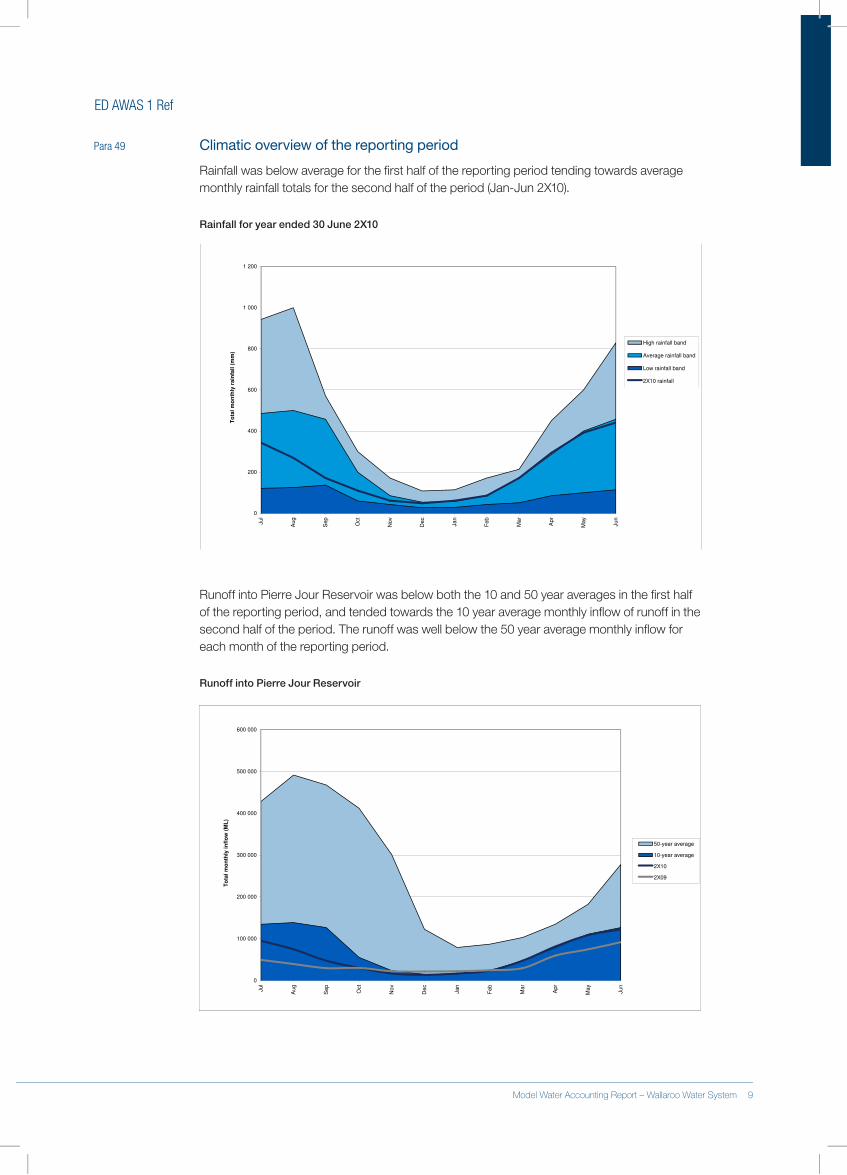
Para 49 Climatic overview of the reporting period
Rainfall.was.below.average.for.the.first.half.of.the.reporting.period.tending.towards.average.monthly.rainfall.totals.for.the.second.half.of.the.period.(Jan-Jun.2X10).
Rainfall for year ended 30 June 2X10
0
200
400
600
800
1 000
1 200
Jul
Aug
Sep
Oct
Nov
Dec
Jan
Feb
Mar
Apr
May
Jun
To
tal
mo
nth
ly r
ain
fall
(m
m)
High rainfall band
Average rainfall band
Low rainfall band
2X10 rainfall
Runoff.into.Pierre.Jour.Reservoir.was.below.both.the.10.and.50.year.averages.in.the.first.half.of.the.reporting.period,.and.tended.towards.the.10.year.average.monthly.inflow.of.runoff.in.the.second.half.of.the.period..The.runoff.was.well.below.the.50.year.average.monthly.inflow.for.each.month.of.the.reporting.period.
Runoff into Pierre Jour Reservoir
0
100 000
200 000
300 000
400 000
500 000
600 000
Jul
Aug
Sep
Oct
Nov
Dec
Jan
Feb
Mar
Apr
May
Jun
To
tal
mo
nth
ly i
nfl
ow
(M
L)
50-year average
10-year average
2X10
2X09
8 Wallaroo Water System – Model Water Accounting Report Model Water Accounting Report – Wallaroo Water System 9
ED AWAS 1 Ref
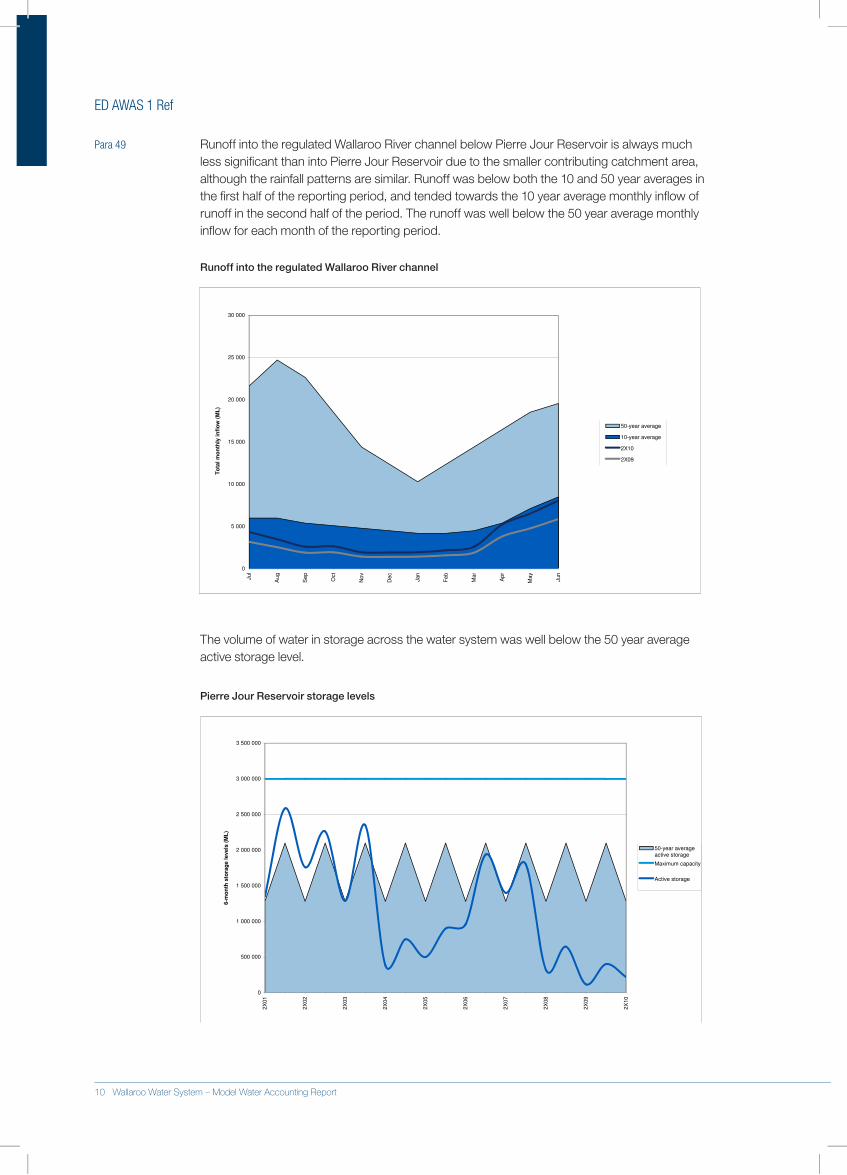
Para 49 Runoff.into.the.regulated.Wallaroo.River.channel.below.Pierre.Jour.Reservoir.is.always.much.less.significant.than.into.Pierre.Jour.Reservoir.due.to.the.smaller.contributing.catchment.area,.although.the.rainfall.patterns.are.similar..Runoff.was.below.both.the.10.and.50.year.averages.in.the.first.half.of.the.reporting.period,.and.tended.towards.the.10.year.average.monthly.inflow.of.runoff.in.the.second.half.of.the.period..The.runoff.was.well.below.the.50.year.average.monthly.inflow.for.each.month.of.the.reporting.period.
Runoff into the regulated Wallaroo River channel
0
5 000
10 000
15 000
20 000
25 000
30 000
Jul
Aug
Sep
Oct
Nov
Dec
Jan
Feb
Mar
Apr
May
Jun
To
tal
mo
nth
ly i
nfl
ow
(M
L)
50-year average
10-year average
2X10
2X09
The.volume.of.water.in.storage.across.the.water.system.was.well.below.the.50.year.average.active.storage.level.
Pierre Jour Reservoir storage levels
0
500 000
1 000 000
1 500 000
2 000 000
2 500 000
3 000 000
3 500 000
2X
01
2X
02
2X
03
2X
04
2X
05
2X
06
2X
07
2X
08
2X
09
2X
10
6-m
on
th s
tora
ge l
evels
(M
L)
50-year averageactive storage
Maximum capacity
Active storage
10 Wallaroo Water System – Model Water Accounting Report
ED AWAS 1 Ref
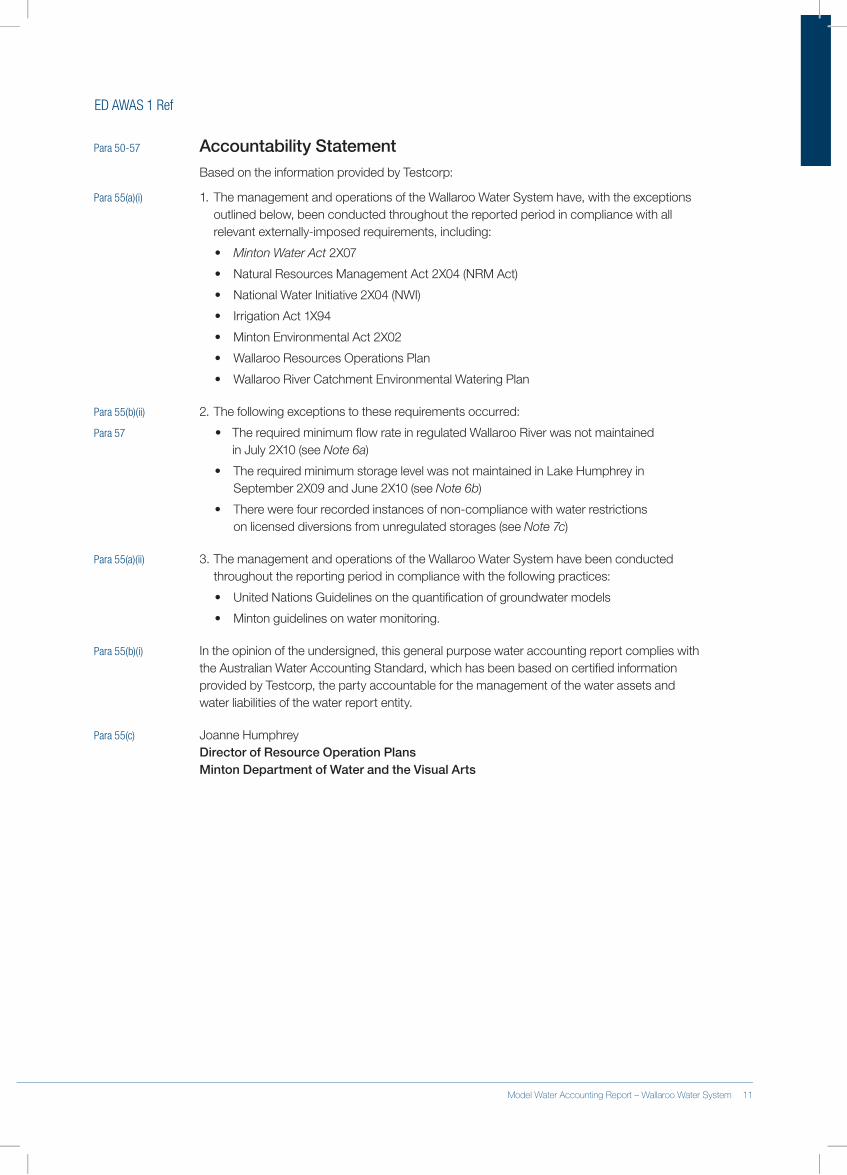
Para 50-57 Accountability Statement Based.on.the.information.provided.by.Testcorp:
Para 55(a)(i) 1.. .The.management.and.operations.of.the.Wallaroo.Water.System.have,.with.the.exceptions.outlined.below,.been.conducted.throughout.the.reported.period.in.compliance.with.all.relevant.externally-imposed.requirements,.including:
•. Minton Water Act 2X07
•. Natural.Resources.Management.Act.2X04.(NRM.Act)
•. National.Water.Initiative.2X04.(NWI)
•. Irrigation.Act.1X94
•. Minton.Environmental.Act.2X02
•. Wallaroo.Resources.Operations.Plan
•. Wallaroo.River.Catchment.Environmental.Watering.Plan
Para 55(b)(ii) 2..The.following.exceptions.to.these.requirements.occurred:
Para 57 •. .The.required.minimum.flow.rate.in.regulated.Wallaroo.River.was.not.maintained.in.July.2X10.(see.Note 6a)
•. The.required.minimum.storage.level.was.not.maintained.in.Lake.Humphrey.in.September.2X09.and.June.2X10.(see.Note 6b)
•. There.were.four.recorded.instances.of.non-compliance.with.water.restrictions..on.licensed.diversions.from.unregulated.storages.(see.Note 7c)
Para 55(a)(ii) 3...The.management.and.operations.of.the.Wallaroo.Water.System.have.been.conducted.throughout.the.reporting.period.in.compliance.with.the.following.practices:
•. United.Nations.Guidelines.on.the.quantification.of.groundwater.models.
•. Minton.guidelines.on.water.monitoring.
Para 55(b)(i) In.the.opinion.of.the.undersigned,.this.general.purpose.water.accounting.report.complies.with.the.Australian.Water.Accounting.Standard,.which.has.been.based.on.certified.information.provided.by.Testcorp,.the.party.accountable.for.the.management.of.the.water.assets.and.water.liabilities.of.the.water.report.entity.
Para 55(c) Joanne.Humphrey.Director of Resource Operation Plans Minton Department of Water and the Visual Arts
10 Wallaroo Water System – Model Water Accounting Report Model Water Accounting Report – Wallaroo Water System 11
ED AWAS 1 Ref
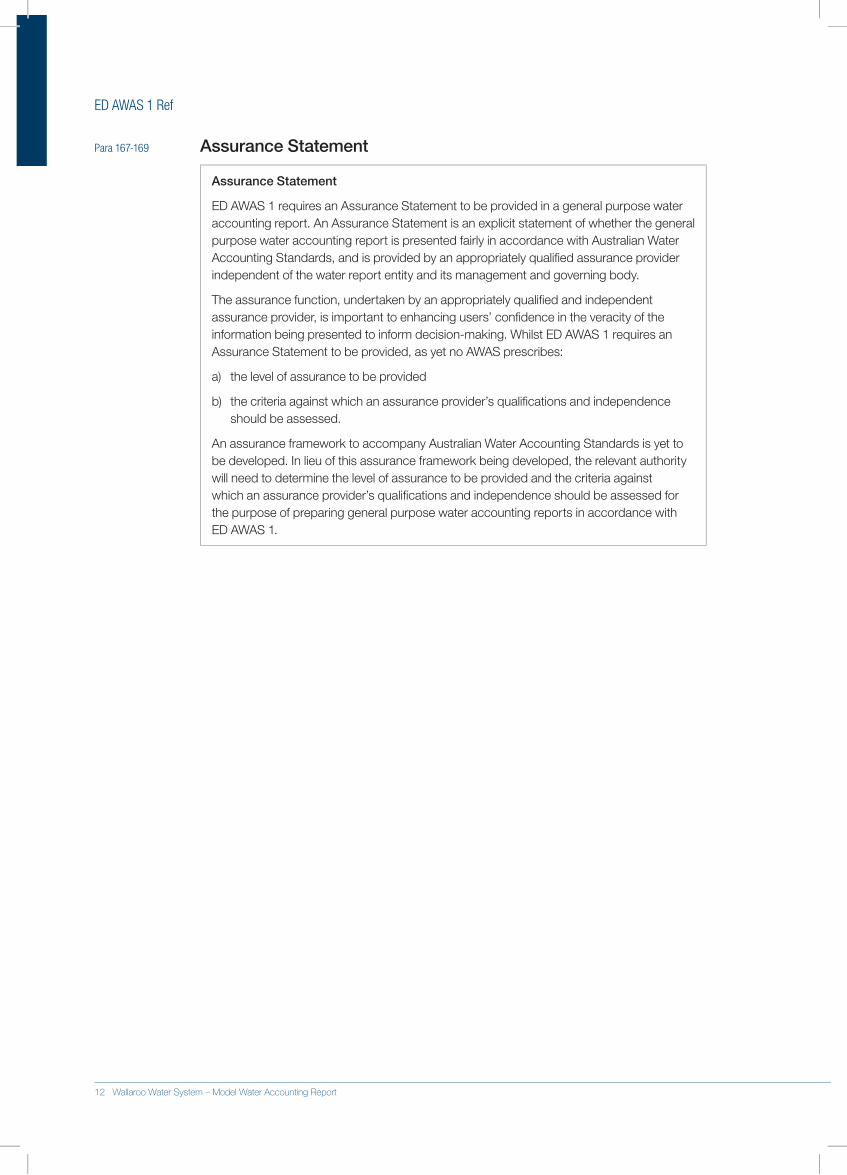
Para 167-169 Assurance Statement
Assurance Statement
ED.AWAS.1.requires.an.Assurance.Statement.to.be.provided.in.a.general.purpose.water.accounting.report..An.Assurance.Statement.is.an.explicit.statement.of.whether.the.general.purpose.water.accounting.report.is.presented.fairly.in.accordance.with.Australian.Water.Accounting.Standards,.and.is.provided.by.an.appropriately.qualified.assurance.provider.independent.of.the.water.report.entity.and.its.management.and.governing.body.
The.assurance.function,.undertaken.by.an.appropriately.qualified.and.independent.assurance.provider,.is.important.to.enhancing.users’.confidence.in.the.veracity.of.the.information.being.presented.to.inform.decision-making..Whilst.ED.AWAS.1.requires.an.Assurance.Statement.to.be.provided,.as.yet.no.AWAS.prescribes:
a). the.level.of.assurance.to.be.provided.
b). .the.criteria.against.which.an.assurance.provider’s.qualifications.and.independence.should.be.assessed..
An.assurance.framework.to.accompany.Australian.Water.Accounting.Standards.is.yet.to.be.developed..In.lieu.of.this.assurance.framework.being.developed,.the.relevant.authority.will.need.to.determine.the.level.of.assurance.to.be.provided.and.the.criteria.against.which.an.assurance.provider’s.qualifications.and.independence.should.be.assessed.for.the.purpose.of.preparing.general.purpose.water.accounting.reports.in.accordance.with.ED AWAS.1.
12 Wallaroo Water System – Model Water Accounting Report
ED AWAS 1 Ref
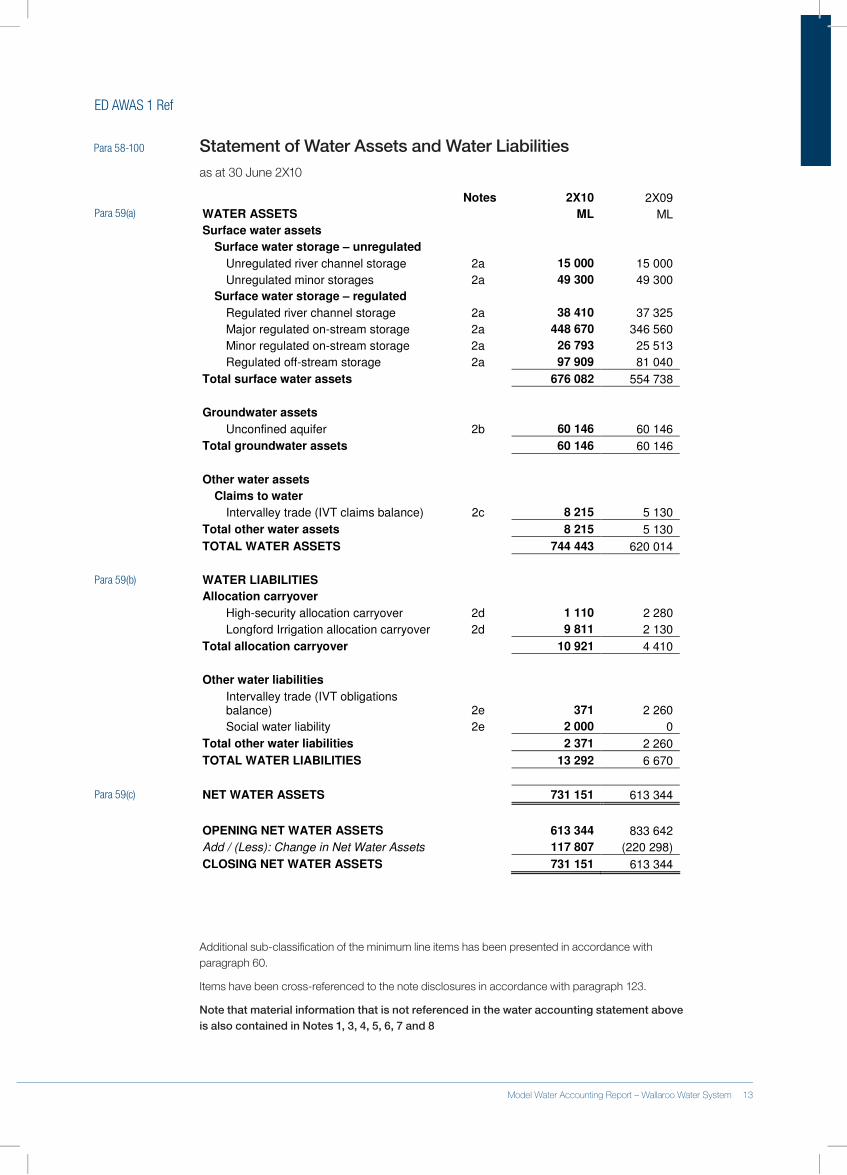
Para 58-100 Statement of Water Assets and Water Liabilitiesas.at.30.June.2X10
Notes 2X10 2X09
WATER ASSETS ML ML
Surface water assets
Surface water storage – unregulated
Unregulated river channel storage 2a 15 000 15 000
Unregulated minor storages 2a 49 300 49 300
Surface water storage – regulated
Regulated river channel storage 2a 38 410 37 325
Major regulated on-stream storage 2a 448 670 346 560
Minor regulated on-stream storage 2a 26 793 25 513
Regulated off-stream storage 2a 97 909 81 040
Total surface water assets 676 082 554 738
Groundwater assets
Unconfined aquifer 2b 60 146 60 146
Total groundwater assets 60 146 60 146
Other water assets
Claims to water
Intervalley trade (IVT claims balance) 2c 8 215 5 130
Total other water assets 8 215 5 130
TOTAL WATER ASSETS 744 443 620 014
WATER LIABILITIES
Allocation carryover
High-security allocation carryover 2d 1 110 2 280
Longford Irrigation allocation carryover 2d 9 811 2 130
Total allocation carryover 10 921 4 410
Other water liabilities
Intervalley trade (IVT obligations balance) 2e
371 2 260
Social water liability 2e 2 000 0
Total other water liabilities 2 371 2 260
TOTAL WATER LIABILITIES 13 292 6 670
NET WATER ASSETS 731 151 613 344
OPENING NET WATER ASSETS 613 344 833 642
Add / (Less): Change in Net Water Assets 117 807 (220 298)
CLOSING NET WATER ASSETS 731 151 613 344
Additional.sub-classification.of.the.minimum.line.items.has.been.presented.in.accordance.with..paragraph.60.
Items.have.been.cross-referenced.to.the.note.disclosures.in.accordance.with.paragraph.123.
Note that material information that is not referenced in the water accounting statement above is also contained in Notes 1, 3, 4, 5, 6, 7 and 8
.
Para 59(a)
Para 59(b)
Para 59(c)
12 Wallaroo Water System – Model Water Accounting Report Model Water Accounting Report – Wallaroo Water System 13
ED AWAS 1 Ref
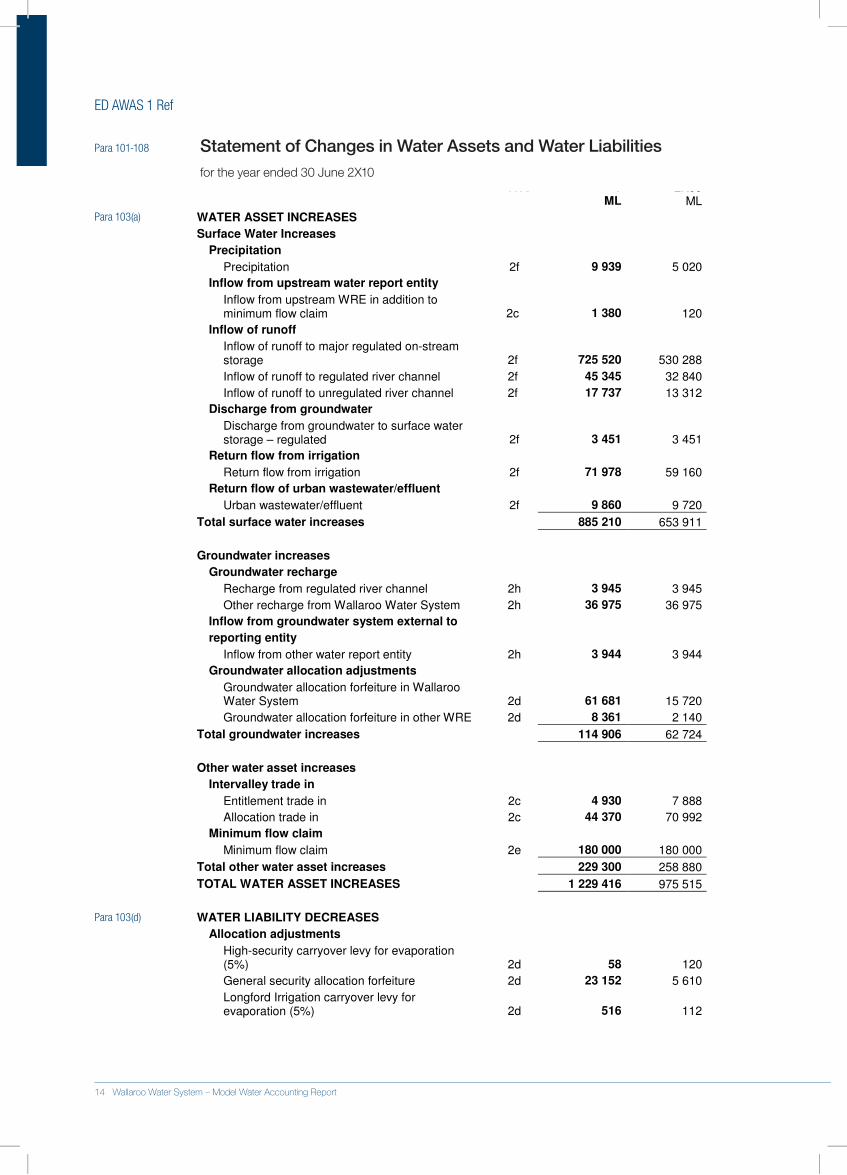
Para 101-108 Statement of Changes in Water Assets and Water Liabilities for.the.year.ended.30.June.2X10 Notes 2X10 2X09 ML ML
WATER ASSET INCREASES
Surface Water Increases
Precipitation
Precipitation 2f 9 939 5 020
Inflow from upstream water report entity
Inflow from upstream WRE in addition to minimum flow claim 2c 1 380
120
Inflow of runoff
Inflow of runoff to major regulated on-stream storage 2f 725 520 530 288
Inflow of runoff to regulated river channel 2f 45 345 32 840
Inflow of runoff to unregulated river channel 2f 17 737 13 312
Discharge from groundwater
Discharge from groundwater to surface water storage – regulated 2f 3 451 3 451
Return flow from irrigation
Return flow from irrigation 2f 71 978 59 160
Return flow of urban wastewater/effluent
Urban wastewater/effluent 2f 9 860 9 720
Total surface water increases 885 210 653 911
Groundwater increases
Groundwater recharge
Recharge from regulated river channel 2h 3 945 3 945
Other recharge from Wallaroo Water System 2h 36 975 36 975
Inflow from groundwater system external to
reporting entity
Inflow from other water report entity 2h 3 944 3 944
Groundwater allocation adjustments
Groundwater allocation forfeiture in Wallaroo Water System 2d 61 681 15 720
Groundwater allocation forfeiture in other WRE 2d 8 361 2 140
Total groundwater increases 114 906 62 724
Other water asset increases
Intervalley trade in
Entitlement trade in 2c 4 930 7 888
Allocation trade in 2c 44 370 70 992
Minimum flow claim
Minimum flow claim 2e 180 000 180 000
Total other water asset increases 229 300 258 880
TOTAL WATER ASSET INCREASES 1 229 416 975 515
WATER LIABILITY DECREASES
Allocation adjustments
High-security carryover levy for evaporation (5%) 2d
58 120
General security allocation forfeiture 2d 23 152 5 610
Longford Irrigation carryover levy for evaporation (5%) 2d 516 112
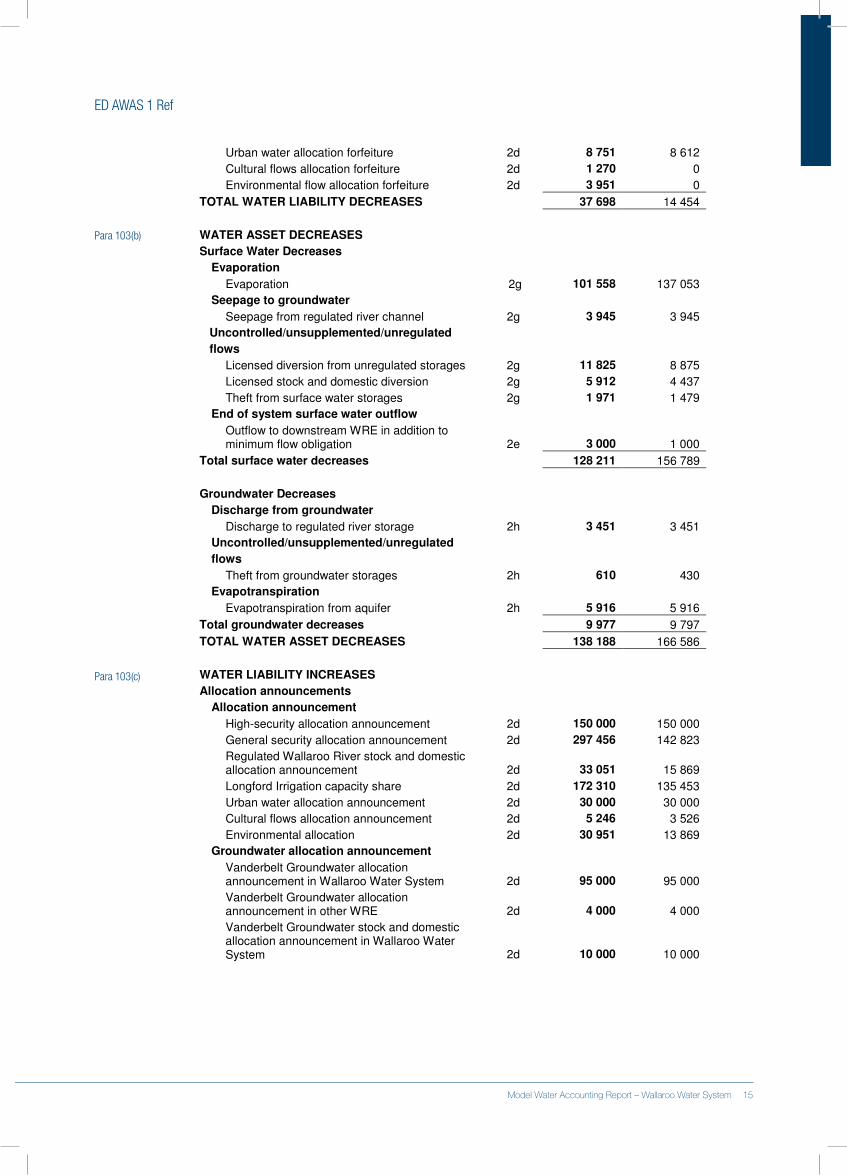
Para 103(a)
Para 103(d)
14 Wallaroo Water System – Model Water Accounting Report
ED AWAS 1 Ref
Urban water allocation forfeiture 2d 8 751 8 612
Cultural flows allocation forfeiture 2d 1 270 0
Environmental flow allocation forfeiture 2d 3 951 0
TOTAL WATER LIABILITY DECREASES 37 698 14 454
WATER ASSET DECREASES
Surface Water Decreases
Evaporation
Evaporation 2g 101 558 137 053
Seepage to groundwater
Seepage from regulated river channel 2g 3 945 3 945
Uncontrolled/unsupplemented/unregulated
flows
Licensed diversion from unregulated storages 2g 11 825 8 875
Licensed stock and domestic diversion 2g 5 912 4 437
Theft from surface water storages 2g 1 971 1 479
End of system surface water outflow
Outflow to downstream WRE in addition to minimum flow obligation 2e 3 000 1 000
Total surface water decreases 128 211 156 789
Groundwater Decreases
Discharge from groundwater
Discharge to regulated river storage 2h 3 451 3 451
Uncontrolled/unsupplemented/unregulated
flows
Theft from groundwater storages 2h 610 430
Evapotranspiration
Evapotranspiration from aquifer 2h 5 916 5 916
Total groundwater decreases 9 977 9 797
TOTAL WATER ASSET DECREASES 138 188 166 586
WATER LIABILITY INCREASES
Allocation announcements
Allocation announcement
High-security allocation announcement 2d 150 000 150 000
General security allocation announcement 2d 297 456 142 823
Regulated Wallaroo River stock and domestic allocation announcement 2d 33 051 15 869
Longford Irrigation capacity share 2d 172 310 135 453
Urban water allocation announcement 2d 30 000 30 000
Cultural flows allocation announcement 2d 5 246 3 526
Environmental allocation 2d 30 951 13 869
Groundwater allocation announcement
Vanderbelt Groundwater allocation announcement in Wallaroo Water System 2d 95 000 95 000
Vanderbelt Groundwater allocation announcement in other WRE 2d 4 000 4 000
Vanderbelt Groundwater stock and domestic allocation announcement in Wallaroo Water System 2d 10 000 10 000
Para 103(b)
Para 103(c)
14 Wallaroo Water System – Model Water Accounting Report Model Water Accounting Report – Wallaroo Water System 15
ED AWAS 1 Ref
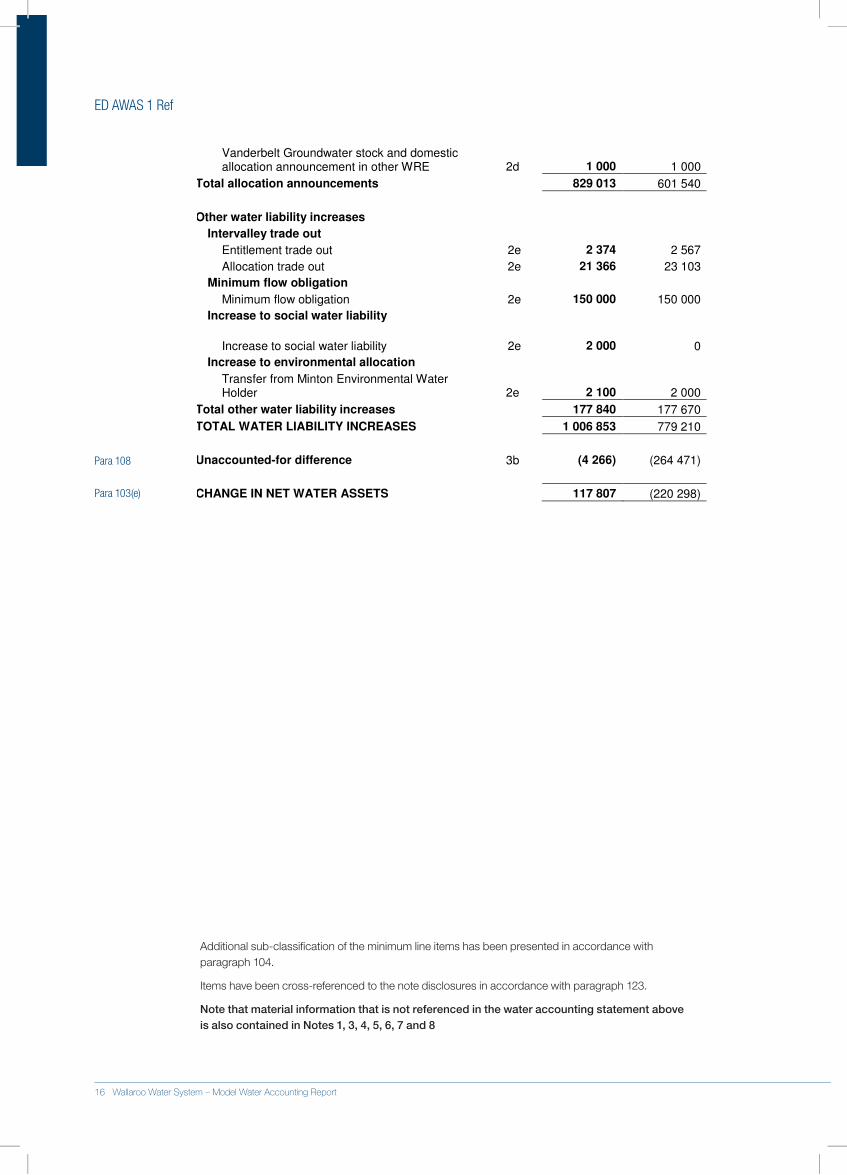
Vanderbelt Groundwater stock and domestic allocation announcement in other WRE 2d 1 000 1 000
Total allocation announcements 829 013 601 540
Other water liability increases
Intervalley trade out
Entitlement trade out 2e 2 374 2 567
Allocation trade out 2e 21 366 23 103
Minimum flow obligation
Minimum flow obligation 2e 150 000 150 000
Increase to social water liability
Increase to social water liability 2e 2 000
0
Increase to environmental allocation
Transfer from Minton Environmental Water Holder 2e 2 100 2 000
Total other water liability increases 177 840 177 670
TOTAL WATER LIABILITY INCREASES 1 006 853 779 210
Unaccounted-for difference 3b (4 266) (264 471)
CHANGE IN NET WATER ASSETS 117 807 (220 298)
Additional.sub-classification.of.the.minimum.line.items.has.been.presented.in.accordance.with..paragraph.104.
Items.have.been.cross-referenced.to.the.note.disclosures.in.accordance.with.paragraph.123.
Note that material information that is not referenced in the water accounting statement above is also contained in Notes 1, 3, 4, 5, 6, 7 and 8
Para 108
Para 103(e)
16 Wallaroo Water System – Model Water Accounting Report
ED AWAS 1 Ref
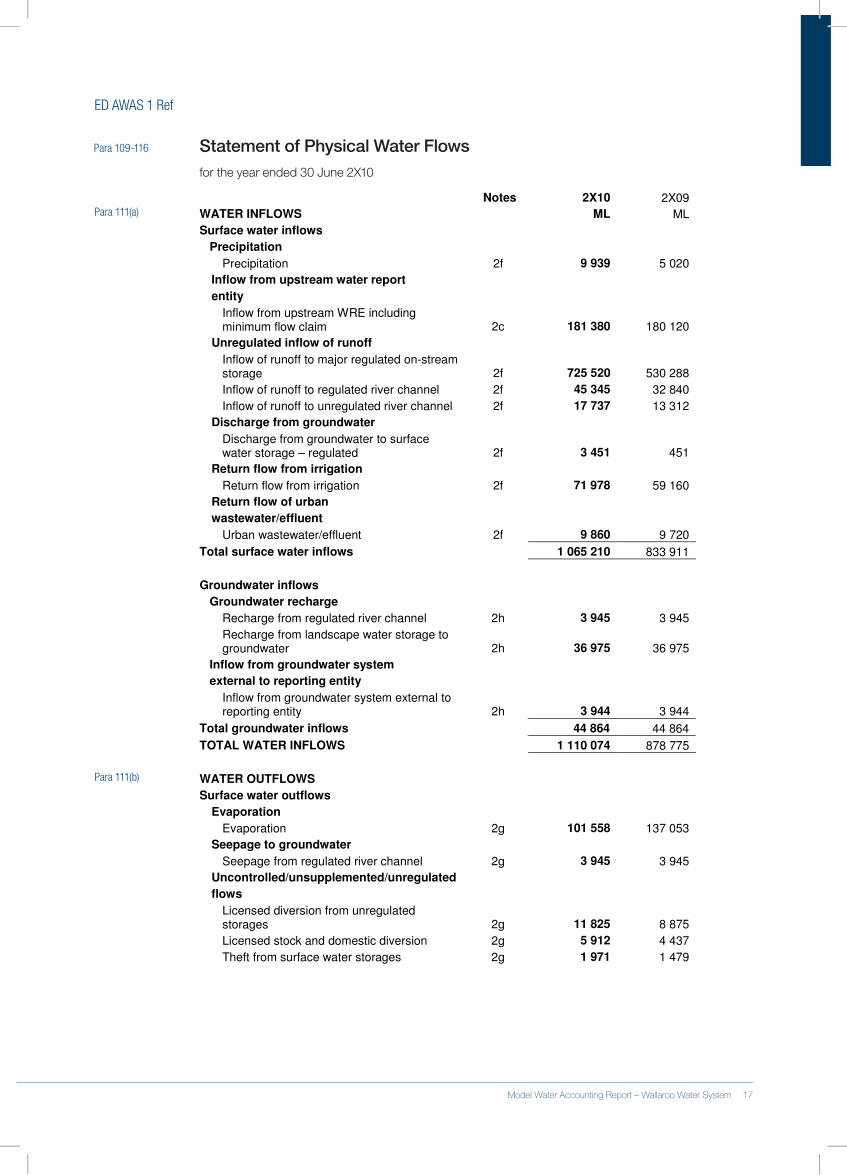
Para 109-116 Statement of Physical Water Flowsfor.the.year.ended.30.June.2X10
Notes 2X10 2X09
WATER INFLOWS ML ML
Surface water inflows
Precipitation
Precipitation 2f 9 939 5 020
Inflow from upstream water report
entity
Inflow from upstream WRE including minimum flow claim 2c 181 380 180 120
Unregulated inflow of runoff
Inflow of runoff to major regulated on-stream storage 2f 725 520 530 288
Inflow of runoff to regulated river channel 2f 45 345 32 840
Inflow of runoff to unregulated river channel 2f 17 737 13 312
Discharge from groundwater
Discharge from groundwater to surface water storage – regulated 2f 3 451 451
Return flow from irrigation
Return flow from irrigation 2f 71 978 59 160
Return flow of urban
wastewater/effluent
Urban wastewater/effluent 2f 9 860 9 720
Total surface water inflows 1 065 210 833 911
Groundwater inflows
Groundwater recharge
Recharge from regulated river channel 2h 3 945 3 945
Recharge from landscape water storage to groundwater 2h 36 975 36 975
Inflow from groundwater system
external to reporting entity
Inflow from groundwater system external to reporting entity 2h 3 944 3 944
Total groundwater inflows 44 864 44 864
TOTAL WATER INFLOWS 1 110 074 878 775
WATER OUTFLOWS
Surface water outflows
Evaporation
Evaporation 2g 101 558 137 053
Seepage to groundwater
Seepage from regulated river channel 2g 3 945 3 945
Uncontrolled/unsupplemented/unregulated
flows
Licensed diversion from unregulated storages 2g 11 825 8 875
Licensed stock and domestic diversion 2g 5 912 4 437
Theft from surface water storages 2g 1 971 1 479
Para 111(a)
Para 111(b)
16 Wallaroo Water System – Model Water Accounting Report Model Water Accounting Report – Wallaroo Water System 17
ED AWAS 1 Ref
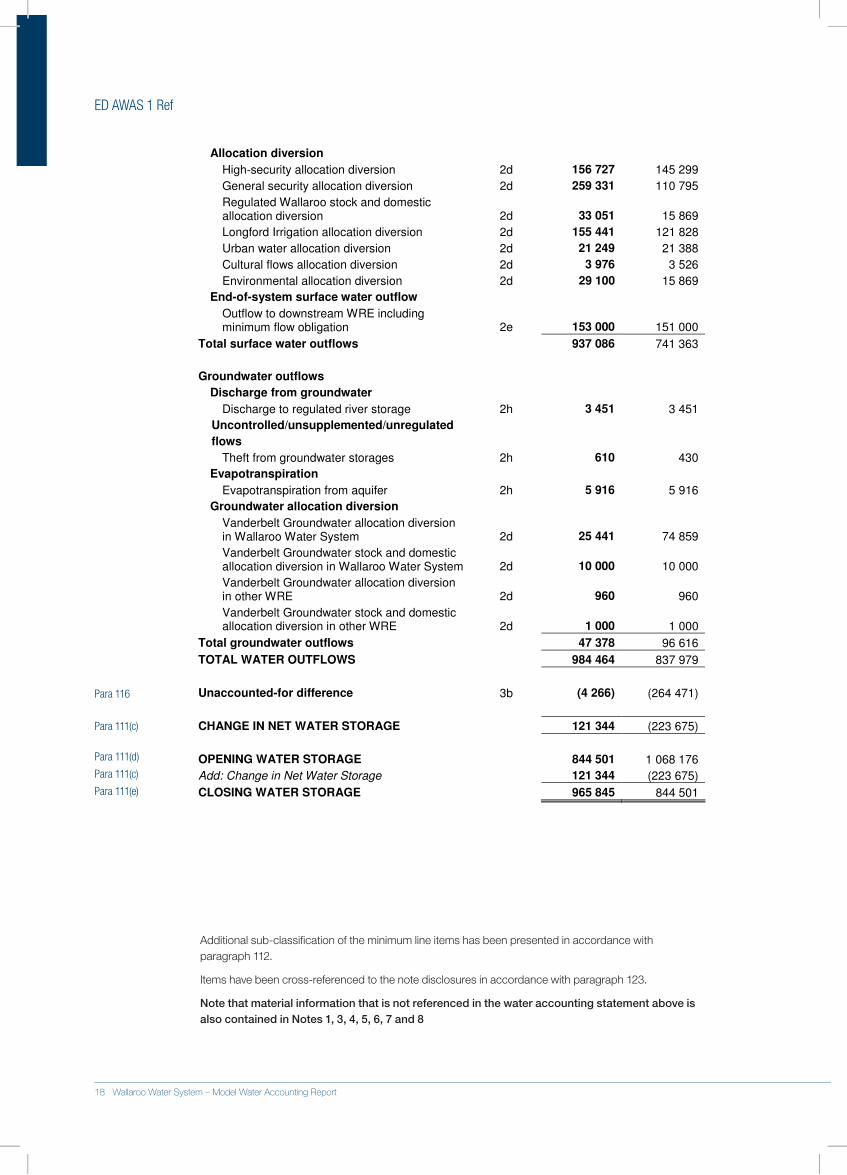
Allocation diversion
High-security allocation diversion 2d 156 727 145 299
General security allocation diversion 2d 259 331 110 795
Regulated Wallaroo stock and domestic allocation diversion 2d 33 051 15 869
Longford Irrigation allocation diversion 2d 155 441 121 828
Urban water allocation diversion 2d 21 249 21 388
Cultural flows allocation diversion 2d 3 976 3 526
Environmental allocation diversion 2d 29 100 15 869
End-of-system surface water outflow
Outflow to downstream WRE including minimum flow obligation 2e 153 000 151 000
Total surface water outflows 937 086 741 363
Groundwater outflows
Discharge from groundwater
Discharge to regulated river storage 2h 3 451 3 451
Uncontrolled/unsupplemented/unregulated
flows
Theft from groundwater storages 2h 610 430
Evapotranspiration
Evapotranspiration from aquifer 2h 5 916 5 916
Groundwater allocation diversion
Vanderbelt Groundwater allocation diversion in Wallaroo Water System 2d 25 441 74 859
Vanderbelt Groundwater stock and domestic allocation diversion in Wallaroo Water System 2d 10 000 10 000
Vanderbelt Groundwater allocation diversion in other WRE 2d 960 960
Vanderbelt Groundwater stock and domestic allocation diversion in other WRE 2d 1 000 1 000
Total groundwater outflows 47 378 96 616
TOTAL WATER OUTFLOWS 984 464 837 979
Unaccounted-for difference 3b (4 266) (264 471)
CHANGE IN NET WATER STORAGE 121 344 (223 675)
OPENING WATER STORAGE 844 501 1 068 176
Add: Change in Net Water Storage 121 344 (223 675)
CLOSING WATER STORAGE 965 845 844 501
Additional.sub-classification.of.the.minimum.line.items.has.been.presented.in.accordance.with..paragraph.112.
Items.have.been.cross-referenced.to.the.note.disclosures.in.accordance.with.paragraph.123.
Note that material information that is not referenced in the water accounting statement above is also contained in Notes 1, 3, 4, 5, 6, 7 and 8
Para 116
Para 111(c)
Para 111(d)
Para 111(c)
Para 111(e)
18 Wallaroo Water System – Model Water Accounting Report
ED AWAS 1 Ref
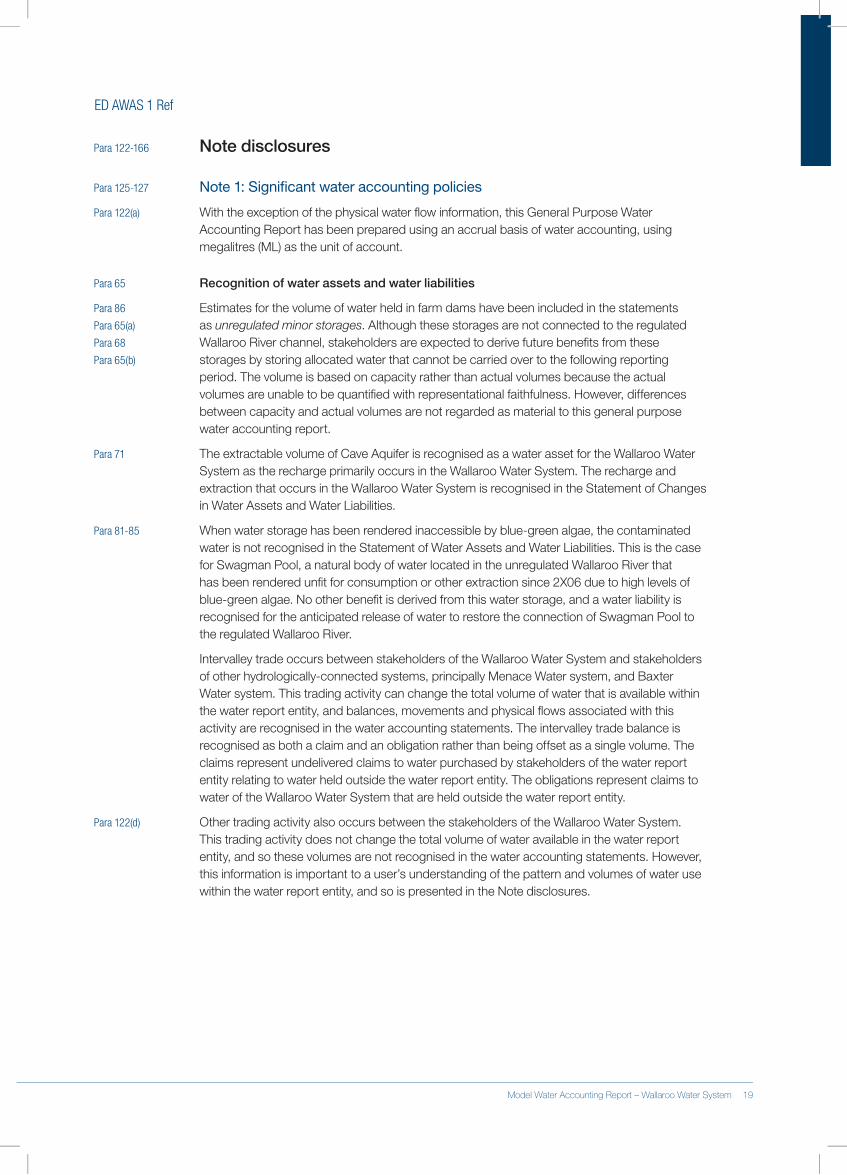
Para 122-166 Note disclosures
Para 125-127 Note 1: Significant water accounting policies
Para 122(a) With.the.exception.of.the.physical.water.flow.information,.this.General.Purpose.Water.Accounting.Report.has.been.prepared.using.an.accrual.basis.of.water.accounting,.using.megalitres.(ML).as.the.unit.of.account.
Para 65 Recognition of water assets and water liabilities
Para 86 Estimates.for.the.volume.of.water.held.in.farm.dams.have.been.included.in.the.statements.as.unregulated minor storages..Although.these.storages.are.not.connected.to.the.regulated.Wallaroo.River.channel,.stakeholders.are.expected.to.derive.future.benefits.from.these.storages.by.storing.allocated.water.that.cannot.be.carried.over.to.the.following.reporting.period..The.volume.is.based.on.capacity.rather.than.actual.volumes.because.the.actual.volumes.are.unable.to.be.quantified.with.representational.faithfulness..However,.differences.between.capacity.and.actual.volumes.are.not.regarded.as.material.to.this.general.purpose.water.accounting.report.
Para 71 The.extractable.volume.of.Cave.Aquifer.is.recognised.as.a.water.asset.for.the.Wallaroo.Water.System.as.the.recharge.primarily.occurs.in.the.Wallaroo.Water.System..The.recharge.and.extraction.that.occurs.in.the.Wallaroo.Water.System.is.recognised.in.the.Statement.of.Changes.in.Water.Assets.and.Water.Liabilities.
Para 81-85 When.water.storage.has.been.rendered.inaccessible.by.blue-green.algae,.the.contaminated.water.is.not.recognised.in.the.Statement.of.Water.Assets.and.Water.Liabilities..This.is.the.case.for.Swagman.Pool,.a.natural.body.of.water.located.in.the.unregulated.Wallaroo.River.that.has.been.rendered.unfit.for.consumption.or.other.extraction.since.2X06.due.to.high.levels.of.blue-green.algae..No.other.benefit.is.derived.from.this.water.storage,.and.a.water.liability.is.recognised.for.the.anticipated.release.of.water.to.restore.the.connection.of.Swagman.Pool.to.the.regulated.Wallaroo.River.
Intervalley.trade.occurs.between.stakeholders.of.the.Wallaroo.Water.System.and.stakeholders.of.other.hydrologically-connected.systems,.principally.Menace.Water.system,.and.Baxter.Water.system..This.trading.activity.can.change.the.total.volume.of.water.that.is.available.within.the.water.report.entity,.and.balances,.movements.and.physical.flows.associated.with.this.activity.are.recognised.in.the.water.accounting.statements..The.intervalley.trade.balance.is.recognised.as.both.a.claim.and.an.obligation.rather.than.being.offset.as.a.single.volume..The.claims.represent.undelivered.claims.to.water.purchased.by.stakeholders.of.the.water.report.entity.relating.to.water.held.outside.the.water.report.entity..The.obligations.represent.claims.to.water.of.the.Wallaroo.Water.System.that.are.held.outside.the.water.report.entity.
Para 122(d) Other.trading.activity.also.occurs.between.the.stakeholders.of.the.Wallaroo.Water.System..This.trading.activity.does.not.change.the.total.volume.of.water.available.in.the.water.report.entity,.and.so.these.volumes.are.not.recognised.in.the.water.accounting.statements..However,.this.information.is.important.to.a.user’s.understanding.of.the.pattern.and.volumes.of.water.use.within.the.water.report.entity,.and.so.is.presented.in.the.Note.disclosures.
Para 65(a)
Para 68
Para 65(b)
18 Wallaroo Water System – Model Water Accounting Report Model Water Accounting Report – Wallaroo Water System 19
ED AWAS 1 Ref
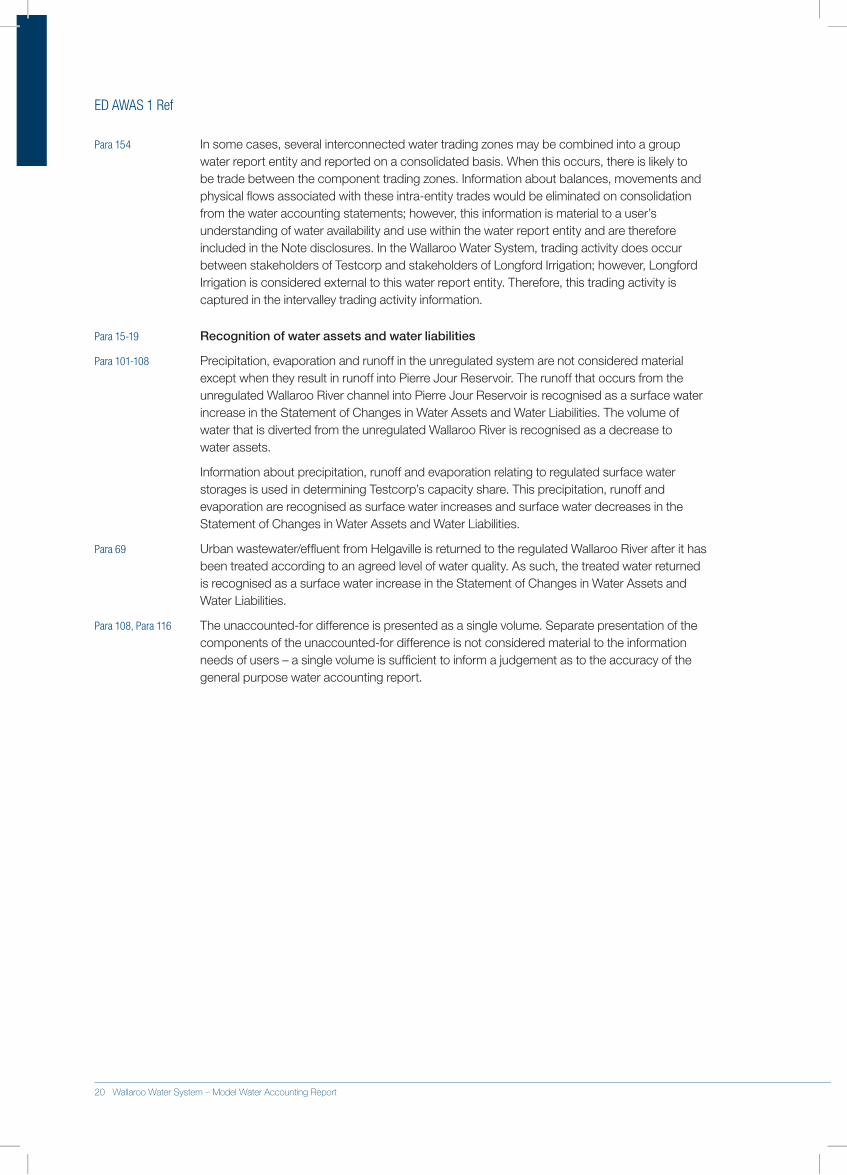
Para 154 In.some.cases,.several.interconnected.water.trading.zones.may.be.combined.into.a.group.water.report.entity.and.reported.on.a.consolidated.basis..When.this.occurs,.there.is.likely.to.be.trade.between.the.component.trading.zones..Information.about.balances,.movements.and.physical.flows.associated.with.these.intra-entity.trades.would.be.eliminated.on.consolidation.from.the.water.accounting.statements;.however,.this.information.is.material.to.a.user’s.understanding.of.water.availability.and.use.within.the.water.report.entity.and.are.therefore.included.in.the.Note.disclosures..In.the.Wallaroo.Water.System,.trading.activity.does.occur.between.stakeholders.of.Testcorp.and.stakeholders.of.Longford.Irrigation;.however,.Longford.Irrigation.is.considered.external.to.this.water.report.entity..Therefore,.this.trading.activity.is.captured.in.the.intervalley.trading.activity.information.
Para 15-19 Recognition of water assets and water liabilities
Para 101-108 Precipitation,.evaporation.and.runoff.in.the.unregulated.system.are.not.considered.material.except.when.they.result.in.runoff.into.Pierre.Jour.Reservoir..The.runoff.that.occurs.from.the.unregulated.Wallaroo.River.channel.into.Pierre.Jour.Reservoir.is.recognised.as.a.surface.water.increase.in.the.Statement.of.Changes.in.Water.Assets.and.Water.Liabilities..The.volume.of.water.that.is.diverted.from.the.unregulated.Wallaroo.River.is.recognised.as.a.decrease.to..water.assets..
Information.about.precipitation,.runoff.and.evaporation.relating.to.regulated.surface.water.storages.is.used.in.determining.Testcorp’s.capacity.share..This.precipitation,.runoff.and.evaporation.are.recognised.as.surface.water.increases.and.surface.water.decreases.in.the.Statement.of.Changes.in.Water.Assets.and.Water.Liabilities.
Para 69 Urban.wastewater/effluent.from.Helgaville.is.returned.to.the.regulated.Wallaroo.River.after.it.has.been.treated.according.to.an.agreed.level.of.water.quality..As.such,.the.treated.water.returned.is.recognised.as.a.surface.water.increase.in.the.Statement.of.Changes.in.Water.Assets.and.Water.Liabilities..
Para 108, Para 116 . The.unaccounted-for.difference.is.presented.as.a.single.volume..Separate.presentation.of.the.components.of.the.unaccounted-for.difference.is.not.considered.material.to.the.information.needs.of.users.–.a.single.volume.is.sufficient.to.inform.a.judgement.as.to.the.accuracy.of.the.general.purpose.water.accounting.report.
20 Wallaroo Water System – Model Water Accounting Report
ED AWAS 1 Ref
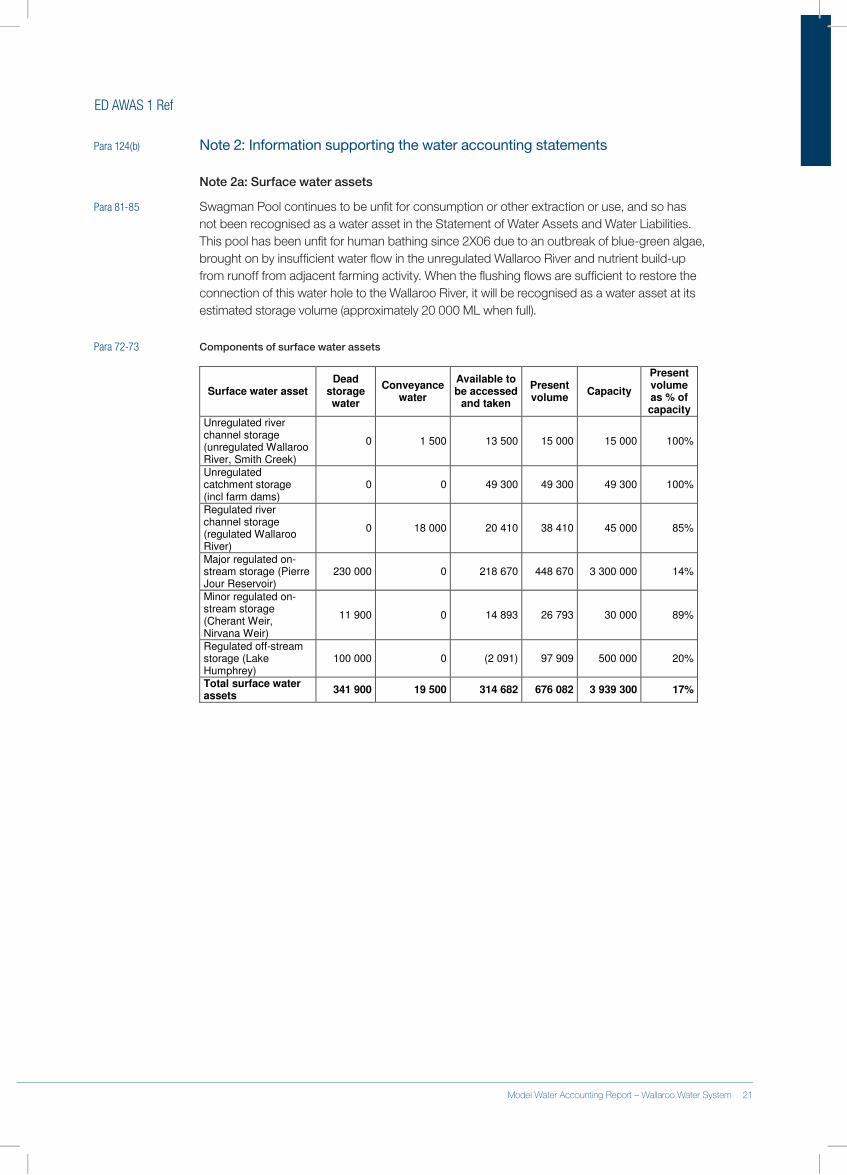
Para 124(b) Note 2: Information supporting the water accounting statements
Note 2a: Surface water assets
Para 81-85 Swagman.Pool.continues.to.be.unfit.for.consumption.or.other.extraction.or.use,.and.so.has.not.been.recognised.as.a.water.asset.in.the.Statement.of.Water.Assets.and.Water.Liabilities..This.pool.has.been.unfit.for.human.bathing.since.2X06.due.to.an.outbreak.of.blue-green.algae,.brought.on.by.insufficient.water.flow.in.the.unregulated.Wallaroo.River.and.nutrient.build-up.from.runoff.from.adjacent.farming.activity..When.the.flushing.flows.are.sufficient.to.restore.the.connection.of.this.water.hole.to.the.Wallaroo.River,.it.will.be.recognised.as.a.water.asset.at.its.estimated.storage.volume.(approximately.20.000.ML.when.full).
Para 72-73 Components of surface water assets
Surface water asset Dead
storage water
Conveyance water
Available to be accessed
and taken
Present volume
Capacity
Present volume as % of capacity
Unregulated river channel storage (unregulated Wallaroo River, Smith Creek)
0 1 500 13 500 15 000 15 000 100%
Unregulated catchment storage (incl farm dams)
0 0 49 300 49 300 49 300 100%
Regulated river channel storage (regulated Wallaroo River)
0 18 000 20 410 38 410 45 000 85%
Major regulated on-stream storage (Pierre Jour Reservoir)
230 000 0 218 670 448 670 3 300 000 14%
Minor regulated on-stream storage (Cherant Weir, Nirvana Weir)
11 900 0 14 893 26 793 30 000 89%
Regulated off-stream storage (Lake Humphrey)
100 000 0 (2 091) 97 909 500 000 20%
Total surface water assets
341 900 19 500 314 682 676 082 3 939 300 17%
20 Wallaroo Water System – Model Water Accounting Report Model Water Accounting Report – Wallaroo Water System 21
ED AWAS 1 Ref
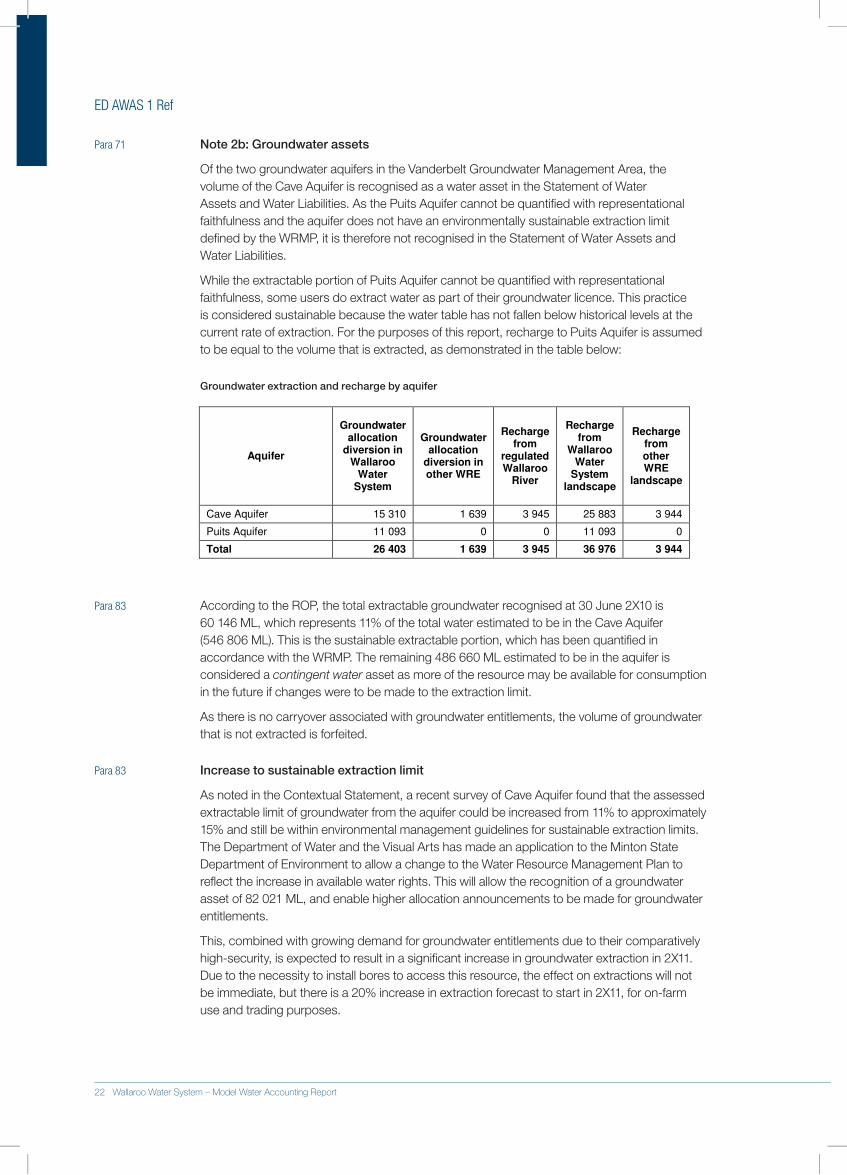
Para 71 Note 2b: Groundwater assets
Of.the.two.groundwater.aquifers.in.the.Vanderbelt.Groundwater.Management.Area,.the.volume.of.the.Cave.Aquifer.is.recognised.as.a.water.asset.in.the.Statement.of.Water.Assets.and.Water.Liabilities..As.the.Puits.Aquifer.cannot.be.quantified.with.representational.faithfulness.and.the.aquifer.does.not.have.an.environmentally.sustainable.extraction.limit.defined.by.the.WRMP,.it.is.therefore.not.recognised.in.the.Statement.of.Water.Assets.and.Water.Liabilities.
While.the.extractable.portion.of.Puits.Aquifer.cannot.be.quantified.with.representational.faithfulness,.some.users.do.extract.water.as.part.of.their.groundwater.licence..This.practice.is.considered.sustainable.because.the.water.table.has.not.fallen.below.historical.levels.at.the.current.rate.of.extraction..For.the.purposes.of.this.report,.recharge.to.Puits.Aquifer.is.assumed.to.be.equal.to.the.volume.that.is.extracted,.as.demonstrated.in.the.table.below:
Groundwater extraction and recharge by aquifer
Aquifer
Groundwater allocation
diversion in Wallaroo
Water System
Groundwater allocation
diversion in other WRE
Recharge from
regulated Wallaroo
River
Recharge from
Wallaroo Water
System landscape
Recharge from other WRE
landscape
Cave Aquifer 15 310 1 639 3 945 25 883 3 944
Puits Aquifer 11 093 0 0 11 093 0
Total 26 403 1 639 3 945 36 976 3 944
Para 83 According.to.the.ROP,.the.total.extractable.groundwater.recognised.at.30.June.2X10.is.60.146.ML,.which.represents.11%.of.the.total.water.estimated.to.be.in.the.Cave.Aquifer..(546.806.ML)..This.is.the.sustainable.extractable.portion,.which.has.been.quantified.in.accordance.with.the.WRMP..The.remaining.486.660.ML.estimated.to.be.in.the.aquifer.is.considered.a.contingent water.asset.as.more.of.the.resource.may.be.available.for.consumption.in.the.future.if.changes.were.to.be.made.to.the.extraction.limit.
As.there.is.no.carryover.associated.with.groundwater.entitlements,.the.volume.of.groundwater.that.is.not.extracted.is.forfeited.
Para 83 Increase to sustainable extraction limit
As.noted.in.the.Contextual.Statement,.a.recent.survey.of.Cave.Aquifer.found.that.the.assessed.extractable.limit.of.groundwater.from.the.aquifer.could.be.increased.from.11%.to.approximately.15%.and.still.be.within.environmental.management.guidelines.for.sustainable.extraction.limits..The.Department.of.Water.and.the.Visual.Arts.has.made.an.application.to.the.Minton.State.Department.of.Environment.to.allow.a.change.to.the.Water.Resource.Management.Plan.to.reflect.the.increase.in.available.water.rights..This.will.allow.the.recognition.of.a.groundwater.asset.of.82.021.ML,.and.enable.higher.allocation.announcements.to.be.made.for.groundwater.entitlements.
This,.combined.with.growing.demand.for.groundwater.entitlements.due.to.their.comparatively.high-security,.is.expected.to.result.in.a.significant.increase.in.groundwater.extraction.in.2X11..Due.to.the.necessity.to.install.bores.to.access.this.resource,.the.effect.on.extractions.will.not.be.immediate,.but.there.is.a.20%.increase.in.extraction.forecast.to.start.in.2X11,.for.on-farm.use.and.trading.purposes.
22 Wallaroo Water System – Model Water Accounting Report
ED AWAS 1 Ref
Para 49 Cross-section of the Vanderbelt Groundwater Management Area
Wallaroo Water System Baxter Water System
Wallaroo River Baxter River
Allocation diversion in other WRE
Allocation diversion in Wallaroo WS
Recharge fromregulated river channel
Rainfall
Inflow from other WRE
Recharge from landscape
Puits Aquifer
Cave Aquifer
Leakage toPuits Aquifer
22 Wallaroo Water System – Model Water Accounting Report Model Water Accounting Report – Wallaroo Water System 23
ED AWAS 1 Ref
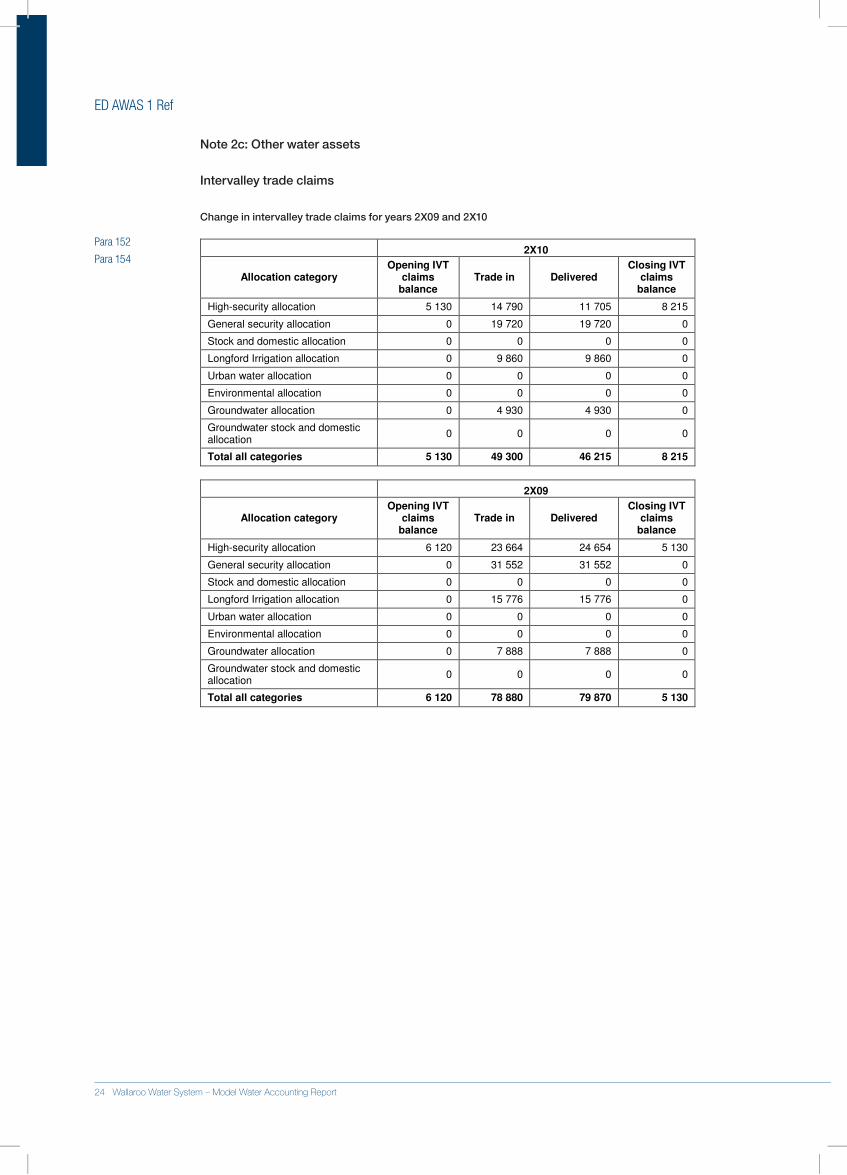
Note 2c: Other water assets
Intervalley trade claims
Change in intervalley trade claims for years 2X09 and 2X10
2X10
Allocation category Opening IVT
claims balance
Trade in Delivered Closing IVT
claims balance
High-security allocation 5 130 14 790 11 705 8 215
General security allocation 0 19 720 19 720 0
Stock and domestic allocation 0 0 0 0
Longford Irrigation allocation 0 9 860 9 860 0
Urban water allocation 0 0 0 0
Environmental allocation 0 0 0 0
Groundwater allocation 0 4 930 4 930 0
Groundwater stock and domestic allocation
0 0 0 0
Total all categories 5 130 49 300 46 215 8 215
2X09
Allocation category Opening IVT
claims balance
Trade in Delivered Closing IVT
claims balance
High-security allocation 6 120 23 664 24 654 5 130
General security allocation 0 31 552 31 552 0
Stock and domestic allocation 0 0 0 0
Longford Irrigation allocation 0 15 776 15 776 0
Urban water allocation 0 0 0 0
Environmental allocation 0 0 0 0
Groundwater allocation 0 7 888 7 888 0
Groundwater stock and domestic allocation
0 0 0 0
Total all categories 6 120 78 880 79 870 5 130
Para 152
Para 154
24 Wallaroo Water System – Model Water Accounting Report
ED AWAS 1 Ref
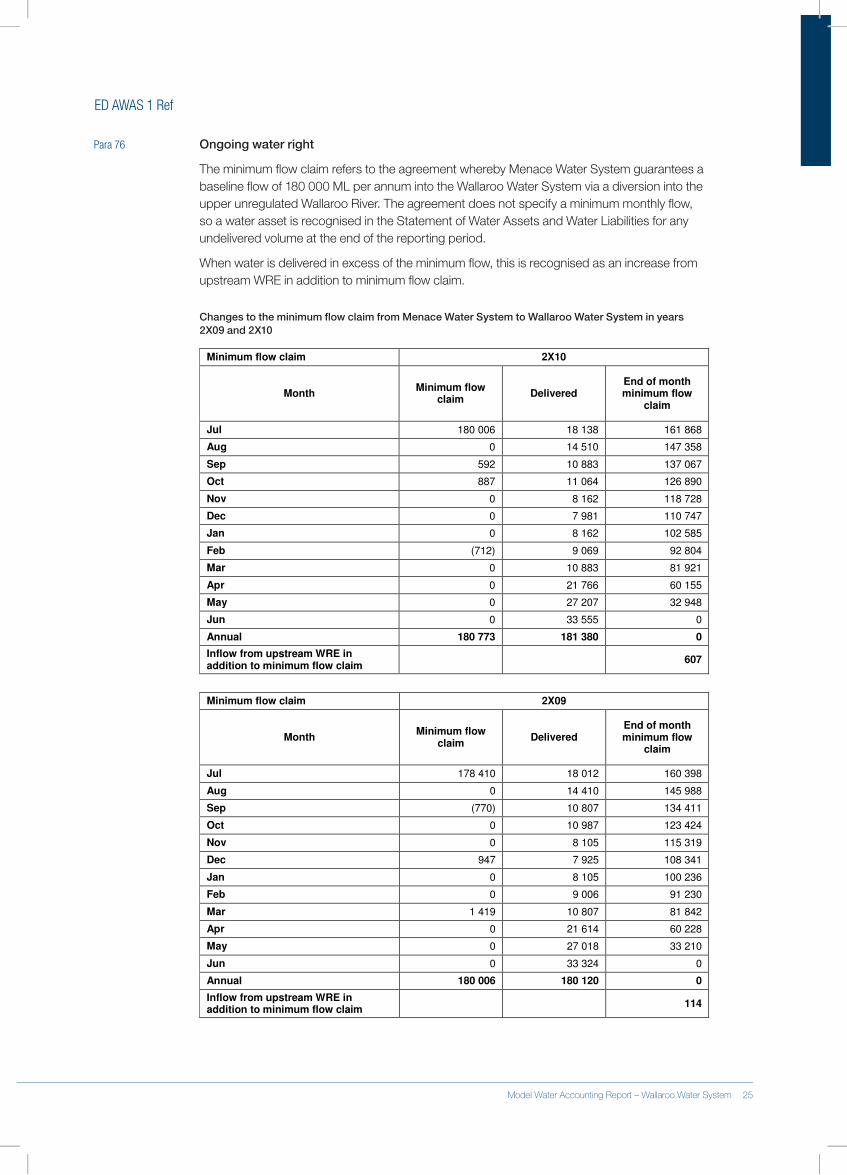
Para 76 Ongoing water right
The.minimum.flow.claim.refers.to.the.agreement.whereby.Menace.Water.System.guarantees.a.baseline.flow.of.180.000.ML.per.annum.into.the.Wallaroo.Water.System.via.a.diversion.into.the.upper.unregulated.Wallaroo.River..The.agreement.does.not.specify.a.minimum.monthly.flow,.so.a.water.asset.is.recognised.in.the.Statement.of.Water.Assets.and.Water.Liabilities.for.any.undelivered.volume.at.the.end.of.the.reporting.period.
When.water.is.delivered.in.excess.of.the.minimum.flow,.this.is.recognised.as.an.increase.from.upstream.WRE.in.addition.to.minimum.flow.claim.
Changes to the minimum flow claim from Menace Water System to Wallaroo Water System in years 2X09 and 2X10
Minimum flow claim 2X10
Month Minimum flow
claim Delivered
End of month minimum flow
claim
Jul 180 006 18 138 161 868
Aug 0 14 510 147 358
Sep 592 10 883 137 067
Oct 887 11 064 126 890
Nov 0 8 162 118 728
Dec 0 7 981 110 747
Jan 0 8 162 102 585
Feb (712) 9 069 92 804
Mar 0 10 883 81 921
Apr 0 21 766 60 155
May 0 27 207 32 948
Jun 0 33 555 0
Annual 180 773 181 380 0
Inflow from upstream WRE in addition to minimum flow claim
607
Minimum flow claim 2X09
Month Minimum flow
claim Delivered
End of month minimum flow
claim
Jul 178 410 18 012 160 398
Aug 0 14 410 145 988
Sep (770) 10 807 134 411
Oct 0 10 987 123 424
Nov 0 8 105 115 319
Dec 947 7 925 108 341
Jan 0 8 105 100 236
Feb 0 9 006 91 230
Mar 1 419 10 807 81 842
Apr 0 21 614 60 228
May 0 27 018 33 210
Jun 0 33 324 0
Annual 180 006 180 120 0
Inflow from upstream WRE in addition to minimum flow claim
114
24 Wallaroo Water System – Model Water Accounting Report Model Water Accounting Report – Wallaroo Water System 25
ED AWAS 1 Ref
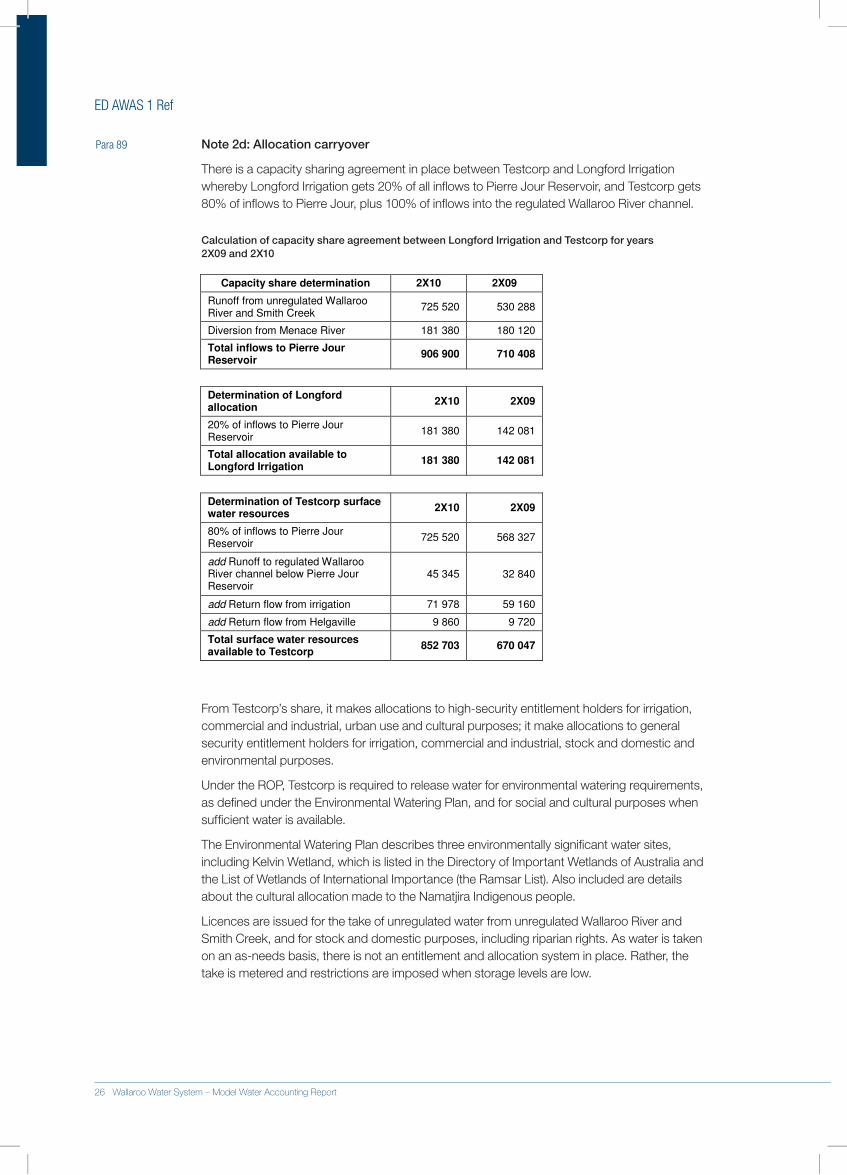
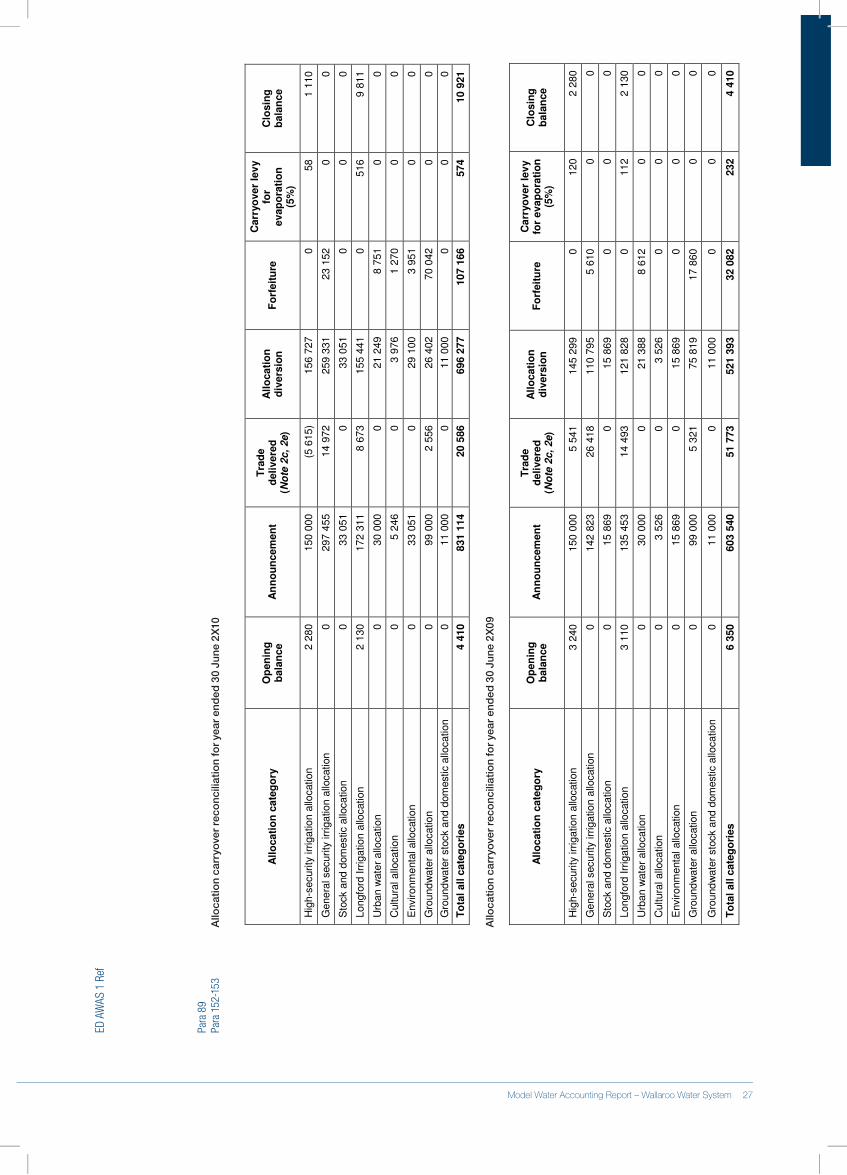
Para 89 Note 2d: Allocation carryover
There.is.a.capacity.sharing.agreement.in.place.between.Testcorp.and.Longford.Irrigation.whereby.Longford.Irrigation.gets.20%.of.all.inflows.to.Pierre.Jour.Reservoir,.and.Testcorp.gets.80%.of.inflows.to.Pierre.Jour,.plus.100%.of.inflows.into.the.regulated.Wallaroo.River.channel..
Calculation of capacity share agreement between Longford Irrigation and Testcorp for years 2X09 and 2X10
Capacity share determination 2X10 2X09
Runoff from unregulated Wallaroo River and Smith Creek
725 520 530 288
Diversion from Menace River 181 380 180 120
Total inflows to Pierre Jour Reservoir
906 900 710 408
Determination of Longford allocation
2X10 2X09
20% of inflows to Pierre Jour Reservoir
181 380 142 081
Total allocation available to Longford Irrigation
181 380 142 081
Determination of Testcorp surface water resources
2X10 2X09
80% of inflows to Pierre Jour Reservoir
725 520 568 327
add Runoff to regulated Wallaroo River channel below Pierre Jour Reservoir
45 345 32 840
add Return flow from irrigation 71 978 59 160
add Return flow from Helgaville 9 860 9 720
Total surface water resources available to Testcorp
852 703 670 047
From.Testcorp’s.share,.it.makes.allocations.to.high-security.entitlement.holders.for.irrigation,.commercial.and.industrial,.urban.use.and.cultural.purposes;.it.make.allocations.to.general.security.entitlement.holders.for.irrigation,.commercial.and.industrial,.stock.and.domestic.and.environmental.purposes..
Under.the.ROP,.Testcorp.is.required.to.release.water.for.environmental.watering.requirements,.as.defined.under.the.Environmental.Watering.Plan,.and.for.social.and.cultural.purposes.when.sufficient.water.is.available.
The.Environmental.Watering.Plan.describes.three.environmentally.significant.water.sites,.including.Kelvin.Wetland,.which.is.listed.in.the.Directory.of.Important.Wetlands.of.Australia.and.the.List.of.Wetlands.of.International.Importance.(the.Ramsar.List)..Also.included.are.details.about.the.cultural.allocation.made.to.the.Namatjira.Indigenous.people.
Licences.are.issued.for.the.take.of.unregulated.water.from.unregulated.Wallaroo.River.and.Smith.Creek,.and.for.stock.and.domestic.purposes,.including.riparian.rights..As.water.is.taken.on.an.as-needs.basis,.there.is.not.an.entitlement.and.allocation.system.in.place..Rather,.the.take.is.metered.and.restrictions.are.imposed.when.storage.levels.are.low.
26 Wallaroo Water System – Model Water Accounting Report
ED A
WAS
1 R
ef
Para
89
Para
152
-153
A
lloca
tion
carr
yove
r re
conc
iliat
ion
for
year
end
ed 3
0 Ju
ne 2
X10
All
ocati
on
cate
go
ry
Op
en
ing
b
ala
nce
An
no
un
cem
en
t T
rad
e
deli
vere
d
(No
te 2
c,
2e)
All
ocati
on
d
ivers
ion
F
orf
eit
ure
Carr
yo
ver
lev
y
for
evap
ora
tio
n
(5%
)
Clo
sin
g
bala
nce
Hig
h-s
ecurity
irr
igation a
llocation
2 2
80
150 0
00
(5 6
15)
156 7
27
0
58
1 1
10
Genera
l security
irr
igation a
llocation
0
297 4
55
14 9
72
259 3
31
23 1
52
0
0
Sto
ck a
nd d
om
estic a
llocation
0
33 0
51
0
33 0
51
0
0
0
Longfo
rd I
rrig
ation a
llocation
2 1
30
172 3
11
8 6
73
155 4
41
0
516
9 8
11
Urb
an w
ate
r allo
cation
0
30 0
00
0
21 2
49
8 7
51
0
0
Cultura
l allo
cation
0
5 2
46
0
3 9
76
1 2
70
0
0
Environm
enta
l allo
cation
0
33 0
51
0
29 1
00
3 9
51
0
0
Gro
und
wate
r allo
cation
0
99 0
00
2 5
56
26 4
02
70 0
42
0
0
Gro
und
wate
r sto
ck a
nd d
om
estic a
llocation
0
11 0
00
0
11 0
00
0
0
0
To
tal
all c
ate
go
ries
4 4
10
831 1
14
20 5
86
696 2
77
107 1
66
574
10 9
21
A
lloca
tion
carr
yove
r re
conc
iliat
ion
for
year
end
ed 3
0 Ju
ne 2
X09
All
ocati
on
cate
go
ry
Op
en
ing
b
ala
nce
An
no
un
cem
en
t T
rad
e
deli
vere
d
(No
te 2
c,
2e)
All
ocati
on
d
ivers
ion
F
orf
eit
ure
C
arr
yo
ver
lev
y
for
evap
ora
tio
n
(5%
)
Clo
sin
g
bala
nce
Hig
h-s
ecurity
irr
igation a
llocation
3 2
40
150 0
00
5 5
41
145 2
99
0
120
2 2
80
Genera
l security
irr
igation a
llocation
0
142 8
23
26 4
18
110 7
95
5 6
10
0
0
Sto
ck a
nd d
om
estic a
llocation
0
15 8
69
0
15 8
69
0
0
0
Longfo
rd I
rrig
ation a
llocation
3 1
10
135 4
53
14 4
93
121 8
28
0
112
2 1
30
Urb
an w
ate
r allo
cation
0
30 0
00
0
21 3
88
8 6
12
0
0
Cultura
l allo
cation
0
3 5
26
0
3 5
26
0
0
0
Environm
enta
l allo
cation
0
15 8
69
0
15 8
69
0
0
0
Gro
und
wate
r allo
cation
0
99 0
00
5 3
21
75 8
19
17 8
60
0
0
Gro
und
wate
r sto
ck a
nd d
om
estic a
llocation
0
11 0
00
0
11 0
00
0
0
0
To
tal
all c
ate
go
ries
6 3
50
603 5
40
51 7
73
521 3
93
32 0
82
232
4 4
10
26 Wallaroo Water System – Model Water Accounting Report Model Water Accounting Report – Wallaroo Water System 27
ED AWAS 1 Ref
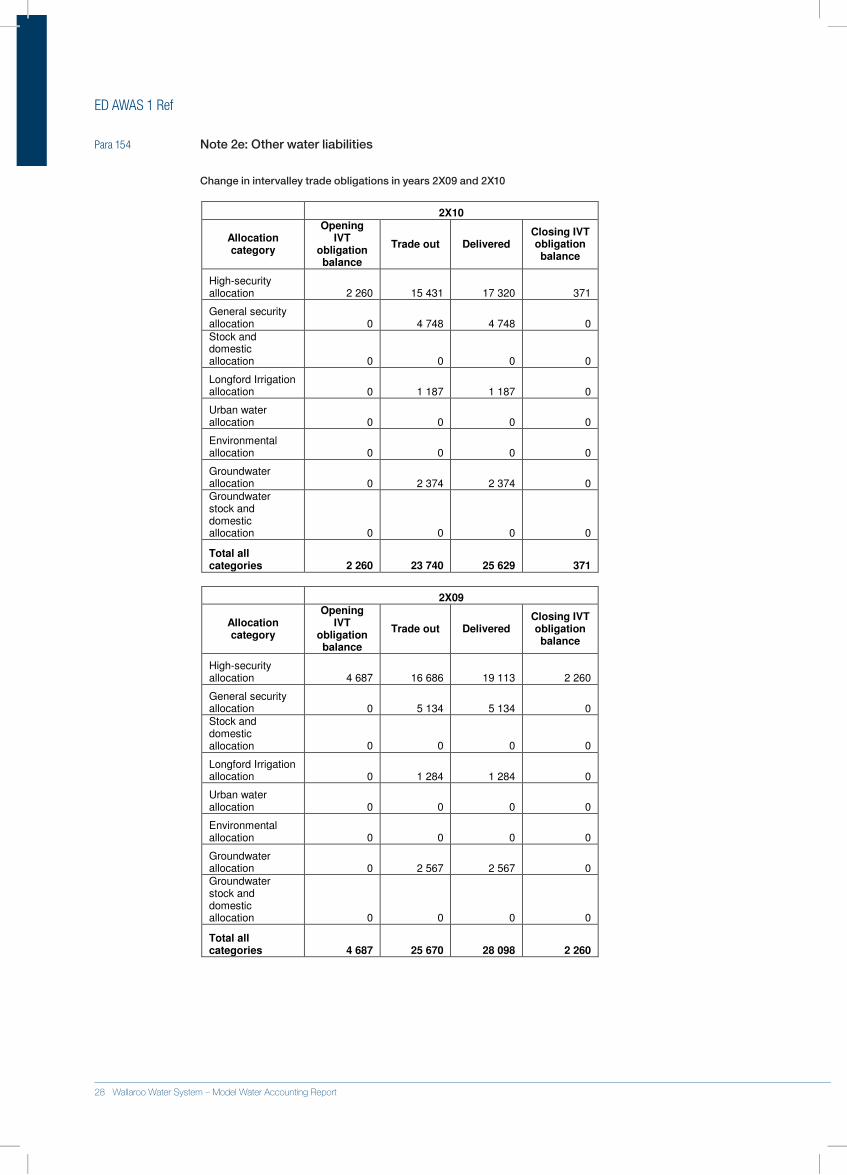
Para 154 Note 2e: Other water liabilities
Change in intervalley trade obligations in years 2X09 and 2X10
2X10
Allocation category
Opening IVT
obligation balance
Trade out Delivered Closing IVT obligation balance
High-security allocation 2 260 15 431 17 320 371
General security allocation 0 4 748 4 748 0
Stock and domestic allocation 0 0 0 0
Longford Irrigation allocation 0 1 187 1 187 0
Urban water allocation 0 0 0 0
Environmental allocation 0 0 0 0
Groundwater allocation 0 2 374 2 374 0 Groundwater stock and domestic allocation 0 0 0 0
Total all categories 2 260 23 740 25 629 371
2X09
Allocation category
Opening IVT
obligation balance
Trade out Delivered Closing IVT obligation balance
High-security allocation 4 687 16 686 19 113 2 260
General security allocation 0 5 134 5 134 0 Stock and domestic allocation 0 0 0 0
Longford Irrigation allocation 0 1 284 1 284 0
Urban water allocation 0 0 0 0
Environmental allocation 0 0 0 0
Groundwater allocation 0 2 567 2 567 0 Groundwater stock and domestic allocation 0 0 0 0
Total all categories 4 687 25 670 28 098 2 260
28 Wallaroo Water System – Model Water Accounting Report
ED AWAS 1 Ref
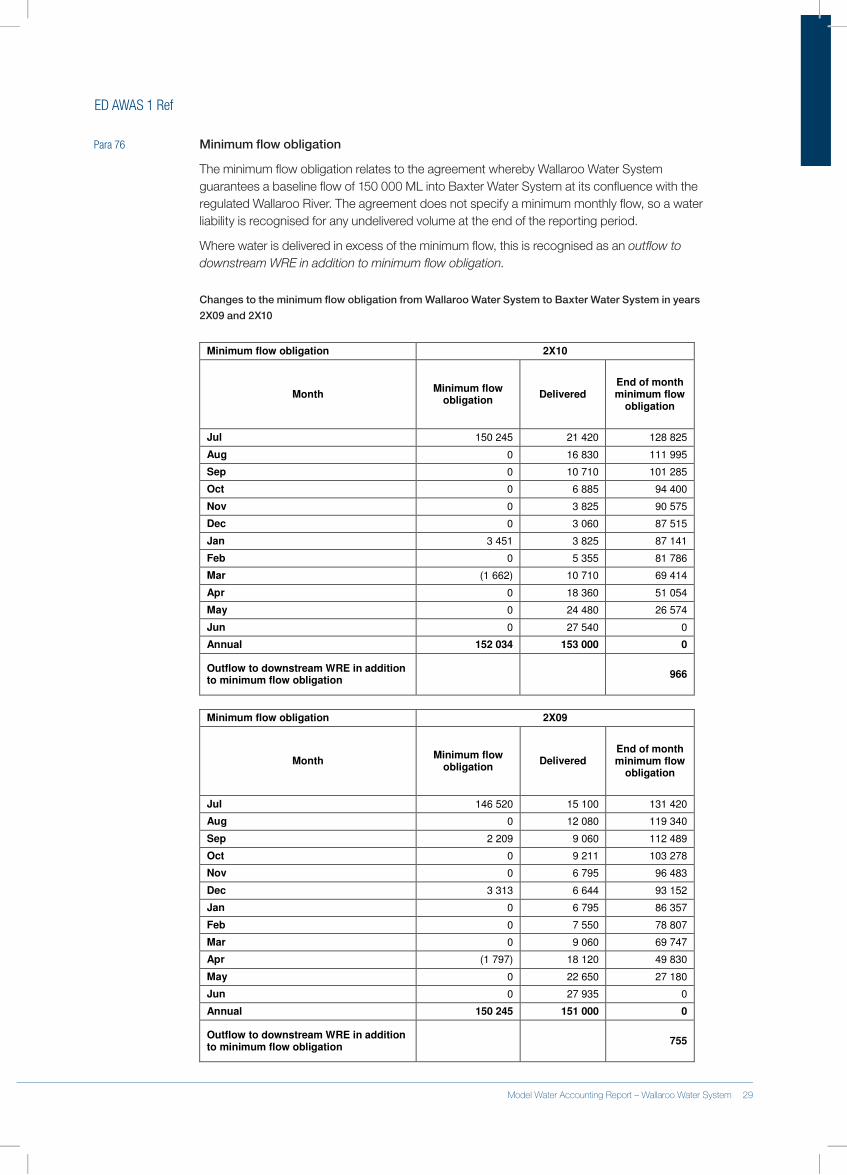
Para 76 Minimum flow obligation
The.minimum.flow.obligation.relates.to.the.agreement.whereby.Wallaroo.Water.System.guarantees.a.baseline.flow.of.150.000.ML.into.Baxter.Water.System.at.its.confluence.with.the.regulated.Wallaroo.River..The.agreement.does.not.specify.a.minimum.monthly.flow,.so.a.water.liability.is.recognised.for.any.undelivered.volume.at.the.end.of.the.reporting.period.
Where.water.is.delivered.in.excess.of.the.minimum.flow,.this.is.recognised.as.an.outflow to downstream WRE in addition to minimum flow obligation.
Changes to the minimum flow obligation from Wallaroo Water System to Baxter Water System in years
2X09 and 2X10
Minimum flow obligation 2X10
Month Minimum flow
obligation Delivered
End of month minimum flow
obligation
Jul 150 245 21 420 128 825
Aug 0 16 830 111 995
Sep 0 10 710 101 285
Oct 0 6 885 94 400
Nov 0 3 825 90 575
Dec 0 3 060 87 515
Jan 3 451 3 825 87 141
Feb 0 5 355 81 786
Mar (1 662) 10 710 69 414
Apr 0 18 360 51 054
May 0 24 480 26 574
Jun 0 27 540 0
Annual 152 034 153 000 0
Outflow to downstream WRE in addition to minimum flow obligation
966
Minimum flow obligation 2X09
Month Minimum flow
obligation Delivered
End of month minimum flow
obligation
Jul 146 520 15 100 131 420
Aug 0 12 080 119 340
Sep 2 209 9 060 112 489
Oct 0 9 211 103 278
Nov 0 6 795 96 483
Dec 3 313 6 644 93 152
Jan 0 6 795 86 357
Feb 0 7 550 78 807
Mar 0 9 060 69 747
Apr (1 797) 18 120 49 830
May 0 22 650 27 180
Jun 0 27 935 0
Annual 150 245 151 000 0
Outflow to downstream WRE in addition to minimum flow obligation
755
28 Wallaroo Water System – Model Water Accounting Report Model Water Accounting Report – Wallaroo Water System 29
ED AWAS 1 Ref
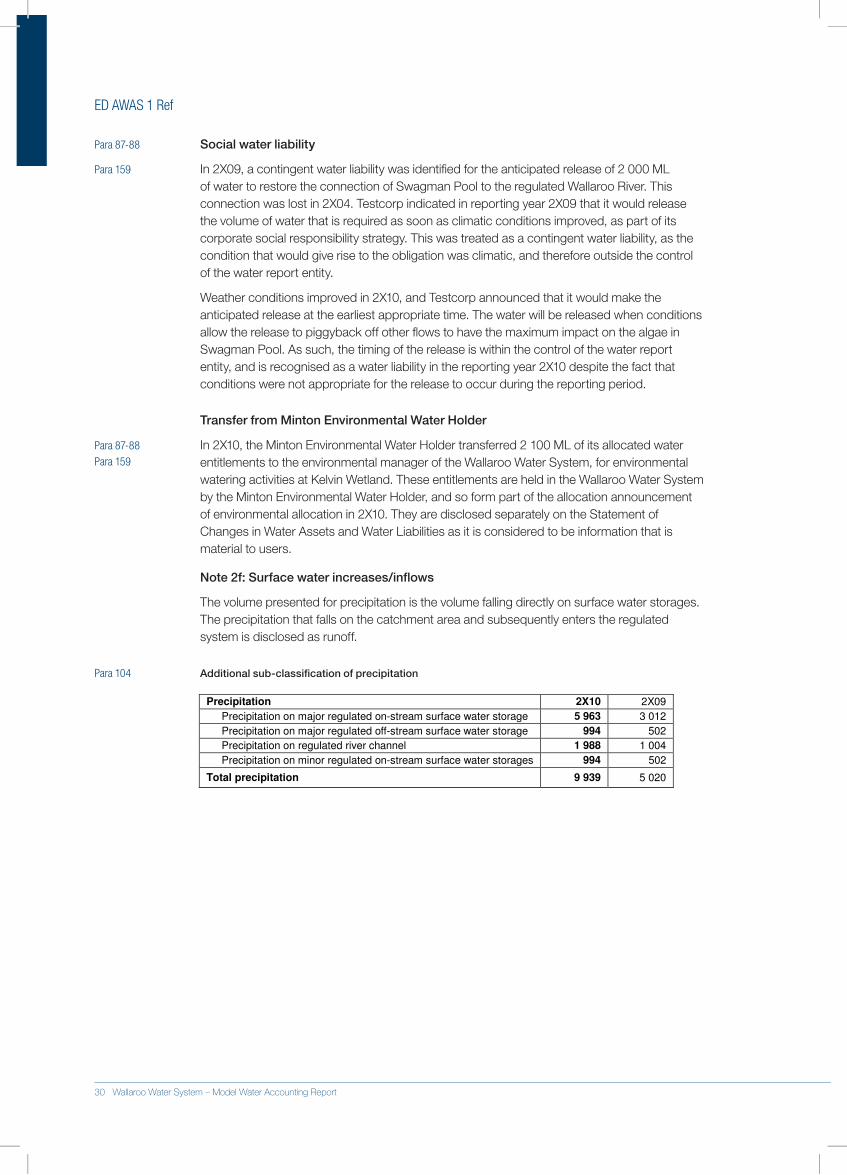
Para 87-88 Social water liability
Para 159 In.2X09,.a.contingent.water.liability.was.identified.for.the.anticipated.release.of.2.000.ML.of.water.to.restore.the.connection.of.Swagman.Pool.to.the.regulated.Wallaroo.River..This.connection.was.lost.in.2X04..Testcorp.indicated.in.reporting.year.2X09.that.it.would.release.the.volume.of.water.that.is.required.as.soon.as.climatic.conditions.improved,.as.part.of.its.corporate.social.responsibility.strategy..This.was.treated.as.a.contingent.water.liability,.as.the.condition.that.would.give.rise.to.the.obligation.was.climatic,.and.therefore.outside.the.control..of.the.water.report.entity.
Weather.conditions.improved.in.2X10,.and.Testcorp.announced.that.it.would.make.the.anticipated.release.at.the.earliest.appropriate.time..The.water.will.be.released.when.conditions.allow.the.release.to.piggyback.off.other.flows.to.have.the.maximum.impact.on.the.algae.in.Swagman.Pool..As.such,.the.timing.of.the.release.is.within.the.control.of.the.water.report.entity,.and.is.recognised.as.a.water.liability.in.the.reporting.year.2X10.despite.the.fact.that.conditions.were.not.appropriate.for.the.release.to.occur.during.the.reporting.period.
Transfer from Minton Environmental Water Holder
Para 87-88 In.2X10,.the.Minton.Environmental.Water.Holder.transferred.2.100.ML.of.its.allocated.water.entitlements.to.the.environmental.manager.of.the.Wallaroo.Water.System,.for.environmental.watering.activities.at.Kelvin.Wetland..These.entitlements.are.held.in.the.Wallaroo.Water.System.by.the.Minton.Environmental.Water.Holder,.and.so.form.part.of.the.allocation.announcement..of.environmental.allocation.in.2X10..They.are.disclosed.separately.on.the.Statement.of.Changes.in.Water.Assets.and.Water.Liabilities.as.it.is.considered.to.be.information.that.is.material.to.users.
Note 2f: Surface water increases/inflows
The.volume.presented.for.precipitation.is.the.volume.falling.directly.on.surface.water.storages..The.precipitation.that.falls.on.the.catchment.area.and.subsequently.enters.the.regulated.system.is.disclosed.as.runoff.
Para 104 Additional sub-classification of precipitation
Precipitation 2X10 2X09
Precipitation on major regulated on-stream surface water storage 5 963 3 012
Precipitation on major regulated off-stream surface water storage 994 502
Precipitation on regulated river channel 1 988 1 004
Precipitation on minor regulated on-stream surface water storages 994 502
Total precipitation 9 939 5 020
Para 159
30 Wallaroo Water System – Model Water Accounting Report
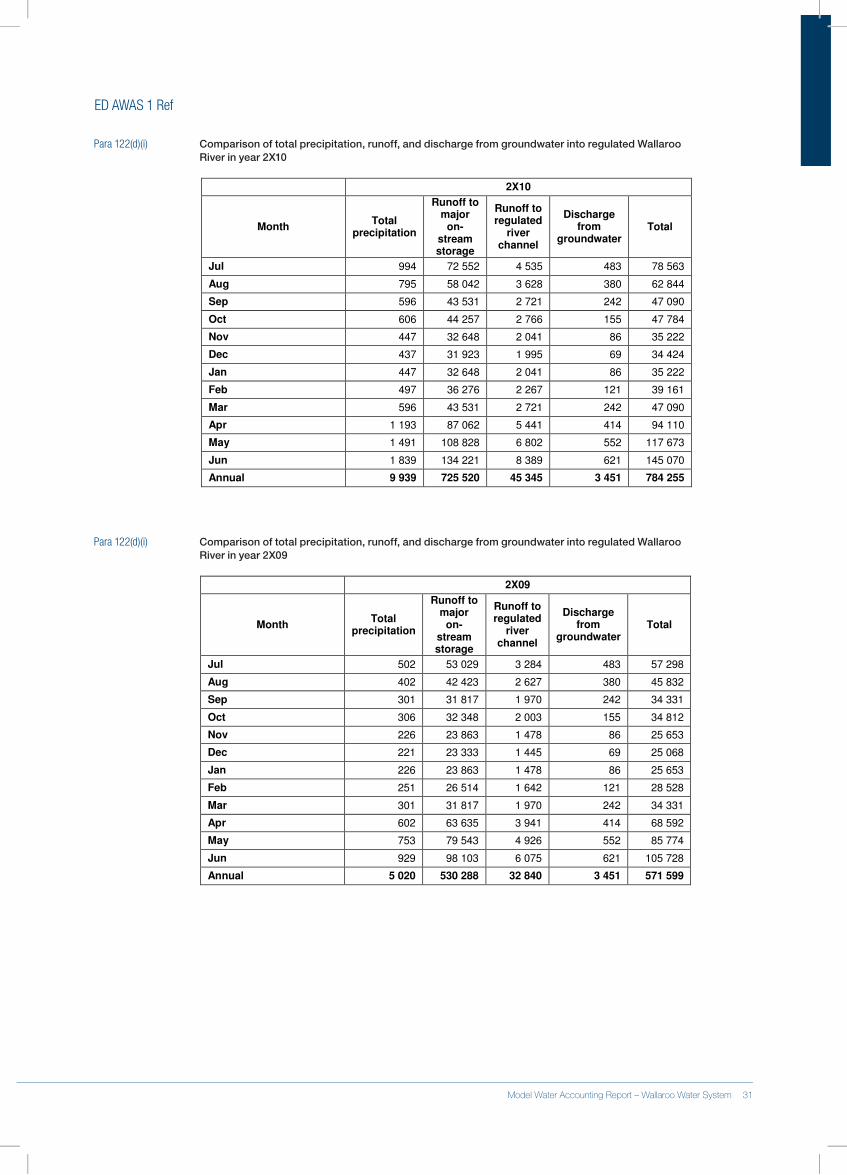
ED AWAS 1 Ref
Para 122(d)(i) Comparison of total precipitation, runoff, and discharge from groundwater into regulated Wallaroo River in year 2X10
2X10
Month Total
precipitation
Runoff to major
on-stream storage
Runoff to regulated
river channel
Discharge from
groundwater Total
Jul 994 72 552 4 535 483 78 563
Aug 795 58 042 3 628 380 62 844
Sep 596 43 531 2 721 242 47 090
Oct 606 44 257 2 766 155 47 784
Nov 447 32 648 2 041 86 35 222
Dec 437 31 923 1 995 69 34 424
Jan 447 32 648 2 041 86 35 222
Feb 497 36 276 2 267 121 39 161
Mar 596 43 531 2 721 242 47 090
Apr 1 193 87 062 5 441 414 94 110
May 1 491 108 828 6 802 552 117 673
Jun 1 839 134 221 8 389 621 145 070
Annual 9 939 725 520 45 345 3 451 784 255
Para 122(d)(i) Comparison of total precipitation, runoff, and discharge from groundwater into regulated Wallaroo River in year 2X09
2X09
Month Total
precipitation
Runoff to major
on-stream storage
Runoff to regulated
river channel
Discharge from
groundwater Total
Jul 502 53 029 3 284 483 57 298
Aug 402 42 423 2 627 380 45 832
Sep 301 31 817 1 970 242 34 331
Oct 306 32 348 2 003 155 34 812
Nov 226 23 863 1 478 86 25 653
Dec 221 23 333 1 445 69 25 068
Jan 226 23 863 1 478 86 25 653
Feb 251 26 514 1 642 121 28 528
Mar 301 31 817 1 970 242 34 331
Apr 602 63 635 3 941 414 68 592
May 753 79 543 4 926 552 85 774
Jun 929 98 103 6 075 621 105 728
Annual 5 020 530 288 32 840 3 451 571 599
30 Wallaroo Water System – Model Water Accounting Report Model Water Accounting Report – Wallaroo Water System 31
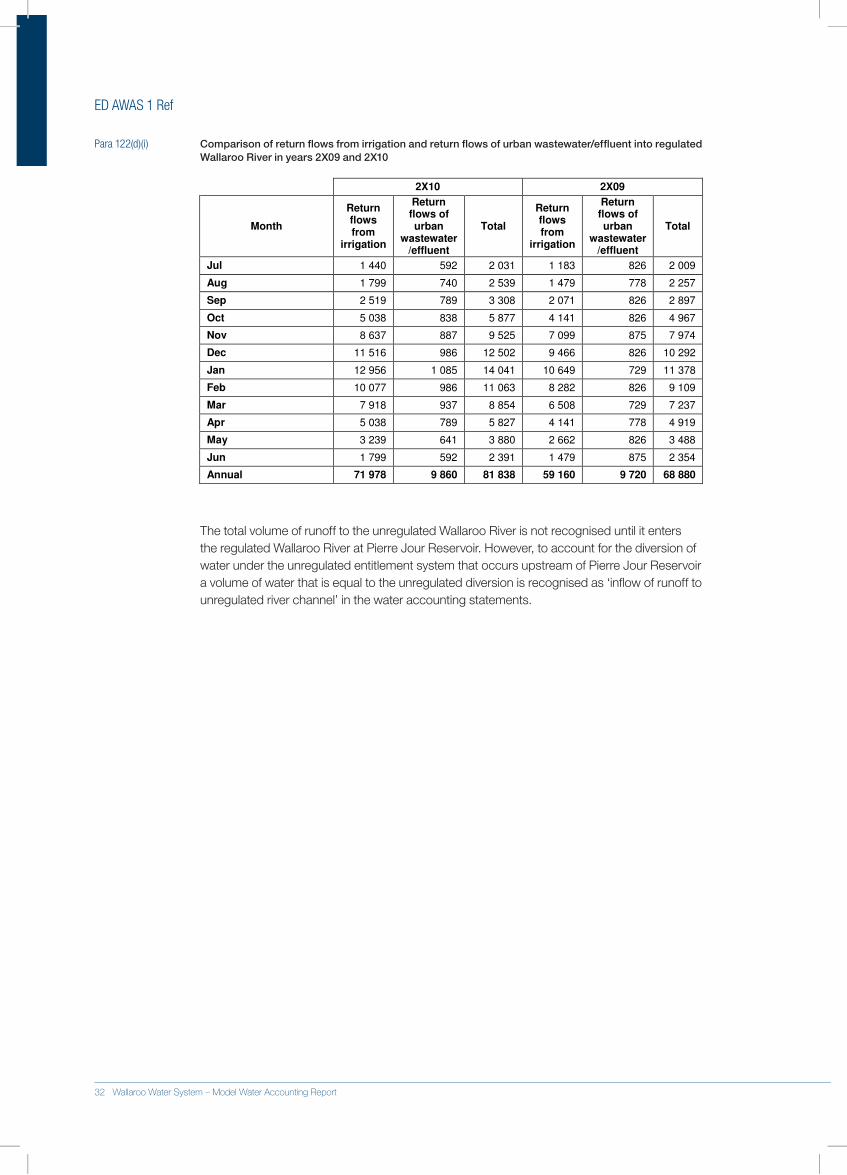
ED AWAS 1 Ref
Para 122(d)(i) Comparison of return flows from irrigation and return flows of urban wastewater/effluent into regulated Wallaroo River in years 2X09 and 2X10
2X10 2X09
Month
Return flows from
irrigation
Return flows of urban
wastewater /effluent
Total
Return flows from
irrigation
Return flows of urban
wastewater /effluent
Total
Jul 1 440 592 2 031 1 183 826 2 009
Aug 1 799 740 2 539 1 479 778 2 257
Sep 2 519 789 3 308 2 071 826 2 897
Oct 5 038 838 5 877 4 141 826 4 967
Nov 8 637 887 9 525 7 099 875 7 974
Dec 11 516 986 12 502 9 466 826 10 292
Jan 12 956 1 085 14 041 10 649 729 11 378
Feb 10 077 986 11 063 8 282 826 9 109
Mar 7 918 937 8 854 6 508 729 7 237
Apr 5 038 789 5 827 4 141 778 4 919
May 3 239 641 3 880 2 662 826 3 488
Jun 1 799 592 2 391 1 479 875 2 354
Annual 71 978 9 860 81 838 59 160 9 720 68 880
The.total.volume.of.runoff.to.the.unregulated.Wallaroo.River.is.not.recognised.until.it.enters.the.regulated.Wallaroo.River.at.Pierre.Jour.Reservoir..However,.to.account.for.the.diversion.of.water.under.the.unregulated.entitlement.system.that.occurs.upstream.of.Pierre.Jour.Reservoir.a.volume.of.water.that.is.equal.to.the.unregulated.diversion.is.recognised.as.‘inflow.of.runoff.to.unregulated.river.channel’.in.the.water.accounting.statements.
32 Wallaroo Water System – Model Water Accounting Report
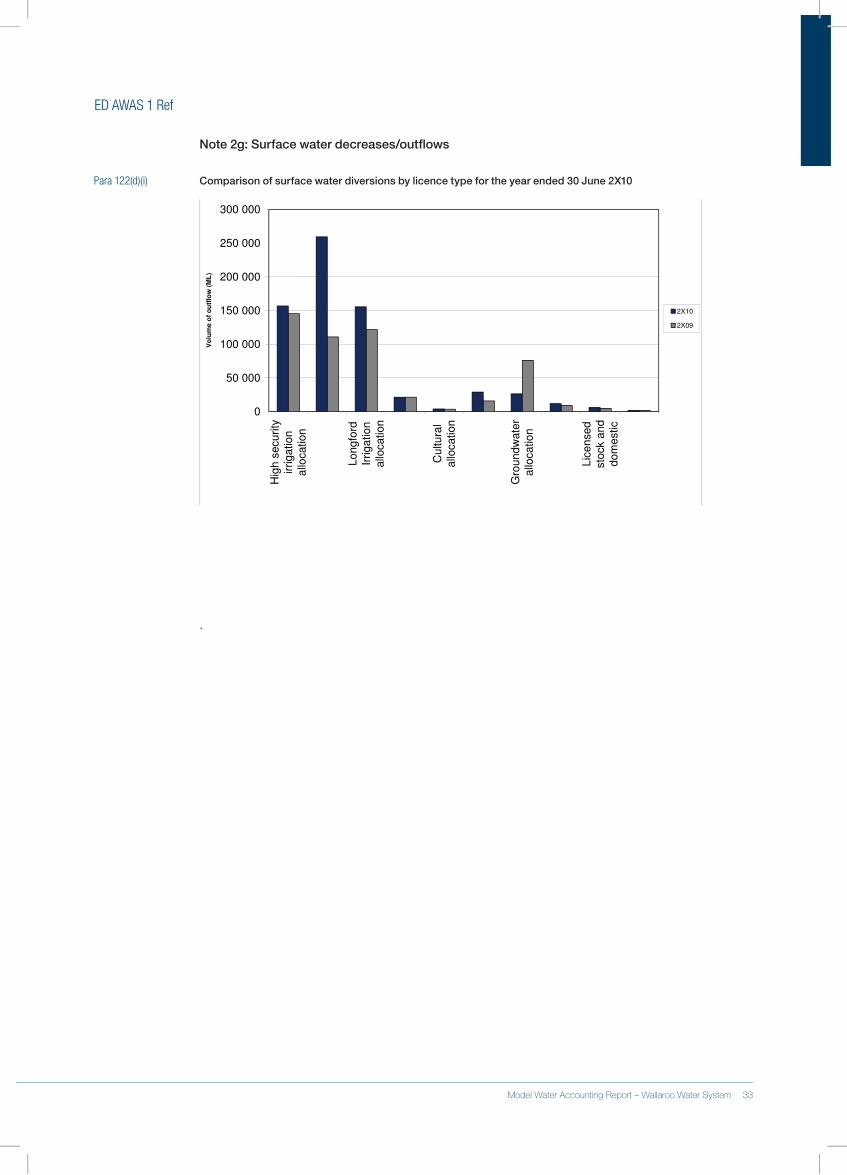
ED AWAS 1 Ref
Note 2g: Surface water decreases/outflows
Para 122(d)(i) Comparison of surface water diversions by licence type for the year ended 30 June 2X10
0
50 000
100 000
150 000
200 000
250 000
300 000
Hig
h s
ecurity
irrigation
allo
cation
Longfo
rd
Irrigation
allo
cation
Cultura
l
allo
cation
Gro
undw
ate
r
allo
cation
Lic
ensed
sto
ck a
nd
dom
estic
Vo
lum
e o
f o
utf
low
(M
L)
2X10
2X09
.
32 Wallaroo Water System – Model Water Accounting Report Model Water Accounting Report – Wallaroo Water System 33
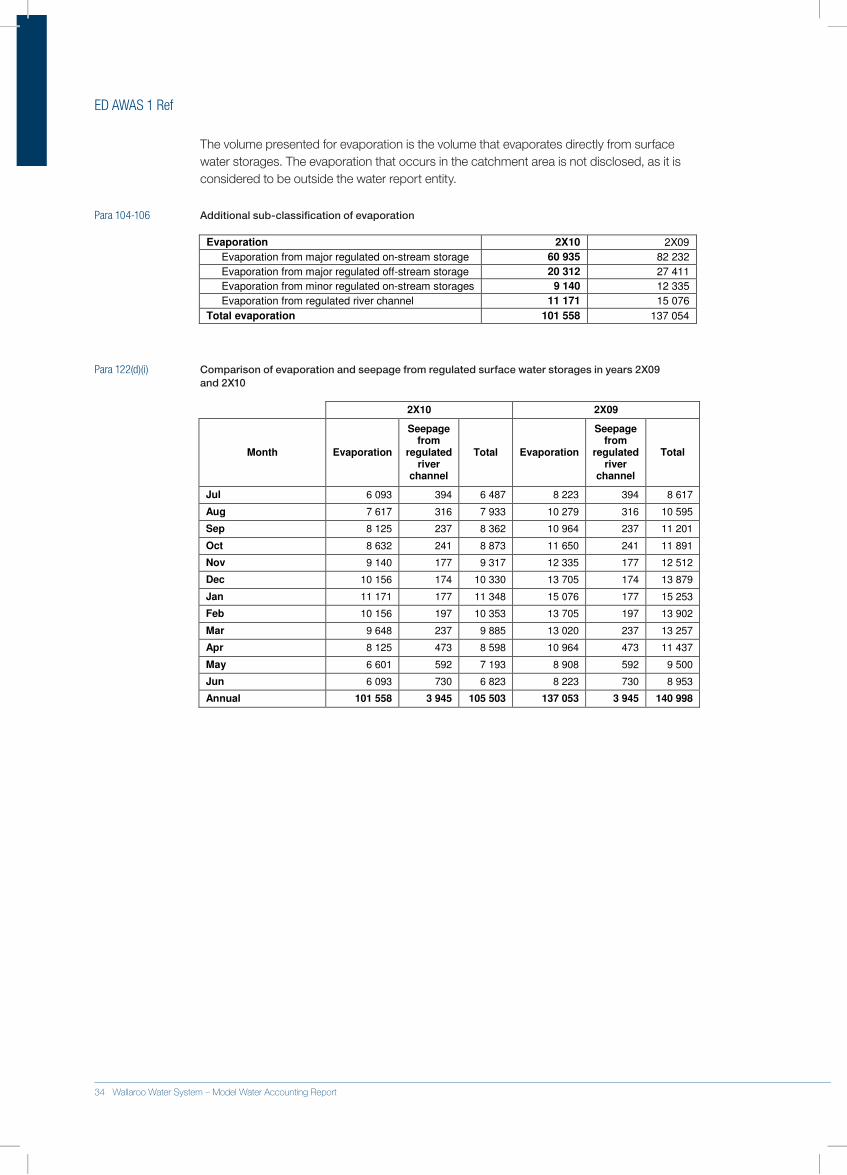
ED AWAS 1 Ref
The.volume.presented.for.evaporation.is.the.volume.that.evaporates.directly.from.surface.water.storages..The.evaporation.that.occurs.in.the.catchment.area.is.not.disclosed,.as.it.is.considered.to.be.outside.the.water.report.entity.
Para 104-106 Additional sub-classification of evaporation
Evaporation 2X10 2X09
Evaporation from major regulated on-stream storage 60 935 82 232
Evaporation from major regulated off-stream storage 20 312 27 411
Evaporation from minor regulated on-stream storages 9 140 12 335
Evaporation from regulated river channel 11 171 15 076
Total evaporation 101 558 137 054
Para 122(d)(i) Comparison of evaporation and seepage from regulated surface water storages in years 2X09 and 2X10
2X10 2X09
Month Evaporation
Seepage from
regulated river
channel
Total Evaporation
Seepage from
regulated river
channel
Total
Jul 6 093 394 6 487 8 223 394 8 617
Aug 7 617 316 7 933 10 279 316 10 595
Sep 8 125 237 8 362 10 964 237 11 201
Oct 8 632 241 8 873 11 650 241 11 891
Nov 9 140 177 9 317 12 335 177 12 512
Dec 10 156 174 10 330 13 705 174 13 879
Jan 11 171 177 11 348 15 076 177 15 253
Feb 10 156 197 10 353 13 705 197 13 902
Mar 9 648 237 9 885 13 020 237 13 257
Apr 8 125 473 8 598 10 964 473 11 437
May 6 601 592 7 193 8 908 592 9 500
Jun 6 093 730 6 823 8 223 730 8 953
Annual 101 558 3 945 105 503 137 053 3 945 140 998
34 Wallaroo Water System – Model Water Accounting Report
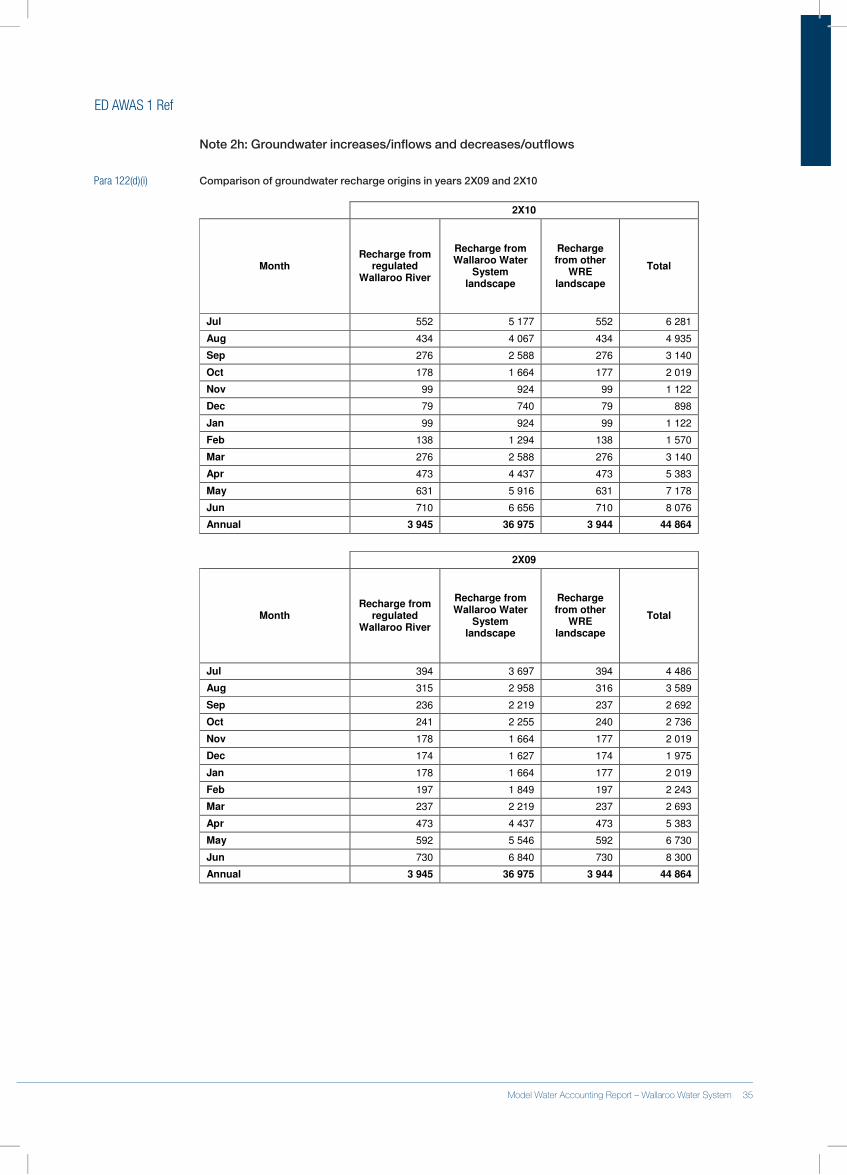
ED AWAS 1 Ref
Note 2h: Groundwater increases/inflows and decreases/outflows
Para 122(d)(i) Comparison of groundwater recharge origins in years 2X09 and 2X10
2X10
Month Recharge from
regulated Wallaroo River
Recharge from Wallaroo Water
System landscape
Recharge from other
WRE landscape
Total
Jul 552 5 177 552 6 281
Aug 434 4 067 434 4 935
Sep 276 2 588 276 3 140
Oct 178 1 664 177 2 019
Nov 99 924 99 1 122
Dec 79 740 79 898
Jan 99 924 99 1 122
Feb 138 1 294 138 1 570
Mar 276 2 588 276 3 140
Apr 473 4 437 473 5 383
May 631 5 916 631 7 178
Jun 710 6 656 710 8 076
Annual 3 945 36 975 3 944 44 864
2X09
Month Recharge from
regulated Wallaroo River
Recharge from Wallaroo Water
System landscape
Recharge from other
WRE landscape
Total
Jul 394 3 697 394 4 486
Aug 315 2 958 316 3 589
Sep 236 2 219 237 2 692
Oct 241 2 255 240 2 736
Nov 178 1 664 177 2 019
Dec 174 1 627 174 1 975
Jan 178 1 664 177 2 019
Feb 197 1 849 197 2 243
Mar 237 2 219 237 2 693
Apr 473 4 437 473 5 383
May 592 5 546 592 6 730
Jun 730 6 840 730 8 300
Annual 3 945 36 975 3 944 44 864
34 Wallaroo Water System – Model Water Accounting Report Model Water Accounting Report – Wallaroo Water System 35
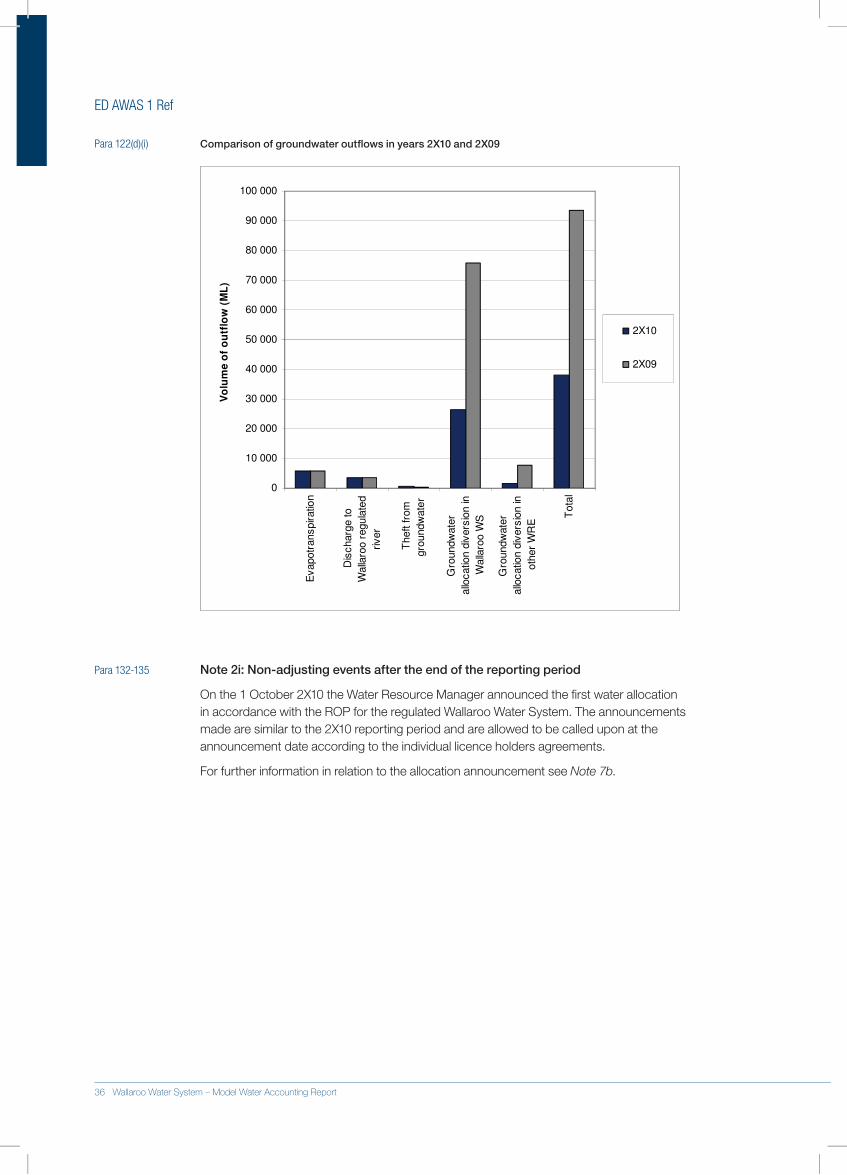
ED AWAS 1 Ref
Para 122(d)(i) Comparison of groundwater outflows in years 2X10 and 2X09
0
10 000
20 000
30 000
40 000
50 000
60 000
70 000
80 000
90 000
100 000
Evapotr
anspiratio
n
Dis
charg
e to
Walla
roo r
egula
ted
river
Theft fro
m
gro
undw
ate
r
Gro
undw
ate
r
allo
catio
n d
ivers
ion in
Walla
roo W
S
Gro
undw
ate
r
allo
catio
n d
ivers
ion in
oth
er
WR
E
To
tal
Vo
lum
e o
f o
utf
low
(M
L)
2X10
2X09
Para 132-135 Note 2i: Non-adjusting events after the end of the reporting period
On.the.1.October.2X10.the.Water.Resource.Manager.announced.the.first.water.allocation.in.accordance.with.the.ROP.for.the.regulated.Wallaroo.Water.System..The.announcements.made.are.similar.to.the.2X10.reporting.period.and.are.allowed.to.be.called.upon.at.the.announcement.date.according.to.the.individual.licence.holders.agreements.
For.further.information.in.relation.to.the.allocation.announcement.see.Note 7b.
36 Wallaroo Water System – Model Water Accounting Report
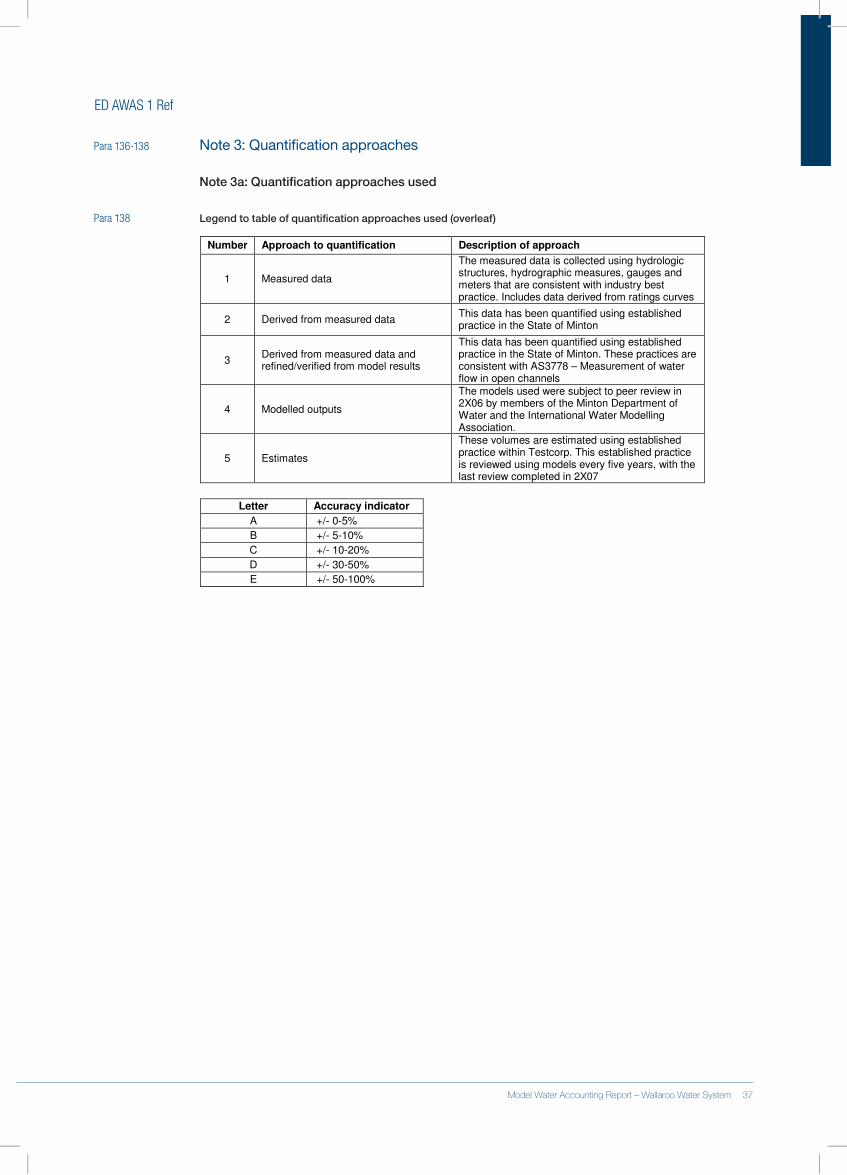
ED AWAS 1 Ref
Para 136-138 Note 3: Quantification approaches
Note 3a: Quantification approaches used
Para 138 Legend to table of quantification approaches used (overleaf)
Number Approach to quantification Description of approach
1 Measured data
The measured data is collected using hydrologic structures, hydrographic measures, gauges and meters that are consistent with industry best practice. Includes data derived from ratings curves
2 Derived from measured data This data has been quantified using established practice in the State of Minton
3 Derived from measured data and refined/verified from model results
This data has been quantified using established practice in the State of Minton. These practices are consistent with AS3778 – Measurement of water flow in open channels
4 Modelled outputs
The models used were subject to peer review in 2X06 by members of the Minton Department of Water and the International Water Modelling Association.
5 Estimates
These volumes are estimated using established practice within Testcorp. This established practice is reviewed using models every five years, with the last review completed in 2X07
Letter Accuracy indicator
A +/- 0-5%
B +/- 5-10%
C +/- 10-20%
D +/- 30-50%
E +/- 50-100%
36 Wallaroo Water System – Model Water Accounting Report Model Water Accounting Report – Wallaroo Water System 37
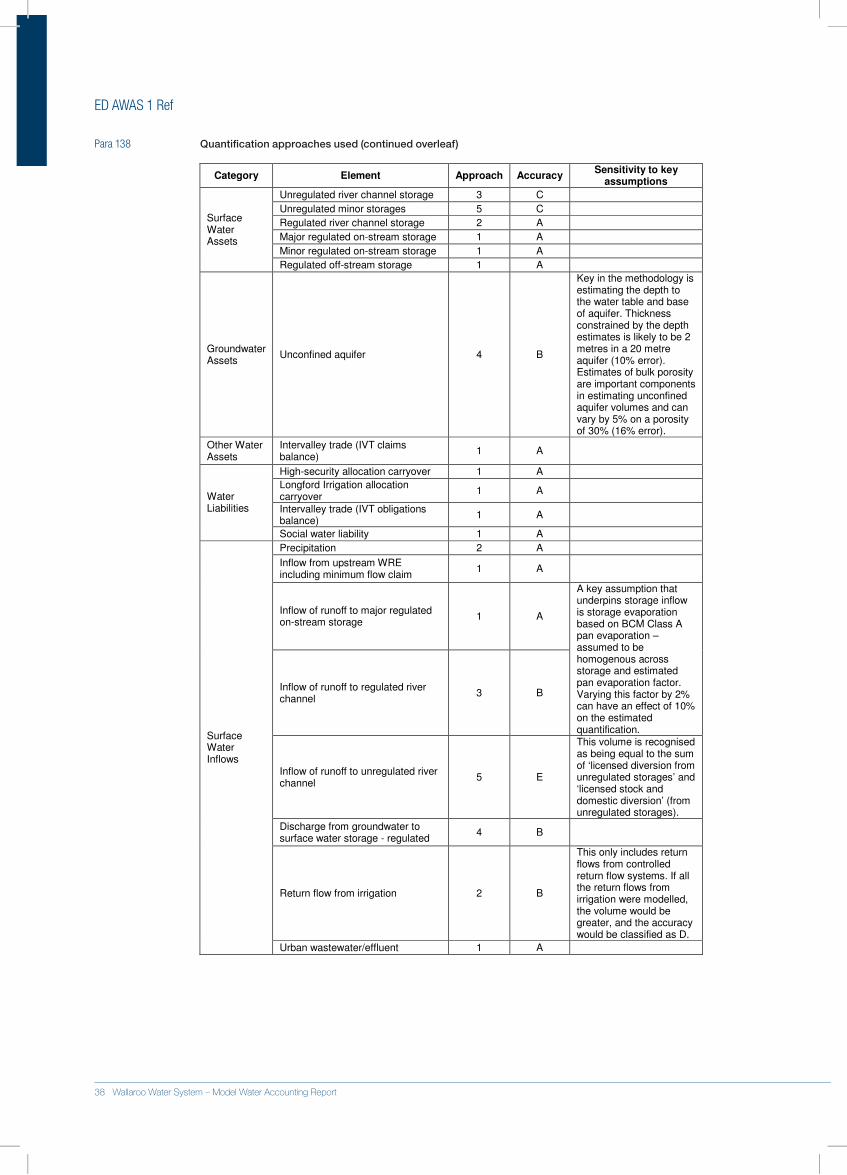
ED AWAS 1 Ref
Para 138 Quantification approaches used (continued overleaf)
Category Element Approach Accuracy Sensitivity to key
assumptions
Unregulated river channel storage 3 C
Unregulated minor storages 5 C
Regulated river channel storage 2 A
Major regulated on-stream storage 1 A
Minor regulated on-stream storage 1 A
Surface Water Assets
Regulated off-stream storage 1 A
Groundwater Assets
Unconfined aquifer 4 B
Key in the methodology is estimating the depth to the water table and base of aquifer. Thickness constrained by the depth estimates is likely to be 2 metres in a 20 metre aquifer (10% error). Estimates of bulk porosity are important components in estimating unconfined aquifer volumes and can vary by 5% on a porosity of 30% (16% error).
Other Water Assets
Intervalley trade (IVT claims balance)
1 A
High-security allocation carryover 1 A
Longford Irrigation allocation carryover
1 A
Intervalley trade (IVT obligations balance)
1 A
Water Liabilities
Social water liability 1 A
Precipitation 2 A
Inflow from upstream WRE including minimum flow claim
1 A
Inflow of runoff to major regulated on-stream storage
1 A
Inflow of runoff to regulated river channel
3 B
A key assumption that underpins storage inflow is storage evaporation based on BCM Class A pan evaporation – assumed to be homogenous across storage and estimated pan evaporation factor. Varying this factor by 2% can have an effect of 10% on the estimated quantification.
Inflow of runoff to unregulated river channel
5 E
This volume is recognised as being equal to the sum of ‘licensed diversion from unregulated storages’ and ‘licensed stock and domestic diversion’ (from unregulated storages).
Discharge from groundwater to surface water storage - regulated
4 B
Return flow from irrigation 2 B
This only includes return flows from controlled return flow systems. If all the return flows from irrigation were modelled, the volume would be greater, and the accuracy would be classified as D.
Surface Water Inflows
Urban wastewater/effluent 1 A
38 Wallaroo Water System – Model Water Accounting Report
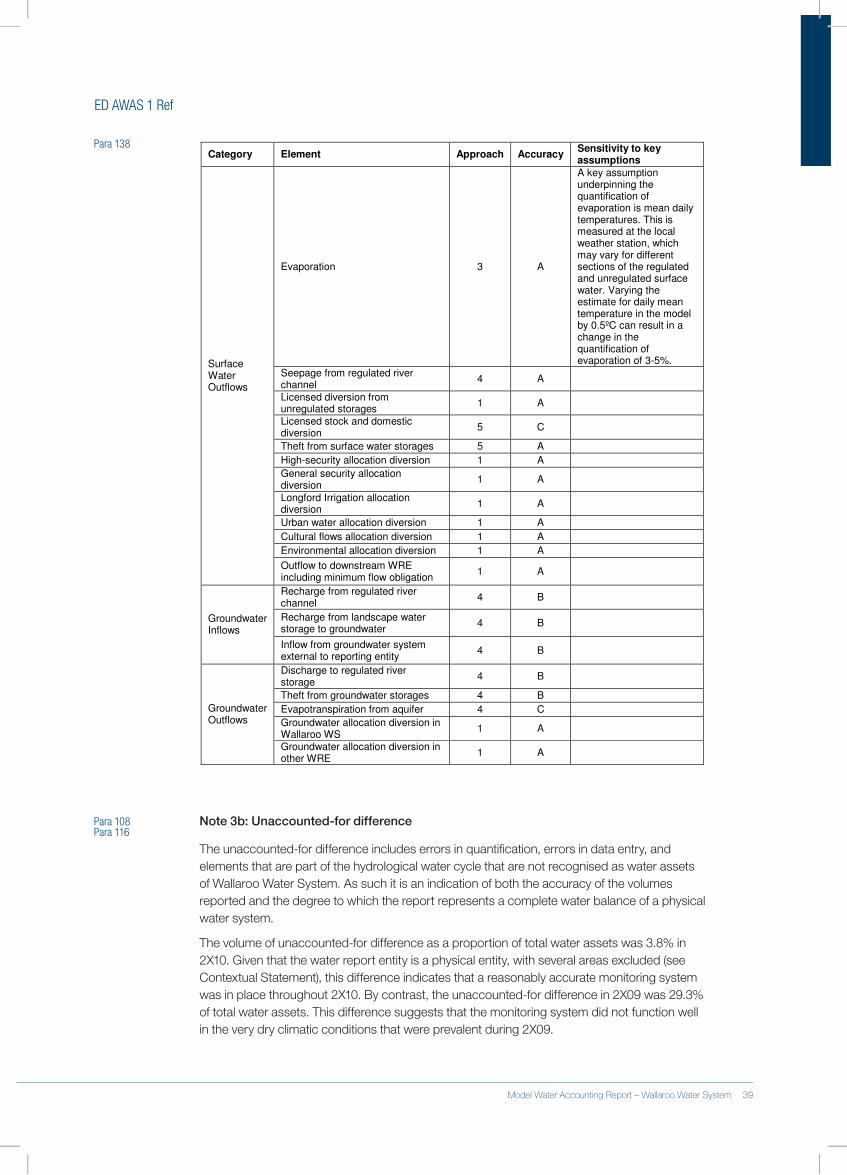
ED AWAS 1 Ref
Para 138 Category Element Approach Accuracy
Sensitivity to key assumptions
Evaporation 3 A
A key assumption underpinning the quantification of evaporation is mean daily temperatures. This is measured at the local weather station, which may vary for different sections of the regulated and unregulated surface water. Varying the estimate for daily mean temperature in the model by 0.5ºC can result in a change in the quantification of evaporation of 3-5%.
Seepage from regulated river channel
4 A
Licensed diversion from unregulated storages
1 A
Licensed stock and domestic diversion
5 C
Theft from surface water storages 5 A
High-security allocation diversion 1 A
General security allocation diversion
1 A
Longford Irrigation allocation diversion
1 A
Urban water allocation diversion 1 A
Cultural flows allocation diversion 1 A
Environmental allocation diversion 1 A
Surface Water Outflows
Outflow to downstream WRE including minimum flow obligation
1 A
Recharge from regulated river channel
4 B
Recharge from landscape water storage to groundwater
4 B Groundwater Inflows
Inflow from groundwater system external to reporting entity
4 B
Discharge to regulated river storage
4 B
Theft from groundwater storages 4 B
Evapotranspiration from aquifer 4 C
Groundwater allocation diversion in Wallaroo WS
1 A
Groundwater Outflows
Groundwater allocation diversion in other WRE
1 A
Para 108 Note 3b: Unaccounted-for differencePara 116
The.unaccounted-for.difference.includes.errors.in.quantification,.errors.in.data.entry,.and.elements.that.are.part.of.the.hydrological.water.cycle.that.are.not.recognised.as.water.assets.of.Wallaroo.Water.System..As.such.it.is.an.indication.of.both.the.accuracy.of.the.volumes.reported.and.the.degree.to.which.the.report.represents.a.complete.water.balance.of.a.physical.water.system.
The.volume.of.unaccounted-for.difference.as.a.proportion.of.total.water.assets.was.3.8%.in.2X10..Given.that.the.water.report.entity.is.a.physical.entity,.with.several.areas.excluded.(see.Contextual.Statement),.this.difference.indicates.that.a.reasonably.accurate.monitoring.system.was.in.place.throughout.2X10..By.contrast,.the.unaccounted-for.difference.in.2X09.was.29.3%.of.total.water.assets..This.difference.suggests.that.the.monitoring.system.did.not.function.well.in.the.very.dry.climatic.conditions.that.were.prevalent.during.2X09.
38 Wallaroo Water System – Model Water Accounting Report Model Water Accounting Report – Wallaroo Water System 39
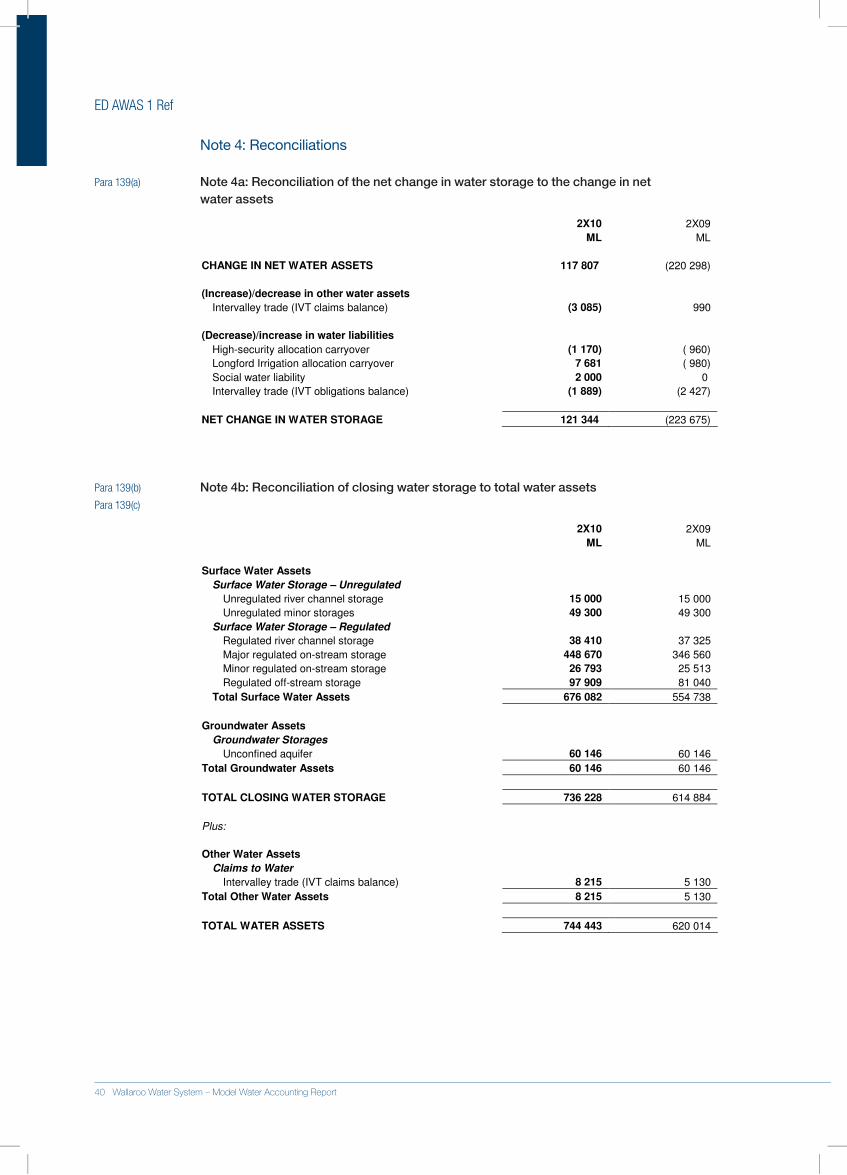
ED AWAS 1 Ref
Note 4: Reconciliations
Para 139(a) Note 4a: Reconciliation of the net change in water storage to the change in net water assets
2X10 2X09
ML ML
CHANGE IN NET WATER ASSETS 117 807 (220 298)
(Increase)/decrease in other water assets
Intervalley trade (IVT claims balance) (3 085) 990
(Decrease)/increase in water liabilities
High-security allocation carryover (1 170) ( 960)
Longford Irrigation allocation carryover 7 681 ( 980)
Social water liability 2 000 0
Intervalley trade (IVT obligations balance) (1 889) (2 427)
NET CHANGE IN WATER STORAGE 121 344 (223 675)
Para 139(b) Note 4b: Reconciliation of closing water storage to total water assets Para 139(c)
2X10 2X09
ML ML
Surface Water Assets
Surface Water Storage – Unregulated
Unregulated river channel storage 15 000 15 000
Unregulated minor storages 49 300 49 300
Surface Water Storage – Regulated
Regulated river channel storage 38 410 37 325
Major regulated on-stream storage 448 670 346 560
Minor regulated on-stream storage 26 793 25 513
Regulated off-stream storage 97 909 81 040
Total Surface Water Assets 676 082 554 738
Groundwater Assets
Groundwater Storages
Unconfined aquifer 60 146 60 146
Total Groundwater Assets 60 146 60 146
TOTAL CLOSING WATER STORAGE 736 228 614 884
Plus:
Other Water Assets
Claims to Water
Intervalley trade (IVT claims balance) 8 215 5 130
Total Other Water Assets 8 215 5 130
TOTAL WATER ASSETS 744 443 620 014
40 Wallaroo Water System – Model Water Accounting Report
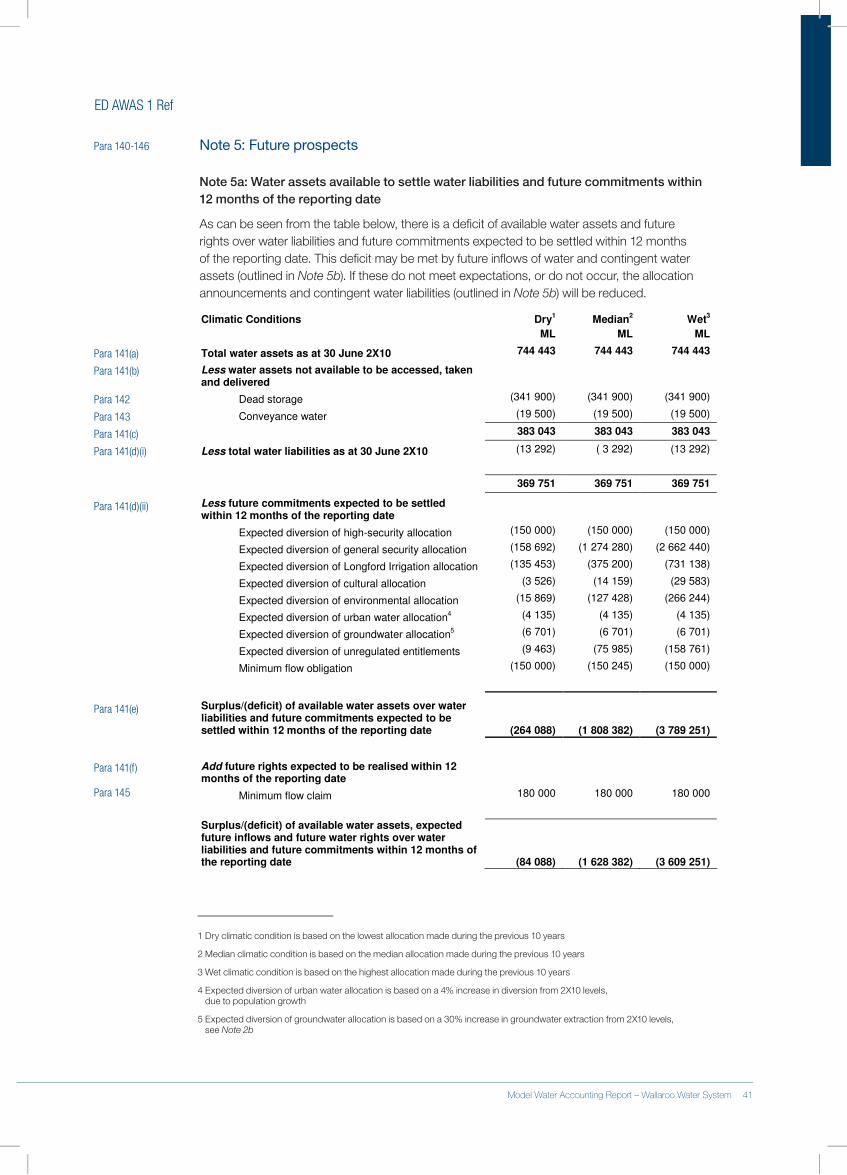
ED AWAS 1 Ref
Para 140-146 Note 5: Future prospects
Note 5a: Water assets available to settle water liabilities and future commitments within 12 months of the reporting date
As.can.be.seen.from.the.table.below,.there.is.a.deficit.of.available.water.assets.and.future.rights.over.water.liabilities.and.future.commitments.expected.to.be.settled.within.12.months.of.the.reporting.date..This.deficit.may.be.met.by.future.inflows.of.water.and.contingent.water.assets.(outlined.in.Note 5b)..If.these.do.not.meet.expectations,.or.do.not.occur,.the.allocation.announcements.and.contingent.water.liabilities.(outlined.in.Note 5b).will.be.reduced.
Climatic Conditions Dry1 Median
2 Wet
3
ML ML ML
Total water assets as at 30 June 2X10 744 443 744 443 744 443
Less water assets not available to be accessed, taken and delivered
Dead storage (341 900) (341 900) (341 900)
Conveyance water (19 500) (19 500) (19 500)
383 043 383 043 383 043
Less total water liabilities as at 30 June 2X10 (13 292) ( 3 292) (13 292)
369 751 369 751 369 751
Less future commitments expected to be settled within 12 months of the reporting date
Expected diversion of high-security allocation (150 000) (150 000) (150 000)
Expected diversion of general security allocation (158 692) (1 274 280) (2 662 440)
Expected diversion of Longford Irrigation allocation (135 453) (375 200) (731 138)
Expected diversion of cultural allocation (3 526) (14 159) (29 583)
Expected diversion of environmental allocation (15 869) (127 428) (266 244)
Expected diversion of urban water allocation4 (4 135) (4 135) (4 135)
Expected diversion of groundwater allocation5 (6 701) (6 701) (6 701)
Expected diversion of unregulated entitlements (9 463) (75 985) (158 761)
Minimum flow obligation (150 000) (150 245) (150 000)
Surplus/(deficit) of available water assets over water liabilities and future commitments expected to be settled within 12 months of the reporting date (264 088) (1 808 382) (3 789 251)
Add future rights expected to be realised within 12 months of the reporting date
Minimum flow claim 180 000 180 000 180 000
Surplus/(deficit) of available water assets, expected future inflows and future water rights over water liabilities and future commitments within 12 months of the reporting date (84 088) (1 628 382) (3 609 251)
1 Dry climatic condition is based on the lowest allocation made during the previous 10 years
2 Median climatic condition is based on the median allocation made during the previous 10 years
3 Wet climatic condition is based on the highest allocation made during the previous 10 years
4 Expected diversion of urban water allocation is based on a 4% increase in diversion from 2X10 levels, due
to population growth 5 Expected diversion of groundwater allocation is based on a 30% increase in groundwater extraction from
2X10 levels, see Note 2b
Para 141(a)
Para 141(b)
Para 142
Para 143
Para 141(c)
Para 141(d)(i)
Para 141(d)(ii)
Para 141(e)
Para 141(f)
Para 145
1..Dry.climatic.condition.is.based.on.the.lowest.allocation.made.during.the.previous.10.years
2..Median.climatic.condition.is.based.on.the.median.allocation.made.during.the.previous.10.years
3.Wet.climatic.condition.is.based.on.the.highest.allocation.made.during.the.previous.10.years
4..Expected.diversion.of.urban.water.allocation.is.based.on.a.4%.increase.in.diversion.from.2X10.levels,..due.to.population.growth
5..Expected.diversion.of.groundwater.allocation.is.based.on.a.30%.increase.in.groundwater.extraction.from.2X10.levels,..see.Note 2b
40 Wallaroo Water System – Model Water Accounting Report Model Water Accounting Report – Wallaroo Water System 41
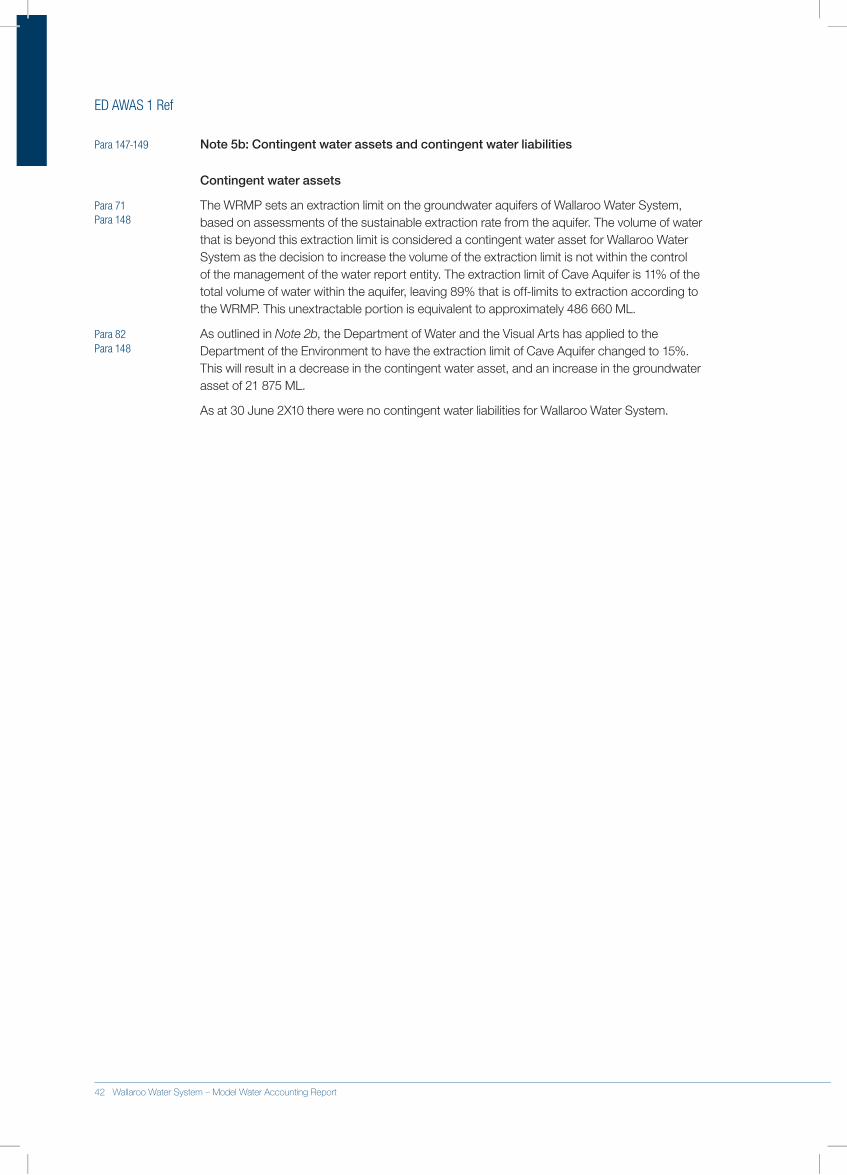
ED AWAS 1 Ref
Para 147-149 Note 5b: Contingent water assets and contingent water liabilities
Contingent water assets
Para 71 The.WRMP.sets.an.extraction.limit.on.the.groundwater.aquifers.of.Wallaroo.Water.System,.based.on.assessments.of.the.sustainable.extraction.rate.from.the.aquifer..The.volume.of.water.that.is.beyond.this.extraction.limit.is.considered.a.contingent.water.asset.for.Wallaroo.Water.System.as.the.decision.to.increase.the.volume.of.the.extraction.limit.is.not.within.the.control.of.the.management.of.the.water.report.entity..The.extraction.limit.of.Cave.Aquifer.is.11%.of.the.total.volume.of.water.within.the.aquifer,.leaving.89%.that.is.off-limits.to.extraction.according.to.the.WRMP..This.unextractable.portion.is.equivalent.to.approximately.486.660.ML.
Para 82 As.outlined.in.Note 2b,.the.Department.of.Water.and.the.Visual.Arts.has.applied.to.the.Department.of.the.Environment.to.have.the.extraction.limit.of.Cave.Aquifer.changed.to.15%..This.will.result.in.a.decrease.in.the.contingent.water.asset,.and.an.increase.in.the.groundwater.asset.of.21.875.ML.
As.at.30.June.2X10.there.were.no.contingent.water.liabilities.for.Wallaroo.Water.System.
Para 148
Para 148
42 Wallaroo Water System – Model Water Accounting Report
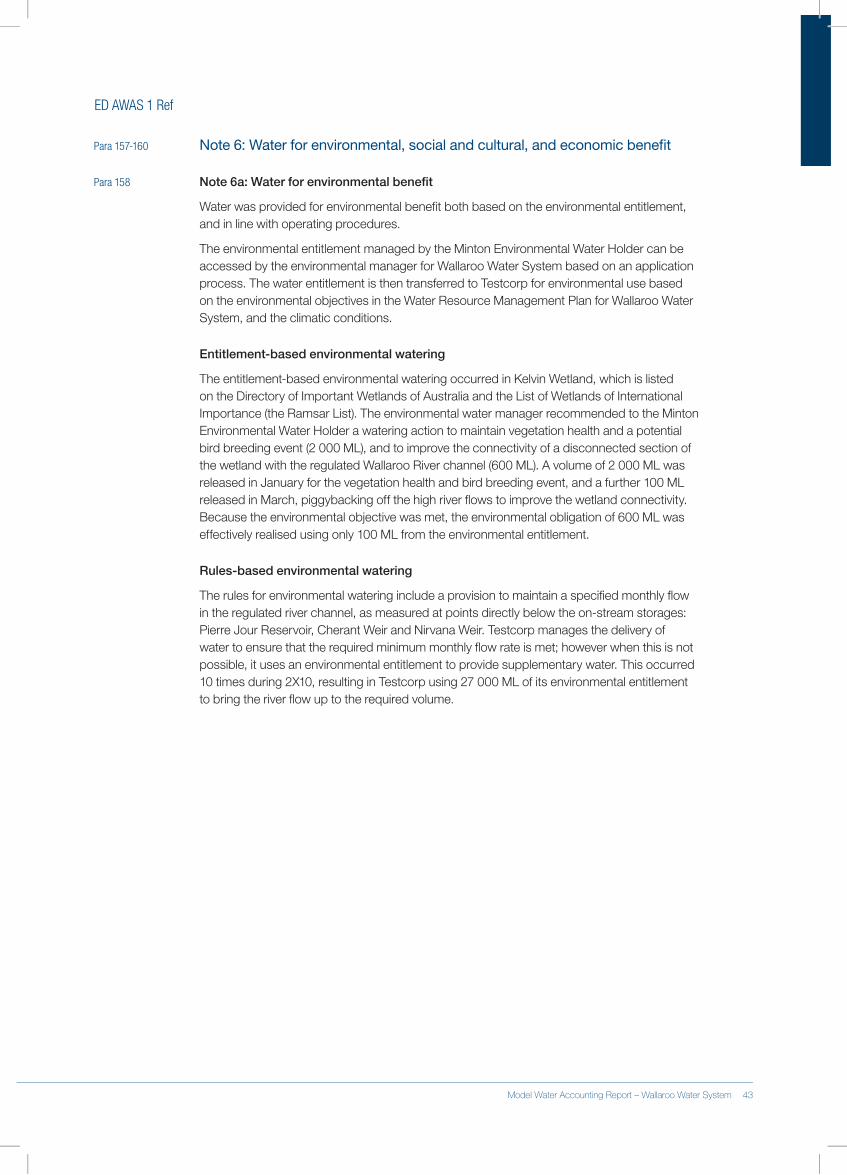
ED AWAS 1 Ref
Para 157-160 Note 6: Water for environmental, social and cultural, and economic benefit
Para 158 Note 6a: Water for environmental benefit
Water.was.provided.for.environmental.benefit.both.based.on.the.environmental.entitlement,.and.in.line.with.operating.procedures.
The.environmental.entitlement.managed.by.the.Minton.Environmental.Water.Holder.can.be.accessed.by.the.environmental.manager.for.Wallaroo.Water.System.based.on.an.application.process..The.water.entitlement.is.then.transferred.to.Testcorp.for.environmental.use.based.on.the.environmental.objectives.in.the.Water.Resource.Management.Plan.for.Wallaroo.Water.System,.and.the.climatic.conditions.
Entitlement-based environmental watering
The.entitlement-based.environmental.watering.occurred.in.Kelvin.Wetland,.which.is.listed.on.the.Directory.of.Important.Wetlands.of.Australia.and.the.List.of.Wetlands.of.International.Importance.(the.Ramsar.List)..The.environmental.water.manager.recommended.to.the.Minton.Environmental.Water.Holder.a.watering.action.to.maintain.vegetation.health.and.a.potential.bird.breeding.event.(2.000.ML),.and.to.improve.the.connectivity.of.a.disconnected.section.of.the.wetland.with.the.regulated.Wallaroo.River.channel.(600.ML)..A.volume.of.2.000.ML.was.released.in.January.for.the.vegetation.health.and.bird.breeding.event,.and.a.further.100.ML.released.in.March,.piggybacking.off.the.high.river.flows.to.improve.the.wetland.connectivity..Because.the.environmental.objective.was.met,.the.environmental.obligation.of.600.ML.was.effectively.realised.using.only.100.ML.from.the.environmental.entitlement.
Rules-based environmental watering
The.rules.for.environmental.watering.include.a.provision.to.maintain.a.specified.monthly.flow.in.the.regulated.river.channel,.as.measured.at.points.directly.below.the.on-stream.storages:.Pierre.Jour.Reservoir,.Cherant.Weir.and.Nirvana.Weir..Testcorp.manages.the.delivery.of.water.to.ensure.that.the.required.minimum.monthly.flow.rate.is.met;.however.when.this.is.not.possible,.it.uses.an.environmental.entitlement.to.provide.supplementary.water..This.occurred.10.times.during.2X10,.resulting.in.Testcorp.using.27.000.ML.of.its.environmental.entitlement..to.bring.the.river.flow.up.to.the.required.volume.
42 Wallaroo Water System – Model Water Accounting Report Model Water Accounting Report – Wallaroo Water System 43
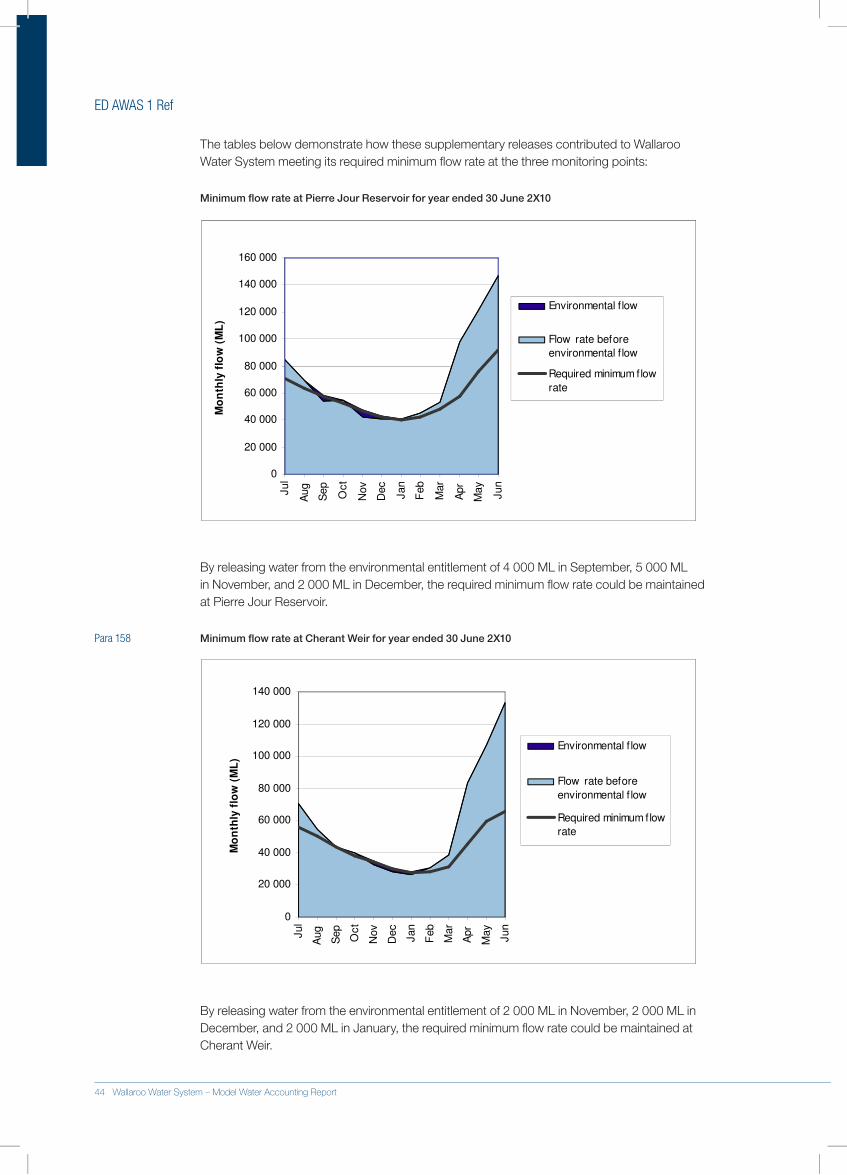
ED AWAS 1 Ref
The.tables.below.demonstrate.how.these.supplementary.releases.contributed.to.Wallaroo.Water.System.meeting.its.required.minimum.flow.rate.at.the.three.monitoring.points:
Minimum flow rate at Pierre Jour Reservoir for year ended 30 June 2X10
.
0
20 000
40 000
60 000
80 000
100 000
120 000
140 000
160 000
Jul
Aug
Sep
Oct
Nov
Dec
Jan
Feb
Mar
Apr
May
Jun
Mo
nth
ly f
low
(M
L)
Environmental flow
Flow rate before
environmental flow
Required minimum flow
rate
By.releasing.water.from.the.environmental.entitlement.of.4.000.ML.in.September,.5.000.ML..in.November,.and.2.000.ML.in.December,.the.required.minimum.flow.rate.could.be.maintained..at.Pierre.Jour.Reservoir.
Para 158 Minimum flow rate at Cherant Weir for year ended 30 June 2X10
.
0
20 000
40 000
60 000
80 000
100 000
120 000
140 000
Jul
Aug
Sep
Oct
Nov
Dec
Jan
Feb
Mar
Apr
May
Jun
Mo
nth
ly f
low
(M
L)
Environmental f low
Flow rate before
environmental f low
Required minimum flow
rate
By.releasing.water.from.the.environmental.entitlement.of.2.000.ML.in.November,.2.000.ML.in.December,.and.2.000.ML.in.January,.the.required.minimum.flow.rate.could.be.maintained.at.Cherant.Weir.
44 Wallaroo Water System – Model Water Accounting Report
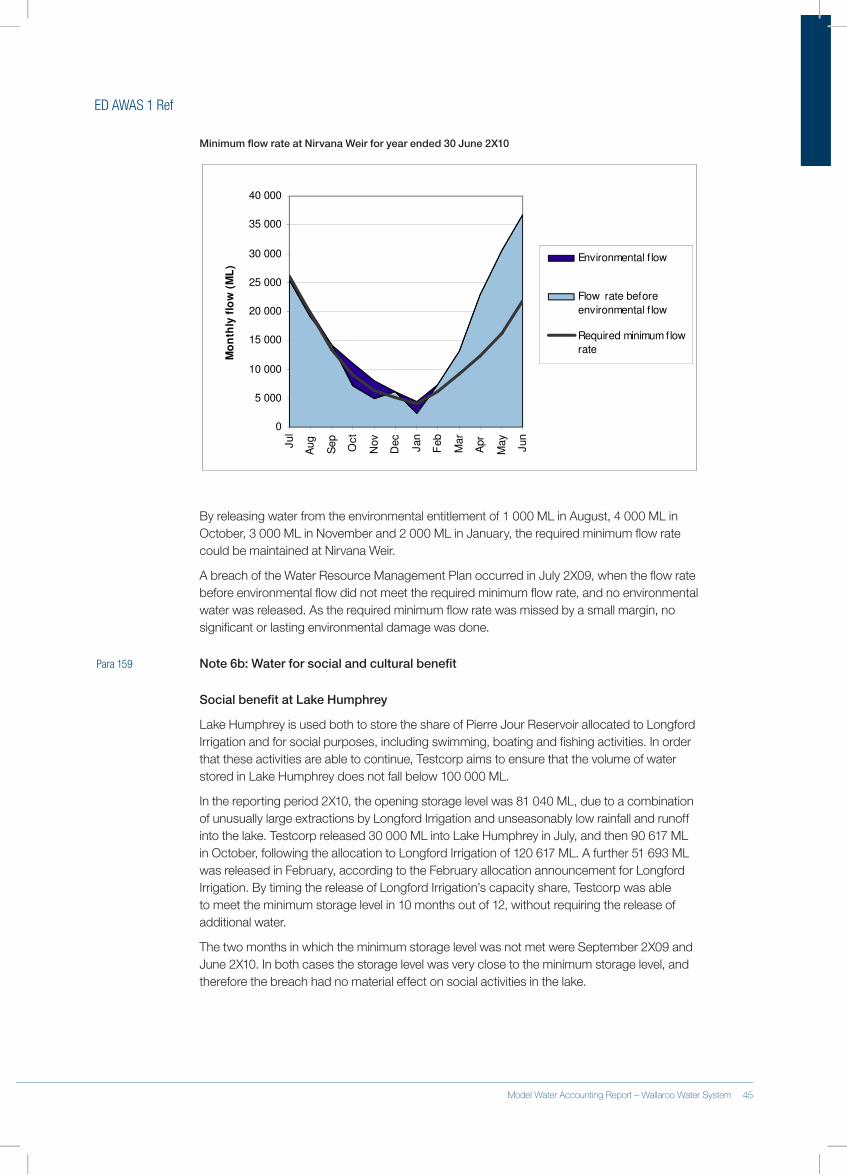
ED AWAS 1 Ref
Minimum flow rate at Nirvana Weir for year ended 30 June 2X10
0
5 000
10 000
15 000
20 000
25 000
30 000
35 000
40 000
Ju
l
Aug
Se
p
Oct
Nov
Dec
Jan
Feb
Mar
Apr
May
Jun
Mo
nth
ly f
low
(M
L)
Environmental f low
Flow rate before
environmental f low
Required minimum flow
rate
By.releasing.water.from.the.environmental.entitlement.of.1.000.ML.in.August,.4.000.ML.in.October,.3.000.ML.in.November.and.2.000.ML.in.January,.the.required.minimum.flow.rate.could.be.maintained.at.Nirvana.Weir.
A.breach.of.the.Water.Resource.Management.Plan.occurred.in.July.2X09,.when.the.flow.rate.before.environmental.flow.did.not.meet.the.required.minimum.flow.rate,.and.no.environmental.water.was.released..As.the.required.minimum.flow.rate.was.missed.by.a.small.margin,.no.significant.or.lasting.environmental.damage.was.done.
Para 159 Note 6b: Water for social and cultural benefit
Social benefit at Lake Humphrey
Lake.Humphrey.is.used.both.to.store.the.share.of.Pierre.Jour.Reservoir.allocated.to.Longford.Irrigation.and.for.social.purposes,.including.swimming,.boating.and.fishing.activities..In.order.that.these.activities.are.able.to.continue,.Testcorp.aims.to.ensure.that.the.volume.of.water.stored.in.Lake.Humphrey.does.not.fall.below.100.000.ML..
In.the.reporting.period.2X10,.the.opening.storage.level.was.81.040.ML,.due.to.a.combination.of.unusually.large.extractions.by.Longford.Irrigation.and.unseasonably.low.rainfall.and.runoff.into.the.lake..Testcorp.released.30.000.ML.into.Lake.Humphrey.in.July,.and.then.90.617.ML.in.October,.following.the.allocation.to.Longford.Irrigation.of.120.617.ML..A.further.51.693.ML.was.released.in.February,.according.to.the.February.allocation.announcement.for.Longford.Irrigation..By.timing.the.release.of.Longford.Irrigation’s.capacity.share,.Testcorp.was.able.to.meet.the.minimum.storage.level.in.10.months.out.of.12,.without.requiring.the.release.of.additional.water.
The.two.months.in.which.the.minimum.storage.level.was.not.met.were.September.2X09.and.June.2X10..In.both.cases.the.storage.level.was.very.close.to.the.minimum.storage.level,.and.therefore.the.breach.had.no.material.effect.on.social.activities.in.the.lake.
44 Wallaroo Water System – Model Water Accounting Report Model Water Accounting Report – Wallaroo Water System 45
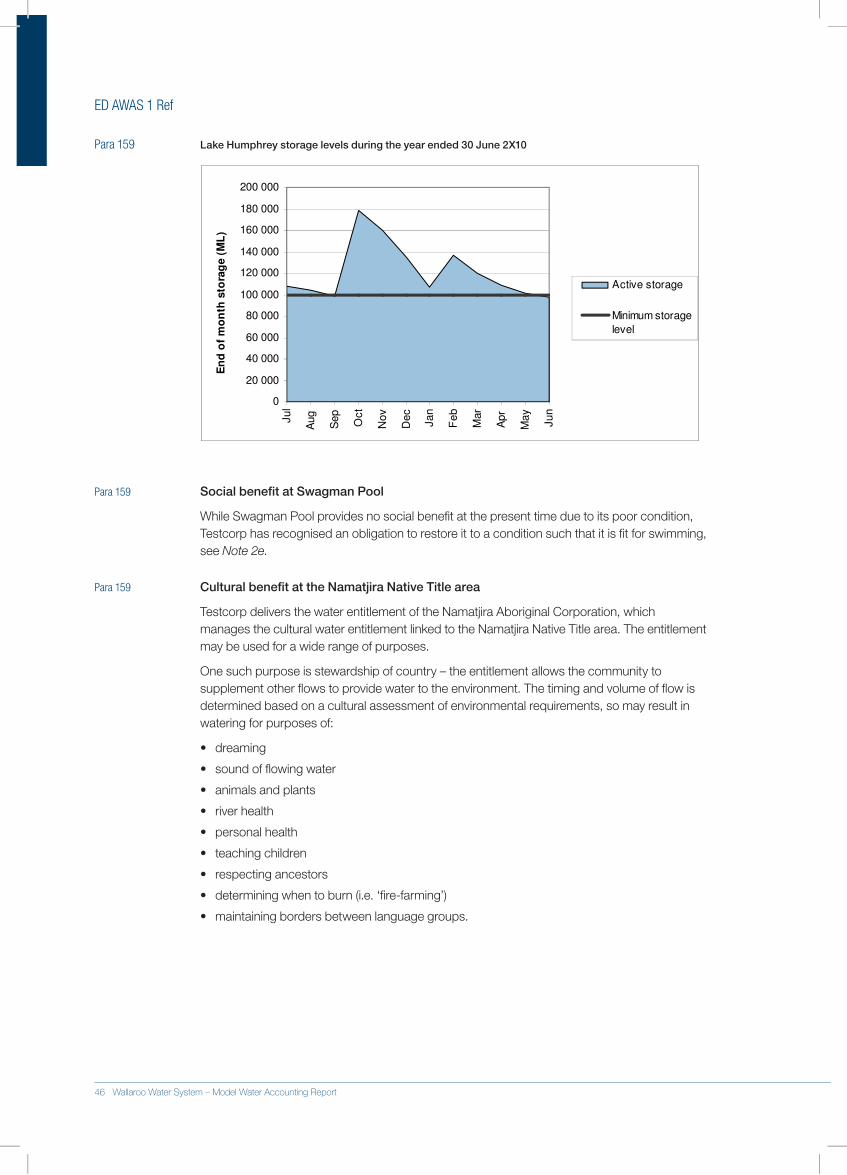
ED AWAS 1 Ref
Para 159 Lake Humphrey storage levels during the year ended 30 June 2X10
.
0
20 000
40 000
60 000
80 000
100 000
120 000
140 000
160 000
180 000
200 000
Jul
Aug
Sep
Oct
Nov
Dec
Jan
Feb
Mar
Apr
May
Jun
En
d o
f m
on
th s
tora
ge (
ML
)
Active storage
Minimum storage
level
Para 159 Social benefit at Swagman Pool
While.Swagman.Pool.provides.no.social.benefit.at.the.present.time.due.to.its.poor.condition,.Testcorp.has.recognised.an.obligation.to.restore.it.to.a.condition.such.that.it.is.fit.for.swimming,.see.Note 2e.
Para 159 Cultural benefit at the Namatjira Native Title area
Testcorp.delivers.the.water.entitlement.of.the.Namatjira.Aboriginal.Corporation,.which.manages.the.cultural.water.entitlement.linked.to.the.Namatjira.Native.Title.area..The.entitlement.may.be.used.for.a.wide.range.of.purposes.
One.such.purpose.is.stewardship.of.country.–.the.entitlement.allows.the.community.to.supplement.other.flows.to.provide.water.to.the.environment..The.timing.and.volume.of.flow.is.determined.based.on.a.cultural.assessment.of.environmental.requirements,.so.may.result.in.watering.for.purposes.of:
•. dreaming..
•. sound.of.flowing.water..
•. animals.and.plants.
•. river.health..
•. personal.health..
•. teaching.children..
•. respecting.ancestors..
•. determining.when.to.burn.(i.e..‘fire-farming’)..
•. maintaining.borders.between.language.groups..
46 Wallaroo Water System – Model Water Accounting Report
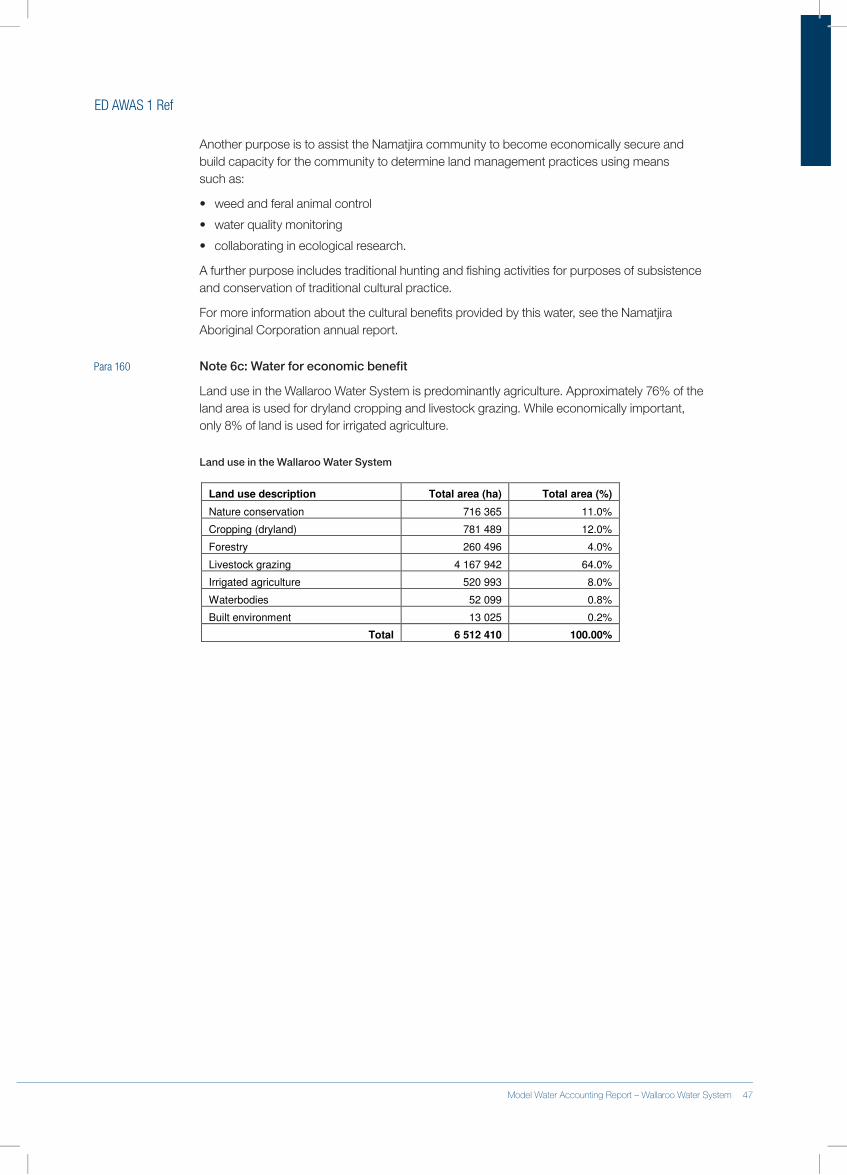
ED AWAS 1 Ref
Another.purpose.is.to.assist.the.Namatjira.community.to.become.economically.secure.and.build.capacity.for.the.community.to.determine.land.management.practices.using.means..such.as:
•. weed.and.feral.animal.control..
•. water.quality.monitoring..
•. collaborating.in.ecological.research.
A.further.purpose.includes.traditional.hunting.and.fishing.activities.for.purposes.of.subsistence.and.conservation.of.traditional.cultural.practice.
For.more.information.about.the.cultural.benefits.provided.by.this.water,.see.the.Namatjira.Aboriginal.Corporation.annual.report.
Para 160 Note 6c: Water for economic benefit
Land.use.in.the.Wallaroo.Water.System.is.predominantly.agriculture..Approximately.76%.of.the.land.area.is.used.for.dryland.cropping.and.livestock.grazing..While.economically.important,.only.8%.of.land.is.used.for.irrigated.agriculture.
Land use in the Wallaroo Water System
Land use description Total area (ha) Total area (%)
Nature conservation 716 365 11.0%
Cropping (dryland) 781 489 12.0%
Forestry 260 496 4.0%
Livestock grazing 4 167 942 64.0%
Irrigated agriculture 520 993 8.0%
Waterbodies 52 099 0.8%
Built environment 13 025 0.2%
Total 6 512 410 100.00%
46 Wallaroo Water System – Model Water Accounting Report Model Water Accounting Report – Wallaroo Water System 47
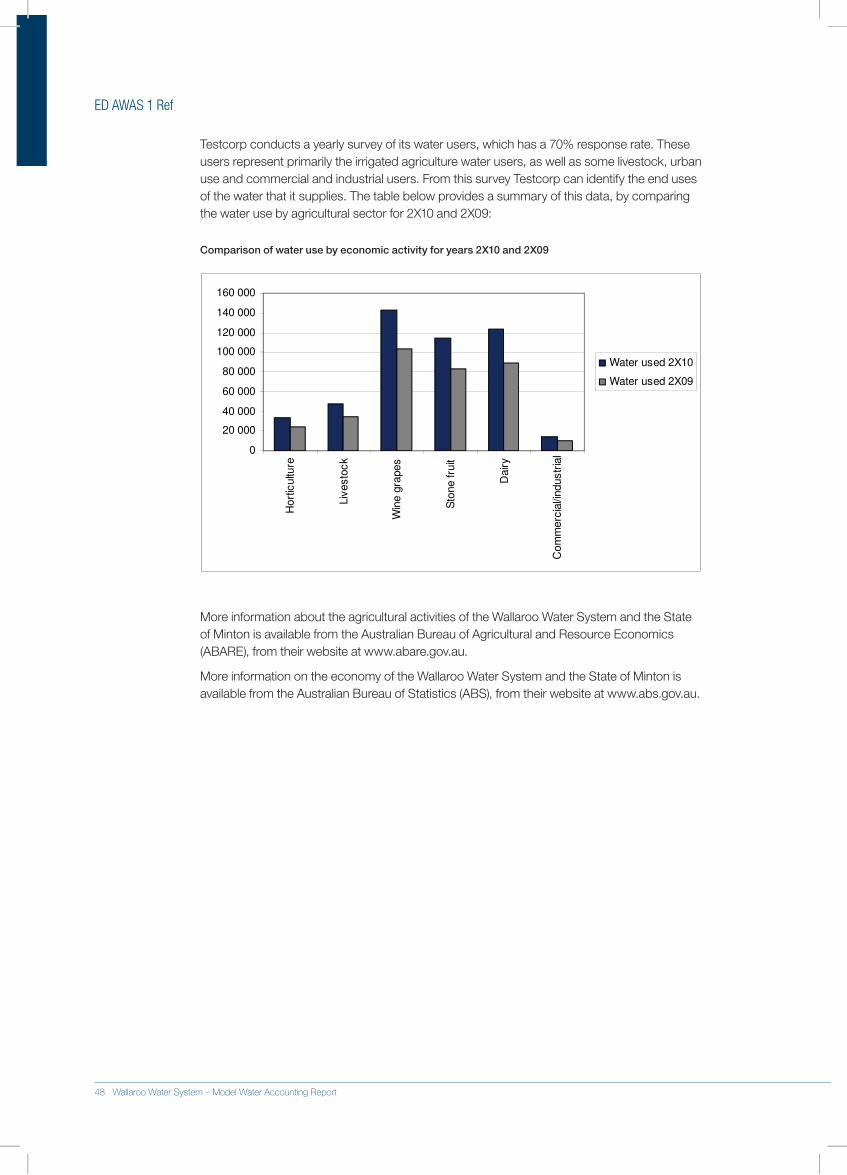
ED AWAS 1 Ref
Testcorp.conducts.a.yearly.survey.of.its.water.users,.which.has.a.70%.response.rate..These.users.represent.primarily.the.irrigated.agriculture.water.users,.as.well.as.some.livestock,.urban.use.and.commercial.and.industrial.users..From.this.survey.Testcorp.can.identify.the.end.uses.of.the.water.that.it.supplies..The.table.below.provides.a.summary.of.this.data,.by.comparing.the.water.use.by.agricultural.sector.for.2X10.and.2X09:
Comparison of water use by economic activity for years 2X10 and 2X09
0
20 000
40 000
60 000
80 000
100 000
120 000
140 000
160 000H
ort
icultu
re
Liv
esto
ck
Win
e g
rapes
Sto
ne fru
it
Dairy
Com
merc
ial/i
ndustr
ial
Water used 2X10
Water used 2X09
More.information.about.the.agricultural.activities.of.the.Wallaroo.Water.System.and.the.State.of.Minton.is.available.from.the.Australian.Bureau.of.Agricultural.and.Resource.Economics.(ABARE),.from.their.website.at.www.abare.gov.au.
More.information.on.the.economy.of.the.Wallaroo.Water.System.and.the.State.of.Minton.is.available.from.the.Australian.Bureau.of.Statistics.(ABS),.from.their.website.at.www.abs.gov.au.
48 Wallaroo Water System – Model Water Accounting Report
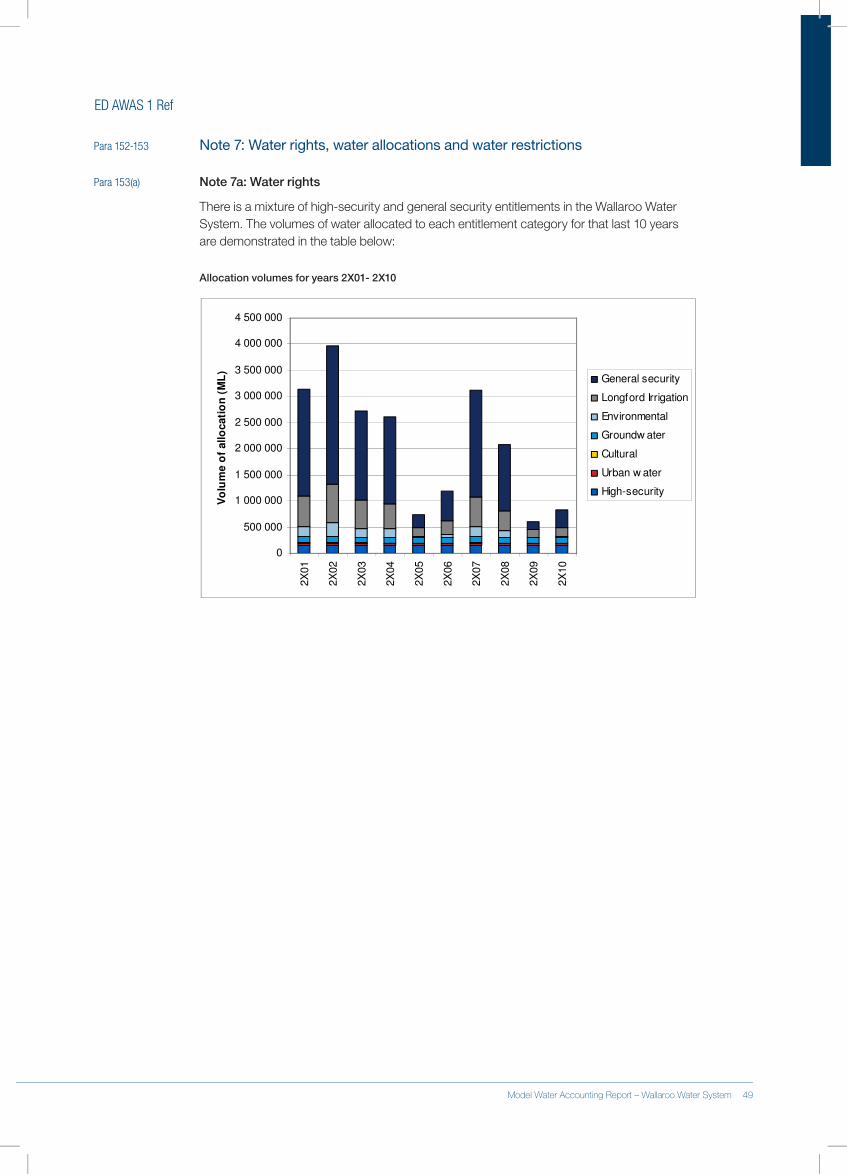
ED AWAS 1 Ref
Para 152-153 Note 7: Water rights, water allocations and water restrictions
Para 153(a) Note 7a: Water rights
There.is.a.mixture.of.high-security.and.general.security.entitlements.in.the.Wallaroo.Water.System..The.volumes.of.water.allocated.to.each.entitlement.category.for.that.last.10.years..are.demonstrated.in.the.table.below:
Allocation volumes for years 2X01- 2X10
0
500 000
1 000 000
1 500 000
2 000 000
2 500 000
3 000 000
3 500 000
4 000 000
4 500 000
2X
01
2X
02
2X
03
2X
04
2X
05
2X
06
2X
07
2X
08
2X
09
2X
10
Vo
lum
e o
f allo
cati
on
(M
L)
General security
Longford Irrigation
Environmental
Groundw ater
Cultural
Urban w ater
High-security
48 Wallaroo Water System – Model Water Accounting Report Model Water Accounting Report – Wallaroo Water System 49
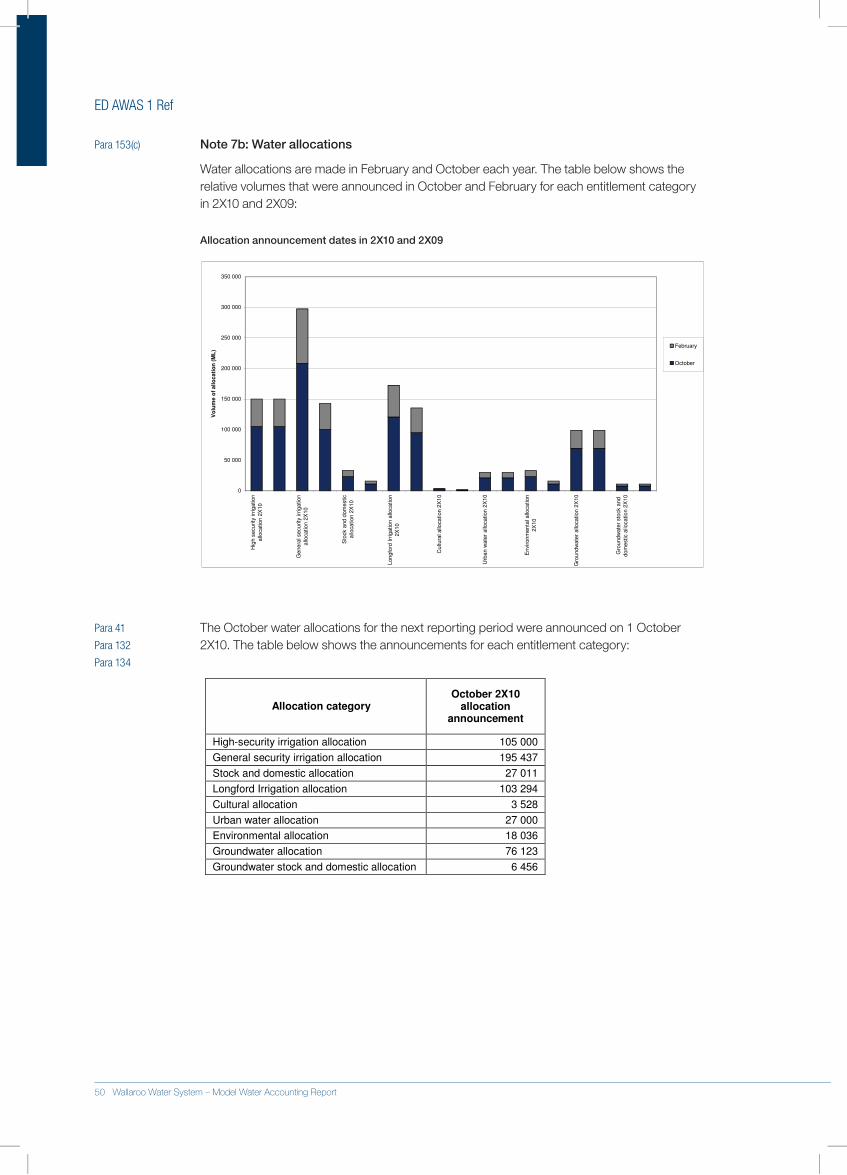
ED AWAS 1 Ref
Para 153(c) Note 7b: Water allocations
Water.allocations.are.made.in.February.and.October.each.year..The.table.below.shows.the.relative.volumes.that.were.announced.in.October.and.February.for.each.entitlement.category.in.2X10.and.2X09:
Allocation announcement dates in 2X10 and 2X09
0
50 000
100 000
150 000
200 000
250 000
300 000
350 000
Hig
h s
ecurity
irr
igation
allo
cation 2
X10
Genera
l security
irr
igation
allo
cation 2
X10
Sto
ck a
nd d
om
estic
allo
cation 2
X10
Longfo
rd I
rrig
ation a
llocation
2X
10
Cultura
l allo
cation 2
X10
Urb
an w
ate
r allo
cation 2
X10
Environm
enta
l allo
cation
2X
10
Gro
undw
ate
r allo
cation 2
X10
Gro
undw
ate
r sto
ck a
nd
dom
estic a
llocation 2
X10
Vo
lum
e o
f all
ocati
on
(M
L)
February
October
The.October.water.allocations.for.the.next.reporting.period.were.announced.on.1.October.2X10..The.table.below.shows.the.announcements.for.each.entitlement.category:.
Allocation category October 2X10
allocation announcement
High-security irrigation allocation 105 000
General security irrigation allocation 195 437
Stock and domestic allocation 27 011
Longford Irrigation allocation 103 294
Cultural allocation 3 528
Urban water allocation 27 000
Environmental allocation 18 036
Groundwater allocation 76 123
Groundwater stock and domestic allocation 6 456
Para 41
Para 132
Para 134
50 Wallaroo Water System – Model Water Accounting Report
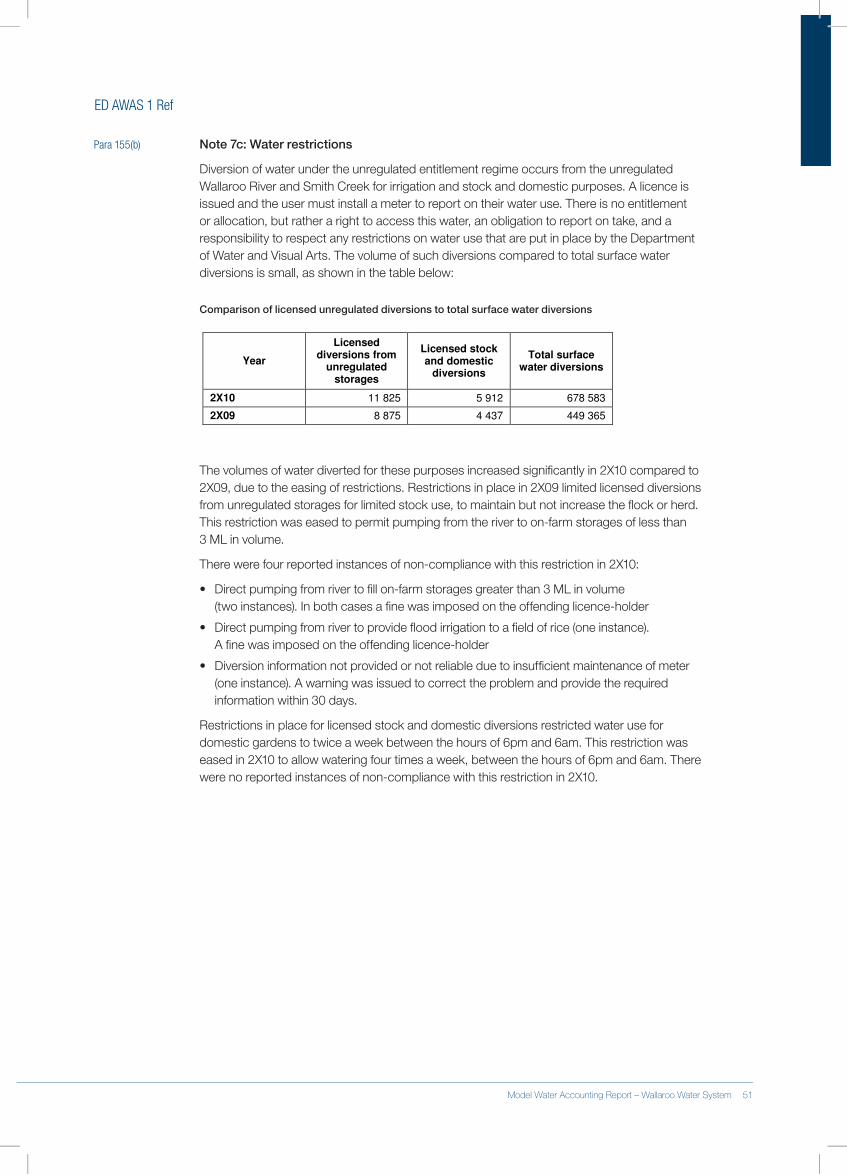
ED AWAS 1 Ref
Para 155(b) Note 7c: Water restrictions
Diversion.of.water.under.the.unregulated.entitlement.regime.occurs.from.the.unregulated.Wallaroo.River.and.Smith.Creek.for.irrigation.and.stock.and.domestic.purposes..A.licence.is.issued.and.the.user.must.install.a.meter.to.report.on.their.water.use..There.is.no.entitlement.or.allocation,.but.rather.a.right.to.access.this.water,.an.obligation.to.report.on.take,.and.a.responsibility.to.respect.any.restrictions.on.water.use.that.are.put.in.place.by.the.Department.of.Water.and.Visual.Arts..The.volume.of.such.diversions.compared.to.total.surface.water.diversions.is.small,.as.shown.in.the.table.below:
Comparison of licensed unregulated diversions to total surface water diversions
Year
Licensed diversions from
unregulated storages
Licensed stock and domestic
diversions
Total surface water diversions
2X10 11 825 5 912 678 583
2X09 8 875 4 437 449 365
The.volumes.of.water.diverted.for.these.purposes.increased.significantly.in.2X10.compared.to.2X09,.due.to.the.easing.of.restrictions..Restrictions.in.place.in.2X09.limited.licensed.diversions.from.unregulated.storages.for.limited.stock.use,.to.maintain.but.not.increase.the.flock.or.herd..This.restriction.was.eased.to.permit.pumping.from.the.river.to.on-farm.storages.of.less.than..3.ML.in.volume.
There.were.four.reported.instances.of.non-compliance.with.this.restriction.in.2X10:
•. Direct.pumping.from.river.to.fill.on-farm.storages.greater.than.3.ML.in.volume..(two.instances)..In.both.cases.a.fine.was.imposed.on.the.offending.licence-holder
•. Direct.pumping.from.river.to.provide.flood.irrigation.to.a.field.of.rice.(one.instance)...A.fine.was.imposed.on.the.offending.licence-holder
•. Diversion.information.not.provided.or.not.reliable.due.to.insufficient.maintenance.of.meter.(one.instance)..A.warning.was.issued.to.correct.the.problem.and.provide.the.required.information.within.30.days.
Restrictions.in.place.for.licensed.stock.and.domestic.diversions.restricted.water.use.for.domestic.gardens.to.twice.a.week.between.the.hours.of.6pm.and.6am..This.restriction.was.eased.in.2X10.to.allow.watering.four.times.a.week,.between.the.hours.of.6pm.and.6am..There.were.no.reported.instances.of.non-compliance.with.this.restriction.in.2X10.
50 Wallaroo Water System – Model Water Accounting Report Model Water Accounting Report – Wallaroo Water System 51
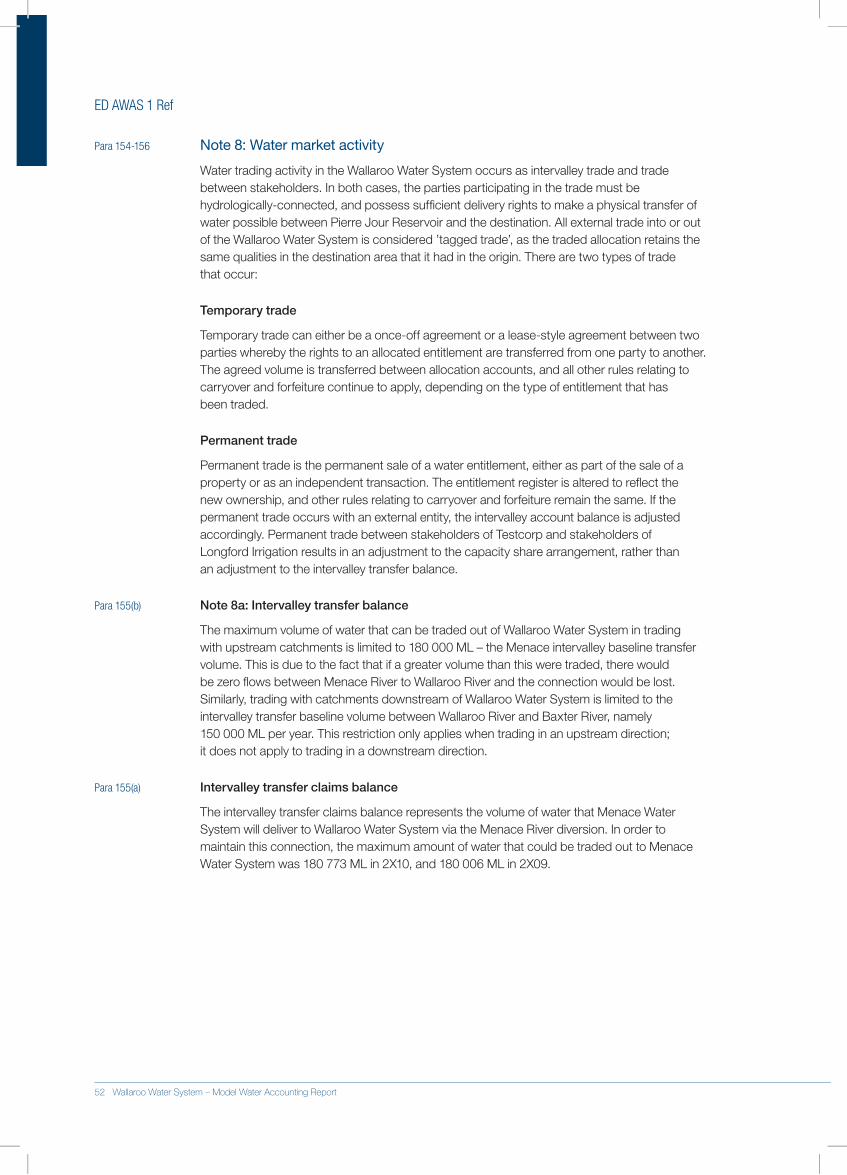
ED AWAS 1 Ref
Para 154-156 Note 8: Water market activity
Water.trading.activity.in.the.Wallaroo.Water.System.occurs.as.intervalley.trade.and.trade.between.stakeholders..In.both.cases,.the.parties.participating.in.the.trade.must.be.hydrologically-connected,.and.possess.sufficient.delivery.rights.to.make.a.physical.transfer.of.water.possible.between.Pierre.Jour.Reservoir.and.the.destination..All.external.trade.into.or.out.of.the.Wallaroo.Water.System.is.considered.’tagged.trade’,.as.the.traded.allocation.retains.the.same.qualities.in.the.destination.area.that.it.had.in.the.origin..There.are.two.types.of.trade..that.occur:
Temporary trade
Temporary.trade.can.either.be.a.once-off.agreement.or.a.lease-style.agreement.between.two.parties.whereby.the.rights.to.an.allocated.entitlement.are.transferred.from.one.party.to.another..The.agreed.volume.is.transferred.between.allocation.accounts,.and.all.other.rules.relating.to.carryover.and.forfeiture.continue.to.apply,.depending.on.the.type.of.entitlement.that.has..been.traded.
Permanent trade
Permanent.trade.is.the.permanent.sale.of.a.water.entitlement,.either.as.part.of.the.sale.of.a.property.or.as.an.independent.transaction..The.entitlement.register.is.altered.to.reflect.the.new.ownership,.and.other.rules.relating.to.carryover.and.forfeiture.remain.the.same..If.the.permanent.trade.occurs.with.an.external.entity,.the.intervalley.account.balance.is.adjusted.accordingly..Permanent.trade.between.stakeholders.of.Testcorp.and.stakeholders.of..Longford.Irrigation.results.in.an.adjustment.to.the.capacity.share.arrangement,.rather.than..an.adjustment.to.the.intervalley.transfer.balance..
Para 155(b) Note 8a: Intervalley transfer balance
The.maximum.volume.of.water.that.can.be.traded.out.of.Wallaroo.Water.System.in.trading.with.upstream.catchments.is.limited.to.180.000.ML.–.the.Menace.intervalley.baseline.transfer.volume..This.is.due.to.the.fact.that.if.a.greater.volume.than.this.were.traded,.there.would.be.zero.flows.between.Menace.River.to.Wallaroo.River.and.the.connection.would.be.lost..Similarly,.trading.with.catchments.downstream.of.Wallaroo.Water.System.is.limited.to.the.intervalley.transfer.baseline.volume.between.Wallaroo.River.and.Baxter.River,.namely..150.000.ML.per.year..This.restriction.only.applies.when.trading.in.an.upstream.direction;..it.does.not.apply.to.trading.in.a.downstream.direction.
Para 155(a) Intervalley transfer claims balance
The.intervalley.transfer.claims.balance.represents.the.volume.of.water.that.Menace.Water.System.will.deliver.to.Wallaroo.Water.System.via.the.Menace.River.diversion..In.order.to.maintain.this.connection,.the.maximum.amount.of.water.that.could.be.traded.out.to.Menace.Water.System.was.180.773.ML.in.2X10,.and.180.006.ML.in.2X09.
52 Wallaroo Water System – Model Water Accounting Report
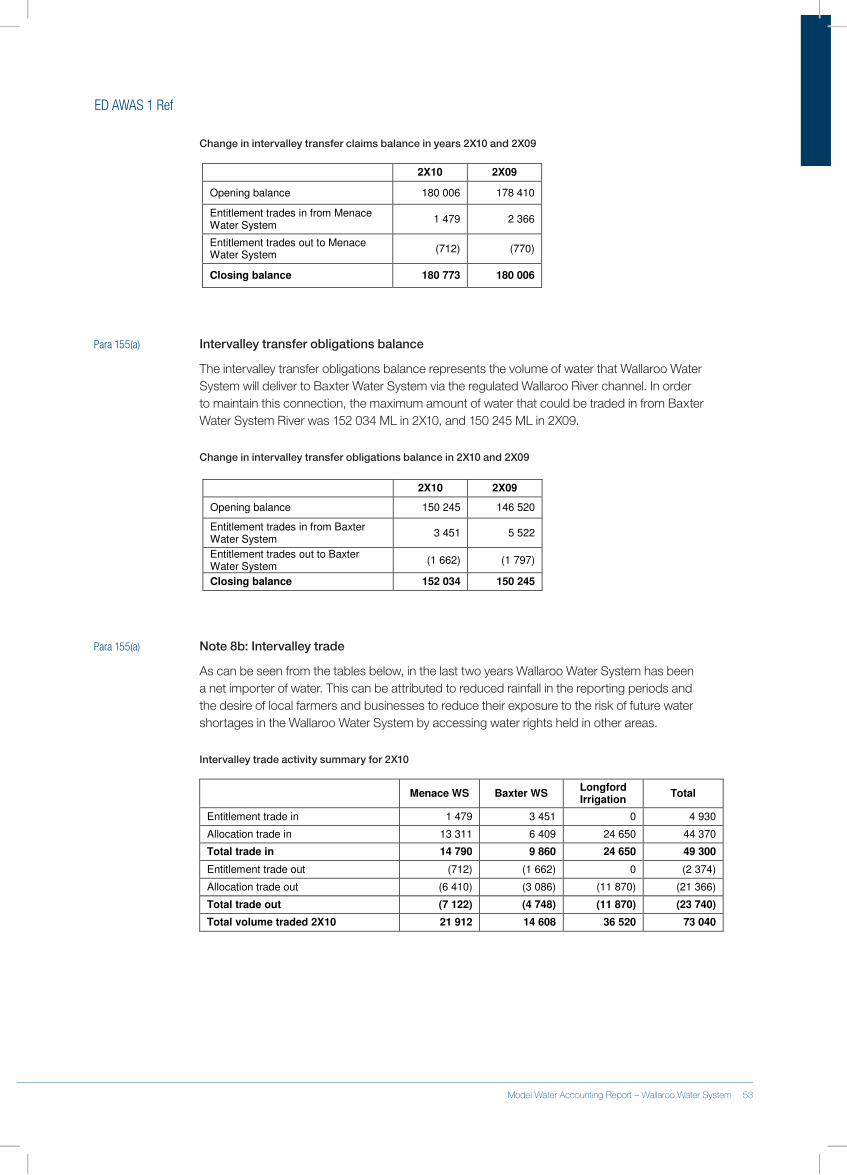
ED AWAS 1 Ref
Change in intervalley transfer claims balance in years 2X10 and 2X09
2X10 2X09
Opening balance 180 006 178 410
Entitlement trades in from Menace Water System
1 479 2 366
Entitlement trades out to Menace Water System
(712) (770)
Closing balance 180 773 180 006
Para 155(a) Intervalley transfer obligations balance
The.intervalley.transfer.obligations.balance.represents.the.volume.of.water.that.Wallaroo.Water.System.will.deliver.to.Baxter.Water.System.via.the.regulated.Wallaroo.River.channel..In.order.to.maintain.this.connection,.the.maximum.amount.of.water.that.could.be.traded.in.from.Baxter.Water.System.River.was.152.034.ML.in.2X10,.and.150.245.ML.in.2X09.
Change in intervalley transfer obligations balance in 2X10 and 2X09
2X10 2X09
Opening balance 150 245 146 520
Entitlement trades in from Baxter Water System
3 451 5 522
Entitlement trades out to Baxter Water System
(1 662) (1 797)
Closing balance 152 034 150 245
Para 155(a) Note 8b: Intervalley trade
As.can.be.seen.from.the.tables.below,.in.the.last.two.years.Wallaroo.Water.System.has.been.a.net.importer.of.water..This.can.be.attributed.to.reduced.rainfall.in.the.reporting.periods.and.the.desire.of.local.farmers.and.businesses.to.reduce.their.exposure.to.the.risk.of.future.water.shortages.in.the.Wallaroo.Water.System.by.accessing.water.rights.held.in.other.areas.
Intervalley trade activity summary for 2X10
Menace WS Baxter WS
Longford Irrigation
Total
Entitlement trade in 1 479 3 451 0 4 930
Allocation trade in 13 311 6 409 24 650 44 370
Total trade in 14 790 9 860 24 650 49 300
Entitlement trade out (712) (1 662) 0 (2 374)
Allocation trade out (6 410) (3 086) (11 870) (21 366)
Total trade out (7 122) (4 748) (11 870) (23 740)
Total volume traded 2X10 21 912 14 608 36 520 73 040
52 Wallaroo Water System – Model Water Accounting Report Model Water Accounting Report – Wallaroo Water System 53
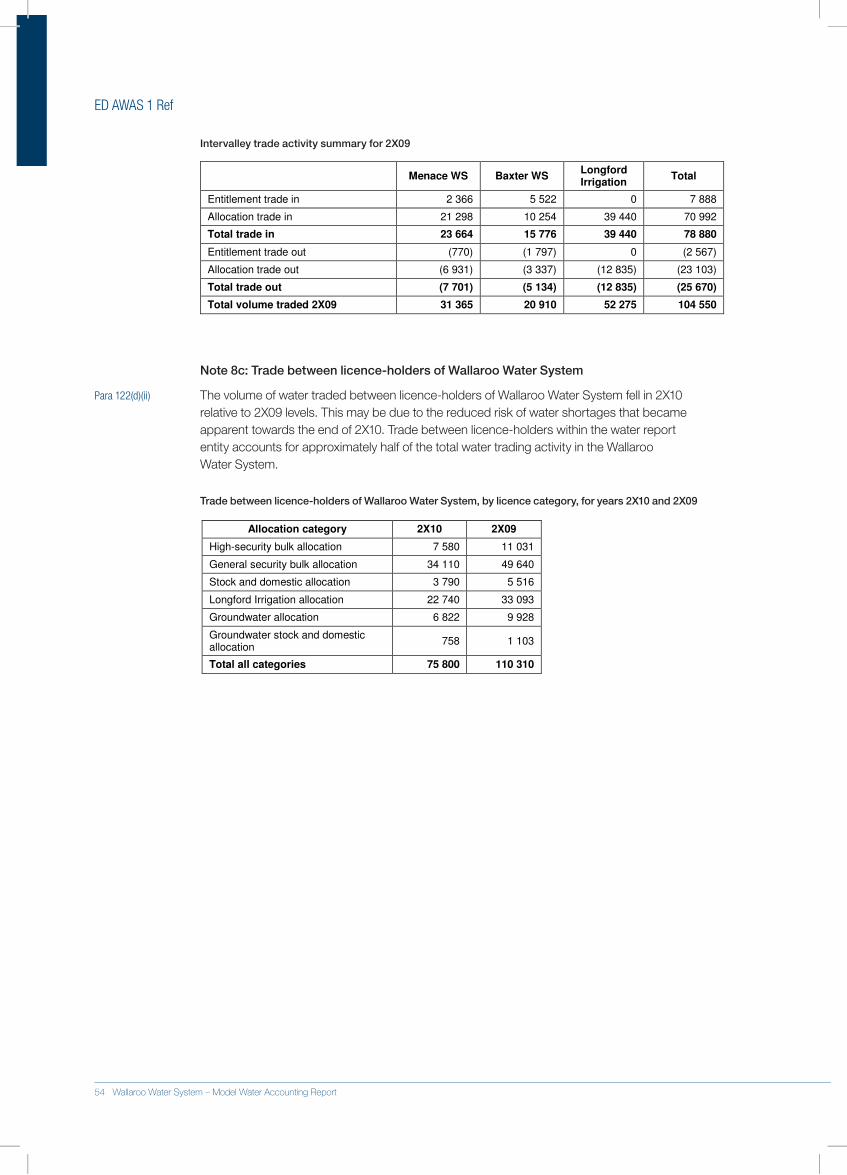
ED AWAS 1 Ref
Intervalley trade activity summary for 2X09
Menace WS Baxter WS
Longford Irrigation
Total
Entitlement trade in 2 366 5 522 0 7 888
Allocation trade in 21 298 10 254 39 440 70 992
Total trade in 23 664 15 776 39 440 78 880
Entitlement trade out (770) (1 797) 0 (2 567)
Allocation trade out (6 931) (3 337) (12 835) (23 103)
Total trade out (7 701) (5 134) (12 835) (25 670)
Total volume traded 2X09 31 365 20 910 52 275 104 550
Note 8c: Trade between licence-holders of Wallaroo Water System
Para 122(d)(ii) The.volume.of.water.traded.between.licence-holders.of.Wallaroo.Water.System.fell.in.2X10.relative.to.2X09.levels..This.may.be.due.to.the.reduced.risk.of.water.shortages.that.became.apparent.towards.the.end.of.2X10..Trade.between.licence-holders.within.the.water.report.entity.accounts.for.approximately.half.of.the.total.water.trading.activity.in.the.Wallaroo..Water.System.
Trade between licence-holders of Wallaroo Water System, by licence category, for years 2X10 and 2X09
Allocation category 2X10 2X09
High-security bulk allocation 7 580 11 031
General security bulk allocation 34 110 49 640
Stock and domestic allocation 3 790 5 516
Longford Irrigation allocation 22 740 33 093
Groundwater allocation 6 822 9 928
Groundwater stock and domestic allocation
758 1 103
Total all categories 75 800 110 310
54 Wallaroo Water System – Model Water Accounting Report
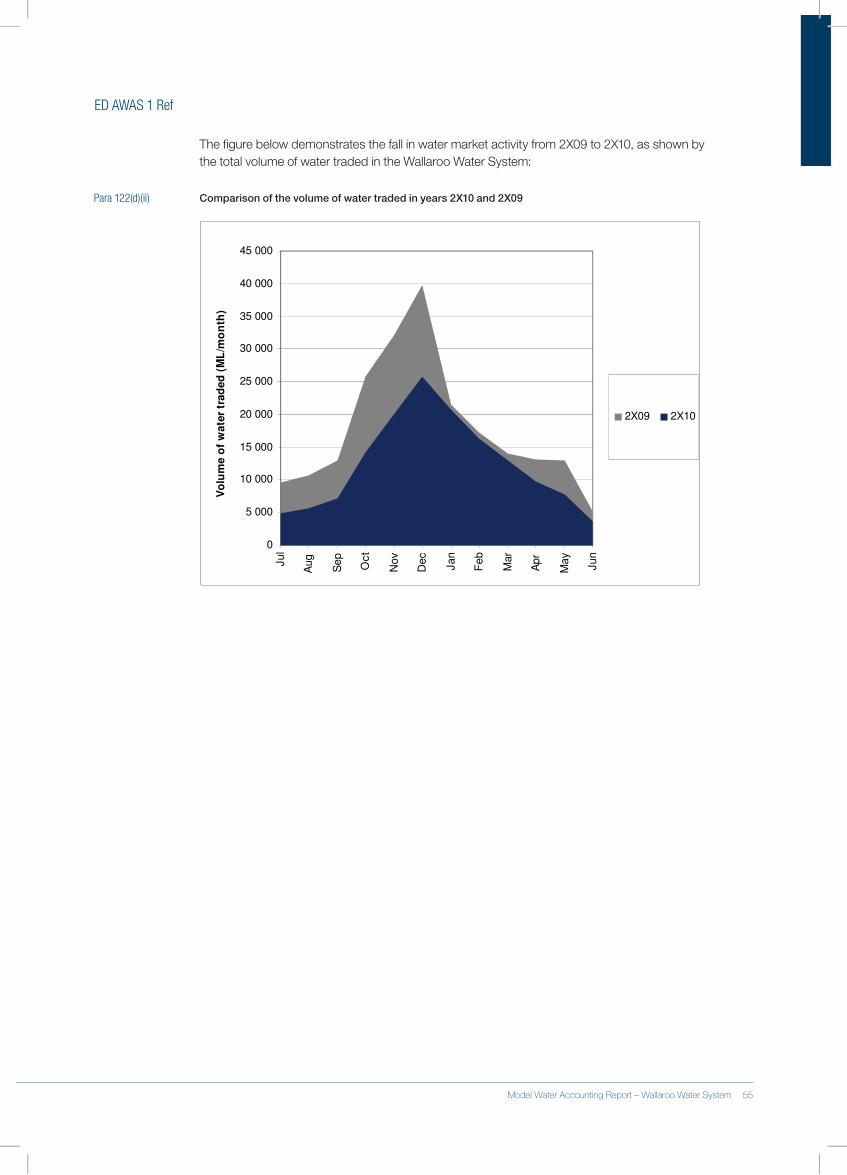
ED AWAS 1 Ref
The.figure.below.demonstrates.the.fall.in.water.market.activity.from.2X09.to.2X10,.as.shown.by.the.total.volume.of.water.traded.in.the.Wallaroo.Water.System:
Para 122(d)(ii) Comparison of the volume of water traded in years 2X10 and 2X09
0
5 000
10 000
15 000
20 000
25 000
30 000
35 000
40 000
45 000
Jul
Aug
Sep
Oct
Nov
Dec
Jan
Feb
Mar
Apr
May
Jun
Vo
lum
e o
f w
ate
r tr
ad
ed
(M
L/m
on
th)
2X09 2X10
54 Wallaroo Water System – Model Water Accounting Report Model Water Accounting Report – Wallaroo Water System 55
ED AWAS 1 Ref
Para 161-165 Note 9: Segment information
There.are.three.entitlement.systems.that.operate.in.the.Wallaroo.Water.System.that.may.be.used.to.separate.the.report.into.segments..These.systems.are.Wallaroo.Regulated.entitlements,.Vanderbelt.Groundwater.entitlements.and.unregulated.entitlements..More.information.on.each.of.these.is.provided.in.the.Contextual.Statement.
While.these.entitlement.systems.offer.a.basis.on.which.to.provide.segment.information,.it.was.deemed.to.be.unnecessary.in.this.case..The.Vanderbelt.Groundwater.entitlement.system.and.the.unregulated.entitlement.system.have.very.few.reporting.elements.in.the.water.accounting.statements,.therefore.segment.information.would.not.provide.a.material.amount.of.additional.information.to.a.user.
56 Wallaroo Water System – Model Water Accounting Report
Model Water Accounting Report
Energetico Hydro Corporation
General Purpose Water Accounting Report30 June 2X10
Prepared by Energetico Hydro Corporation An illustration of an Australian general purpose water accounting report for a fictitious water report entity

Contents
Glossary..................................................................................................................................................2
Contextual Statement.........................................................................................................................3Physical information ............................................................................................................................3
Administrative information ..................................................................................................................4
Overview of reporting period ..............................................................................................................5
Accountability Statement...................................................................................................................9
Assurance Statement....................................................................................................................... 10
Statement of Water Assets and Water Liabilities...................................................................... 11
Statement of Changes in Water Assets and Water Liabilities.............................................. 12
Statement of Physical Water Flows.............................................................................................. 13
Note disclosures................................................................................................................................. 14
Note 1: Significant water accounting policies .................................................................................. 14
Note 2: Information supporting the items presented in the water accounting statements ............ 15
Note 3: Quantification approaches ...................................................................................................21
Note 4: Reconciliations .....................................................................................................................22
Note 5: Future prospects ..................................................................................................................23
Note 6: Water for environmental, social and cultural, and economic benefit .................................25
Note 7: Segment information ............................................................................................................29
Model Water Accounting Report – Energetico Hydro Corporation 1
Glossary of terms used in this report not defined in ED AWAS 1
The.terms.listed.below.are.additional.terms.to.ED.AWAS.1.used.in.this.General.Purpose.Water.Accounting.Report.but.are.not.inconsistent.with.ED.AWAS.1..
•. Entitlement.–.Short.version.of.‘Water.access.entitlement’:.A.perpetual.or.ongoing.entitlement.to.exclusive.access.to.a.share.of.water.from.a.specified.consumptive.pool.as.defined.in.the.relevant.water.plan.1
•. Allocation.–.Short.version.of.‘Water.allocation’:.The.specific.volume.of.water.allocated.to.water.access.entitlements.in.a.given.season,.given.accounting.period,.defined.according.to.rules.established.in.the.relevant.water.plan.2
•. Allocation announcement.–.The.obligating.event.that.creates.the.legal.right.to.access.a.water.allocation.
•. Environmental benefit –.Part.of.‘Environmental.and.other.public.benefit.outcomes’:.Environmental.and.other.public.benefit.outcomes.are.defined.as.part.of.the.water.planning.process,.are.specified.in.water.plans.and.may.include.a.number.of.aspects,.including:.–.environmental.outcomes:.maintaining.ecosystem.function.(e.g..through.periodic.inundation.of.floodplain.wetlands);.biodiversity,.water.quality;.river.health.targets;.other.public.benefits:.mitigating.pollution,.public.health.(e.g..limiting.noxious.algal.blooms),.Indigenous.and.cultural.values,.recreation,.fisheries,.tourism,.navigation.and.amenity.values.3
•. Treated effluent –.Water.derived.from.wastewater.which.is.treated.to.a.standard.that.is.appropriate.for.its.intended.use.
•. Urban.–.The.total.residential,.commercial,.municipal.and.industrial.within.a.city.
1. National.Water.Initiative2. Ibid3. Ibid
Glossary
2 Energetico Hydro Corporation – Model Water Accounting Report
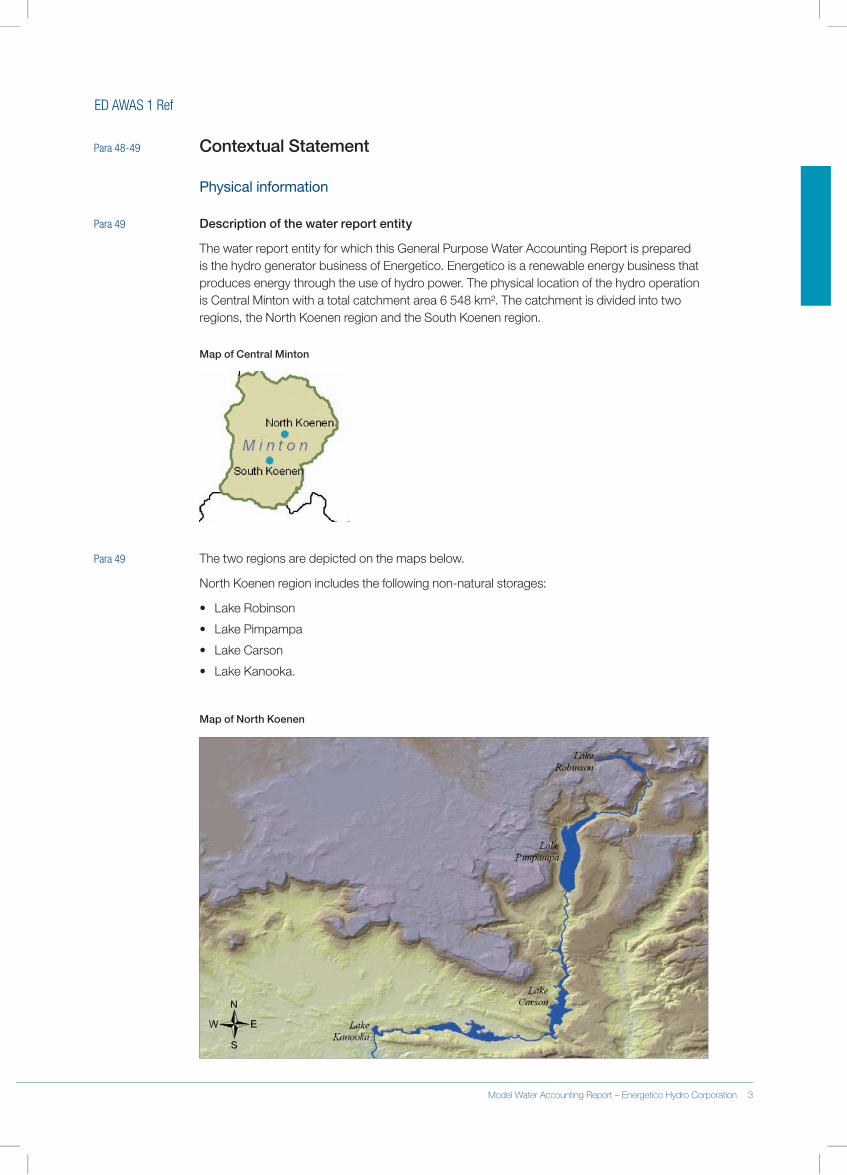
ED AWAS 1 Ref
Para 48-49 Contextual Statement
Physical information
Para 49 Description of the water report entity
The.water.report.entity.for.which.this.General.Purpose.Water.Accounting.Report.is.prepared.is.the.hydro.generator.business.of.Energetico..Energetico.is.a.renewable.energy.business.that.produces.energy.through.the.use.of.hydro.power..The.physical.location.of.the.hydro.operation.is.Central.Minton.with.a.total.catchment.area.6.548.km²..The.catchment.is.divided.into.two.regions,.the.North.Koenen.region.and.the.South.Koenen.region.
Map of Central Minton
Para 49 The.two.regions.are.depicted.on.the.maps.below.
North.Koenen.region.includes.the.following.non-natural.storages:
•. Lake.Robinson
•. Lake.Pimpampa
•. Lake.Carson
•. Lake.Kanooka.
Map of North Koenen
2 Energetico Hydro Corporation – Model Water Accounting Report Model Water Accounting Report – Energetico Hydro Corporation 3
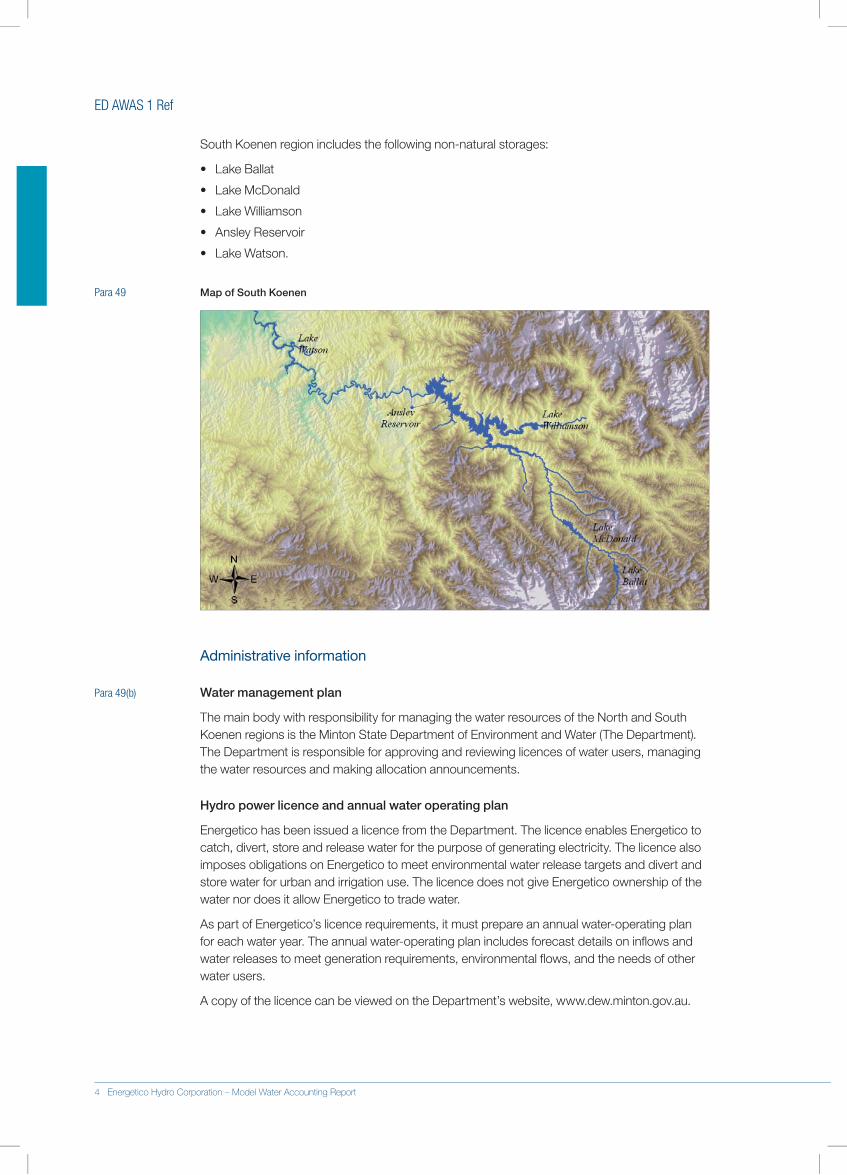
ED AWAS 1 Ref
South.Koenen.region.includes.the.following.non-natural.storages:
•. Lake.Ballat
•. Lake.McDonald
•. Lake.Williamson
•. Ansley.Reservoir
•. Lake.Watson.
Para 49 Map of South Koenen
Administrative information
Para 49(b) Water management plan
The.main.body.with.responsibility.for.managing.the.water.resources.of.the.North.and.South.Koenen.regions.is.the.Minton.State.Department.of.Environment.and.Water.(The.Department)..The.Department.is.responsible.for.approving.and.reviewing.licences.of.water.users,.managing.the.water.resources.and.making.allocation.announcements.
Hydro power licence and annual water operating plan
Energetico.has.been.issued.a.licence.from.the.Department..The.licence.enables.Energetico.to.catch,.divert,.store.and.release.water.for.the.purpose.of.generating.electricity..The.licence.also.imposes.obligations.on.Energetico.to.meet.environmental.water.release.targets.and.divert.and.store.water.for.urban.and.irrigation.use..The.licence.does.not.give.Energetico.ownership.of.the.water.nor.does.it.allow.Energetico.to.trade.water.
As.part.of.Energetico’s.licence.requirements,.it.must.prepare.an.annual.water-operating.plan.for.each.water.year..The.annual.water-operating.plan.includes.forecast.details.on.inflows.and.water.releases.to.meet.generation.requirements,.environmental.flows,.and.the.needs.of.other.water.users.
A.copy.of.the.licence.can.be.viewed.on.the.Department’s.website,.www.dew.minton.gov.au.
.
4 Energetico Hydro Corporation – Model Water Accounting Report
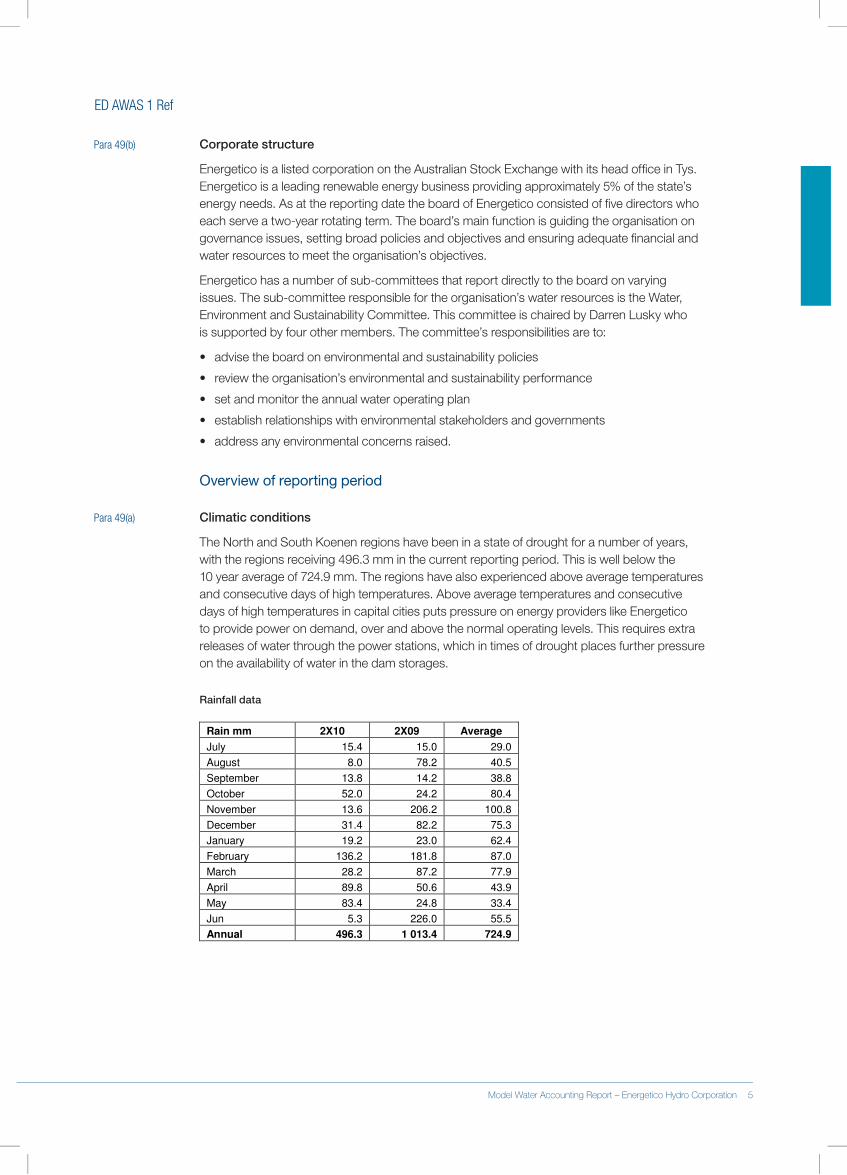
ED AWAS 1 Ref
Para 49(b) Corporate structure
Energetico.is.a.listed.corporation.on.the.Australian.Stock.Exchange.with.its.head.office.in.Tys...Energetico.is.a.leading.renewable.energy.business.providing.approximately.5%.of.the.state’s.energy.needs..As.at.the.reporting.date.the.board.of.Energetico.consisted.of.five.directors.who.each.serve.a.two-year.rotating.term..The.board’s.main.function.is.guiding.the.organisation.on.governance.issues,.setting.broad.policies.and.objectives.and.ensuring.adequate.financial.and.water.resources.to.meet.the.organisation’s.objectives.
Energetico.has.a.number.of.sub-committees.that.report.directly.to.the.board.on.varying.issues..The.sub-committee.responsible.for.the.organisation’s.water.resources.is.the.Water,.Environment.and.Sustainability.Committee..This.committee.is.chaired.by.Darren.Lusky.who..is.supported.by.four.other.members..The.committee’s.responsibilities.are.to:
•. advise.the.board.on.environmental.and.sustainability.policies.
•. review.the.organisation’s.environmental.and.sustainability.performance.
•. set.and.monitor.the.annual.water.operating.plan.
•. establish.relationships.with.environmental.stakeholders.and.governments.
•. address.any.environmental.concerns.raised.
Overview of reporting period
Para 49(a) Climatic conditions
The.North.and.South.Koenen.regions.have.been.in.a.state.of.drought.for.a.number.of.years,.with.the.regions.receiving.496.3.mm.in.the.current.reporting.period..This.is.well.below.the..10.year.average.of.724.9.mm..The.regions.have.also.experienced.above.average.temperatures.and.consecutive.days.of.high.temperatures..Above.average.temperatures.and.consecutive.days.of.high.temperatures.in.capital.cities.puts.pressure.on.energy.providers.like.Energetico.to.provide.power.on.demand,.over.and.above.the.normal.operating.levels..This.requires.extra.releases.of.water.through.the.power.stations,.which.in.times.of.drought.places.further.pressure.on.the.availability.of.water.in.the.dam.storages.
Rainfall data
.
Rain mm 2X10 2X09 Average
July 15.4 15.0 29.0
August 8.0 78.2 40.5
September 13.8 14.2 38.8
October 52.0 24.2 80.4
November 13.6 206.2 100.8
December 31.4 82.2 75.3
January 19.2 23.0 62.4
February 136.2 181.8 87.0
March 28.2 87.2 77.9
April 89.8 50.6 43.9
May 83.4 24.8 33.4
Jun 5.3 226.0 55.5
Annual 496.3 1 013.4 724.9
..
4 Energetico Hydro Corporation – Model Water Accounting Report Model Water Accounting Report – Energetico Hydro Corporation 5
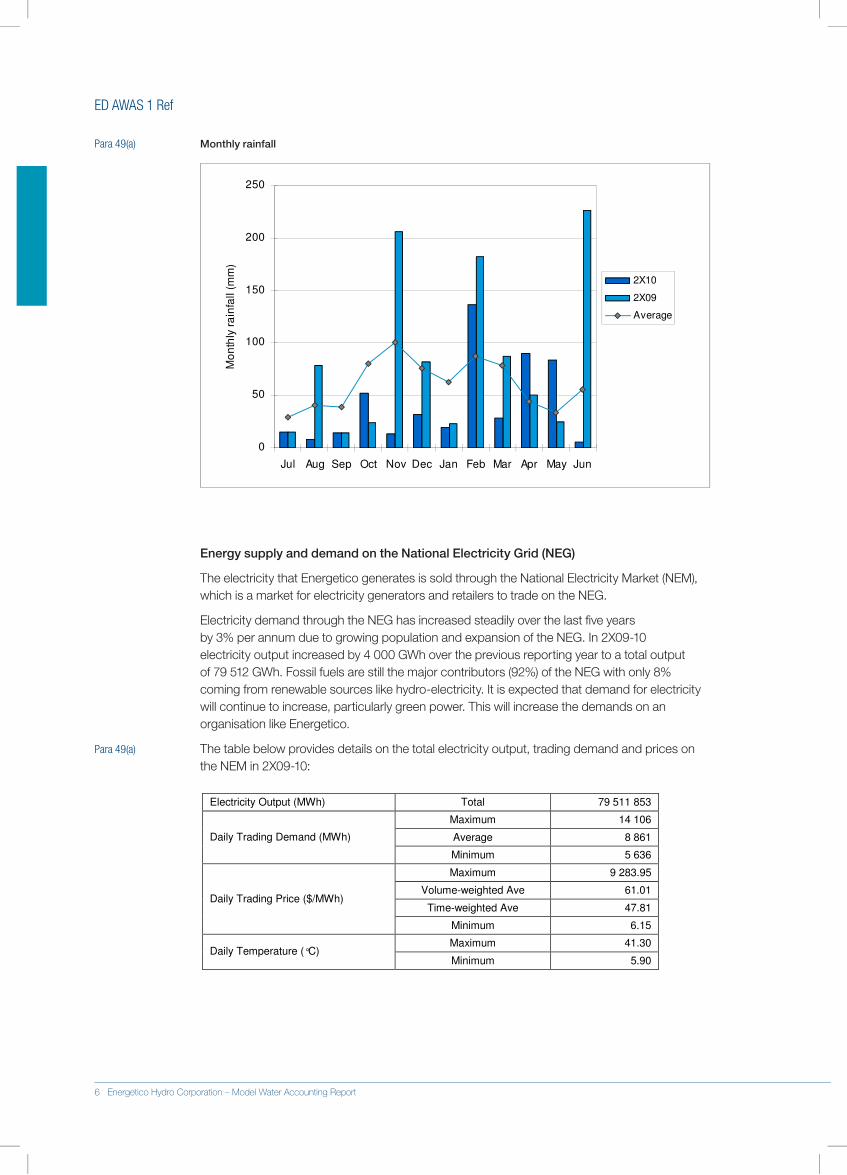
ED AWAS 1 Ref
Para 49(a) Monthly rainfall
0
50
100
150
200
250
Jul Aug Sep Oct Nov Dec Jan Feb Mar Apr May Jun
Mo
nth
ly r
ain
fall (
mm
)
2X10
2X09
Average
Energy supply and demand on the National Electricity Grid (NEG)
The.electricity.that.Energetico.generates.is.sold.through.the.National.Electricity.Market.(NEM),.which.is.a.market.for.electricity.generators.and.retailers.to.trade.on.the.NEG.
Electricity.demand.through.the.NEG.has.increased.steadily.over.the.last.five.years..by.3%.per.annum.due.to.growing.population.and.expansion.of.the.NEG..In.2X09-10..electricity.output.increased.by.4.000.GWh.over.the.previous.reporting.year.to.a.total.output.of.79.512.GWh..Fossil.fuels.are.still.the.major.contributors.(92%).of.the.NEG.with.only.8%.coming.from.renewable.sources.like.hydro-electricity..It.is.expected.that.demand.for.electricity.will.continue.to.increase,.particularly.green.power..This.will.increase.the.demands.on.an.organisation.like.Energetico.
Para 49(a) The.table.below.provides.details.on.the.total.electricity.output,.trading.demand.and.prices.on.the.NEM.in.2X09-10:
Electricity Output (MWh) Total 79 511 853
Maximum 14 106
Average 8 861 Daily Trading Demand (MWh)
Minimum 5 636
Maximum 9 283.95
Volume-weighted Ave 61.01
Time-weighted Ave 47.81 Daily Trading Price ($/MWh)
Minimum 6.15
Maximum 41.30 Daily Temperature (C)
Minimum 5.90
6 Energetico Hydro Corporation – Model Water Accounting Report
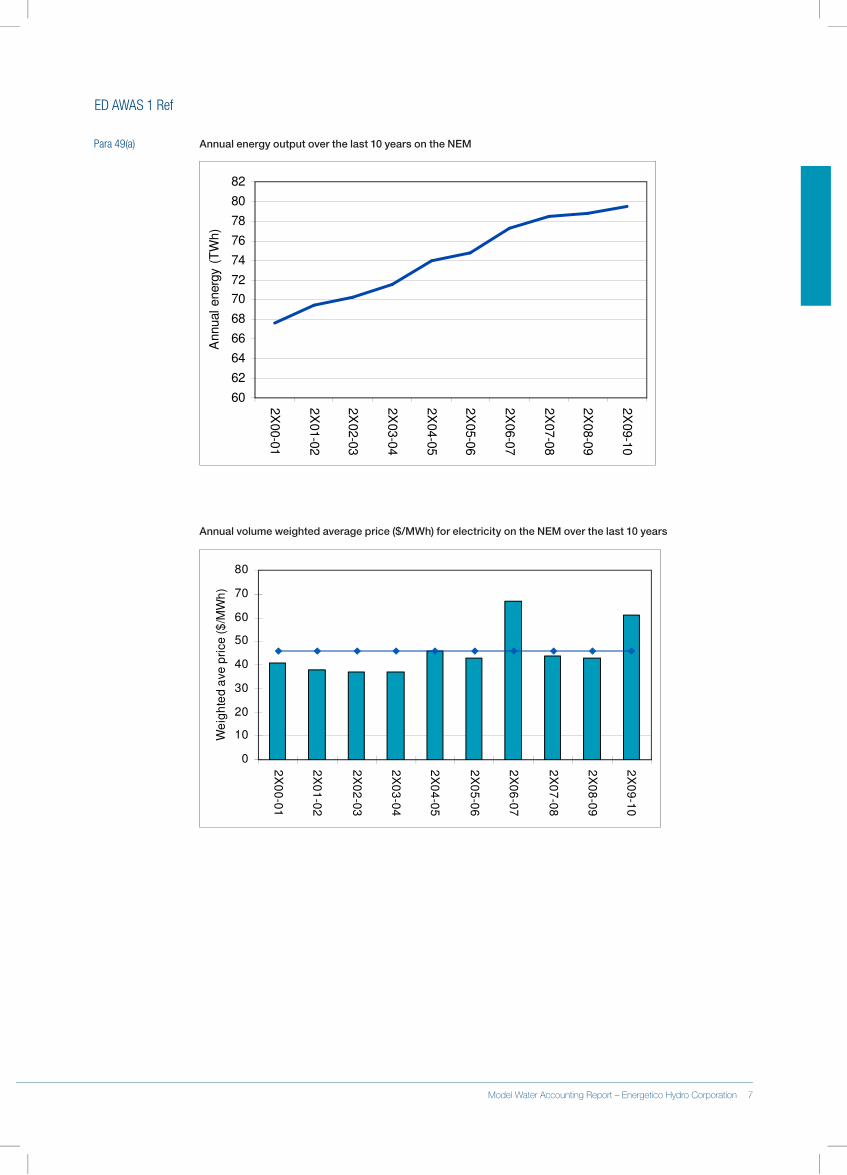
ED AWAS 1 Ref
Para 49(a) Annual energy output over the last 10 years on the NEM
60
62
64
66
68
70
72
74
76
78
80
82
2X
00-0
1
2X
01-0
2
2X
02-0
3
2X
03-0
4
2X
04-0
5
2X
05-0
6
2X
06-0
7
2X
07-0
8
2X
08-0
9
2X
09-1
0A
nnual energ
y (
TW
h)
Annual volume weighted average price ($/MWh) for electricity on the NEM over the last 10 years
0
10
20
30
40
50
60
70
802
X0
0-0
1
2X
01
-02
2X
02
-03
2X
03
-04
2X
04
-05
2X
05
-06
2X
06
-07
2X
07
-08
2X
08
-09
2X
09
-10
We
igh
ted
ave
pri
ce
($
/MW
h)
6 Energetico Hydro Corporation – Model Water Accounting Report Model Water Accounting Report – Energetico Hydro Corporation 7
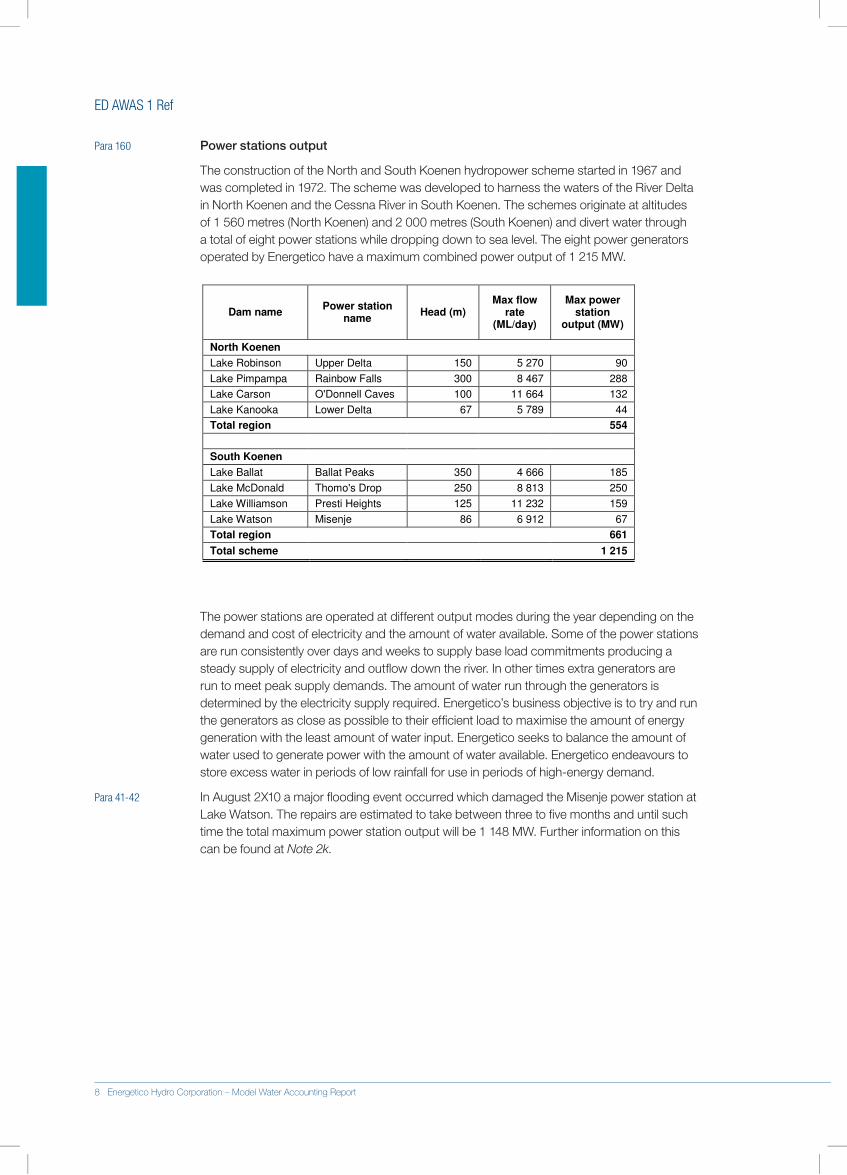
ED AWAS 1 Ref
Para 160 Power stations output
The.construction.of.the.North.and.South.Koenen.hydropower.scheme.started.in.1967.and..was.completed.in.1972..The.scheme.was.developed.to.harness.the.waters.of.the.River.Delta..in.North.Koenen.and.the.Cessna.River.in.South.Koenen..The.schemes.originate.at.altitudes.of.1.560.metres.(North.Koenen).and.2.000.metres.(South.Koenen).and.divert.water.through.a.total.of.eight.power.stations.while.dropping.down.to.sea.level..The.eight.power.generators.operated.by.Energetico.have.a.maximum.combined.power.output.of.1.215.MW.
Dam name Power station
name Head (m)
Max flow rate
(ML/day)
Max power station
output (MW)
North Koenen
Lake Robinson Upper Delta 150 5 270 90
Lake Pimpampa Rainbow Falls 300 8 467 288
Lake Carson O'Donnell Caves 100 11 664 132
Lake Kanooka Lower Delta 67 5 789 44
Total region 554
South Koenen
Lake Ballat Ballat Peaks 350 4 666 185
Lake McDonald Thomo's Drop 250 8 813 250
Lake Williamson Presti Heights 125 11 232 159
Lake Watson Misenje 86 6 912 67
Total region 661
Total scheme 1 215
The.power.stations.are.operated.at.different.output.modes.during.the.year.depending.on.the.demand.and.cost.of.electricity.and.the.amount.of.water.available..Some.of.the.power.stations.are.run.consistently.over.days.and.weeks.to.supply.base.load.commitments.producing.a.steady.supply.of.electricity.and.outflow.down.the.river..In.other.times.extra.generators.are.run.to.meet.peak.supply.demands..The.amount.of.water.run.through.the.generators.is.determined.by.the.electricity.supply.required..Energetico’s.business.objective.is.to.try.and.run.the.generators.as.close.as.possible.to.their.efficient.load.to.maximise.the.amount.of.energy.generation.with.the.least.amount.of.water.input..Energetico.seeks.to.balance.the.amount.of.water.used.to.generate.power.with.the.amount.of.water.available..Energetico.endeavours.to.store.excess.water.in.periods.of.low.rainfall.for.use.in.periods.of.high-energy.demand.
Para 41-42 In.August.2X10.a.major.flooding.event.occurred.which.damaged.the.Misenje.power.station.at.Lake.Watson..The.repairs.are.estimated.to.take.between.three.to.five.months.and.until.such.time.the.total.maximum.power.station.output.will.be.1.148.MW..Further.information.on.this..can.be.found.at.Note2k.
8 Energetico Hydro Corporation – Model Water Accounting Report
ED AWAS 1 Ref
Para 50-57 Accountability Statement In.the.opinion.of.the.undersigned:
Para 54(a)(iii) 1.. .This.general.purpose.water.accounting.report.has.been.prepared.and.presented.in.accordance.with.Australian.Water.Accounting.Standards.issued.by.the.Water.Accounting.Standards.Board.
Para 54(a)(i) 2...The.management.and.operations.of.Energetico.have,.with.some.exceptions.outlined.below,.been.conducted.throughout.the.reported.period.in.compliance.with.all.relevant.externally-imposed.requirements,.including:
•. Directions.issued.by.the.Minton.State.Department.of.the.Environment.and.Water.
•. Energetico.Corporation’s.Licence,.document.no.DWEAP59,.issued.by.the.Department.of.Environment.and.Water.
Para 57 Some.exceptions.occurred,.which.prevented.the.compliance.of.the.Energetico.with.externally-imposed.requirements.described.above..These.exceptions.are.outlined.below.and.in.the.notes:
•. The.annual.release.from.Lake.Carson.to.the.Faulkner.Wetlands.was.below.the.annual.minimum.release.target.of.10%..Further.details.are.available.in.Note6.under.the.heading.Faulkner.Wetlands.
Para 54(a)(ii) 3...The.management.and.operations.of.Energetico.have.been.conducted.throughout.the.reporting.period.in.compliance.with.the.following.practices:
•. Energetico’s.Annual.Management.Plan.
•. Internal.best.practices.of.Energetico.
This.accountability.statement.is.made.in.accordance.with.a.resolution.of.the.directors,..dated.at.Tys,.in.the.State.of.Minton,.on.21.August.2X10.
Para 54(b) Anthony.DemodrovChairman Energetico Hydro Corporation
8 Energetico Hydro Corporation – Model Water Accounting Report Model Water Accounting Report – Energetico Hydro Corporation 9
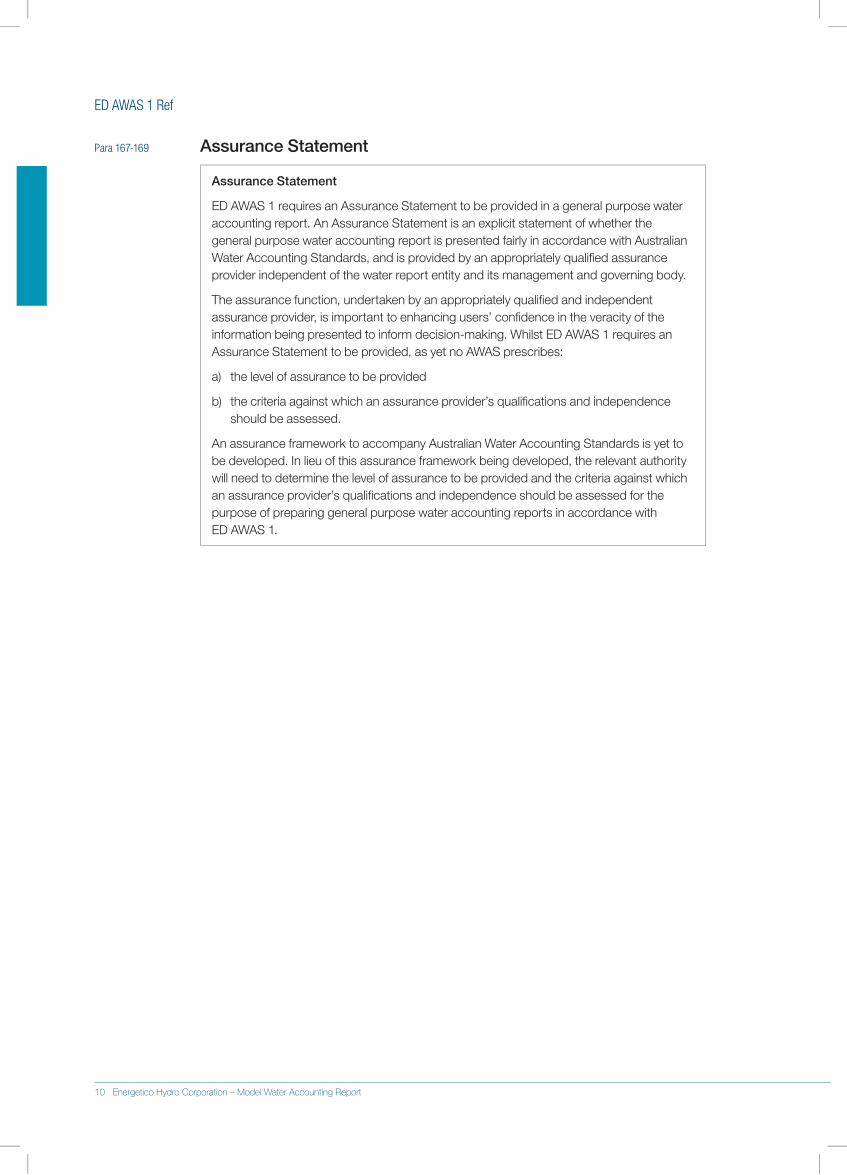
ED AWAS 1 Ref
Para 167-169 Assurance Statement
Assurance Statement
ED.AWAS.1.requires.an.Assurance.Statement.to.be.provided.in.a.general.purpose.water.accounting.report..An.Assurance.Statement.is.an.explicit.statement.of.whether.the.general.purpose.water.accounting.report.is.presented.fairly.in.accordance.with.Australian.Water.Accounting.Standards,.and.is.provided.by.an.appropriately.qualified.assurance.provider.independent.of.the.water.report.entity.and.its.management.and.governing.body.
The.assurance.function,.undertaken.by.an.appropriately.qualified.and.independent.assurance.provider,.is.important.to.enhancing.users’.confidence.in.the.veracity.of.the.information.being.presented.to.inform.decision-making..Whilst.ED.AWAS.1.requires.an.Assurance.Statement.to.be.provided,.as.yet.no.AWAS.prescribes:
a). the.level.of.assurance.to.be.provided.
b). .the.criteria.against.which.an.assurance.provider’s.qualifications.and.independence.should.be.assessed..
An.assurance.framework.to.accompany.Australian.Water.Accounting.Standards.is.yet.to.be.developed..In.lieu.of.this.assurance.framework.being.developed,.the.relevant.authority.will.need.to.determine.the.level.of.assurance.to.be.provided.and.the.criteria.against.which.an.assurance.provider’s.qualifications.and.independence.should.be.assessed.for.the.purpose.of.preparing.general.purpose.water.accounting.reports.in.accordance.with..ED.AWAS.1.
10 Energetico Hydro Corporation – Model Water Accounting Report
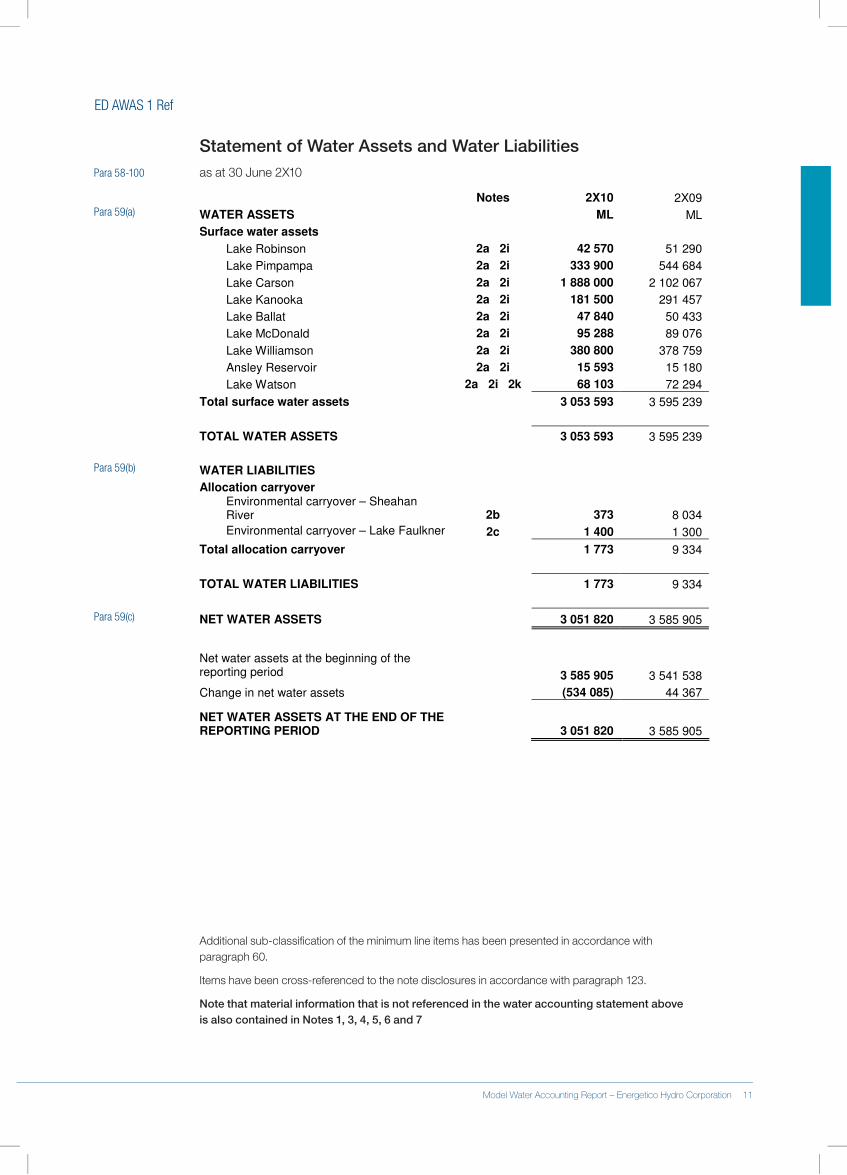
ED AWAS 1 Ref
Statement of Water Assets and Water LiabilitiesPara 58-100 as.at.30.June.2X10
Notes 2X10 2X09
WATER ASSETS ML ML
Surface water assets
Lake Robinson 2a 2i 42 570 51 290
Lake Pimpampa 2a 2i 333 900 544 684
Lake Carson 2a 2i 1 888 000 2 102 067
Lake Kanooka 2a 2i 181 500 291 457
Lake Ballat 2a 2i 47 840 50 433
Lake McDonald 2a 2i 95 288 89 076
Lake Williamson 2a 2i 380 800 378 759
Ansley Reservoir 2a 2i 15 593 15 180
Lake Watson 2a 2i 2k 68 103 72 294
Total surface water assets 3 053 593 3 595 239
TOTAL WATER ASSETS 3 053 593 3 595 239
WATER LIABILITIES
Allocation carryover
Environmental carryover – Sheahan River 2b 373 8 034
Environmental carryover – Lake Faulkner 2c 1 400 1 300
Total allocation carryover 1 773 9 334
TOTAL WATER LIABILITIES 1 773 9 334
NET WATER ASSETS 3 051 820 3 585 905
Net water assets at the beginning of the reporting period 3 585 905 3 541 538
Change in net water assets (534 085) 44 367
NET WATER ASSETS AT THE END OF THE REPORTING PERIOD 3 051 820 3 585 905
Additional.sub-classification.of.the.minimum.line.items.has.been.presented.in.accordance.with..paragraph.60.
Items.have.been.cross-referenced.to.the.note.disclosures.in.accordance.with.paragraph.123.
Note that material information that is not referenced in the water accounting statement above is also contained in Notes 1, 3, 4, 5, 6 and 7
Para 59(a)
Para 59(b)
Para 59(c)
10 Energetico Hydro Corporation – Model Water Accounting Report Model Water Accounting Report – Energetico Hydro Corporation 11
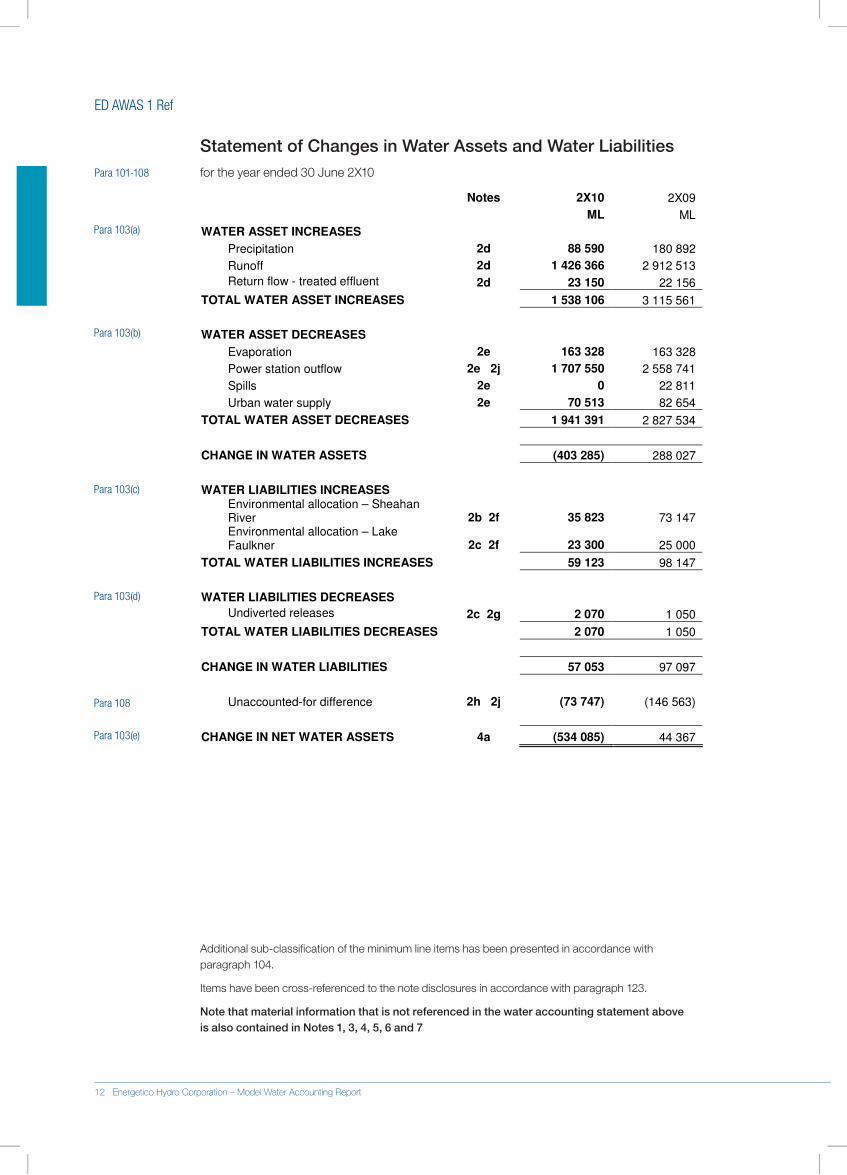
ED AWAS 1 Ref
Statement of Changes in Water Assets and Water LiabilitiesPara 101-108 for.the.year.ended.30.June.2X10
Notes 2X10 2X09
ML ML
WATER ASSET INCREASES
Precipitation 2d 88 590 180 892
Runoff 2d 1 426 366 2 912 513
Return flow - treated effluent 2d 23 150 22 156
TOTAL WATER ASSET INCREASES 1 538 106 3 115 561
WATER ASSET DECREASES
Evaporation 2e 163 328 163 328
Power station outflow 2e 2j 1 707 550 2 558 741
Spills 2e 0 22 811
Urban water supply 2e 70 513 82 654
TOTAL WATER ASSET DECREASES 1 941 391 2 827 534
CHANGE IN WATER ASSETS (403 285) 288 027
WATER LIABILITIES INCREASES
Environmental allocation – Sheahan River 2b 2f 35 823 73 147
Environmental allocation – Lake Faulkner 2c 2f 23 300 25 000
TOTAL WATER LIABILITIES INCREASES 59 123 98 147
WATER LIABILITIES DECREASES
Undiverted releases 2c 2g 2 070 1 050
TOTAL WATER LIABILITIES DECREASES 2 070 1 050
CHANGE IN WATER LIABILITIES 57 053 97 097
Unaccounted-for difference 2h 2j (73 747) (146 563)
CHANGE IN NET WATER ASSETS 4a (534 085) 44 367
Additional.sub-classification.of.the.minimum.line.items.has.been.presented.in.accordance.with..paragraph.104.
Items.have.been.cross-referenced.to.the.note.disclosures.in.accordance.with.paragraph.123.
Note that material information that is not referenced in the water accounting statement above is also contained in Notes 1, 3, 4, 5, 6 and 7
Para 103(a)
Para 103(b)
Para 103(c)
Para 103(d)
Para 108
Para 103(e)
12 Energetico Hydro Corporation – Model Water Accounting Report
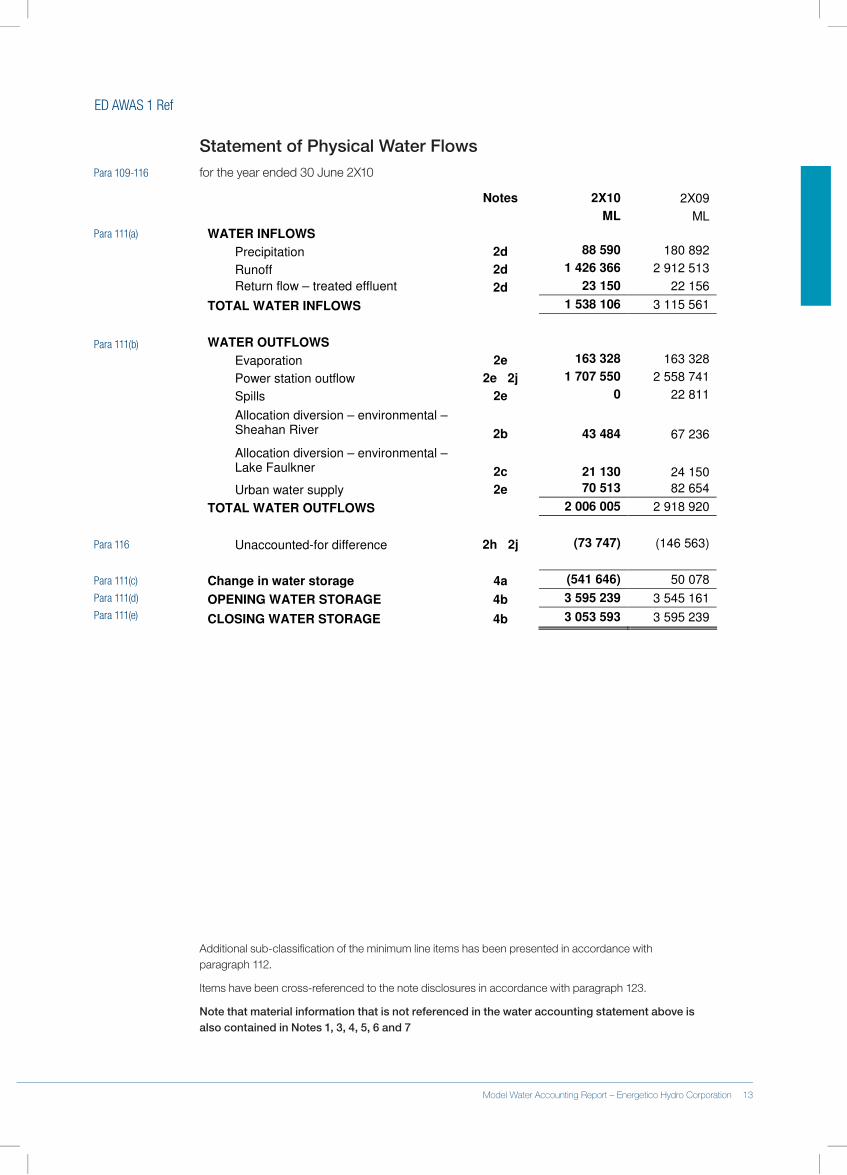
ED AWAS 1 Ref
Statement of Physical Water FlowsPara 109-116 for.the.year.ended.30.June.2X10
Notes 2X10 2X09
ML ML
WATER INFLOWS
Precipitation 2d 88 590 180 892
Runoff 2d 1 426 366 2 912 513
Return flow – treated effluent 2d 23 150 22 156
TOTAL WATER INFLOWS 1 538 106 3 115 561
WATER OUTFLOWS
Evaporation 2e 163 328 163 328
Power station outflow 2e 2j 1 707 550 2 558 741
Spills 2e 0 22 811
Allocation diversion – environmental – Sheahan River 2b 43 484 67 236
Allocation diversion – environmental – Lake Faulkner 2c 21 130 24 150
Urban water supply 2e 70 513 82 654
TOTAL WATER OUTFLOWS 2 006 005 2 918 920
Unaccounted-for difference 2h 2j (73 747) (146 563)
Change in water storage 4a (541 646) 50 078
OPENING WATER STORAGE 4b 3 595 239 3 545 161
CLOSING WATER STORAGE 4b 3 053 593 3 595 239
Additional.sub-classification.of.the.minimum.line.items.has.been.presented.in.accordance.with..paragraph.112.
Items.have.been.cross-referenced.to.the.note.disclosures.in.accordance.with.paragraph.123.
Note that material information that is not referenced in the water accounting statement above is also contained in Notes 1, 3, 4, 5, 6 and 7
Para 111(a)
Para 111(b)
Para 116
Para 111(c)
Para 111(d)
Para 111(e)
12 Energetico Hydro Corporation – Model Water Accounting Report Model Water Accounting Report – Energetico Hydro Corporation 13
ED AWAS 1 Ref
Para 122-166 Note disclosures
Para 125-127 Note 1: Significant water accounting policies
Para 122(a) With.the.exception.of.the.physical.water.flow.information,.this.General.Purpose.Water.Accounting.Report.has.been.prepared.using.an.accrual.basis.of.water.accounting..The.water.attribute.being.quantified.is.volume.and.the.unit.of.account.is.megalitres.(ML).
Para 65 Recognition of water assets
Water.that.Energetico.either.holds.or.has.management.responsibilities.for.is.recognised.as.a.water.asset.provided.that:.(1).Energetico.derives.future.benefits.from.that.water;.and.(2).the.volumes.of.water.can.be.quantified.with.representational.faithfulness..Future.benefits.are.derived.from.the.water.when.it.contributes.to.generating.hydroelectric.power.
Groundwater.aquifers.and.natural.lakes,.whilst.within.the.physical.region.Energetico.operates,.are.not.recognised.as.water.assets.of.Energetico..This.is.because.the.water.is.not.utilised.in.the.production.of.electricity.and.Energetico.therefore.does.not.derive.future.benefits.from.such.water..Nor.does.Energetico.have.management.responsibility.for.this.water..
Water.within.the.river.channel.storage.is.vital.to.the.hydro-generation.process.but.only.as.a.channel.to.move.water.between.storages..The.only.data.collected.on.river.channels,.of.interest.to.the.management.of.Energetico,.is.the.flow.rate.of.the.water..The.volume.of.water.within.the.river.system.has.not.been.recognised.as.a.water.asset..However,.its.omission.from.the.General.Purpose.Water.Accounting.Report.is.not.considered.to.have.a.material.impact.
Para 107 Recognition of changes in water assets
The.volume.of.precipitation.and.evaporation.are.only.quantified.on.the.lakes’.surface..They.are.not.quantified.for.the.entire.region.
The.power.station.outflows.are.calculated.as.the.water.is.directed.through.the.hydro.power.turbines..It.is.assumed.all.water.that.flows.out.of.the.power.station.flows.directly.into.the.next.storage.lake.as.inflow.from.upstream.power.stations..Any.losses.or.additions.are.accounted..for.as.part.of.the.runoff.line.item.
Runoff.is.a.measurement.of.the.volume.of.water.that.flows.into.the.lakes.less.inflow.from.upstream.power.stations..The.runoff.includes.precipitation.captured.in.the.catchment.area.of.the.storage.facilities.less.any.losses.in.the.transfer.of.water.between.power.stations.
Treated.effluent.is.recognised.as.a.change.in.water.assets.as.it.will.be.used.in.conjunction.with.other.water.resources.for.the.production.of.hydro.power.
14 Energetico Hydro Corporation – Model Water Accounting Report
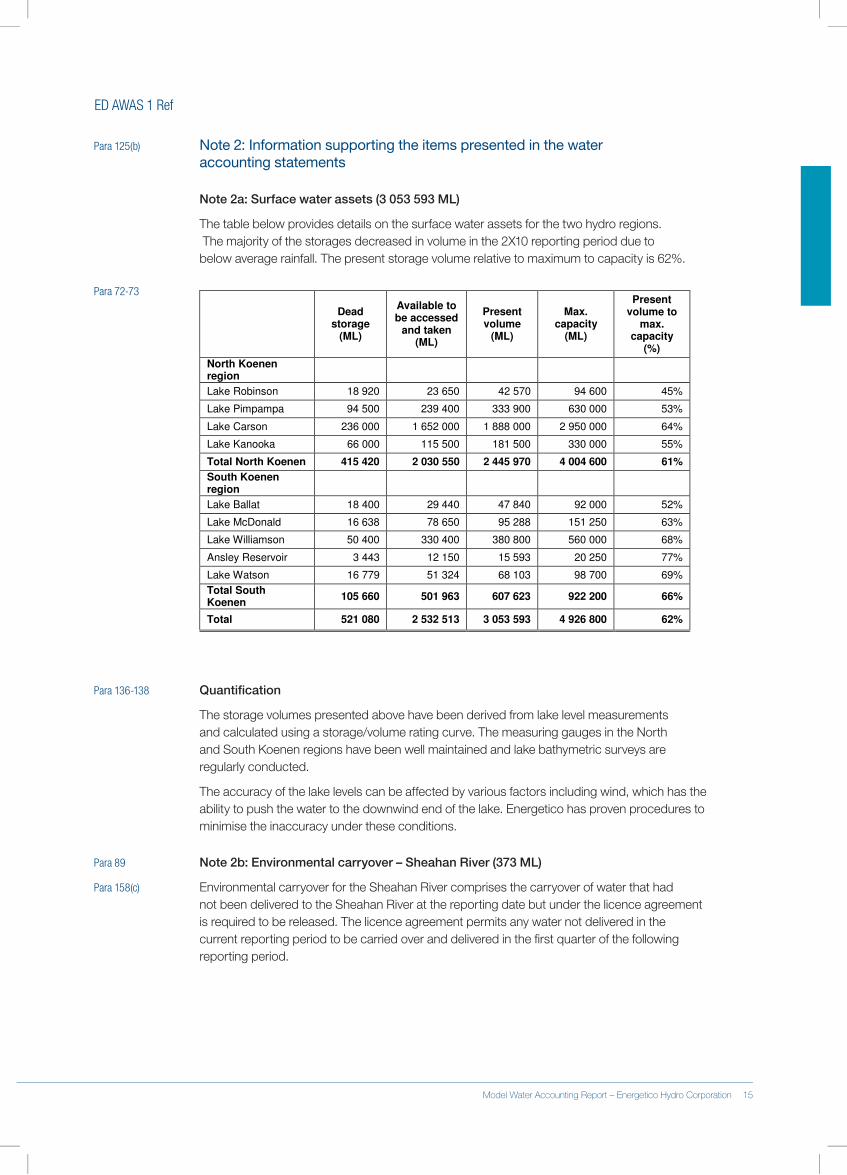
ED AWAS 1 Ref
Para 125(b) Note 2: Information supporting the items presented in the water accounting statements
Note 2a: Surface water assets (3 053 593 ML)
The.table.below.provides.details.on.the.surface.water.assets.for.the.two.hydro.regions...The.majority.of.the.storages.decreased.in.volume.in.the.2X10.reporting.period.due.to..below.average.rainfall..The.present.storage.volume.relative.to.maximum.to.capacity.is.62%.
Para 72-73
Dead storage
(ML)
Available to be accessed
and taken (ML)
Present volume
(ML)
Max. capacity
(ML)
Present volume to
max. capacity
(%)
North Koenen region
Lake Robinson 18 920 23 650 42 570 94 600 45%
Lake Pimpampa 94 500 239 400 333 900 630 000 53%
Lake Carson 236 000 1 652 000 1 888 000 2 950 000 64%
Lake Kanooka 66 000 115 500 181 500 330 000 55%
Total North Koenen 415 420 2 030 550 2 445 970 4 004 600 61%
South Koenen region
Lake Ballat 18 400 29 440 47 840 92 000 52%
Lake McDonald 16 638 78 650 95 288 151 250 63%
Lake Williamson 50 400 330 400 380 800 560 000 68%
Ansley Reservoir 3 443 12 150 15 593 20 250 77%
Lake Watson 16 779 51 324 68 103 98 700 69%
Total South Koenen
105 660 501 963 607 623 922 200 66%
Total 521 080 2 532 513 3 053 593 4 926 800 62%
Para 136-138 Quantification
The.storage.volumes.presented.above.have.been.derived.from.lake.level.measurements..and.calculated.using.a.storage/volume.rating.curve..The.measuring.gauges.in.the.North..and.South.Koenen.regions.have.been.well.maintained.and.lake.bathymetric.surveys.are.regularly.conducted.
The.accuracy.of.the.lake.levels.can.be.affected.by.various.factors.including.wind,.which.has.the.ability.to.push.the.water.to.the.downwind.end.of.the.lake..Energetico.has.proven.procedures.to.minimise.the.inaccuracy.under.these.conditions.
Para 89 Note 2b: Environmental carryover – Sheahan River (373 ML)
Para 158(c) Environmental.carryover.for.the.Sheahan.River.comprises.the.carryover.of.water.that.had.not.been.delivered.to.the.Sheahan.River.at.the.reporting.date.but.under.the.licence.agreement.is.required.to.be.released..The.licence.agreement.permits.any.water.not.delivered.in.the..current.reporting.period.to.be.carried.over.and.delivered.in.the.first.quarter.of.the.following.reporting.period.
14 Energetico Hydro Corporation – Model Water Accounting Report Model Water Accounting Report – Energetico Hydro Corporation 15
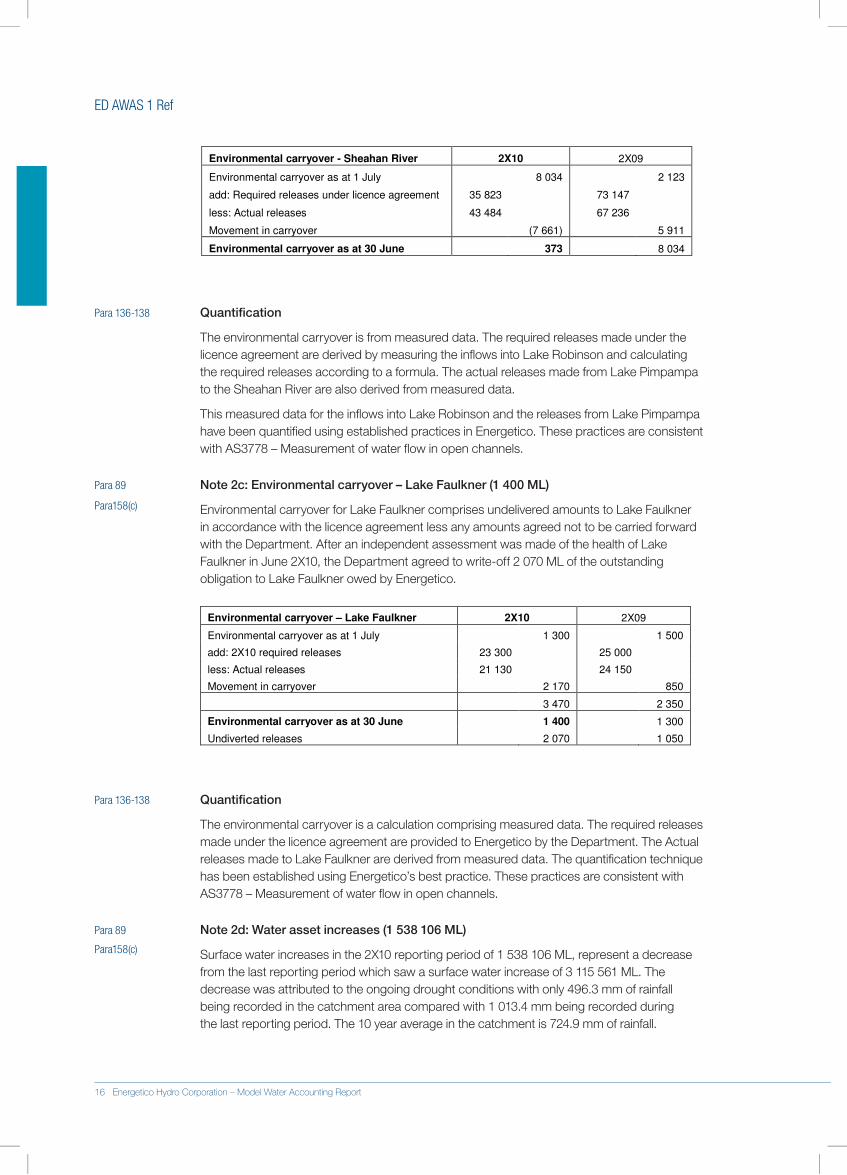
ED AWAS 1 Ref
Environmental carryover - Sheahan River 2X10 2X09
Environmental carryover as at 1 July 8 034 2 123
add: Required releases under licence agreement 35 823 73 147
less: Actual releases 43 484 67 236
Movement in carryover (7 661) 5 911
Environmental carryover as at 30 June 373 8 034
Para 136-138 Quantification
The.environmental.carryover.is.from.measured.data..The.required.releases.made.under.the.licence.agreement.are.derived.by.measuring.the.inflows.into.Lake.Robinson.and.calculating.the.required.releases.according.to.a.formula..The.actual.releases.made.from.Lake.Pimpampa.to.the.Sheahan.River.are.also.derived.from.measured.data.
This.measured.data.for.the.inflows.into.Lake.Robinson.and.the.releases.from.Lake.Pimpampa.have.been.quantified.using.established.practices.in.Energetico..These.practices.are.consistent.with.AS3778.–.Measurement.of.water.flow.in.open.channels.
Para 89 Note 2c: Environmental carryover – Lake Faulkner (1 400 ML)
Environmental.carryover.for.Lake.Faulkner.comprises.undelivered.amounts.to.Lake.Faulkner.in.accordance.with.the.licence.agreement.less.any.amounts.agreed.not.to.be.carried.forward.with.the.Department..After.an.independent.assessment.was.made.of.the.health.of.Lake.Faulkner.in.June.2X10,.the.Department.agreed.to.write-off.2.070.ML.of.the.outstanding.obligation.to.Lake.Faulkner.owed.by.Energetico.
Environmental carryover – Lake Faulkner 2X10 2X09
Environmental carryover as at 1 July 1 300 1 500
add: 2X10 required releases 23 300 25 000
less: Actual releases 21 130 24 150
Movement in carryover 2 170 850
3 470 2 350
Environmental carryover as at 30 June 1 400 1 300
Undiverted releases 2 070 1 050
Para 136-138 Quantification
The.environmental.carryover.is.a.calculation.comprising.measured.data..The.required.releases.made.under.the.licence.agreement.are.provided.to.Energetico.by.the.Department..The.Actual.releases.made.to.Lake.Faulkner.are.derived.from.measured.data..The.quantification.technique.has.been.established.using.Energetico’s.best.practice..These.practices.are.consistent.with.AS3778.–.Measurement.of.water.flow.in.open.channels.
Para 89 Note 2d: Water asset increases (1 538 106 ML)
Surface.water.increases.in.the.2X10.reporting.period.of.1.538.106.ML,.represent.a.decrease.from.the.last.reporting.period.which.saw.a.surface.water.increase.of.3.115.561.ML..The.decrease.was.attributed.to.the.ongoing.drought.conditions.with.only.496.3.mm.of.rainfall..being.recorded.in.the.catchment.area.compared.with.1.013.4.mm.being.recorded.during..the.last.reporting.period..The.10.year.average.in.the.catchment.is.724.9.mm.of.rainfall.
Para158(c)
Para158(c)
16 Energetico Hydro Corporation – Model Water Accounting Report
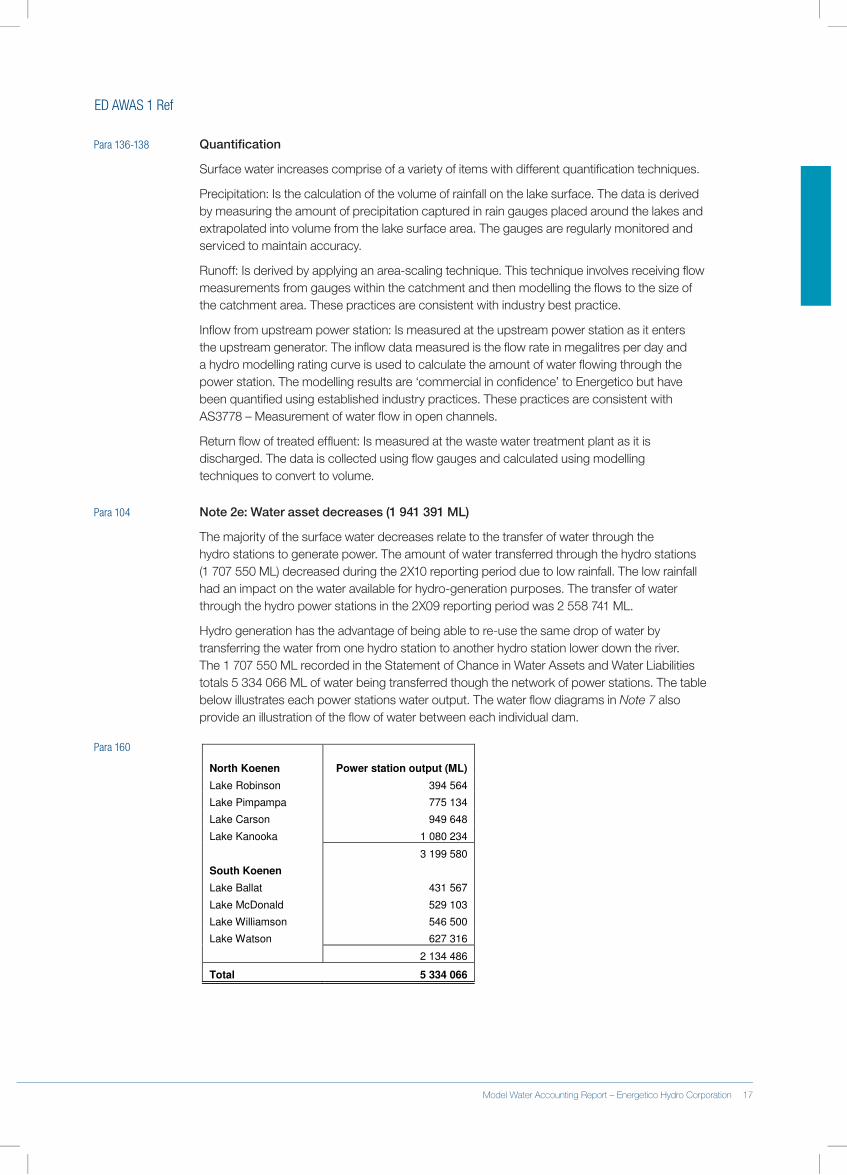
ED AWAS 1 Ref
Para 136-138 Quantification
Surface.water.increases.comprise.of.a.variety.of.items.with.different.quantification.techniques.
Precipitation:.Is.the.calculation.of.the.volume.of.rainfall.on.the.lake.surface..The.data.is.derived..by.measuring.the.amount.of.precipitation.captured.in.rain.gauges.placed.around.the.lakes.and.extrapolated.into.volume.from.the.lake.surface.area..The.gauges.are.regularly.monitored.and.serviced.to.maintain.accuracy.
Runoff:.Is.derived.by.applying.an.area-scaling.technique..This.technique.involves.receiving.flow.measurements.from.gauges.within.the.catchment.and.then.modelling.the.flows.to.the.size.of.the.catchment.area..These.practices.are.consistent.with.industry.best.practice.
Inflow.from.upstream.power.station:.Is.measured.at.the.upstream.power.station.as.it.enters.the.upstream.generator..The.inflow.data.measured.is.the.flow.rate.in.megalitres.per.day.and.a.hydro.modelling.rating.curve.is.used.to.calculate.the.amount.of.water.flowing.through.the.power.station..The.modelling.results.are.‘commercial.in.confidence’.to.Energetico.but.have.been.quantified.using.established.industry.practices..These.practices.are.consistent.with.AS3778.–.Measurement.of.water.flow.in.open.channels.
Return.flow.of.treated.effluent:.Is.measured.at.the.waste.water.treatment.plant.as.it.is.discharged..The.data.is.collected.using.flow.gauges.and.calculated.using.modelling.techniques.to.convert.to.volume.
Para 104 Note 2e: Water asset decreases (1 941 391 ML)
The.majority.of.the.surface.water.decreases.relate.to.the.transfer.of.water.through.the..hydro.stations.to.generate.power..The.amount.of.water.transferred.through.the.hydro.stations.(1.707.550.ML).decreased.during.the.2X10.reporting.period.due.to.low.rainfall..The.low.rainfall.had.an.impact.on.the.water.available.for.hydro-generation.purposes..The.transfer.of.water.through.the.hydro.power.stations.in.the.2X09.reporting.period.was.2.558.741.ML..
Hydro.generation.has.the.advantage.of.being.able.to.re-use.the.same.drop.of.water.by.transferring.the.water.from.one.hydro.station.to.another.hydro.station.lower.down.the.river..The.1.707.550.ML.recorded.in.the.Statement.of.Chance.in.Water.Assets.and.Water.Liabilities.totals.5.334.066.ML.of.water.being.transferred.though.the.network.of.power.stations..The.table.below.illustrates.each.power.stations.water.output..The.water.flow.diagrams.in.Note7.also.provide.an.illustration.of.the.flow.of.water.between.each.individual.dam..
North Koenen Power station output (ML)
Lake Robinson 394 564
Lake Pimpampa 775 134
Lake Carson 949 648
Lake Kanooka 1 080 234
3 199 580
South Koenen
Lake Ballat 431 567
Lake McDonald 529 103
Lake Williamson 546 500
Lake Watson 627 316
2 134 486
Total 5 334 066
Para 160
16 Energetico Hydro Corporation – Model Water Accounting Report Model Water Accounting Report – Energetico Hydro Corporation 17
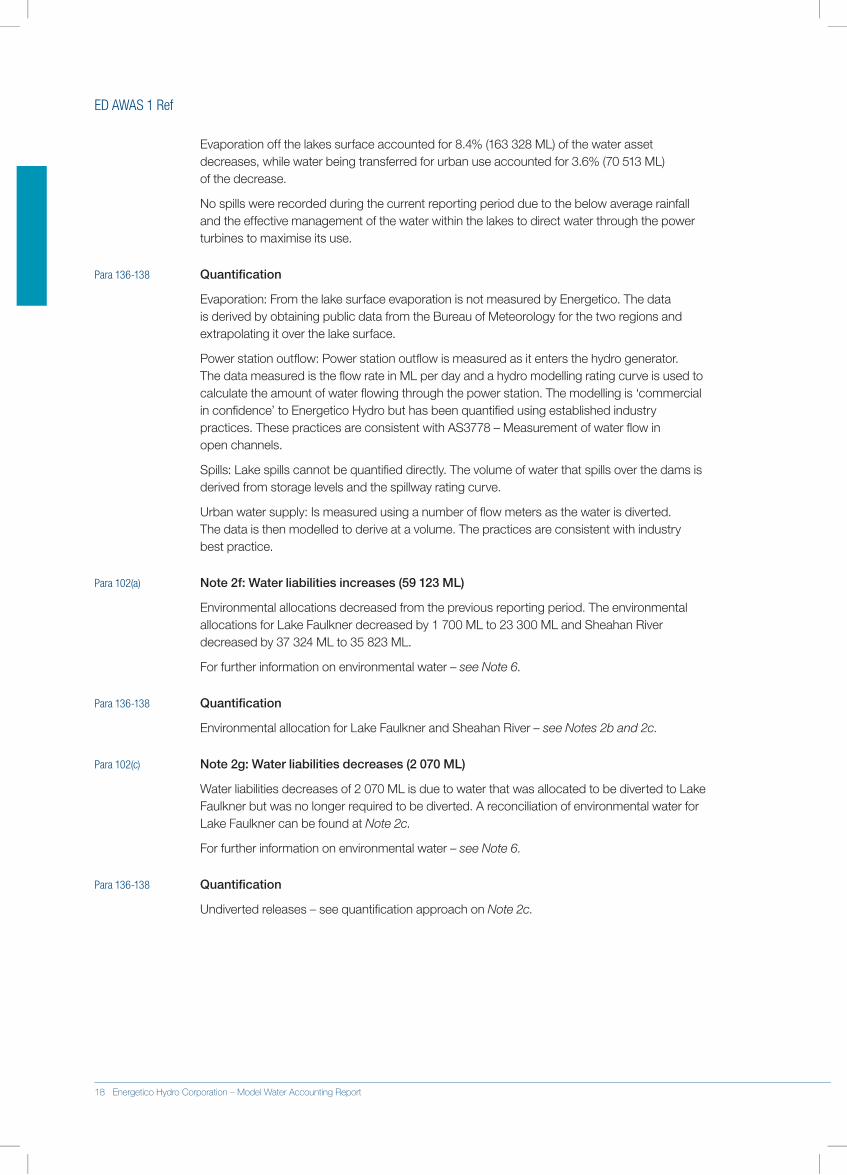
ED AWAS 1 Ref
Evaporation.off.the.lakes.surface.accounted.for.8.4%.(163.328.ML).of.the.water.asset.decreases,.while.water.being.transferred.for.urban.use.accounted.for.3.6%.(70.513.ML)..of.the.decrease.
No.spills.were.recorded.during.the.current.reporting.period.due.to.the.below.average.rainfall.and.the.effective.management.of.the.water.within.the.lakes.to.direct.water.through.the.power.turbines.to.maximise.its.use.
Para 136-138 Quantification
Evaporation:.From.the.lake.surface.evaporation.is.not.measured.by.Energetico..The.data.is.derived.by.obtaining.public.data.from.the.Bureau.of.Meteorology.for.the.two.regions.and.extrapolating.it.over.the.lake.surface.
Power.station.outflow:.Power.station.outflow.is.measured.as.it.enters.the.hydro.generator...The.data.measured.is.the.flow.rate.in.ML.per.day.and.a.hydro.modelling.rating.curve.is.used.to.calculate.the.amount.of.water.flowing.through.the.power.station..The.modelling.is.‘commercial.in.confidence’.to.Energetico.Hydro.but.has.been.quantified.using.established.industry.practices..These.practices.are.consistent.with.AS3778.–.Measurement.of.water.flow.in..open.channels.
Spills:.Lake.spills.cannot.be.quantified.directly..The.volume.of.water.that.spills.over.the.dams.is.derived.from.storage.levels.and.the.spillway.rating.curve..
Urban.water.supply:.Is.measured.using.a.number.of.flow.meters.as.the.water.is.diverted...The.data.is.then.modelled.to.derive.at.a.volume..The.practices.are.consistent.with.industry.best.practice.
Para 102(a) Note 2f: Water liabilities increases (59 123 ML)
Environmental.allocations.decreased.from.the.previous.reporting.period..The.environmental.allocations.for.Lake.Faulkner.decreased.by.1.700.ML.to.23.300.ML.and.Sheahan.River.decreased.by.37.324.ML.to.35.823.ML.
For.further.information.on.environmental.water.–.seeNote6.
Para 136-138 Quantification
Environmental.allocation.for.Lake.Faulkner.and.Sheahan.River–seeNotes2band2c.
Para 102(c) Note 2g: Water liabilities decreases (2 070 ML)
Water.liabilities.decreases.of.2.070.ML.is.due.to.water.that.was.allocated.to.be.diverted.to.Lake.Faulkner.but.was.no.longer.required.to.be.diverted..A.reconciliation.of.environmental.water.for.Lake.Faulkner.can.be.found.at.Note2c.
For.further.information.on.environmental.water.–.seeNote6.
Para 136-138 Quantification
Undiverted.releases.–.see.quantification.approach.on.Note2c.
18 Energetico Hydro Corporation – Model Water Accounting Report
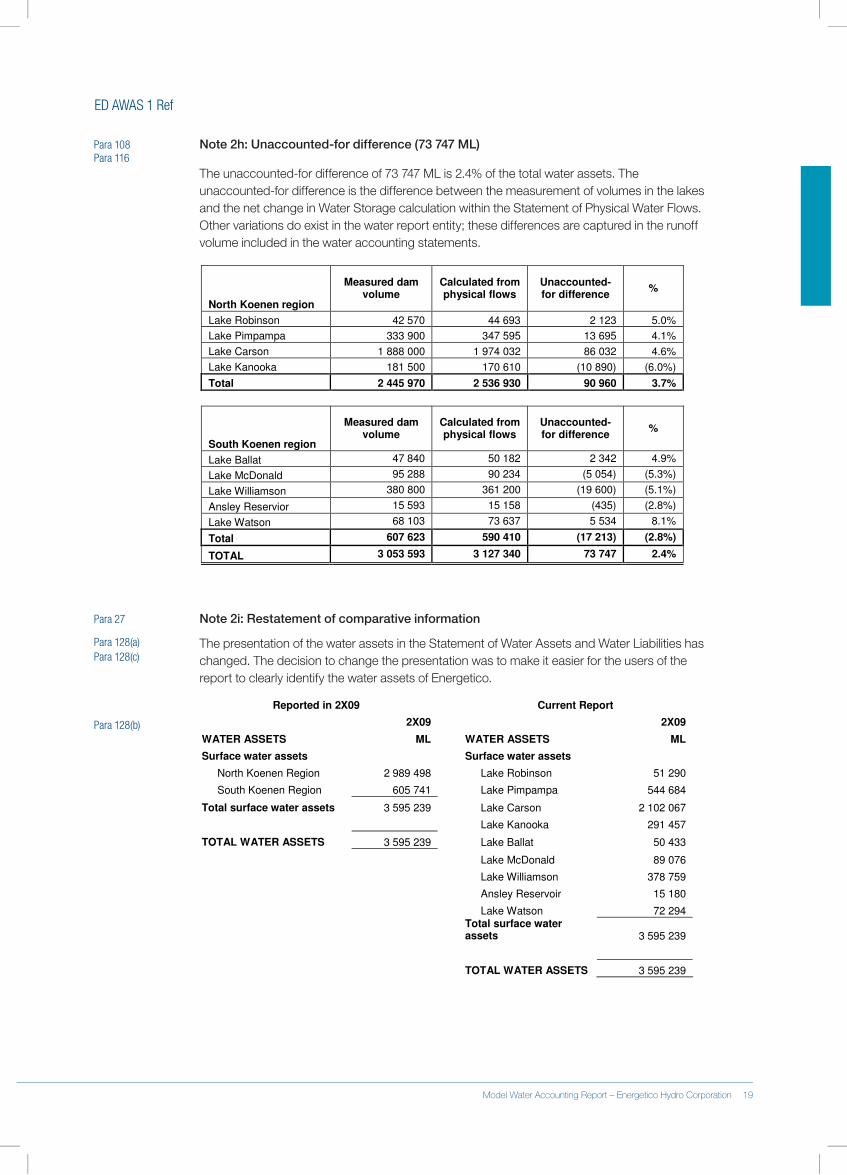
ED AWAS 1 Ref
Para 108 Note 2h: Unaccounted-for difference (73 747 ML)Para 116
The.unaccounted-for.difference.of.73.747.ML.is.2.4%.of.the.total.water.assets..The.unaccounted-for.difference.is.the.difference.between.the.measurement.of.volumes.in.the.lakes.and.the.net.change.in.Water.Storage.calculation.within.the.Statement.of.Physical.Water.Flows..Other.variations.do.exist.in.the.water.report.entity;.these.differences.are.captured.in.the.runoff.volume.included.in.the.water.accounting.statements.
North Koenen region
Measured dam volume
Calculated from physical flows
Unaccounted- for difference
%
Lake Robinson 42 570 44 693 2 123 5.0%
Lake Pimpampa 333 900 347 595 13 695 4.1%
Lake Carson 1 888 000 1 974 032 86 032 4.6%
Lake Kanooka 181 500 170 610 (10 890) (6.0%)
Total 2 445 970 2 536 930 90 960 3.7%
South Koenen region
Measured dam volume
Calculated from physical flows
Unaccounted- for difference
%
Lake Ballat 47 840 50 182 2 342 4.9%
Lake McDonald 95 288 90 234 (5 054) (5.3%)
Lake Williamson 380 800 361 200 (19 600) (5.1%)
Ansley Reservior 15 593 15 158 (435) (2.8%)
Lake Watson 68 103 73 637 5 534 8.1%
Total 607 623 590 410 (17 213) (2.8%)
TOTAL 3 053 593 3 127 340 73 747 2.4%
Para 27 Note 2i: Restatement of comparative information
The.presentation.of.the.water.assets.in.the.Statement.of.Water.Assets.and.Water.Liabilities.has.changed..The.decision.to.change.the.presentation.was.to.make.it.easier.for.the.users.of.the.report.to.clearly.identify.the.water.assets.of.Energetico.
Para 128(b)
Reported in 2X09 Current Report
2X09 2X09
WATER ASSETS ML WATER ASSETS ML
Surface water assets Surface water assets
North Koenen Region 2 989 498 Lake Robinson 51 290
South Koenen Region 605 741 Lake Pimpampa 544 684
Total surface water assets 3 595 239 Lake Carson 2 102 067
Lake Kanooka 291 457
TOTAL WATER ASSETS 3 595 239 Lake Ballat 50 433
Lake McDonald 89 076
Lake Williamson 378 759
Ansley Reservoir 15 180
Lake Watson 72 294
Total surface water assets 3 595 239
TOTAL WATER ASSETS 3 595 239
Para 128(a)Para 128(c)
18 Energetico Hydro Corporation – Model Water Accounting Report Model Water Accounting Report – Energetico Hydro Corporation 19
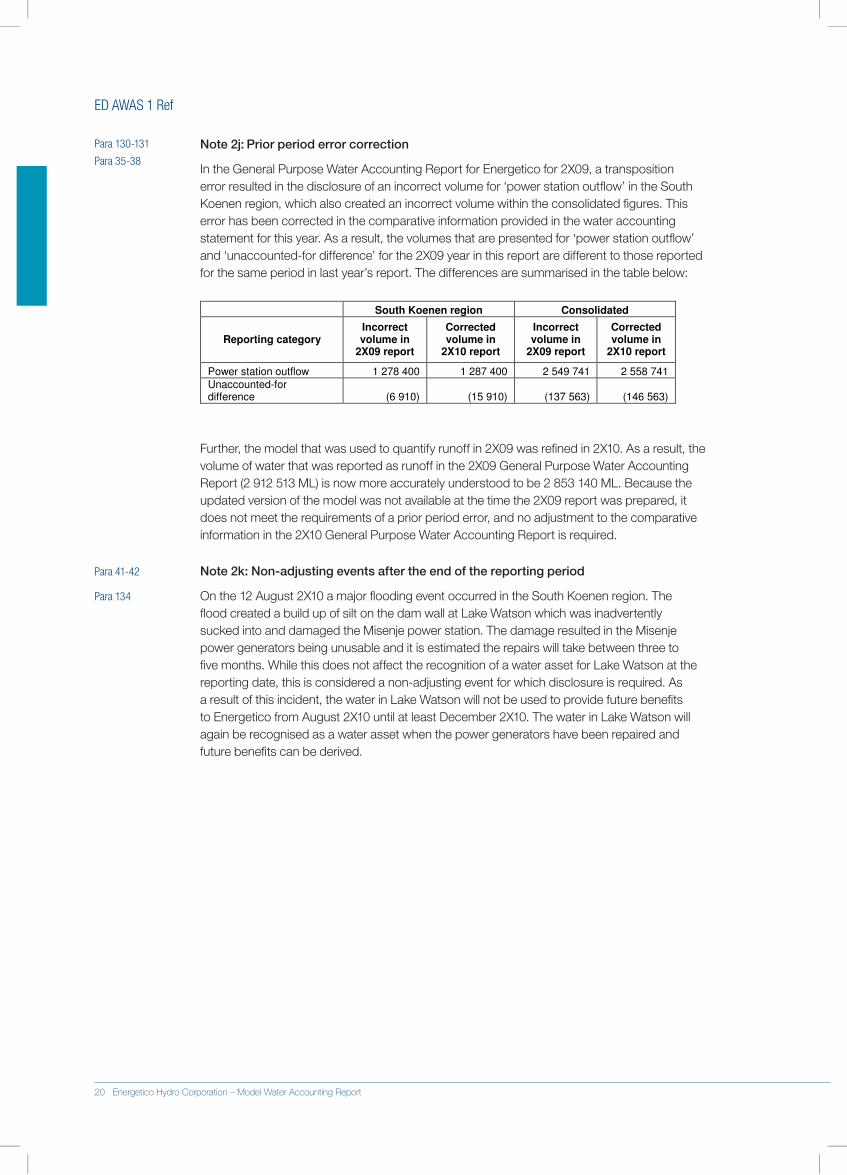
ED AWAS 1 Ref
Note 2j: Prior period error correction
In.the.General.Purpose.Water.Accounting.Report.for.Energetico.for.2X09,.a.transposition.error.resulted.in.the.disclosure.of.an.incorrect.volume.for.‘power.station.outflow’.in.the.South.Koenen.region,.which.also.created.an.incorrect.volume.within.the.consolidated.figures..This.error.has.been.corrected.in.the.comparative.information.provided.in.the.water.accounting.statement.for.this.year..As.a.result,.the.volumes.that.are.presented.for.‘power.station.outflow’.and.‘unaccounted-for.difference’.for.the.2X09.year.in.this.report.are.different.to.those.reported.for.the.same.period.in.last.year’s.report..The.differences.are.summarised.in.the.table.below:
South Koenen region Consolidated
Reporting category Incorrect volume in
2X09 report
Corrected volume in
2X10 report
Incorrect volume in
2X09 report
Corrected volume in
2X10 report
Power station outflow 1 278 400 1 287 400 2 549 741 2 558 741
Unaccounted-for difference (6 910) (15 910) (137 563) (146 563)
Further,.the.model.that.was.used.to.quantify.runoff.in.2X09.was.refined.in.2X10..As.a.result,.the.volume.of.water.that.was.reported.as.runoff.in.the.2X09.General.Purpose.Water.Accounting.Report.(2.912.513.ML).is.now.more.accurately.understood.to.be.2.853.140.ML..Because.the.updated.version.of.the.model.was.not.available.at.the.time.the.2X09.report.was.prepared,.it.does.not.meet.the.requirements.of.a.prior.period.error,.and.no.adjustment.to.the.comparative.information.in.the.2X10.General.Purpose.Water.Accounting.Report.is.required.
Para 41-42 Note 2k: Non-adjusting events after the end of the reporting period
Para 134 On.the.12.August.2X10.a.major.flooding.event.occurred.in.the.South.Koenen.region..The.flood.created.a.build.up.of.silt.on.the.dam.wall.at.Lake.Watson.which.was.inadvertently.sucked.into.and.damaged.the.Misenje.power.station..The.damage.resulted.in.the.Misenje.power.generators.being.unusable.and.it.is.estimated.the.repairs.will.take.between.three.to.five.months..While.this.does.not.affect.the.recognition.of.a.water.asset.for.Lake.Watson.at.the.reporting.date,.this.is.considered.a.non-adjusting.event.for.which.disclosure.is.required..As.a.result.of.this.incident,.the.water.in.Lake.Watson.will.not.be.used.to.provide.future.benefits.to.Energetico.from.August.2X10.until.at.least.December.2X10..The.water.in.Lake.Watson.will.again.be.recognised.as.a.water.asset.when.the.power.generators.have.been.repaired.and.future.benefits.can.be.derived.
Para 130-131
Para 35-38
20 Energetico Hydro Corporation – Model Water Accounting Report
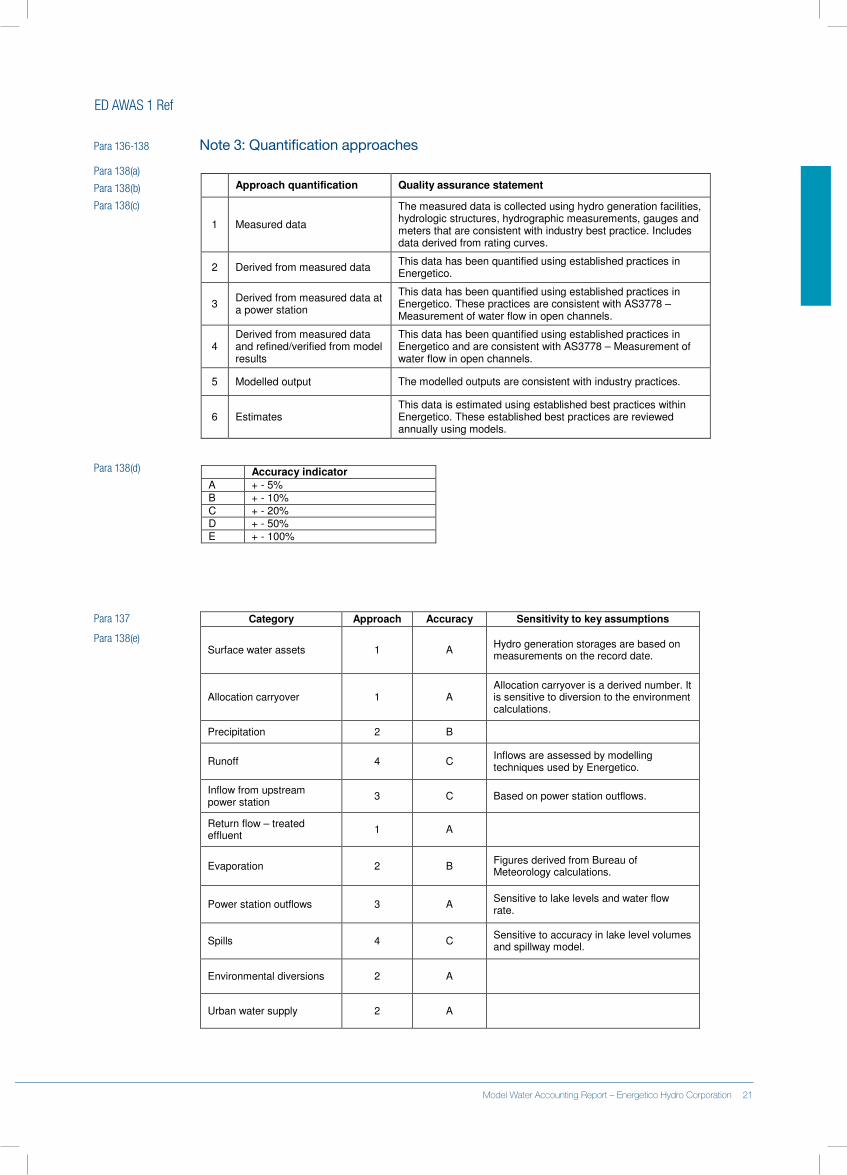
ED AWAS 1 Ref
Para 136-138 Note 3: Quantification approaches
Para 138(a)
Para 138(b)
Para 138(c)
Approach quantification Quality assurance statement
1 Measured data
The measured data is collected using hydro generation facilities, hydrologic structures, hydrographic measurements, gauges and meters that are consistent with industry best practice. Includes data derived from rating curves.
2 Derived from measured data This data has been quantified using established practices in Energetico.
3 Derived from measured data at a power station
This data has been quantified using established practices in Energetico. These practices are consistent with AS3778 – Measurement of water flow in open channels.
4 Derived from measured data and refined/verified from model results
This data has been quantified using established practices in Energetico and are consistent with AS3778 – Measurement of water flow in open channels.
5 Modelled output The modelled outputs are consistent with industry practices.
6 Estimates This data is estimated using established best practices within Energetico. These established best practices are reviewed annually using models.
Accuracy indicator
A + - 5%
B + - 10%
C + - 20% D + - 50%
E + - 100%
Category Approach Accuracy Sensitivity to key assumptions
Surface water assets 1 A Hydro generation storages are based on measurements on the record date.
Allocation carryover 1 A Allocation carryover is a derived number. It is sensitive to diversion to the environment calculations.
Precipitation 2 B
Runoff 4 C Inflows are assessed by modelling techniques used by Energetico.
Inflow from upstream power station
3 C Based on power station outflows.
Return flow – treated effluent
1 A
Evaporation 2 B Figures derived from Bureau of Meteorology calculations.
Power station outflows 3 A Sensitive to lake levels and water flow rate.
Spills 4 C Sensitive to accuracy in lake level volumes and spillway model.
Environmental diversions 2 A
Urban water supply 2 A
Para 138(d)
Para 137
Para 138(e)
20 Energetico Hydro Corporation – Model Water Accounting Report Model Water Accounting Report – Energetico Hydro Corporation 21
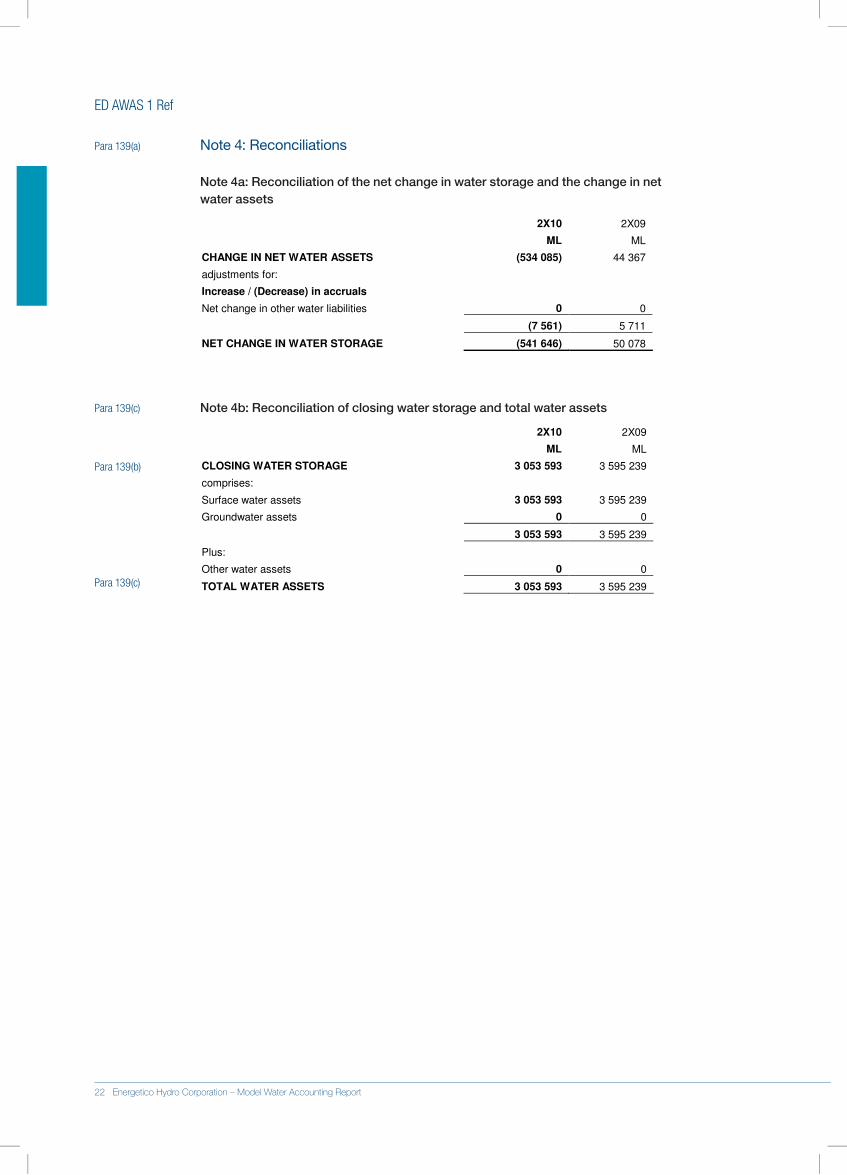
ED AWAS 1 Ref
Para 139(a) Note 4: Reconciliations
Note 4a: Reconciliation of the net change in water storage and the change in net water assets
2X10 2X09
ML ML
CHANGE IN NET WATER ASSETS (534 085) 44 367
adjustments for:
Increase / (Decrease) in accruals
Net change in other water liabilities 0 0
(7 561) 5 711
NET CHANGE IN WATER STORAGE (541 646) 50 078
Para 139(c) Note 4b: Reconciliation of closing water storage and total water assets
2X10 2X09
ML ML
CLOSING WATER STORAGE 3 053 593 3 595 239
comprises:
Surface water assets 3 053 593 3 595 239
Groundwater assets 0 0
3 053 593 3 595 239
Plus:
Other water assets 0 0
TOTAL WATER ASSETS 3 053 593 3 595 239
Para 139(b)
Para 139(c)
22 Energetico Hydro Corporation – Model Water Accounting Report
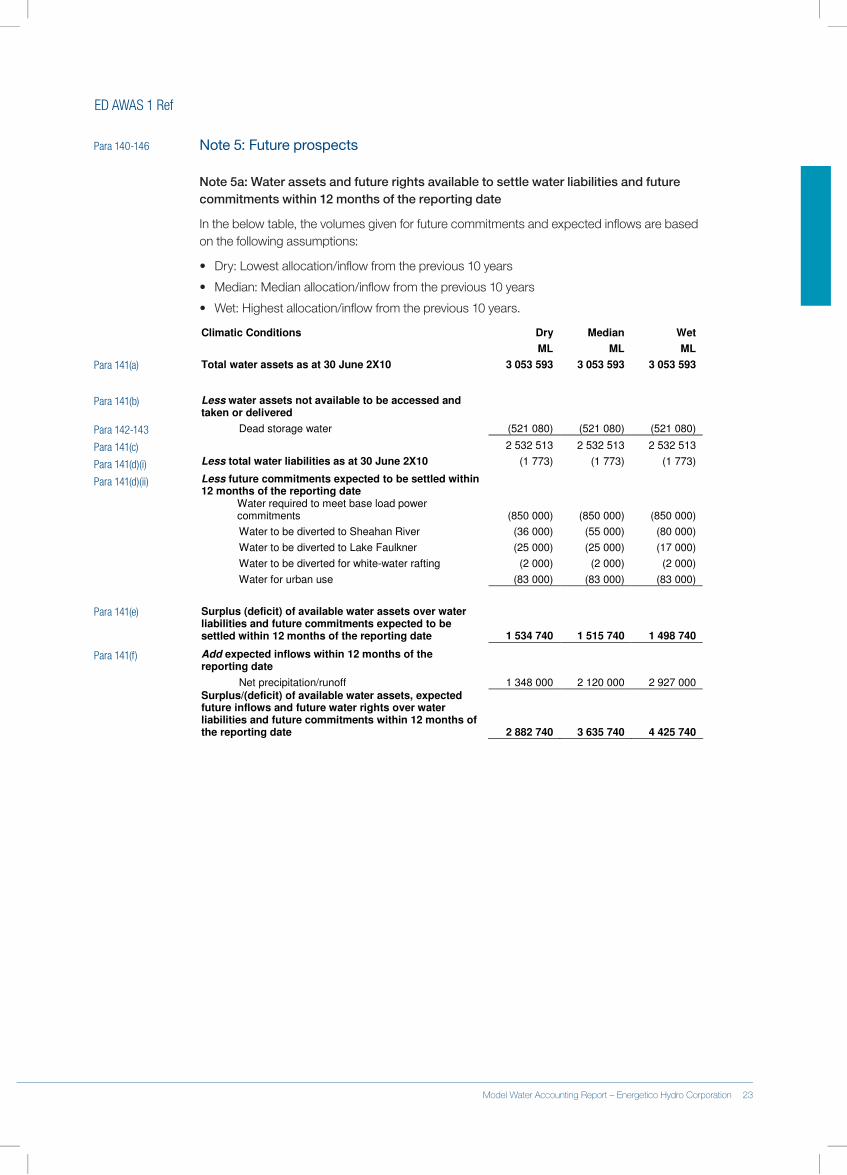
ED AWAS 1 Ref
Para 140-146 Note 5: Future prospects
Note 5a: Water assets and future rights available to settle water liabilities and future commitments within 12 months of the reporting date
In.the.below.table,.the.volumes.given.for.future.commitments.and.expected.inflows.are.based.on.the.following.assumptions:
•. Dry:.Lowest.allocation/inflow.from.the.previous.10.years
•. Median:.Median.allocation/inflow.from.the.previous.10.years
•. Wet:.Highest.allocation/inflow.from.the.previous.10.years.
Climatic Conditions Dry Median Wet
ML ML ML
Total water assets as at 30 June 2X10 3 053 593 3 053 593 3 053 593
Less water assets not available to be accessed and taken or delivered
Dead storage water (521 080) (521 080) (521 080)
2 532 513 2 532 513 2 532 513
Less total water liabilities as at 30 June 2X10 (1 773) (1 773) (1 773)
Less future commitments expected to be settled within 12 months of the reporting date
Water required to meet base load power commitments (850 000) (850 000) (850 000)
Water to be diverted to Sheahan River (36 000) (55 000) (80 000)
Water to be diverted to Lake Faulkner (25 000) (25 000) (17 000)
Water to be diverted for white-water rafting (2 000) (2 000) (2 000)
Water for urban use (83 000) (83 000) (83 000)
Surplus (deficit) of available water assets over water liabilities and future commitments expected to be settled within 12 months of the reporting date 1 534 740 1 515 740 1 498 740
Add expected inflows within 12 months of the reporting date
Net precipitation/runoff 1 348 000 2 120 000 2 927 000
Surplus/(deficit) of available water assets, expected future inflows and future water rights over water liabilities and future commitments within 12 months of the reporting date 2 882 740 3 635 740 4 425 740
Para 141(a)
Para 141(b)
Para 142-143
Para 141(c)
Para 141(d)(i)
Para 141(d)(ii)
Para 141(e)
Para 141(f)
22 Energetico Hydro Corporation – Model Water Accounting Report Model Water Accounting Report – Energetico Hydro Corporation 23
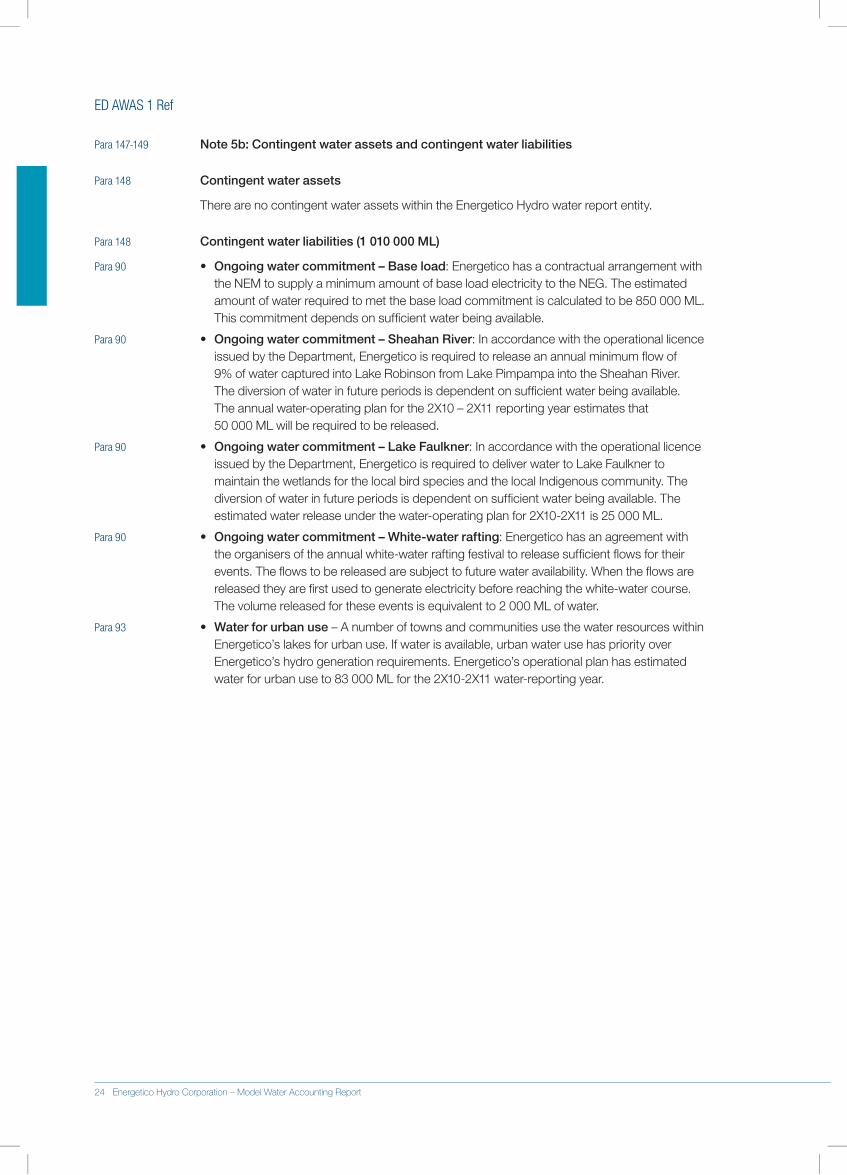
ED AWAS 1 Ref
Para 147-149 Note 5b: Contingent water assets and contingent water liabilities
Para 148 Contingent water assets
There.are.no.contingent.water.assets.within.the.Energetico.Hydro.water.report.entity.
Para 148 Contingent water liabilities (1 010 000 ML)
Para 90 •. Ongoing water commitment – Base load:.Energetico.has.a.contractual.arrangement.with.the.NEM.to.supply.a.minimum.amount.of.base.load.electricity.to.the.NEG..The.estimated.amount.of.water.required.to.met.the.base.load.commitment.is.calculated.to.be.850.000.ML..This.commitment.depends.on.sufficient.water.being.available..
Para 90 •. .Ongoing water commitment – Sheahan River:.In.accordance.with.the.operational.licence.issued.by.the.Department,.Energetico.is.required.to.release.an.annual.minimum.flow.of..9%.of.water.captured.into.Lake.Robinson.from.Lake.Pimpampa.into.the.Sheahan.River...The.diversion.of.water.in.future.periods.is.dependent.on.sufficient.water.being.available...The.annual.water-operating.plan.for.the.2X10.–.2X11.reporting.year.estimates.that..50.000.ML.will.be.required.to.be.released.
Para 90 •. .Ongoing water commitment – Lake Faulkner:.In.accordance.with.the.operational.licence.issued.by.the.Department,.Energetico.is.required.to.deliver.water.to.Lake.Faulkner.to.maintain.the.wetlands.for.the.local.bird.species.and.the.local.Indigenous.community..The.diversion.of.water.in.future.periods.is.dependent.on.sufficient.water.being.available..The.estimated.water.release.under.the.water-operating.plan.for.2X10-2X11.is.25.000.ML.
Para 90 •. .Ongoing water commitment – White-water rafting:.Energetico.has.an.agreement.with.the.organisers.of.the.annual.white-water.rafting.festival.to.release.sufficient.flows.for.their.events..The.flows.to.be.released.are.subject.to.future.water.availability..When.the.flows.are.released.they.are.first.used.to.generate.electricity.before.reaching.the.white-water.course..The.volume.released.for.these.events.is.equivalent.to.2.000.ML.of.water..
Para 93 •. .Water for urban use.–.A.number.of.towns.and.communities.use.the.water.resources.within.Energetico’s.lakes.for.urban.use..If.water.is.available,.urban.water.use.has.priority.over.Energetico’s.hydro.generation.requirements..Energetico’s.operational.plan.has.estimated.water.for.urban.use.to.83.000.ML.for.the.2X10-2X11.water-reporting.year.
24 Energetico Hydro Corporation – Model Water Accounting Report
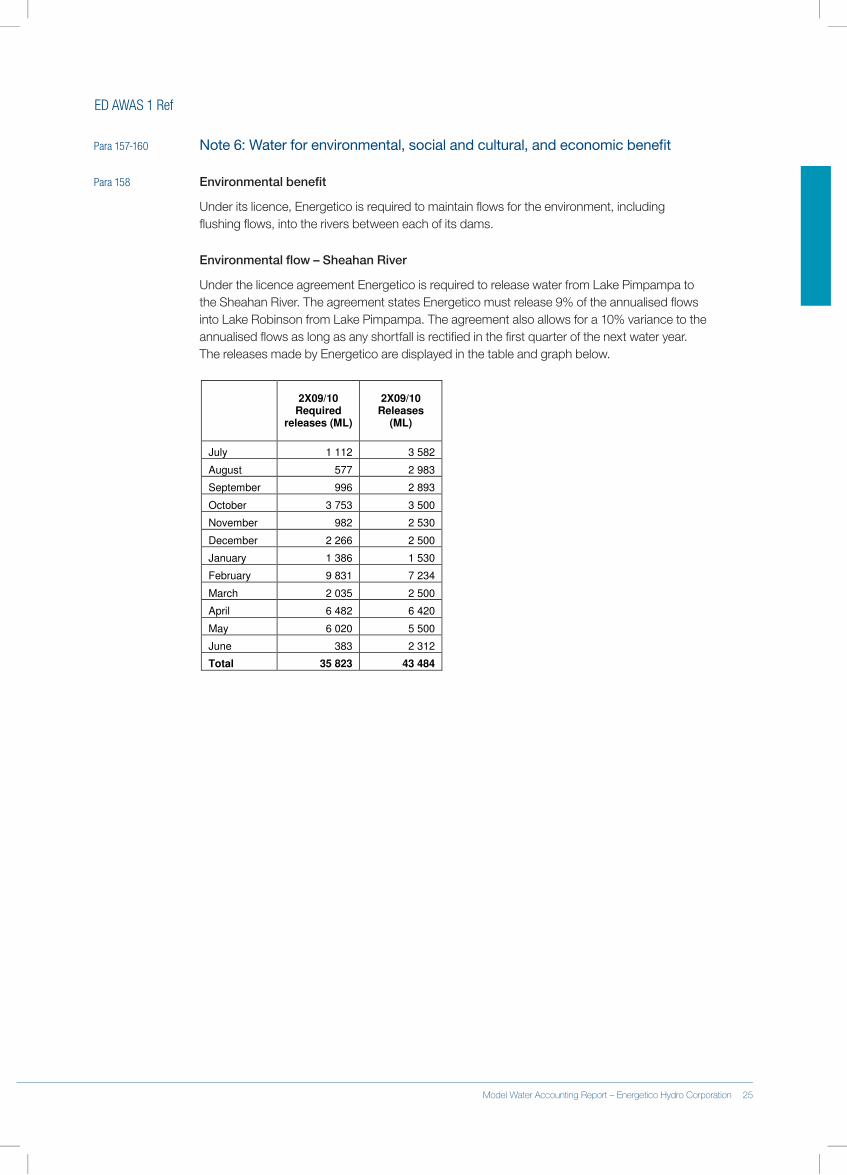
ED AWAS 1 Ref
Para 157-160 Note 6: Water for environmental, social and cultural, and economic benefit
Para 158 Environmental benefit
Under.its.licence,.Energetico.is.required.to.maintain.flows.for.the.environment,.including.flushing.flows,.into.the.rivers.between.each.of.its.dams.
Environmental flow – Sheahan River
Under.the.licence.agreement.Energetico.is.required.to.release.water.from.Lake.Pimpampa.to.the.Sheahan.River..The.agreement.states.Energetico.must.release.9%.of.the.annualised.flows.into.Lake.Robinson.from.Lake.Pimpampa..The.agreement.also.allows.for.a.10%.variance.to.the.annualised.flows.as.long.as.any.shortfall.is.rectified.in.the.first.quarter.of.the.next.water.year..The.releases.made.by.Energetico.are.displayed.in.the.table.and.graph.below.
2X09/10 Required
releases (ML)
2X09/10 Releases
(ML)
July 1 112 3 582
August 577 2 983
September 996 2 893
October 3 753 3 500
November 982 2 530
December 2 266 2 500
January 1 386 1 530
February 9 831 7 234
March 2 035 2 500
April 6 482 6 420
May 6 020 5 500
June 383 2 312
Total 35 823 43 484
24 Energetico Hydro Corporation – Model Water Accounting Report Model Water Accounting Report – Energetico Hydro Corporation 25
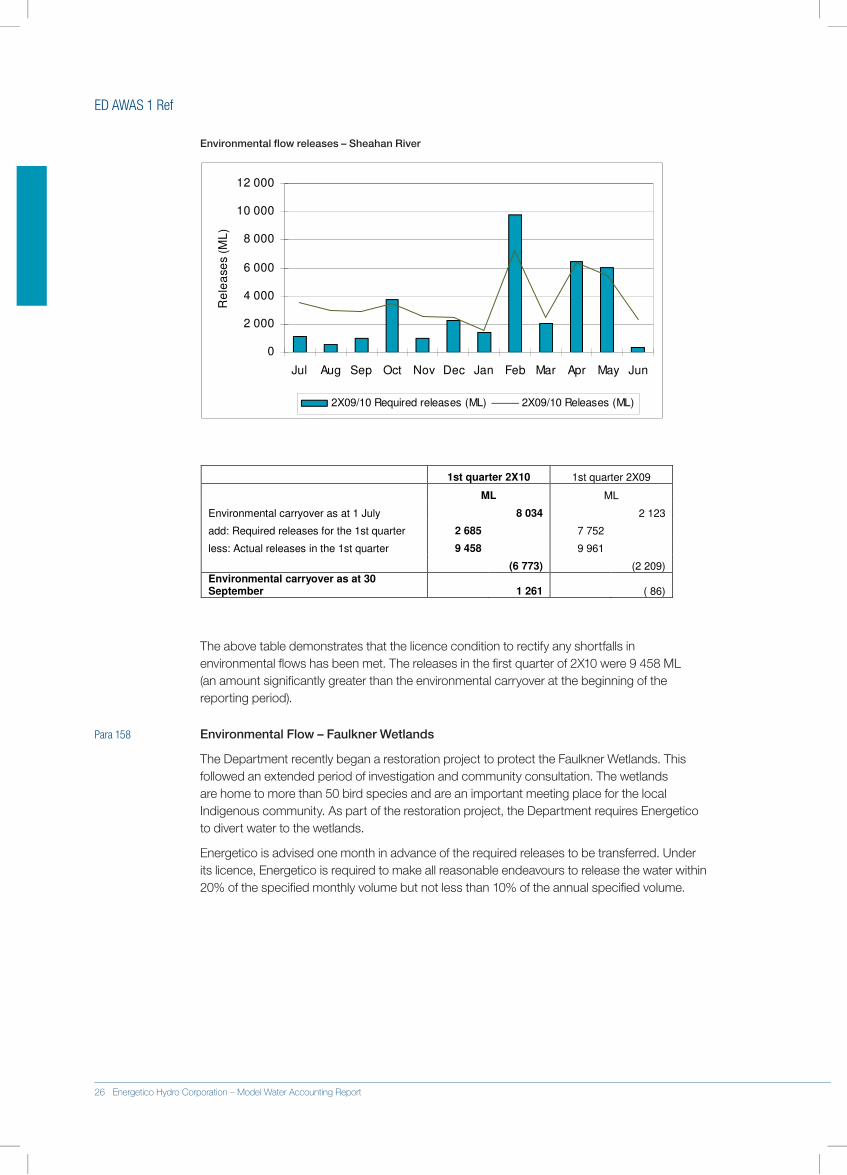
ED AWAS 1 Ref
Environmental flow releases – Sheahan River
0
2 000
4 000
6 000
8 000
10 000
12 000
Jul Aug Sep Oct Nov Dec Jan Feb Mar Apr May Jun
Re
lea
se
s (
ML
)
2X09/10 Required releases (ML) 2X09/10 Releases (ML)
1st quarter 2X10 1st quarter 2X09
ML ML
Environmental carryover as at 1 July 8 034 2 123
add: Required releases for the 1st quarter 2 685 7 752
less: Actual releases in the 1st quarter 9 458 9 961
(6 773) (2 209) Environmental carryover as at 30 September 1 261 ( 86)
The.above.table.demonstrates.that.the.licence.condition.to.rectify.any.shortfalls.in.environmental.flows.has.been.met..The.releases.in.the.first.quarter.of.2X10.were.9.458.ML..(an.amount.significantly.greater.than.the.environmental.carryover.at.the.beginning.of.the.reporting.period).
Para 158 Environmental Flow – Faulkner Wetlands
The.Department.recently.began.a.restoration.project.to.protect.the.Faulkner.Wetlands..This.followed.an.extended.period.of.investigation.and.community.consultation..The.wetlands.are.home.to.more.than.50.bird.species.and.are.an.important.meeting.place.for.the.local.Indigenous.community..As.part.of.the.restoration.project,.the.Department.requires.Energetico.to.divert.water.to.the.wetlands..
Energetico.is.advised.one.month.in.advance.of.the.required.releases.to.be.transferred..Under.its.licence,.Energetico.is.required.to.make.all.reasonable.endeavours.to.release.the.water.within.20%.of.the.specified.monthly.volume.but.not.less.than.10%.of.the.annual.specified.volume.
26 Energetico Hydro Corporation – Model Water Accounting Report
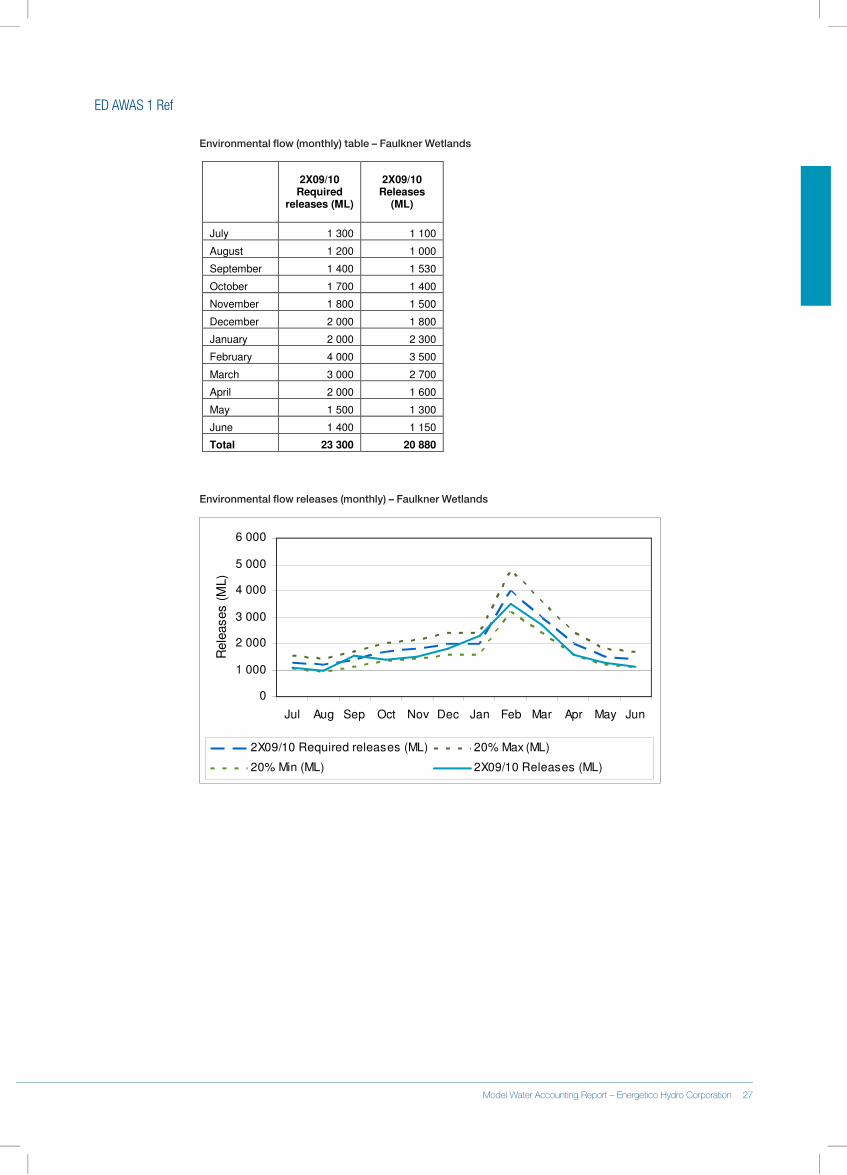
ED AWAS 1 Ref
Environmental flow (monthly) table – Faulkner Wetlands
2X09/10 Required
releases (ML)
2X09/10 Releases
(ML)
July 1 300 1 100
August 1 200 1 000
September 1 400 1 530
October 1 700 1 400
November 1 800 1 500
December 2 000 1 800
January 2 000 2 300
February 4 000 3 500
March 3 000 2 700
April 2 000 1 600
May 1 500 1 300
June 1 400 1 150
Total 23 300 20 880
Environmental flow releases (monthly) – Faulkner Wetlands
0
1 000
2 000
3 000
4 000
5 000
6 000
Jul Aug Sep Oct Nov Dec Jan Feb Mar Apr May Jun
Rele
ases (
ML)
2X09/10 Required releases (ML) 20% Max (ML)
20% Min (ML) 2X09/10 Releases (ML)
26 Energetico Hydro Corporation – Model Water Accounting Report Model Water Accounting Report – Energetico Hydro Corporation 27
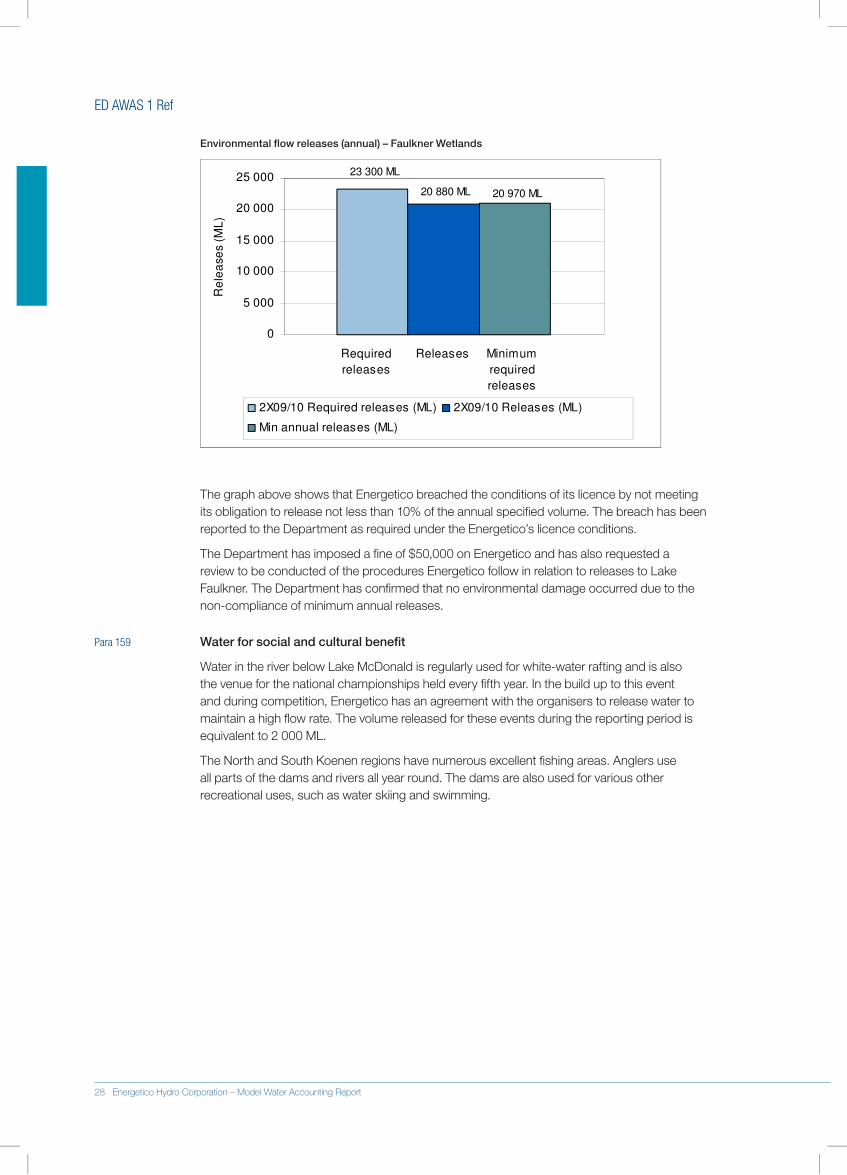
ED AWAS 1 Ref
Environmental flow releases (annual) – Faulkner Wetlands
23 300 ML
20 880 ML 20 970 ML
0
5 000
10 000
15 000
20 000
25 000
Re
lea
se
s (
ML
)
2X09/10 Required releases (ML) 2X09/10 Releases (ML)
Min annual releases (ML)
Required
releases
Releases Minimum
required
releases
The.graph.above.shows.that.Energetico.breached.the.conditions.of.its.licence.by.not.meeting.its.obligation.to.release.not.less.than.10%.of.the.annual.specified.volume..The.breach.has.been.reported.to.the.Department.as.required.under.the.Energetico’s.licence.conditions..
The.Department.has.imposed.a.fine.of.$50,000.on.Energetico.and.has.also.requested.a.review.to.be.conducted.of.the.procedures.Energetico.follow.in.relation.to.releases.to.Lake.Faulkner..The.Department.has.confirmed.that.no.environmental.damage.occurred.due.to.the.non-compliance.of.minimum.annual.releases..
Para 159 Water for social and cultural benefit
Water.in.the.river.below.Lake.McDonald.is.regularly.used.for.white-water.rafting.and.is.also.the.venue.for.the.national.championships.held.every.fifth.year..In.the.build.up.to.this.event.and.during.competition,.Energetico.has.an.agreement.with.the.organisers.to.release.water.to.maintain.a.high.flow.rate..The.volume.released.for.these.events.during.the.reporting.period.is.equivalent.to.2.000.ML.
The.North.and.South.Koenen.regions.have.numerous.excellent.fishing.areas..Anglers.use.all.parts.of.the.dams.and.rivers.all.year.round..The.dams.are.also.used.for.various.other.recreational.uses,.such.as.water.skiing.and.swimming..
28 Energetico Hydro Corporation – Model Water Accounting Report
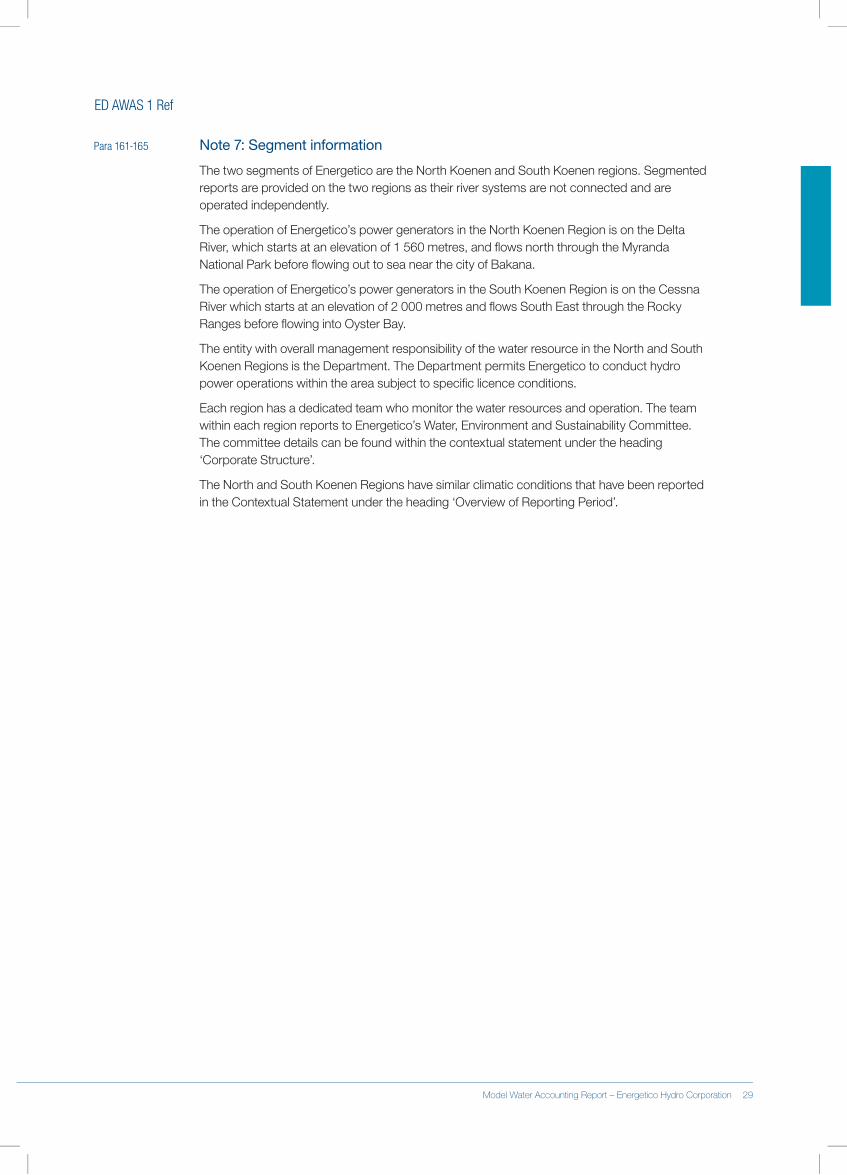
ED AWAS 1 Ref
Para 161-165 Note 7: Segment information
The.two.segments.of.Energetico.are.the.North.Koenen.and.South.Koenen.regions..Segmented.reports.are.provided.on.the.two.regions.as.their.river.systems.are.not.connected.and.are.operated.independently..
The.operation.of.Energetico’s.power.generators.in.the.North.Koenen.Region.is.on.the.Delta.River,.which.starts.at.an.elevation.of.1.560.metres,.and.flows.north.through.the.Myranda.National.Park.before.flowing.out.to.sea.near.the.city.of.Bakana.
The.operation.of.Energetico’s.power.generators.in.the.South.Koenen.Region.is.on.the.Cessna.River.which.starts.at.an.elevation.of.2.000.metres.and.flows.South.East.through.the.Rocky.Ranges.before.flowing.into.Oyster.Bay..
The.entity.with.overall.management.responsibility.of.the.water.resource.in.the.North.and.South.Koenen.Regions.is.the.Department..The.Department.permits.Energetico.to.conduct.hydro.power.operations.within.the.area.subject.to.specific.licence.conditions..
Each.region.has.a.dedicated.team.who.monitor.the.water.resources.and.operation..The.team.within.each.region.reports.to.Energetico’s.Water,.Environment.and.Sustainability.Committee..The.committee.details.can.be.found.within.the.contextual.statement.under.the.heading.‘Corporate.Structure’.
The.North.and.South.Koenen.Regions.have.similar.climatic.conditions.that.have.been.reported.in.the.Contextual.Statement.under.the.heading.‘Overview.of.Reporting.Period’.
28 Energetico Hydro Corporation – Model Water Accounting Report Model Water Accounting Report – Energetico Hydro Corporation 29
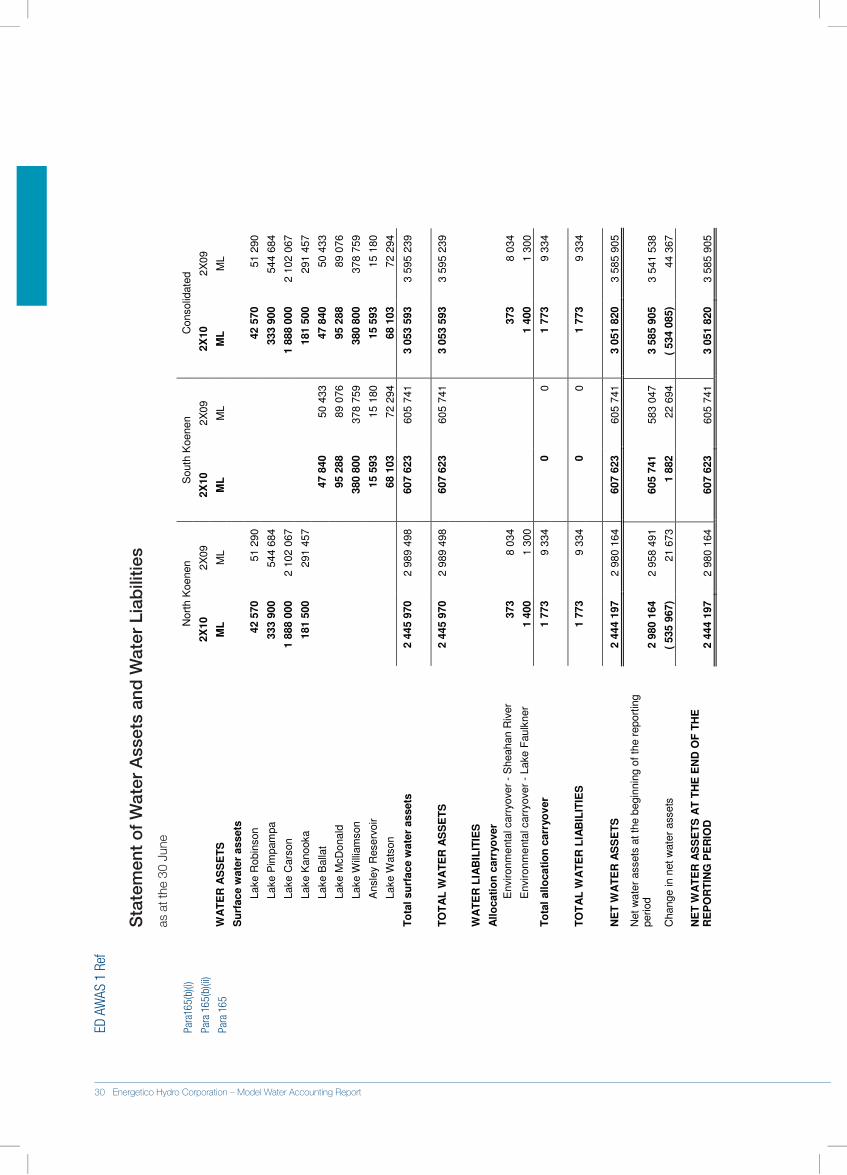
ED A
WAS
1 R
ef
Sta
tem
ent
of
Wat
er A
sset
s an
d W
ater
Lia
bili
ties
as.a
t.the
.30.
June
.
Para
165(
b)(i)
Para
165
(b)(i
i)
Para
165
Nort
h K
oenen
South
Koenen
Consolid
ate
d
2X
10
2X
09
2X
10
2X
09
2X
10
2X
09
WA
TE
R A
SS
ET
S
ML
M
L
ML
M
L
ML
M
L
Su
rface w
ate
r assets
Lake R
obin
son
4
2 5
70
51 2
90
42 5
70
5
1 2
90
Lake P
impam
pa
333 9
00
544 6
84
3
33 9
00
544 6
84
Lake C
ars
on
1 8
88 0
00
2 1
02 0
67
1 8
88 0
00
2 1
02 0
67
Lake K
anooka
1
81 5
00
291 4
57
181 5
00
291 4
57
Lake B
alla
t
4
7 8
40
50 4
33
4
7 8
40
5
0 4
33
Lake M
cD
onald
9
5 2
88
89 0
76
95 2
88
8
9 0
76
Lake W
illia
mson
380 8
00
378 7
59
3
80 8
00
378 7
59
A
nsle
y R
eserv
oir
15 5
93
15 1
80
1
5 5
93
15 1
80
Lake W
ats
on
68 1
03
72 2
94
6
8 1
03
7
2 2
94
To
tal
su
rface w
ate
r assets
2
445 9
70
2 9
89 4
98
607 6
23
605 7
41
3
053 5
93
3 5
95 2
39
TO
TA
L W
AT
ER
AS
SE
TS
2
445 9
70
2 9
89 4
98
6
07 6
23
605 7
41
3
053 5
93
3 5
95 2
39
WA
TE
R L
IAB
ILIT
IES
All
ocati
on
carr
yo
ver
E
nvironm
enta
l carr
yover
- S
heahan R
iver
3
73
8
034
373
8
034
E
nvironm
enta
l carr
yover
- Lake F
aulk
ner
1
400
1 3
00
1 4
00
1 3
00
To
tal
all
ocati
on
carr
yo
ver
1
773
9
334
0
0
1 7
73
9
334
TO
TA
L W
AT
ER
LIA
BIL
ITIE
S
1 7
73
9
334
0
0
1
773
9 3
34
NE
T W
AT
ER
AS
SE
TS
2
444 1
97
2 9
80 1
64
607 6
23
605 7
41
3 0
51 8
20
3 5
85 9
05
Net
wate
r assets
at th
e b
egin
nin
g o
f th
e r
eport
ing
period
2 9
80 1
64
2 9
58 4
91
605 7
41
583 0
47
3 5
85 9
05
3 5
41 5
38
Change in n
et
wate
r assets
(
535 9
67)
21 6
73
1 8
82
22 6
94
( 534 0
85)
4
4 3
67
NE
T W
AT
ER
AS
SE
TS
AT
TH
E E
ND
OF
TH
E
RE
PO
RT
ING
PE
RIO
D
2 4
44 1
97
2 9
80 1
64
607 6
23
605 7
41
3 0
51 8
20
3 5
85 9
05
30 Energetico Hydro Corporation – Model Water Accounting Report
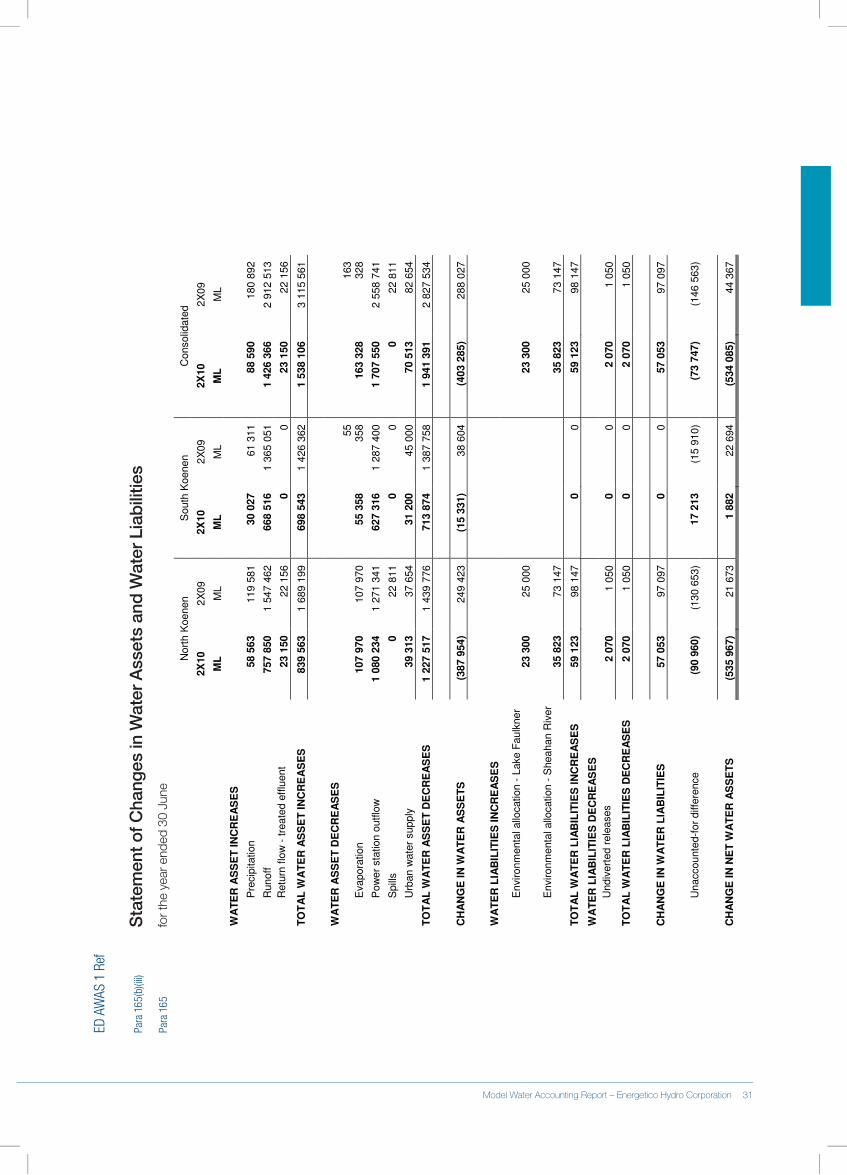
ED A
WAS
1 R
ef
Para
165
(b)(i
ii)
Sta
tem
ent o
f Cha
nges
in W
ater
Ass
ets
and
Wat
er L
iab
ilitie
sPa
ra 1
65
for.t
he.y
ear.e
nded
.30.
June
Nort
h K
oenen
South
Koenen
Consolid
ate
d
2X
10
2X
09
2X
10
2X
09
2X
10
2X
09
ML
M
L
ML
M
L
ML
M
L
WA
TE
R A
SS
ET
IN
CR
EA
SE
S
P
recip
itation
5
8 5
63
119 5
81
30 0
27
6
1 3
11
8
8 5
90
1
80 8
92
R
unoff
757 8
50
1 5
47 4
62
668 5
16
1 3
65 0
51
1
426 3
66
2 9
12 5
13
R
etu
rn f
low
- t
reate
d e
fflu
ent
23 1
50
2
2 1
56
0
0
23 1
50
22 1
56
TO
TA
L W
AT
ER
AS
SE
T I
NC
RE
AS
ES
8
39 5
63
1 6
89 1
99
698 5
43
1 4
26 3
62
1 5
38 1
06
3 1
15 5
61
WA
TE
R A
SS
ET
DE
CR
EA
SE
S
E
vapora
tion
107 9
70
107 9
70
55 3
58
55
358
163 3
28
163
328
P
ow
er
sta
tion o
utflo
w
1 0
80 2
34
1 2
71 3
41
627 3
16
1 2
87 4
00
1 7
07 5
50
2 5
58 7
41
S
pill
s
0
22 8
11
0
0
0
2
2 8
11
U
rban w
ate
r supply
39 3
13
37 6
54
31 2
00
45 0
00
7
0 5
13
82 6
54
TO
TA
L W
AT
ER
AS
SE
T D
EC
RE
AS
ES
1
227 5
17
1 4
39 7
76
713 8
74
1 3
87 7
58
1 9
41 3
91
2 8
27 5
34
CH
AN
GE
IN
WA
TE
R A
SS
ET
S
(387 9
54)
2
49 4
23
(15 3
31)
3
8 6
04
(403 2
85)
2
88 0
27
WA
TE
R L
IAB
ILIT
IES
IN
CR
EA
SE
S
E
nvironm
enta
l allo
cation -
Lake F
aulk
ner
23 3
00
25 0
00
23 3
00
2
5 0
00
E
nvironm
enta
l allo
cation -
Sheahan R
iver
35 8
23
73 1
47
35 8
23
7
3 1
47
TO
TA
L W
AT
ER
LIA
BIL
ITIE
S IN
CR
EA
SE
S
59 1
23
98 1
47
0
0
59 1
23
98 1
47
WA
TE
R L
IAB
ILIT
IES
DE
CR
EA
SE
S
U
ndiv
ert
ed r
ele
ases
2 0
70
1
050
0
0
2 0
70
1 0
50
TO
TA
L W
AT
ER
LIA
BIL
ITIE
S D
EC
RE
AS
ES
2 0
70
1
050
0
0
2 0
70
1
050
CH
AN
GE
IN
WA
TE
R L
IAB
ILIT
IES
5
7 0
53
97 0
97
0
0
57 0
53
97 0
97
U
naccounte
d-f
or
diffe
rence
(90 9
60)
(1
30 6
53)
17 2
13
(15 9
10)
(7
3 7
47)
(1
46 5
63)
CH
AN
GE
IN
NE
T W
AT
ER
AS
SE
TS
(5
35 9
67)
21 6
73
1 8
82
22 6
94
(534 0
85)
4
4 3
67
30 Energetico Hydro Corporation – Model Water Accounting Report Model Water Accounting Report – Energetico Hydro Corporation 31
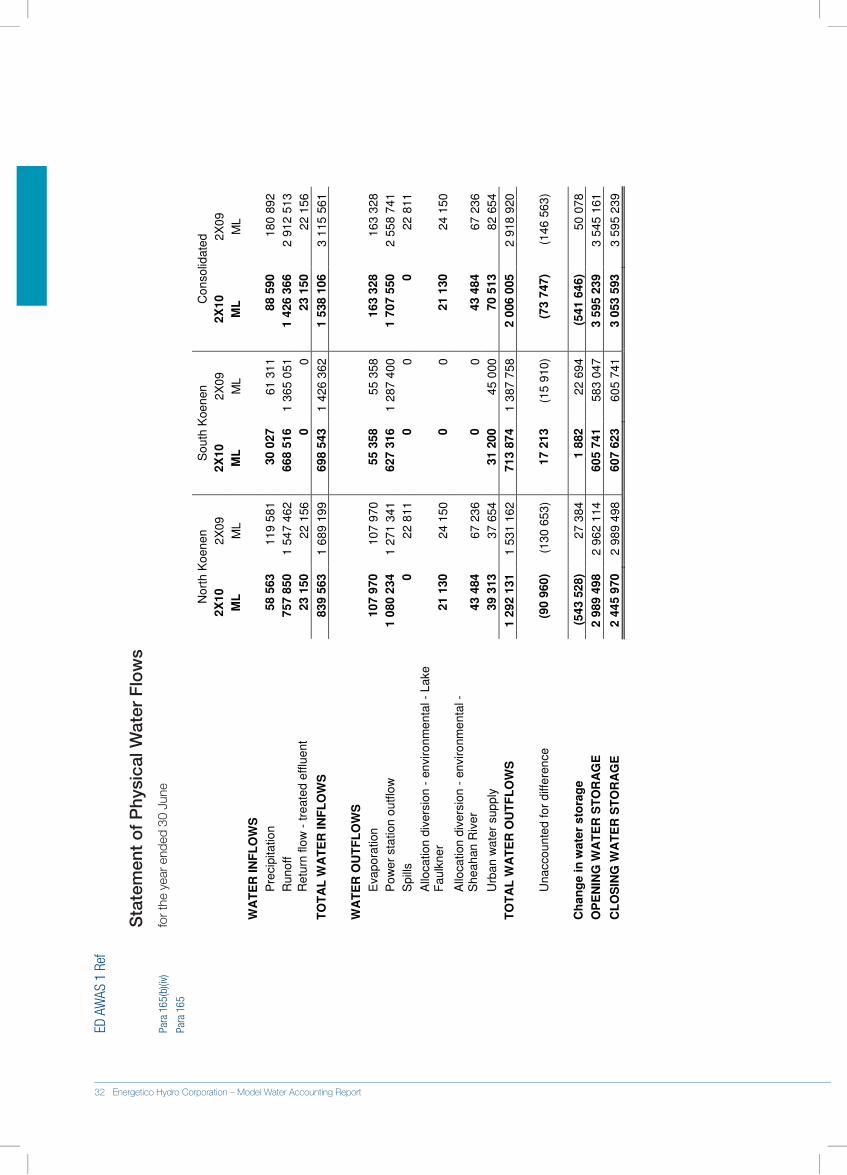
ED A
WAS
1 R
ef
Sta
tem
ent
of
Phy
sica
l Wat
er F
low
sPa
ra 1
65(b
)(iv)
fo
r.the
.yea
r.end
ed.3
0.Ju
ne.
Para
165
No
rth
Ko
en
en
S
ou
th K
oe
nen
C
on
solid
ate
d
2X
10
2
X0
9
2X
10
2
X0
9
2X
10
2
X0
9
ML
M
L
ML
M
L
ML
M
L
WA
TE
R I
NF
LO
WS
P
recip
ita
tio
n
58
563
11
9 5
81
30
027
61
31
1
8
8 5
90
1
80
89
2
R
un
off
75
7 8
50
1
54
7 4
62
6
68
51
6
1 3
65
05
1
1 4
26
36
6
2 9
12 5
13
R
etu
rn flo
w -
tre
ate
d e
fflu
ent
2
3 1
50
2
2 1
56
0
0
2
3 1
50
2
2 1
56
TO
TA
L W
AT
ER
IN
FL
OW
S
8
39
56
3
1 6
89
19
9
6
98
54
3
1 4
26
36
2
1
538
10
6
3
115
56
1
WA
TE
R O
UT
FL
OW
S
E
va
po
ration
10
7 9
70
10
7 9
70
5
5 3
58
55
35
8
1
63
32
8
1
63
32
8
P
ow
er
sta
tion
ou
tflo
w
1 0
80
23
4
1 2
71
34
1
62
7 3
16
1
28
7 4
00
1
70
7 5
50
2 5
58 7
41
S
pill
s
0
22
811
0
0
0
22
811
Allo
ca
tion
div
ers
ion
- e
nvir
onm
en
tal -
Lake
F
au
lkn
er
2
1 1
30
2
4 1
50
0
0
2
1 1
30
24
15
0
Allo
ca
tion
div
ers
ion
- e
nvir
onm
en
tal -
Sh
ea
han
Riv
er
43
484
67
23
6
0
0
43
48
4
6
7 2
36
U
rba
n w
ate
r sup
ply
3
9 3
13
37
65
4
3
1 2
00
4
5 0
00
7
0 5
13
8
2 6
54
TO
TA
L W
AT
ER
OU
TF
LO
WS
1
29
2 1
31
1
53
1 1
62
7
13
87
4
1 3
87
75
8
2
006
005
2 9
18
920
U
na
cco
un
ted
fo
r d
iffe
ren
ce
(9
0 9
60
)
(13
0 6
53
)
1
7 2
13
(1
5 9
10
)
(73
747
)
(14
6 5
63
)
Ch
an
ge
in
wa
ter
sto
rag
e
(54
3 5
28
)
27
38
4
1
882
22
69
4
(54
1 6
46
)
5
0 0
78
OP
EN
ING
WA
TE
R S
TO
RA
GE
2
98
9 4
98
2
96
2 1
14
6
05
74
1
58
3 0
47
3 5
95
23
9
3
545
161
CL
OS
ING
WA
TE
R S
TO
RA
GE
2
44
5 9
70
2 9
89 4
98
60
7 6
23
6
05
74
1
3
053
593
3
59
5 2
39
32 Energetico Hydro Corporation – Model Water Accounting Report
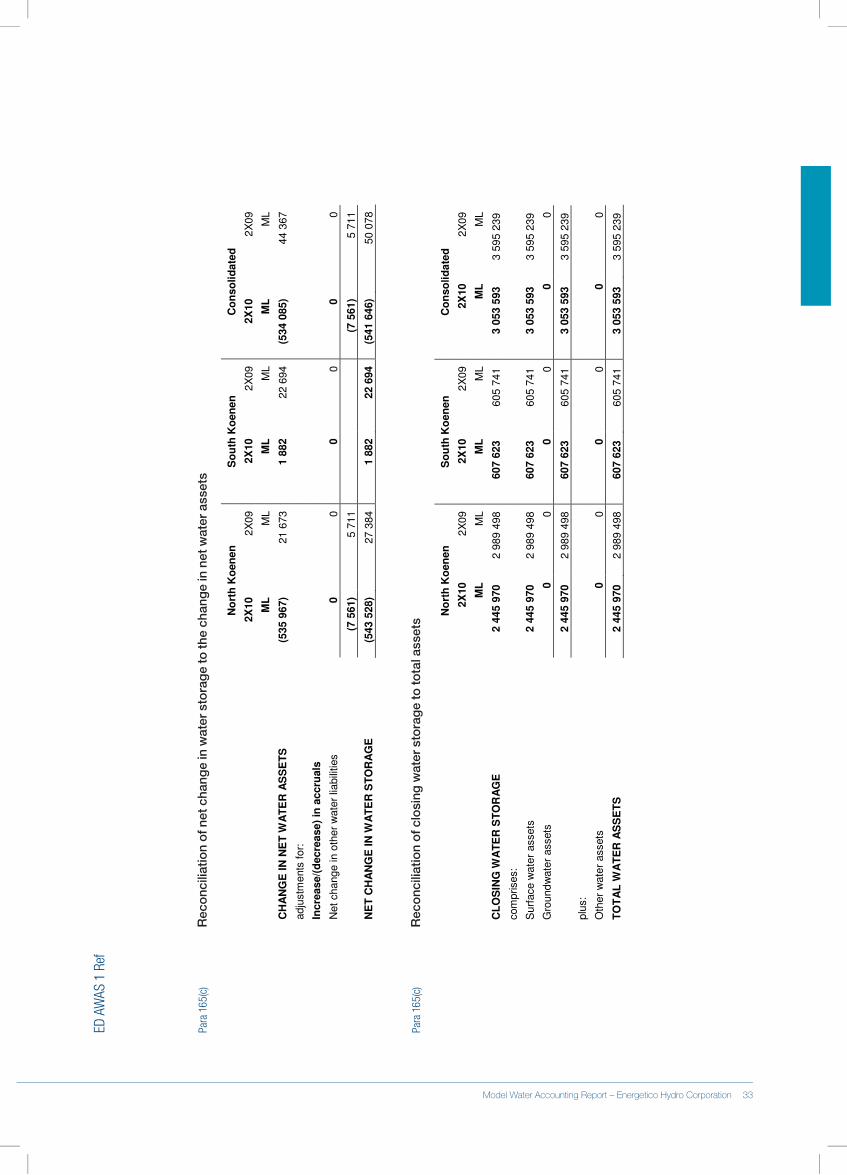
ED A
WAS
1 R
ef
Para
165
(c)
Rec
onc
iliat
ion
of n
et c
hang
e in
wat
er s
tora
ge
to th
e ch
ang
e in
net
wat
er a
sset
s
N
ort
h K
oen
en
S
ou
th K
oen
en
C
on
so
lid
ate
d
2X
10
2X
09
2X
10
2X
09
2X
10
2X
09
M
L
ML
ML
M
L
ML
M
L
CH
AN
GE
IN
NE
T W
AT
ER
AS
SE
TS
(5
35 9
67)
21 6
73
1
882
2
2 6
94
(534 0
85)
44 3
67
adju
stm
ents
for:
Incre
ase/(
decre
ase)
in a
ccru
als
Net
change in o
ther
wate
r lia
bili
ties
0
0
0
0
0
0
(7
561)
5
711
(7 5
61)
5
711
NE
T C
HA
NG
E I
N W
AT
ER
ST
OR
AG
E
(543 5
28)
27 3
84
1
882
22 6
94
(541 6
46)
50 0
78
Para
165
(c)
Rec
onc
iliat
ion
of c
losi
ng w
ater
sto
rag
e to
tota
l ass
ets
N
ort
h K
oen
en
S
ou
th K
oen
en
C
on
so
lid
ate
d
2X
10
2X
09
2X
10
2X
09
2X
10
2X
09
M
L
ML
ML
M
L
ML
M
L
CL
OS
ING
WA
TE
R S
TO
RA
GE
2 4
45 9
70
2
989 4
98
607 6
23
605 7
41
3 0
53 5
93
3
595 2
39
com
prises:
Surf
ace w
ate
r assets
2 4
45 9
70
2
989 4
98
607 6
23
605 7
41
3 0
53 5
93
3
595 2
39
Gro
und
wate
r assets
0
0
0
0
0
0
2 4
45 9
70
2
989 4
98
607 6
23
605 7
41
3 0
53 5
93
3
595 2
39
plu
s:
Oth
er
wate
r assets
0
0
0
0
0
0
TO
TA
L W
AT
ER
AS
SE
TS
2 4
45 9
70
2
989 4
98
607 6
23
605 7
41
3 0
53 5
93
3
595 2
39
32 Energetico Hydro Corporation – Model Water Accounting Report Model Water Accounting Report – Energetico Hydro Corporation 33
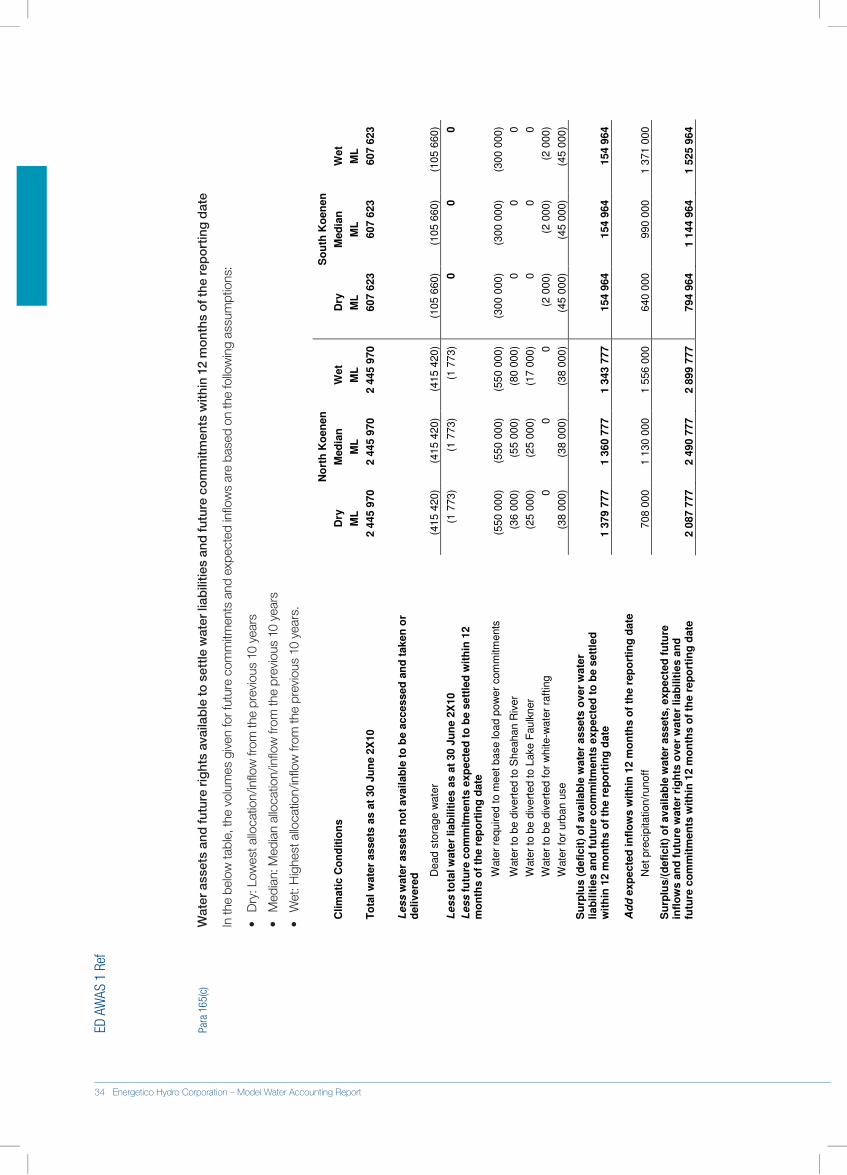
ED A
WAS
1 R
ef
Para
165
(c)
Wat
er a
sset
s an
d fu
ture
rig
hts
avai
lab
le to
set
tle w
ater
liab
ilitie
s an
d fu
ture
co
mm
itmen
ts w
ithin
12
mo
nths
of t
he r
epo
rtin
g d
ate
In.th
e.be
low
.tabl
e,.th
e.vo
lum
es.g
iven
.for.f
utur
e.co
mm
itmen
ts.a
nd.e
xpec
ted.
inflo
ws.
are.
base
d.on
.the.
follo
win
g.as
sum
ptio
ns:
•.D
ry:.L
owes
t.allo
catio
n/in
flow
.from
.the.
prev
ious
.10.
year
s
•.M
edia
n:.M
edia
n.al
loca
tion/
inflo
w.fr
om.th
e.pr
evio
us.1
0.ye
ars
•.W
et:.H
ighe
st.a
lloca
tion/
inflo
w.fr
om.th
e.pr
evio
us.1
0.ye
ars.
No
rth
Ko
en
en
S
ou
th K
oen
en
Clim
ati
c C
on
dit
ion
s
D
ry
Med
ian
W
et
Dry
M
ed
ian
W
et
ML
M
L
ML
M
L
ML
M
L
To
tal
wate
r assets
as a
t 30 J
un
e 2
X10
2 4
45 9
70
2
445 9
70
2
445 9
70
607 6
23
607 6
23
607 6
23
Less w
ate
r assets
no
t avail
ab
le t
o b
e a
ccessed
an
d t
aken
or
deli
vere
d
Dead s
tora
ge w
ate
r
(415 4
20)
(415 4
20)
(415 4
20)
(105 6
60)
(105 6
60)
(105 6
60)
Less t
ota
l w
ate
r liab
ilit
ies a
s a
t 30 J
un
e 2
X10
(1 7
73)
(1 7
73)
(1 7
73)
0
0
0
Less f
utu
re c
om
mit
men
ts e
xp
ecte
d t
o b
e s
ett
led
wit
hin
12
mo
nth
s o
f th
e r
ep
ort
ing
date
Wate
r re
quired t
o m
eet base load p
ow
er
com
mitm
ents
(550 0
00)
(550 0
00)
(550 0
00)
(300 0
00)
(300 0
00)
(300 0
00)
Wate
r to
be d
ivert
ed to S
heahan R
iver
(3
6 0
00)
(55 0
00)
(80 0
00)
0
0
0
Wate
r to
be d
ivert
ed to L
ake F
aulk
ner
(2
5 0
00)
(25 0
00)
(17 0
00)
0
0
0
Wate
r to
be d
ivert
ed for
white-w
ate
r ra
ftin
g
0
0
0
(2 0
00)
(2 0
00)
(2 0
00)
Wate
r fo
r urb
an u
se
(3
8 0
00)
(38 0
00)
(38 0
00)
(45 0
00)
(45 0
00)
(45 0
00)
Su
rplu
s (
defi
cit
) o
f avail
ab
le w
ate
r assets
over
wate
r li
ab
ilit
ies a
nd
fu
ture
co
mm
itm
en
ts e
xp
ecte
d t
o b
e s
ett
led
w
ith
in 1
2 m
on
ths o
f th
e r
ep
ort
ing
date
1
379 7
77
1
360 7
77
1
343 7
77
154 9
64
154 9
64
154 9
64
Ad
d e
xp
ecte
d in
flo
ws w
ith
in 1
2 m
on
ths o
f th
e r
ep
ort
ing
date
Net
pre
cip
itation/r
unoff
708 0
00
1
130 0
00
1
556 0
00
640 0
00
990 0
00
1
371 0
00
Su
rplu
s/(
defi
cit
) o
f avail
ab
le w
ate
r assets
, exp
ecte
d f
utu
re
infl
ow
s a
nd
fu
ture
wate
r ri
gh
ts o
ver
wate
r liab
ilit
ies a
nd
fu
ture
co
mm
itm
en
ts w
ith
in 1
2 m
on
ths o
f th
e r
ep
ort
ing
date
2
087 7
77
2
490 7
77
2
899 7
77
794 9
64
1
144 9
64
1
525 9
64
34 Energetico Hydro Corporation – Model Water Accounting Report
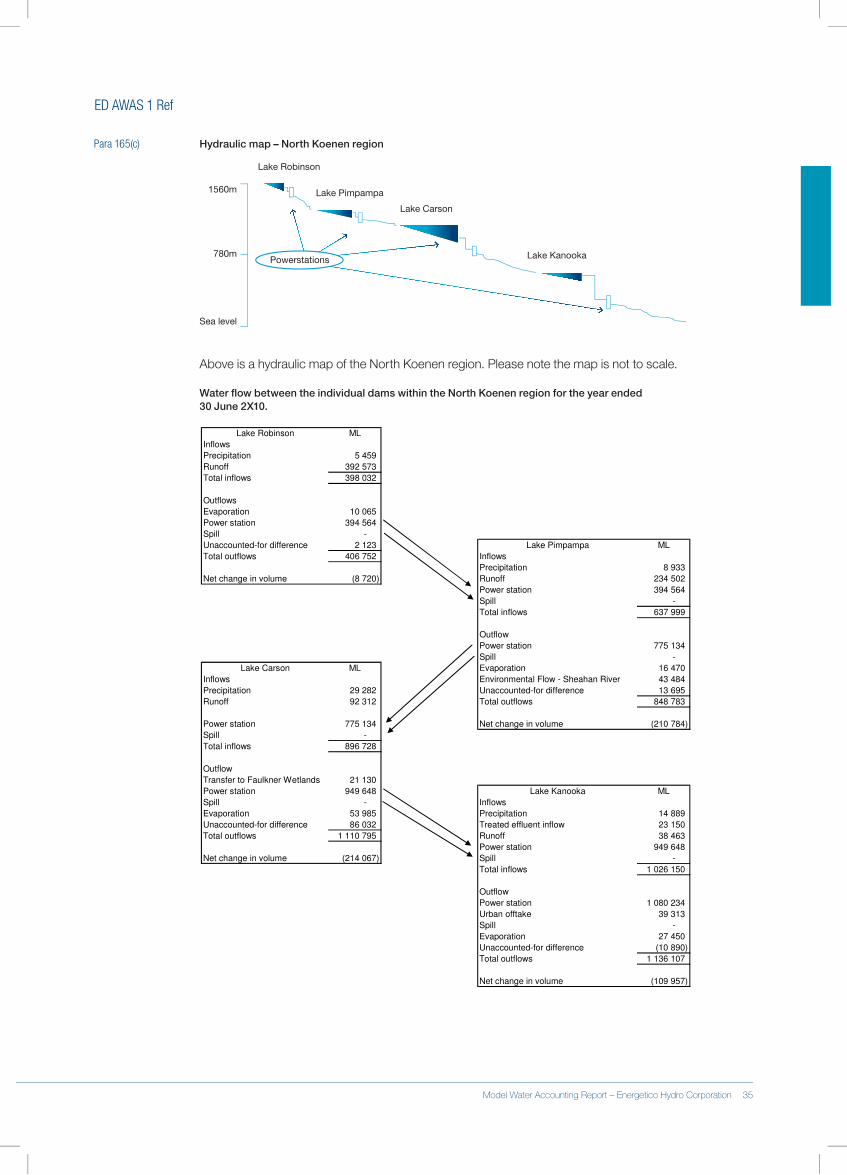
ED AWAS 1 Ref
Para 165(c) Hydraulic map – North Koenen region
Lake Robinson
Lake Pimpampa
Lake Carson
Lake Kanooka
Sea level
780m
1560m
Powerstations
Above.is.a.hydraulic.map.of.the.North.Koenen.region..Please.note.the.map.is.not.to.scale.
Water flow between the individual dams within the North Koenen region for the year ended 30 June 2X10.
Lake Robinson ML
Inflows
Precipitation 5 459
Runoff 392 573
Total inflows 398 032
Outflows
Evaporation 10 065
Power station 394 564
Spill -
Unaccounted-for difference 2 123 Lake Pimpampa ML
Total outflows 406 752 Inflows
Precipitation 8 933
Net change in volume (8 720) Runoff 234 502
Power station 394 564
Spill -
Total inflows 637 999
Outflow
Power station 775 134
Spill -
Lake Carson ML Evaporation 16 470
Inflows Environmental Flow - Sheahan River 43 484
Precipitation 29 282 Unaccounted-for difference 13 695
Runoff 92 312 Total outflows 848 783
Power station 775 134 Net change in volume (210 784)
Spill -
Total inflows 896 728
Outflow
Transfer to Faulkner Wetlands 21 130
Power station 949 648 Lake Kanooka ML
Spill - Inflows
Evaporation 53 985 Precipitation 14 889
Unaccounted-for difference 86 032 Treated effluent inflow 23 150
Total outflows 1 110 795 Runoff 38 463
Power station 949 648
Net change in volume (214 067) Spill -
Total inflows 1 026 150
Outflow
Power station 1 080 234
Urban offtake 39 313
Spill -
Evaporation 27 450
Unaccounted-for difference (10 890)
Total outflows 1 136 107
Net change in volume (109 957)
34 Energetico Hydro Corporation – Model Water Accounting Report Model Water Accounting Report – Energetico Hydro Corporation 35
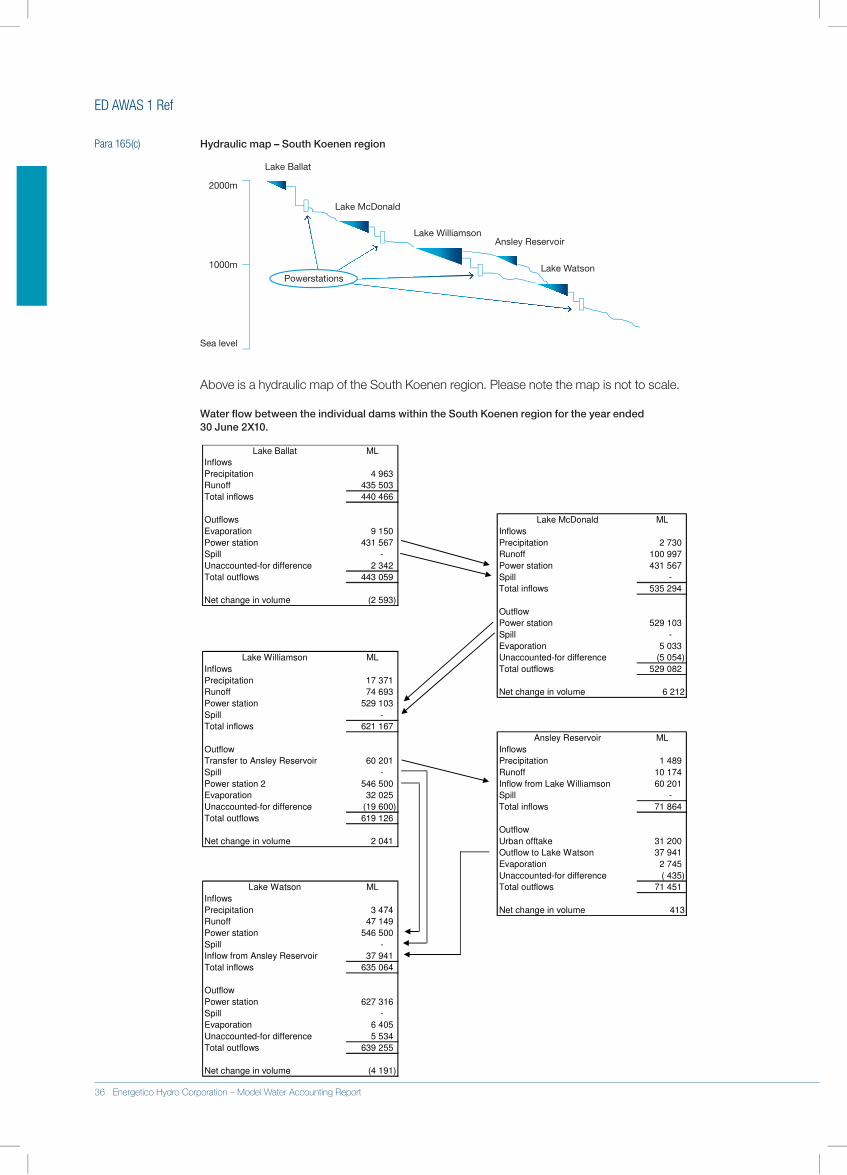
ED AWAS 1 Ref
Para 165(c) Hydraulic map – South Koenen region
Lake Ballat
Lake McDonald
Lake WilliamsonAnsley Reservoir
Sea level
1000m
2000m
PowerstationsLake Watson
Above.is.a.hydraulic.map.of.the.South.Koenen.region..Please.note.the.map.is.not.to.scale.
Water flow between the individual dams within the South Koenen region for the year ended 30 June 2X10.
Lake Ballat ML
Inflows
Precipitation 4 963
Runoff 435 503
Total inflows 440 466
Outflows Lake McDonald ML
Evaporation 9 150 Inflows
Power station 431 567 Precipitation 2 730
Spill - Runoff 100 997
Unaccounted-for difference 2 342 Power station 431 567
Total outflows 443 059 Spill -
Total inflows 535 294
Net change in volume (2 593)
Outflow
Power station 529 103
Spill -
Evaporation 5 033
Lake Williamson ML Unaccounted-for difference (5 054)
Inflows Total outflows 529 082
Precipitation 17 371
Runoff 74 693 Net change in volume 6 212
Power station 529 103
Spill -
Total inflows 621 167
Ansley Reservoir ML
Outflow Inflows
Transfer to Ansley Reservoir 60 201 Precipitation 1 489
Spill - Runoff 10 174
Power station 2 546 500 Inflow from Lake Williamson 60 201
Evaporation 32 025 Spill -
Unaccounted-for difference (19 600) Total inflows 71 864
Total outflows 619 126
Outflow
Net change in volume 2 041 Urban offtake 31 200
Outflow to Lake Watson 37 941
Evaporation 2 745
Unaccounted-for difference ( 435)
Lake Watson ML Total outflows 71 451
Inflows
Precipitation 3 474 Net change in volume 413
Runoff 47 149
Power station 546 500
Spill -
Inflow from Ansley Reservoir 37 941
Total inflows 635 064
Outflow
Power station 627 316
Spill -
Evaporation 6 405
Unaccounted-for difference 5 534
Total outflows 639 255
Net change in volume (4 191)
36 Energetico Hydro Corporation – Model Water Accounting Report
Model Water Accounting Report
Terra Firma Water Supply System
General Purpose Water Accounting Report30 June 2X10
Prepared by Terra Firma Corporation An illustration of an Australian general purpose water accounting report for a fictitious water report entity

Contents
Glossary..................................................................................................................................................2
Contextual Statement.........................................................................................................................3Physical information.............................................................................................................................3
Administrative Information...................................................................................................................5
Overview of Reporting Period..............................................................................................................6
Accountability Statement...................................................................................................................9
Assurance Statement....................................................................................................................... 10
Statement of Water Assets and Water Liabilities...................................................................... 11
Statement of Changes in Water Assets and Water Liabilities.............................................. 12
Statement of Physical Water Flows.............................................................................................. 14
Note disclosures................................................................................................................................. 16
Note 1: Significant water accounting policies................................................................................... 16
Note 2: Information supporting the items presented in the water accounting statements............. 17
Note 3: Quantification information.....................................................................................................23
Note 4: Reconciliations...................................................................................................................... 24
Note 5: Future prospects...................................................................................................................25
Note 6: Water rights, water allocations and water restrictions.........................................................27
Note 7: Water market activity.............................................................................................................29
Note 8: Water for environmental, social and cultural, and economic benefit..................................30
Model Water Accounting Report – Terra Firma Water Supply System 1
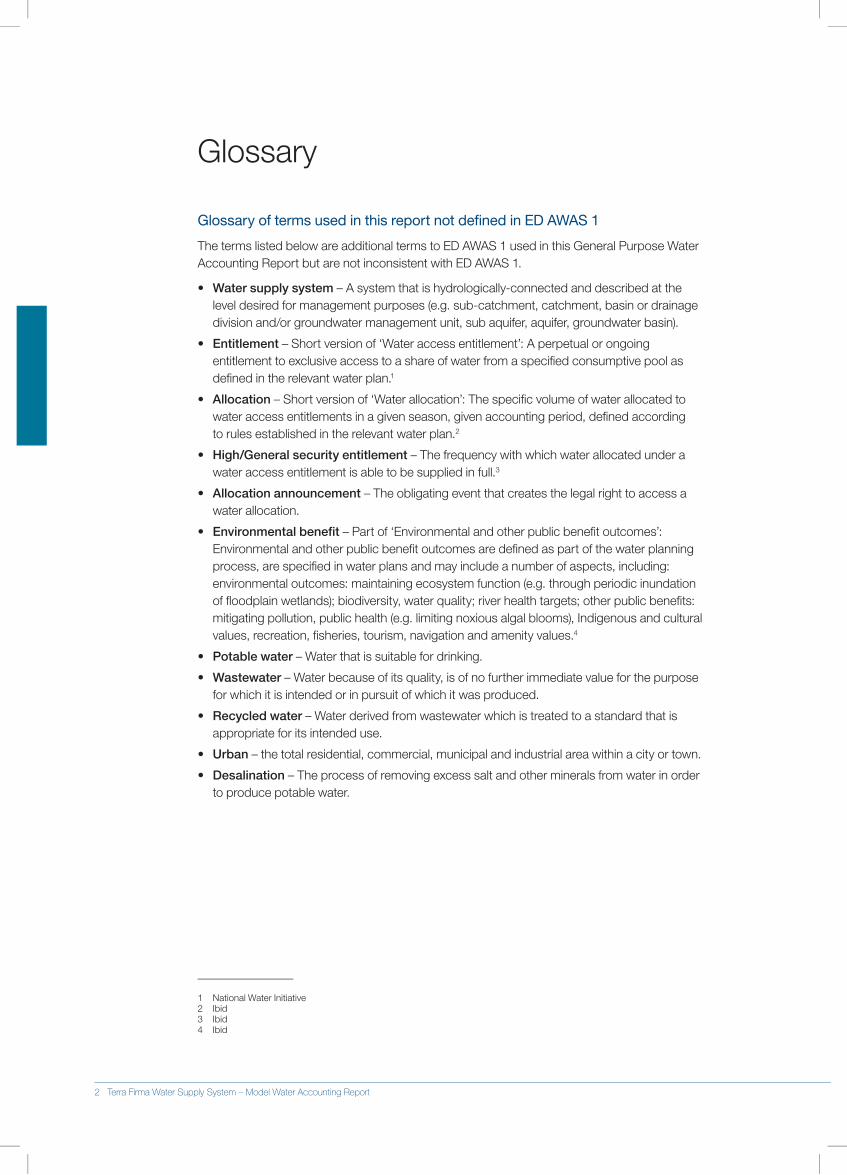
Glossary of terms used in this report not defined in ED AWAS 1
The.terms.listed.below.are.additional.terms.to.ED.AWAS.1.used.in.this.General.Purpose.Water.Accounting.Report.but.are.not.inconsistent.with.ED.AWAS.1..
•. Water supply system.–.A.system.that.is.hydrologically-connected.and.described.at.the.level.desired.for.management.purposes.(e.g..sub-catchment,.catchment,.basin.or.drainage.division.and/or.groundwater.management.unit,.sub.aquifer,.aquifer,.groundwater.basin).
•. Entitlement.–.Short.version.of.‘Water.access.entitlement’:.A.perpetual.or.ongoing.entitlement.to.exclusive.access.to.a.share.of.water.from.a.specified.consumptive.pool.as.defined.in.the.relevant.water plan.1.
•. Allocation.–.Short.version.of.‘Water.allocation’:.The.specific.volume.of.water.allocated.to.water.access.entitlements.in.a.given.season,.given.accounting.period,.defined.according..to.rules.established.in.the.relevant.water.plan.2.
•. High/General security entitlement.–.The.frequency.with.which.water.allocated.under.a.water.access.entitlement.is.able.to.be.supplied.in.full.3.
•. Allocation announcement.–.The.obligating.event.that.creates.the.legal.right.to.access.a.water allocation.
•. Environmental benefit.–.Part.of.‘Environmental.and.other.public.benefit.outcomes’:.Environmental.and.other.public.benefit.outcomes.are.defined.as.part.of.the.water.planning.process,.are.specified.in.water.plans.and.may.include.a.number.of.aspects,.including:.environmental.outcomes:.maintaining.ecosystem.function.(e.g..through.periodic.inundation.of.floodplain.wetlands);.biodiversity,.water.quality;.river.health.targets;.other.public.benefits:.mitigating.pollution,.public.health.(e.g..limiting.noxious.algal.blooms),.Indigenous.and.cultural.values,.recreation,.fisheries,.tourism,.navigation.and.amenity.values.4.
•. Potable water –.Water.that.is.suitable.for.drinking.
•. Wastewater.–.Water.because.of.its.quality,.is.of.no.further.immediate.value.for.the.purpose.for.which.it.is.intended.or.in.pursuit.of.which.it.was.produced.
•. Recycled water.–.Water.derived.from.wastewater.which.is.treated.to.a.standard.that.is.appropriate.for.its.intended.use.
•. Urban.–.the.total.residential,.commercial,.municipal.and.industrial.area.within.a.city.or.town.
•. Desalination.–.The.process.of.removing.excess.salt.and.other.minerals.from.water.in.order.to.produce.potable.water.
1. National.Water.Initiative2. Ibid3. Ibid4. Ibid
Glossary
2 Terra Firma Water Supply System – Model Water Accounting Report
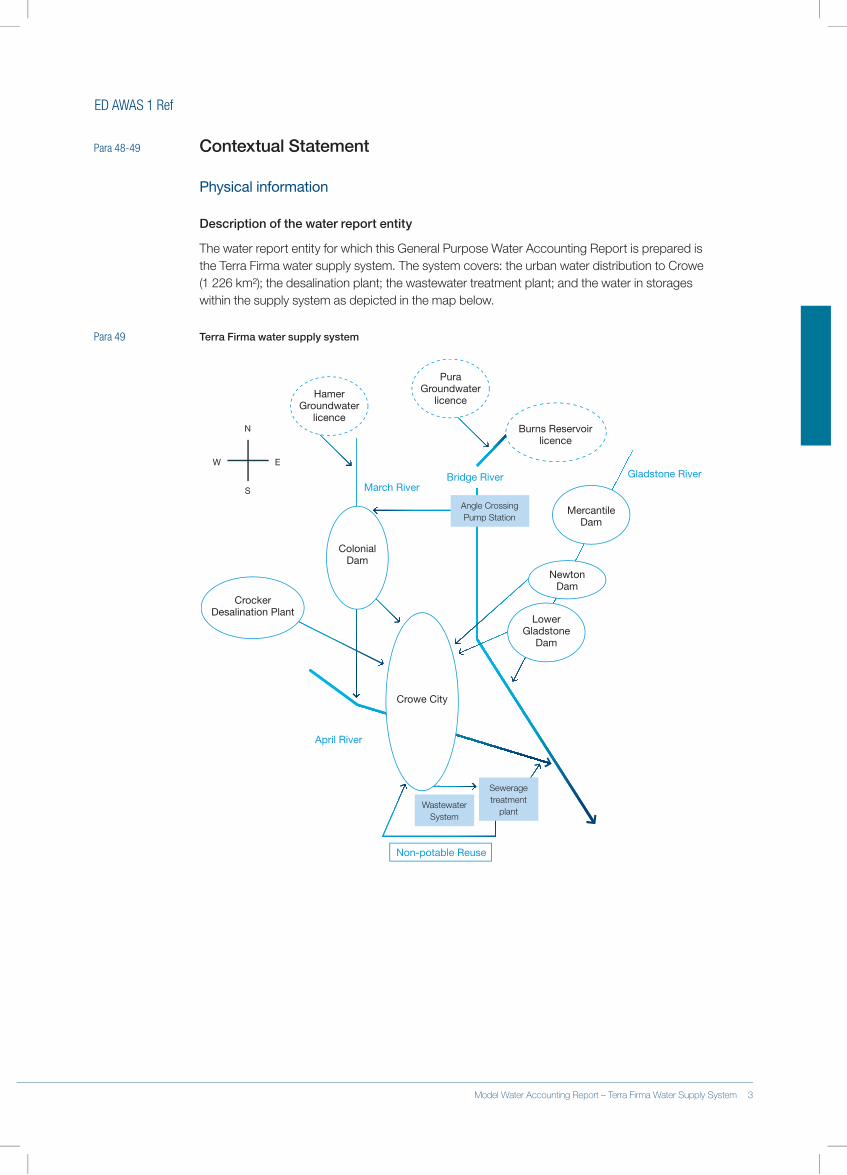
ED AWAS 1 Ref
Para 48-49 Contextual Statement
Physical information
Description of the water report entity
The.water.report.entity.for.which.this.General.Purpose.Water.Accounting.Report.is.prepared.is.the.Terra.Firma.water.supply.system..The.system.covers:.the.urban.water.distribution.to.Crowe.(1.226.km²);.the.desalination.plant;.the.wastewater.treatment.plant;.and.the.water.in.storages.within.the.supply.system.as.depicted.in.the.map.below.
Para 49 Terra Firma water supply system
HamerGroundwater
licence
PuraGroundwater
licence
ColonialDam
CrockerDesalination Plant
MercantileDam
March RiverBridge River Gladstone River
April River
WastewaterSystem
Seweragetreatment
plant
Non-potable Reuse
NewtonDam
LowerGladstone
Dam
Angle CrossingPump Station
N
S
W E
Crowe City
Burns Reservoirlicence
2 Terra Firma Water Supply System – Model Water Accounting Report Model Water Accounting Report – Terra Firma Water Supply System 3
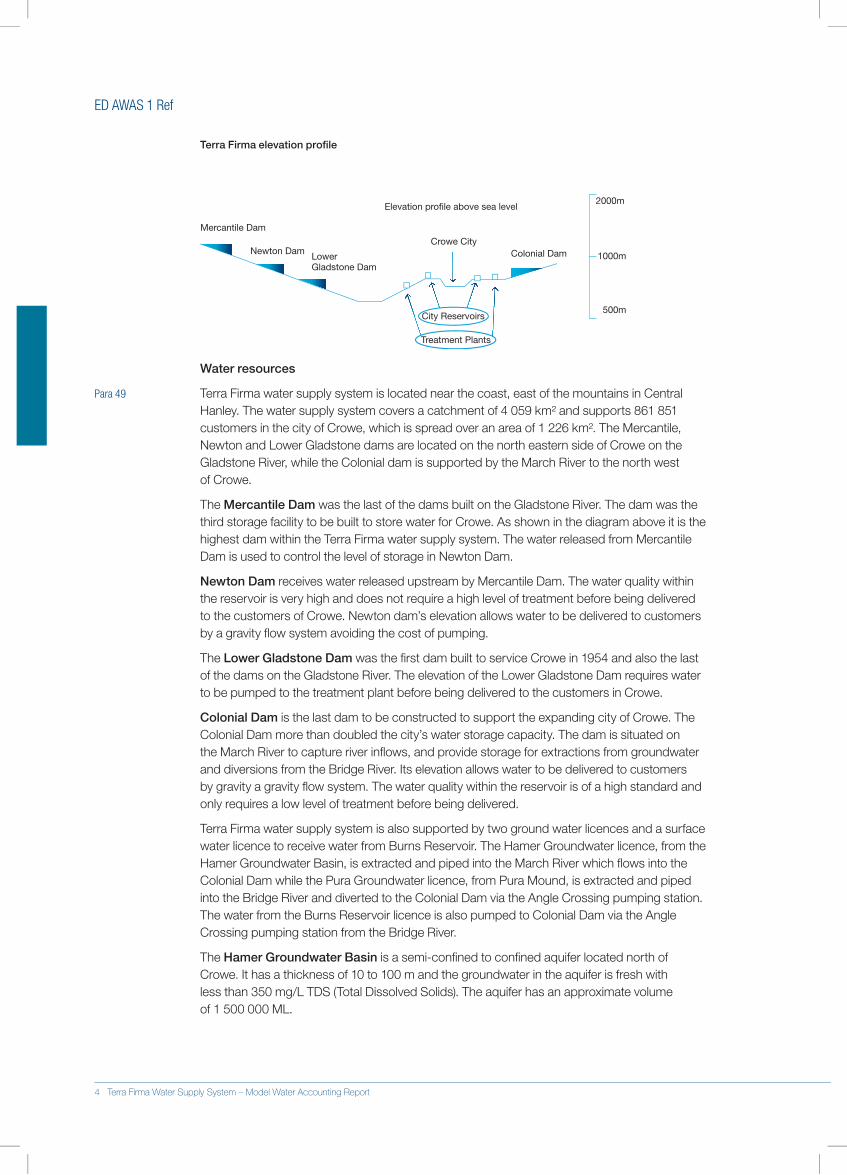
ED AWAS 1 Ref
Terra Firma elevation profile
1000m
500m
2000m
Treatment Plants
Mercantile Dam
Newton DamLowerGladstone Dam
Crowe City
City Reservoirs
Colonial Dam
Elevation profile above sea level
Water resources
Para 49 Terra.Firma.water.supply.system.is.located.near.the.coast,.east.of.the.mountains.in.Central.Hanley..The.water.supply.system.covers.a.catchment.of.4.059.km².and.supports.861.851.customers.in.the.city.of.Crowe,.which.is.spread.over.an.area.of.1.226.km²..The.Mercantile,.Newton.and.Lower.Gladstone.dams.are.located.on.the.north.eastern.side.of.Crowe.on.the.Gladstone.River,.while.the.Colonial.dam.is.supported.by.the.March.River.to.the.north.west..of.Crowe.
The.Mercantile Dam.was.the.last.of.the.dams.built.on.the.Gladstone.River..The.dam.was.the.third.storage.facility.to.be.built.to.store.water.for.Crowe..As.shown.in.the.diagram.above.it.is.the.highest.dam.within.the.Terra.Firma.water.supply.system..The.water.released.from.Mercantile.Dam.is.used.to.control.the.level.of.storage.in.Newton.Dam.
Newton Dam.receives.water.released.upstream.by.Mercantile.Dam..The.water.quality.within.the.reservoir.is.very.high.and.does.not.require.a.high.level.of.treatment.before.being.delivered.to.the.customers.of.Crowe..Newton.dam’s.elevation.allows.water.to.be.delivered.to.customers.by.a.gravity.flow.system.avoiding.the.cost.of.pumping..
The.Lower Gladstone Dam.was.the.first.dam.built.to.service.Crowe.in.1954.and.also.the.last.of.the.dams.on.the.Gladstone.River..The.elevation.of.the.Lower.Gladstone.Dam.requires.water.to.be.pumped.to.the.treatment.plant.before.being.delivered.to.the.customers.in.Crowe.
Colonial Dam.is.the.last.dam.to.be.constructed.to.support.the.expanding.city.of.Crowe..The.Colonial.Dam.more.than.doubled.the.city’s.water.storage.capacity..The.dam.is.situated.on.the.March.River.to.capture.river.inflows,.and.provide.storage.for.extractions.from.groundwater.and.diversions.from.the.Bridge.River..Its.elevation.allows.water.to.be.delivered.to.customers.by.gravity.a.gravity.flow.system..The water.quality.within.the.reservoir.is.of.a.high.standard.and.only.requires.a.low.level.of.treatment.before.being.delivered.
Terra.Firma.water.supply.system.is.also.supported.by.two.ground.water.licences.and.a.surface.water.licence.to.receive.water.from.Burns.Reservoir..The.Hamer.Groundwater.licence,.from.the.Hamer.Groundwater.Basin,.is.extracted.and.piped.into.the.March.River.which.flows.into.the.Colonial.Dam.while.the.Pura.Groundwater.licence,.from.Pura.Mound,.is.extracted.and.piped.into.the.Bridge.River.and.diverted.to.the.Colonial.Dam.via.the.Angle.Crossing.pumping.station..The.water.from.the.Burns.Reservoir.licence.is.also.pumped.to.Colonial.Dam.via.the.Angle.Crossing.pumping.station.from.the.Bridge.River..
The.Hamer Groundwater Basin.is.a.semi-confined.to.confined.aquifer.located.north.of.Crowe..It.has.a.thickness.of.10.to.100.m.and.the.groundwater.in.the.aquifer.is.fresh.with..less.than.350.mg/L.TDS.(Total.Dissolved.Solids)..The.aquifer.has.an.approximate.volume..of.1.500.000.ML.
4 Terra Firma Water Supply System – Model Water Accounting Report
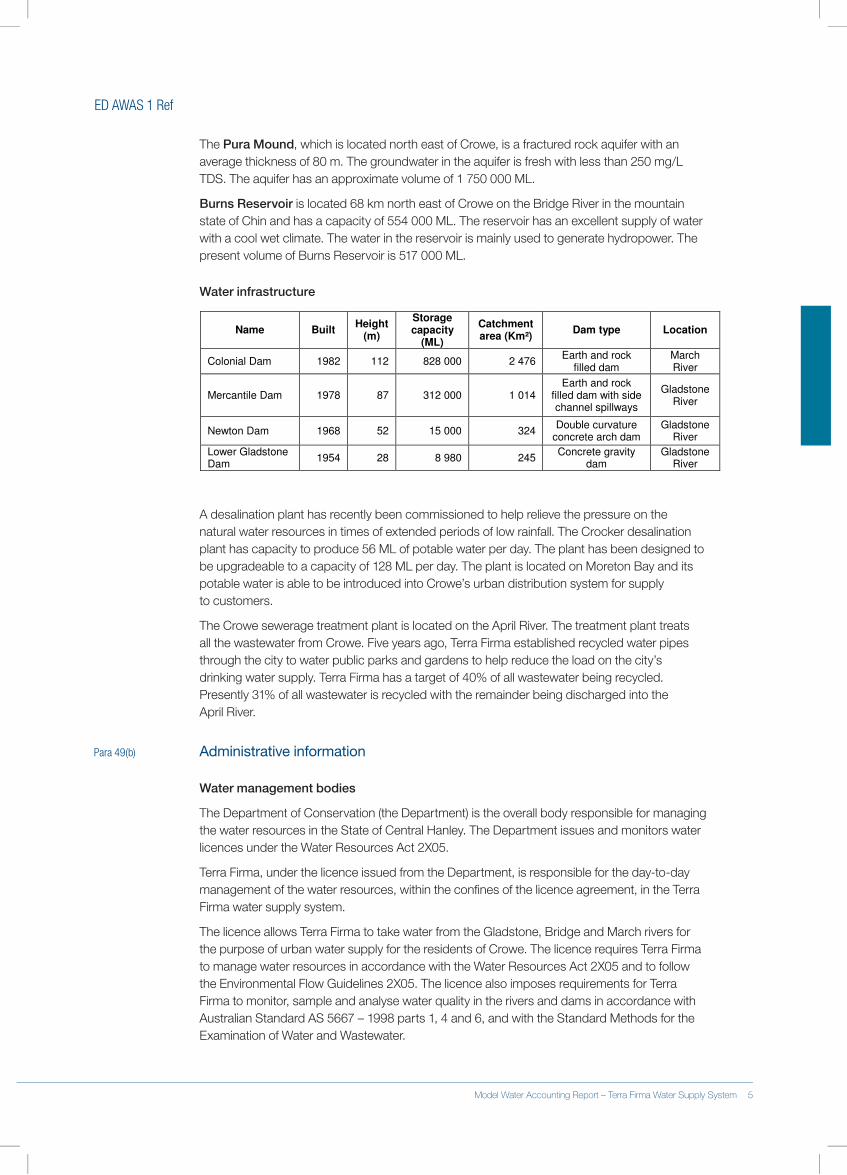
ED AWAS 1 Ref
The.Pura Mound,.which.is.located.north.east.of.Crowe,.is.a.fractured.rock.aquifer.with.an.average.thickness.of.80.m..The.groundwater.in.the.aquifer.is.fresh.with.less.than.250.mg/L.TDS..The.aquifer.has.an.approximate.volume.of.1.750.000.ML.
Burns Reservoir.is.located.68.km.north.east.of.Crowe.on.the.Bridge.River.in.the.mountain.state.of.Chin.and.has.a.capacity.of.554.000.ML..The.reservoir.has.an.excellent.supply.of.water.with.a.cool.wet.climate..The.water.in.the.reservoir.is.mainly.used.to.generate.hydropower..The.present.volume.of.Burns.Reservoir.is.517.000.ML.
Water infrastructure
Name Built Height
(m)
Storage capacity
(ML)
Catchment area (Km²)
Dam type Location
Colonial Dam 1982 112 828 000 2 476 Earth and rock
filled dam March River
Mercantile Dam 1978 87 312 000 1 014 Earth and rock
filled dam with side channel spillways
Gladstone River
Newton Dam 1968 52 15 000 324 Double curvature
concrete arch dam Gladstone
River
Lower Gladstone Dam
1954 28 8 980 245 Concrete gravity
dam Gladstone
River
A.desalination.plant.has.recently.been.commissioned.to.help.relieve.the.pressure.on.the.natural.water.resources.in.times.of.extended.periods.of.low.rainfall..The.Crocker.desalination.plant.has.capacity.to.produce.56.ML.of.potable.water.per.day..The.plant.has.been.designed.to.be.upgradeable.to.a.capacity.of.128.ML.per.day..The.plant.is.located.on.Moreton.Bay.and.its.potable.water.is.able.to.be.introduced.into.Crowe’s.urban.distribution.system.for.supply..to.customers..
The.Crowe.sewerage.treatment.plant.is.located.on.the.April.River..The.treatment.plant.treats.all.the.wastewater.from.Crowe..Five.years.ago,.Terra.Firma.established.recycled.water.pipes.through.the.city.to.water.public.parks.and.gardens.to.help.reduce.the.load.on.the.city’s.drinking.water.supply..Terra.Firma.has.a.target.of.40%.of.all.wastewater.being.recycled..Presently.31%.of.all.wastewater.is.recycled.with.the.remainder.being.discharged.into.the..April.River.
Para 49(b) Administrative information
Water management bodies
The.Department.of.Conservation.(the.Department).is.the.overall.body.responsible.for.managing.the.water.resources.in.the.State.of.Central.Hanley..The.Department.issues.and.monitors.water.licences.under.the.Water.Resources.Act.2X05.
Terra.Firma,.under.the.licence.issued.from.the.Department,.is.responsible.for.the.day-to-day.management.of.the.water.resources,.within.the.confines.of.the.licence.agreement,.in.the.Terra.Firma.water.supply.system.
The.licence.allows.Terra.Firma.to.take.water.from.the.Gladstone,.Bridge.and.March.rivers.for.the.purpose.of.urban.water.supply.for.the.residents.of.Crowe..The.licence.requires.Terra.Firma.to.manage.water.resources.in.accordance.with.the.Water.Resources.Act.2X05.and.to.follow.the.Environmental.Flow.Guidelines.2X05..The.licence.also.imposes.requirements.for.Terra.Firma.to.monitor,.sample.and.analyse.water.quality.in.the.rivers.and.dams.in.accordance.with.Australian.Standard.AS.5667.–.1998.parts.1,.4.and.6,.and.with.the.Standard.Methods.for.the.Examination.of.Water.and.Wastewater..
4 Terra Firma Water Supply System – Model Water Accounting Report Model Water Accounting Report – Terra Firma Water Supply System 5
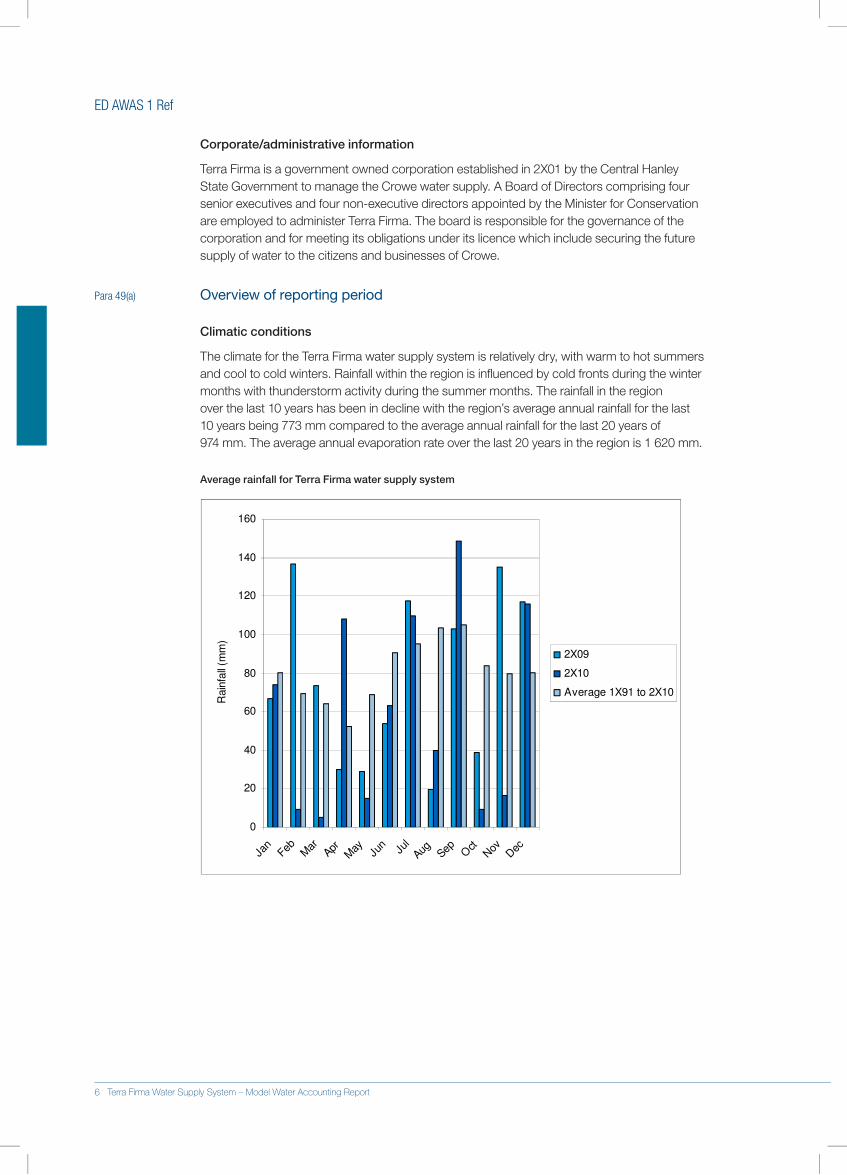
ED AWAS 1 Ref
Corporate/administrative information
Terra.Firma.is.a.government.owned.corporation.established.in.2X01.by.the.Central.Hanley.State.Government.to.manage.the.Crowe.water.supply..A.Board.of.Directors.comprising.four.senior.executives.and.four.non-executive.directors.appointed.by.the.Minister.for.Conservation.are.employed.to.administer.Terra.Firma..The.board.is.responsible.for.the.governance.of.the.corporation.and.for.meeting.its.obligations.under.its.licence.which.include.securing.the.future.supply.of.water.to.the.citizens.and.businesses.of.Crowe.
Para 49(a) Overview of reporting period
Climatic conditions
The.climate.for.the.Terra.Firma.water.supply.system.is.relatively.dry,.with.warm.to.hot.summers.and.cool.to.cold.winters..Rainfall.within.the.region.is.influenced.by.cold.fronts.during.the.winter.months.with.thunderstorm.activity.during.the.summer.months..The.rainfall.in.the.region..over.the.last.10.years.has.been.in.decline.with.the.region’s.average.annual.rainfall.for.the.last..10.years.being.773.mm.compared.to.the.average.annual.rainfall.for.the.last.20.years.of..974.mm..The.average.annual.evaporation.rate.over.the.last.20.years.in.the.region.is.1.620.mm.
Average rainfall for Terra Firma water supply system
0
20
40
60
80
100
120
140
160
Jan
Feb Mar
AprM
ay Jun
Jul
Aug Sep Oct
Nov
Dec
Rain
fall
(mm
)
2X09
2X10
Average 1X91 to 2X10
6 Terra Firma Water Supply System – Model Water Accounting Report
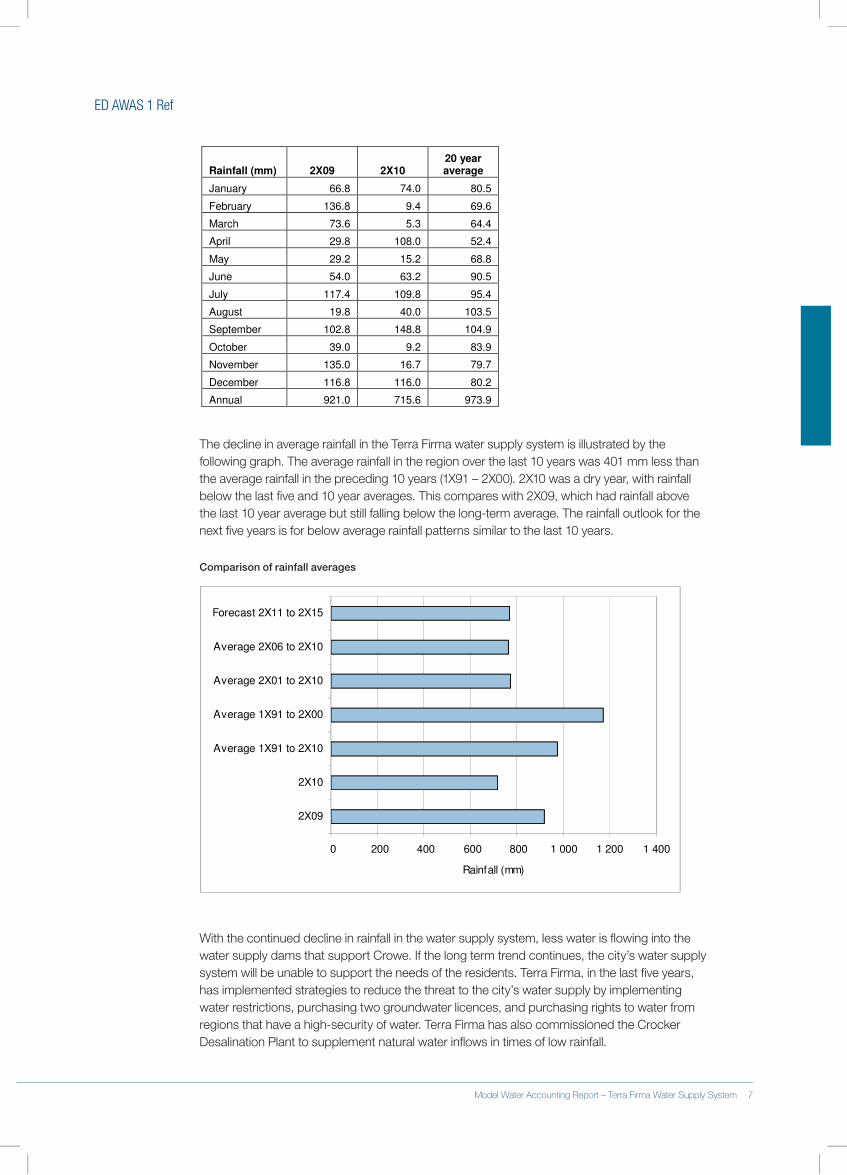
ED AWAS 1 Ref
Rainfall (mm) 2X09 2X10 20 year average
January 66.8 74.0 80.5
February 136.8 9.4 69.6
March 73.6 5.3 64.4
April 29.8 108.0 52.4
May 29.2 15.2 68.8
June 54.0 63.2 90.5
July 117.4 109.8 95.4
August 19.8 40.0 103.5
September 102.8 148.8 104.9
October 39.0 9.2 83.9
November 135.0 16.7 79.7
December 116.8 116.0 80.2
Annual 921.0 715.6 973.9
The.decline.in.average.rainfall.in.the.Terra.Firma.water.supply.system.is.illustrated.by.the.following.graph..The.average.rainfall.in.the.region.over.the.last.10.years.was.401.mm.less.than.the.average.rainfall.in.the.preceding.10.years.(1X91.–.2X00)..2X10.was.a.dry.year,.with.rainfall.below.the.last.five.and.10.year.averages..This.compares.with.2X09,.which.had.rainfall.above.the.last.10.year.average.but.still.falling.below.the.long-term.average..The.rainfall.outlook.for.the.next.five.years.is.for.below.average.rainfall.patterns.similar.to.the.last.10.years..
Comparison of rainfall averages
.
0 200 400 600 800 1 000 1 200 1 400
2X09
2X10
Average 1X91 to 2X10
Average 1X91 to 2X00
Average 2X01 to 2X10
Average 2X06 to 2X10
Forecast 2X11 to 2X15
Rainfall (mm)
With.the.continued.decline.in.rainfall.in.the.water.supply.system,.less.water.is.flowing.into.the.water.supply.dams.that.support.Crowe..If.the.long.term.trend.continues,.the.city’s.water.supply.system.will.be.unable.to.support.the.needs.of.the.residents..Terra.Firma,.in.the.last.five.years,.has.implemented.strategies.to.reduce.the.threat.to.the.city’s.water.supply.by.implementing.water.restrictions,.purchasing.two.groundwater.licences,.and.purchasing.rights.to.water.from.regions.that.have.a.high-security.of.water..Terra.Firma.has.also.commissioned.the.Crocker.Desalination.Plant.to.supplement.natural.water.inflows.in.times.of.low.rainfall.
6 Terra Firma Water Supply System – Model Water Accounting Report Model Water Accounting Report – Terra Firma Water Supply System 7
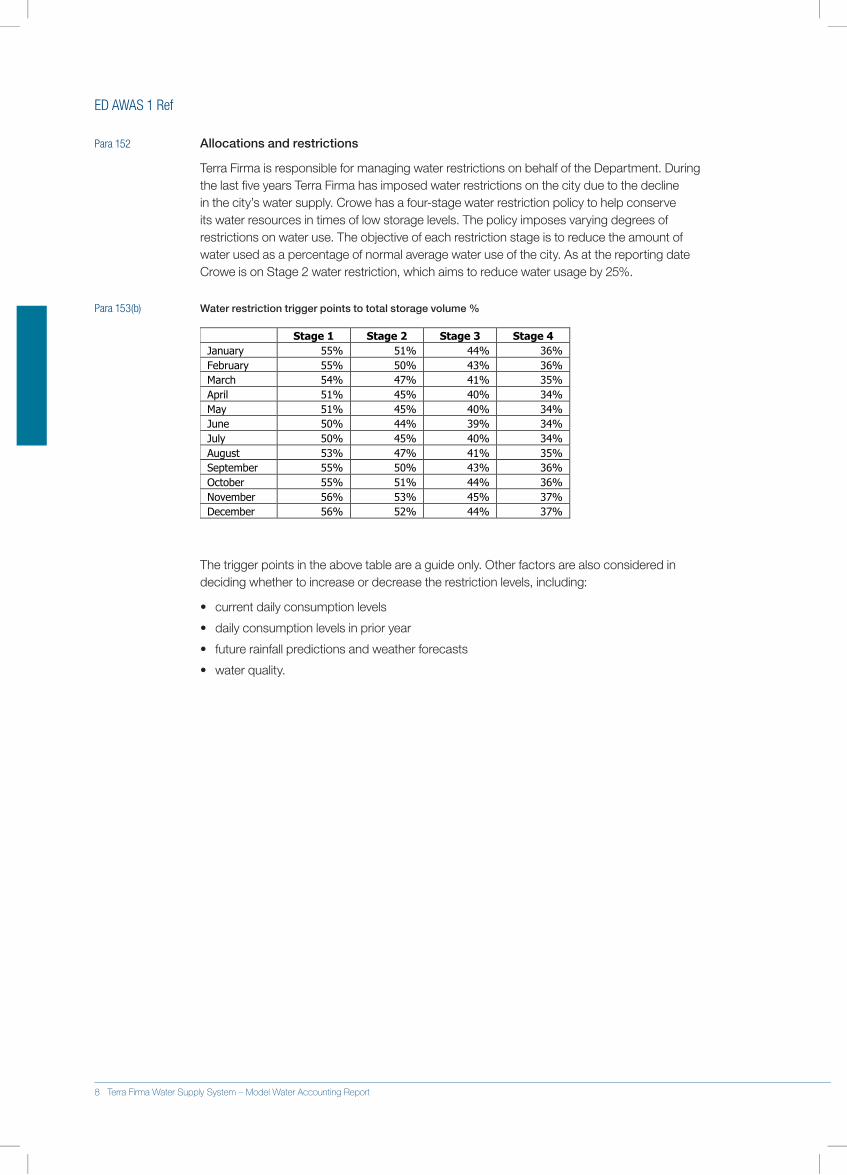
ED AWAS 1 Ref
Para 152 Allocations and restrictions
Terra.Firma.is.responsible.for.managing.water.restrictions.on.behalf.of.the.Department..During.the.last.five.years.Terra.Firma.has.imposed.water.restrictions.on.the.city.due.to.the.decline.in.the.city’s.water.supply..Crowe.has.a.four-stage.water.restriction.policy.to.help.conserve.its.water.resources.in.times.of.low.storage.levels..The.policy.imposes.varying.degrees.of.restrictions.on.water.use..The.objective.of.each.restriction.stage.is.to.reduce.the.amount.of.water.used.as.a.percentage.of.normal.average.water.use.of.the.city..As.at.the.reporting.date.Crowe.is.on.Stage.2.water.restriction,.which.aims.to.reduce.water.usage.by.25%..
Para 153(b) Water restriction trigger points to total storage volume %
.
The.trigger.points.in.the.above.table.are.a.guide.only..Other.factors.are.also.considered.in.deciding.whether.to.increase.or.decrease.the.restriction.levels,.including:
•. current.daily.consumption.levels.
•. daily.consumption.levels.in.prior.year.
•. future.rainfall.predictions.and.weather.forecasts.
•. water.quality.
8 Terra Firma Water Supply System – Model Water Accounting Report
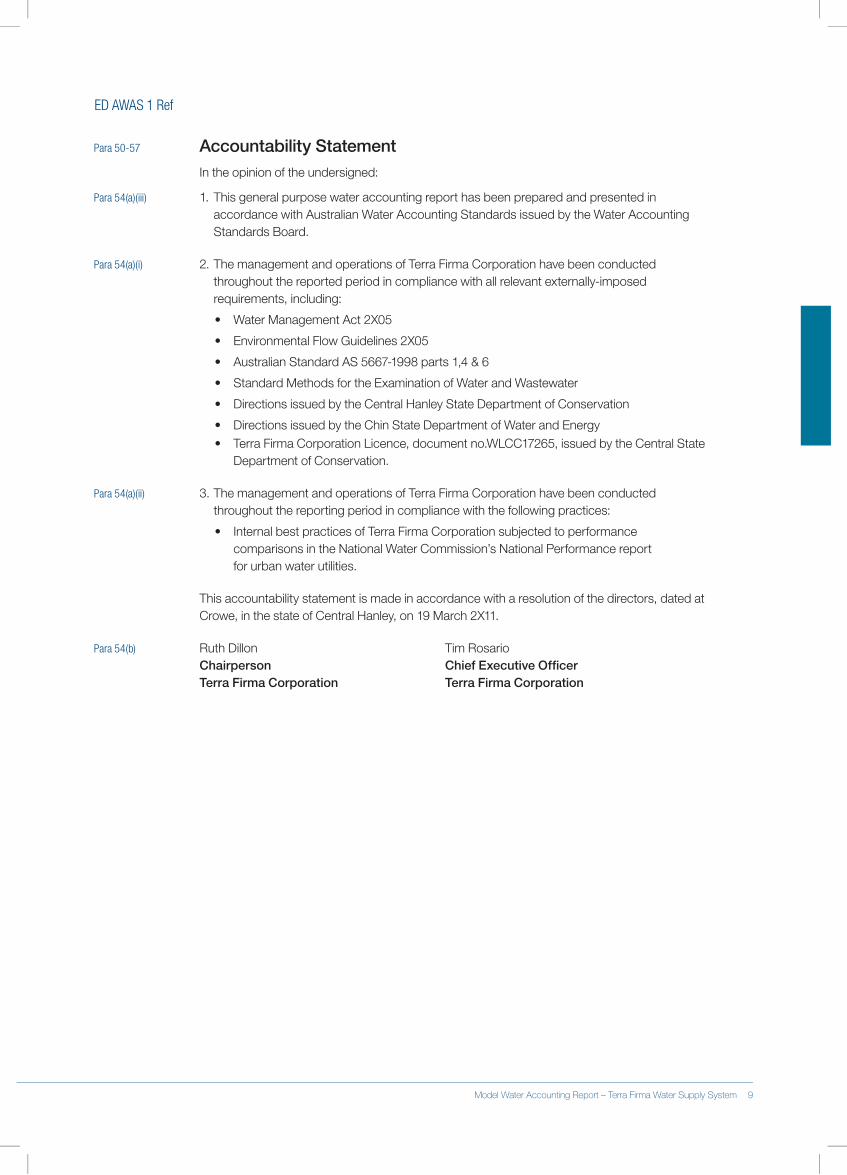
ED AWAS 1 Ref
Para 50-57 Accountability Statement In.the.opinion.of.the.undersigned:
Para 54(a)(iii) 1.. .This.general.purpose.water.accounting.report.has.been.prepared.and.presented.in.accordance.with.Australian.Water.Accounting.Standards.issued.by.the.Water.Accounting.Standards.Board.
Para 54(a)(i) 2...The.management.and.operations.of.Terra.Firma.Corporation.have.been.conducted.throughout.the.reported.period.in.compliance.with.all.relevant.externally-imposed.requirements,.including:
•. Water.Management.Act.2X05.
•. Environmental.Flow.Guidelines.2X05.
•. Australian.Standard.AS.5667-1998.parts.1,4.&.6.
•. Standard.Methods.for.the.Examination.of.Water.and.Wastewater.
•. Directions.issued.by.the.Central.Hanley.State.Department.of.Conservation.
•. Directions.issued.by.the.Chin.State.Department.of.Water.and.Energy.•. Terra.Firma.Corporation.Licence,.document.no.WLCC17265,.issued.by.the.Central.State.
Department.of.Conservation.
Para 54(a)(ii) 3...The.management.and.operations.of.Terra.Firma.Corporation.have.been.conducted.throughout.the.reporting.period.in.compliance.with.the.following.practices:
•. Internal.best.practices.of.Terra.Firma.Corporation.subjected.to.performance.comparisons.in.the.National.Water.Commission’s.National.Performance.report.for.urban.water.utilities.
This.accountability.statement.is.made.in.accordance.with.a.resolution.of.the.directors,.dated.at.Crowe,.in the.state.of.Central.Hanley,.on.19.March.2X11.
Para 54(b) Ruth.Dillon. Tim.RosarioChairperson Chief Executive Officer Terra Firma Corporation Terra Firma Corporation
8 Terra Firma Water Supply System – Model Water Accounting Report Model Water Accounting Report – Terra Firma Water Supply System 9
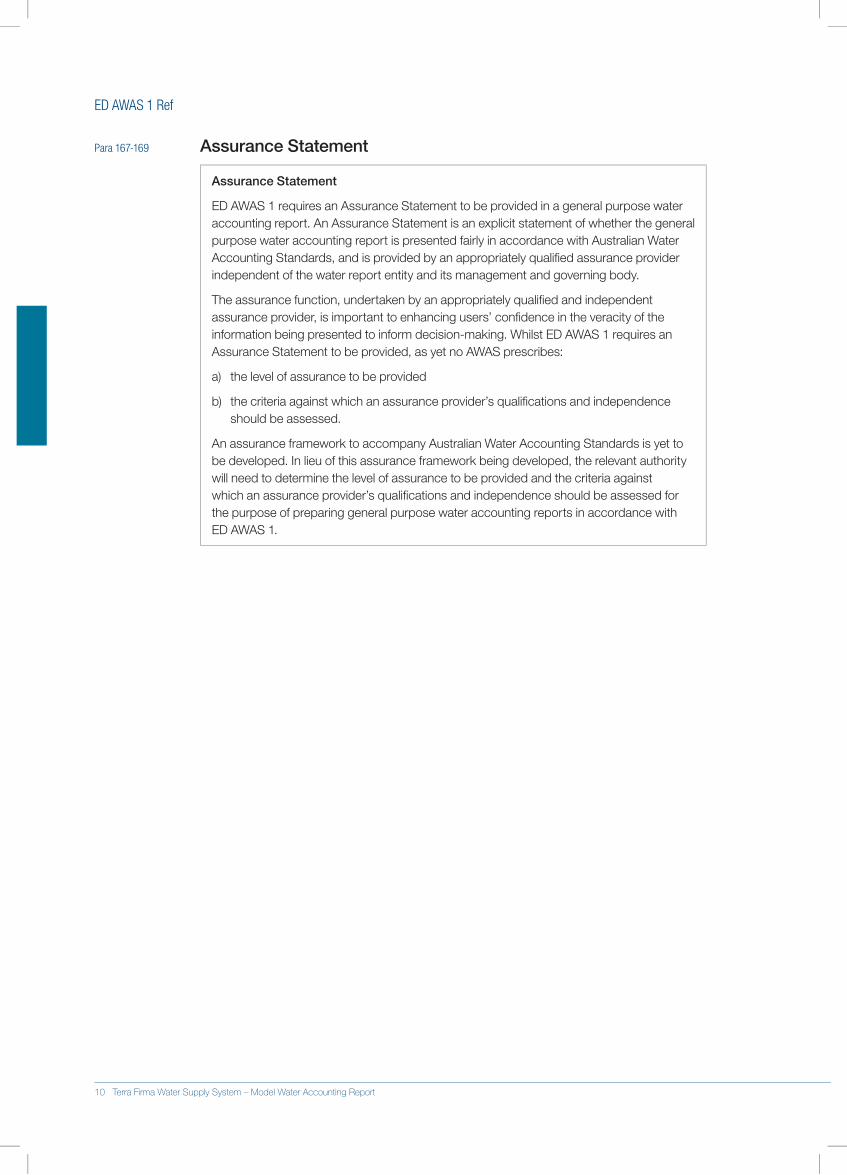
ED AWAS 1 Ref
Para 167-169 Assurance Statement
Assurance Statement
ED.AWAS.1.requires.an.Assurance.Statement.to.be.provided.in.a.general.purpose.water.accounting.report..An.Assurance.Statement.is.an.explicit.statement.of.whether.the.general.purpose.water.accounting.report.is.presented.fairly.in.accordance.with.Australian.Water.Accounting.Standards,.and.is.provided.by.an.appropriately.qualified.assurance.provider.independent.of.the.water.report.entity.and.its.management.and.governing.body.
The.assurance.function,.undertaken.by.an.appropriately.qualified.and.independent.assurance.provider,.is.important.to.enhancing.users’.confidence.in.the.veracity.of.the.information.being.presented.to.inform.decision-making..Whilst.ED.AWAS.1.requires.an.Assurance.Statement.to.be.provided,.as.yet.no.AWAS.prescribes:
a). the.level.of.assurance.to.be.provided.
b). .the.criteria.against.which.an.assurance.provider’s.qualifications.and.independence.should.be.assessed..
An.assurance.framework.to.accompany.Australian.Water.Accounting.Standards.is.yet.to.be.developed..In.lieu.of.this.assurance.framework.being.developed,.the.relevant.authority.will.need.to.determine.the.level.of.assurance.to.be.provided.and.the.criteria.against.which.an.assurance.provider’s.qualifications.and.independence.should.be.assessed.for.the.purpose.of.preparing.general.purpose.water.accounting.reports.in.accordance.with.ED AWAS.1.
10 Terra Firma Water Supply System – Model Water Accounting Report
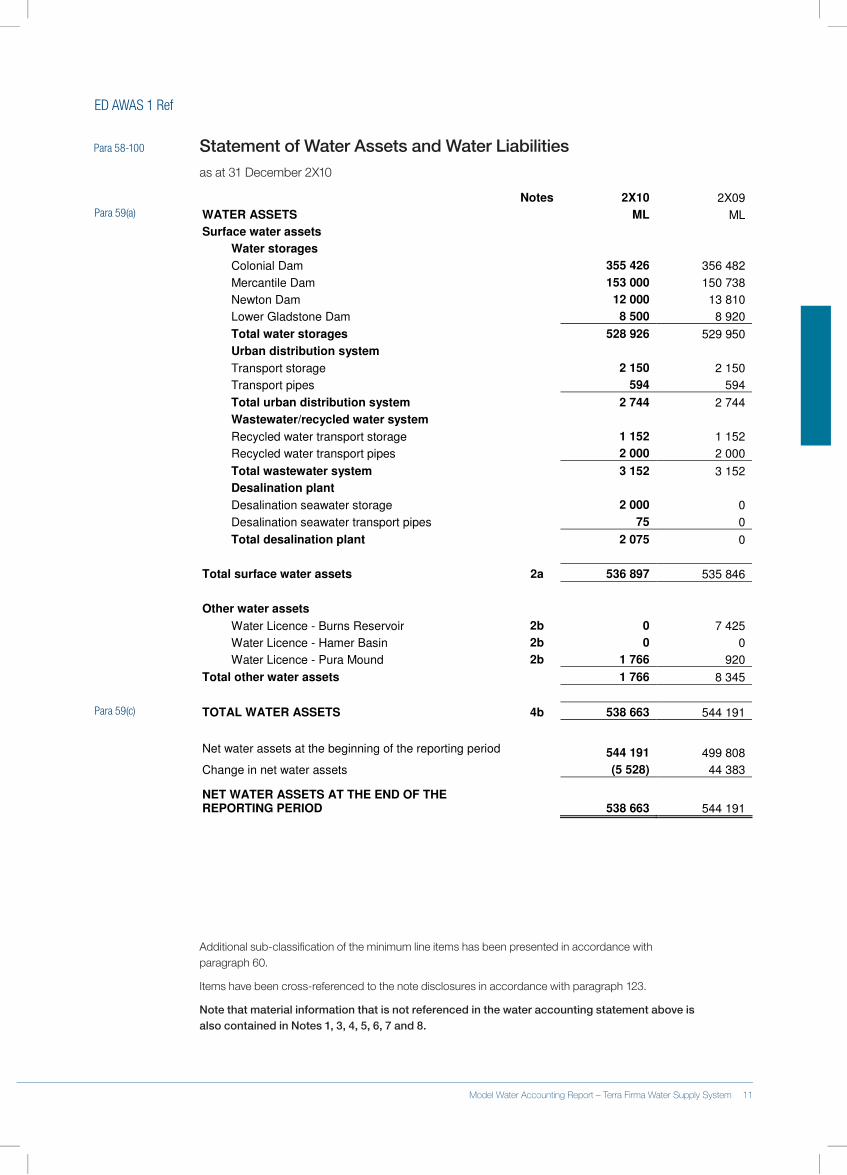
ED AWAS 1 Ref
Para 58-100 Statement of Water Assets and Water Liabilitiesas.at.31.December.2X10
Notes 2X10 2X09
WATER ASSETS ML ML
Surface water assets
Water storages
Colonial Dam 355 426 356 482
Mercantile Dam 153 000 150 738
Newton Dam 12 000 13 810
Lower Gladstone Dam 8 500 8 920
Total water storages 528 926 529 950
Urban distribution system
Transport storage 2 150 2 150
Transport pipes 594 594
Total urban distribution system 2 744 2 744
Wastewater/recycled water system
Recycled water transport storage 1 152 1 152
Recycled water transport pipes 2 000 2 000
Total wastewater system 3 152 3 152
Desalination plant
Desalination seawater storage 2 000 0
Desalination seawater transport pipes 75 0
Total desalination plant 2 075 0
Total surface water assets 2a 536 897 535 846
Other water assets
Water Licence - Burns Reservoir 2b 0 7 425
Water Licence - Hamer Basin 2b 0 0
Water Licence - Pura Mound 2b 1 766 920
Total other water assets 1 766 8 345
TOTAL WATER ASSETS 4b 538 663 544 191
Net water assets at the beginning of the reporting period 544 191 499 808
Change in net water assets (5 528) 44 383
NET WATER ASSETS AT THE END OF THE REPORTING PERIOD 538 663 544 191
Additional.sub-classification.of.the.minimum.line.items.has.been.presented.in.accordance.with.paragraph 60.
Items.have.been.cross-referenced.to.the.note.disclosures.in.accordance.with.paragraph.123.
Note that material information that is not referenced in the water accounting statement above is also contained in Notes 1, 3, 4, 5, 6, 7 and 8.
Para 59(a)
Para 59(c)
10 Terra Firma Water Supply System – Model Water Accounting Report Model Water Accounting Report – Terra Firma Water Supply System 11
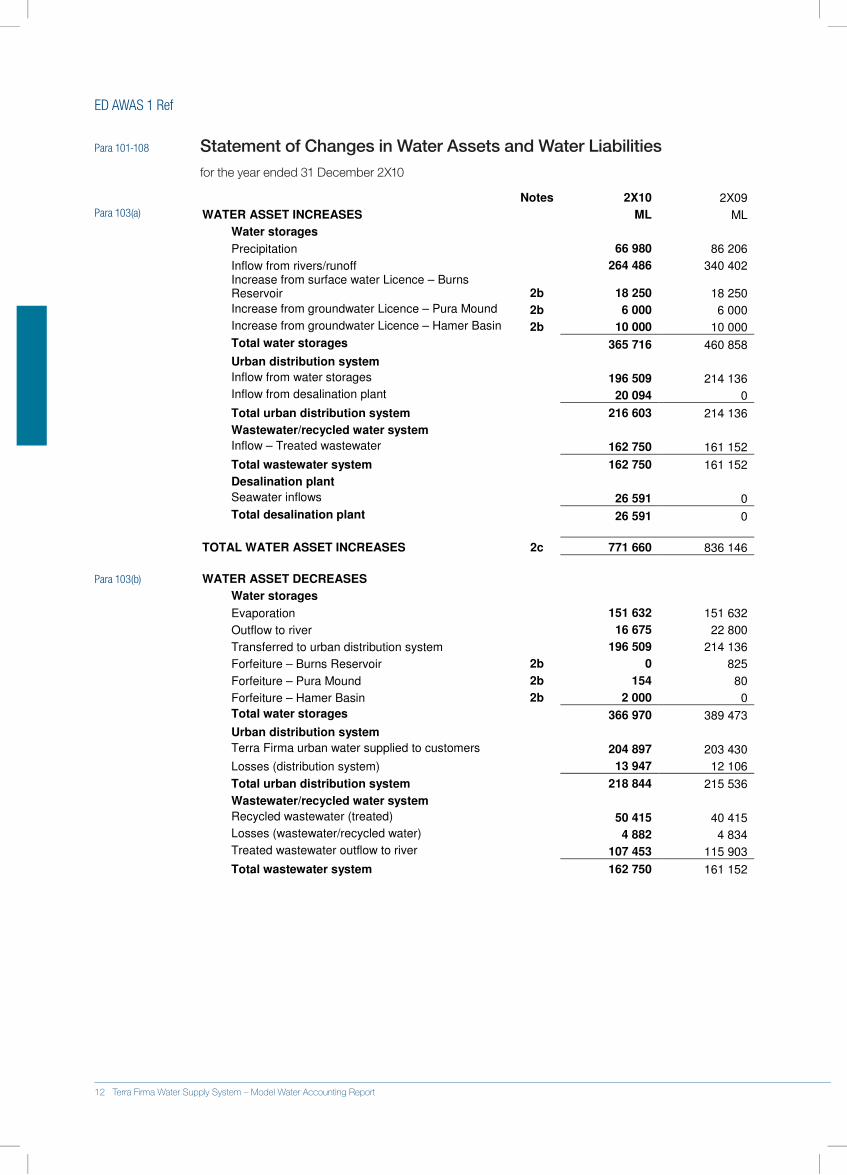
ED AWAS 1 Ref
Para 101-108 Statement of Changes in Water Assets and Water Liabilitiesfor.the.year.ended.31.December.2X10
Notes 2X10 2X09
WATER ASSET INCREASES ML ML
Water storages
Precipitation 66 980 86 206
Inflow from rivers/runoff 264 486 340 402
Increase from surface water Licence – Burns Reservoir 2b 18 250 18 250
Increase from groundwater Licence – Pura Mound 2b 6 000 6 000
Increase from groundwater Licence – Hamer Basin 2b 10 000 10 000
Total water storages 365 716 460 858
Urban distribution system
Inflow from water storages 196 509 214 136
Inflow from desalination plant 20 094 0
Total urban distribution system 216 603 214 136
Wastewater/recycled water system
Inflow – Treated wastewater 162 750 161 152
Total wastewater system 162 750 161 152
Desalination plant
Seawater inflows 26 591 0
Total desalination plant 26 591 0
TOTAL WATER ASSET INCREASES 2c 771 660 836 146
WATER ASSET DECREASES
Water storages
Evaporation 151 632 151 632
Outflow to river 16 675 22 800
Transferred to urban distribution system 196 509 214 136
Forfeiture – Burns Reservoir 2b 0 825
Forfeiture – Pura Mound 2b 154 80
Forfeiture – Hamer Basin 2b 2 000 0
Total water storages 366 970 389 473
Urban distribution system
Terra Firma urban water supplied to customers 204 897 203 430
Losses (distribution system) 13 947 12 106
Total urban distribution system 218 844 215 536
Wastewater/recycled water system
Recycled wastewater (treated) 50 415 40 415
Losses (wastewater/recycled water) 4 882 4 834
Treated wastewater outflow to river 107 453 115 903
Total wastewater system 162 750 161 152
Desalination plant
Transferred to urban distribution system 20 094 0
Losses (desalination) 531 0
Desalination wastewater outflow 3 891 0
Total desalination plant 24 516 0
TOTAL WATER ASSET DECREASES 2d 773 080 766 161
Unaccounted-for difference 2e (4 108) (25 602)
CHANGE IN NET WATER ASSETS 4a (5 528) 44 383
Para 103(a)
Para 103(b)
12 Terra Firma Water Supply System – Model Water Accounting Report
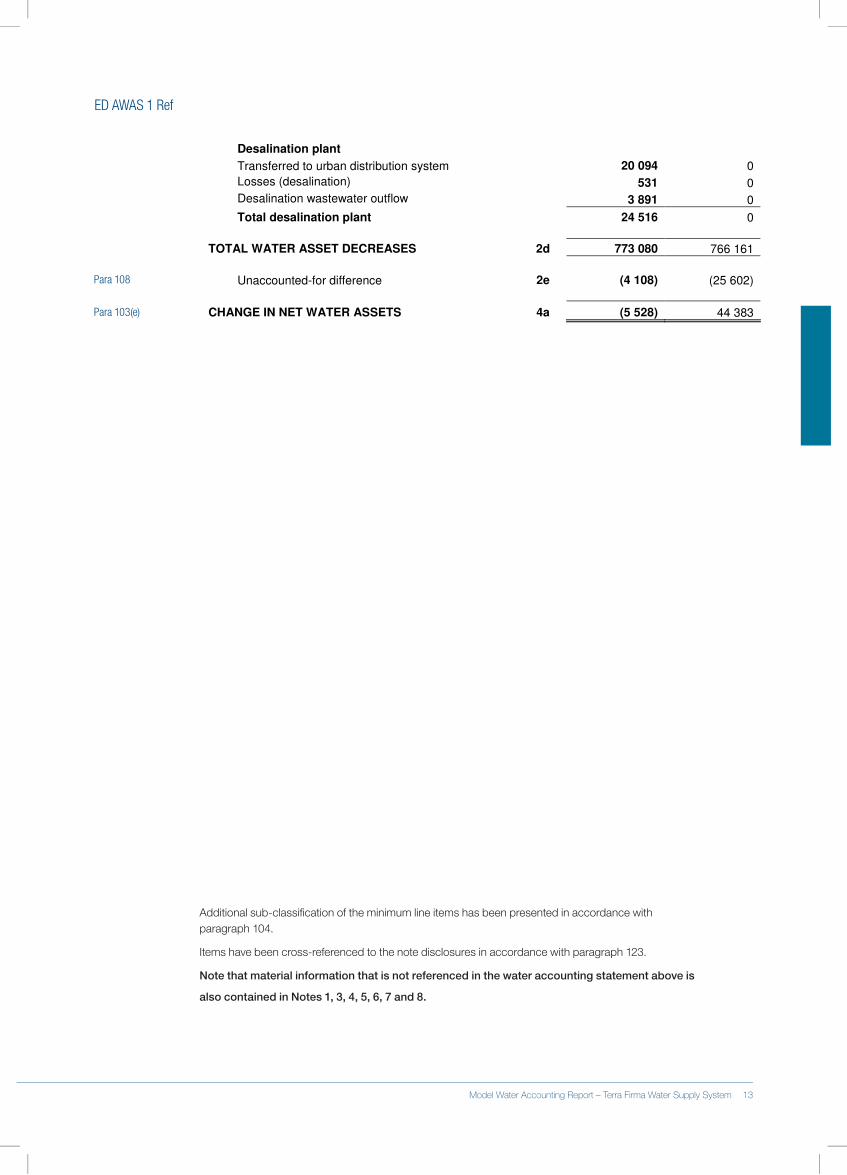
ED AWAS 1 Ref
Notes 2X10 2X09
WATER ASSET INCREASES ML ML
Water storages
Precipitation 66 980 86 206
Inflow from rivers/runoff 264 486 340 402
Increase from surface water Licence – Burns Reservoir 2b 18 250 18 250
Increase from groundwater Licence – Pura Mound 2b 6 000 6 000
Increase from groundwater Licence – Hamer Basin 2b 10 000 10 000
Total water storages 365 716 460 858
Urban distribution system
Inflow from water storages 196 509 214 136
Inflow from desalination plant 20 094 0
Total urban distribution system 216 603 214 136
Wastewater/recycled water system
Inflow – Treated wastewater 162 750 161 152
Total wastewater system 162 750 161 152
Desalination plant
Seawater inflows 26 591 0
Total desalination plant 26 591 0
TOTAL WATER ASSET INCREASES 2c 771 660 836 146
WATER ASSET DECREASES
Water storages
Evaporation 151 632 151 632
Outflow to river 16 675 22 800
Transferred to urban distribution system 196 509 214 136
Forfeiture – Burns Reservoir 2b 0 825
Forfeiture – Pura Mound 2b 154 80
Forfeiture – Hamer Basin 2b 2 000 0
Total water storages 366 970 389 473
Urban distribution system
Terra Firma urban water supplied to customers 204 897 203 430
Losses (distribution system) 13 947 12 106
Total urban distribution system 218 844 215 536
Wastewater/recycled water system
Recycled wastewater (treated) 50 415 40 415
Losses (wastewater/recycled water) 4 882 4 834
Treated wastewater outflow to river 107 453 115 903
Total wastewater system 162 750 161 152
Desalination plant
Transferred to urban distribution system 20 094 0
Losses (desalination) 531 0
Desalination wastewater outflow 3 891 0
Total desalination plant 24 516 0
TOTAL WATER ASSET DECREASES 2d 773 080 766 161
Unaccounted-for difference 2e (4 108) (25 602)
CHANGE IN NET WATER ASSETS 4a (5 528) 44 383
Additional.sub-classification.of.the.minimum.line.items.has.been.presented.in.accordance.with.paragraph 104.
Items.have.been.cross-referenced.to.the.note.disclosures.in.accordance.with.paragraph.123.
Note that material information that is not referenced in the water accounting statement above is
also contained in Notes 1, 3, 4, 5, 6, 7 and 8.
Para 108
Para 103(e)
12 Terra Firma Water Supply System – Model Water Accounting Report Model Water Accounting Report – Terra Firma Water Supply System 13
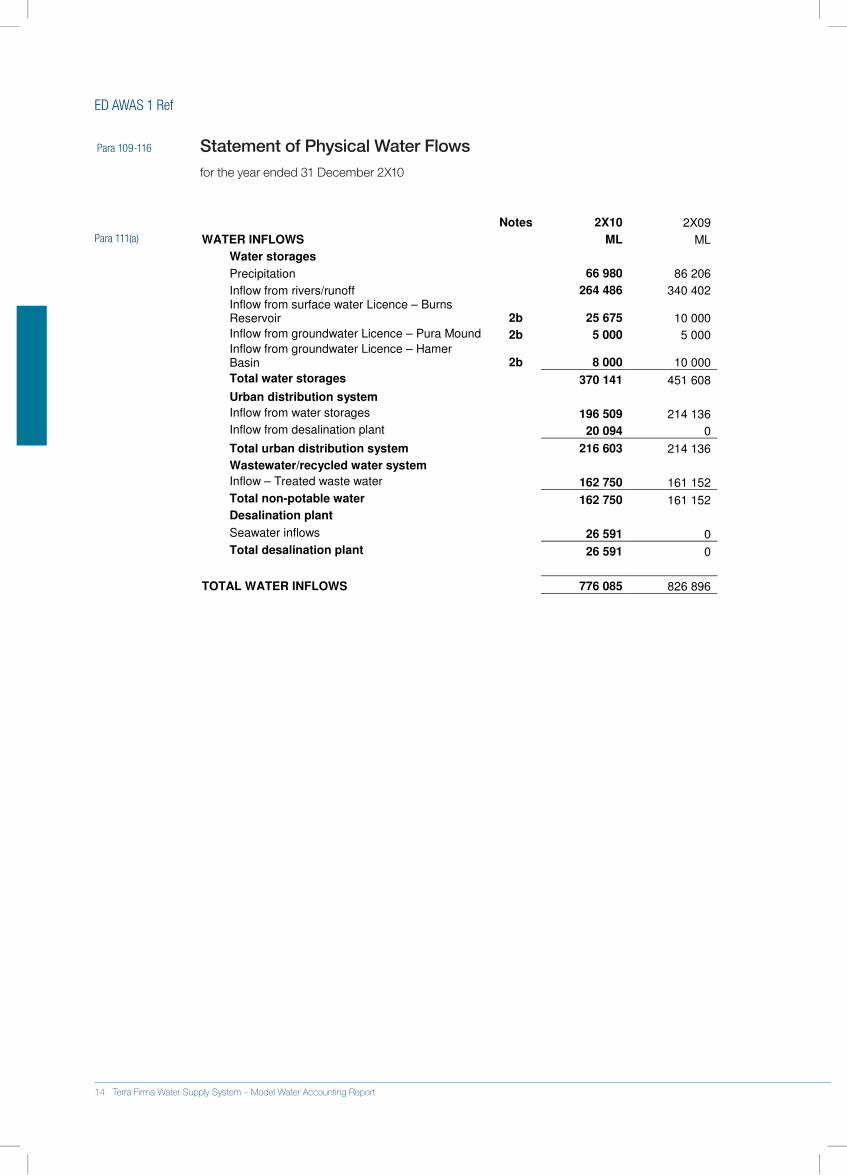
ED AWAS 1 Ref
Para 109-116 Statement of Physical Water Flowsfor.the.year.ended.31.December.2X10
Notes 2X10 2X09
WATER INFLOWS ML ML
Water storages
Precipitation 66 980 86 206
Inflow from rivers/runoff 264 486 340 402
Inflow from surface water Licence – Burns Reservoir 2b 25 675 10 000
Inflow from groundwater Licence – Pura Mound 2b 5 000 5 000
Inflow from groundwater Licence – Hamer Basin 2b 8 000 10 000
Total water storages 370 141 451 608
Urban distribution system
Inflow from water storages 196 509 214 136
Inflow from desalination plant 20 094 0
Total urban distribution system 216 603 214 136
Wastewater/recycled water system
Inflow – Treated waste water 162 750 161 152
Total non-potable water 162 750 161 152
Desalination plant
Seawater inflows 26 591 0
Total desalination plant 26 591 0
TOTAL WATER INFLOWS 776 085 826 896
WATER OUTFLOWS
Water storages
Evaporation 151 632 151 632
Outflow to river 16 675 22 800
Transferred to urban distribution system 196 509 214 136
Total water storages 364 816 388 568
Urban distribution system
Terra Firma urban water supplied to customers 204 897 203 430
Losses (distribution system) 13 947 12 106
Total urban distribution system 218 844 215 536
Wastewater/recycled water system
Recycled wastewater (treated) 50 415 40 415
Losses (wastewater/recycled water) 4 882 4 834
Treated wastewater outflow to river 107 453 115 903
Total non-potable water 162 750 161 152
Desalination plant
Transferred to urban distribution system 20 094 0
Losses (desalination) 531 0
Desalination wastewater outflow 3 891 0
Total desalination plant 24 516 0
TOTAL WATER OUTFLOWS 770 926 765 256
Para 111(a)
14 Terra Firma Water Supply System – Model Water Accounting Report
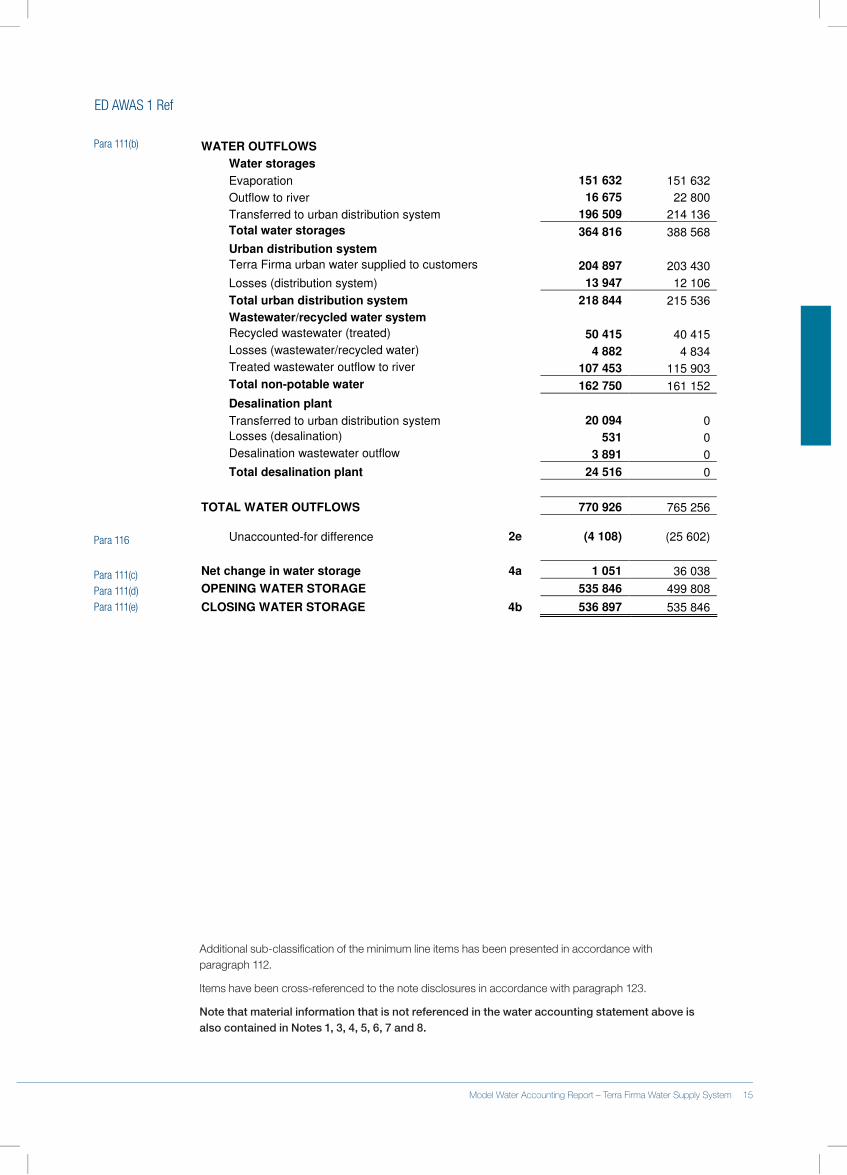
ED AWAS 1 Ref
Notes 2X10 2X09
WATER INFLOWS ML ML
Water storages
Precipitation 66 980 86 206
Inflow from rivers/runoff 264 486 340 402
Inflow from surface water Licence – Burns Reservoir 2b 25 675 10 000
Inflow from groundwater Licence – Pura Mound 2b 5 000 5 000
Inflow from groundwater Licence – Hamer Basin 2b 8 000 10 000
Total water storages 370 141 451 608
Urban distribution system
Inflow from water storages 196 509 214 136
Inflow from desalination plant 20 094 0
Total urban distribution system 216 603 214 136
Wastewater/recycled water system
Inflow – Treated waste water 162 750 161 152
Total non-potable water 162 750 161 152
Desalination plant
Seawater inflows 26 591 0
Total desalination plant 26 591 0
TOTAL WATER INFLOWS 776 085 826 896
WATER OUTFLOWS
Water storages
Evaporation 151 632 151 632
Outflow to river 16 675 22 800
Transferred to urban distribution system 196 509 214 136
Total water storages 364 816 388 568
Urban distribution system
Terra Firma urban water supplied to customers 204 897 203 430
Losses (distribution system) 13 947 12 106
Total urban distribution system 218 844 215 536
Wastewater/recycled water system
Recycled wastewater (treated) 50 415 40 415
Losses (wastewater/recycled water) 4 882 4 834
Treated wastewater outflow to river 107 453 115 903
Total non-potable water 162 750 161 152
Desalination plant
Transferred to urban distribution system 20 094 0
Losses (desalination) 531 0
Desalination wastewater outflow 3 891 0
Total desalination plant 24 516 0
TOTAL WATER OUTFLOWS 770 926 765 256
Unaccounted-for difference 2e (4 108) (25 602)
Net change in water storage 4a 1 051 36 038
OPENING WATER STORAGE 535 846 499 808
CLOSING WATER STORAGE 4b 536 897 535 846
Additional.sub-classification.of.the.minimum.line.items.has.been.presented.in.accordance.with.paragraph 112.
Items.have.been.cross-referenced.to.the.note.disclosures.in.accordance.with.paragraph.123.
Note that material information that is not referenced in the water accounting statement above is also contained in Notes 1, 3, 4, 5, 6, 7 and 8.
Para 111(b)
Para 116
Para 111(c)Para 111(d)Para 111(e)
14 Terra Firma Water Supply System – Model Water Accounting Report Model Water Accounting Report – Terra Firma Water Supply System 15
ED AWAS 1 Ref
Para 122-166 Note disclosures
Para 125-127 Note 1: Significant water accounting policies
Para 122(a) With.the.exception.of.the.physical.water.flow.information,.this.General.Purpose.Water.Accounting.Report.has.been.prepared.using.an.accrual.basis.of.water.accounting...The.water.attribute.being.quantified.is.volume.and.the.unit.of.account.is.megalitres.(ML).
Recognition of water assets
Only.water.that.is.held.or.over.which.Terra.Firma.has.management.responsibilities,.meets.the.definition.of.a.water.asset..Provided.its.volume.can.be.quantified.with.representational.faithfulness,.the.asset.is.recognised.in.the.Statement.of.Water.Assets.and.Water.Liabilities.
Water.in.groundwater.aquifers.or.natural.lakes.over.which.Terra.Firma.does.not.hold.or.have.management.responsibilities.is.not.regarded.as.a.water.asset.of.Terra.Firma..Whilst.this.water.is.in.the.physical.region.within.which.Terra.Firma.operates,.it.is.not.covered.by.Terra.Firma’s.licence.agreements.and.not.utilised.in.the.water.distribution.network.to.the.city.of.Crowe.
Seawater.within.the.storage.facilities.and.distribution.pipes.of.the.water.report.entity.is.regarded.as.a.water.asset.as.it.is.held.by.Terra.Firma..Terra.Firma.has.management.responsibility.for.that.water,.and.future.benefits.are.derived.from.the.water.by.the.water..report.entity.
While.water.within.the.river.channel.storage.is.a.vital.asset.for.the.transportation.of.water.within.the.water.supply.system,.it.cannot.be.quantified.with.representational.faithfulness.and.is.not.material.to.the.water.accounting.report..It.is.therefore.not.recognised.as.a.water.asset.
Para 107 Recognition of changes in water assets
Precipitation.and.evaporation.are.only.recognised.in.relation.to.the.dam.surfaces..It.does.not.represent.all.precipitation.and.evaporation.within.the.physical.region.of.the.water.report.entity.
Inflow.from.rivers/runoff.is.quantified.and.recognised.for.water.that.flows.into.the.dams..The.inflow.from.rivers/runoff.includes.releases.from.upstream.dams.and.precipitation.captured.in.the.catchment.areas.less.any.losses.in.the.transfer.of.water.between.dams.
Inflow.of.treated.wastewater.meets.required.levels.of.water.quality.before.it.is.returned.to.the.system..It.is.recognised.in.the.Statement.of.Changes.in.Water.Assets.and.Water.Liabilities.as..a.surface.water.increase..
Losses.which.have.been.recognised.within.the.Statement.of.Changes.of.Water.Assets.and.Water.Liabilities.relate.to.losses.in.the.transportation.of.water.from.a.water.licence.to.storage,.losses.due.to.processing.or.losses.due.to.seepage.within.the.distribution.pipes..Other.losses.within.the.water.supply.system.may.also.exist.and.will.be.part.of.the.unaccounted-for.difference.line.item.
Para 125(b)Para 65
16 Terra Firma Water Supply System – Model Water Accounting Report
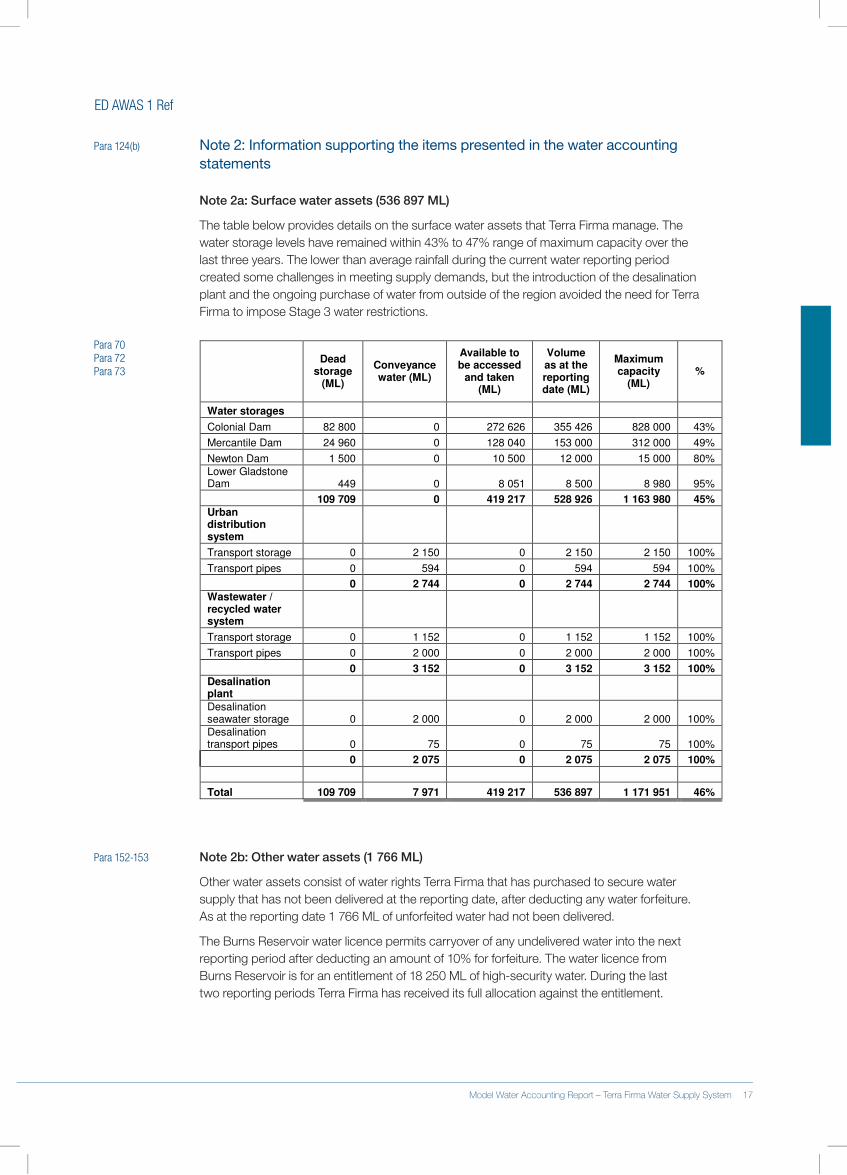
ED AWAS 1 Ref
Para 124(b) Note 2: Information supporting the items presented in the water accounting statements
Note 2a: Surface water assets (536 897 ML)
The.table.below.provides.details.on.the.surface.water.assets.that.Terra.Firma.manage..The.water.storage.levels.have.remained.within.43%.to.47%.range.of.maximum.capacity.over.the.last.three.years..The.lower.than.average.rainfall.during.the.current.water.reporting.period.created.some.challenges.in.meeting.supply.demands,.but.the.introduction.of.the.desalination.plant.and.the.ongoing.purchase.of.water.from.outside.of.the.region.avoided.the.need.for.Terra.Firma.to.impose.Stage.3.water.restrictions.
Dead storage
(ML)
Conveyance water (ML)
Available to be accessed
and taken (ML)
Volume as at the reporting date (ML)
Maximum capacity
(ML) %
Water storages
Colonial Dam 82 800 0 272 626 355 426 828 000 43%
Mercantile Dam 24 960 0 128 040 153 000 312 000 49%
Newton Dam 1 500 0 10 500 12 000 15 000 80%
Lower Gladstone Dam 449 0 8 051 8 500 8 980 95%
109 709 0 419 217 528 926 1 163 980 45%
Urban distribution system
Transport storage 0 2 150 0 2 150 2 150 100%
Transport pipes 0 594 0 594 594 100%
0 2 744 0 2 744 2 744 100%
Wastewater / recycled water system
Transport storage 0 1 152 0 1 152 1 152 100%
Transport pipes 0 2 000 0 2 000 2 000 100%
0 3 152 0 3 152 3 152 100%
Desalination plant
Desalination seawater storage 0 2 000 0 2 000 2 000 100%
Desalination transport pipes 0 75 0 75 75 100%
0 2 075 0 2 075 2 075 100%
Total 109 709 7 971 419 217 536 897 1 171 951 46%
Para 152-153 Note 2b: Other water assets (1 766 ML)
Other.water.assets.consist.of.water.rights.Terra.Firma.that.has.purchased.to.secure.water.supply.that.has.not.been.delivered.at.the.reporting.date,.after.deducting.any.water.forfeiture..As.at.the.reporting.date.1.766.ML.of.unforfeited.water.had.not.been.delivered.
The.Burns.Reservoir.water.licence.permits.carryover.of.any.undelivered.water.into.the.next.reporting.period.after.deducting.an.amount.of.10%.for.forfeiture..The.water.licence.from..Burns.Reservoir.is.for.an.entitlement.of.18.250.ML.of.high-security.water..During.the.last..two.reporting.periods.Terra.Firma.has.received.its.full.allocation.against.the.entitlement.
Para 70Para 72Para 73
16 Terra Firma Water Supply System – Model Water Accounting Report Model Water Accounting Report – Terra Firma Water Supply System 17
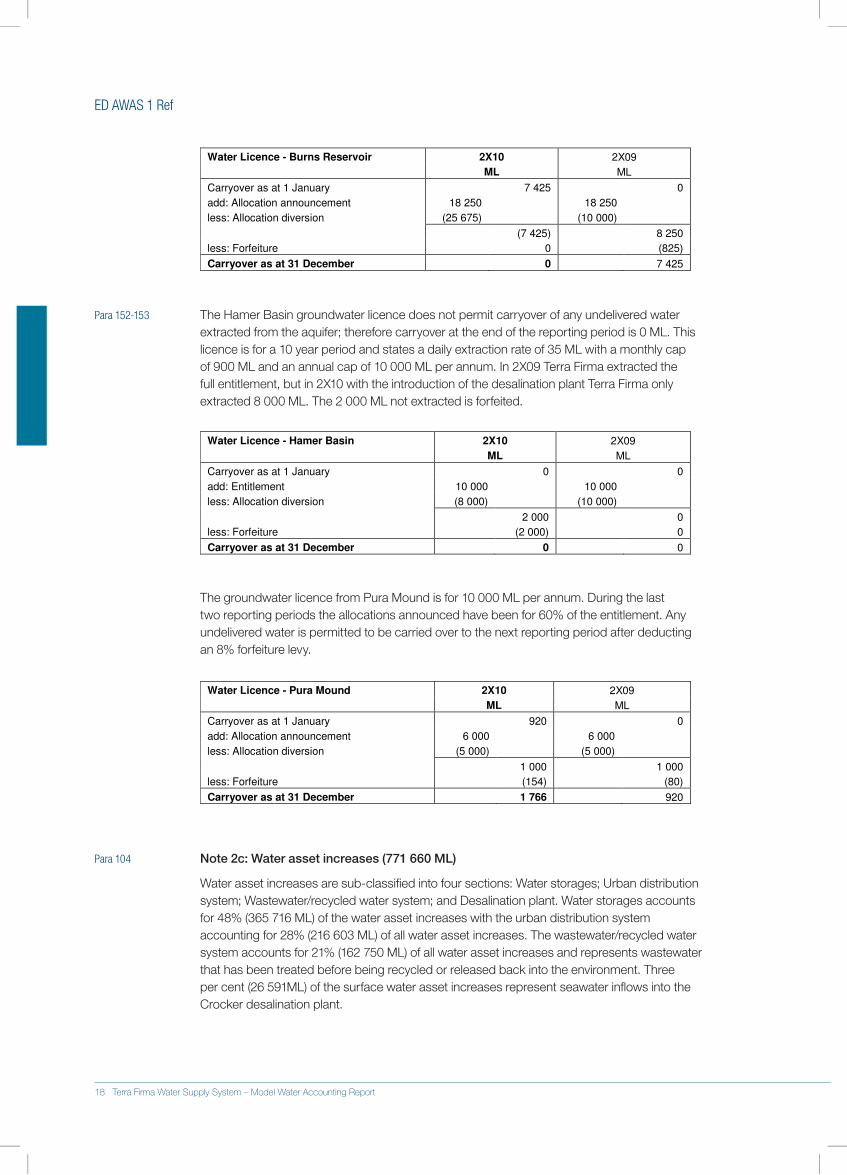
ED AWAS 1 Ref
Water Licence - Burns Reservoir 2X10 2X09
ML ML
Carryover as at 1 January 7 425 0
add: Allocation announcement 18 250 18 250
less: Allocation diversion (25 675) (10 000)
(7 425) 8 250
less: Forfeiture 0 (825)
Carryover as at 31 December 0 7 425
Para 152-153 The.Hamer.Basin.groundwater.licence.does.not.permit.carryover.of.any.undelivered.water.extracted.from.the.aquifer;.therefore.carryover.at.the.end.of.the.reporting.period.is.0.ML..This.licence.is.for.a.10.year.period.and.states.a.daily.extraction.rate.of.35.ML.with.a.monthly.cap.of.900.ML.and.an.annual.cap.of.10 000.ML.per.annum..In.2X09.Terra.Firma.extracted.the.full.entitlement,.but.in.2X10.with.the.introduction.of.the.desalination.plant.Terra.Firma.only.extracted.8.000.ML..The.2.000.ML.not.extracted.is.forfeited.
Water Licence - Hamer Basin 2X10 2X09
ML ML
Carryover as at 1 January 0 0
add: Entitlement 10 000 10 000
less: Allocation diversion (8 000) (10 000)
2 000 0
less: Forfeiture (2 000) 0
Carryover as at 31 December 0 0
The.groundwater.licence.from.Pura.Mound.is.for.10.000.ML.per.annum..During.the.last.two.reporting.periods.the.allocations.announced.have.been.for.60%.of.the.entitlement..Any.undelivered.water.is.permitted.to.be.carried.over.to.the.next.reporting.period.after.deducting.an.8%.forfeiture.levy.
Water Licence - Pura Mound 2X10 2X09
ML ML
Carryover as at 1 January 920 0
add: Allocation announcement 6 000 6 000
less: Allocation diversion (5 000) (5 000)
1 000 1 000
less: Forfeiture (154) (80)
Carryover as at 31 December 1 766 920
Para 104 Note 2c: Water asset increases (771 660 ML)
Water.asset.increases.are.sub-classified.into.four.sections:.Water.storages;.Urban.distribution..system;.Wastewater/recycled.water.system;.and.Desalination.plant..Water.storages.accounts.for.48%.(365.716.ML).of.the.water.asset.increases.with.the.urban.distribution.system.accounting.for.28%.(216.603.ML).of.all.water.asset.increases..The.wastewater/recycled.water.system.accounts.for.21%.(162.750.ML).of.all.water.asset.increases.and.represents.wastewater.that.has.been.treated.before.being.recycled.or.released.back.into.the.environment..Three.per.cent.(26.591ML).of.the.surface.water.asset.increases.represent.seawater.inflows.into.the.Crocker.desalination.plant.
18 Terra Firma Water Supply System – Model Water Accounting Report
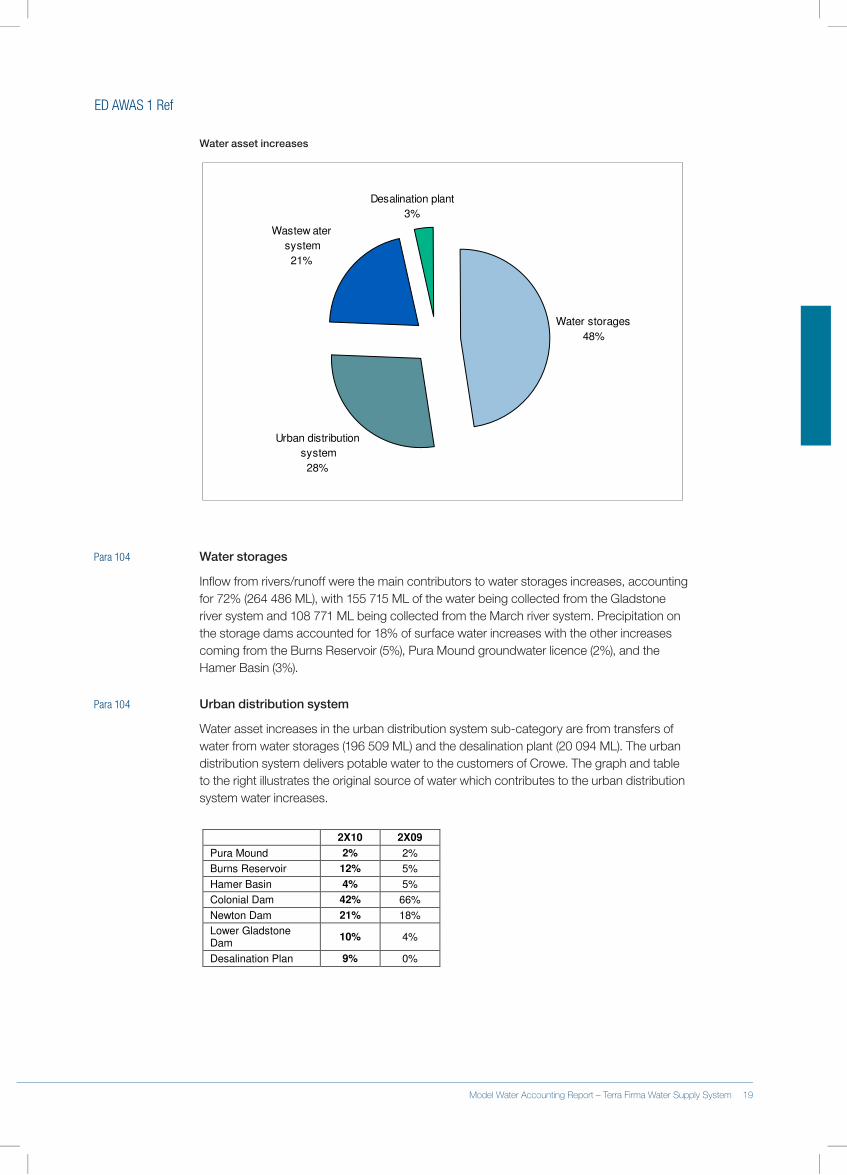
ED AWAS 1 Ref
Water asset increases
Water storages
48%
Urban distribution
system
28%
Desalination plant
3%
Wastew ater
system
21%
Para 104 Water storages
Inflow.from.rivers/runoff.were.the.main.contributors.to.water.storages.increases,.accounting..for.72%.(264.486.ML),.with.155.715.ML.of.the.water.being.collected.from.the.Gladstone..river.system.and.108.771.ML.being.collected.from.the.March.river.system..Precipitation.on..the.storage.dams.accounted.for.18%.of.surface.water.increases.with.the.other.increases.coming.from.the.Burns.Reservoir.(5%),.Pura.Mound.groundwater.licence.(2%),.and.the..Hamer.Basin.(3%).
Para 104 Urban distribution system
Water.asset.increases.in.the.urban.distribution.system.sub-category.are.from.transfers.of.water.from.water.storages.(196.509.ML).and.the.desalination.plant.(20.094.ML)..The.urban.distribution.system.delivers.potable.water.to.the.customers.of.Crowe..The.graph.and.table.to.the.right.illustrates.the.original.source.of.water.which.contributes.to.the.urban.distribution.system.water.increases.
2X10 2X09
Pura Mound 2% 2%
Burns Reservoir 12% 5%
Hamer Basin 4% 5%
Colonial Dam 42% 66%
Newton Dam 21% 18%
Lower Gladstone Dam
10% 4%
Desalination Plan 9% 0%
18 Terra Firma Water Supply System – Model Water Accounting Report Model Water Accounting Report – Terra Firma Water Supply System 19
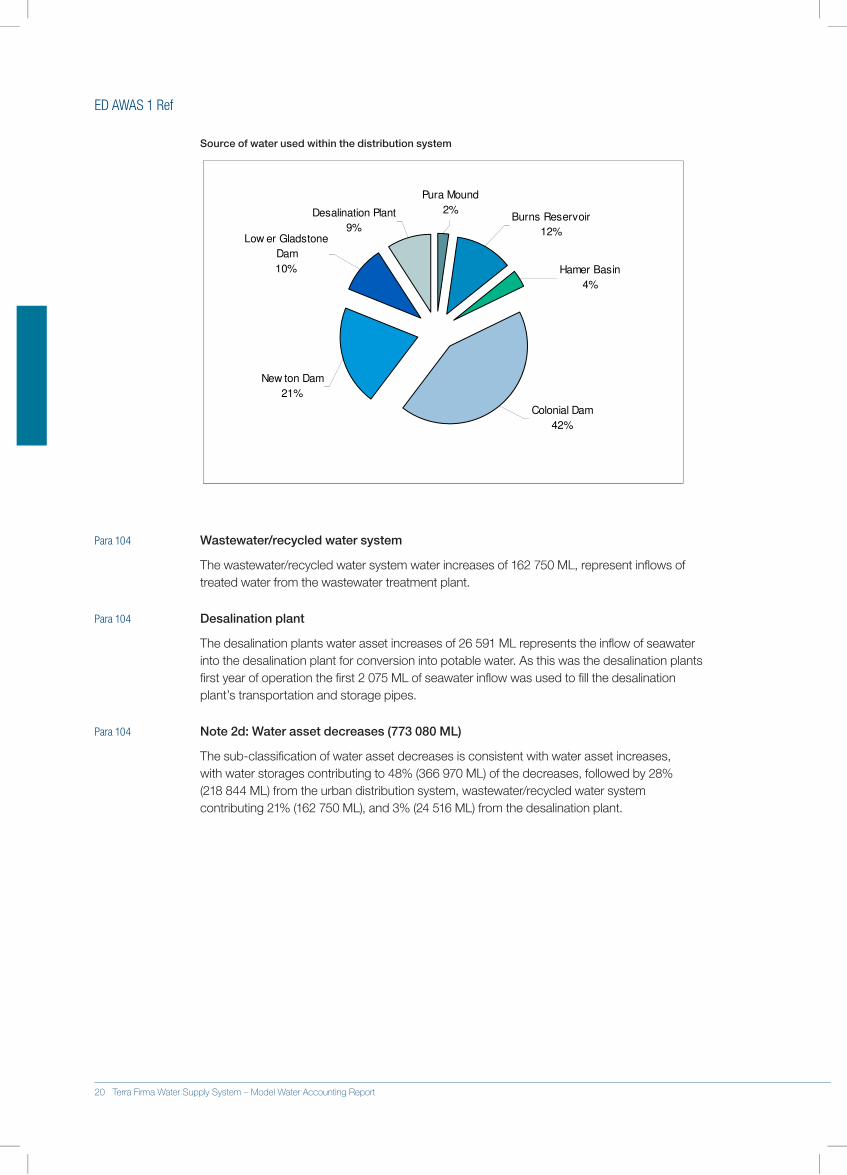
ED AWAS 1 Ref
Source of water used within the distribution system
Colonial Dam
42%
Desalination Plant
9%Low er Gladstone
Dam
10%
New ton Dam
21%
Pura Mound
2%Burns Reservoir
12%
Hamer Basin
4%
Para 104 Wastewater/recycled water system
The.wastewater/recycled.water.system.water.increases.of.162.750.ML,.represent.inflows.of.treated.water.from.the.wastewater.treatment.plant.
Para 104 Desalination plant
The.desalination.plants.water.asset.increases.of.26.591.ML.represents.the.inflow.of.seawater.into.the.desalination.plant.for.conversion.into.potable.water..As.this.was.the.desalination.plants.first.year.of.operation.the.first.2.075.ML.of.seawater.inflow.was.used.to.fill.the.desalination.plant’s.transportation.and.storage.pipes.
Para 104 Note 2d: Water asset decreases (773 080 ML)
The.sub-classification.of.water.asset.decreases.is.consistent.with.water.asset.increases,..with.water.storages.contributing.to.48%.(366.970.ML).of.the.decreases,.followed.by.28%..(218.844.ML).from.the.urban.distribution.system,.wastewater/recycled.water.system.contributing.21%.(162.750.ML),.and.3%.(24.516.ML).from.the.desalination.plant..
20 Terra Firma Water Supply System – Model Water Accounting Report
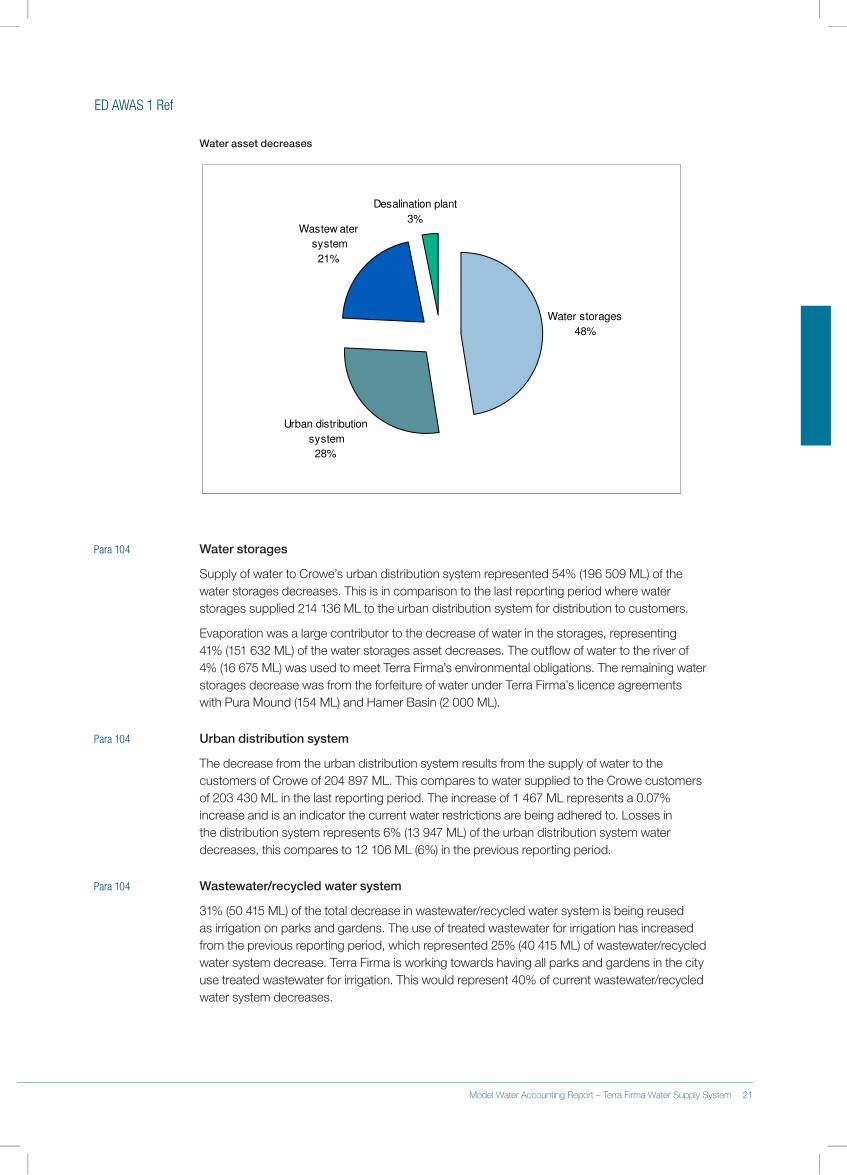
ED AWAS 1 Ref
Water asset decreases
Water storages
48%
Urban distribution
system
28%
Desalination plant
3%Wastew ater
system
21%
Para 104 Water storages
Supply.of.water.to.Crowe’s.urban.distribution.system.represented.54%.(196.509.ML).of.the.water.storages.decreases..This.is.in.comparison.to.the.last.reporting.period.where.water.storages.supplied.214.136.ML.to.the.urban.distribution.system.for.distribution.to.customers.
Evaporation.was.a.large.contributor.to.the.decrease.of.water.in.the.storages,.representing..41%.(151 632 ML).of.the.water.storages.asset.decreases..The.outflow.of.water.to.the.river.of.4%.(16.675 ML).was.used.to.meet.Terra.Firma’s.environmental.obligations..The.remaining.water.storages.decrease.was.from.the.forfeiture.of.water.under.Terra.Firma’s.licence.agreements.with.Pura.Mound.(154.ML).and.Hamer Basin.(2.000.ML).
Para 104 Urban distribution system
The.decrease.from.the.urban.distribution.system.results.from.the.supply.of.water.to.the.customers.of.Crowe.of.204.897.ML..This.compares.to.water.supplied.to.the.Crowe.customers.of.203.430.ML.in.the.last.reporting.period..The.increase.of.1.467.ML.represents.a.0.07%.increase.and.is.an.indicator.the.current.water.restrictions.are.being.adhered.to..Losses.in.the.distribution.system.represents.6%.(13.947 ML).of.the.urban.distribution.system.water.decreases,.this.compares.to.12.106.ML.(6%).in.the.previous.reporting.period.
Para 104 Wastewater/recycled water system
31%.(50.415.ML).of.the.total.decrease.in.wastewater/recycled.water.system.is.being.reused.as.irrigation.on.parks.and.gardens..The.use.of.treated.wastewater.for.irrigation.has.increased.from.the.previous.reporting.period,.which.represented.25%.(40.415.ML).of.wastewater/recycled.water.system.decrease..Terra.Firma.is.working.towards.having.all.parks.and.gardens.in.the.city.use.treated.wastewater.for.irrigation..This.would.represent.40%.of.current.wastewater/recycled.water.system.decreases.
20 Terra Firma Water Supply System – Model Water Accounting Report Model Water Accounting Report – Terra Firma Water Supply System 21
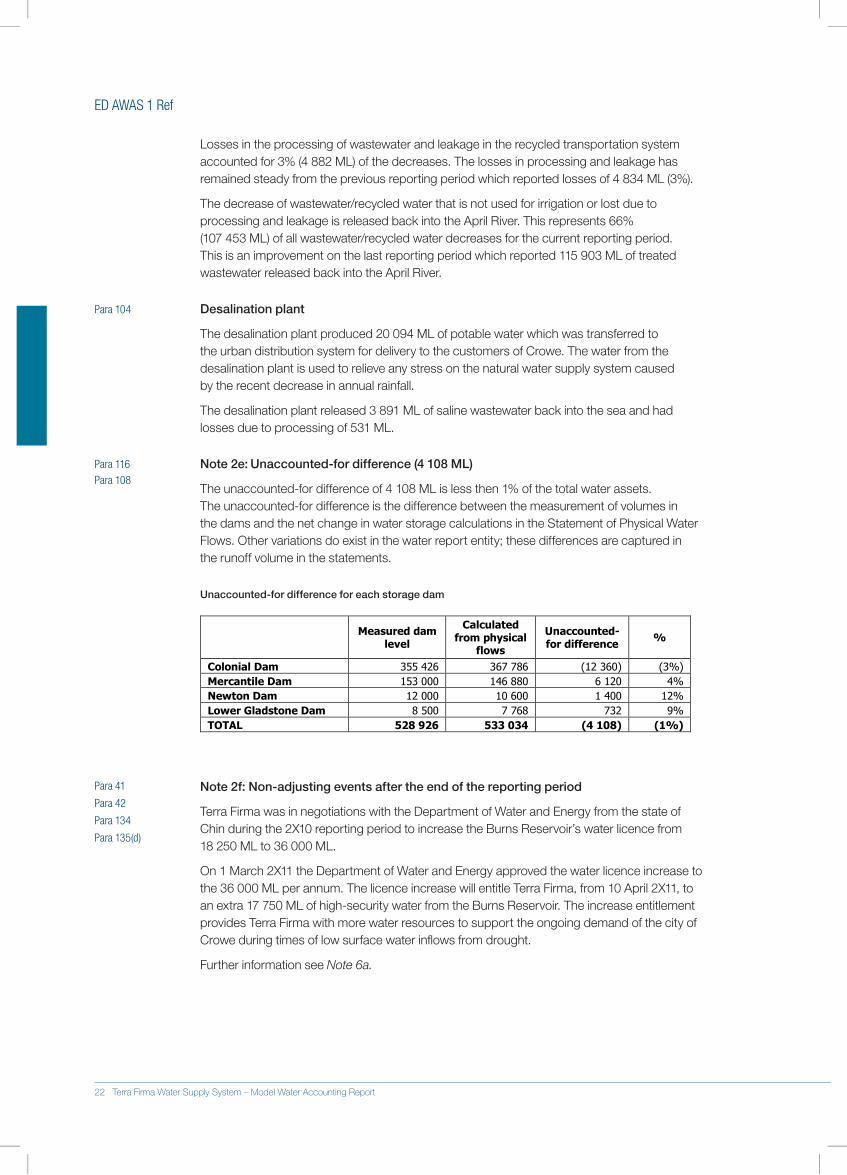
ED AWAS 1 Ref
Losses.in.the.processing.of.wastewater.and.leakage.in.the.recycled.transportation.system.accounted.for.3%.(4.882.ML).of.the.decreases..The.losses.in.processing.and.leakage.has.remained.steady.from.the.previous.reporting.period.which.reported.losses.of.4.834.ML.(3%)..
The.decrease.of.wastewater/recycled.water.that.is.not.used.for.irrigation.or.lost.due.to.processing.and.leakage.is.released.back.into.the.April.River..This.represents.66%..(107.453.ML).of.all.wastewater/recycled.water.decreases.for.the.current.reporting.period..This.is.an.improvement.on.the.last.reporting.period.which.reported.115.903.ML.of.treated.wastewater.released.back.into.the.April.River.
Para 104 Desalination plant
The.desalination.plant.produced.20.094.ML.of.potable.water.which.was.transferred.to.the.urban.distribution.system.for.delivery.to.the.customers.of.Crowe..The.water.from.the.desalination.plant.is.used.to.relieve.any.stress.on.the.natural.water.supply.system.caused..by.the.recent.decrease.in.annual.rainfall..
The.desalination.plant.released.3.891.ML.of.saline.wastewater.back.into.the.sea.and.had.losses.due.to.processing.of.531.ML..
Note 2e: Unaccounted-for difference (4 108 ML)
The.unaccounted-for.difference.of.4.108.ML.is.less.then.1%.of.the.total.water.assets..The unaccounted-for.difference.is.the.difference.between.the.measurement.of.volumes.in..the.dams.and.the.net.change.in.water.storage.calculations.in.the.Statement.of.Physical.Water.Flows..Other.variations.do.exist.in.the.water.report.entity;.these.differences.are.captured.in..the.runoff.volume.in.the.statements.
Unaccounted-for difference for each storage dam
Note 2f: Non-adjusting events after the end of the reporting period
Terra.Firma.was.in.negotiations.with.the.Department.of.Water.and.Energy.from.the.state.of..Chin.during.the.2X10.reporting.period.to.increase.the.Burns.Reservoir’s.water.licence.from..18.250.ML.to.36.000 ML..
On.1.March.2X11.the.Department.of.Water.and.Energy.approved.the.water.licence.increase.to.the.36 000 ML.per.annum..The.licence.increase.will.entitle.Terra.Firma,.from.10.April.2X11,.to.an.extra.17 750 ML.of.high-security.water.from.the.Burns.Reservoir..The.increase.entitlement.provides.Terra Firma.with.more.water.resources.to.support.the.ongoing.demand.of.the.city.of.Crowe.during.times.of.low.surface.water.inflows.from.drought.
Further.information.see.Note 6a.
Para 41
Para 42
Para 134
Para 135(d)
Para 116Para 108
22 Terra Firma Water Supply System – Model Water Accounting Report
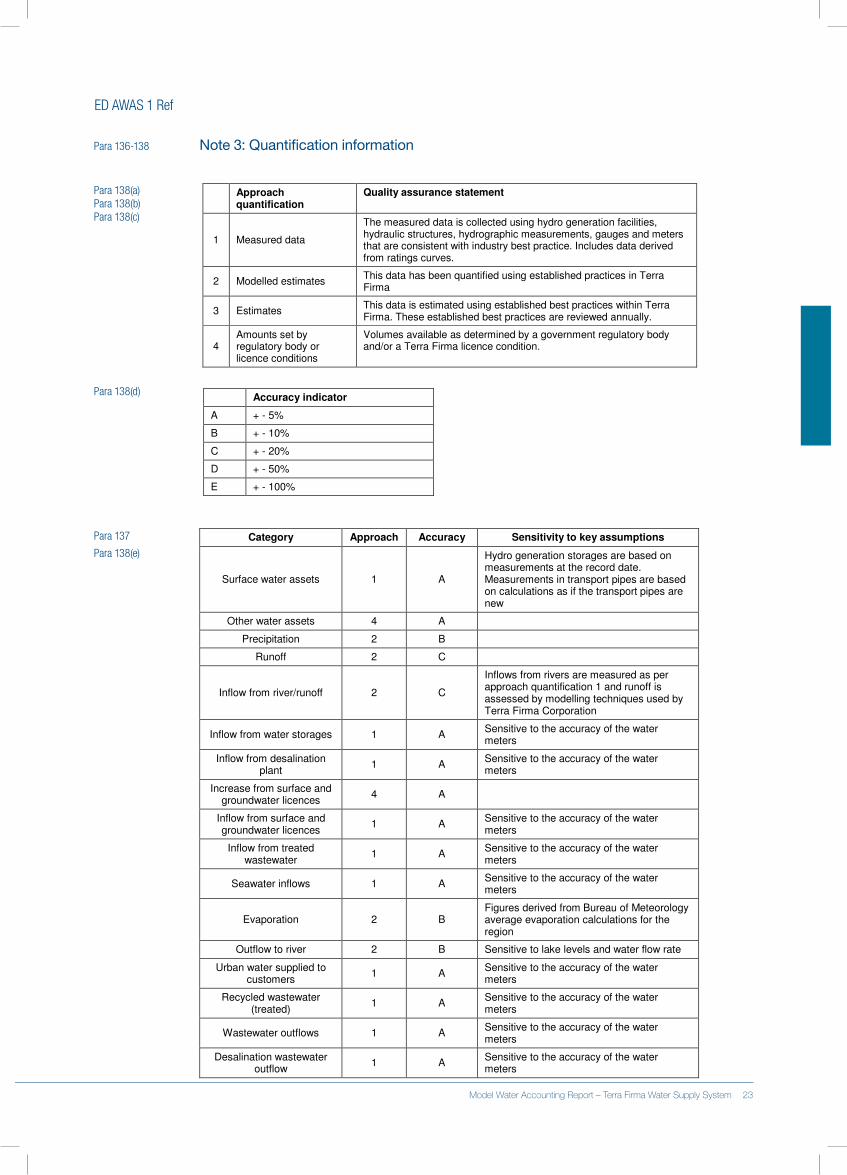
ED AWAS 1 Ref
Para 136-138 Note 3: Quantification information
Approach quantification
Quality assurance statement
1 Measured data
The measured data is collected using hydro generation facilities, hydraulic structures, hydrographic measurements, gauges and meters that are consistent with industry best practice. Includes data derived from ratings curves.
2 Modelled estimates This data has been quantified using established practices in Terra Firma
3 Estimates This data is estimated using established best practices within Terra Firma. These established best practices are reviewed annually.
4 Amounts set by regulatory body or licence conditions
Volumes available as determined by a government regulatory body and/or a Terra Firma licence condition.
Accuracy indicator
A + - 5%
B + - 10%
C + - 20%
D + - 50%
E + - 100%
Category Approach Accuracy Sensitivity to key assumptions
Surface water assets 1 A
Hydro generation storages are based on measurements at the record date. Measurements in transport pipes are based on calculations as if the transport pipes are new
Other water assets 4 A
Precipitation 2 B
Runoff 2 C
Inflow from river/runoff 2 C
Inflows from rivers are measured as per approach quantification 1 and runoff is assessed by modelling techniques used by Terra Firma Corporation
Inflow from water storages 1 A Sensitive to the accuracy of the water meters
Inflow from desalination plant
1 A Sensitive to the accuracy of the water meters
Increase from surface and groundwater licences
4 A
Inflow from surface and groundwater licences
1 A Sensitive to the accuracy of the water meters
Inflow from treated wastewater
1 A Sensitive to the accuracy of the water meters
Seawater inflows 1 A Sensitive to the accuracy of the water meters
Evaporation 2 B Figures derived from Bureau of Meteorology average evaporation calculations for the region
Outflow to river 2 B Sensitive to lake levels and water flow rate
Urban water supplied to customers
1 A Sensitive to the accuracy of the water meters
Recycled wastewater (treated)
1 A Sensitive to the accuracy of the water meters
Wastewater outflows 1 A Sensitive to the accuracy of the water meters
Desalination wastewater outflow
1 A Sensitive to the accuracy of the water meters
Para 138(d)
Para 137
Para 138(e)
Para 138(a)Para 138(b)Para 138(c)
22 Terra Firma Water Supply System – Model Water Accounting Report Model Water Accounting Report – Terra Firma Water Supply System 23
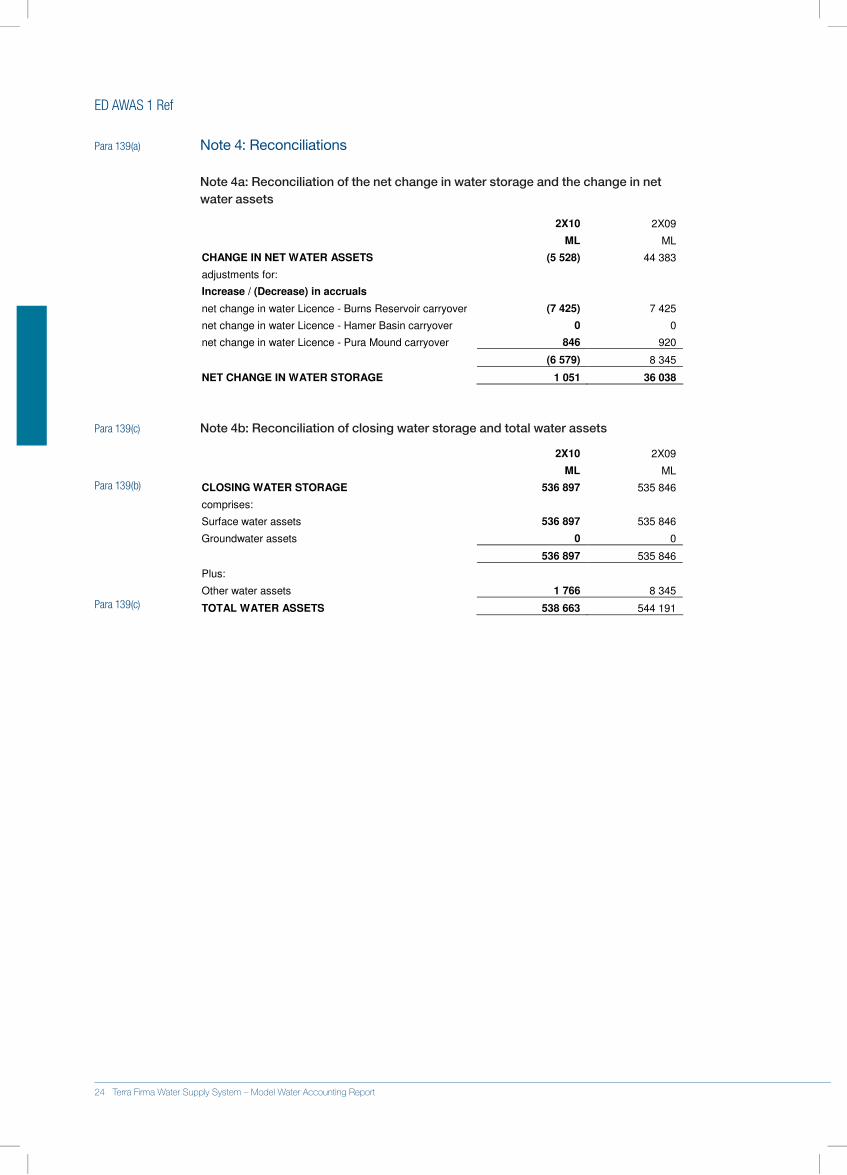
ED AWAS 1 Ref
Para 139(a) Note 4: Reconciliations
Note 4a: Reconciliation of the net change in water storage and the change in net water assets
2X10 2X09
ML ML
CHANGE IN NET WATER ASSETS (5 528) 44 383
adjustments for:
Increase / (Decrease) in accruals
net change in water Licence - Burns Reservoir carryover (7 425) 7 425
net change in water Licence - Hamer Basin carryover 0 0
net change in water Licence - Pura Mound carryover 846 920
(6 579) 8 345
NET CHANGE IN WATER STORAGE 1 051 36 038
Para 139(c) Note 4b: Reconciliation of closing water storage and total water assets
2X10 2X09
ML ML
CLOSING WATER STORAGE 536 897 535 846
comprises:
Surface water assets 536 897 535 846
Groundwater assets 0 0
536 897 535 846
Plus:
Other water assets 1 766 8 345
TOTAL WATER ASSETS 538 663 544 191
Para 139(b)
Para 139(c)
24 Terra Firma Water Supply System – Model Water Accounting Report
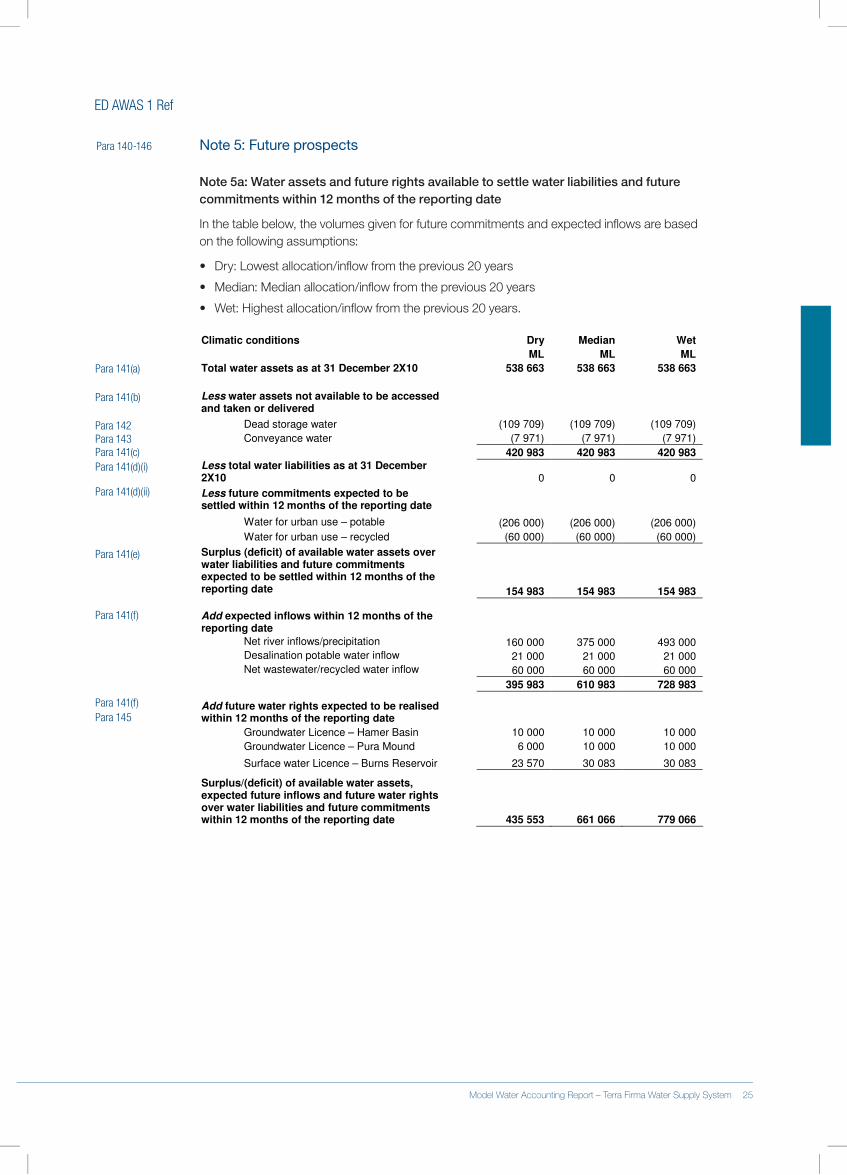
ED AWAS 1 Ref
Para 140-146 Note 5: Future prospects
Note 5a: Water assets and future rights available to settle water liabilities and future commitments within 12 months of the reporting date
In.the.table.below,.the.volumes.given.for.future.commitments.and.expected.inflows.are.based.on.the.following.assumptions:
•. Dry:.Lowest.allocation/inflow.from.the.previous.20.years
•. Median:.Median.allocation/inflow.from.the.previous.20.years
•. Wet:.Highest.allocation/inflow.from.the.previous.20.years.
Climatic conditions Dry Median Wet
ML ML ML
Total water assets as at 31 December 2X10 538 663 538 663 538 663
Less water assets not available to be accessed and taken or delivered
Dead storage water (109 709) (109 709) (109 709)
Conveyance water (7 971) (7 971) (7 971)
420 983 420 983 420 983
Less total water liabilities as at 31 December 2X10 0 0 0
Less future commitments expected to be settled within 12 months of the reporting date
Water for urban use – potable (206 000) (206 000) (206 000)
Water for urban use – recycled (60 000) (60 000) (60 000)
Surplus (deficit) of available water assets over water liabilities and future commitments expected to be settled within 12 months of the reporting date 154 983 154 983 154 983
Add expected inflows within 12 months of the reporting date
Net river inflows/precipitation 160 000 375 000 493 000
Desalination potable water inflow 21 000 21 000 21 000
Net wastewater/recycled water inflow 60 000 60 000 60 000
395 983 610 983 728 983
Add future water rights expected to be realised within 12 months of the reporting date
Groundwater Licence – Hamer Basin 10 000 10 000 10 000
Groundwater Licence – Pura Mound 6 000 10 000 10 000
Surface water Licence – Burns Reservoir 23 570 30 083 30 083
Surplus/(deficit) of available water assets, expected future inflows and future water rights over water liabilities and future commitments within 12 months of the reporting date 435 553 661 066 779 066
Para 141(a)
Para 141(b)
Para 142Para 143Para 141(c)Para 141(d)(i)
Para 141(d)(ii)
Para 141(e)
Para 141(f)
Para 141(f)Para 145
24 Terra Firma Water Supply System – Model Water Accounting Report Model Water Accounting Report – Terra Firma Water Supply System 25
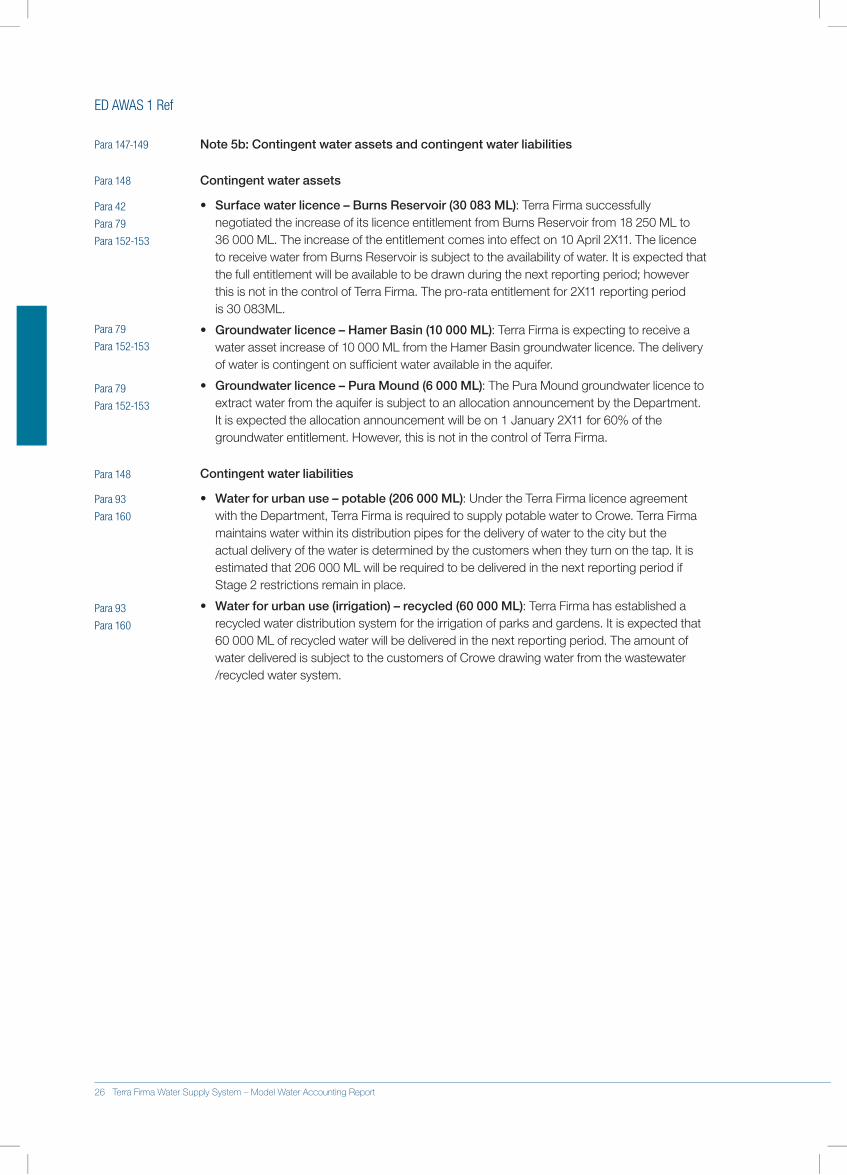
ED AWAS 1 Ref
Para 147-149 Note 5b: Contingent water assets and contingent water liabilities
Para 148 Contingent water assets
•. .Surface water licence – Burns Reservoir (30 083 ML):.Terra.Firma.successfully.negotiated.the.increase.of.its.licence.entitlement.from.Burns.Reservoir.from.18.250.ML.to.36.000.ML..The.increase.of.the.entitlement.comes.into.effect.on.10.April.2X11..The.licence.to.receive.water.from.Burns.Reservoir.is.subject.to.the.availability.of.water..It.is.expected.that.the.full.entitlement.will.be.available.to.be.drawn.during.the.next.reporting.period;.however.this.is.not.in.the.control.of.Terra.Firma..The.pro-rata.entitlement.for.2X11.reporting.period..is.30.083ML.
•. .Groundwater licence – Hamer Basin (10 000 ML):.Terra.Firma.is.expecting.to.receive.a.water.asset.increase.of.10.000.ML.from.the.Hamer.Basin.groundwater.licence..The.delivery.of.water.is.contingent.on.sufficient.water.available.in.the.aquifer.
•. Groundwater licence – Pura Mound (6 000 ML):.The.Pura.Mound.groundwater.licence.to.extract.water.from.the.aquifer.is.subject.to.an.allocation.announcement.by.the.Department..It.is.expected.the.allocation.announcement.will.be.on.1.January.2X11.for.60%.of.the.groundwater.entitlement..However,.this.is.not.in.the.control.of.Terra.Firma.
Contingent water liabilities
•. Water for urban use – potable (206 000 ML):.Under.the.Terra.Firma.licence.agreement.with.the.Department,.Terra.Firma.is.required.to.supply.potable.water.to.Crowe..Terra.Firma.maintains.water.within.its.distribution.pipes.for.the.delivery.of.water.to.the.city.but.the.actual.delivery.of.the.water.is.determined.by.the.customers.when.they.turn.on.the.tap..It.is.estimated.that.206.000.ML.will.be.required.to.be.delivered.in.the.next.reporting.period.if.Stage.2.restrictions.remain.in.place.
•. Water for urban use (irrigation) – recycled (60 000 ML):.Terra.Firma.has.established.a.recycled.water.distribution.system.for.the.irrigation.of.parks.and.gardens..It.is.expected.that.60.000.ML.of.recycled.water.will.be.delivered.in.the.next.reporting.period..The.amount.of.water.delivered.is.subject.to.the.customers.of.Crowe.drawing.water.from.the.wastewater./recycled.water.system.
Para 42
Para 79
Para 152-153
Para 79
Para 152-153
Para 79
Para 152-153
Para 148
Para 93
Para 160
Para 93
Para 160
26 Terra Firma Water Supply System – Model Water Accounting Report
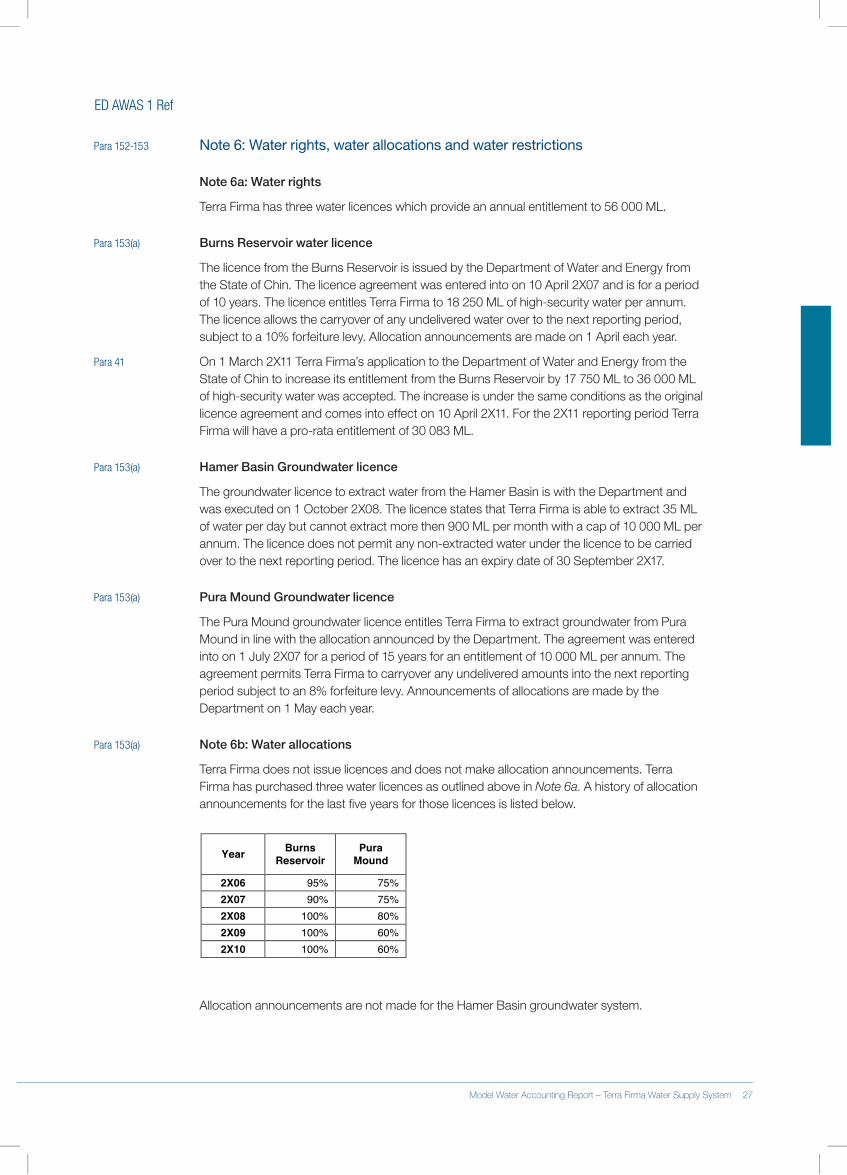
ED AWAS 1 Ref
Para 152-153 Note 6: Water rights, water allocations and water restrictions
Note 6a: Water rights
Terra.Firma.has.three.water.licences.which.provide.an.annual.entitlement.to.56.000.ML.
Para 153(a) Burns Reservoir water licence
The.licence.from.the.Burns.Reservoir.is.issued.by.the.Department.of.Water.and.Energy.from.the.State.of.Chin..The.licence.agreement.was.entered.into.on.10.April.2X07.and.is.for.a.period.of.10.years..The licence.entitles.Terra.Firma.to.18.250.ML.of.high-security.water.per.annum..The.licence.allows.the.carryover.of.any.undelivered.water.over.to.the.next.reporting.period,.subject.to.a.10%.forfeiture.levy..Allocation.announcements.are.made.on.1.April.each.year.
Para 41 On.1.March.2X11.Terra.Firma’s.application.to.the.Department.of.Water.and.Energy.from.the.State.of.Chin.to.increase.its.entitlement.from.the.Burns.Reservoir.by.17.750.ML.to.36.000.ML.of.high-security.water.was.accepted..The.increase.is.under.the.same.conditions.as.the.original.licence.agreement.and.comes.into.effect.on.10.April.2X11..For.the.2X11.reporting.period.Terra.Firma.will.have.a.pro-rata.entitlement.of.30.083.ML.
Para 153(a) Hamer Basin Groundwater licence
The.groundwater.licence.to.extract.water.from.the.Hamer.Basin.is.with.the.Department.and.was.executed.on.1.October.2X08..The.licence.states.that.Terra.Firma.is.able.to.extract.35.ML.of.water.per.day.but.cannot.extract.more.then.900.ML.per.month.with.a.cap.of.10.000.ML.per.annum..The.licence.does.not.permit.any.non-extracted.water.under.the.licence.to.be.carried.over.to.the.next.reporting.period..The licence.has.an.expiry.date.of.30.September.2X17.
Para 153(a) Pura Mound Groundwater licence
The.Pura.Mound.groundwater.licence.entitles.Terra.Firma.to.extract.groundwater.from.Pura.Mound.in.line.with.the.allocation.announced.by.the.Department..The.agreement.was.entered.into.on.1.July.2X07.for.a.period.of.15.years.for.an.entitlement.of.10.000.ML.per.annum..The.agreement.permits.Terra.Firma.to.carryover.any.undelivered.amounts.into.the.next.reporting.period.subject.to.an.8%.forfeiture.levy..Announcements.of.allocations.are.made.by.the.Department.on.1.May.each.year.
Para 153(a) Note 6b: Water allocations
Terra.Firma.does.not.issue.licences.and.does.not.make.allocation.announcements..Terra.Firma.has.purchased.three.water.licences.as.outlined.above.in.Note 6a..A.history.of.allocation.announcements.for.the.last.five.years.for.those.licences.is.listed.below.
Year Burns Reservoir
Pura Mound
2X06 95% 75% 2X07 90% 75% 2X08 100% 80% 2X09 100% 60% 2X10 100% 60%
Allocation.announcements.are.not.made.for.the.Hamer.Basin.groundwater.system.
26 Terra Firma Water Supply System – Model Water Accounting Report Model Water Accounting Report – Terra Firma Water Supply System 27
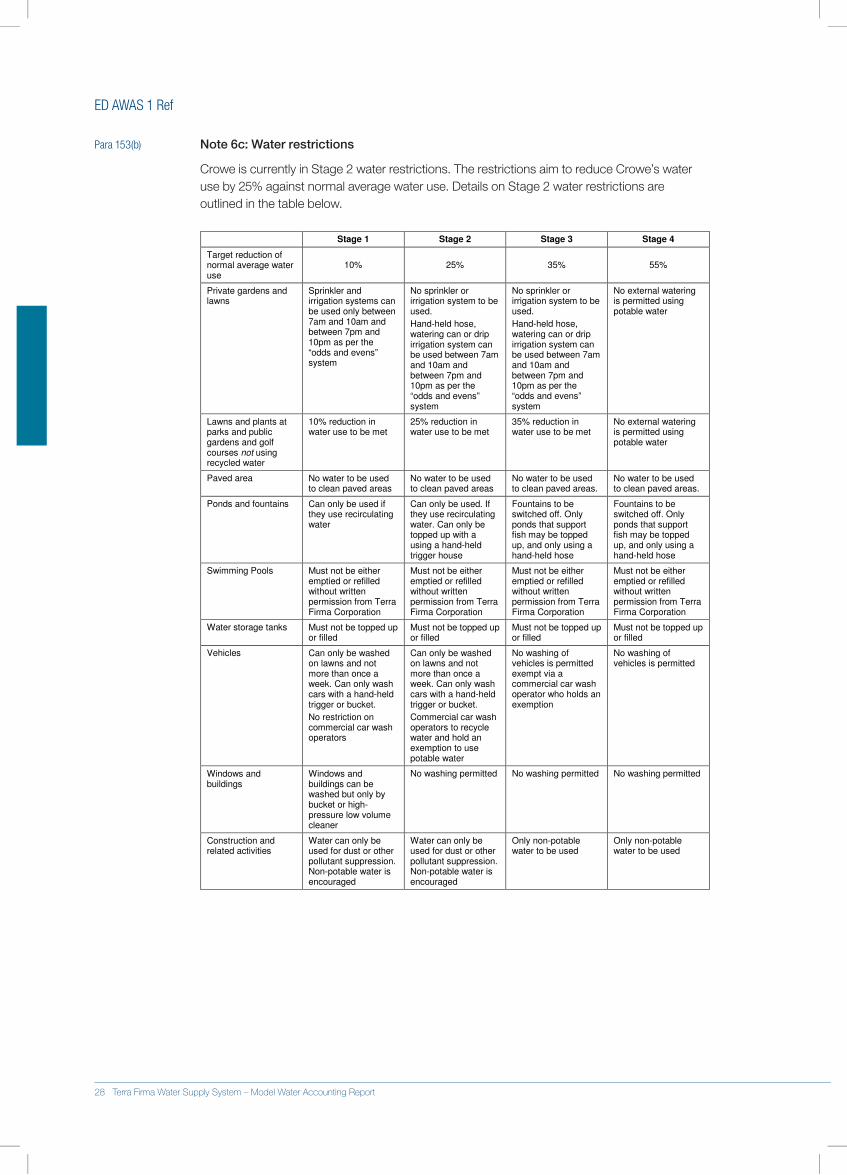
ED AWAS 1 Ref
Para 153(b) Note 6c: Water restrictions
Crowe.is.currently.in.Stage.2.water.restrictions..The.restrictions.aim.to.reduce.Crowe’s.water.use.by.25%.against.normal.average.water.use..Details.on.Stage.2.water.restrictions.are.outlined.in.the.table.below.
Stage 1 Stage 2 Stage 3 Stage 4
Target reduction of normal average water use
10% 25% 35% 55%
Private gardens and lawns
Sprinkler and irrigation systems can be used only between 7am and 10am and between 7pm and 10pm as per the “odds and evens” system
No sprinkler or irrigation system to be used.
Hand-held hose, watering can or drip irrigation system can be used between 7am and 10am and between 7pm and 10pm as per the “odds and evens” system
No sprinkler or irrigation system to be used.
Hand-held hose, watering can or drip irrigation system can be used between 7am and 10am and between 7pm and 10pm as per the “odds and evens” system
No external watering is permitted using potable water
Lawns and plants at parks and public gardens and golf courses not using recycled water
10% reduction in water use to be met
25% reduction in water use to be met
35% reduction in water use to be met
No external watering is permitted using potable water
Paved area No water to be used to clean paved areas
No water to be used to clean paved areas
No water to be used to clean paved areas.
No water to be used to clean paved areas.
Ponds and fountains Can only be used if they use recirculating water
Can only be used. If they use recirculating water. Can only be topped up with a using a hand-held trigger house
Fountains to be switched off. Only ponds that support fish may be topped up, and only using a hand-held hose
Fountains to be switched off. Only ponds that support fish may be topped up, and only using a hand-held hose
Swimming Pools Must not be either emptied or refilled without written permission from Terra Firma Corporation
Must not be either emptied or refilled without written permission from Terra Firma Corporation
Must not be either emptied or refilled without written permission from Terra Firma Corporation
Must not be either emptied or refilled without written permission from Terra Firma Corporation
Water storage tanks Must not be topped up or filled
Must not be topped up or filled
Must not be topped up or filled
Must not be topped up or filled
Vehicles Can only be washed on lawns and not more than once a week. Can only wash cars with a hand-held trigger or bucket.
No restriction on commercial car wash operators
Can only be washed on lawns and not more than once a week. Can only wash cars with a hand-held trigger or bucket.
Commercial car wash operators to recycle water and hold an exemption to use potable water
No washing of vehicles is permitted exempt via a commercial car wash operator who holds an exemption
No washing of vehicles is permitted
Windows and buildings
Windows and buildings can be washed but only by bucket or high-pressure low volume cleaner
No washing permitted No washing permitted No washing permitted
Construction and related activities
Water can only be used for dust or other pollutant suppression. Non-potable water is encouraged
Water can only be used for dust or other pollutant suppression. Non-potable water is encouraged
Only non-potable water to be used
Only non-potable water to be used
28 Terra Firma Water Supply System – Model Water Accounting Report
ED AWAS 1 Ref
Para 154-155 Note 7: Water market activity
Terra.Firma.under.the.licence.issued.from.the.Department.is.responsible.for.the.day-to-day.management.of.the.water.resources.within.the.confines.of.its.licence.agreement..The.water.within.the.catchment.is.used.solely.for.the.urban.supply.to.Crowe..Physical.water.within.the.water.supply.system.is.not.permitted,.under.the.licence.agreement,.to.be.traded.
Terra.Firma.has.purchased.three.water.licences.to.receive.water.from.outside.the.Crowe.water.supply.system..The.details.of.the.licences.can.be.found.in.Note 6.
28 Terra Firma Water Supply System – Model Water Accounting Report Model Water Accounting Report – Terra Firma Water Supply System 29
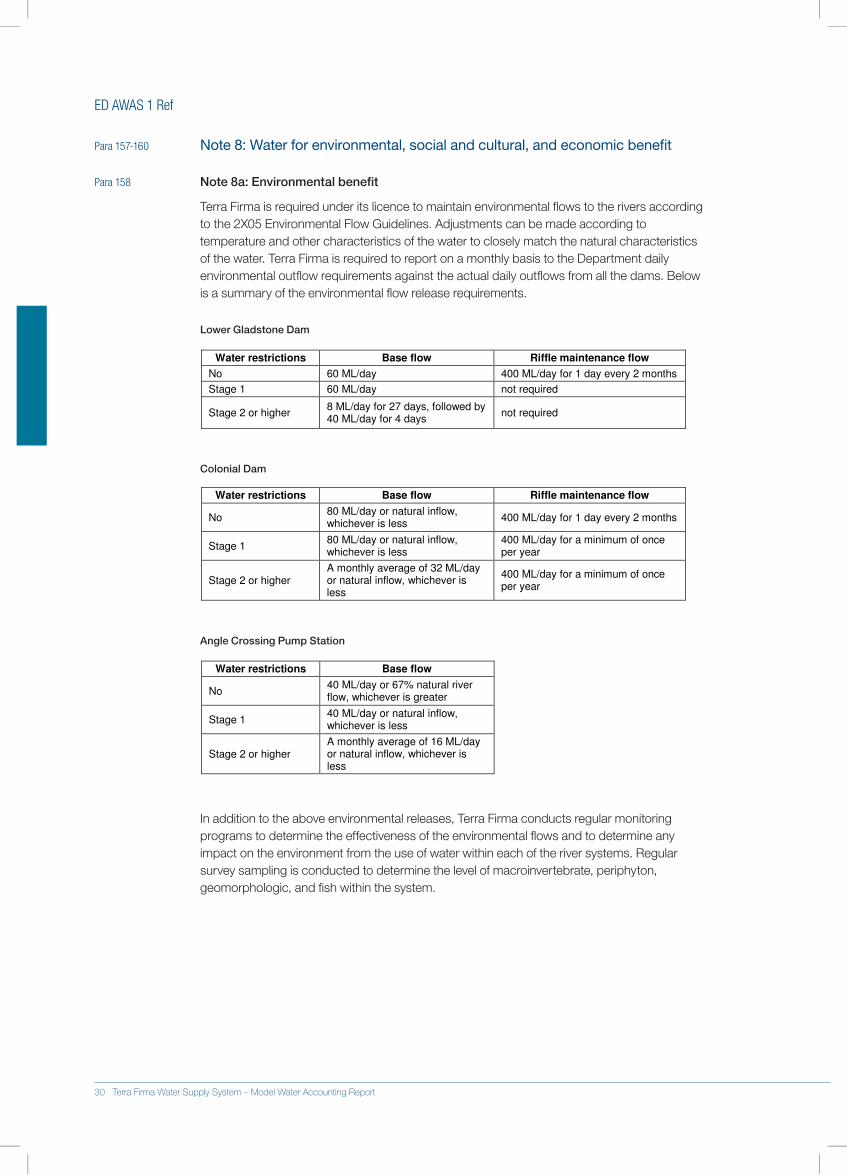
ED AWAS 1 Ref
Para 157-160 Note 8: Water for environmental, social and cultural, and economic benefit
Para 158 Note 8a: Environmental benefit
Terra.Firma.is.required.under.its.licence.to.maintain.environmental.flows.to.the.rivers.according.to.the.2X05.Environmental.Flow.Guidelines..Adjustments.can.be.made.according.to.temperature.and.other.characteristics.of.the.water.to.closely.match.the.natural.characteristics.of.the.water..Terra.Firma.is.required.to.report.on.a.monthly.basis.to.the.Department.daily.environmental.outflow.requirements.against.the.actual.daily.outflows.from.all.the.dams..Below.is.a.summary.of.the.environmental.flow.release requirements.
Lower Gladstone Dam
Water restrictions Base flow Riffle maintenance flow
No 60 ML/day 400 ML/day for 1 day every 2 months
Stage 1 60 ML/day not required
Stage 2 or higher 8 ML/day for 27 days, followed by 40 ML/day for 4 days
not required
Colonial Dam
Water restrictions Base flow Riffle maintenance flow
No 80 ML/day or natural inflow, whichever is less
400 ML/day for 1 day every 2 months
Stage 1 80 ML/day or natural inflow, whichever is less
400 ML/day for a minimum of once per year
Stage 2 or higher A monthly average of 32 ML/day or natural inflow, whichever is less
400 ML/day for a minimum of once per year
Angle Crossing Pump Station
Water restrictions Base flow
No 40 ML/day or 67% natural river flow, whichever is greater
Stage 1 40 ML/day or natural inflow, whichever is less
Stage 2 or higher A monthly average of 16 ML/day or natural inflow, whichever is less
In.addition.to.the.above.environmental.releases,.Terra.Firma.conducts.regular.monitoring.programs.to.determine.the.effectiveness.of.the.environmental.flows.and.to.determine.any.impact.on.the.environment.from.the.use.of.water.within.each.of.the.river.systems..Regular.survey.sampling.is.conducted.to.determine.the.level.of.macroinvertebrate,.periphyton,.geomorphologic,.and.fish.within.the.system.
30 Terra Firma Water Supply System – Model Water Accounting Report
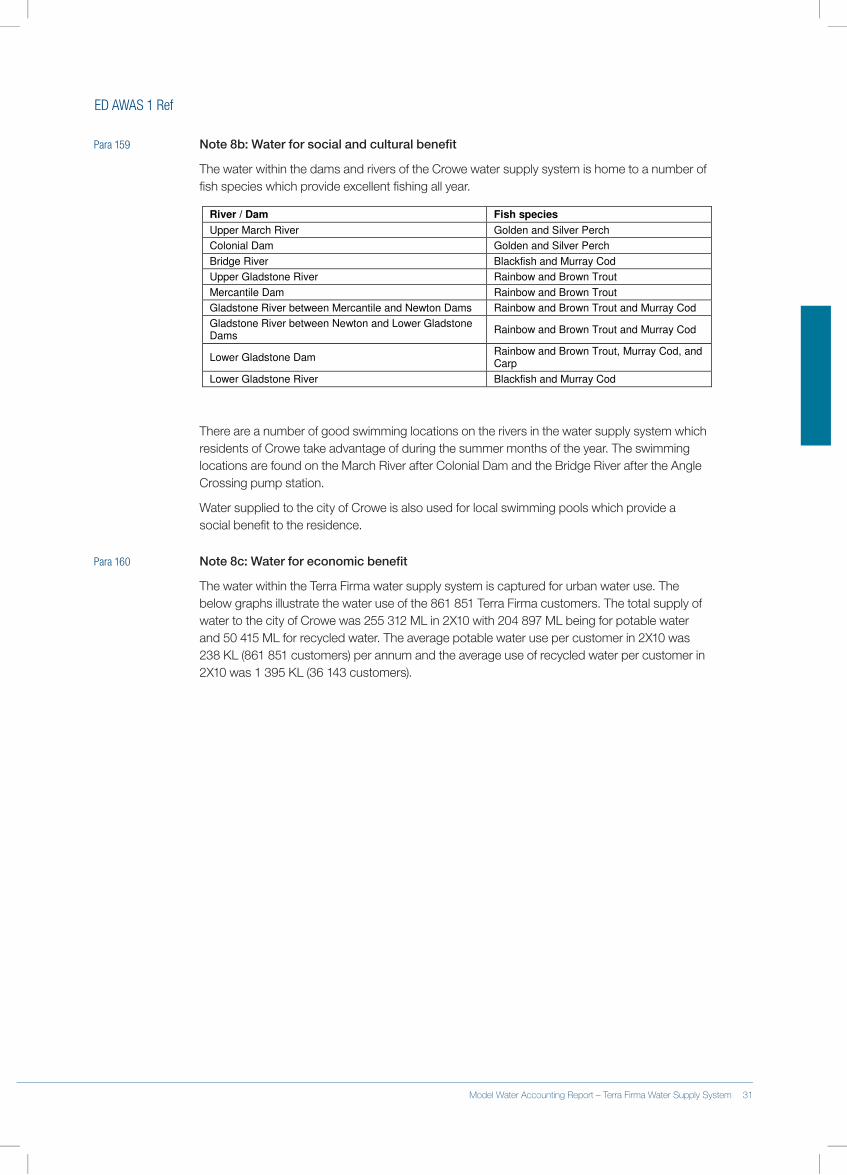
ED AWAS 1 Ref
Para 159 Note 8b: Water for social and cultural benefit
The.water.within.the.dams.and.rivers.of.the.Crowe.water.supply.system.is.home.to.a.number.of.fish.species.which.provide.excellent.fishing.all.year.
River / Dam Fish species
Upper March River Golden and Silver Perch
Colonial Dam Golden and Silver Perch
Bridge River Blackfish and Murray Cod
Upper Gladstone River Rainbow and Brown Trout
Mercantile Dam Rainbow and Brown Trout
Gladstone River between Mercantile and Newton Dams Rainbow and Brown Trout and Murray Cod
Gladstone River between Newton and Lower Gladstone Dams
Rainbow and Brown Trout and Murray Cod
Lower Gladstone Dam Rainbow and Brown Trout, Murray Cod, and Carp
Lower Gladstone River Blackfish and Murray Cod
There.are.a.number.of.good.swimming.locations.on.the.rivers.in.the.water.supply.system.which.residents.of.Crowe.take.advantage.of.during.the.summer.months.of.the.year..The.swimming.locations.are.found.on.the.March.River.after.Colonial.Dam.and.the.Bridge.River.after.the.Angle.Crossing.pump.station.
Water.supplied.to.the.city.of.Crowe.is.also.used.for.local.swimming.pools.which.provide.a.social.benefit.to.the.residence..
Para 160 Note 8c: Water for economic benefit
The.water.within.the.Terra.Firma.water.supply.system.is.captured.for.urban.water.use..The.below.graphs.illustrate.the.water.use.of.the.861.851.Terra.Firma.customers..The.total.supply.of.water.to.the.city.of.Crowe.was.255.312.ML.in.2X10.with.204.897.ML.being.for.potable.water.and.50.415.ML.for.recycled.water..The.average.potable.water.use.per.customer.in.2X10.was.238.KL.(861.851.customers).per.annum.and.the.average.use.of.recycled.water.per.customer.in.2X10.was.1.395.KL.(36.143.customers).
30 Terra Firma Water Supply System – Model Water Accounting Report Model Water Accounting Report – Terra Firma Water Supply System 31
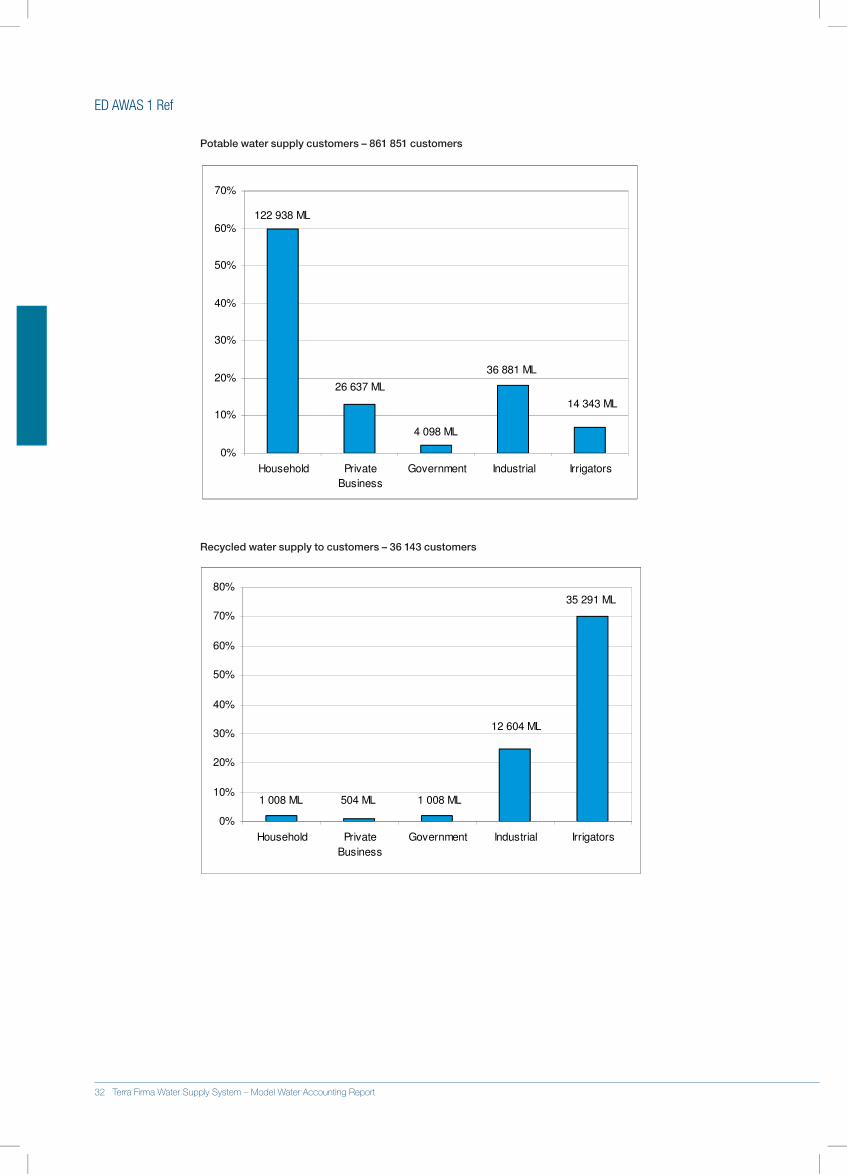
ED AWAS 1 Ref
Potable water supply customers – 861 851 customers
.
0%
10%
20%
30%
40%
50%
60%
70%
Household Private
Business
Government Industrial Irrigators
122 938 ML
26 637 ML
36 881 ML
14 343 ML
4 098 ML
Recycled water supply to customers – 36 143 customers
0%
10%
20%
30%
40%
50%
60%
70%
80%
Household Private
Business
Government Industrial Irrigators
1 008 ML
12 604 ML
35 291 ML
1 008 ML504 ML
32 Terra Firma Water Supply System – Model Water Accounting Report
Model Water Accounting Report
Minton Environmental Water Holder
General Purpose Water Accounting Report30 June 2X10
Prepared by Minton Environmental Water Holder An illustration of an Australian general purpose water accounting report for a fictitious water report entity

Contents
Glossary..................................................................................................................................................2
Contextual Statement.........................................................................................................................3Description of the water report entity..................................................................................................3
Accountability Statement................................................................................................................. 10
Assurance Statement....................................................................................................................... 11
Statement of Water Assets and Water Liabilities...................................................................... 12
Statement of Changes in Water Assets and Water Liabilities.............................................. 13
Note disclosures................................................................................................................................. 14
Note 1: Significant water accounting policies................................................................................... 14
Note 2: Information supporting items presented in the water accounting statements................... 15
Note 3: Other disclosures..................................................................................................................20
Note 4: Segment information.............................................................................................................21
Model Water Accounting Report – Minton Environmental Water Holder 1
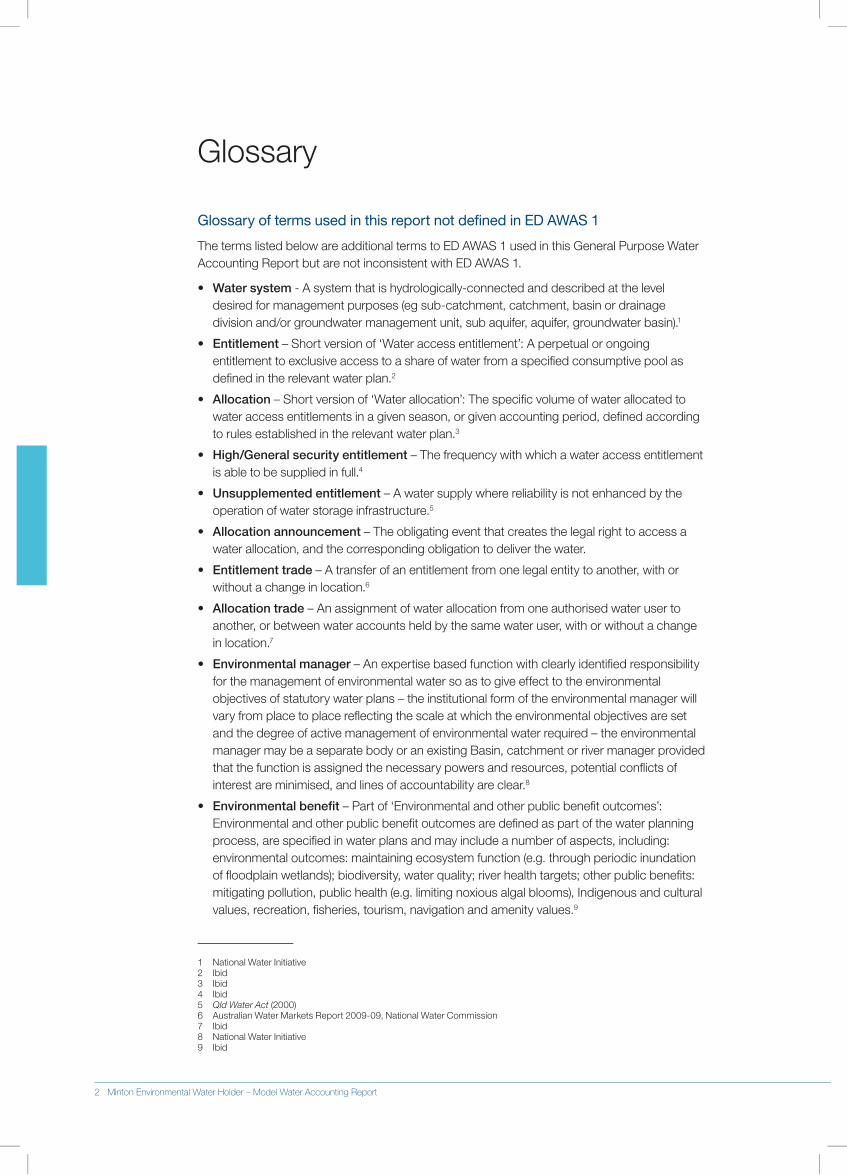
Glossary of terms used in this report not defined in ED AWAS 1
The.terms.listed.below.are.additional.terms.to.ED.AWAS.1.used.in.this.General.Purpose.Water.Accounting.Report.but.are.not.inconsistent.with.ED.AWAS.1..
• Watersystem.-.A.system.that.is.hydrologically-connected.and.described.at.the.level.desired.for.management.purposes.(eg.sub-catchment,.catchment,.basin.or.drainage.division.and/or.groundwater.management.unit,.sub.aquifer,.aquifer,.groundwater.basin).1.
• Entitlement.–.Short.version.of.‘Water.access.entitlement’:.A.perpetual.or.ongoing.entitlement.to.exclusive.access.to.a.share.of.water.from.a.specified.consumptive.pool.as.defined.in.the.relevant.water.plan.2
• Allocation.–.Short.version.of.‘Water.allocation’:.The.specific.volume.of.water.allocated.to.water.access.entitlements.in.a.given.season,.or.given.accounting.period,.defined.according.to.rules.established.in.the.relevant.water.plan.3
• High/Generalsecurityentitlement.–.The.frequency.with.which.a.water.access.entitlement.is.able.to.be.supplied.in.full.4
• Unsupplementedentitlement.–.A.water.supply.where.reliability.is.not.enhanced.by.the.operation.of.water.storage.infrastructure.5
• Allocationannouncement.–.The.obligating.event.that.creates.the.legal.right.to.access.a.water.allocation,.and.the.corresponding.obligation.to.deliver.the.water.
• Entitlementtrade.–.A.transfer.of.an.entitlement.from.one.legal.entity.to.another,.with.or.without.a.change.in.location.6
• Allocationtrade.–.An.assignment.of.water.allocation.from.one.authorised.water.user.to.another,.or.between.water.accounts.held.by.the.same.water.user,.with.or.without.a.change.in.location.7
• Environmentalmanager.–.An.expertise.based.function.with.clearly.identified.responsibility.for.the.management.of.environmental.water.so.as.to.give.effect.to.the.environmental.objectives.of.statutory.water.plans.–.the.institutional.form.of.the.environmental.manager.will.vary.from.place.to.place.reflecting.the.scale.at.which.the.environmental.objectives.are.set.and.the.degree.of.active.management.of.environmental.water.required.–.the.environmental.manager.may.be.a.separate.body.or.an.existing.Basin,.catchment.or.river.manager.provided.that.the.function.is.assigned.the.necessary.powers.and.resources,.potential.conflicts.of.interest.are.minimised,.and.lines.of.accountability.are clear.8
• Environmentalbenefit.–.Part.of.‘Environmental.and.other.public.benefit.outcomes’:.Environmental.and.other.public.benefit.outcomes.are.defined.as.part.of.the.water.planning.process,.are.specified.in.water.plans.and.may.include.a.number.of.aspects,.including:.environmental.outcomes:.maintaining.ecosystem.function.(e.g..through.periodic.inundation.of.floodplain.wetlands);.biodiversity,.water.quality;.river.health.targets;.other.public.benefits:.mitigating.pollution,.public.health.(e.g..limiting.noxious.algal.blooms),.Indigenous.and.cultural.values,.recreation,.fisheries,.tourism,.navigation.and.amenity.values.9
1. National.Water.Initiative2. Ibid3. Ibid4. Ibid5. Qld Water Act.(2000)6. Australian.Water.Markets.Report.2009-09,.National.Water.Commission7. Ibid8. National.Water.Initiative9. Ibid
Glossary
2 Minton Environmental Water Holder – Model Water Accounting Report
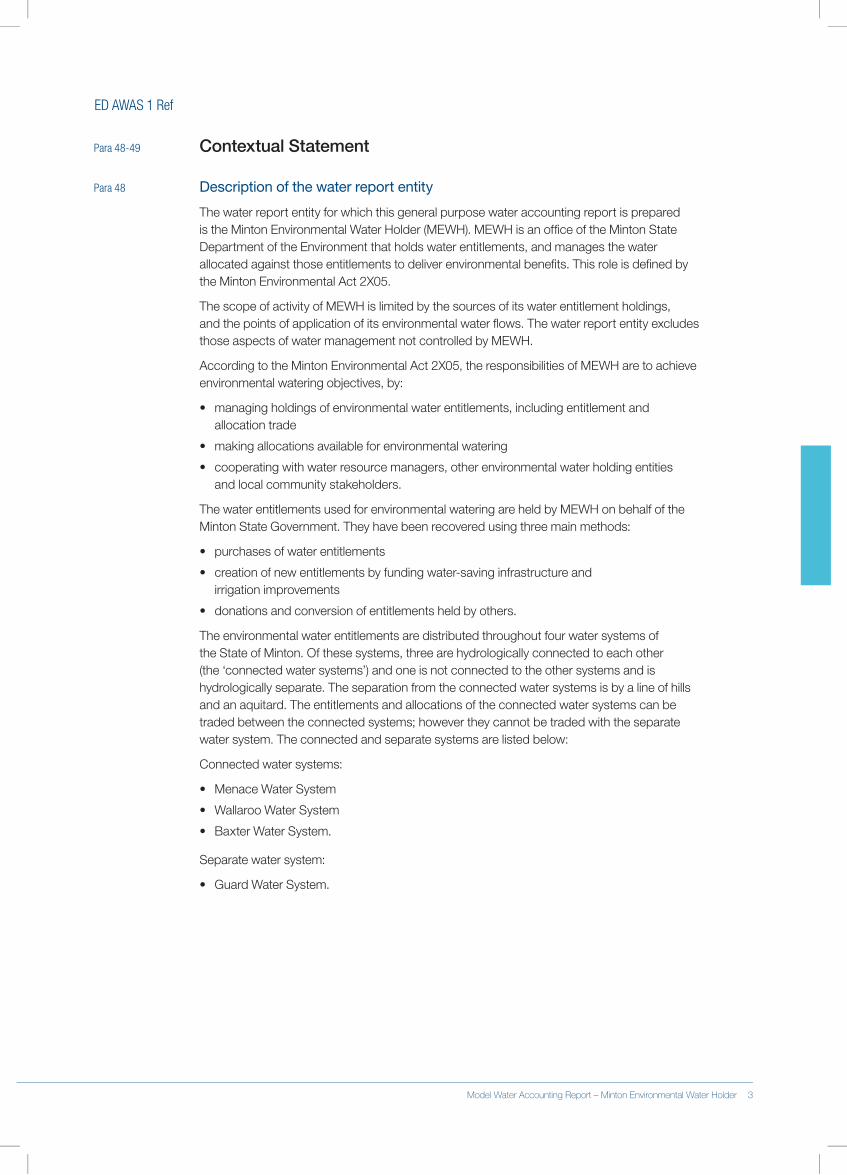
ED AWAS 1 Ref
Para 48-49 ContextualStatement
Para 48 Description of the water report entity
The.water.report.entity.for.which.this.general.purpose.water.accounting.report.is.prepared.is.the.Minton.Environmental.Water.Holder.(MEWH)..MEWH.is.an.office.of.the.Minton.State.Department.of.the.Environment.that.holds.water.entitlements,.and.manages.the.water.allocated.against.those.entitlements.to.deliver.environmental.benefits..This.role.is.defined.by.the.Minton.Environmental.Act.2X05.
The.scope.of.activity.of.MEWH.is.limited.by.the.sources.of.its.water.entitlement.holdings,..and.the.points.of.application.of.its.environmental.water.flows..The.water.report.entity.excludes.those.aspects.of.water.management.not.controlled.by.MEWH.
According.to.the.Minton.Environmental.Act.2X05,.the.responsibilities.of.MEWH.are.to.achieve.environmental.watering.objectives,.by:
•. managing.holdings.of.environmental.water.entitlements,.including.entitlement.and..allocation.trade.
•. making.allocations.available.for.environmental.watering.
•. cooperating.with.water.resource.managers,.other.environmental.water.holding.entities..and.local.community.stakeholders.
The.water.entitlements.used.for.environmental.watering.are.held.by.MEWH.on.behalf.of.the.Minton.State.Government..They.have.been.recovered.using.three.main.methods:
•. purchases.of.water.entitlements.
•. creation.of.new.entitlements.by.funding.water-saving.infrastructure.and..irrigation.improvements.
•. donations.and.conversion.of.entitlements.held.by.others.
The.environmental.water.entitlements.are.distributed.throughout.four.water.systems.of.the.State.of.Minton..Of.these.systems,.three.are.hydrologically.connected.to.each.other.(the.‘connected.water.systems’).and.one.is.not.connected.to.the.other.systems.and.is.hydrologically.separate..The.separation.from.the.connected.water.systems.is.by.a.line.of.hills.and.an.aquitard..The.entitlements.and.allocations.of.the.connected.water.systems.can.be.traded.between.the.connected.systems;.however.they.cannot.be.traded.with.the.separate.water.system..The.connected.and.separate.systems.are.listed.below:
Connected.water.systems:
•. Menace.Water.System
•. Wallaroo.Water.System
•. Baxter.Water.System.
Separate.water.system:
•. Guard.Water.System.
2 Minton Environmental Water Holder – Model Water Accounting Report Model Water Accounting Report – Minton Environmental Water Holder 3
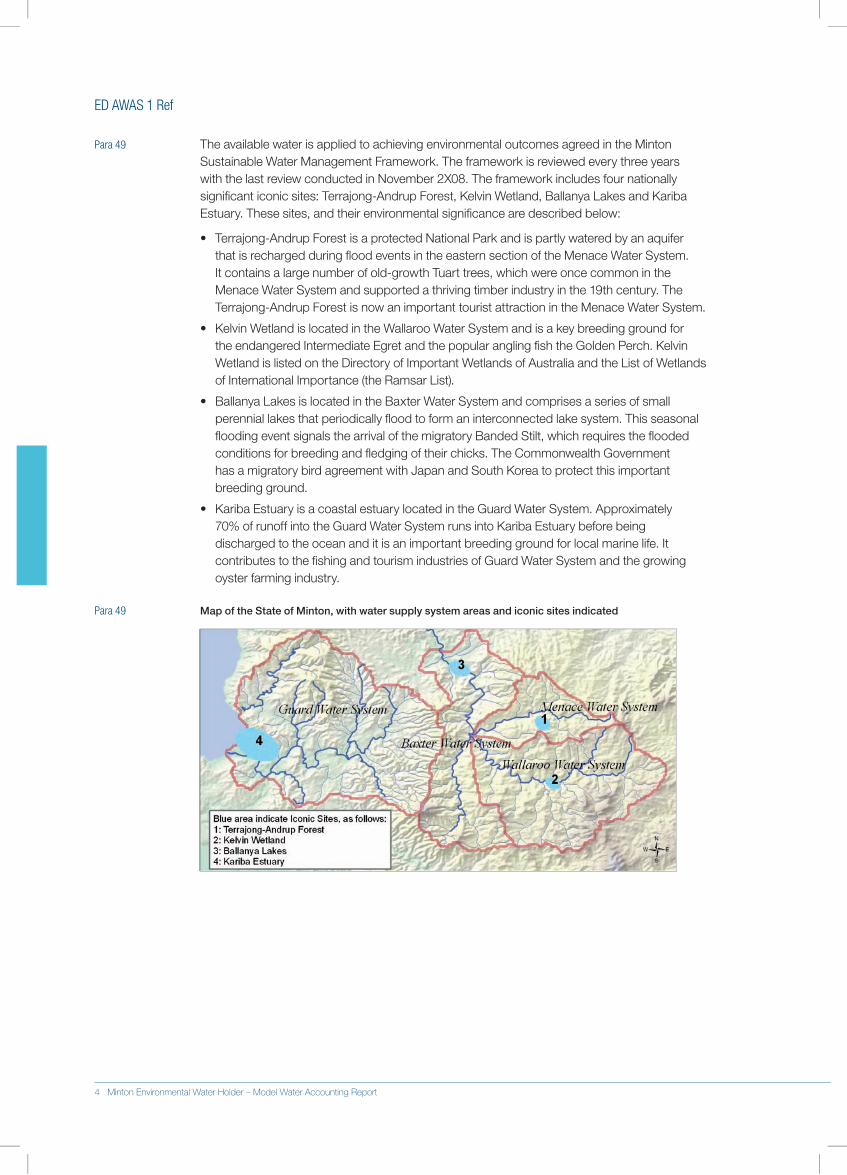
ED AWAS 1 Ref
Para 49 The.available.water.is.applied.to.achieving.environmental.outcomes.agreed.in.the.Minton.Sustainable.Water.Management.Framework..The.framework.is.reviewed.every.three.years.with.the.last.review.conducted.in.November.2X08..The.framework.includes.four.nationally.significant.iconic.sites:.Terrajong-Andrup.Forest,.Kelvin.Wetland,.Ballanya.Lakes.and.Kariba.Estuary..These.sites,.and.their.environmental.significance.are.described.below:
•. Terrajong-Andrup.Forest.is.a.protected.National.Park.and.is.partly.watered.by.an.aquifer.that.is.recharged.during.flood.events.in.the.eastern.section.of.the.Menace.Water.System..It.contains.a.large.number.of.old-growth.Tuart.trees,.which.were.once.common.in.the.Menace.Water.System.and.supported.a.thriving.timber.industry.in.the.19th.century..The.Terrajong-Andrup.Forest.is.now.an.important.tourist.attraction.in.the.Menace.Water.System.
•. Kelvin.Wetland.is.located.in.the.Wallaroo.Water.System.and.is.a.key.breeding.ground.for.the.endangered.Intermediate.Egret.and.the.popular.angling.fish.the.Golden.Perch..Kelvin.Wetland.is.listed.on.the.Directory.of.Important.Wetlands.of.Australia.and.the.List.of.Wetlands.of.International.Importance.(the.Ramsar.List).
•. Ballanya.Lakes.is.located.in.the.Baxter.Water.System.and.comprises.a.series.of.small.perennial.lakes.that.periodically.flood.to.form.an.interconnected.lake.system..This.seasonal.flooding.event.signals.the.arrival.of.the.migratory.Banded.Stilt,.which.requires.the.flooded.conditions.for.breeding.and.fledging.of.their.chicks..The.Commonwealth.Government..has.a.migratory.bird.agreement.with.Japan.and.South.Korea.to.protect.this.important.breeding.ground.
•. Kariba.Estuary.is.a.coastal.estuary.located.in.the.Guard.Water.System..Approximately..70%.of.runoff.into.the.Guard.Water.System.runs.into.Kariba.Estuary.before.being.discharged.to.the.ocean.and.it.is.an.important.breeding.ground.for.local.marine.life..It.contributes.to.the.fishing.and.tourism.industries.of.Guard.Water.System.and.the.growing.oyster.farming.industry.
Para 49 MapoftheStateofMinton,withwatersupplysystemareasandiconicsitesindicated
4 Minton Environmental Water Holder – Model Water Accounting Report
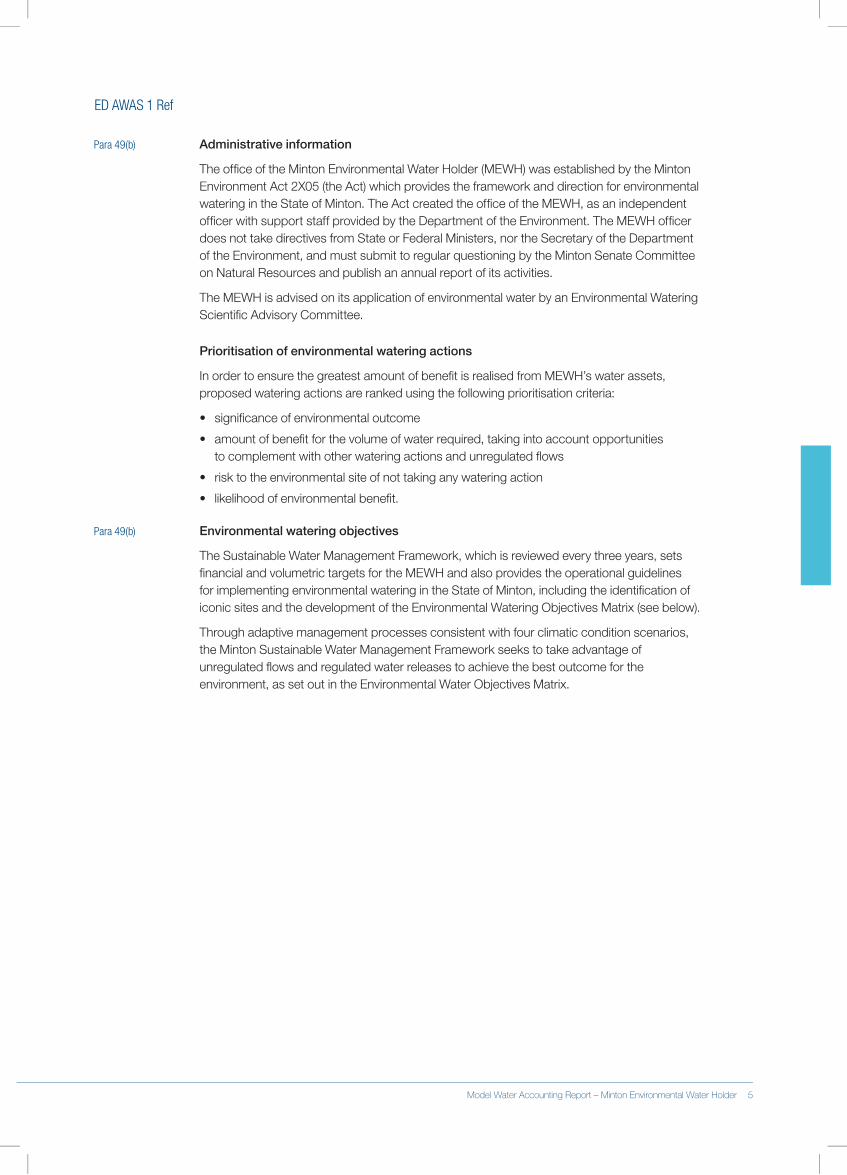
ED AWAS 1 Ref
Para 49(b) Administrativeinformation
The.office.of.the.Minton.Environmental.Water.Holder.(MEWH).was.established.by.the.Minton.Environment.Act.2X05.(the.Act).which.provides.the.framework.and.direction.for.environmental.watering.in.the.State.of.Minton..The.Act.created.the.office.of.the.MEWH,.as.an.independent.officer.with.support.staff.provided.by.the.Department.of.the.Environment..The.MEWH.officer.does.not.take.directives.from.State.or.Federal.Ministers,.nor.the.Secretary.of.the.Department..of.the.Environment,.and.must.submit.to.regular.questioning.by.the.Minton.Senate.Committee.on.Natural.Resources.and.publish.an.annual.report.of.its activities.
The.MEWH.is.advised.on.its.application.of.environmental.water.by.an.Environmental.Watering.Scientific.Advisory.Committee.
Prioritisationofenvironmentalwateringactions
In.order.to.ensure.the.greatest.amount.of.benefit.is.realised.from.MEWH’s.water.assets,.proposed.watering.actions.are.ranked.using.the.following.prioritisation.criteria:
•. significance.of.environmental.outcome
•. amount.of.benefit.for.the.volume.of.water.required,.taking.into.account.opportunities..to.complement.with.other.watering.actions.and.unregulated.flows
•. risk.to.the.environmental.site.of.not.taking.any.watering.action
•. likelihood.of.environmental.benefit.
Para 49(b) Environmentalwateringobjectives
The.Sustainable.Water.Management.Framework,.which.is.reviewed.every.three.years,.sets.financial.and.volumetric.targets.for.the.MEWH.and.also.provides.the.operational.guidelines.for.implementing.environmental.watering.in.the.State.of.Minton,.including.the.identification.of.iconic.sites.and.the.development.of.the.Environmental.Watering.Objectives.Matrix.(see.below)..
Through.adaptive.management.processes.consistent.with.four.climatic.condition.scenarios,.the.Minton.Sustainable.Water.Management.Framework.seeks.to.take.advantage.of.unregulated.flows.and.regulated.water.releases.to.achieve.the.best.outcome.for.the.environment,.as.set.out.in.the.Environmental.Water.Objectives.Matrix.
4 Minton Environmental Water Holder – Model Water Accounting Report Model Water Accounting Report – Minton Environmental Water Holder 5
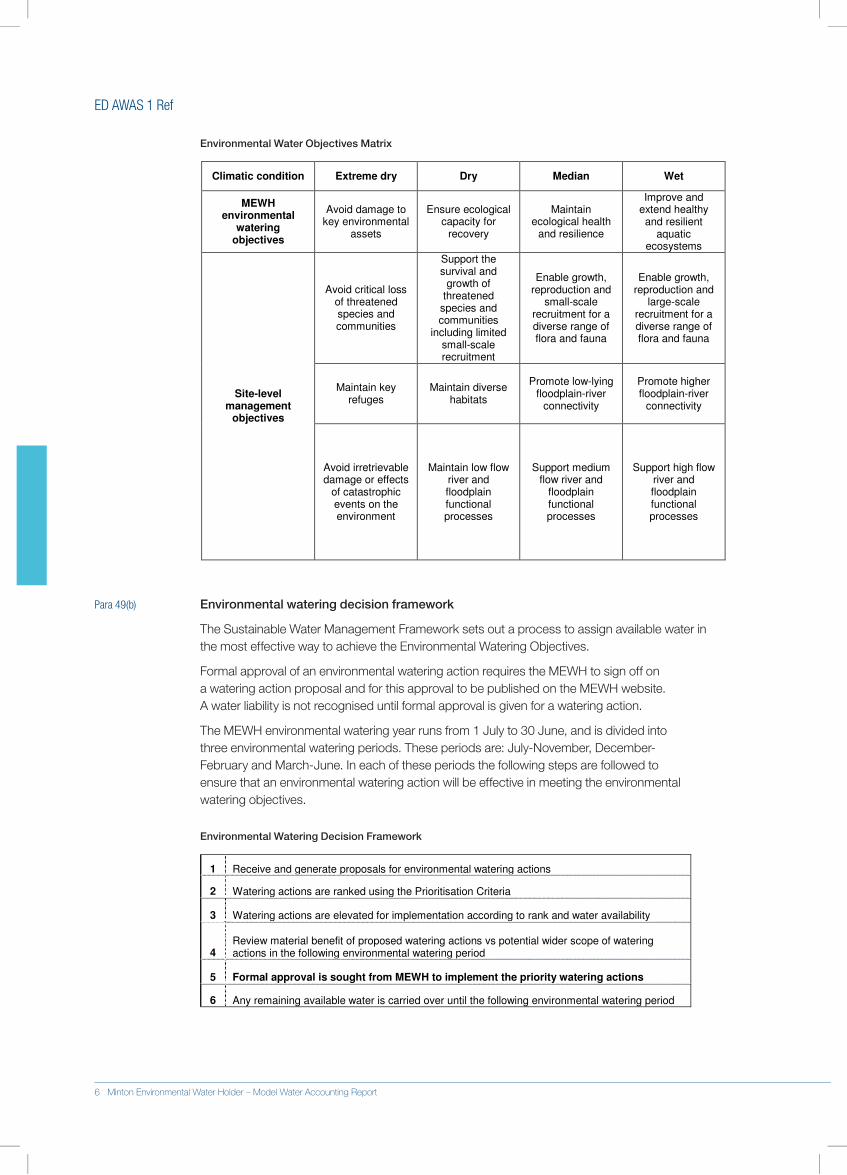
ED AWAS 1 Ref
EnvironmentalWaterObjectivesMatrix
Climatic condition Extreme dry Dry Median Wet
MEWH environmental
watering objectives
Avoid damage to key environmental
assets
Ensure ecological capacity for
recovery
Maintain ecological health
and resilience
Improve and extend healthy and resilient
aquatic ecosystems
Avoid critical loss of threatened species and communities
Support the survival and
growth of threatened
species and communities
including limited small-scale recruitment
Enable growth, reproduction and
small-scale recruitment for a diverse range of flora and fauna
Enable growth, reproduction and
large-scale recruitment for a diverse range of flora and fauna
Maintain key refuges
Maintain diverse habitats
Promote low-lying floodplain-river
connectivity
Promote higher floodplain-river
connectivity Site-level
management objectives
Avoid irretrievable damage or effects
of catastrophic events on the environment
Maintain low flow river and floodplain functional processes
Support medium flow river and
floodplain functional processes
Support high flow river and floodplain functional processes
Para 49(b) Environmentalwateringdecisionframework
The.Sustainable.Water.Management.Framework.sets.out.a.process.to.assign.available.water.in.the.most.effective.way.to.achieve.the.Environmental.Watering.Objectives..
Formal.approval.of.an.environmental.watering.action.requires.the.MEWH.to.sign.off.on..a.watering.action.proposal.and.for.this.approval.to.be.published.on.the.MEWH.website...A.water.liability.is.not.recognised.until.formal.approval.is.given.for.a.watering.action.
The.MEWH.environmental.watering.year.runs.from.1.July.to.30.June,.and.is.divided.into..three.environmental.watering.periods..These.periods.are:.July-November,.December-.February.and.March-June..In.each.of.these.periods.the.following.steps.are.followed.to..ensure.that.an.environmental.watering.action.will.be.effective.in.meeting.the.environmental.watering.objectives.
EnvironmentalWateringDecisionFramework
1 Receive and generate proposals for environmental watering actions
2 Watering actions are ranked using the Prioritisation Criteria
Receive and generate proposals for environmental watering actions
3 Watering actions are elevated for implementation according to rank and water availability
Watering actions are ranked using the Prioritisatio
4 Review material benefit of proposed watering actions vs potential wider scope of watering actions in the following environmental watering period
Watering actions are elevated for implementation according to rank and water availability
5 Formal approval is sought from MEWH to implement the priority watering actions
actions in the following environmental watering period
6 Any remaining available water is carried over until the following environmental watering period
6 Minton Environmental Water Holder – Model Water Accounting Report
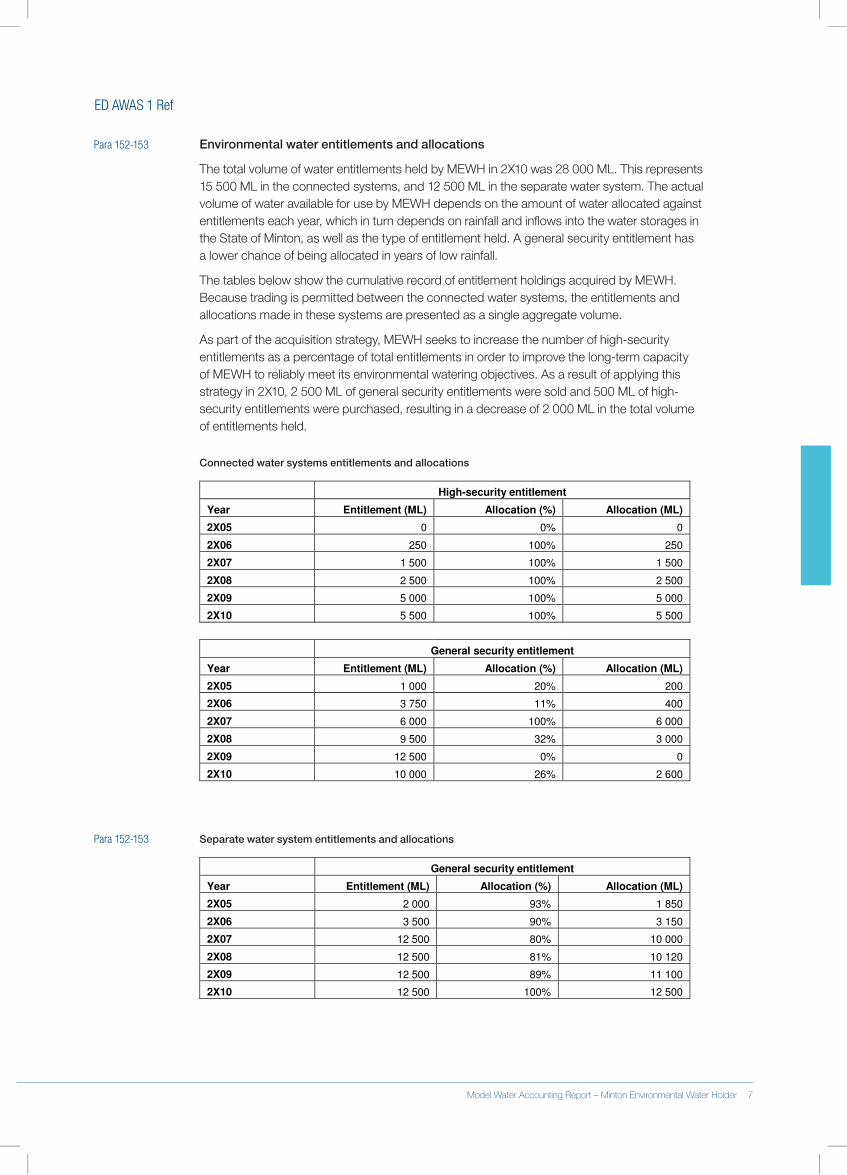
ED AWAS 1 Ref
Para 152-153 Environmentalwaterentitlementsandallocations
The.total.volume.of.water.entitlements.held.by.MEWH.in.2X10.was.28.000.ML..This.represents.15.500.ML.in.the.connected.systems,.and.12.500.ML.in.the.separate.water.system..The.actual.volume.of.water.available.for.use.by.MEWH.depends.on.the.amount.of.water.allocated.against.entitlements.each.year,.which.in.turn.depends.on.rainfall.and.inflows.into.the.water.storages.in.the.State.of.Minton,.as.well.as.the.type.of.entitlement.held..A.general.security.entitlement.has..a.lower.chance.of.being.allocated.in.years.of.low.rainfall.
The.tables.below.show.the.cumulative.record.of.entitlement.holdings.acquired.by.MEWH..Because.trading.is.permitted.between.the.connected.water.systems,.the.entitlements.and.allocations.made.in.these.systems.are.presented.as.a.single.aggregate.volume..
As.part.of.the.acquisition.strategy,.MEWH.seeks.to.increase.the.number.of.high-security.entitlements.as.a.percentage.of.total.entitlements.in.order.to.improve.the.long-term.capacity.of.MEWH.to.reliably.meet.its.environmental.watering.objectives..As.a.result.of.applying.this.strategy.in.2X10,.2.500.ML.of.general.security.entitlements.were.sold.and.500.ML.of.high-security.entitlements.were.purchased,.resulting.in.a.decrease.of.2.000.ML.in.the.total.volume.of.entitlements.held.
Connectedwatersystemsentitlementsandallocations
High-security entitlement
Year Entitlement (ML) Allocation (%) Allocation (ML)
2X05 0 0% 0
2X06 250 100% 250
2X07 1 500 100% 1 500
2X08 2 500 100% 2 500
2X09 5 000 100% 5 000
2X10 5 500 100% 5 500
General security entitlement
Year Entitlement (ML) Allocation (%) Allocation (ML)
2X05 1 000 20% 200
2X06 3 750 11% 400
2X07 6 000 100% 6 000
2X08 9 500 32% 3 000
2X09 12 500 0% 0
2X10 10 000 26% 2 600
Para 152-153 Separatewatersystementitlementsandallocations
General security entitlement
Year Entitlement (ML) Allocation (%) Allocation (ML)
2X05 2 000 93% 1 850
2X06 3 500 90% 3 150
2X07 12 500 80% 10 000
2X08 12 500 81% 10 120
2X09 12 500 89% 11 100
2X10 12 500 100% 12 500
6 Minton Environmental Water Holder – Model Water Accounting Report Model Water Accounting Report – Minton Environmental Water Holder 7
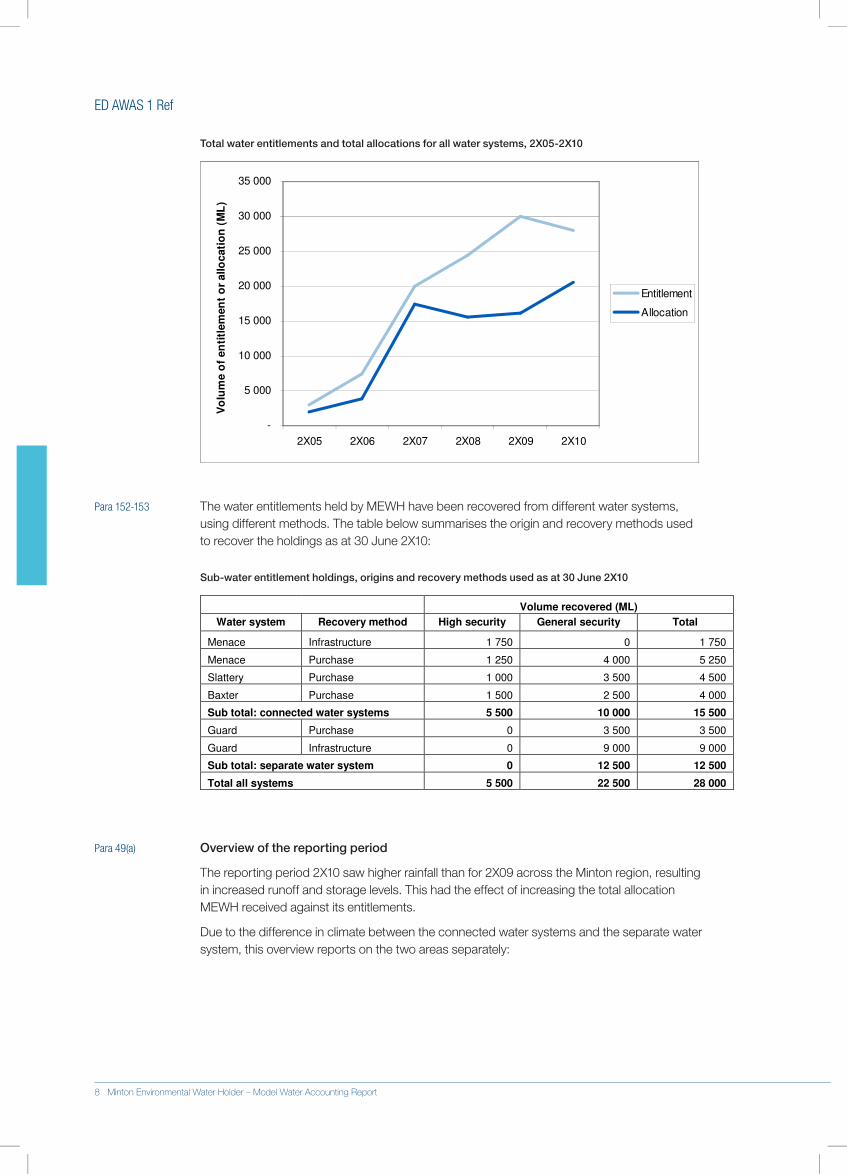
ED AWAS 1 Ref
Totalwaterentitlementsandtotalallocationsforallwatersystems,2X05-2X10
-
5 000
10 000
15 000
20 000
25 000
30 000
35 000
2X05 2X06 2X07 2X08 2X09 2X10
Vo
lum
e o
f en
titl
em
en
t o
r allo
cati
on
(M
L)
Entitlement
Allocation
Para 152-153 The.water.entitlements.held.by.MEWH.have.been.recovered.from.different.water.systems,.using.different.methods..The.table.below.summarises.the.origin.and.recovery.methods.used..to.recover.the.holdings.as.at.30.June.2X10:
Sub-waterentitlementholdings,originsandrecoverymethodsusedasat30June2X10
Volume recovered (ML)
Water system Recovery method High security General security Total
Menace Infrastructure 1 750 0 1 750
Menace Purchase 1 250 4 000 5 250
Slattery Purchase 1 000 3 500 4 500
Baxter Purchase 1 500 2 500 4 000
Sub total: connected water systems 5 500 10 000 15 500
Guard Purchase 0 3 500 3 500
Guard Infrastructure 0 9 000 9 000
Sub total: separate water system 0 12 500 12 500
Total all systems 5 500 22 500 28 000
Para 49(a) Overviewofthereportingperiod
The.reporting.period.2X10.saw.higher.rainfall.than.for.2X09.across.the.Minton.region,.resulting.in.increased.runoff.and.storage.levels..This.had.the.effect.of.increasing.the.total.allocation.MEWH.received.against.its.entitlements..
Due.to.the.difference.in.climate.between.the.connected.water.systems.and.the.separate.water.system,.this.overview.reports.on.the.two.areas.separately:
8 Minton Environmental Water Holder – Model Water Accounting Report
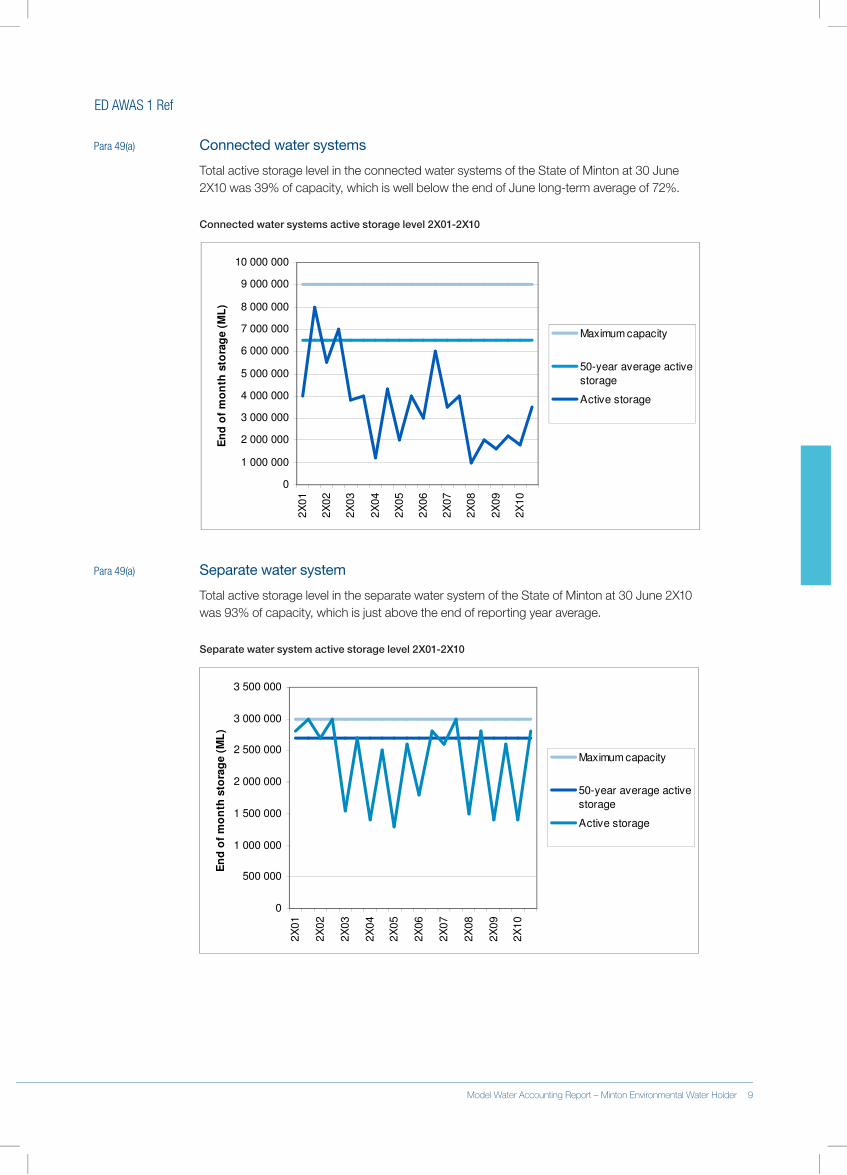
ED AWAS 1 Ref
Para 49(a) Connected water systems
Total.active.storage.level.in.the.connected.water.systems.of.the.State.of.Minton.at.30.June.2X10.was.39%.of.capacity,.which.is.well.below.the.end.of.June.long-term.average.of.72%..
Connectedwatersystemsactivestoragelevel2X01-2X10
0
1 000 000
2 000 000
3 000 000
4 000 000
5 000 000
6 000 000
7 000 000
8 000 000
9 000 000
10 000 000
2X
01
2X
02
2X
03
2X
04
2X
05
2X
06
2X
07
2X
08
2X
09
2X
10
En
d o
f m
on
th s
tora
ge (
ML
)
Maximum capacity
50-year average active
storage
Active storage
Para 49(a) Separate water system
Total.active.storage.level.in.the.separate.water.system.of.the.State.of.Minton.at.30.June.2X10.was.93%.of.capacity,.which.is.just.above.the.end.of.reporting.year.average.
Separatewatersystemactivestoragelevel2X01-2X10
0
500 000
1 000 000
1 500 000
2 000 000
2 500 000
3 000 000
3 500 000
2X
01
2X
02
2X
03
2X
04
2X
05
2X
06
2X
07
2X
08
2X
09
2X
10
En
d o
f m
on
th s
tora
ge (
ML
)
Maximum capacity
50-year average active
storage
Active storage
8 Minton Environmental Water Holder – Model Water Accounting Report Model Water Accounting Report – Minton Environmental Water Holder 9
ED AWAS 1 Ref
Para 50-57 AccountabilityStatementIn.the.opinion.of.the.undersigned:
Para 54(a)(iii) 1.. .This.general.purpose.water.accounting.report.complies.with.the.Australian.Water.Accounting.Standard.Exposure.Draft.issued.by.the.Water.Accounting.Standards.Board.
Para 54(a)(i) 2...The.management.and.operations.of.the.Minton.Environmental.Water.Holder.have,.with.the.exceptions.outlined.below,.been.conducted.throughout.the.reporting.period.in.compliance.with.all.relevant.externally-imposed.requirements,.including:
• Minton Water Act.2X07.
•. Natural.Resources.Management.Act.2X04.(NRM.Act).
•. Minton.Environment.Act.2X02.
Para 54(a)(ii) 3...The.management.and.operations.of.the.Minton.Environmental.Water.Holder.have.been.conducted.throughout.the.reporting.period.in.compliance.with.the.following.practices:
•. Minton.guidelines.on.water.monitoring.
•. Minton.Sustainable.Water.Management.Framework.
•. Water.Resource.Management.Instruments.(one.for.each.water.system).
Para 54(a)(iv) 4..The.following.exceptions.to.these.requirements.occurred:
•. 300.ML.of.water.was.forfeited.at.the.end.of.the.reporting.period.that.could.not.be.carried.over..According.to.the.Sustainable.Water.Management.Framework,.unused.allocation.is.to.be.traded.on.the.water.market.(see.Note 3c).
Para 54(b) Wendy.PoundMintonEnvironmentalWaterHolder
Para 57
10 Minton Environmental Water Holder – Model Water Accounting Report
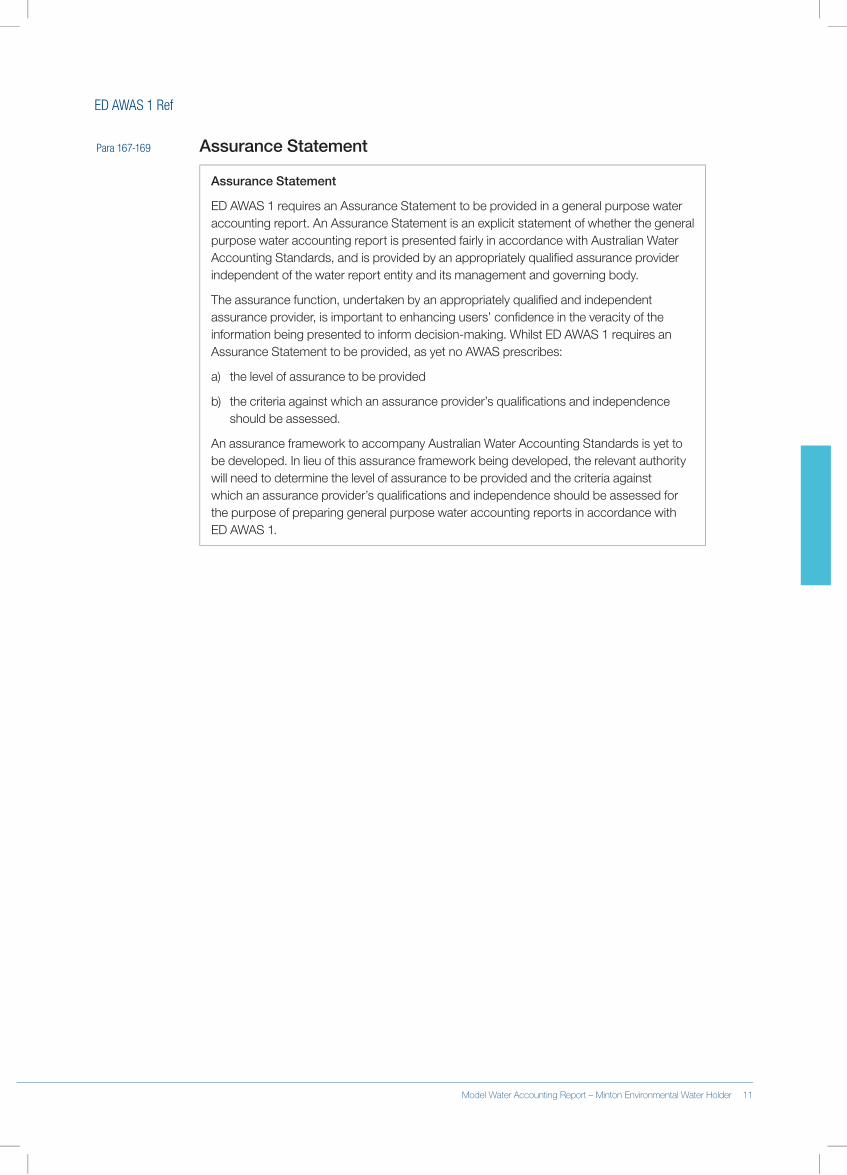
ED AWAS 1 Ref
Para 167-169 AssuranceStatement
AssuranceStatement
ED.AWAS.1.requires.an.Assurance.Statement.to.be.provided.in.a.general.purpose.water.accounting.report..An.Assurance.Statement.is.an.explicit.statement.of.whether.the.general.purpose.water.accounting.report.is.presented.fairly.in.accordance.with.Australian.Water.Accounting.Standards,.and.is.provided.by.an.appropriately.qualified.assurance.provider.independent.of.the.water.report.entity.and.its.management.and.governing.body.
The.assurance.function,.undertaken.by.an.appropriately.qualified.and.independent.assurance.provider,.is.important.to.enhancing.users’.confidence.in.the.veracity.of.the.information.being.presented.to.inform.decision-making..Whilst.ED.AWAS.1.requires.an.Assurance.Statement.to.be.provided,.as.yet.no.AWAS.prescribes:
a). the.level.of.assurance.to.be.provided.
b). .the.criteria.against.which.an.assurance.provider’s.qualifications.and.independence.should.be.assessed..
An.assurance.framework.to.accompany.Australian.Water.Accounting.Standards.is.yet.to.be.developed..In.lieu.of.this.assurance.framework.being.developed,.the.relevant.authority.will.need.to.determine.the.level.of.assurance.to.be.provided.and.the.criteria.against.which.an.assurance.provider’s.qualifications.and.independence.should.be.assessed.for.the.purpose.of.preparing.general.purpose.water.accounting.reports.in.accordance.with.ED AWAS.1.
10 Minton Environmental Water Holder – Model Water Accounting Report Model Water Accounting Report – Minton Environmental Water Holder 11
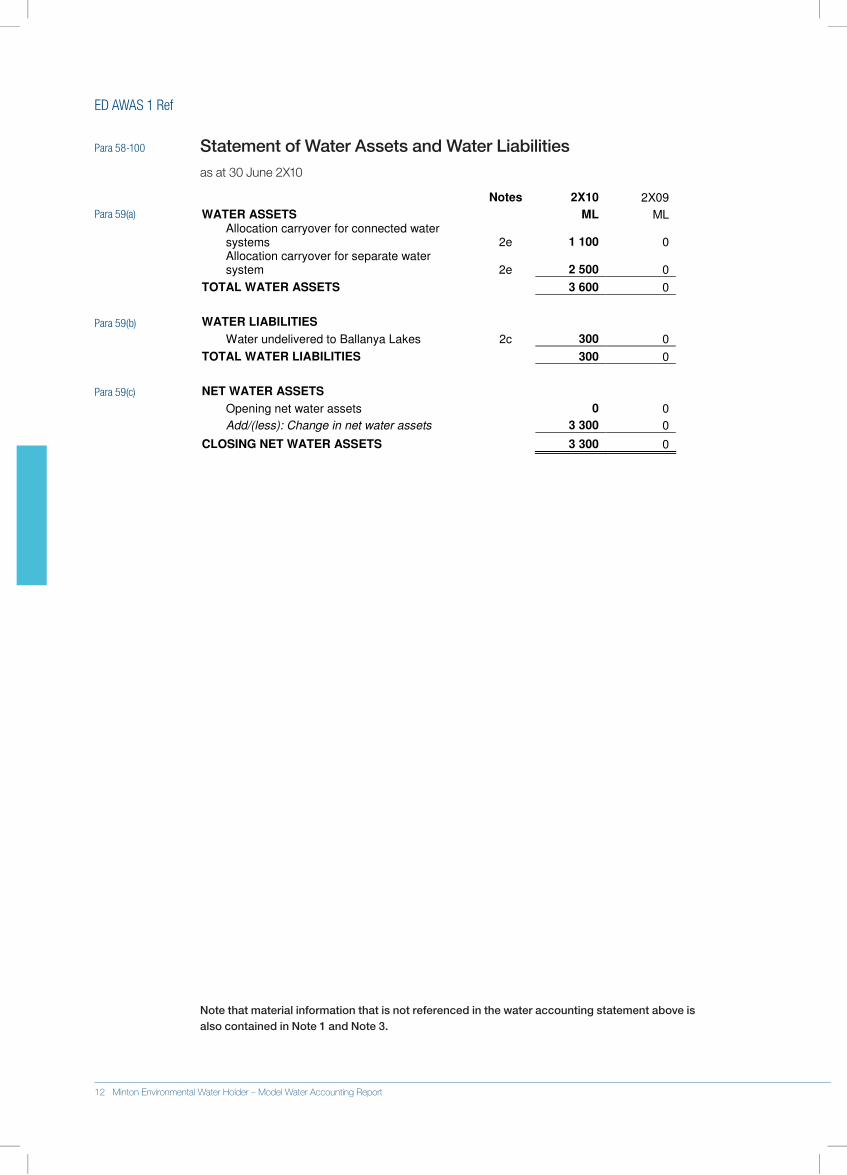
ED AWAS 1 Ref
Para 58-100 StatementofWaterAssetsandWaterLiabilitiesas.at.30.June.2X10
Notes 2X10 2X09
WATER ASSETS ML ML
Allocation carryover for connected water systems 2e 1 100 0
Allocation carryover for separate water system 2e 2 500 0
TOTAL WATER ASSETS 3 600 0
WATER LIABILITIES
Water undelivered to Ballanya Lakes 2c 300 0
TOTAL WATER LIABILITIES 300 0
NET WATER ASSETS
Opening net water assets 0 0
Add/(less): Change in net water assets 3 300 0
CLOSING NET WATER ASSETS 3 300 0
NotethatmaterialinformationthatisnotreferencedinthewateraccountingstatementaboveisalsocontainedinNote1andNote3.
Para 59(a)
Para 59(b)
Para 59(c)
12 Minton Environmental Water Holder – Model Water Accounting Report
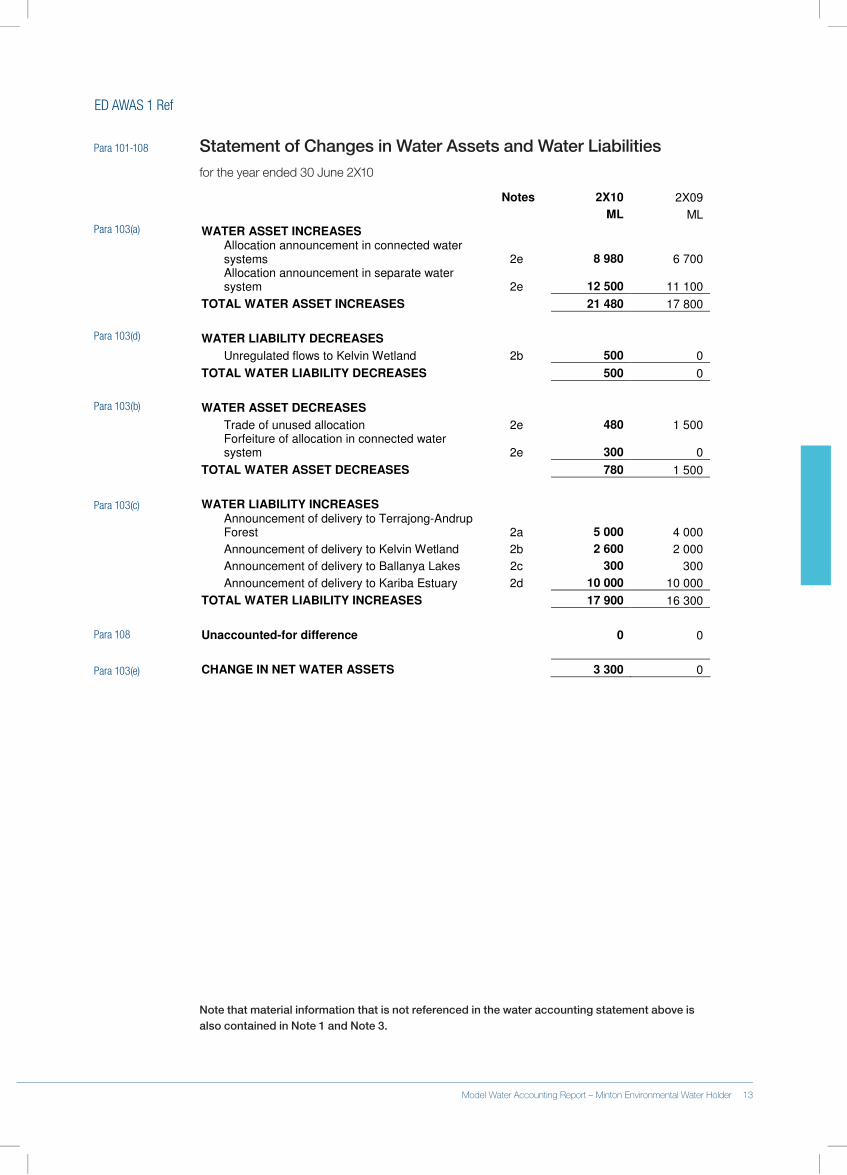
ED AWAS 1 Ref
Para 101-108 StatementofChangesinWaterAssetsandWaterLiabilitiesfor.the.year.ended.30.June.2X10
Notes 2X10 2X09
ML ML
WATER ASSET INCREASES
Allocation announcement in connected water systems 2e 8 980 6 700
Allocation announcement in separate water system 2e 12 500 11 100
TOTAL WATER ASSET INCREASES 21 480 17 800
WATER LIABILITY DECREASES
Unregulated flows to Kelvin Wetland 2b 500 0
TOTAL WATER LIABILITY DECREASES 500 0
WATER ASSET DECREASES
Trade of unused allocation 2e 480 1 500
Forfeiture of allocation in connected water system 2e 300 0
TOTAL WATER ASSET DECREASES 780 1 500
WATER LIABILITY INCREASES
Announcement of delivery to Terrajong-Andrup Forest 2a 5 000 4 000
Announcement of delivery to Kelvin Wetland 2b 2 600 2 000
Announcement of delivery to Ballanya Lakes 2c 300 300
Announcement of delivery to Kariba Estuary 2d 10 000 10 000
TOTAL WATER LIABILITY INCREASES 17 900 16 300
Unaccounted-for difference 0 0
CHANGE IN NET WATER ASSETS 3 300 0
NotethatmaterialinformationthatisnotreferencedinthewateraccountingstatementaboveisalsocontainedinNote1andNote3.
Para 103(a)
Para 103(d)
Para 103(b)
Para 103(c)
Para 108
Para 103(e)
12 Minton Environmental Water Holder – Model Water Accounting Report Model Water Accounting Report – Minton Environmental Water Holder 13
ED AWAS 1 Ref
Para 122-166 Notedisclosures
Para 125-127 Note 1: Significant water accounting policies
Para 122(a) With.the.exception.of.the.physical.water.flow.information,.this.General.Purpose.Water.Accounting.Report.(GPWAR).has.been.prepared.using.an.accrual.basis.of.accounting..The.volumetric.unit.of.account.is.megalitres.(ML).
Para 122(b) Recognitionofwaterassetsandwaterliabilities
The.physical.water.held.within.the.environmental.sites.is.not.a.water.asset.of.MEWH..For.water.to.be.regarded.as.a.water.asset.of.MEWH,.it.must.meet.the.definition.of.a.water.asset,.which.requires.that.MEWH:.(1).either.holds.the.water.or.has.management.responsibilities.over.the.water;.and.(2).derives.future.benefits.from.the.water..
Although.MEWH.is.responsible.for.deciding.the.application.of.environmental.water,.it.does.not.hold.or.have.management.responsibilities.over.the.physical.water.within.the.environmental.sites.
Para 88 Obligations.to.deliver.water.to.an.environmental.site.are.recognised.as.water.liabilities.at.the.date.that.formal.approval.is.given.for.a.watering.action,.as.per.the.Environmental.Watering.Decision.Framework..The.water.liability.continues.to.be.recognised.in.the.Statement.of.Water.Assets.and.Water.Liabilities.until.it.is.settled.by.delivery.of.environmental.claims.to.water.or.any.unregulated.flows.
Para 107 Recognitionofchangesinwaterassetsandwaterliabilities
Unregulated.flows.are.recognised.as.an.increase.in.net.water.assets.in.the.Statement.of.Changes.in.Water.Assets.and.Water.Liabilities,.as.the.unregulated.flows.can.assist.in.the.settlement.of.water.liabilities..These.flows.replace.a.portion.of.the.water.that.the.environmental.water.holder.would.have.delivered,.and.as.such.result.in.a.decrease.in.the.water.liability.
Where.permitted.under.water.licensing.terms,.return.flows.of.environmental.water.to.a.regulated.system.are.in.some.cases.recognised.as.an.increase.to.the.other.water.assets.of.the.environmental.water.holder..It.is.not.recognised.as.a.physical.inflow.at.this.time.(see.water.accounting.policy.above.relating.to.the.delivery.of.water.to.environmental.sites).
Para 115 Omissionofstatementofphysicalwaterflows
MEWH.does.not.recognise.any.physical.water.assets.and.when.the.non-physical.water.assets.are.realised,.this.does.not.result.in.the.recognition.of.a.physical.water.asset;.as.such.there.are.no.physical.water.inflows..While.it.is.the.case.that.physical.water.outflows.occur.when.the.water.liabilities.of.the.water.report.entity.are.realised,.there.are.no.outflows.from.a.physical.water.asset.held.by.the.MEWH..Therefore, the.Statement.of.Physical.Water.Flows.has.been.omitted.from.this.general.purpose.water.accounting.report.
Para 65
Para 86
Para 75
14 Minton Environmental Water Holder – Model Water Accounting Report
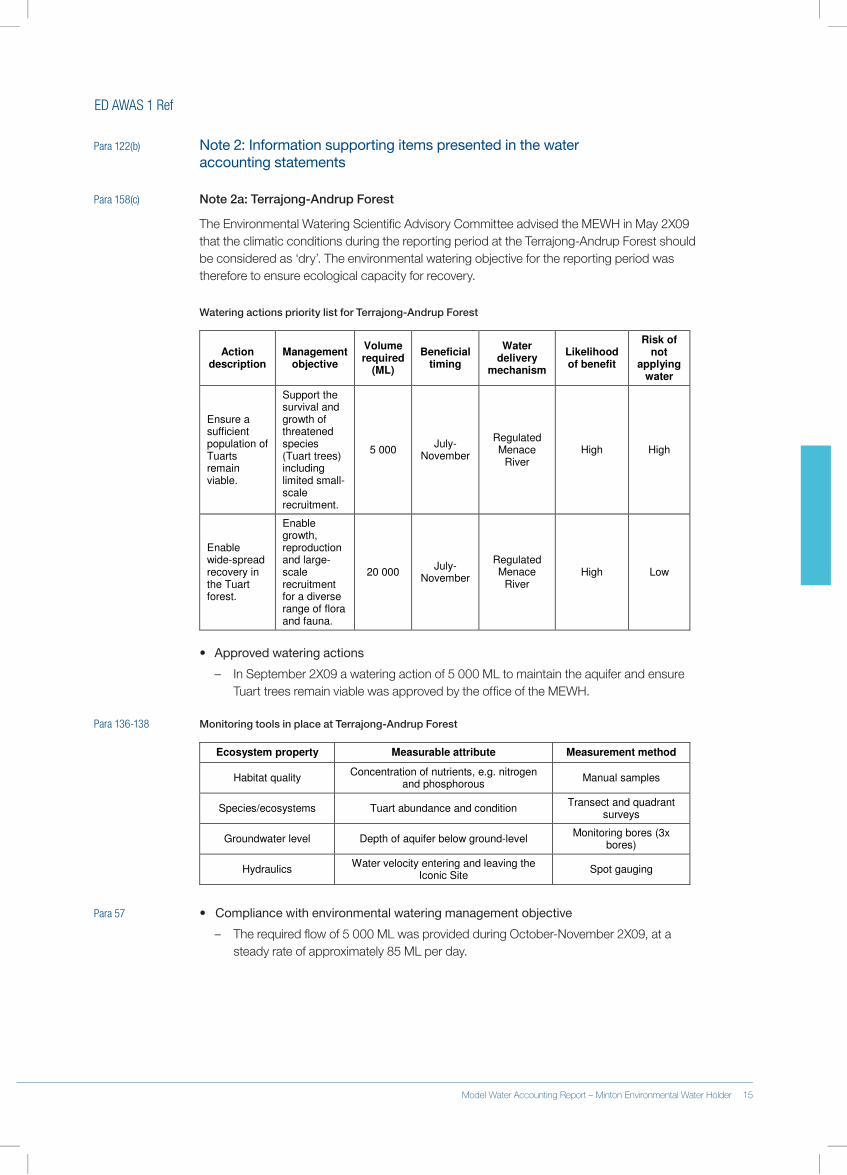
ED AWAS 1 Ref
Para 122(b) Note 2: Information supporting items presented in the water accounting statements
Para 158(c) Note2a:Terrajong-AndrupForest
The.Environmental.Watering.Scientific.Advisory.Committee.advised.the.MEWH.in.May.2X09.that.the.climatic.conditions.during.the.reporting.period.at.the.Terrajong-Andrup.Forest.should.be.considered.as.‘dry’..The.environmental.watering.objective.for.the.reporting.period.was.therefore.to.ensure.ecological.capacity.for.recovery.
WateringactionsprioritylistforTerrajong-AndrupForest
Action description
Management objective
Volume required
(ML)
Beneficial timing
Water delivery
mechanism
Likelihood of benefit
Risk of not
applying water
Ensure a sufficient population of Tuarts remain viable.
Support the survival and growth of threatened species (Tuart trees) including limited small-scale recruitment.
5 000 July-
November
Regulated Menace
River High High
Enable wide-spread recovery in the Tuart forest.
Enable growth, reproduction and large-scale recruitment for a diverse range of flora and fauna.
20 000 July-
November
Regulated Menace
River High Low
• Approved watering actions
.– In.September.2X09.a.watering.action.of.5.000.ML.to.maintain.the.aquifer.and.ensure.Tuart.trees.remain.viable.was.approved.by.the.office.of.the.MEWH.
Para 136-138 MonitoringtoolsinplaceatTerrajong-AndrupForest
Ecosystem property Measurable attribute Measurement method
Habitat quality Concentration of nutrients, e.g. nitrogen
and phosphorous Manual samples
Species/ecosystems Tuart abundance and condition Transect and quadrant
surveys
Groundwater level Depth of aquifer below ground-level Monitoring bores (3x
bores)
Hydraulics Water velocity entering and leaving the
Iconic Site Spot gauging
Para 57 • Compliance with environmental watering management objective
.– The.required.flow.of.5.000.ML.was.provided.during.October-November.2X09,.at.a.steady.rate.of.approximately.85.ML.per.day..
14 Minton Environmental Water Holder – Model Water Accounting Report Model Water Accounting Report – Minton Environmental Water Holder 15
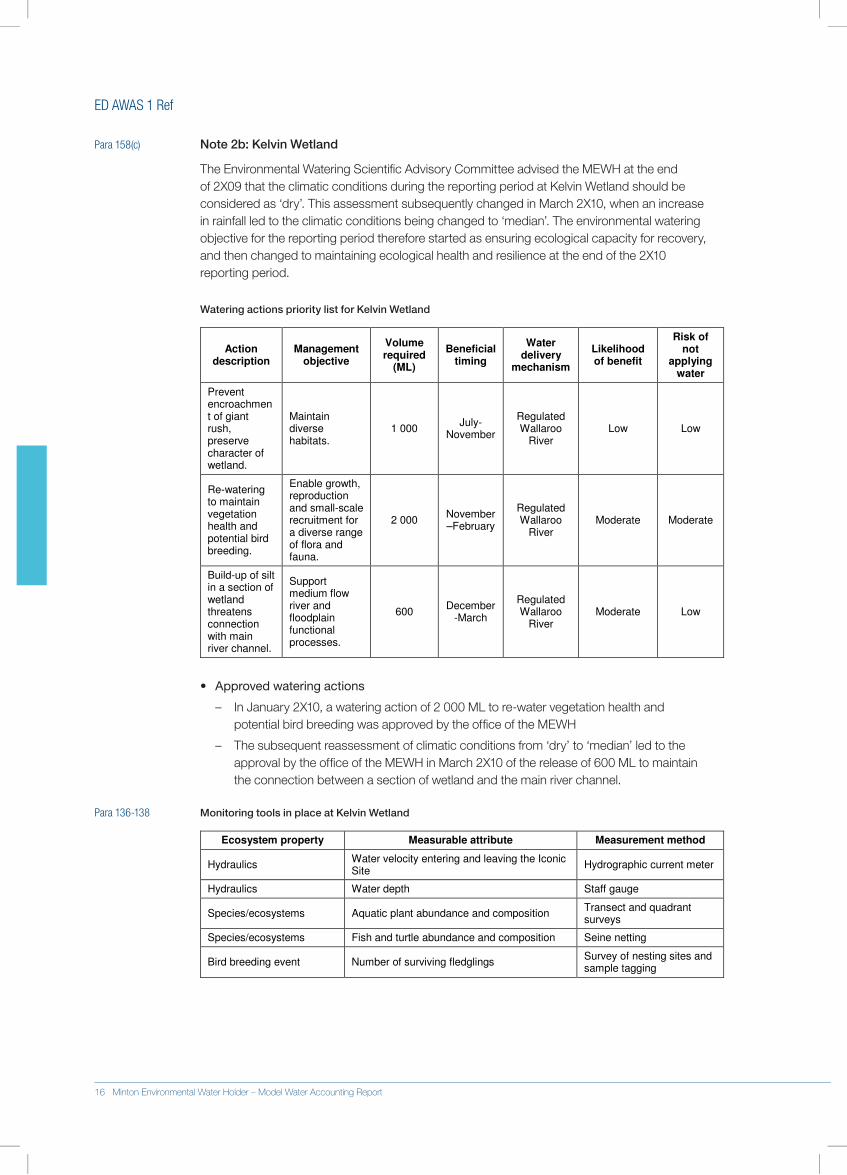
ED AWAS 1 Ref
Para 158(c) Note2b:KelvinWetland
The.Environmental.Watering.Scientific.Advisory.Committee.advised.the.MEWH.at.the.end.of.2X09.that.the.climatic.conditions.during.the.reporting.period.at.Kelvin.Wetland.should.be.considered.as.‘dry’..This.assessment.subsequently.changed.in.March.2X10,.when.an.increase.in.rainfall.led.to.the.climatic.conditions.being.changed.to.‘median’..The.environmental.watering.objective.for.the.reporting.period.therefore.started.as.ensuring.ecological.capacity.for.recovery,.and.then.changed.to.maintaining.ecological.health.and.resilience.at.the.end.of.the.2X10.reporting.period.
WateringactionsprioritylistforKelvinWetland
Action description
Management objective
Volume required
(ML)
Beneficial timing
Water delivery
mechanism
Likelihood of benefit
Risk of not
applying water
Prevent encroachment of giant rush, preserve character of wetland.
Maintain diverse habitats.
1 000 July-
November
Regulated Wallaroo
River Low Low
Re-watering to maintain vegetation health and potential bird breeding.
Enable growth, reproduction and small-scale recruitment for a diverse range of flora and fauna.
2 000 November –February
Regulated Wallaroo
River Moderate Moderate
Build-up of silt in a section of wetland threatens connection with main river channel.
Support medium flow river and floodplain functional processes.
600 December
-March
Regulated Wallaroo
River Moderate Low
• Approved watering actions
.– In.January.2X10,.a.watering.action.of.2.000.ML.to.re-water.vegetation.health.and.potential.bird.breeding.was.approved.by.the.office.of.the.MEWH
.– The.subsequent.reassessment.of.climatic.conditions.from.‘dry’.to.‘median’.led.to.the.approval.by.the.office.of.the.MEWH.in.March.2X10.of.the.release.of.600.ML.to.maintain.the.connection.between.a.section.of.wetland.and.the.main.river.channel.
Para 136-138 MonitoringtoolsinplaceatKelvinWetland
Ecosystem property Measurable attribute Measurement method
Hydraulics Water velocity entering and leaving the Iconic Site
Hydrographic current meter
Hydraulics Water depth Staff gauge
Species/ecosystems Aquatic plant abundance and composition Transect and quadrant surveys
Species/ecosystems Fish and turtle abundance and composition Seine netting
Bird breeding event Number of surviving fledglings Survey of nesting sites and sample tagging
16 Minton Environmental Water Holder – Model Water Accounting Report
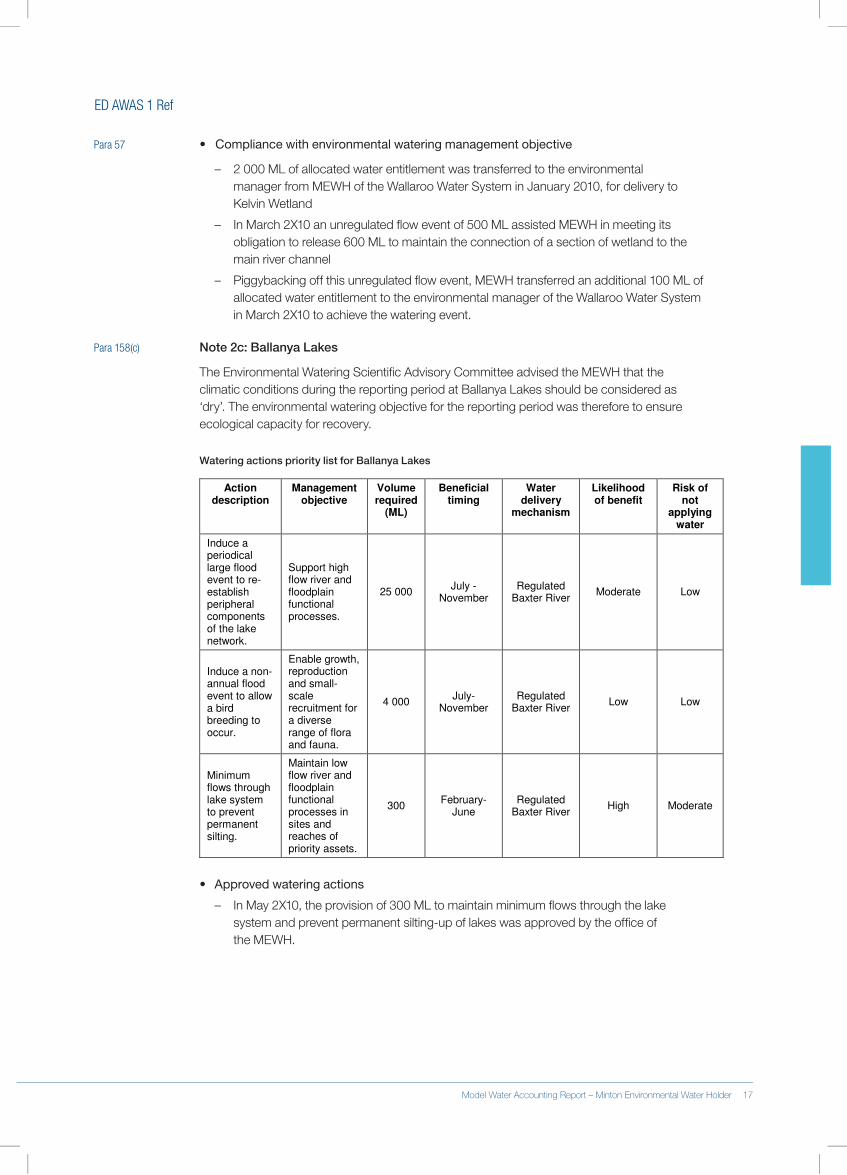
ED AWAS 1 Ref
Para 57 • Compliance with environmental watering management objective
.– 2.000.ML.of.allocated.water.entitlement.was.transferred.to.the.environmental..manager.from.MEWH.of.the.Wallaroo.Water.System.in.January.2010,.for.delivery.to.Kelvin.Wetland
.– In.March.2X10.an.unregulated.flow.event.of.500.ML.assisted.MEWH.in.meeting.its.obligation.to.release.600.ML.to.maintain.the.connection.of.a.section.of.wetland.to.the.main.river.channel
.– Piggybacking.off.this.unregulated.flow.event,.MEWH.transferred.an.additional.100.ML.of.allocated.water.entitlement.to.the.environmental.manager.of.the.Wallaroo.Water.System.in.March.2X10.to.achieve.the.watering.event.
Para 158(c) Note2c:BallanyaLakes
The.Environmental.Watering.Scientific.Advisory.Committee.advised.the.MEWH.that.the.climatic.conditions.during.the.reporting.period.at.Ballanya.Lakes.should.be.considered.as..‘dry’..The.environmental.watering.objective.for.the.reporting.period.was.therefore.to.ensure.ecological.capacity.for.recovery.
WateringactionsprioritylistforBallanyaLakes
Action description
Management objective
Volume required
(ML)
Beneficial timing
Water delivery
mechanism
Likelihood of benefit
Risk of not
applying water
Induce a periodical large flood event to re-establish peripheral components of the lake network.
Support high flow river and floodplain functional processes.
25 000 July -
November Regulated
Baxter River Moderate Low
Induce a non-annual flood event to allow a bird breeding to occur.
Enable growth, reproduction and small-scale recruitment for a diverse range of flora and fauna.
4 000 July-
November Regulated
Baxter River Low Low
Minimum flows through lake system to prevent permanent silting.
Maintain low flow river and floodplain functional processes in sites and reaches of priority assets.
300 February-
June Regulated
Baxter River High Moderate
• Approved watering actions
.– In.May.2X10,.the.provision.of.300.ML.to.maintain.minimum.flows.through.the.lake.system.and.prevent.permanent.silting-up.of.lakes.was.approved.by.the.office.of..the.MEWH.
16 Minton Environmental Water Holder – Model Water Accounting Report Model Water Accounting Report – Minton Environmental Water Holder 17
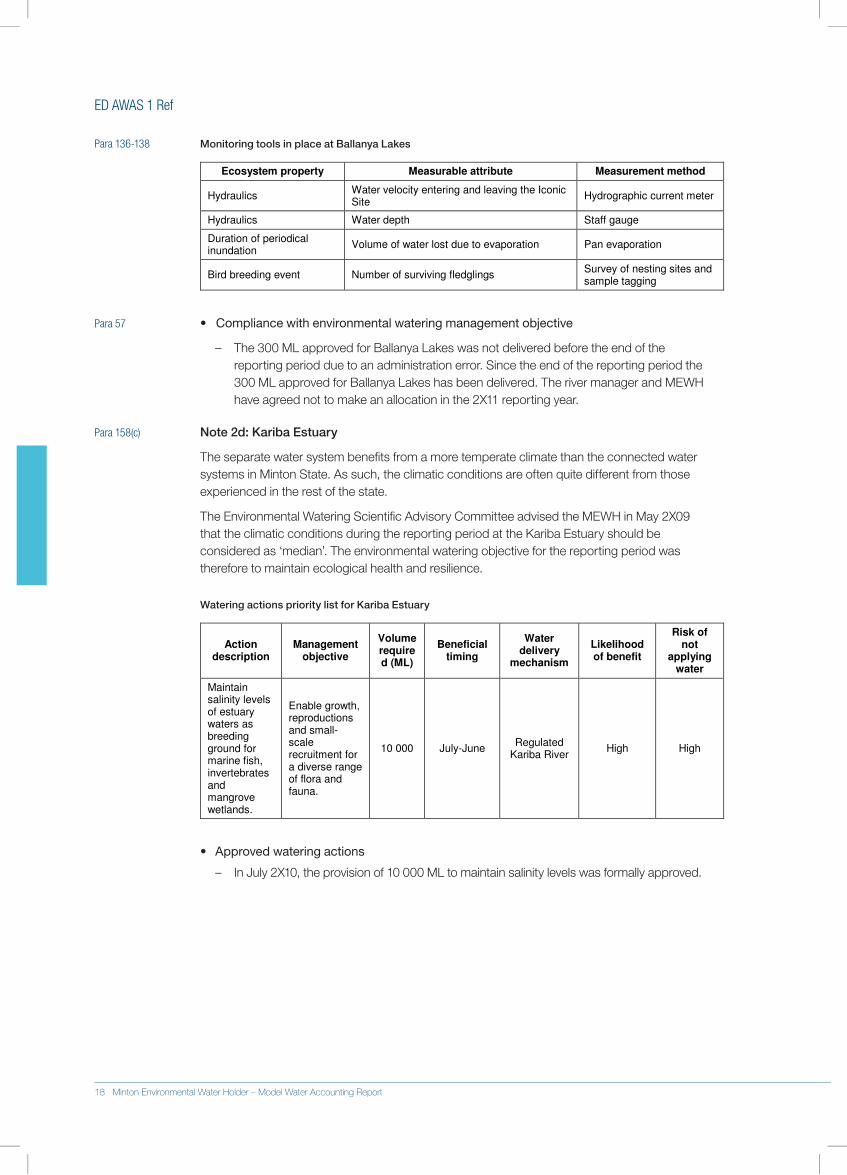
ED AWAS 1 Ref
Para 136-138 MonitoringtoolsinplaceatBallanyaLakes
Ecosystem property Measurable attribute Measurement method
Hydraulics Water velocity entering and leaving the Iconic Site
Hydrographic current meter
Hydraulics Water depth Staff gauge
Duration of periodical inundation
Volume of water lost due to evaporation Pan evaporation
Bird breeding event Number of surviving fledglings Survey of nesting sites and sample tagging
Para 57 • Compliance with environmental watering management objective
.– The.300.ML.approved.for.Ballanya.Lakes.was.not.delivered.before.the.end.of.the.reporting.period.due.to.an.administration.error..Since.the.end.of.the.reporting.period.the.300.ML.approved.for.Ballanya.Lakes.has.been.delivered..The.river.manager.and.MEWH.have.agreed.not.to.make.an.allocation.in.the.2X11.reporting.year...
Para 158(c) Note2d:KaribaEstuary
The.separate.water.system.benefits.from.a.more.temperate.climate.than.the.connected.water.systems.in.Minton.State..As.such,.the.climatic.conditions.are.often.quite.different.from.those.experienced.in.the.rest.of.the.state.
The.Environmental.Watering.Scientific.Advisory.Committee.advised.the.MEWH.in.May.2X09.that.the.climatic.conditions.during.the.reporting.period.at.the.Kariba.Estuary.should.be.considered.as.‘median’..The.environmental.watering.objective.for.the.reporting.period.was.therefore.to.maintain.ecological.health.and.resilience.
WateringactionsprioritylistforKaribaEstuary
Action description
Management objective
Volume required (ML)
Beneficial timing
Water delivery
mechanism
Likelihood of benefit
Risk of not
applying water
Maintain salinity levels of estuary waters as breeding ground for marine fish, invertebrates and mangrove wetlands.
Enable growth, reproductions and small-scale recruitment for a diverse range of flora and fauna.
10 000 July-June Regulated
Kariba River High High
• Approved watering actions
.– In.July.2X10,.the.provision.of.10.000.ML.to.maintain.salinity.levels.was.formally.approved.
18 Minton Environmental Water Holder – Model Water Accounting Report
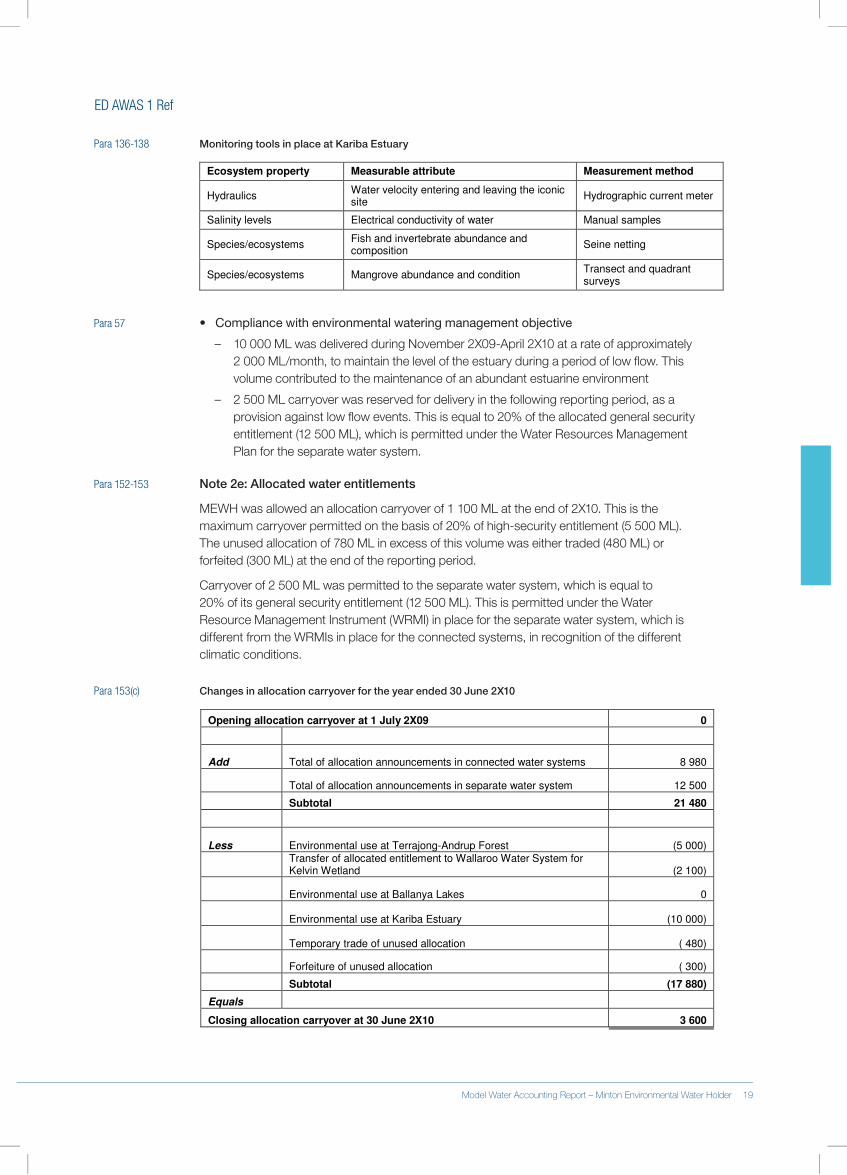
ED AWAS 1 Ref
Para 136-138 MonitoringtoolsinplaceatKaribaEstuary
Ecosystem property Measurable attribute Measurement method
Hydraulics Water velocity entering and leaving the iconic site
Hydrographic current meter
Salinity levels Electrical conductivity of water Manual samples
Species/ecosystems Fish and invertebrate abundance and composition
Seine netting
Species/ecosystems Mangrove abundance and condition Transect and quadrant surveys
Para 57 • Compliance with environmental watering management objective
.– 10.000.ML.was.delivered.during.November.2X09-April.2X10.at.a.rate.of.approximately..2.000.ML/month,.to.maintain.the.level.of.the.estuary.during.a.period.of.low.flow..This.volume.contributed.to.the.maintenance.of.an.abundant.estuarine.environment
.– 2.500.ML.carryover.was.reserved.for.delivery.in.the.following.reporting.period,.as.a.provision.against.low.flow.events..This.is.equal.to.20%.of.the.allocated.general.security.entitlement.(12 500 ML),.which.is.permitted.under.the.Water.Resources.Management.Plan.for.the.separate.water.system.
Para 152-153 Note2e:Allocatedwaterentitlements
MEWH.was.allowed.an.allocation.carryover.of.1.100.ML.at.the.end.of.2X10..This.is.the.maximum.carryover.permitted.on.the.basis.of.20%.of.high-security.entitlement.(5.500.ML)...The.unused.allocation.of.780.ML.in.excess.of.this.volume.was.either.traded.(480.ML).or.forfeited.(300.ML).at.the.end.of.the.reporting.period..
Carryover.of.2.500.ML.was.permitted.to.the.separate.water.system,.which.is.equal.to..20%.of.its.general.security.entitlement.(12.500.ML)..This.is.permitted.under.the.Water.Resource.Management.Instrument.(WRMI).in.place.for.the.separate.water.system,.which.is.different.from.the.WRMIs.in.place.for.the.connected.systems,.in.recognition.of.the.different.climatic.conditions.
Para 153(c) Changesinallocationcarryoverfortheyearended30June2X10
Opening allocation carryover at 1 July 2X09 0
Add Total of allocation announcements in connected water systems 8 980
Total of allocation announcements in separate water system 12 500
Subtotal 21 480
Less Environmental use at Terrajong-Andrup Forest (5 000)
Transfer of allocated entitlement to Wallaroo Water System for Kelvin Wetland (2 100)
Environmental use at Ballanya Lakes 0
Environmental use at Kariba Estuary (10 000)
Temporary trade of unused allocation ( 480)
Forfeiture of unused allocation ( 300)
Subtotal (17 880)
Equals
Closing allocation carryover at 30 June 2X10 3 600
18 Minton Environmental Water Holder – Model Water Accounting Report Model Water Accounting Report – Minton Environmental Water Holder 19
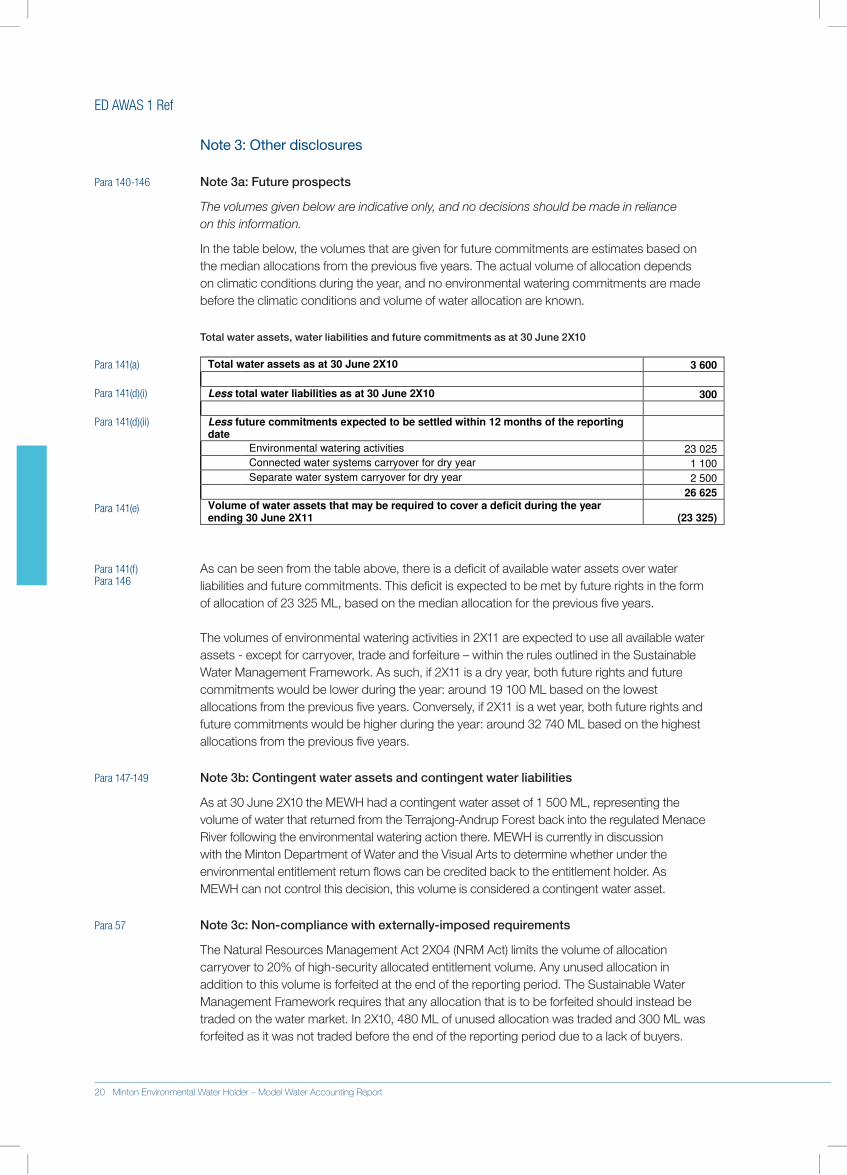
ED AWAS 1 Ref
Note 3: Other disclosures
Para 140-146 Note3a:Futureprospects
The volumes given below are indicative only, and no decisions should be made in reliance on this information.
In.the.table.below,.the.volumes.that.are.given.for.future.commitments.are.estimates.based.on.the.median.allocations.from.the.previous.five.years..The.actual.volume.of.allocation.depends.on.climatic.conditions.during.the.year,.and.no.environmental.watering.commitments.are.made.before.the.climatic.conditions.and.volume.of.water.allocation.are.known..
Totalwaterassets,waterliabilitiesandfuturecommitmentsasat30June2X10
Total water assets as at 30 June 2X10 3 600
Less total water liabilities as at 30 June 2X10 300
Less future commitments expected to be settled within 12 months of the reporting date
Environmental watering activities 23 025
Connected water systems carryover for dry year 1 100
Separate water system carryover for dry year 2 500
26 625
Volume of water assets that may be required to cover a deficit during the year ending 30 June 2X11 (23 325)
Para 141(f) As.can.be.seen.from.the.table.above,.there.is.a.deficit.of.available.water.assets.over.water.liabilities.and.future.commitments..This.deficit.is.expected.to.be.met.by.future.rights.in.the.form.of.allocation.of.23 325 ML,.based.on.the.median.allocation.for.the.previous.five.years..
The.volumes.of.environmental.watering.activities.in.2X11.are.expected.to.use.all.available.water.assets.-.except.for.carryover,.trade.and.forfeiture.–.within.the.rules.outlined.in.the.Sustainable.Water.Management.Framework..As.such,.if.2X11.is.a.dry.year,.both.future.rights.and.future.commitments.would.be.lower.during.the.year:.around.19.100.ML.based.on.the.lowest.allocations.from.the.previous.five.years..Conversely,.if.2X11.is.a.wet.year,.both.future.rights.and.future.commitments.would.be.higher.during.the.year:.around.32.740.ML.based.on.the.highest.allocations.from.the.previous.five.years..
Para 147-149 Note3b:Contingentwaterassetsandcontingentwaterliabilities
As.at.30.June.2X10.the.MEWH.had.a.contingent.water.asset.of.1.500.ML,.representing.the.volume.of.water.that.returned.from.the.Terrajong-Andrup.Forest.back.into.the.regulated.Menace.River.following.the.environmental.watering.action.there..MEWH.is.currently.in.discussion.with.the.Minton.Department.of.Water.and.the.Visual.Arts.to.determine.whether.under.the.environmental.entitlement.return.flows.can.be.credited.back.to.the.entitlement.holder..As.MEWH.can.not.control.this.decision,.this.volume.is.considered.a.contingent.water.asset.
Para 57 Note3c:Non-compliancewithexternally-imposedrequirements
The.Natural.Resources.Management.Act.2X04.(NRM.Act).limits.the.volume.of.allocation.carryover.to.20%.of.high-security.allocated.entitlement.volume..Any.unused.allocation.in.addition.to.this.volume.is.forfeited.at.the.end.of.the.reporting.period..The.Sustainable.Water.Management.Framework.requires.that.any.allocation.that.is.to.be.forfeited.should.instead.be.traded.on.the.water.market..In.2X10,.480.ML.of.unused.allocation.was.traded.and.300.ML.was.forfeited.as.it.was.not.traded.before.the.end.of.the.reporting.period.due.to.a.lack.of.buyers.
Para 141(a)
Para 141(d)(i)
Para 141(d)(ii)
Para 141(e)
Para 146
20 Minton Environmental Water Holder – Model Water Accounting Report
ED AWAS 1 Ref
Note 4: Segment information
Para 161-165 The.connected.water.systems.and.separate.water.system.are.two.discrete.components.that.make.up.the.Minton.Environmental.Water.Holder.water.report.entity.
It.was.considered.that.information.about.these.two.components.was.already.presented.in.a.manner.that.allows.users.to.evaluate.the.activities.of.the.water.systems..Reporting.additional.segment.information.will.not.provide.a.material.benefit.to.the.users.of.this.general.purpose.water.accounting.report.
20 Minton Environmental Water Holder – Model Water Accounting Report Model Water Accounting Report – Minton Environmental Water Holder 21


For more informationVisit our website at: www.bom.gov.au/water/wasb
DO
T507
2/10