water absorption and dielectric properties of epoxy insulation - diva
TRANSCRIPT

June 2008Erling Ildstad, ELKRAFT
Master of Science in Energy and EnvironmentSubmission date:Supervisor:
Norwegian University of Science and TechnologyDepartment of Electrical Power Engineering
Water absorption and dielectricproperties of Epoxy insulation
Saikat Swapan Dutta


Problem DescriptionThis assignment is a part of an ongoing research project at NTNU/SINTEF Energy Research, whichis sponsored by industry and the National Research Foundation (NFR). The main aim of thisresearch project is to develop materials and design criteria facilitating development of powerequipment for electrification of sub sea oil and gas production.
More specific the topics of this project assignment are to:
1. Review findings in the literature and:i) Present the theoretical basis for diffusion and absorption of water in filled epoxy.ii) Review of relevant literature with respect to the effect of water in epoxy related to itselectrical and mechanical performance.
2. Perform experimental investigations to examine the effect of water in epoxy related tothe following properties: Dielectric Breakdown Strength, Mechanical Strength, DielectricResponse, Glass transition Temperature. Also the effect of electrode materials on dielectricresponse is to be studied.
Assignment given: 14. January 2008Supervisor: Erling Ildstad, ELKRAFT


1
Preface: I would like to sincerely thank the following people. You have made my time at NTNU
well spent. First and foremost I would like to thank Prof. Erling Ildstad, for being such a
wonderful supervisor. I thank him for all his guidance, support, encouragement and
supervision throughout the semester. I would also like to thank Dr. Sverre Hvidsten for
his much helpful advice. I would also like to thank all my friends and colleagues for their
support and understanding. Last but not the least I would like to thank my Family for
their support which helped me a lot in completing my Masters Degree.

2
Abstract:
Characterization of Epoxy (diglycidyl ether of Bis-phenol A cured with Tri ethylene
Tetra amine) without fillers was done. The Water absorption test at 95°C shows that at
saturation the epoxy contains a water concentration of 2.089%. The diffusion coefficient
of absorption is calculated as 0.021 cm2/s. The diffusion coefficient of desorption is
calculated as 0.0987 cm2/s. The diffusion is almost 5 times faster than absorption. Also
the material looses weight as the hydrothermal aging progresses. The water in the sample
leads to chain scission which leads to the weight loss. The weight loss is more incase of
absorption followed by desorption than only absorption. The chain scission leads to
decrease in the mechanical strength by around 45%. The diffusion of water from the
samples doesn’t affect the mechanical strength of the materials. The glass transition
temperature reduces by 20°C with water inside the sample. The diffusion of water out of
the sample only increases by around 10°C. The Dielectric response of the material shows
that after the water absorption the sample shows high losses at lower frequencies. Also
the increase in the real part of the permittivity increases with low frequency. The rapid
increase in the real art of the permittivity of the material at lower frequencies can be
attributed to a polarization at the electrode due both to accumulation of the charge
carriers and to chain migrations. The breakdown test of the samples shows that with
water in the sample the breakdown strength of the material decreases by 10 KV, but the
material regains its dielectric strength when the water is diffused out. This shows that the
chain scission and weight loss of the samples has no or minimum effect on the dielectric
strength of the sample.

3
Index:
Preface: ............................................................................................................................... 1 Abstract:.............................................................................................................................. 2 1 Introduction: ........................................................................................................... 4 2 Literature review: .................................................................................................. 4
2.1 General Epoxy Chemistry: ......................................................................... 4 2.2 Water absorption in Epoxy ........................................................................ 8
3 Procedure Methods and Experimentation: ................................................... 9 3.1 Work Outline: ................................................................................................. 9
4 Casting of Epoxy samples: ............................................................................... 11 5 Equipments Used................................................................................................ 13
5.1 IDAX 206........................................................................................................ 13 5.2 Mettler Toledo AT250................................................................................. 14 5.3 Mettler Toledo DSC822 ............................................................................. 14 5.4 Lloyd Instruments LR 5K: ........................................................................ 15
6 Tests Performed (Experimentation):.............................................................. 16 7 Results and Discussion: ................................................................................... 18
7.1 Effect of Electrode Material on Dielectric response:........................ 18 7.2 Water absorption and desorption in Epoxy: ...................................... 19
7.2.1 Desorption:................................................................................................ 21 7.3 Glass transition temperature:................................................................. 23 7.4 Dielectric response: .................................................................................... 26 7.5 Mechanical test:........................................................................................... 28 7.6 Electrical Breakdown Strength: ............................................................. 31
8 Conclusion: ........................................................................................................... 34 9 Appendix: ............................................................................................................... 35
9.1 Appendix A: ................................................................................................... 35 9.1.1 Background theory:................................................................................... 35
9.1.1.1 Water Diffusion in Polymers: ............................................................... 35 9.1.1.2 Insulation Diagnostics Using Impedance Spectroscopy ....................... 39 9.1.1.3 Dielectric Response in Frequency Domain........................................... 42
9.2 Appendix B: List of Figures...................................................................... 44 9.3 Appendix C: List of Tables ....................................................................... 45
10 Bibliography: .................................................................................................... 46

4
1 Introduction: Epoxy resins have become an essential part of insulation materials since their
commercial introduction over 60 years ago. The versatility, stability under adverse
conditions, and ease of use has significantly improved the electrical equipment that relies
on their insulating abilities. From the smallest computer to chip to the largest motors and
generators, epoxy polymers serve their purpose and are required to do this for long period
of time. The evolution in both equipments and materials have been used a close
observation of the processes to ensure solutions to the inevitable problems.
Several conventions will be used in this paper to simplify discussions. Epoxy
resins will refer to the uncured material, still containing epoxy rings intended for
polymerization. The resin will frequently be compounded with other components to
achieve the desired properties in the final polymer. Once the system is cured, the material
becomes an “epoxy polymer”.
The conversion from resin to polymer is a chemical reaction that must be carried
out every time in a proper fashion. Any change that can affect the rate of a chemical
reaction can affect the final properties of the epoxy polymer.
2 Literature review:
2.1 General Epoxy Chemistry: Epoxy resins are a family of thermoset polymers in which two components are
mixed to eventually form a glassy product at room temperature which has reasonable
electrical insulating properties. Many different curing agents are used to bring about
cross-linking if this resin. The action of the curing agent or the “hardener” is to open and
join into the epoxide rings. Cross-linking in cured epoxies can be very high and an
extensive network of connections with high mechanical rigidity is produced.
To improve the physical and mechanical properties of the end product and also to
control the cost, the epoxy resins are loaded with fiber-glass, fumed silica, and other

5
inorganic particulates fillers. Cast resin polymers are compounds that are formulated by
mixing resin with hardener, filler, plasticizer, and colouring pigments. Here fillers may
constitute 50% or more of the compound weight, during curing phase, epoxy may shrink
by about 3%, which is reduced to less than 0.5% by adding mineral fillers.
Epoxy resin chemistry is based of the reaction if three membered rings of two
carbons and an oxygen atom known as the oxirane group, commonly known as the epoxy
group. This chemical reaction of the groups has been known for many years but only
during the post World War II period sufficient raw materials containing the epoxy group
were commercially available. Dow Chemicals, Ciba-Geigy and Shell Oil were early
innovators in developing processes for the large scale production of materials containing
this reactive group [1].
Insulation industry is not a large user of epoxy resin compared with other resin
users in the chemical industry. Hence, the resins to be used for insulation must be
available from the industry for other widespread uses, and electrical insulation must be
“piggy-bagged” onto the larger uses. The largest quantity material made is the diglycidyl
ether of Bis-phenol A, which is known by the acronym, BPADGE, and is made by the
reaction of ephichlorohydrin with Bis-phenol A. The simple BPADGA (n=0) is a
crystalline material (mp ≈ 35° C), which creates formulation problems. The displacement
reaction is therefore carried out so there are additional reactions of the phenol with the
epoxy group to form dimmers or oligomers. The resulting mixture then remains a viscous
liquid, which is easier to handle in subsequent formulations using the epoxy resin. A
range of molecular weight material is available from manufacturers, where the n in Fig. 1
can have a variety of values from 0.1 to 100.
There are numerous agents that react with epoxy resins to convert them to
insulation polymers in the process called cure. The choice of system is dictated by the
method of application, the cure process, and the properties wanted both in the uncured
resin and in the final polymer. The polymer properties are affected by the curing agent as
they are incorporated into the polymer. The common curing processes are:
Amine Cure: A common cure system is to use a multifunctional amine to react
with the bis epoxy resins. The ring polymerizes by the amine which adds to the epoxy
group to form an amino alcohol . The amine cures, the process can actually stop at this

6
stage, although some more additions can occur with the amine if secondary hydrogen is
present. However, the usual process involves other amines reaction with other epoxy
groups to form the final network of the crossed material.
In low molecular weight amines, the concentration of amine groups is high so that
the heat of reaction becomes a serious problem, leading to runaway reaction and product
charring. Also, the lower molecular weight amines tend to have toxic characteristics and
their use is to be avoided. One of the ways to eliminate the low molecular weight amines
is to use a polyamide. This is an oligomeric product of the reaction of amines with acids.
While polyamides contain amide groups that can react through any hydrogen on the
amide nitrogen, the reactant for the epoxies is generally the amines on the end of the
amide chains. The reduction in concentration and the higher molecular weight solves the
high reactivity and the toxicity problems, and the use of the amide chains provides an
additional way to vary the physical properties of the end polymer.
Acid Cure: The cationic polymerization of the epoxy by an acid or cation
proceeds by a different mechanism than the amine polymerization. The acid adds to the
oxygen of the epoxy ring and opens to the carbonium ion intermediate. This intermediate
can in turn add to another epoxy ring. This process is actually a chain addition reaction
and results in many rings being polymerized with each acid or cation, in contrast with the
previously mentioned amine case, where only one or two rings are polymerized with each
amine group. Finally, the carbonium ion ether acquires a hydrogen atom or reacts further
with another epoxy, continuing the polymerization.
The epoxy unit, when polymerized by a ring opening process, releases energy to
the system. This is not an insignificant amount of heat. One who has mixed considerable
amount of epoxy resin will know. The exotherm can be quite vigorous at its extreme. The
heat release must be controlled, but since it is depended upon for many cures, it cannot be
totally eliminated. However, the heat rise of the exotherm is important, especially in
systems where it is difficult to provide enough heat for cure. For example, room
temperature cure epoxies do not generally give satisfactory physical properties unless
there is enough material present to create an exotherm, which provides enough heat to
cure the resin.

7
Cure of epoxy resins is ended when all available epoxy groups have been opened
and their energy released. The usual method of determining cure on a laboratory scale is
with differential scanning calorimetry (DSC), which measures the residual heat in a given
sample. The method is particularly valuable for determining when the bulk of the heat is
released but becomes less sensitive as the end of the reaction is approached and the
concentration of remaining epoxy group diminishes. Because most of the important
physical and electrical properties are generated in the final stages of cure, it is very
important to be able to follow this part of the cure system.
The glass transition temperature (Tg) is the temperature where the polymer
undergoes a transition from the glassy, brittle and rigid state at the lower temperature to
the rubbery or flexible state. At a high temperature, polymer can reach the melting point
(Tm) where the rubbery polymer becomes liquid and begins to flow. In the case where
the polymer is cross-linked, as with epoxies, there is no melting point and the polymer
does not reach the point where it starts to flow. Molecular movement is severely limited
below Tg, and cure effectively stops once the Tg is reached by the polymer, since the
molecules cannot slide around anymore.
The presence of hydroxyl group in the polymer that results from the ring opening
polymerization makes the polymer susceptible to water absorption. The water can cause
the polymer to lose some strength which is present in the dry polymer. This is worse
when the use temperature is near or above Tg, because the water effect causes a
disastrous failure. It is knows that water can cause a 20° to 30°C drop in Tg of an
epoxy[1]. This drop can cause the tensile strength of the epoxy to drop from 40% to 75%
[1].
When more cross links are present the drop in Tg is lower. And the drop in tensile
strength is less. There is some indication that the use of anhydrides for cure allows the
epoxy polymer to have better properties when the polymer is used at temperatures
slightly above Tg.
One of the uses of epoxy potting material is to conduct heat through the polymer.
This heat can be as simple as the heat of reaction of the polymerization, a one-time
problem during the curing cycle. It can also be important during the use of the system
where heat much be conducted away from an active part to a heat sink. Most polymers
conduct heat at about the same rate where the thermal conductivity (TC) is from .17 to

8
.22 watts/meter-degrees Kelvin (W/mK). This number can be increased by the addition of
inorganic fillers. By mixing 30% to 40% by weight of these fillers the TC can be raised to
.31 W/mK. Even higher value can be reached using glass fibers, or in the case of high
voltage application, 50% or more mica can be used to reach value of .35-.4 W/mk [1] .
2.2 Water absorption in Epoxy It has been long known that epoxy and epoxy composites easily absorb water when
exposed to humid environments. This reduces the stable lifetime of the material.
Experiments show that the water in epoxy is present in two states [7]:
• Evenly distributed water molecules between the polymer chain
• Condensed water in fractures and cavities.
In Epoxy with mineral fillers it has been seen that water destroys the bond at the interface
between the filler and polymer. This creates additional cavities along the fibers that can
be filled with water.
Although the sorption processes of liquids and vapour in glassy polymers follow complex
water diffusion mechanisms in epoxy resin matrices, their behaviour has frequently been
found to approximate to that corresponding to Fickian diffusion. The characteristics of
Fickian diffusion have been described as under:
• The sorption curves are linear in the initial stages.
• Above the linear portion both absorption and desorption curves are concave to the
abscissa. For absorption the linear region extends to over 60% or more of the
region studied.
• When a series of reduced absorption curves are plotted for films of different
thickness, the curves are super-imposable.

Figure 1: Water absorption in epoxy with mineral fillers. Sample thickness of 5.3 μm [7] .
3 Procedure Methods and Experimentation:
3.1 Work Outline:
The main aim of the project is characterization of unfilled epoxy polymer (bis-
phenol A cured by amine). The raw material used for epoxy casting was RenLam© CY
219 (epoxy resin) and Ren© HY5160. These are procured from the company Huntsman.
The work for this thesis includes making epoxy samples and then performing different
tests on them for characterization. The casting was done using two different ways. In one
way the resin and the hardener was mixed manually and then put in to a form then the
mixture is vacuum cured at 60° C. In the other method the mixture of the resin and
hardener was mixed in the machine and then put into the forms and then vacuum cured at
60° C. Both the samples were studied for dielectric response to find if there is any
difference due to the way of mixing the resin and hardener before curing.
For the ease of mixing large quantity of epoxy resin and hardener, the materials
for all samples casted were mixed in the machines. The samples were casted in different
shapes for different kind of tests. The following are the shapes, in which the epoxy
samples are casted,
9

• Disc ( 1mm thick X 10 mm diameter )
• Dog bone shaped ( 4 mm X 115 mm X 10 mm )
• Rogowski shaped ( 1mm think )
Figure 2: “Dog bone” shaped Epoxy sample
Figure 3: Disc epoxy samples
Figure 4 : Rogowski samples for breakdown.
10
11
To study the effect of electrode material on dielectric response one of the disc shaped
sample was casted with one side with aluminum foil casted into it. The aluminum foil
acts as the high voltage electrode. In the other sample the sides of the epoxy were painted
with silver paint, which acted as the high voltage electrode.
The main characterization of the unfilled epoxy sample was done on the basis of
water absorption at 95° C. The following are the tests performed on the sample;
• Dielectric response
• Glass Transition Temperature
• Mechanical Strength ( stress – strain curve)
• Breakdown Strength.
Also the absorption and desorption coefficients for the material was found.
4 Casting of Epoxy samples:
For the casting of the epoxy samples RenLam© CY 219 and Ren© HY 5160 were
used. RenLam© CY 219 is the epoxy resin and Ren© HY 5160 is the hardener. They are
mixed with each other in the proportion 100 (RenLam© CY 219) : 50 (Ren© HY 5160) by
weight. CY 219 is a diglycidyl ether of bis-phenol A, which is known by the Acronym,
BPADGE. HY 5160 is hardener containing a multifunctional amine. The things that have
to taken care of while mixing manually that the mixture should not contain any trapped
air bubbles, as it is very easy if proper care is not taken to introduce air bubbles, in the
resin and hardener mixture. Also the resin and the hardener are to be mixed thoroughly,
else the polymerization is not proper and the physical, mechanical and electrical
properties of the polymer are not to the level expected. While the mixture is put into the
cast again care should be taken not to introduce any air bubble in the mixture. Though
this is very hard and practically impossible hence the curing is done in a vacuum oven.
The trapped air bubbles are released when the vacuum is turned on. Another important
thing to take care of is that sufficient Teflon spay is to be added on the surface of the cast
so that the cured epoxy can be easily removed. This is necessary as the thickness of some

samples are small (1mm) hence the samples may break while removing it from the cast if
they are stuck to the cast. The figure below shows the pictures of the casted epoxy
samples. One sample is casted with aluminum foil on one side. This is used as an
electrode for measuring the dielectric response. The effect of electrode material is
studied. On the other samples the electrode was silver paint. As shown in Fig 6. Due to
the shrinkage problem the casting to epoxy with aluminum foil is difficult as the cured
epoxy is not a flat disc it gets a bit curved and hence causes trouble while placing it in the
arrangement for measuring the dielectric response. The other samples are made in
Machine and applied silver paints on both sides as shown in the Fig 5. The samples were
very good and flat. Hence the tests are carried on the samples with electrodes as silver
paint. Also the samples were easy to cast with the machines than manually.
Figure 5: Epoxy samples casted in machine. With silver painted electrodes.
Figure 6: Epoxy samples manually casted. With aluminium foil as electrode.
12

5 Equipments Used
5.1 IDAX 206 The IDAX 206 is an insulation diagnostic system designed and manufactured by “PAX
Diagnostics”. It employs the principle of dielectric spectroscopy as described in section
2.4, and balances out the capacitive current before measuring it.
The IDAX 206 is by designed intended for performing insulation diagnostic in the field,
for instance on transformers, high voltage cables, bushings etc. It has two built in signal
generators capable of generating sinusoidal voltage of 10V peak and 200V peak
respectively. The frequency range is between 0.1 mHz to 1 kHz using the built in voltage
sources. The voltage is measured by a voltmeter and the current is measured by
electrometer acting as a current to voltage converter. The analogue signals are then
converted to digital samples used in calculations.
The system operates fully standalone, essentially containing a PC with a slimed down
version of Windows Xp operating system for embedded systems and a hard drive for
storing measurement data. Measurements are programmed using a specialized scripting
language, and executed through instrument control software. The instrument is capable of
calculating any of the parameters in different insulation models, and can also export the
calculated values to text files for manual post-processing.
Figure 7: IDAX 206
13

5.2 Mettler Toledo AT250
The Mettler Toledo AT250 is a precision scale for measuring weights up to 200g with a
resolution of 0.01 mg. It calibrates itself automatically when it detects a change in
temperature or relative humidity. It is shown in Figure:8
Figure 8: Mettler Toledo AT250
5.3 Mettler Toledo DSC822 Mettler Toledo DSC822 is Differential scanning calorimetry equipment. It can measure
the Glass Transition temperature of the given polymer samples. It is shown in Fig 9.
14

Figure 9: DSC822
5.4 Lloyd Instruments LR 5K:
Lloyd Instruments LR 5K is the equipment for applying the tensile force on the dog bone
shaped objects. This unit is connected with a computer which records all the data of the
stress and the Extension during the test. This equipment can apply tensile force upto 5
Kilo Newton.
15

Figure 10: LR 5K
6 Tests Performed (Experimentation): To characterize the epoxy material Different tests were performed. The following tests
were performed:
To study the effect of electrode material two samples were taken. One of the
samples was casted with aluminum foil casted on one side to be used as the high voltage
electrode; where as in the other sample there was no metal foil casted, the surface of this
sample was painted with silver paint. Both the samples were tested for Dielectric
response for frequency range 1000 Hz to 0.01 Hz. The results were noted. The value of
dielectric loss factor and permittivity (both real and imaginary part) were studied.
The samples were put in water at 95°C and the water absorption and desorption
were studied. The graph of water content as a percentage of weight of the polymer versus
time is plotted and the coefficient of absorption and desorption were found out.
16

17
Dielectric response test was done on the samples in three different stages, namely
in Dry condition before the start of water absorption, after the samples are kept under
water for absorption at 95°C (hydro thermal ageing) in wet condition and after the
desorption is done. The results were documented and the effects of the water in the
samples in the dielectric response were discussed. Also the effect of hydrothermal aging
is on dielectric response is discussed.
The glass transition temperature (Tg) of the samples were found using DSC
(Differential Scanning Calorimetry). The Tg is measured in the samples in dry condition
before the water absorption process, then in samples after the water absorption process
with moisture in the sample, and then in sample after the desorption. The effect of water
on the Tg of the epoxy polymer is studied and the result is documented and discussed.
The mechanical strength of the epoxy polymer is studied. A destructive test has
been performed. A tensile force is applied to the dog bone shaped samples till it breaks
and the stress versus strain curve is plotted. This test is also done in dry sample before
water absorption, then in sample which was kept under water at 95°C for absorption, and
in sample which has undergone absorption and desorption at 95° C. The difference
between the stress-strain curves is documented and discussed.
Breakdown testing is done in Rogowski shaped object to find the dielectric
breakdown strength of the materials at different condition to study the effect of water in
Dielectric breakdown strength of the material. The test is again performed on three type
of samples, Dry samples (before water absorption), Wet samples (after water absorption
at 95°C), and on samples after desorption. The breakdown strengths of the materials is
documented and discussed.

7 Results and Discussion:
7.1 Effect of Electrode Material on Dielectric response: The effect of electrode material on the dielectric response of the material was
studied. On one sample the high voltage electrode is painted with silver paint. On the
other sample the aluminum foil which is casted on to the sample is used as the high
voltage electrode. The measuring electrodes of both the samples are silver painted. Fig
11.
Figure 11: Dielectric losses for sample with two different types of electrodes
The dielectric response test was performed on both the samples. The frequency
range used was from 1000 Hz to 0.1 Hz. The dielectric losses at high frequency for both
the samples don’t have much difference. But at lower frequencies the losses of the
sample with silver paint is higher. As can be seen from the graph the dielectric response
of the material is affected by the materials of the electrode used. The aluminum foil
casted onto the sample and that is the fact that there is perfect connection between the
electrode and the epoxy. As there the silver paint is applied on the sample there are some
18

gaps in the connection. As the surface of the epoxy is not uniform in the micro level, the
silver painted electrodes has some interface with the epoxy. Hence there is an interfacial
polarization. This polarization loss adds to the dielectric loss. At lower frequency this is
clearly visible by the increased loss with the sample with silver paint. As interfacial
polarization in a relaxation mechanism, at lower frequency it is dominant and at higher
frequencies it is negligible. Also the Work function of Aluminum is lower than that of
silver. An shrinkage of the epoxy was seen when the aluminium foil is casted into it. This
skrinkage might crease voids on the contact between epoxy and the foil. This give rise to
many problems like partial discharge. Also if water is absorbed my the sample it may
condensate in to the voids giving rise to high losses and early breakdown.
7.2 Water absorption and desorption in Epoxy: The samples as shown in Fig 2 are kept under water at 95°C in a heating cabinet.
The weights of samples were measured from time to time and the weight gain was noted.
The graph percentage weight gain with against time was plotted. It is seen that the
absorption process here is following the Fick’s law. A curve fitting was done. The
equation used for fitting the curve is
0.75( )(1 ( )K XY Cs e ×= − 1
Where,
Cs = water concentration at saturation
K = how close to saturation the sample is.
19

0 20 40 60Time(hrs)
80
0
0.5
1
1.5
2
2.5
Wat
er C
once
ntra
tion
(% w
eigh
t)
Figure 12: Water absorption Graph
The curve fitting is done in the software Grapher 4. Both the above parameters are
adjusted to fit the graph so that the closest fitting is got to the points obtained
experimentally. The Graph of water absorption is shown below.
The diffusion coefficient is calculated and is presented in Table 1.
Temperature Absorption
Coefficient
(cm2/s)
Saturation at
Concentration
(% of weight)
95°C 0.021 2.089 Table 1: Diffusion Coefficient
As can be seen from the absorption curve, initially, the resin gains weight linearly
with time, the rate then decreases and the polymer starts loosing weight after around
20

75hours of aging. However, this absorption was not accompanied by any visible damage
to the material.
From the absorption curve, it can be clearly seen that the residual weight change,
ΔW, as a function of initial weight, W0, increased initially, and was then followed by a
reduction that led eventually to a weight loss. This behavior suggests irreversible trapping
of water and degradation of the polymeric structure during hydrothermal aging. This
result is in good agreement with Ref [14], where a commercial epoxy resin based on
DGEBA was studied.
The absorption behavior shown in Fig 12 suggests the following scenario, in
qualitative terms. Initially, the polymer absorbs water, of which a fraction reacts
chemically, causing hydrolysis leading to chain scission. Schematically, we can write:
2A B H O A OH B H− + → − + −∼ ∼ ∼ ∼ 2
where, A and B represent chemical groups in the epoxy main chain. In the early stages,
chain scission leads to simply to the chemical addition of water that will be unable to
leave upon drying. However, after the number of chemical reaction site has increased, the
probability of a given inter crosslink chain being cut into two (or more) increases, thus
facilitating separation and subsequent leaching of the detached segments from the
network. This leads to a weight loss.
7.2.1 Desorption: After the water absorption for a given period, the samples were surface dried and
weight. Drying was continued, at the same temperature (95°C) as that of absorption , and
the samples were periodically weighed until a good estimate of their final equilibrium
weight after desorption could be obtained. This process normally took 1 to 2 weeks to
finish.
Fig 13 below shows desorption of the epoxy samples at 95°C.
21

0 10 20 30 4Time (hrs)
0
-1
0
1
2
Water C
oncentration(%
weight)
Figure 13: Desorption Graph
The coefficient of Diffusion is given in Table2. It can bee seen that the diffusion
is around 5 times faster than absorption.
Temperature at which
Desorption is done
Diffusion coefficient of
Desorption (cm2/s)
95°C 0.0987 Table 2: Desorption coefficient
It can be seen from the graph that the weight loss due to chain scission is more in
case of absorption followed by desorption [1].
22
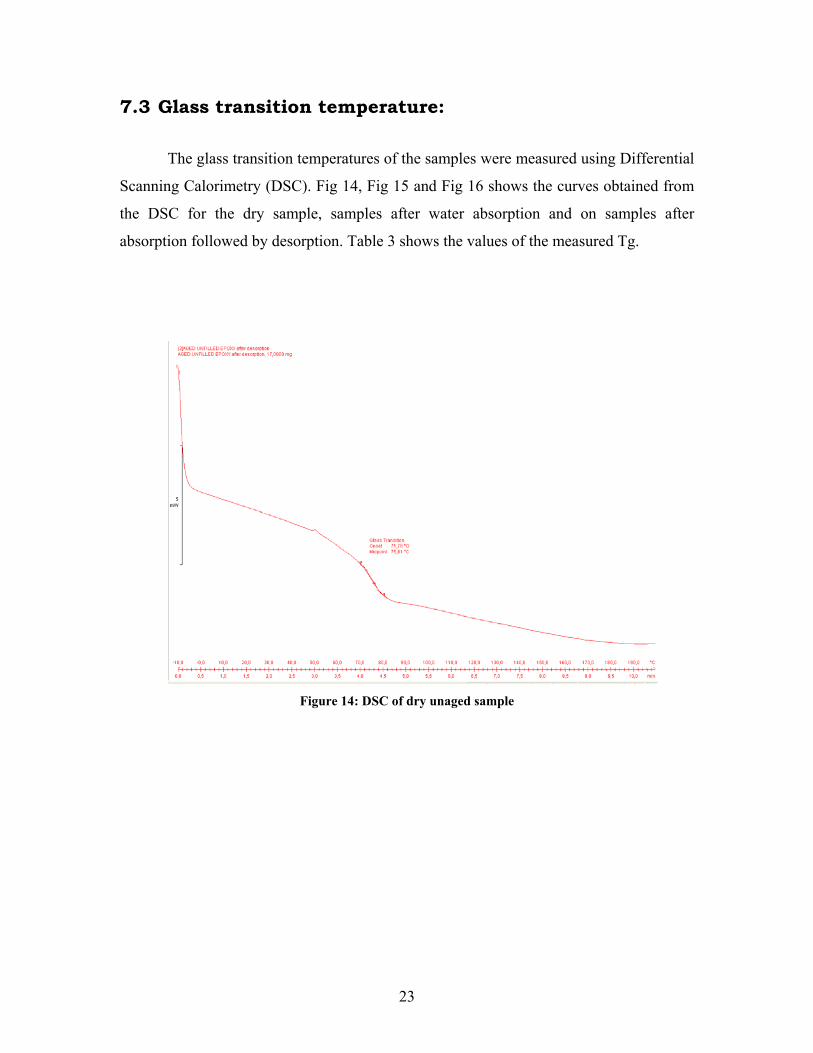
7.3 Glass transition temperature:
The glass transition temperatures of the samples were measured using Differential
Scanning Calorimetry (DSC). Fig 14, Fig 15 and Fig 16 shows the curves obtained from
the DSC for the dry sample, samples after water absorption and on samples after
absorption followed by desorption. Table 3 shows the values of the measured Tg.
Figure 14: DSC of dry unaged sample
23

Figure 15: DSC of Wet aged sample
Figure 16: DSC of aged dried sample.
24

25
Samples Onset
Temperature
Midpoint
Temperature Unaged
Dry sample
71.76°C 75.81°C
Aged wet
sample
49.65°C 53.67°C
Aged sample
(with water absorption
followed by desorption)
56.05°C 59.78°C
Table 3: Glass transition Temperatures.
It can be observed that the Tg for the samples with water have reduced by
approximately 20°C. With water concentration of around 2.0 % the Tg reduces by 20°C.
The water in the sample can cause the polymer to lose some strength. This problem is
even worse at high temperature and can lead to disastrous failure [1]. When the cross
links are present, the Tg drop is lower and the drop in tensile strength is less. Knowing
the Tg of the cured polymer is especially necessary where the polymer is used for its
adhesion or cohesion properties. If the Tg is exceeded, the tensile strength and
compressive strength of the polymer is drastically reduced, and even if the polymer is
cross linked, the insulation can fail. There is some indication that the use of anhydrides
for cure allows the epoxy to have better properties when the polymer is used at
temperatures slightly above Tg [1].
In many systems, the insulation in use will be heated and the cure will continue to
push the Tg to high temperature. If the stress damages the epoxy polymer as the Tg is
exceeded, failure can occur. The practical solution to this problem is to ensure that the
cure temperature exceeds the expected use temperature of the insulation.

7.4 Dielectric response:
Disc samples of dimension 10mm (diameter) X 1mm are used to study the
dielectric response. The electrodes on the samples used are conduction silver paint. Fig
17 shows the picture of the samples prepared for testing. Three samples were tested. The
first sample tested was a dry sample (un-aged). The dielectric response is shown in the
Fig 17, blue curve.
Figure 17: Dielectric response of unaged, wet aged and aged dried samples
The second sample tested is a sample that has undergone hydrothermal aging. The
sample was put under water at 95°C and the weight gain was noted. The sample when
near saturation with a water concentration of 2.089 %, it was removed from the water
cooled down and dried superficially. The samples were cooled down so that no water is
diffused out of the sample. The electrodes were pained with silver paint on both the sides
of the sample. This sample is then tested with IDA 206 instrument for dielectric response.
The frequency range used was 1000 Hz to 0.1 Hz. The Fig 17,black curve shows the
26

dielectric response of this sample. It can be seen that due to water in the sample the
dielectric loss factor have increased considerably. Also there is a considerable increase in
the real part of the permittivity of the material Fig 18 Green curve. At low frequency the
dielectric loss factor increases rapidly this is due to the presence of water in the sample.
This shows a conduction effect inside the sample due to the presence of water, which
causes the high conductive current at low frequency. The rapid increase in the real art of
the permittivity of the material at lower frequencies can be attributed to a polarization at
the electrode due both to accumulation of the charge carriers and to chain migrations. The
chain migration is high because the water causes a chain scission in the epoxy after
absorption. With water present in the sample it’s easy for the chain to migrate than in dry
samples.
Figure 18: Relative permittivity of unaged and wet aged sample.
The third sample tested was kept under water at 95°C and then when reached
saturation has been subject to desorption at same temperature. When the sample is dry
then the samples is cooled down and then the electrodes were painted on to the sample.
Silver paint is used for the electrodes. The Fig 17, Green curve shows the dielectric
response. The below shown are the dielectric loss factor and the real part of the relative
permittivity. It can be seen that after the absorption followed by desorption the dielectric
27

loss actually is quite close to the results already obtained. But in the lower frequency
range a increase in the dielectric loss is observed.
7.5 Mechanical test: With respect to finding the characteristics of the epoxy, it is important to find the
mechanical properties as well. It’s an important properties looked at in many industrial
applications. The Dog bone shaped samples were used for testing. The Fig 2 shows the
picture of the samples. The samples were then applied tensile force till breakage. The
stress-strain curves were plotted. These Curves give the idea about the mechanical
strength of the material.
Fig 19 shows the stress-strain curve of the unaged sample.
0 2 4 6 8Extension(mm)
10
0
500
1000
1500
2000
2500
Stress
(N)
Figure 19: Stress – Strain Curve for Unaged sample
28

For the second set of test dog bone samples are immersed in water. Till they reach
saturation around 2.089% of water concentration. The samples are then cooled down and
dried superficially and then again tensile force is applied on them till break. The stress
strain curve is plotted from the test. Fig 20 shows the stress-strain curve of the samples
after they have undergone water absorption at 95°C. By comparing with Fig 19 it can be
seen that the after the water absorption the material has much lower Yield stress. The
Yield stress almost reduces by 50%. But the material can take much more strain before it
breaks. The elongation at break is much larger with water in the sample. The water
results in chain scission which in turn makes the sample less rigid. But the material
suffers a permanent deformation after yield point. The stress at yield point is also reduced
drastically.
0 5 10 15 20 25
Extension (mm)
0
400
800
1200
Stress(N)
Figure 20: Stress – Strain curve for wet aged sample
29

For the third set of tests dog bone shaped samples were subjected to water
absorption followed by desorption at 95°C. After the desorption process the samples are
cooled down and then they were subjected to mechanical tensile force till break. The
Stress-Strain curve is plotted for the samples. Fig21 shows the Stress-Strain curve. While
comparing it with Fig 19 and Fig 20, we can see that even after desorption the material
doesn’t gain back the mechanical strength. That proves that the water present in the
epoxy doesn’t only acts as a flexibilizer, it results in chain scission causing permanent
and irreversible damage to the cross linking in the materials. Due to this the material
looses strength.
0 4 8 12Extension(mm)
16
0
400
800
1200
1600
2000
Strain(N
)
Figure 21: Stress – Strain Curve for the Aged dried samples
30

31
Sample Reference Stiffness (N/m) Young's Modulus (MPa) Tensile Strength (MPa)Dry sample 1 635055.1498 1825.783556 57.3426342 Dry sample 2 585805.87 1684.191876 55.00903548 Dry sample 3 656198.6968 1886.571253 57.69517294
Aged wet Sample 1 404038.9939 1161.612108 26.38791279 Aged wet Sample 2 399761.2448 1149.313579 26.04797695 Aged wet Sample 3 284783.2527 818.7518515 21.29674607
Test Sample aged dried 1 500984.3778 1440.330086 38.0221676 Test Sample aged dried 2 551794.613 1586.409512 39.27350708 Test Sample aged dried 3 615122.0248 1768.475821 41.6396404
Table 4: Mechanical test data of Unaged, aged wet and aged dried samples.
7.6 Electrical Breakdown Strength:
Electrical breakdown strength of the epoxy material was studied for this epoxy
type. For this test Rogowski shaped materials were used. Fig 22 shows the samples. The
Break down test was performed on three sets of samples. Each set consist of 3 samples.
First set of samples were test for breakdown. These samples were not subjected to any
kind of aging. The break down strength of the samples was given in Table 5.
Samples Breakdown Strength.
C1 54 KV
C2 31.6 KV
C3 45.1 KV Table 5: Breakdown strength of Unaged samples

Figure 22: Unaged sample for breakdown.
The second set of samples was subjected to water absorption at 95°C. They were
tested for electrical breakdown strength when the water concentration in the samples was
2.0 % of the weight of the samples. The Breakdown strength of the samples is shown in
Table 6. Comparing the results of Table5 and Table 6 it can be seen that with water in the
samples reduces the breakdown strength of the material. This can be concluded from the
fact that water inside the samples helps in conducting the charges across the epoxy which
leads to early breakdown of the material.
Samples Breakdown Strength.
C4 29.5 KV
C5 37.0 KV
C6 29.7 KV Table 6: Breakdown Strength of Aged wet sample
32

Figure 23: Aged wet sample for breakdown.
The third set of samples were subjected to water absorption at 95°C followed by
desorption at the same temperature. The breakdown strength of these materials was then
tested. Table9 shows the results of this test. The results shows that the epoxy regains their
breakdown strength after the water is diffused out and the small weight loss after
desorption don’t affect the breakdown strength of the epoxy.
Samples Breakdown Strength.
C7 50.3 KV
C8 44.0 KV
C9 50.7 KV Table 7: Breakdown Strength of aged dried samples
Figure 24: Aged dried sample for breakdown.
33
34
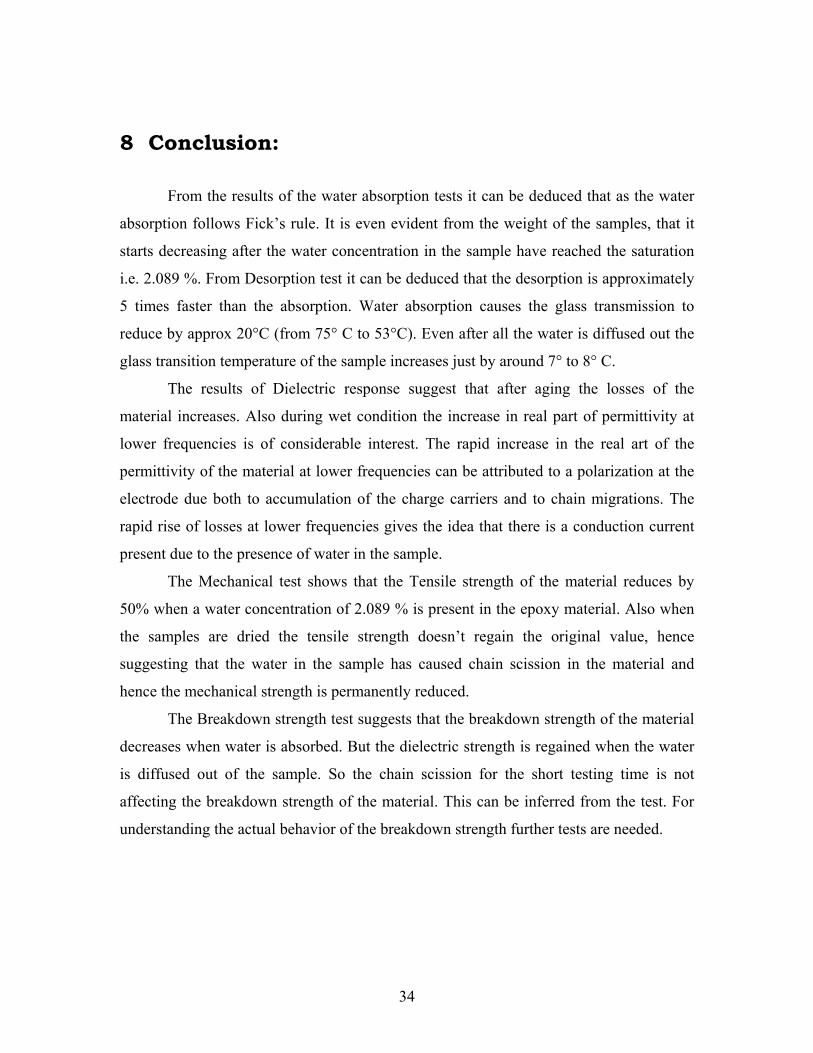
8 Conclusion:
From the results of the water absorption tests it can be deduced that as the water
absorption follows Fick’s rule. It is even evident from the weight of the samples, that it
starts decreasing after the water concentration in the sample have reached the saturation
i.e. 2.089 %. From Desorption test it can be deduced that the desorption is approximately
5 times faster than the absorption. Water absorption causes the glass transmission to
reduce by approx 20°C (from 75° C to 53°C). Even after all the water is diffused out the
glass transition temperature of the sample increases just by around 7° to 8° C.
The results of Dielectric response suggest that after aging the losses of the
material increases. Also during wet condition the increase in real part of permittivity at
lower frequencies is of considerable interest. The rapid increase in the real art of the
permittivity of the material at lower frequencies can be attributed to a polarization at the
electrode due both to accumulation of the charge carriers and to chain migrations. The
rapid rise of losses at lower frequencies gives the idea that there is a conduction current
present due to the presence of water in the sample.
The Mechanical test shows that the Tensile strength of the material reduces by
50% when a water concentration of 2.089 % is present in the epoxy material. Also when
the samples are dried the tensile strength doesn’t regain the original value, hence
suggesting that the water in the sample has caused chain scission in the material and
hence the mechanical strength is permanently reduced.
The Breakdown strength test suggests that the breakdown strength of the material
decreases when water is absorbed. But the dielectric strength is regained when the water
is diffused out of the sample. So the chain scission for the short testing time is not
affecting the breakdown strength of the material. This can be inferred from the test. For
understanding the actual behavior of the breakdown strength further tests are needed.

9 Appendix:
9.1 Appendix A:
9.1.1 Background theory:
9.1.1.1 Water Diffusion in Polymers:
Water or any other fluid diffusion in a solid material is described by Fick’s Two
laws. Fick’s first law states that in the steady state condition, the flux of water J [g/mm2]
through a solid is proportional to the gradient of the water concentration [g/mm3].
,J Dxφ∂
= −∂ 3
φ = Water concentration in the material
D = Diffusion coefficient or Diffusivity of the material [mm2/s], relating to the speed at
which the water concentration changes in side the material.
Fick’s Second law is given by,
2
2Dt xφ φ∂ ∂
=∂ ∂ 4
Lets consider a rectangular object as shown in Fig 25 . It has an initial
concentration as φ i. The object is exposed to moisture, giving a water concentration on
the surface of φ a . The boundary conditions are as under:
φ = φ i, for 0 < x < h.
35

φ = φ a, for x > 0.
l
b
h
Figure 25: Geometry of Rectangular test specimen
Applying Fick’s second law following solution can be found.
2 2
20
(2 1)4 1 (2 1)1 sin exp2 1
i x
jm i
j Dj xj h h
φ φ ππφ φ π
∞
=
,t⎡ ⎤− ++= − −⎢ ⎥− + ⎣ ⎦
∑ 5
where φ m is the water concentration when the object is fully saturated and Dx is the
diffusivity normal to the surface. By integrating Eq. (3) over the object’s full thickness
the total water content can be obtained, giving the relation
2 22
2 21
e x p ( 2 1 )81
( 2 1 )
x
i
jm i
D tjhm mG
m m j
π
π
∞
=
⎡ ⎤⎛ ⎞− + ⎜ ⎟⎢ ⎥− ⎝ ⎠⎣ ⎦≡ = −− +∑ 6
where,
m = weight of the moisture at any given time,
mi = initial weight of moisture on the object,
mm = weight of moisture at full saturation.
G = measure of how close to full saturation the object is, It is dimension less.
36

The value of G can be approximated by the equation
0.75
21 exp 7.3 xD tGs
⎡ ⎤⎛ ⎞= − −⎢ ⎥⎜ ⎟⎝ ⎠⎢ ⎥⎣ ⎦
7
The value of the parameter s is dependent on the fact if the object is exposed to moisture
on either sides or a single side. It exposed on both sides, s = h. If exposed on only one
side then s = 2h.
For Practical purposes, the percentage moisture content is the most interesting
quantity. Usually defined as the weight gain of the material, give by the formula below,
( ) .100,d
d
W WM M tW−
= ≡ 8
Where, W = weight of the sample at any given time.
Wd = weight of the dry material.
By putting W = Wd + m, and rearranging the terms we get
( )m i ,iM G M M M= − + 9
Where, Mi = initial moisture content
Mm = moisture content at full saturation.
The diffusivity can be estimated by plotting the water uptake versus time t and using
numerical tool (Grapher 4 ) to fit to Eq.* to the experimental data. Also the diffusivity
can be calculated by plotting water uptake versus t and D can be calculated by the
following equation.
22
2 1
2 14 m
M MhDM t t
π⎛ ⎞⎛ ⎞ −
= ⎜⎜ ⎟ ⎜ −⎝ ⎠ ⎝ ⎠⎟⎟ 10
If diffusion through the side surface can be neglected then Dx≈D. If the diffusion through
the side surface can’t be neglected then Dx can be calculated by the following equation.
37

2
1xh hD Dl b
−⎛ ⎞= + +⎜⎝ ⎠
⎟ 11
Figure 26: Illustration of change of moisture content with square root of time. The initial rate of
change is almost constant.
38

9.1.1.2 Insulation Diagnostics Using Impedance Spectroscopy
In this method the different parameters of the Insulation under test is determined
by calculating the impedance of the material. This is done in following project with the
help of and Equipment from PAX Diagnostic called IDAX-206. The impedance of the
sample is measured by applying a voltage across the sample. This voltage will generate
current through the sample. By accurately measuring the voltage and the current, the
impedance can be calculated.
V
A
computer with DSP-board voltage source
control voltage
measured voltage
measured current
sample
Z
U
I
Electrometer
voltmeter
Figure 27: Measurement of electrical Impedance The impedance is calculated using ohm’s law:
Z = U/I
where Z, U and I are complex entities.
The voltage generated by the voltage source. The voltage is measured by means of a
voltmeter and the current is measured by an ammeter or electrometer which acts as a
39

current to voltage converter. The analogue signals are then converted to digital samples
of the signal that are used in subsequent calculations.
Insulation diagnostic is based on material characterization and therefore material models
are often used. To be able to define material parameters from measured impedance Z the
geometry of the sample, described in terms of the geometric capacitance C0, has to be
defined. In the picture bellow a vacuum capacitor of defined geometry is shown. Since no
material is between the electrodes the capacitance of a) is the geometrical capacitance.
Figure 28: Material parameter models based on a geometrical capacitance C0 and material
parameter.
In picture above b) and c) a material is inserted between the electrodes and it will
influence the current, I, flowing in the circuit. The influence of the material can be
described by different parameters using either a dielectric model or a conductive model.
In the dielectric model the “material capacitance”, the permittivity is a complex function
describing both the capacitance and the loss, whereas in the conductive model the
capacitance is described by a permittivity and the loss by a conductivity ( or resistivity).
The dielectric and resistive models are derived as follows:
1Zj Cω
=
0 ( )C C jε ε′ ′= − ′
40

Dielectric:
0
1Rej C Z
εω
⎧ ⎫′ = ⎨ ⎬
⎩ ⎭
kε ε′ ′Δ = + (k is an arbitrary constant)
0
1Imj C Z
εω
⎧ ⎫′′ = − ⎨ ⎬
⎩ ⎭
tan εδε′′
=′
Resistive:
0
1Rej C Z
εω
⎧ ⎫′ = ⎨ ⎬
⎩ ⎭
0
01Re
C
Z
ρε
=⎧ ⎫⎨ ⎬⎩ ⎭
1σρ
=
41

9.1.1.3 Dielectric Response in Frequency Domain We assume here that the dielectric material is linear, homogeneous and isotropic. The material will then follow the Ampere’s Law. The current density J(t) through a dielectric material with an electric field E(t) in time domain can be expressed as:
20
0
( ) ( ) (1 ) ( ) ( ) ( ) ( / )t
eJ t E t E t f E t d A mt
σ ε χ τ τ τ⎧ ⎫∂
= + + + −⎨ ⎬∂ ⎩ ⎭∫ (12)
The Ampere’s Law in time domain can be written as :
2( / )DH E A mt
σ ∂∇× = +
∂ (13)
If now only time-harmonic electric fields are considered the Fourier transform is applicable. The Fourier transformed Ampere’s Law can be written as
2ˆ ˆ( ) ( )..( / )H E i D A mσ ω ω ω∇× = + (14) The electric polarization in time domain is expressed as
(15) 20 0 0
0
( ) ( ) ( ) ( ) ( ) ( ) ..( / )e eP t E t P t E t f E t d C mε χ ε χ ε τ τ τ∞
= + Δ = + −∫ If the separation of electric polarization in rapid and slow processes is done, the Fourier transformed electric polarization can be expressed as
( ) 20 0 0
ˆ ˆˆ ˆ ˆ ˆ( ) ( ) ( ) ( ) ( ) ( )..( / )e eP E f E f E Cω ε χ ω ε ω ω ε χ ω ω= + = + m (16) Now the dimensionless frequency- dependent electric susceptibility ( )χ ω can be defined as
(17) ( ) ( )0
ˆˆ ˆ ˆ( ) ( ) ( ) i ti f f t e ωχ ω χ ω χ ω ω∞
−′ ′′= − = = ∫ dt
Now the total current density, ( )J ω of a dielectric material under harmonic
excitation, ( )E ω can be expressed according to Ampere’s law as:
42

( ) ( ) ( ) ( ) ( )( ){ } ( )
( ) ( ) ( ) ( )
0
20
0
ˆ ˆ ˆ ˆˆ ˆ1
ˆˆ ˆ1 ..
e
e
J E i D i i E
i i E A m/
ω σ ω ω ω σ ωε χ χ ω χ ω ω
σωε χ χ ω χ ω ωωε
′ ′′= + = + + + −
⎧ ⎫⎛ ⎞⎪ ⎪′ ′′= + + − +⎨ ⎬⎜ ⎟⎪ ⎪⎝ ⎠⎩ ⎭
(18)
From this expression it is seen that there is one part of the current ( )J ω which is in
phase and one part which is 900 before the driving harmonic electric field ( )E ω . The part of the current which is in phase with driving field in associated with the energy losses in the dielectric material. Two types of energy losses are seen in the material. The first type, which is due to the conduction (free charge) in the material, gives rise to ohmic losses. The second type, which is due to electric polarisation in the material, gives rise to what is called dielectric losses. Dielectric losses occur due to the inertia of the bound charges when they are accelerated in the driving field. The part of the current which is 900 before the driving field, displacement current, is associated with the capacitance of the material. In many situations it is more convenient to talk about the complex permittivity which is defined as follows:
( ) ( ) ( ){ } ( )( ) (
( )
)
( )0
0
ˆ ˆ1ˆ ˆˆ ˆ
ˆ ˆ
e
J i i Eε ω χ χ
ω ωε ε ω ε ω ω σω
ε ω χε ω
′ ′= + +′ ′′= − ⇒
′′ ′′= + ω (19)
It is seen from the equation above that the conductivityσ , the relative permittivity rε and the electric susceptibility ( )χ ω characterises the behaviour of the dielectric material under harmonic excitation. This equation shows that it is possible in frequency domain to make measurements which characterise the material.
43

44
9.2 Appendix B: List of Figures
Figure 1: Water absorption in epoxy with mineral fillers. Sample thickness of 5.3 μm [7] .............................................................................................................................................. 9 Figure 2: “Dog bone” shaped Epoxy sample.................................................................... 10 Figure 3: Disc epoxy samples .......................................................................................... 10 Figure 4 : Rogowski samples for breakdown. .................................................................. 10 Figure 5: Epoxy samples casted in machine. With silver painted electrodes. .................. 12 Figure 6: Epoxy samples manually casted. With aluminium foil as electrode. ................ 12 Figure 7: IDAX 206 .......................................................................................................... 13 Figure 8: Mettler Toledo AT250....................................................................................... 14 Figure 9: DSC822 ............................................................................................................. 15 Figure 10: LR 5K.............................................................................................................. 16 Figure 11: Dielectric losses for sample with two different types of electrodes................ 18 Figure 12: Water absorption Graph .................................................................................. 20 Figure 13: Desorption Graph ............................................................................................ 22 Figure 14: DSC of dry unaged sample.............................................................................. 23 Figure 15: DSC of Wet aged sample ................................................................................ 24 Figure 16: DSC of aged dried sample............................................................................... 24 Figure 17: Dielectric response of unaged, wet aged and aged dried samples................... 26 Figure 18: Relative permittivity of unaged and wet aged sample. ................................... 27 Figure 19: Stress – Strain Curve for Unaged sample........................................................ 28 Figure 20: Stress – Strain curve for wet aged sample....................................................... 29 Figure 21: Stress – Strain Curve for the Aged dried samples........................................... 30 Figure 22: Unaged sample for breakdown........................................................................ 32 Figure 23: Aged wet sample for breakdown..................................................................... 33 Figure 24: Aged dried sample for breakdown. ................................................................. 33 Figure 26: Illustration of change of moisture content with square root of time. The initial rate of change is almost constant. ..................................................................................... 38 Figure 27: Measurement of electrical Impedance............................................................. 39 Figure 28: Material parameter models based on a geometrical capacitance C0 and material parameter........................................................................................................................... 40

45
9.3 Appendix C: List of Tables
Table 1: Diffusion Coefficient .......................................................................................... 20 Table 2: Desorption coefficient ........................................................................................ 22 Table 3: Glass transition Temperatures. ........................................................................... 25 Table 4: Mechanical test data of Unaged, aged wet and aged dried samples. .................. 31 Table 5: Breakdown strength of Unaged samples ............................................................ 31 Table 6: Breakdown Strength of Aged wet sample .......................................................... 32 Table 7: Breakdown Strength of aged dried samples ....................................................... 33

46
10 Bibliography: [1] Epoxy Chemistry for Electrical Insulation. by Donald A. Bolon, Consultant, Charlton,
NY
[2]Dielectric Properties of Aged Epoxy at high Temperatures and Pressures in Humid Environment, Masters Thesis. Ole Martin Solås. [2] Condensation of Water Vapour in XLPE Insulation t Different Colling Rates and Pressure. Ø.L. Hestad and Sverre Hvidsten, Conference Record of the 2006 IEEE International Symposium on Electrical Insulation [3] Water Sorption and Diffusion Studies in an Epoxy Resin System, C. Maggana and P. Plisses. [4] Dielectric Properties of machine Insulation studied with Dielectric Response. Andre Helgeson [5] Combines effects of humidity and thermal stress on the dielectric properties of epoxy-silica composites, P. Gonon, A. Sylvestre, J. Teysseyre, C. Prior [6] Effects of Hydrothermal Aging on the Dielectric Properties of Epoxy Composites, P. Gonon, S. Bourdelais, O. Lesaint, T. Pham Hong, P. Guuinic, H. Debruyne. [7] Influence of Flexibilizers and Dissolved Water on the Dielectric Properties of Epoxy Resins, Jarle Sletbak and Nils G Gjelsten, Sixth International Symposium On High Voltage Engineering 1989. [8] Diffusion in Polymers, Crank Park. [9] Water absorption in polyaminosiloxane-epoxy thermosetting polymers, J. C. Cabanelas, S. G. Prolongo, B. Serrano, J. Bravo and J. Baselga . [10] Modelling of Fickian diffusion to enhance polymer-modified sensor performance, P. McLoughlin, K. Flavin, P. Kirwan, B. Murphy and K. Murphy. [12] Dielectric Properties of Aged Epoxy at high Temperatures and Pressures in Humid Environment, Masters Thesis. Ole Martin Solås. [11] IDAX-206 User Manual. [13] The effect of humidity and surface fictionalization on the dielectric properties of nanoconposites, Phd thesis of Chen Zou, University of Leicester.

47
[14] Water absorption and Desorption in an Epoxy Resin with Degradation, G. Z. Xiao, M.E.R Shanahan, Centre national de la Recherche Scientifique, Ecole Nationale Superieure des Mines de Paris. [15] High- humidity Deterioration and Internal Structure Change of Epoxy Resin for Electrical Insulation, T. Kumazawa , Chubu Electric Power Co. Japan and M. Oishi, Toray research center Inc., japan. [16] Filler treatment effects in the dielectric properties of a filled epoxy resin, J.P Adohi, C. Guillermin, P. Rain, S.W Rowe, Laboratorie d’Electrostatique et de Materiaux Dielectriques, CNRS-UJF, France. [17]Electrical and Mechanical Strength of Mineral Filled Epoxy Insulators in Correlation to Power Loss Factor, F. Gerdinand, M. Budde, M. Kurrat Institute for High Voltage Technology and Electric Power Systems, Technical University of Braunschweig, Germany.