wastewater reuse systems for idaho development projects - a case
TRANSCRIPT

Wastewater Reuse Systems for Idaho Development Projects
- A Case Study -
For:2007 Idaho Wastewater Reuse Conference
By:Carl Hipwell, P.E.Bob Pharmer P.E.
Kevin Wentland, P.E.

Purpose of Presentation
Discuss experience with planning, design and construction of Class A and Class B wastewater reuse systems for Idaho development projects.
EP
Idaho Developments


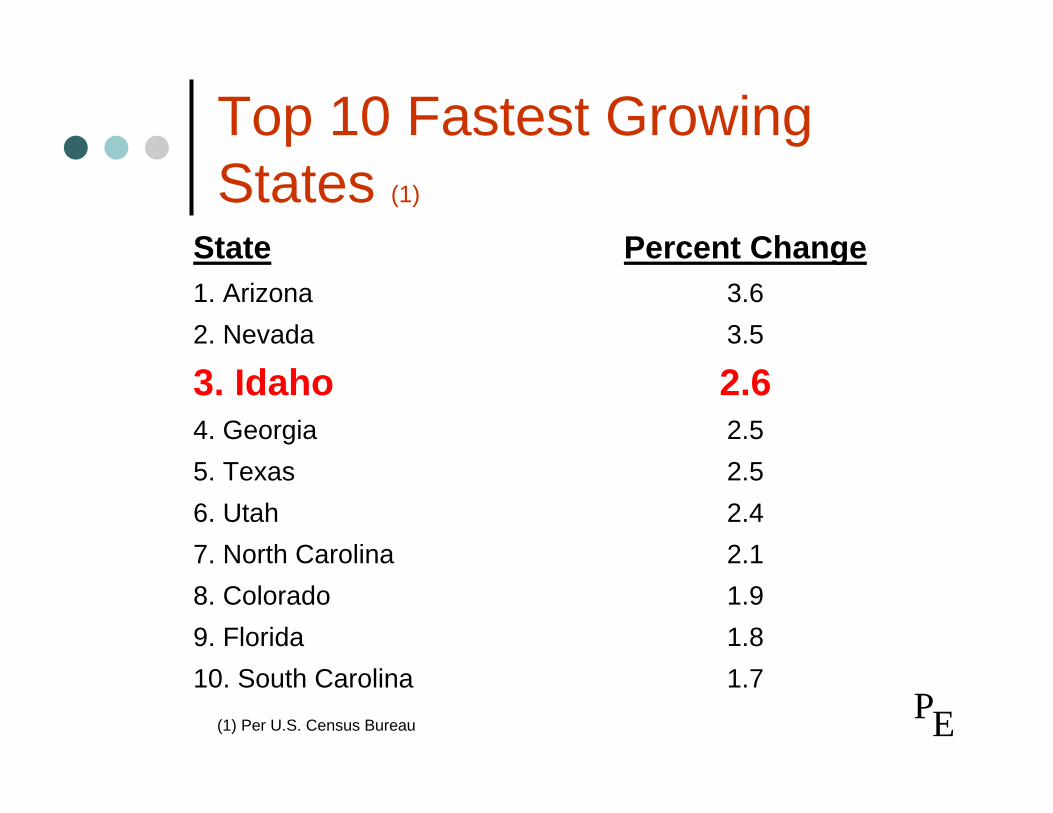
Top 10 Fastest Growing States (1)
1.710. South Carolina1.89. Florida1.98. Colorado2.17. North Carolina2.46. Utah2.55. Texas2.54. Georgia2.6 3. Idaho3.52. Nevada3.61. Arizona
Percent ChangeState
(1) Per U.S. Census Bureau EP

Common ScenarioDevelopment of a new community outside of “metro” area of impact, intended to provide a “country” or “relaxed” lifestyle settingTreatment plant service size
Avimor - 3,300 HomesSouthFork Landing - 630 HomesHidden Springs - 1,525 homes
Development needs stand-alone utilities including water and wastewater systems to support project
EP

Wastewater Issues Important to Developers
Initial capital costScheduleProven technologySystem reliabilityReuse potentialEase of implementation Ability to meet environmental requirements Ease of operationOdor and noiseFootprint
EP

Capital CostsInitial capital costs need to be kept in line with lot sales
Reduce upfront costs for system by providing an expansion plan for new treatment facilities as new development phases are builtRequires multiple treatment trains to be built in phases
• Define minimum design flows per phase and how many treatment trains per phase
• How trains connect together in futureEP

Schedule Conflict
Work on treatment system is often delayed until approvals are obtained by County
But…Project needs to be planned, permitted and constructed in time to allow for sanitary restrictions to be lifted so that lots can be sold
EP

PlanningStudies Required
Facilities PlanPreliminary Engineering ReportReuse Permit
• Preliminary technical report• Reuse permit application• If Class A – Class A engineering report
NPDES Permit Application
EP

Planning Flows and loadsAllocate 300 gpd per residential
Avimor – Phase I 333,000 gpdSouthFork Landing - Phase I 67,000 gpd
If historical data supports a reduction in the unit flow rate reduced unit volumes may be approved
Hidden Springs Phase II - 275,000 gpd (Hidden Springs @ 180 gpd/residence)
Ten States Standards unit loading values used for determination of wastewater loading
EP
Planning
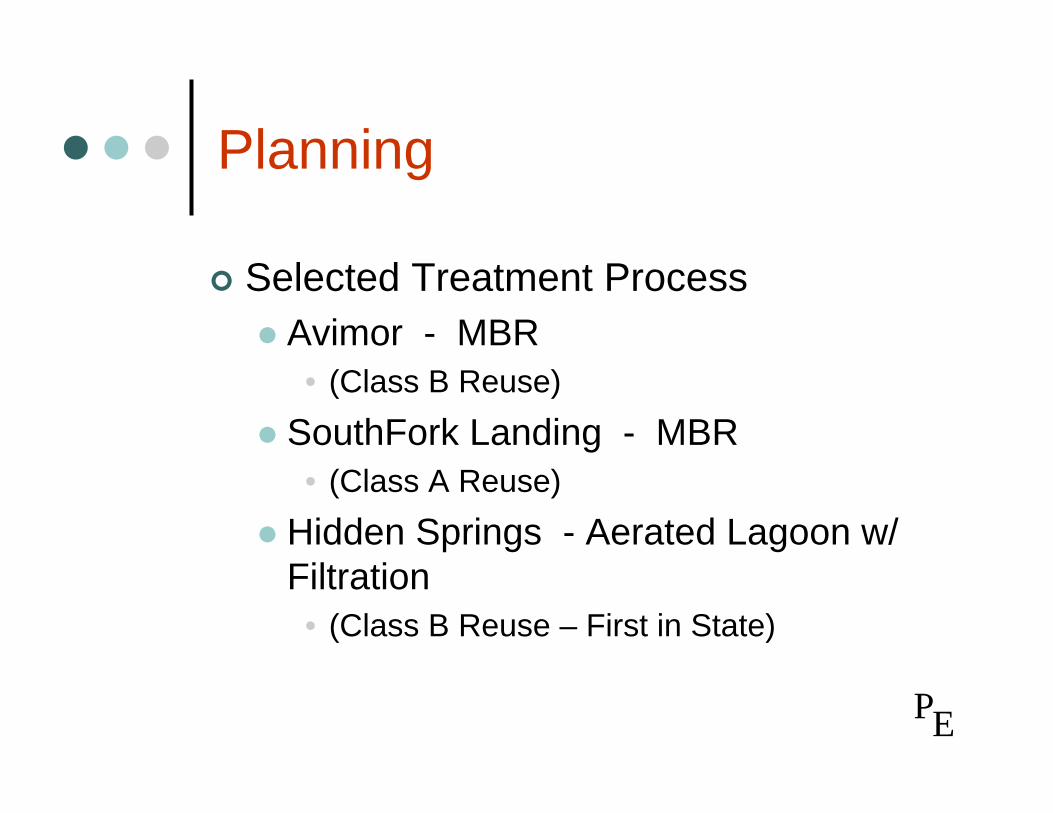
Selected Treatment ProcessAvimor - MBR
• (Class B Reuse)SouthFork Landing - MBR
• (Class A Reuse)Hidden Springs - Aerated Lagoon w/ Filtration
• (Class B Reuse – First in State)
EP
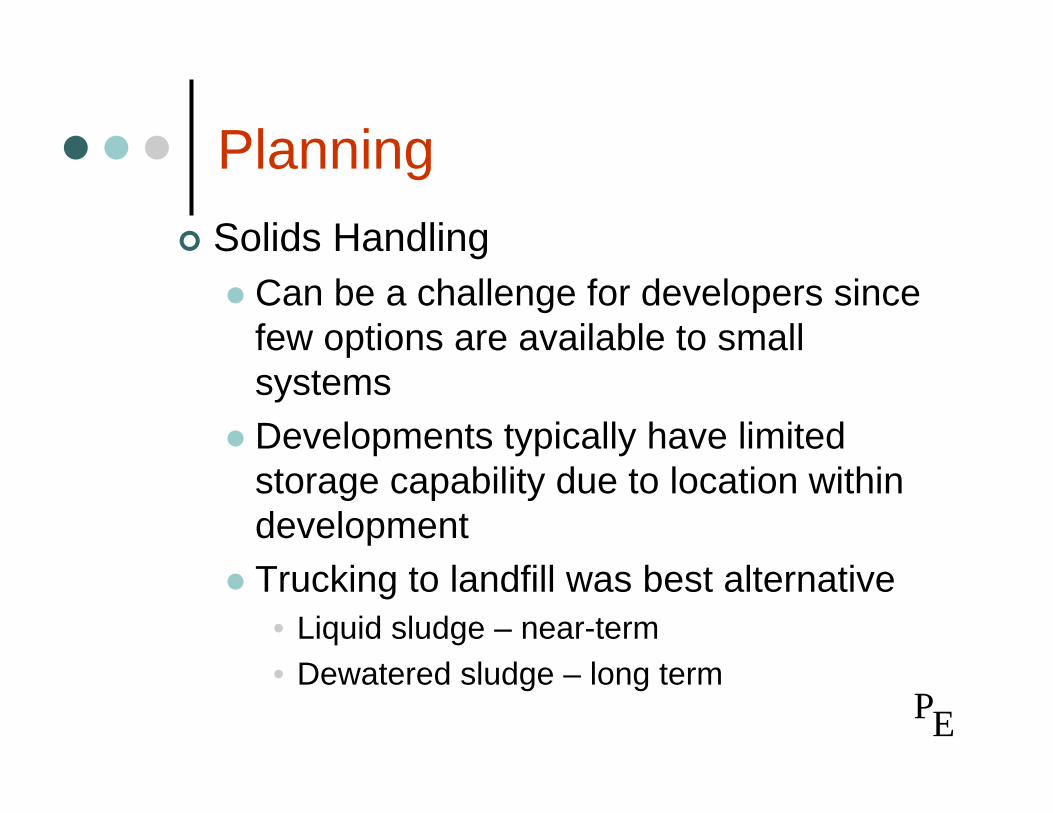
Planning Solids Handling
Can be a challenge for developers since few options are available to small systemsDevelopments typically have limited storage capability due to location within developmentTrucking to landfill was best alternative
• Liquid sludge – near-term• Dewatered sludge – long term
EP
Planning
WWTF OperationsContract operations• Numerous “local” operations groups are
forming to meet demand
Options for effluent disposal:NPDES Permit Reuse/recharge
EP

NPDES
Receiving streams can provide long-term or winter time option for effluent disposal
Avimor – Spring Valley Creek – Dry Creek – Boise RiverSouthFork Landing – South Fork of Payette River
Timing for NPDES permitting typically does not meet requirements of project schedule
Requires dual reuse/disposal plan utilizing initial reuse and then phase into direct discharge at least during winter months
Region X will take >24 month turn-around on NPDES permitsStatus of TMDL for watershed will be a critical issue for NPDES
EP
Effluent Reuse
Idaho Reuse RulesRevised 02/27/07Few Class A or Class B reuse permits have been issued under new reg’s
Provides five categories for effluent disposalClass A and B are most common for municipal reuseClass A carries a high price “tag” for additional facilities to satisfy redundancy requirements of the regulationsClass B provides very high quality reuse water and often meets reuse objectives EP
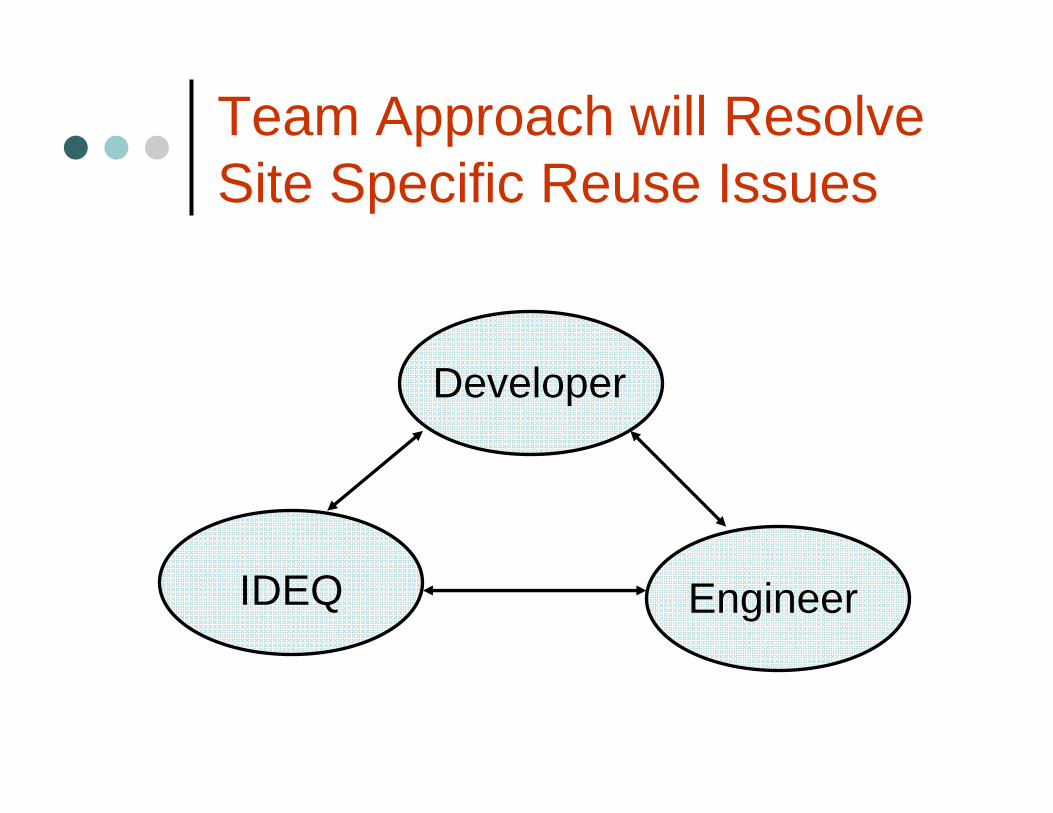
Team Approach will Resolve Site Specific Reuse Issues
IDEQ Engineer
Developer
Effluent Reuse Reuse rules will dictate the level of treatment required for BOD/TSS and disinfection
Class A adds redundancy to the system• For South Fork Landing has a redundant
treatment train and 7-day holding pond was designed into system
Nitrogen will be driven by impacts on groundwater < 10 mg/l TN for recharge systemsPhosphorus will be set by TMDL depending on the connection between groundwater and surface waters
EP

Wastewater Disposal ScenariosSummer (April 1 – Nov. 1)
Avimor, South Fork Landing and Hidden Springs• Landscape irrigation
• Parks• Ball fields• Common areas
• Buffer zone requirements need to be identified early in planning process
Winter (Nov 1 - March 31)Hidden Springs
• StorageAvimor and South Fork Landing
• Groundwater recharge through rapid Infiltration• Future NDPES discharge
EP
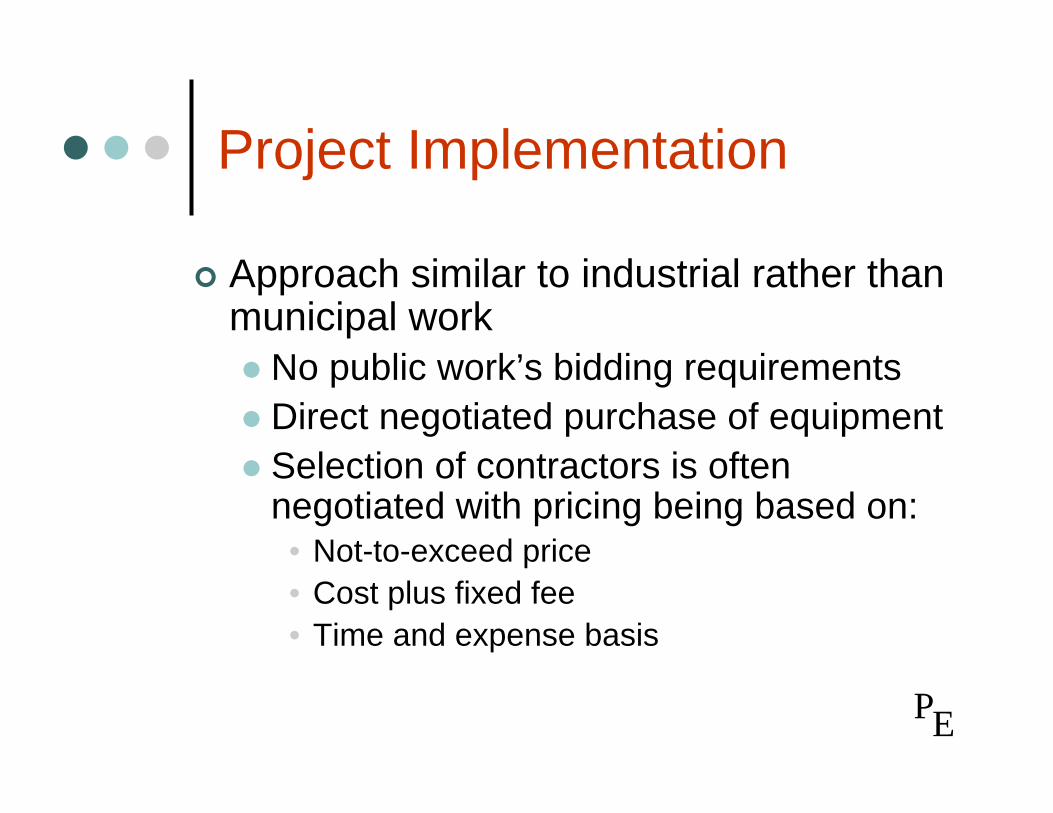
Project Implementation
Approach similar to industrial rather than municipal work
No public work’s bidding requirementsDirect negotiated purchase of equipmentSelection of contractors is often negotiated with pricing being based on:
• Not-to-exceed price• Cost plus fixed fee• Time and expense basis
EP

Design/Build
Avimor and SFL – Design Build ProjectsAttractive to developers
• Contractor takes lead role in project with support from engineers
• Developers are familiar dealing with contractors
• Single point of responsibility• Often combines wastewater, water systems
and other site utilities under one contract
EP

Case Study No. 1Avimor
EP

Avimor Planned Community
Kevin Wentland, P.E.Project Introduction
What is AvimorWastewater & Reuse at Avimor• Long term & short termExperiences Status
EP

Avimor Planned Community
Spring Valley Ranch 32,000 acres10 miles north of Eagle, IdahoAda, Boise, and Gem countiesElevation ranges between 3150 and 3520 Residential, commercial, and institutional property will cover 9,200 acres of the development.

Avimor Location
EP
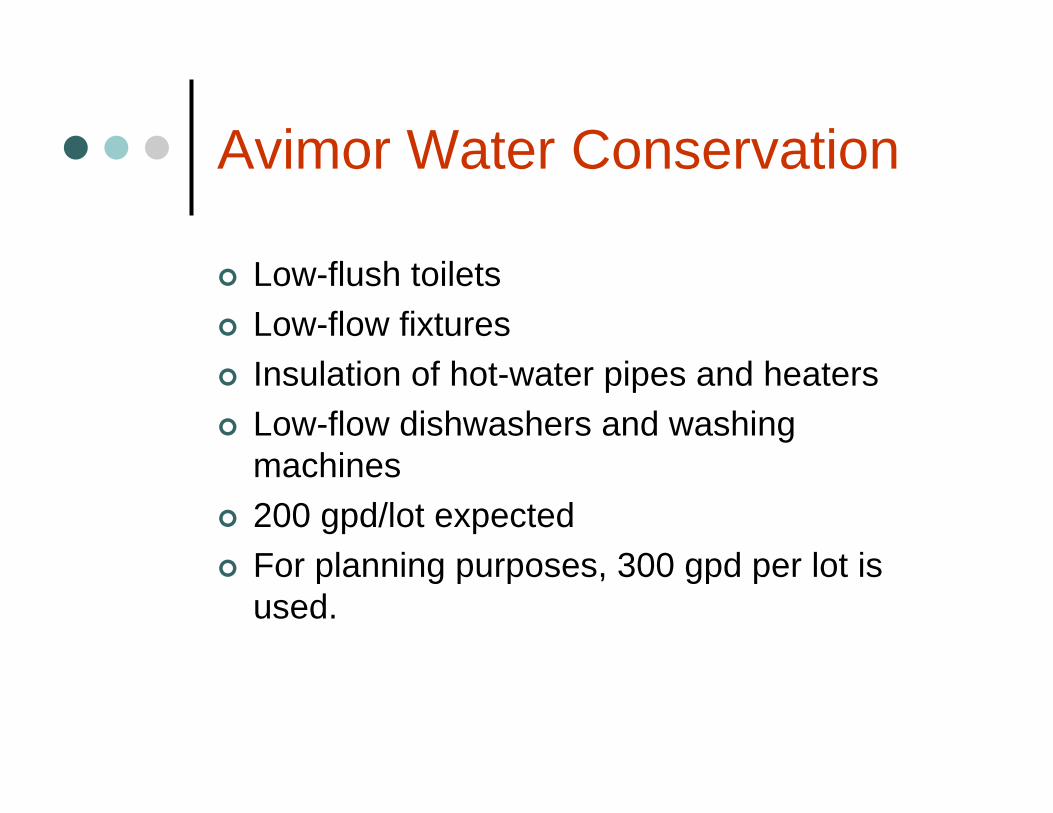
Avimor Water Conservation
Low-flush toiletsLow-flow fixturesInsulation of hot-water pipes and heatersLow-flow dishwashers and washing machines200 gpd/lot expected For planning purposes, 300 gpd per lot is used.

AWRF Overview
Class B Facility0.33 mgd facility expandable to 1.0 mgd in three equal phasesDraft Reuse Permit open for commentTreatment system is activated sludge with membranesDesigned for removal of BOD, TSS, TN, TP (chemical precip)Solids handling

AWRF Requirements
Master PlanPreliminary Engineering ReportDesign Plans and SpecsReuse PermitNPDES Permit

AWRF Schedule
Master Planning, PER - 6 monthsPlans & Specs – 4 ½ monthsReview & Revisions – 3 monthsReuse Permit – year to draft permitConstruction – 1 year

AWRF Design Loading & Flows
1.16Peak hour
0.66Peak daily
0.33Average daily
Flow (mgd)
Flows
0.0294Total nitrogen (TN)
0.0059Total phosphorus (TP)
0.1900Total suspended solids (TSS)
0.1700Biochemical oxygen demand, 5-day (BOD5)
Loading (lbs/person)Parameter
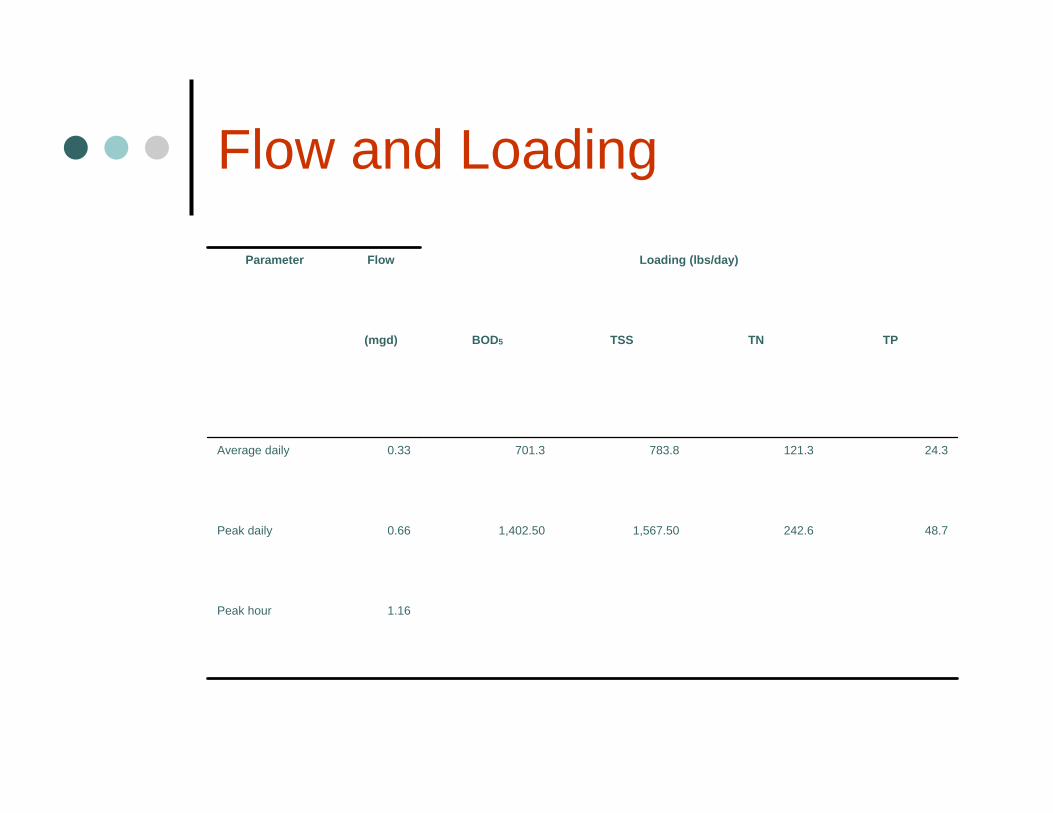
Flow and Loading
1.16Peak hour
48.7242.61,567.501,402.500.66Peak daily
24.3121.3783.8701.30.33Average daily
TPTNTSSBOD5(mgd)
Loading (lbs/day)FlowParameter
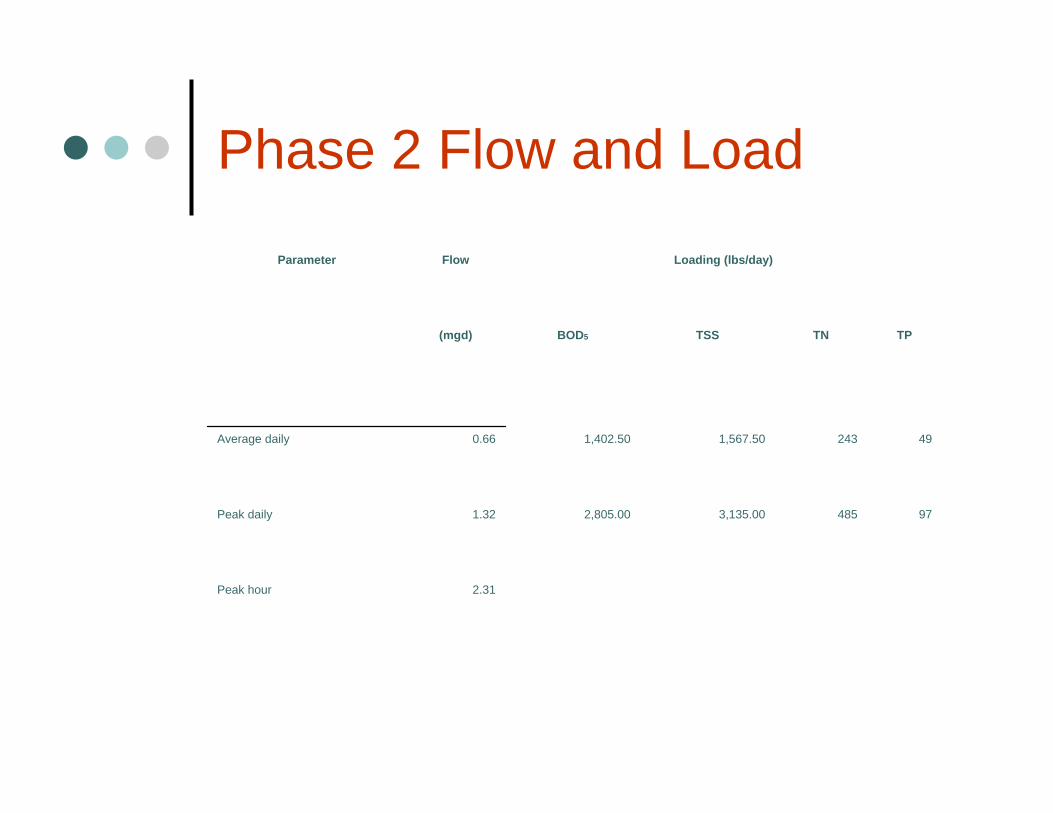
Phase 2 Flow and Load
2.31Peak hour
974853,135.002,805.001.32Peak daily
492431,567.501,402.500.66Average daily
TPTNTSSBOD5(mgd)
Loading (lbs/day)FlowParameter
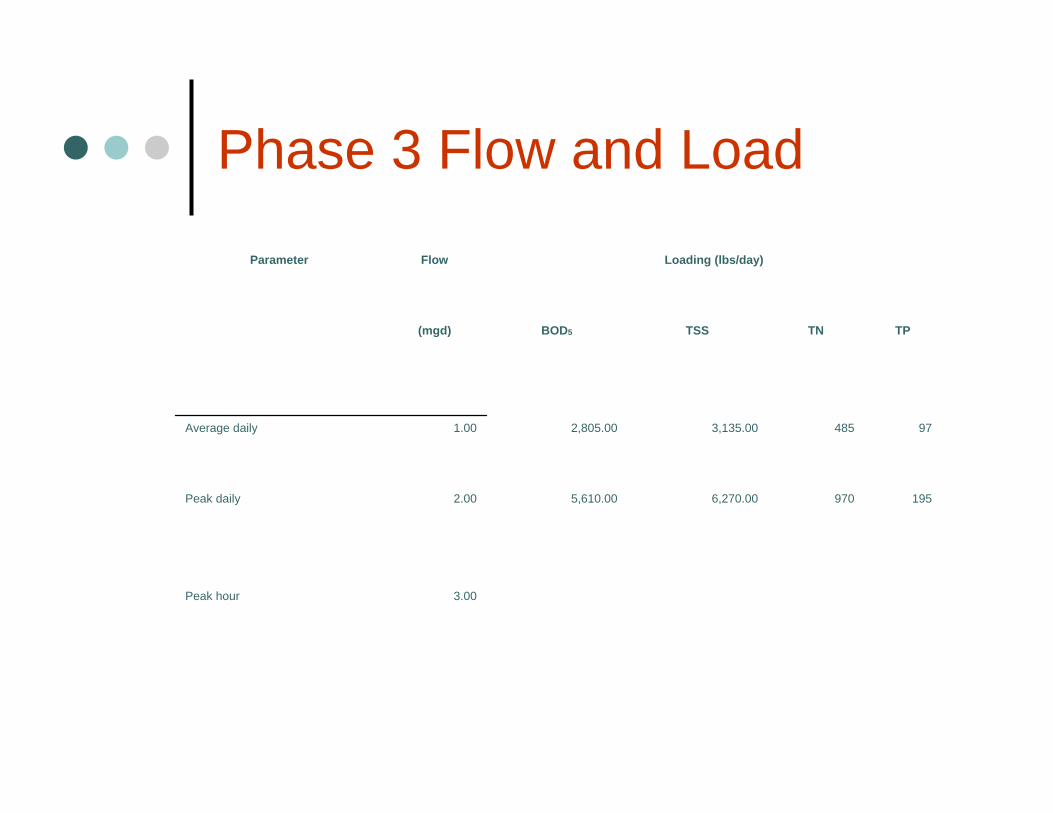
Phase 3 Flow and Load
3.00Peak hour
1959706,270.005,610.002.00Peak daily
974853,135.002,805.001.00Average daily
TPTNTSSBOD5(mgd)
Loading (lbs/day)FlowParameter

Effluent Design Criteria
BOD & TSS < 5.0 mg/lTP < 0.1 mg/lTN < 8.0 mg/lTurbidity < 2.0 NTU

AWRF Components
Lift Station1.0 mgd – ultimate capacity
HeadworksFine screening
• Structural for ultimate capacity• Mechanical equipment for 1st Phase• Screenings to landfill
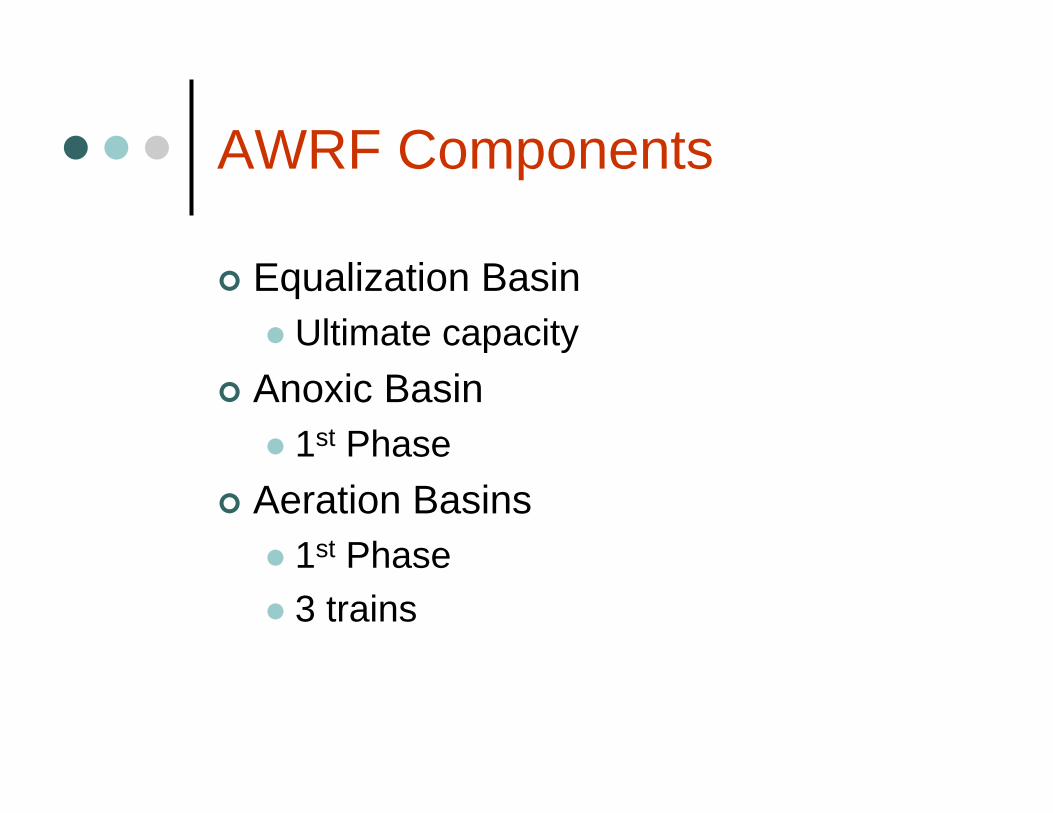
AWRF Components
Equalization BasinUltimate capacity
Anoxic Basin1st Phase
Aeration Basins1st Phase3 trains

AWRF Components
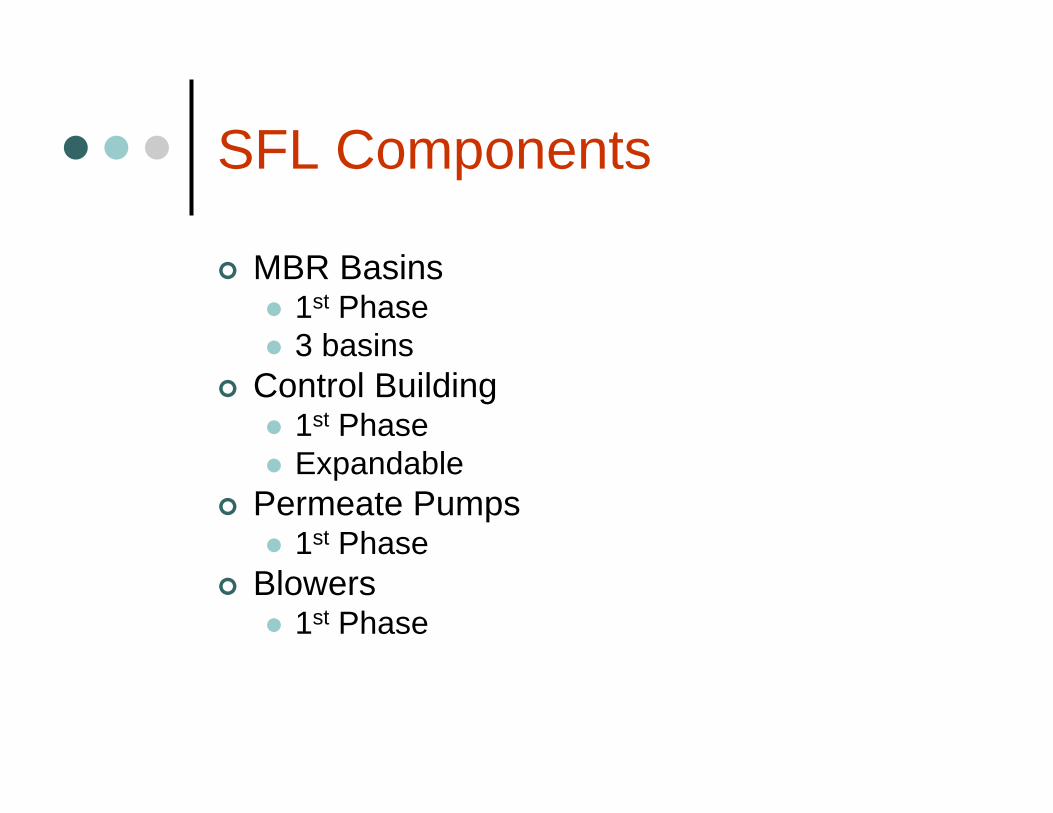
MBR Basins1st Phase3 basins
Control BuildingUltimate capacity
Permeate Pumps1st Phase
Blowers1st Phase

AWRF Components
WAS PumpsUltimate capacity
Sludge StorageUltimate capacity
Solids handlingGBTPress added at future phase

AWRF Components
Disinfection with ChlorineUltimate capacity
Reuse PumpingUltimate capacity
Electrical1st Phase Room for expansion

AWRF P&ID
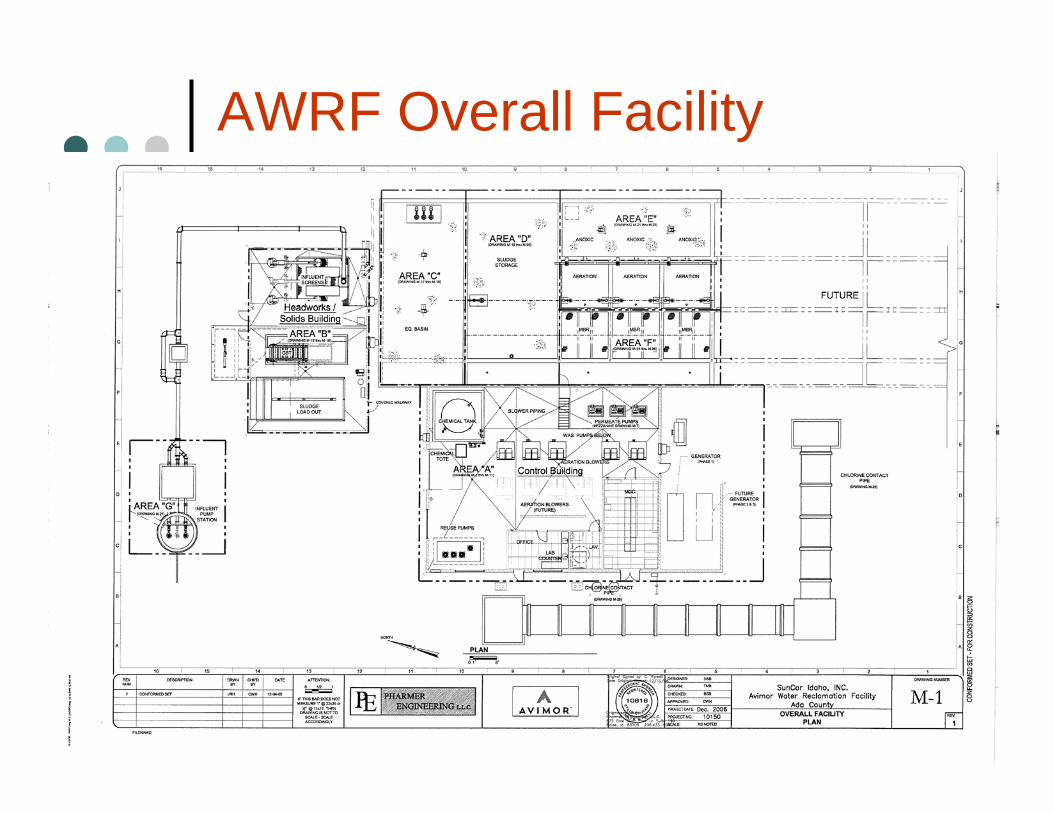
AWRF Overall Facility


Reuse Effluent
• Irrigation of landscaping with overflow to RI (March – November)
• Winter effluent will all go to RI• Ag areas as backup
EP

IDEQ Draft Reuse Permit
May 30th, 2007 Draft Permit• RI Site • Ag Areas
Adding details as requested for use for irrigation

Reuse Permit Limits
Class B Water Quality RequirementsNitrogen
Minimal Impacts to GWPhosphorus
TMDL basedNPDES permit – as required to discharge to Spring Valley Creek

Draft Permit Limits
Biochemical Oxygen Demand <5.0 mg/L GS, <5.0 mg/L NGSTotal Suspended Solids <5.0 mg/L GS, <5.0 mg/L NGSTotal Nitrogen <8.0 mg/L GS, <8.0 mg/L NGSTotal Phosphorous <8.0 mg/L (<0.1 mg/L for RI basin a, b) <0.1 mg/L bTurbidity 24 hour average of: <2.0 NTU , <2.0 NTU. With no instantaneous more than 5.0.Total Coliform <2.2 CFU/100mL of effluent <2.2 CFU/100mL of effluentChlorine Residual of 1.0 mg/l
a Treated effluent discharged to the RI basin during the growing season must be treated to 0.2 mg/L to ensure surface water protection, due to potential interconnectivity issues associated with the basin, ground water, and surface water.
b The phosphorous concentration presented in this table (i.e., <0.1 mg/L) represents the effluent reduction level designed for the wastewater treatment facility. Phosphorous limits for effluent discharged from AWRF to the RI basin will ultimately be required to conform to the final version of the Lower Boise River Phosphorous TMDL.

Reuse Irrigation Areas
Bike PathParksBall fieldAlong streetsCommon areas

Reuse Requirements
Nightime irrigationSigns at RI site and irrigation areas
“irrigated with reclaimed wastewater –do not drink”
Buffer distances

RI Site
Pierce Park Sand2-3 acres of 3-4 basins
0.3 acres needed based on soil classification
Currently performing field testing for infiltrationFenced & Signs
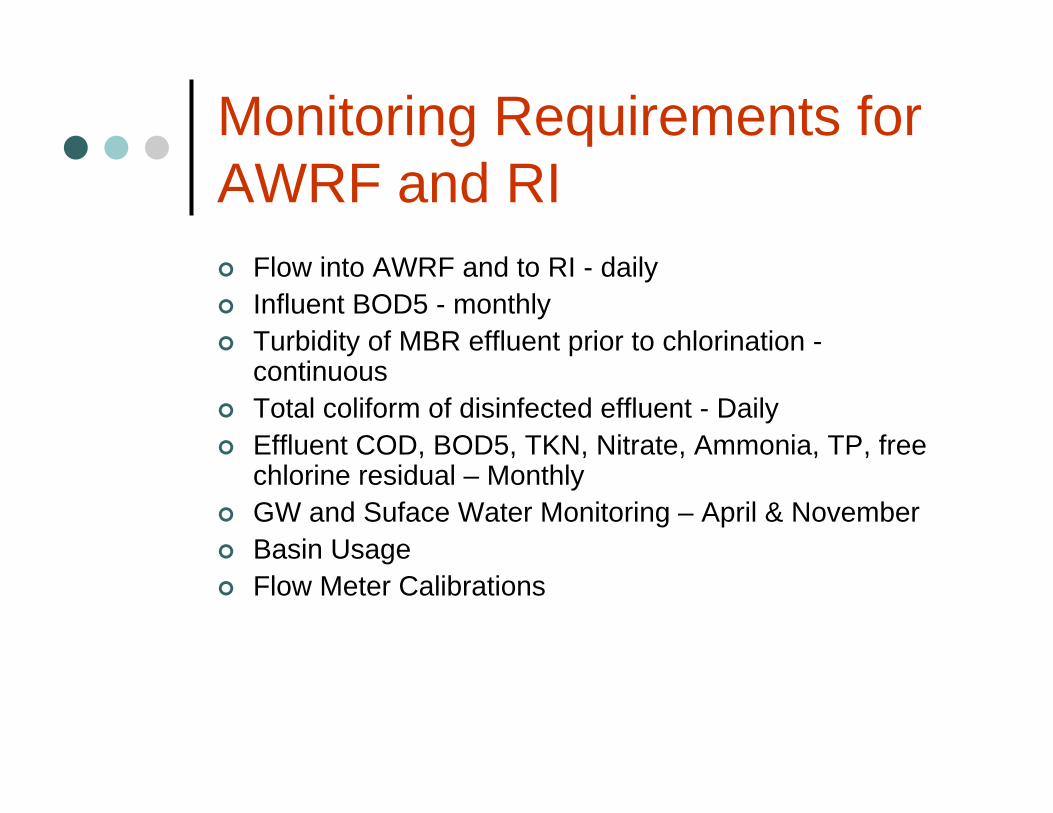
Monitoring Requirements for AWRF and RI
Flow into AWRF and to RI - dailyInfluent BOD5 - monthlyTurbidity of MBR effluent prior to chlorination -continuousTotal coliform of disinfected effluent - DailyEffluent COD, BOD5, TKN, Nitrate, Ammonia, TP, free chlorine residual – MonthlyGW and Suface Water Monitoring – April & NovemberBasin UsageFlow Meter Calibrations

Compliance Activities
O&M PlanPlans & Specs for RI Site
Engineering report for basis of designPlans for GW and Surface Water Monitoring SystemRunoff management planScaled site mapWaste solids management plan

Start-up and Operation
OMCS Assist with Start-upOperation of AWRF
• Includes collection system• RI system• Irrigation system• Ag areas

Avimor NPDES
Note: pH values shall be between 6.5 and 8. Winter temperature shall be 10 degrees C maximum.
B Applicable November 1 through March 31
A most probable number
< 0.15 mg/LTPB
< 5.0 mg/LNitrite + nitrate
< 1.0 mg/LAmmonia
< 200 MPNA/100 mlFecal coliform
< 3.0 mg/LTotal Kjeldahl nitrogen (TKN)
0.0 mg/LTotal residual chlorine
< 10.0 mg/LTSS
< 10.0 mg/LBOD
WinterParameter

Case Study No. 2South Fork Landing
EP
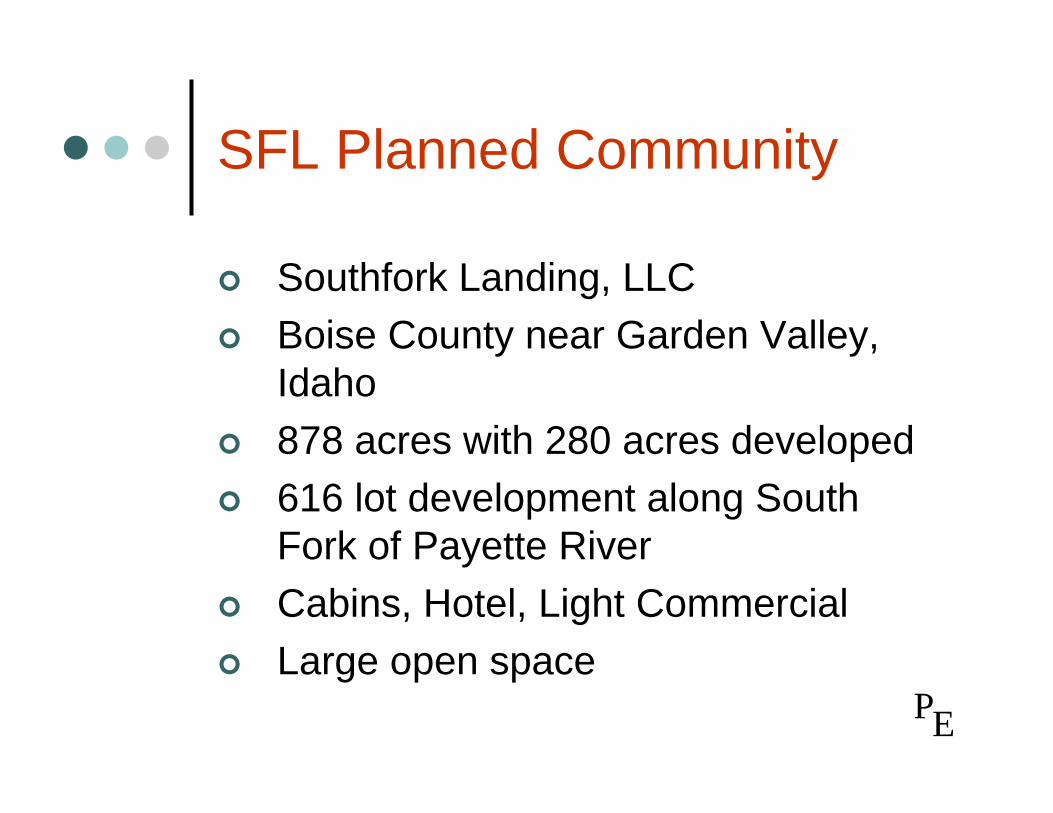
SFL Planned Community
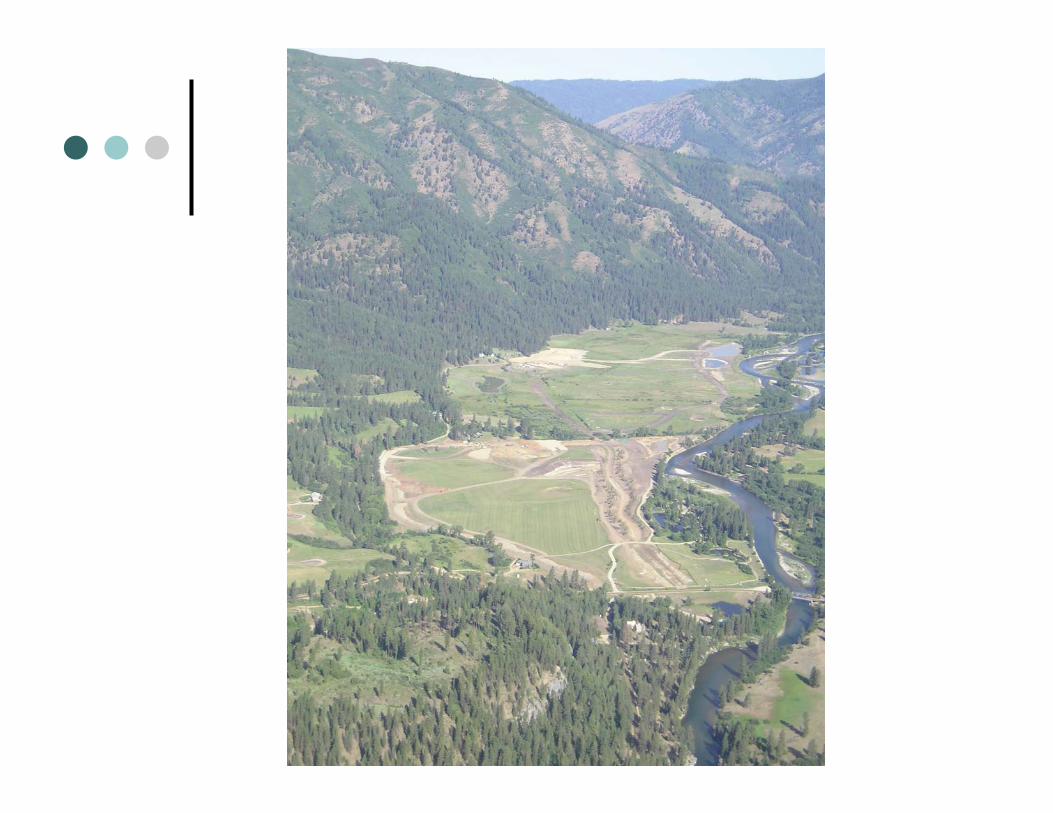
Southfork Landing, LLCBoise County near Garden Valley, Idaho878 acres with 280 acres developed616 lot development along South Fork of Payette RiverCabins, Hotel, Light CommercialLarge open space
EP
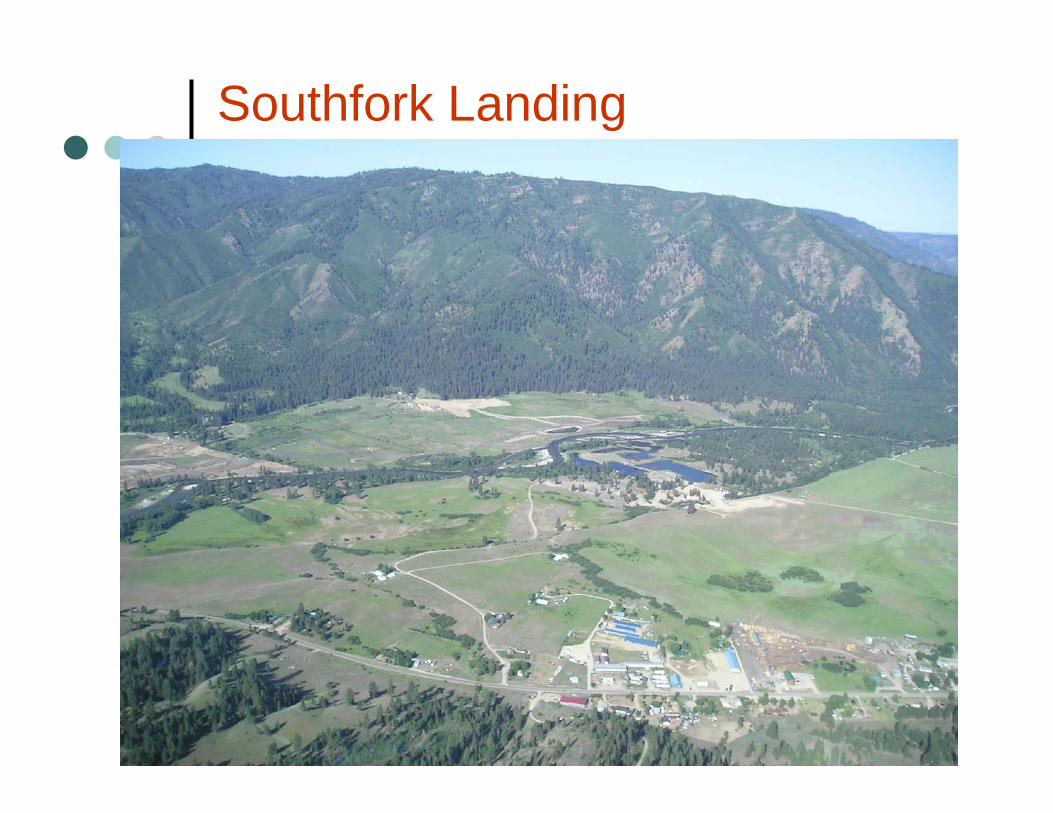
Southfork Landing
EP
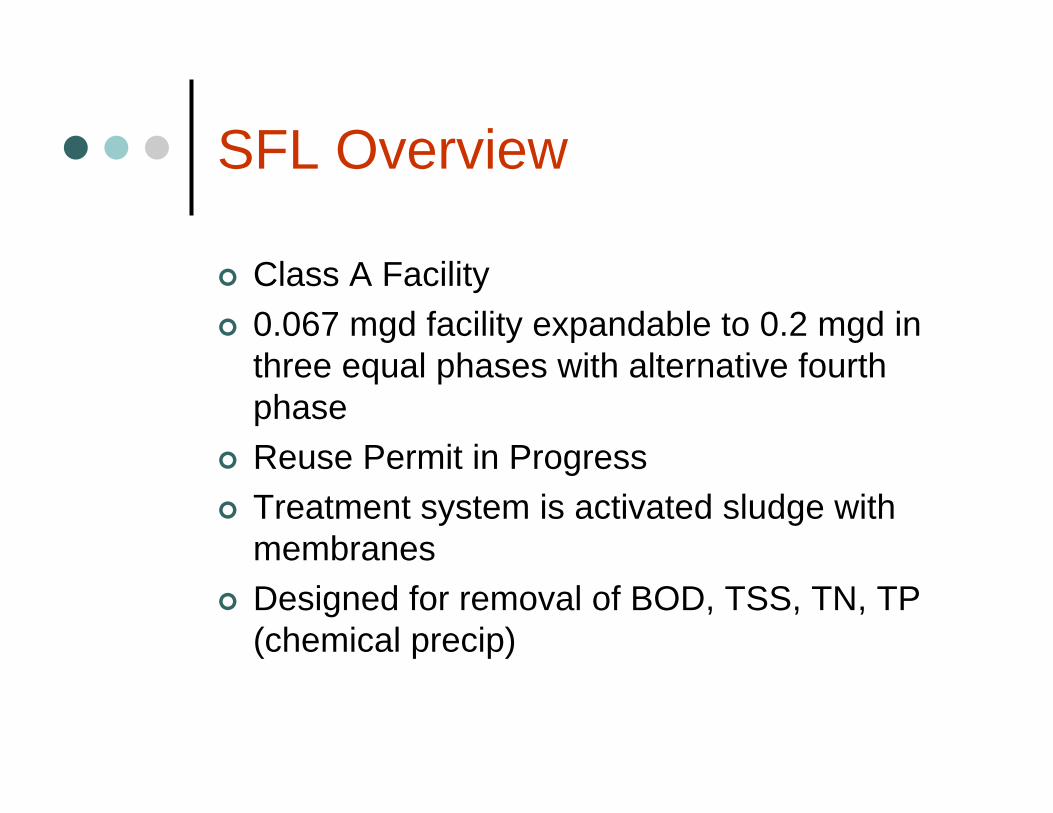
SFL Overview
Class A Facility0.067 mgd facility expandable to 0.2 mgd in three equal phases with alternative fourth phaseReuse Permit in ProgressTreatment system is activated sludge with membranesDesigned for removal of BOD, TSS, TN, TP (chemical precip)

Class A & B Differences
Mechanical RedundancyAdditional Train
7-Day PondOr alternative discharge
Buffer distances
Why Class A
Ground Water Recharge in Open BasinsProximity to Southfork of Payette River
SFL Requirements
Master PlanPreliminary Engineering ReportDesign Plans and SpecsReuse PermitNPDES Permit
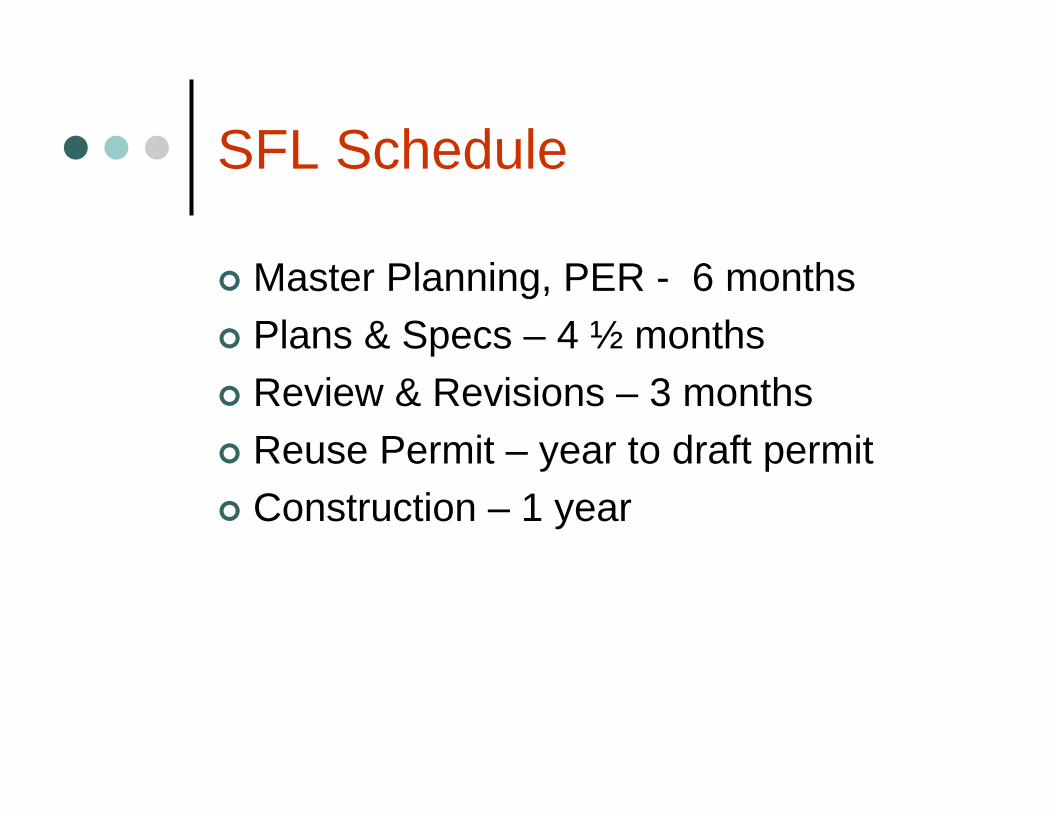
SFL Schedule
Master Planning, PER - 6 monthsPlans & Specs – 4 ½ monthsReview & Revisions – 3 monthsReuse Permit – year to draft permitConstruction – 1 year

SFL Design Layout
Ultimate capacity considerationsThree initial trains
More trains as needed during each expansionTrains set up for Class A mechanical redundancy requirements
7-day pond
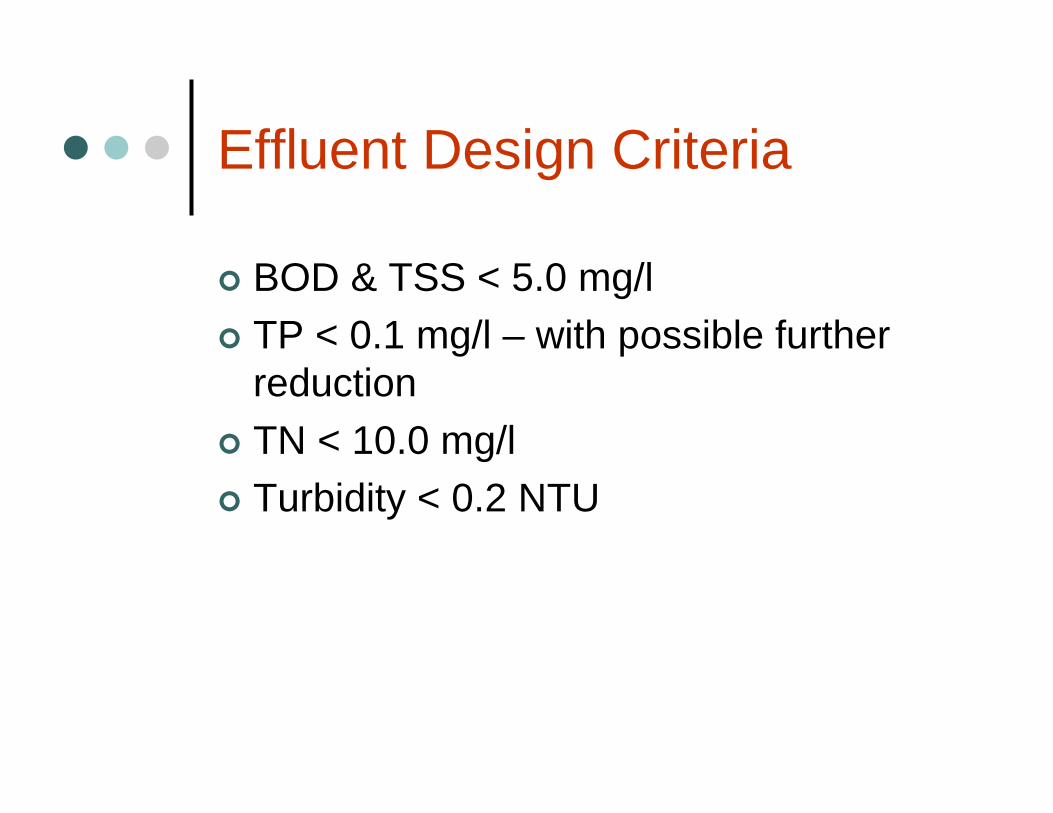
Effluent Design Criteria
BOD & TSS < 5.0 mg/lTP < 0.1 mg/l – with possible further reductionTN < 10.0 mg/lTurbidity < 0.2 NTU
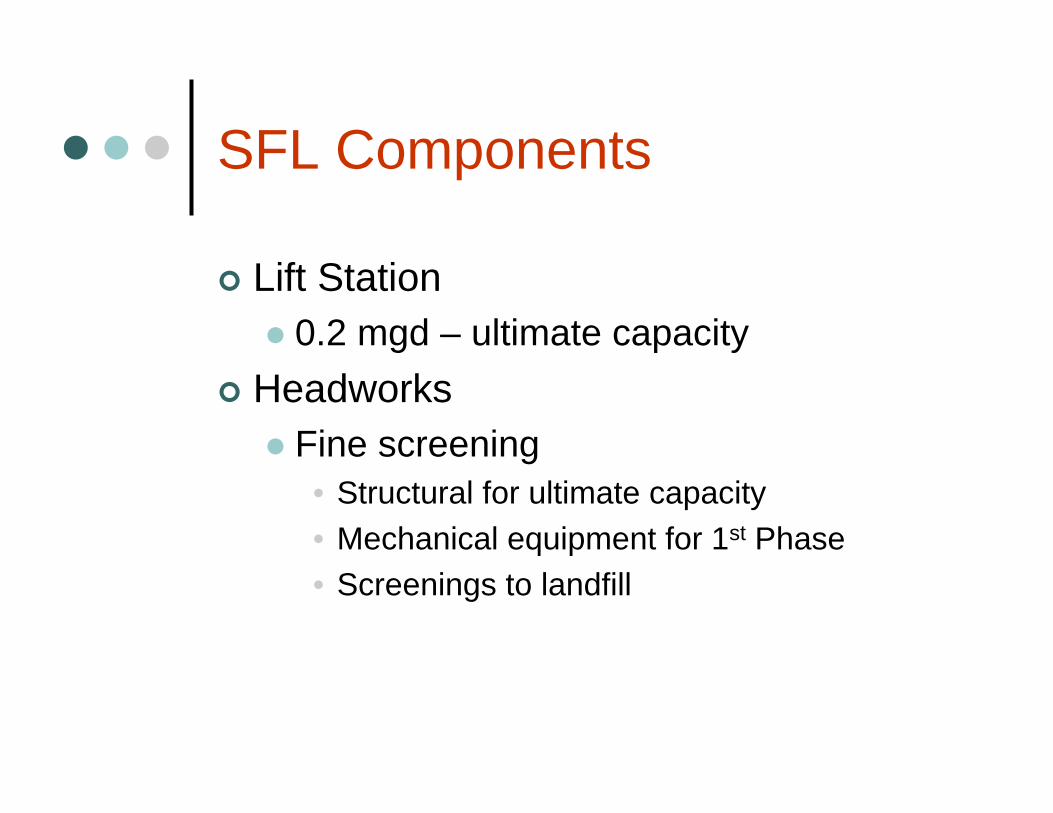
SFL Components
Lift Station0.2 mgd – ultimate capacity
HeadworksFine screening
• Structural for ultimate capacity• Mechanical equipment for 1st Phase• Screenings to landfill
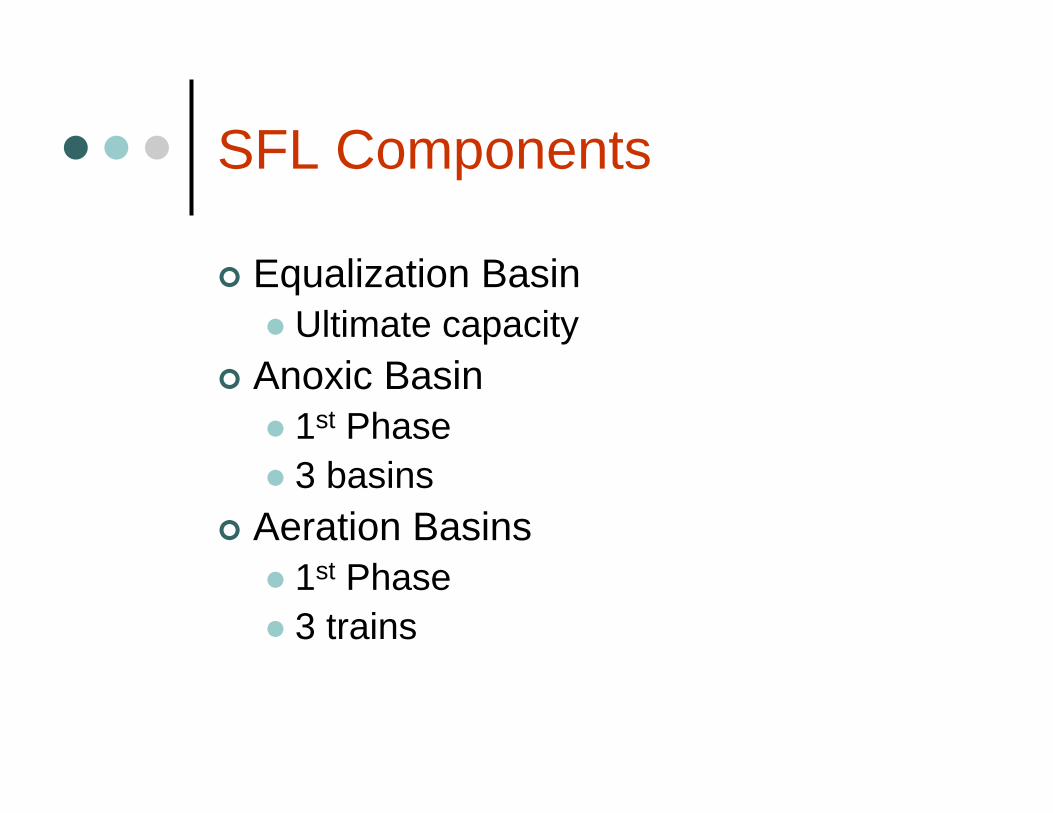
SFL Components
Equalization BasinUltimate capacity
Anoxic Basin1st Phase3 basins
Aeration Basins1st Phase3 trains
SFL Components
MBR Basins1st Phase3 basins
Control Building1st Phase Expandable
Permeate Pumps1st Phase
Blowers1st Phase

SFL Components
WAS PumpsUltimate capacity
Sludge StorageUltimate capacity
Solids handlingLater phase
SFL Components
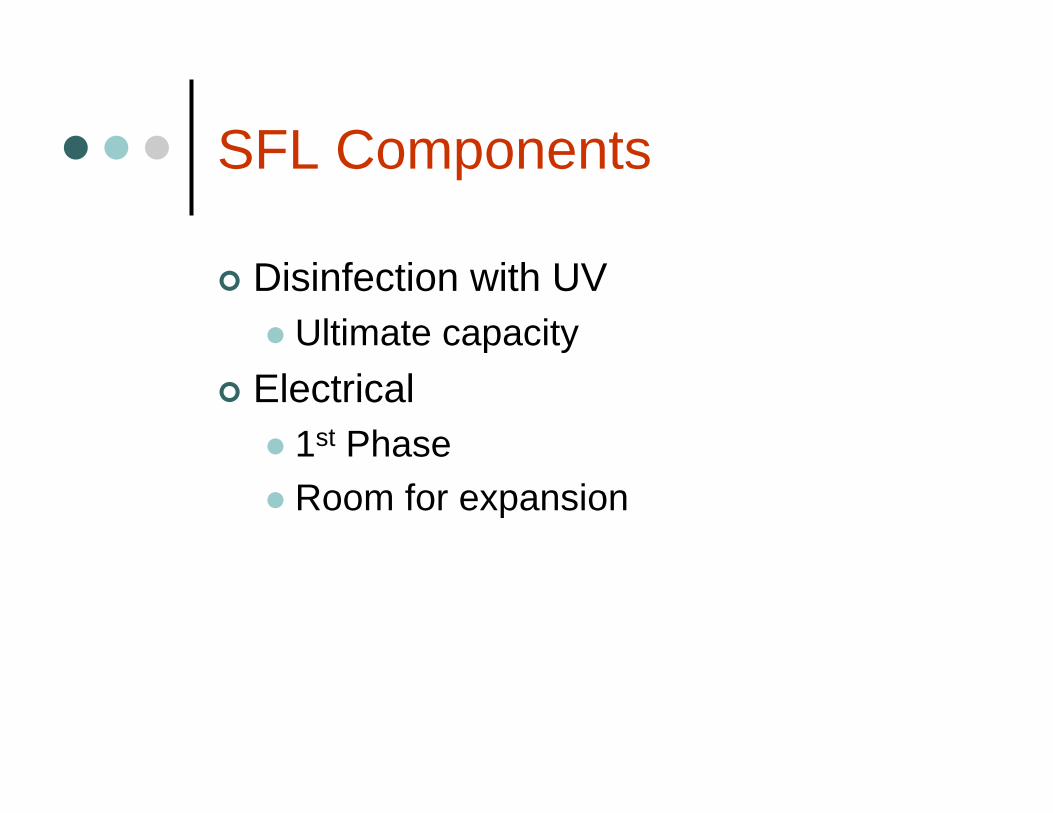
Disinfection with UVUltimate capacity
Electrical1st Phase Room for expansion
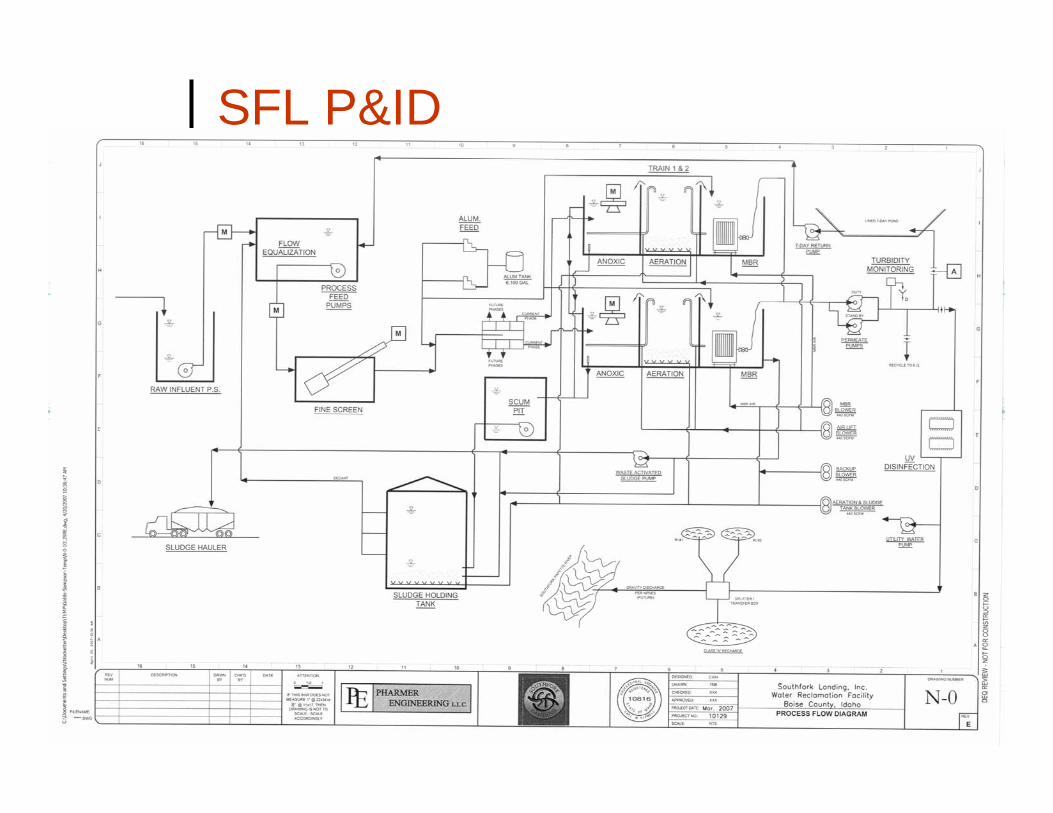
SFL P&ID

SFL Hydraulic Profile

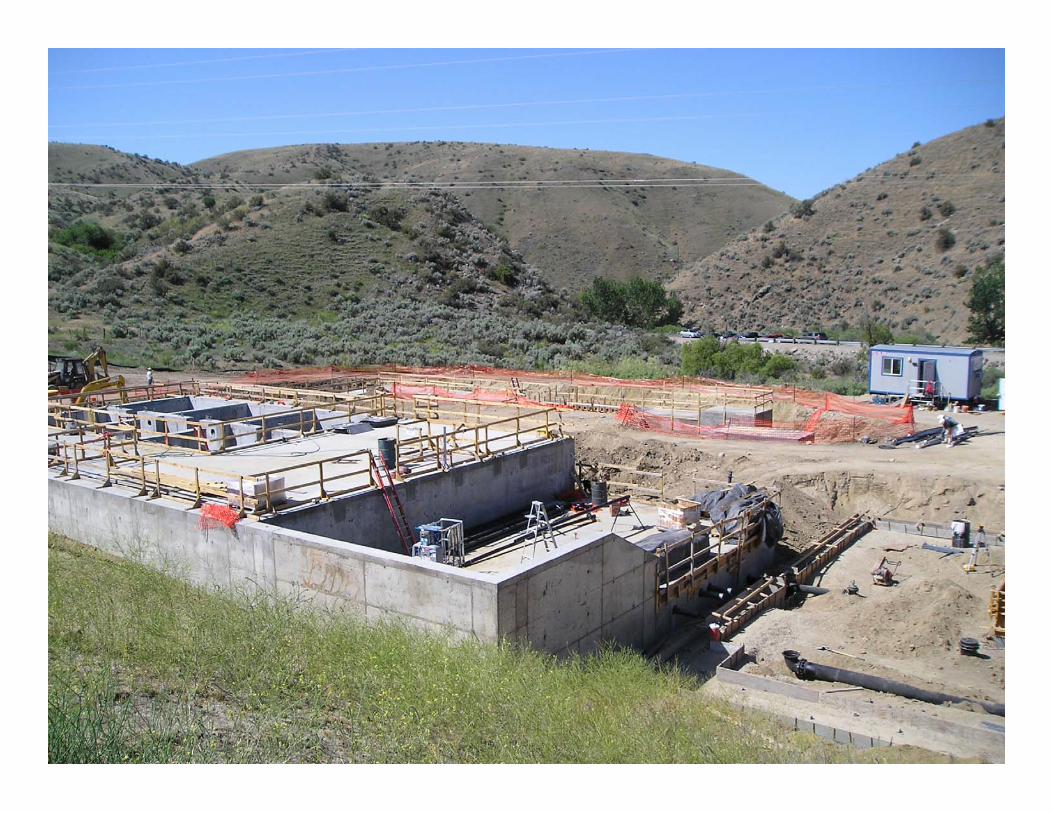
SFL Overall Facility
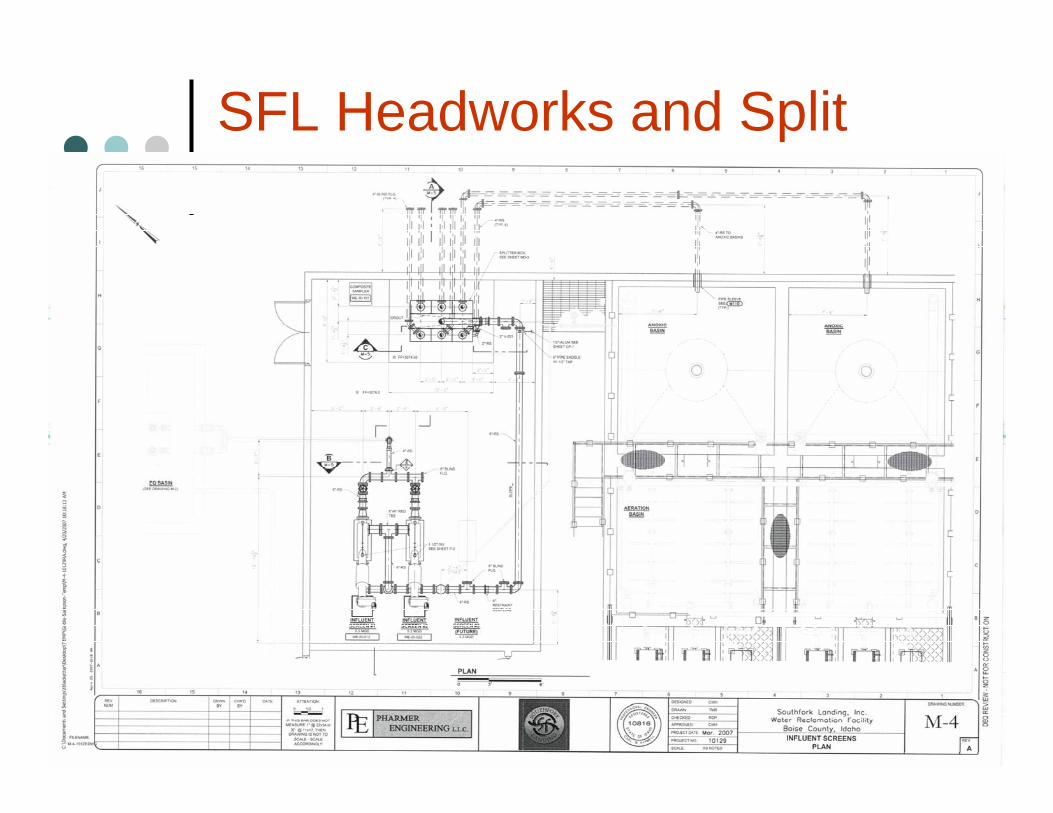
SFL Headworks and Split
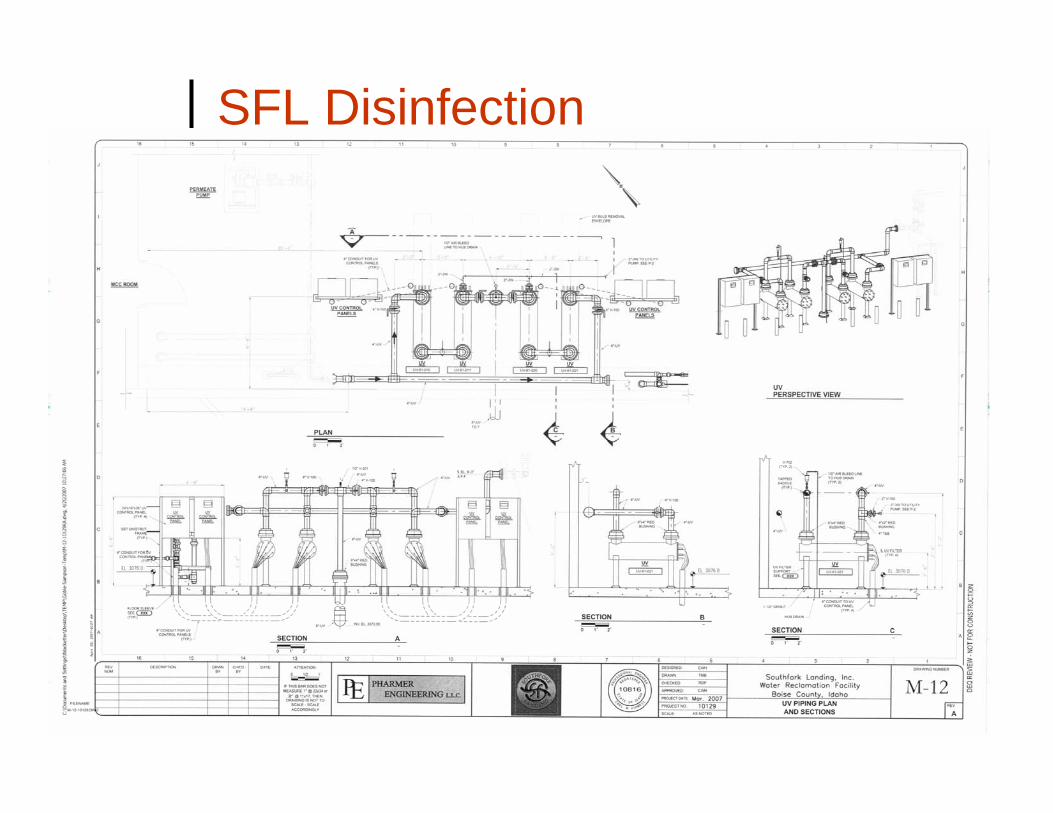
SFL Disinfection

Reuse Effluent
• Irrigation of landscaping in equestrian area and around treatment plant with overflow to aquifer recharge and/or RI (March – November)
• Winter effluent will all go to aquifer recharge and/or RI
EP

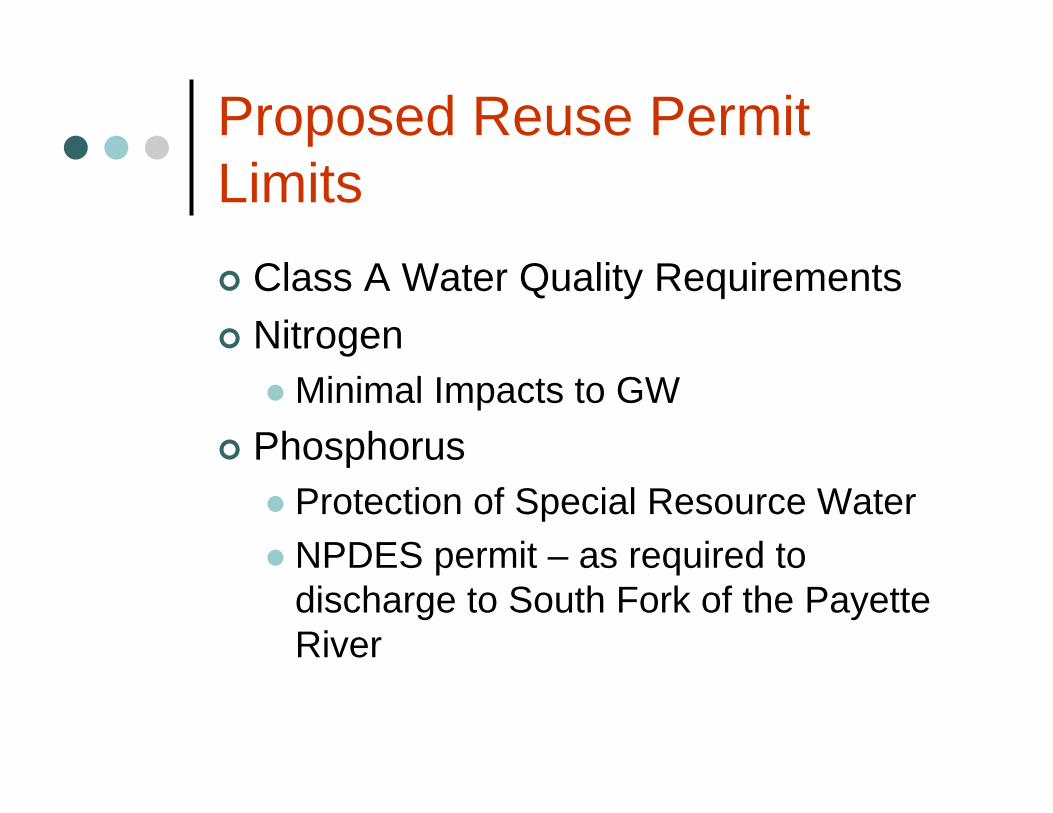
Proposed Reuse Permit Limits
Class A Water Quality RequirementsNitrogen
Minimal Impacts to GWPhosphorus
Protection of Special Resource WaterNPDES permit – as required to discharge to South Fork of the Payette River
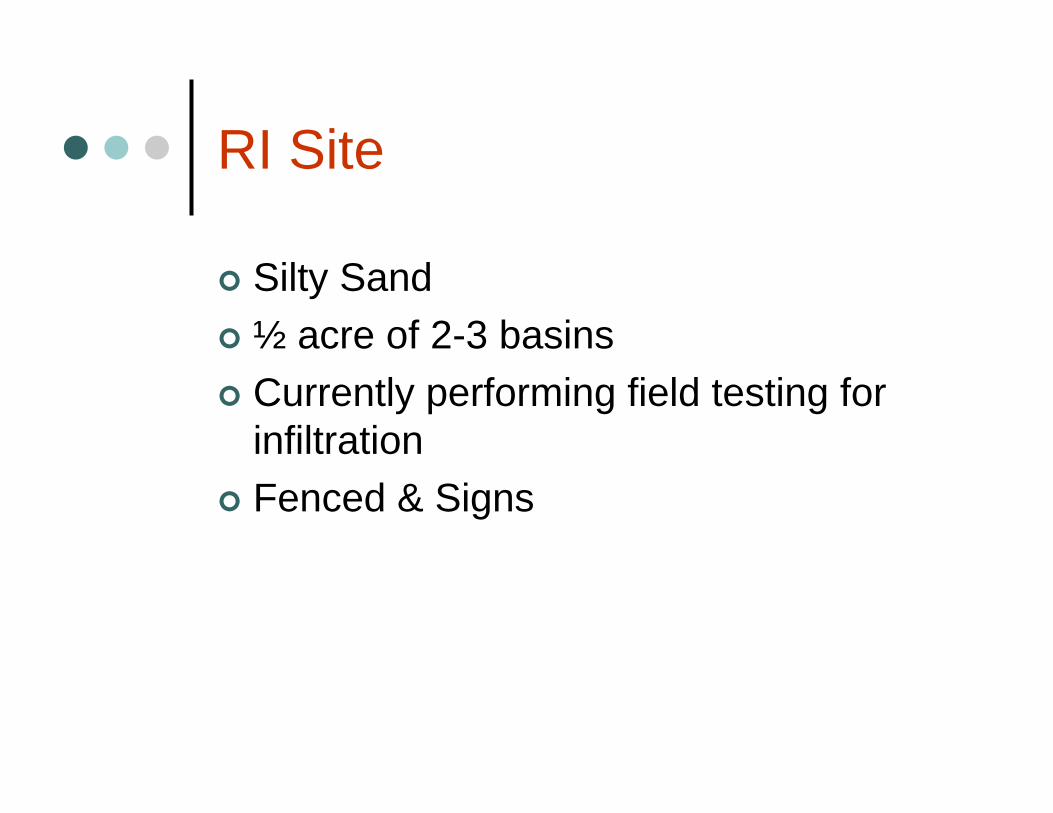
RI Site
Silty Sand½ acre of 2-3 basinsCurrently performing field testing for infiltrationFenced & Signs

Aquifer Recharge
Open basinsTrout ponds


Case Study No. 3Hidden Springs
EP
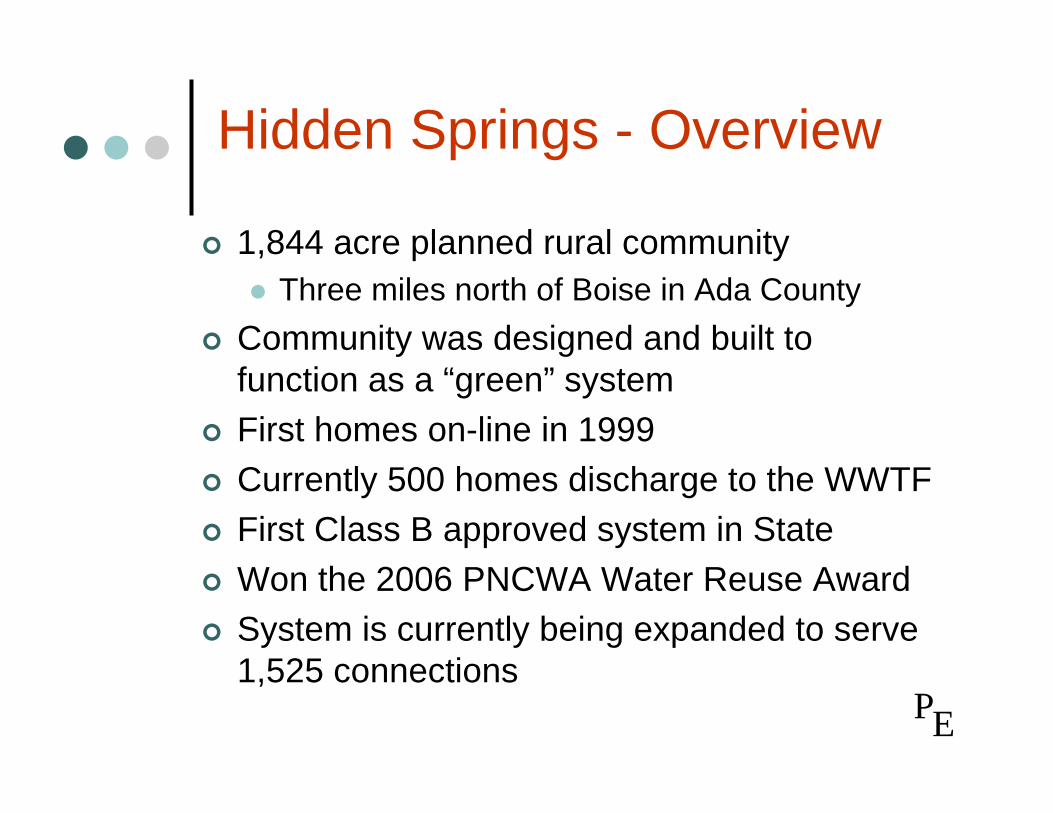
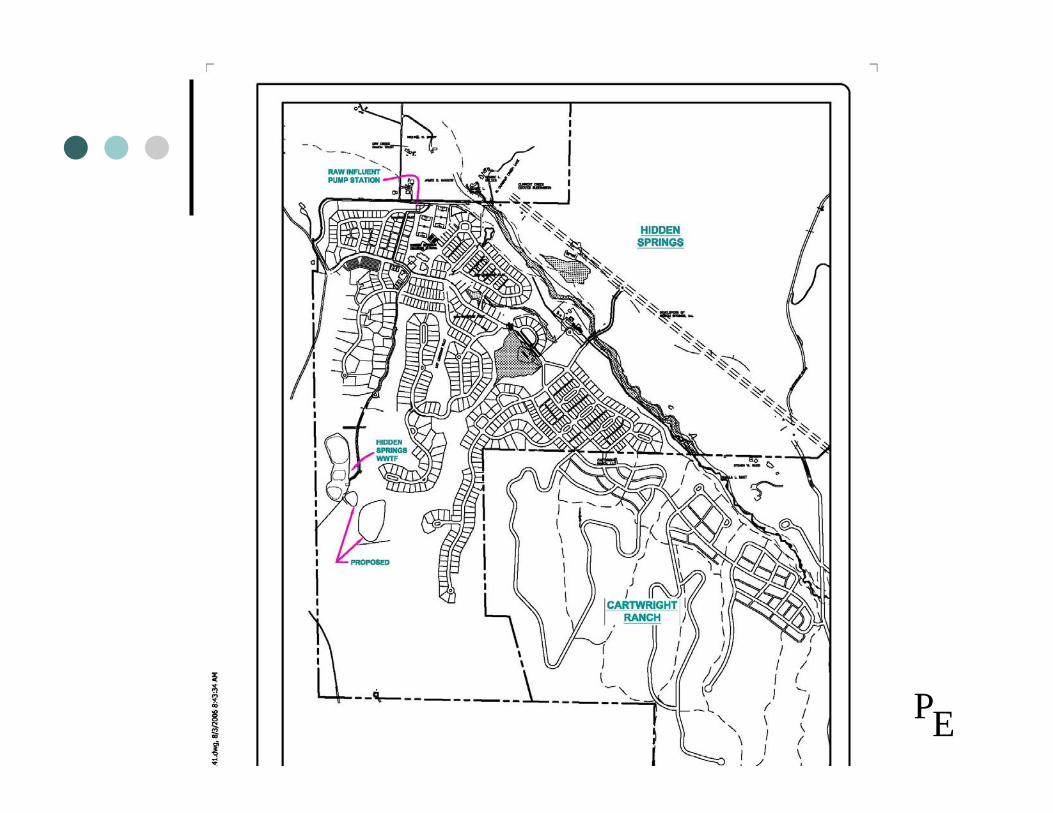
Hidden Springs - Overview
1,844 acre planned rural community Three miles north of Boise in Ada County
Community was designed and built to function as a “green” systemFirst homes on-line in 1999Currently 500 homes discharge to the WWTFFirst Class B approved system in StateWon the 2006 PNCWA Water Reuse AwardSystem is currently being expanded to serve 1,525 connections
EP
EP
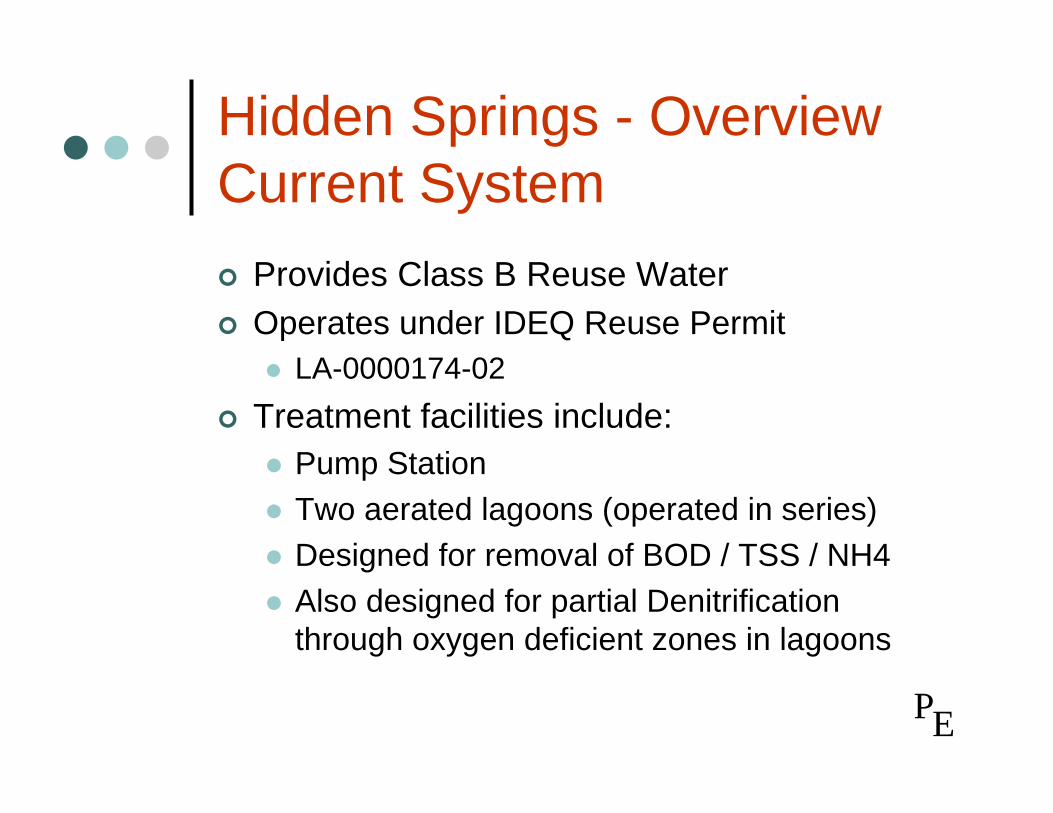
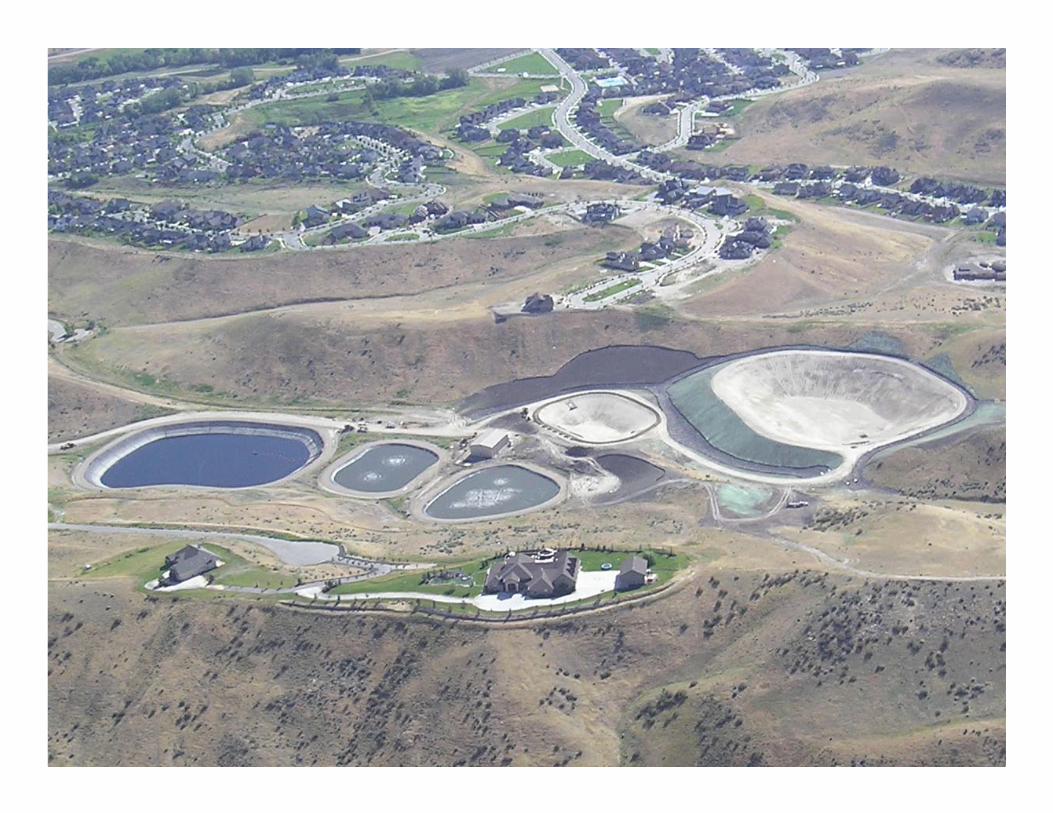
Hidden Springs - Overview Current System
Provides Class B Reuse WaterOperates under IDEQ Reuse Permit
LA-0000174-02Treatment facilities include:
Pump StationTwo aerated lagoons (operated in series)Designed for removal of BOD / TSS / NH4Also designed for partial Denitrification through oxygen deficient zones in lagoons
EP

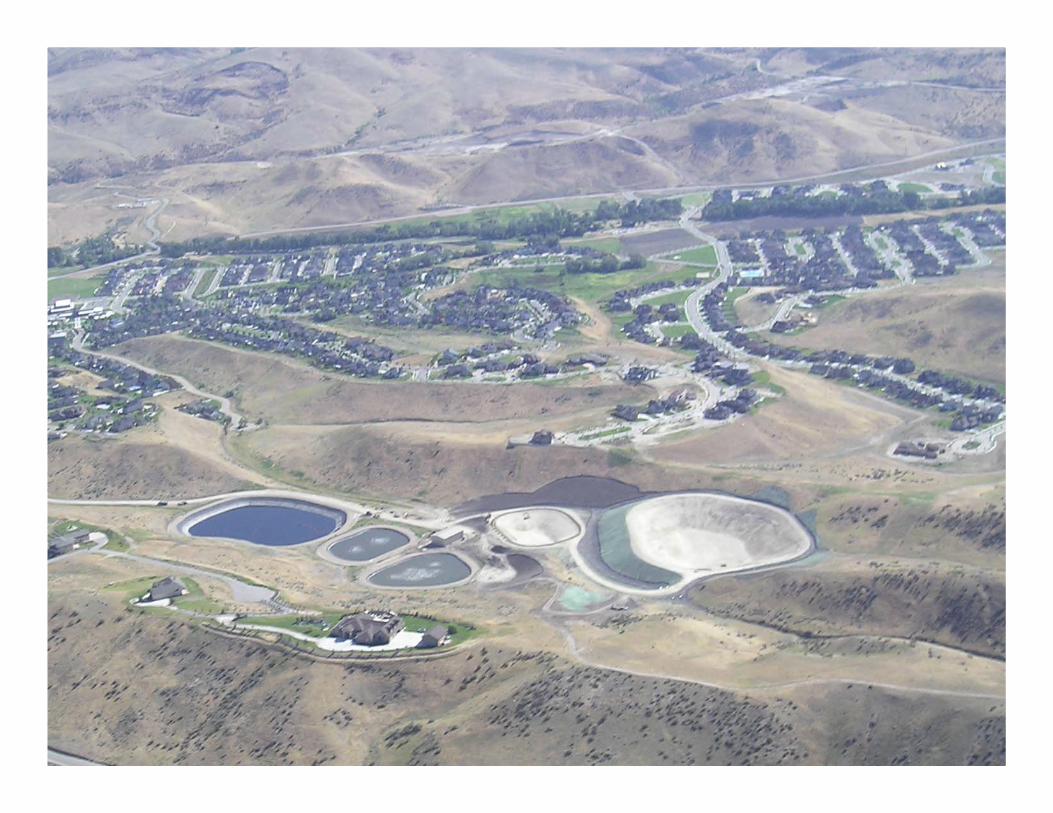
Hidden Springs - Overview Current System
Treatment facilities (cont.):19.6 mil gal treated storage lagoonStorage of treated water from November – MarchEffluent Reuse Application Season
• March - November• Filtration• Sodium Hypochlorite disinfection
EP

Storage Cell
Cell 2
Cell 1
Blower / Filtration Bldg
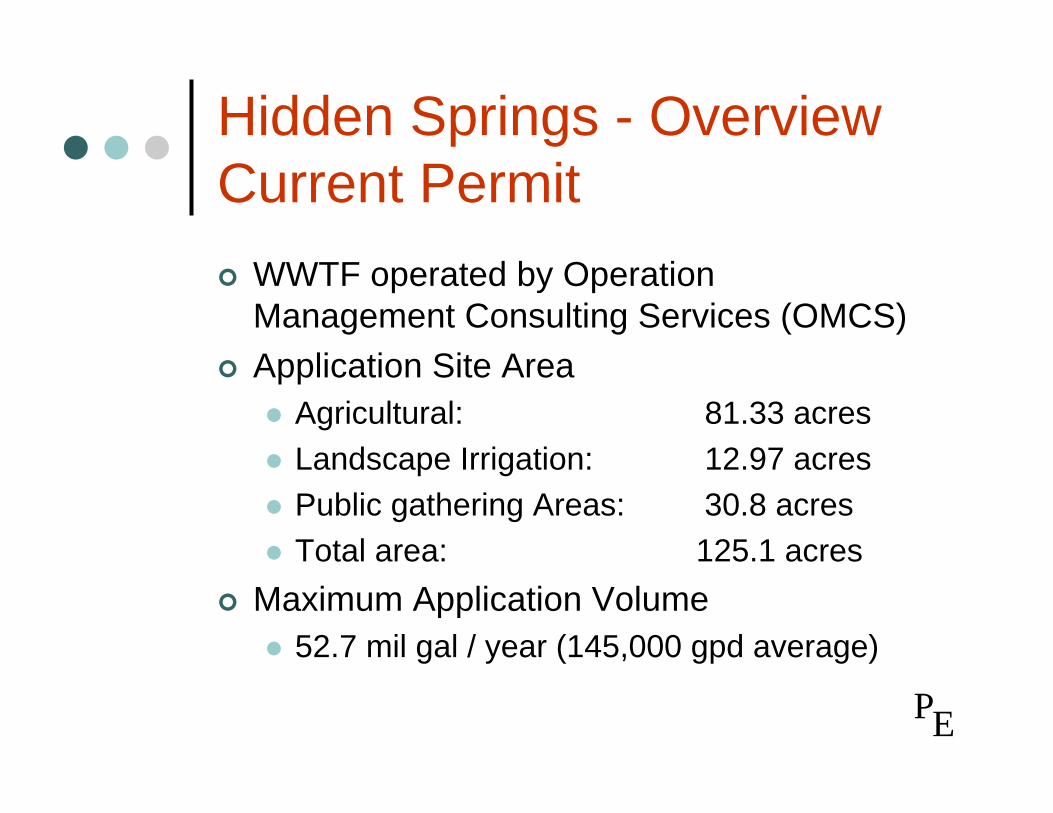
Hidden Springs - Overview Current Permit
WWTF operated by Operation Management Consulting Services (OMCS)Application Site Area
Agricultural: 81.33 acresLandscape Irrigation: 12.97 acresPublic gathering Areas: 30.8 acresTotal area: 125.1 acres
Maximum Application Volume 52.7 mil gal / year (145,000 gpd average)
EP
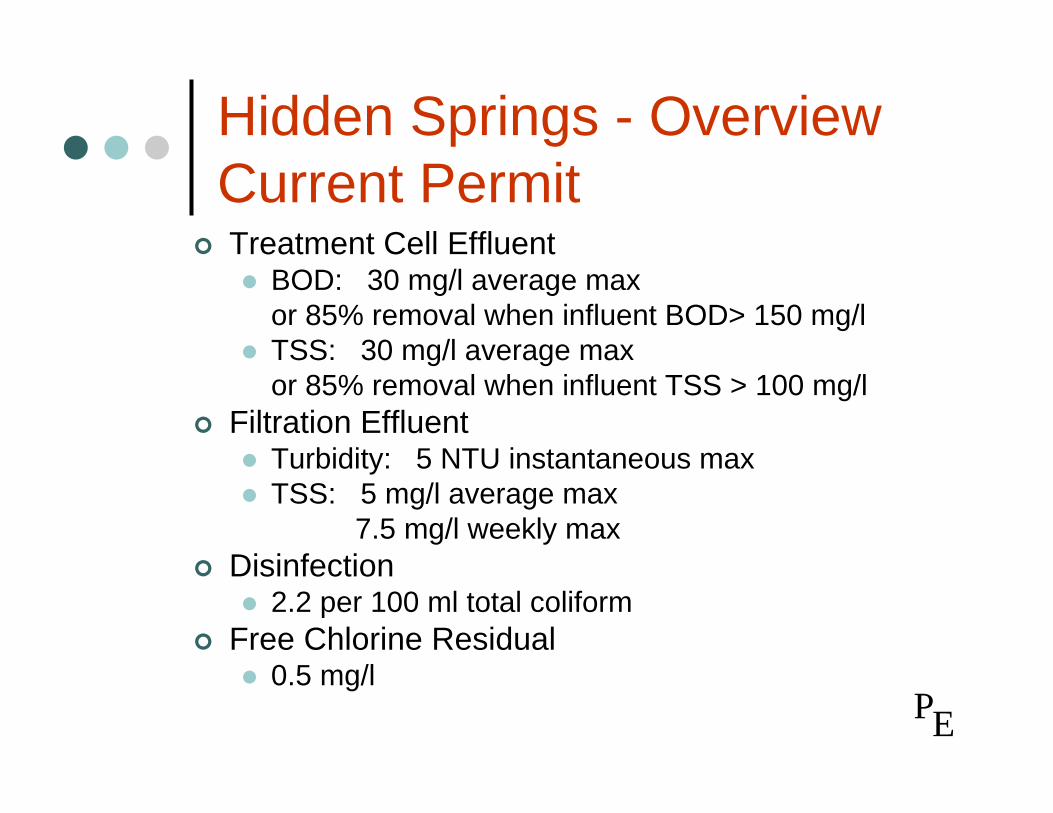
Hidden Springs - Overview Current PermitTreatment Cell Effluent
BOD: 30 mg/l average max or 85% removal when influent BOD> 150 mg/lTSS: 30 mg/l average max or 85% removal when influent TSS > 100 mg/l
Filtration EffluentTurbidity: 5 NTU instantaneous maxTSS: 5 mg/l average max
7.5 mg/l weekly maxDisinfection
2.2 per 100 ml total coliformFree Chlorine Residual
0.5 mg/l
EP
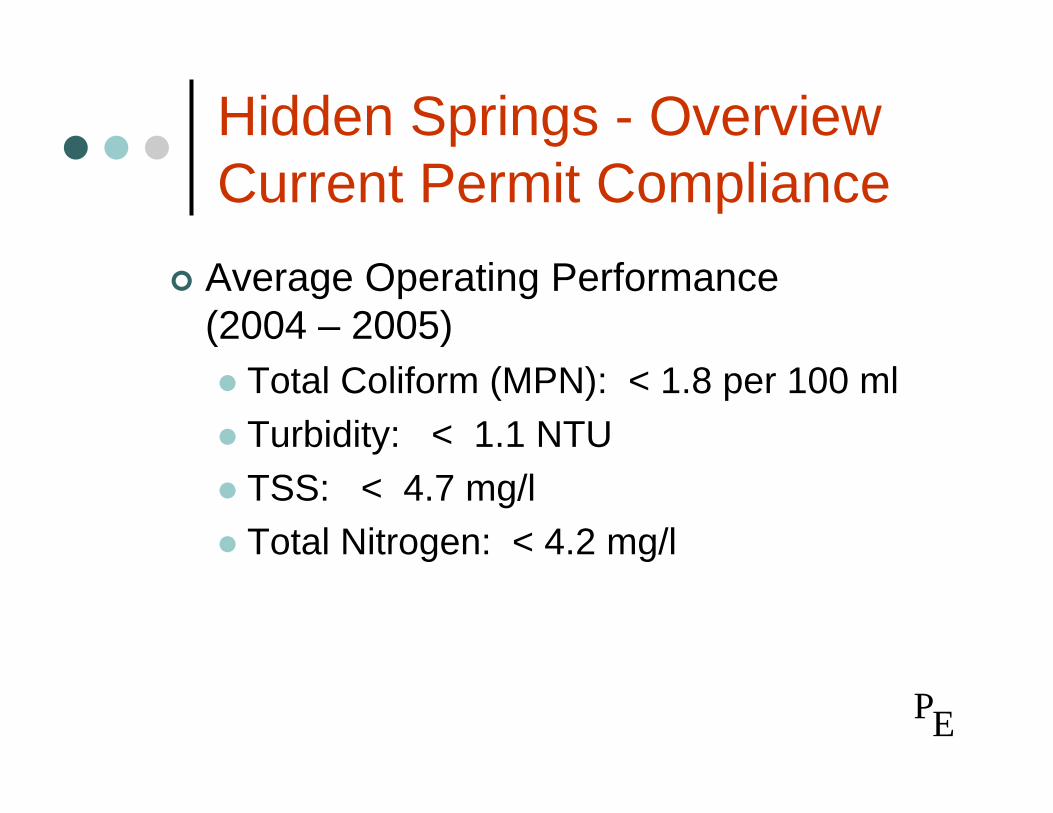
Hidden Springs - Overview Current Permit Compliance
Average Operating Performance (2004 – 2005)
Total Coliform (MPN): < 1.8 per 100 mlTurbidity: < 1.1 NTUTSS: < 4.7 mg/lTotal Nitrogen: < 4.2 mg/l
EP

Hidden Springs Expansion
Design Conditions:1,525 connections180 gpd/connection
• Lower flow per residential unit is based on six years of operating data from Hidden Springs
Average Daily Flow: 274,500 gpdPeaking factor: 3.35Peak Flow: 640 gpm
EP

Hidden Springs Expansion
New Facilities Added1 - Aerated lagoon volume: 3.0 mg• (to be operated in series with existing two lagoons)
1 - Winter storage cell volume: 26.0 mg1 - Chlorine contact / filtered effluent storage volume: 0.7 mg
EP


Questions
EP