wastewater reuse after treatment by tertiary ultrafiltration and a membrane bioreactor (mbr): a...
TRANSCRIPT

0011-9164/09/$– See front matter © 200 Elsevier B.V.
Desalination 243 (2009) 32–41
Wastewater reuse after treatment by tertiary ultrafiltrationand a membrane bioreactor (MBR): a comparative study
Juan Arévaloa, Gloria Garralónb, Fidel Plazab, Begoña Morenoa, Jorge Péreza,Miguel Ángel Gómeza*
aTechnologies for Water Management and Treatment Research Group, Department of Civil Engineering,University of Granada, 18071 Granada, Spain
Tel. +34 (58) 246153; Fax: +34 (58) 246138; email: [email protected] of Research and Development, Cadagua S.A., Gran Vía 45, 7ª, 48011 Bilbao, Spain
Received 20 January 2008; Accepted 4 April 2008
Abstract
The quality of effluent from urban wastewater destined for reuse was compared after treatment by a submergedmembrane bioreactor (MBR) and a conventional activated sludge system followed by ultrafiltration (CAS-U). Thestudy was carried out at pilot scale, using an MBR module equipped with hollow-fibre ultrafiltration membranes fedwith pre-treated raw urban wastewater, and a flat-membrane ultrafiltration module fed with effluent from a con-ventional activated sludge plant. A comparative analysis was carried out for physicochemical quality parameters(turbidity, suspended solids, colour and COD) and microbiological quality parameters (E. coli, faecal coliforms, totalaerobic bacteria and coliphages). A particle distribution analysis (2–125 µm) was also undertaken. The two systemsproduced water with similar phsyicochemical characteristics, although the MBR proved more efficient at reducingCOD. However, the colour of the MBR effluent was more marked. With regard to microbiological quality, thedifferences observed between the two systems were due to variations in the periods of chemical cleaning applied tothe membranes in order to prevent progressive fouling of the permeate zone. Independently of the frequency ofchemical cleaning, the MBR system proved more efficient at retaining coliphages.
Keywords: Membrane bioreactor; Tertiary ultrafiltration; Wastewater reuse; Microbiological quality; Physico-chemical quality
*Corresponding author.
doi:10.1016/j.desal.200 .0 .08 4 138 All rights reserved.

J. Arévalo et al. / Desalination 243 (2009) 32–41 33
1. Introduction
Reuse of wastewater is an essential part ofsustainable urban development, permitting a morebalanced management of water resources whilecontributing to the maintenance of quality stan-dards [1]. Among the various technologies whichhave been developed to guarantee an acceptablequality in wastewater destined for reuse, mem-brane technologies are of particular interest [2].
Advantages of membrane technologies includethe need for less space, their action as a physicalbarrier against particle material and their effi-ciency at retaining microorganisms without prob-lems of resistance or by-product generation [3,4].As a result, membrane technologies are nowapplied in diverse areas of water treatment suchas the reuse of urban wastewater [3] or as pre-treatment in inverse osmosis systems [5].
A standard membrane configuration is theirapplication as tertiary treatment after a conven-tional purifying system [6]. In these applications,macrofiltration is often used as pretreatment inorder to avoid direct damage to the membraneand to optimize maintenance operations [7]. Thisconfiguration is ideal for application with con-ventional systems which require tertiary treat-ment and has been shown to produce high-qualityeffluent suitable for reuse [8].
An alternative membrane application in waste-water reuse is the technology known as a sub-merged membrane bioreactor (MBR), whichcombines the biological activated sludge processwith physical separation by membrane, avoidingthe need for an intermediate or second purifyingstep. In this way a new system has evolved whichmerges the second and third treatment phases,allowing for the construction of more compactplants capable of producing directly reusableeffluent [9]. In such a system different con-figurations may be used, with membranes appliedeither as ultrafiltration or as microfiltration. Thisflexibility may be extended to the use of mem-brane technologies as tertiary treatment where
ultrafiltration membranes have been shown to bemore efficient than microfiltration membranes,particularly in the elimination of viruses [2].
With these considerations in mind, the objec-tive of the present study was to compare thequality of effluent destined for reuse obtainedfrom an MBR system with that of effluentobtained from an ultrafiltration membrane appliedas tertiary treatment after a conventional activatedsludge process (CAS-U).
2. Materials and methods
2.1. Experimental systems
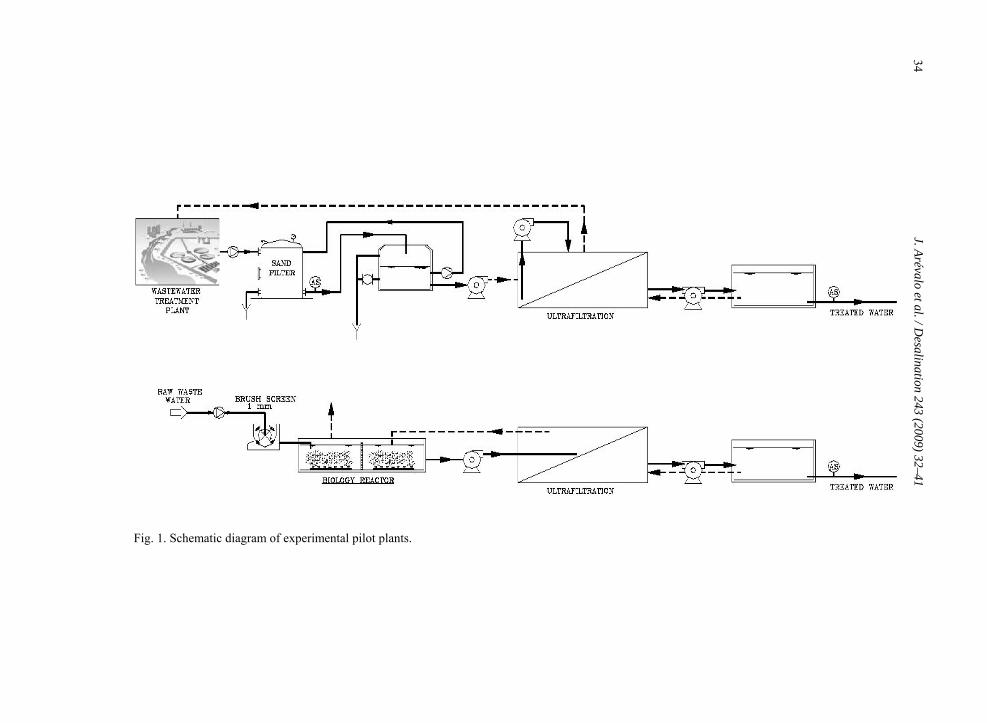
The study was carried out at pilot scale(Fig. 1). The two systems compared were atertiary ultrafiltration module applied after a con-ventional activated sludge plant (CAS-U) and amembrane biorreactor (MBR) fed with pre-treated raw wastewater. The tertiary ultrafiltrationsystem was a Flamec (FilterPar) ultrafiltrationmodule equipped with flat cassette-type poly-vinylidenefluoride (PVDF) membranes with anaverage pore size of 0.05 µm. Area of filtrationsurface was 35 m2, operating in a vacuum withtransmembrane pressure of between !0.1 and!0.6 bar. Running conditions involved a 20-minproduction phase (1 m3/h), followed by a 2-minbackwashing. Alkaline chemical cleansing wascarried out every 15 days (NaOH 0.3 M andNaClO at 12.5%). Acid chemical cleansing wascarried out every 30 days (H2SO4 0.05 M) bymeans of recirculation for 1 h. The system waslinked to a sand-pressure filter pre-treatment,filled with silica sand with an effective size of0.8 mm and operating with a hydraulic loading of5 m3/m2 h.
The MBR consisted of an external membranesysten (ZeeWeed 500 membranes) equipped withPVDF outside–inside hollow fibres with an ave-rage pore size of 0.04 µm. The membranes wereimmersed in an external membrane tank fed fromthe biological reactor at a flow rate of 5 F. The
J. Arévalo et al. / D
esalination 243 (2009) 32–41
Fig. 1. Schematic diagram of experimental pilot plants.
34

J. Arévalo et al. / Desalination 243 (2009) 32–41 35
membrane tank concentrate (4 F) returned asoverflow to the biological reactor and the per-meate (F = 1 m³/h) passed to the backwashingtank. Overflow from the backwashing tankwas the final permeate from the system. Themembrane operated with a continuous flow of20 l/(m²h), and with a permeate cycle of 6 minfollowed by cycles of repose and backwashing of30 s. Prior to treatment, the influent was passedthrough a 1 mm brush screen in order to ensurethe correct operation of the membrane.
For the biological MBR process a cellularretention time of 25 days was established, with ahydraulic retention time of 25 h. This was suffi-cient to guarantee the quality of the effluent interms of organic material and stability of gene-rated sludge (<65% in volatile material). Theconventional system operated with a cellularretention time of 5 days and a hydraulic retentiontime of 7 h, thus complying with standards fordischarge established in EC Directive 271/91. Inneither of the two systems was the elimination ofphosphorous or nitrogen taken into account.
2.2. Physical and chemical determinations
Throughout the day, a 5 L compound samplewas collected from both the influent and effluentof the two experimental systems by means of aperistaltic pump. The storage system was main-tained under refrigeration.
COD was measured using the COD closedreflux micro method (APHA, 1992). Absorbanceof the digestate was measured colorimetrically at600 nm and the COD concentration was cal-culated from a calibration curve, prepared withpotassium acid phthalate. Chloride interferencewas prevented by means of silver nitrate. SS werecalculated through vacuum filtration, drying at105ºC, and gravimetric determination using0.45 µm filters. Turbidity was determined byspectrophotometric methods at 860 nm (UNE-ENISO 7027) using a spectrophotometer Helios γ(ThermoSpectronic). True colour of the water
samples was determined by measuring the fil-trated samples at 436 nm in accordance withUNE-EN-ISO 7887.
Particle analysis was carried out for each ofthe samples obtained using a LiQuilaz-E20particle counter (Particle Measuring Systems).This system employs laser light to measure dif-fraction particles ranging between 2 and 125 µmin size with a resolution of 1 µm.
2.3. Microbiological determinations
For bacteriological and viral analyses, dailygrab water samples were collected at approxi-mately the same time in sterile glass bottles (1 L)and analysed immediately after collection. Thepresence of thermotolerant coliforms (faecalcoliforms) and E. coli was studied using themembrane filtration procedure UNE-EN ISO9308-1. Samples (100 ml or dilution) were fil-tered through Millipore sterile membrane filters(0.45 µm) placed on Petri dishes containing adouble layer of tryptic–bile–agar and tryptic–soy–agar (Difco) respectively. Petri dishes wereincubated at 37±0.5ºC for 4 h and then at 44.5±0.5ºC for 18 h, following methodological recom-mendations for colony count and differentiationbetween faecal coliforms and E. coli. The colonycount was calculated from the arithmetic mean ofthree membrane filter counts. A total aerobicbacteria count was carried out at 22ºC using themethod described in Regulation UNE-EN ISO6222 (1999).
Coliphages were examined using a modifiedform of the double agar layer method describedby Adams [10], with E. coli C (ATTC 13076) ashost bacteria. Previous to analyses, 10 ml ofsample or dilution was placed in a tube contain-ing 2 ml of chloroform. The tube was shakenvigorously and then left to settle for 20 min; afterheating at 45ºC, the chloroform was removed.This sample treatment removed all bacteria priorto coliphage determination.

J. Arévalo et al. / Desalination 243 (2009) 32–4136
3. Results and discussion
A key element when comparing the quality ofeffluents from ultrafiltration membranes, whetherapplied as MBR or as tertiary treatment for urbanwastewater, is the analysis of particle distributionin the effluent. In the two systems under study,distribution of particles between 2 and 125 µmconformed to a logarithmic X-model regression(Fig. 2), with different values both in the slopeand in the intersection with the ordinate axis. Thisindicates a different quality of effluent proceed-ing from the two systems, with the tertiarytreatment presenting a lower content of bothsmall-sized and large-sized particles.
It is not feasible that particles of over 2 µm insize should derive from either the influent or fromthe activated sludge filtered by membrane ultra-filtration. Rather, the particles proceed from theprogressive fouling of the clean membrane sur-face and from the permeate zone, as has beendescribed by other researchers for both MBR[11,12] and tertiary ultrafiltration [3]. This foul-ing may have different origins, both biological(development of biofilms) and chemical (incrus-tation, introduction of particles in backwashing),and presumably depends on the membranesystem operation protocol.
In the present experiment, operation wascarried out in accordance with the manufacturer’sinstructions, with periodical chemical cleaningfor the tertiary system performed independentlyof the state of the membrane. However, cleaningphases for the MBR were carried out on a basis ofneed (taking into account the condition of themembrane, quality of the effluent, etc) in order tooptimize use of chemical reactives. This differ-ence in the operation of the two systems wouldseem to have contributed significantly to thegreater or lesser fouling of the clean membranesurface and permeate zone, thus influencing thefinal quality of the effluent.
Particle distribution in effluents from theMBR presented changes over time, with a pro-
Fig. 2. Particle size distributions (2–125 µm) for effluentfrom MBR (G) and tertiary ultrafiltration (!). Log-arithmic X-model regression for MBR (—) and tertiaryultrafiltration (- - -).
Fig. 3. Evolution of particle size distributions in MBReffluent after 7 fortnights of operation without chemicalcleansing.
gressive increase in the number of both small andlarge-sized particles. However, this behaviourwas not evident in the effluent from the tertiaryultrafiltration. As may be seen in Fig. 3, meanparticle distributions obtained from the analysescarried out during the two-week period conformto a logarithmic X-model regression. Accord-ingly, integration of this regression with the coor-dinate axes between the smallest particle analysed(2 µm) and the maximum size recorded (Y = 0)provides a value indicating the extent of foulingof the permeate zone, based on the analysis of

J. Arévalo et al. / Desalination 243 (2009) 32–41 37
Fig. 4. Mathematical integration of logarithmic X-modelregression from fortnight medium particle size distri-butions (2–125 µm) for effluent from MBR (G) andtertiary ultrafiltration (!).
effluent particle distribution. As Fig. 4 shows,these values reveal the different behaviour of thetwo systems, with the MBR presenting progres-sive fouling while the tertiary ultrafiltrationmaintained similar values throughout the experi-mentation period. This variation in the quality ofeffluent based on particle distribution analysis isdue to the characteristics of the chemical cleaningprocess applied in each case. Given that similarworking routines could be established for the twosystems, the present comparative analysis shouldtake into account the operational differenceswhich have affected the final quality of treatedeffluent.
Parameters such as turbidity and suspendedsolids give an indication of the aesthetic aspect ofthe water and are increasingly accepted as physi-cochemical parameters for monitoring quality inwater reuse, given their low cost, easy analysisand the extent of information they provide [13].Both parameters are considerably improved byultrafiltration membranes, due to their sievingeffect on particle material. In the present experi-ment, the tertiary ultrafiltration achieved valuesof approximately 90% for the two parameters,and the quality of effluent was shown to beindependent of the quality of influent. This reten-tion capacity was even greater in the MBR, withthe membranes extracting water almost totallyfree of particles, from activated sludge with a
concentration of between 7 and 9 g/l of MLSS.Again, concentration in the influent did not affectthe quality of the effluent, as other authors havedescribed [8,11,14]. The systems thus produceeffluents with a high degree of clarification, asalso indicated by the particle analysis, and thismay be considered an advantage for the reuse ofwater obtained from both MBR and tertiaryfiltration.
A further physicochemical parameter relatedto the aesthetic aspect is colour, which is easy todetermine analytically and provides importantinformation regarding the quality of the water[13]. In contrast to results obtained for turbidityand suspended solids, colour was present in theeffluent from the ultrafiltration membranes, thusposing a drawback for their reuse. It should benoted that values in the MBR effluent were con-siderably greater than those in the effluent fromtertiary ultrafiltration, presenting statistically sig-nificant differences (Table 1). It would thereforebe necessary to consider post-treatment for MBReffluents, depending on the re-use for which thewater is intended, and particularly for domesticuses [15]. However, such treatment is less likelyto be required for effluents from tertiary ultra-filtration.
In previous research, Poyatos et al. [11]obtained effluents with mean values for colour of2.8 m!1 (α436 nm) for an MBR system operatingwith maximum concentrations of 6 g/l of MLSS.However, the MBR system in the presentexperiment showed lower mean values for greaterconcentrations of MLSS (Table 1). This mightlead to the view that retention time exerts aninfluence on the colour of MBR effluent, and thata large part of the colour is due to dissolvedorganic compounds which are eliminated ingreater quantities when cellular retention time islonger. However, this idea is challenged by thefact that the effluent from the tertiary ultra-filtration system presented less colour, since theconventional biological process generally ope-rates with shorter retention times. It would

J. Arévalo et al. / Desalination 243 (2009) 32–4138
Table 1Summary of effluent characteristics from MBR and ultrafiltration system
Parameters MRB effluent Ultrafiltration effluent p value
Max. Min. Average Max. Min. Average
Turbidity NTU 0.34 0 0.12 0.8 0 0.15 0.061TSS mg/l 3.8 0 0.76 7 0 1.2 0.0593Colour (436 nm) m!1 2.7 1.1 1.8 1.4 0.25 0.55 0COD mg O2/l 200 14 50.5 170 22 75 0.001Total aerobic cfu/ 100 ml 32000 207 4353 256 0 89 0Faecal coliforms cfu/100 ml 125 0 3.5 9 0 1.4 0E. coli cfu/100 ml 35 0 35 0 0 0 0Coliphages cfu/100 ml 0 0 0 1 0 0.3 0
therefore appear that other elements influence thereduction of colour in conventional activatedsludge systems.
COD is another physicochemical parameterfor which the two experimental systems varied.The effluent from tertiary ultrafiltration generallyshowed higher values than the MBR effluent,and differences were statistically significant(Table 1). At start-up, the MBR system producedeffluents with high concentrations of COD(.200 mg O2/l), but these quickly stabilized, giv-ing way to a final concentration which accordingto some researchers [11] remains unaffected bythe MLSS concentration in the activated sludge.The composition of wastewater includes afraction of non-biodegradable soluble COD [16]which would not be transformed in the biologicalreactor and would pass through the membrane,resulting in a minimal concentration with slightvariation, independently of the characteristics ofthe system operation. However, any type ofproblem with the operation of the biological pro-cess would directly affect the COD concentrationin the effluent, due to the incapacity of the mem-brane to retain dissolved material.
Acting on effluent from a conventional bio-logical process, tertiary ultrafiltration achievespoorer results for the elimination of dissolvedCOD elimination than those associated with
MBR systems, since it operates with shortercellular retention periods. The membrane in itselfproduces an improvement in COD concentrationdue to the retention of particle material, achievinga performance of 27%. In tertiary ultrafiltration,a strong correlation exists between the CODconcentration in the effluent and influent (Fig. 5),meaning that the final quality of the effluent withregard to COD is directly dependent on the bio-logical purifying process.
One aspect in which membrane ultrafiltrationexcels is disinfection, due to its capacity forretaining bacteria and viruses [3]. This efficiencyis reflected in the low presence of E. coli strainsin the effluents, particularly in tertiary ultra-filtration effluent, where 100% of the samplestaken presented zero values. However, the pre-sence of this faecal contamination indicator insome of the samples of MBR effluent wassignificant, thus confirming the superior qualityof the water from the CAS-U system observed inthe particle distribution analysis.
Similar behaviour was observed with regard tofaecal coliforms, which appeared in isolated fash-ion in only a small percentage of samples takenfrom the tertiary ultrafiltration effluent (Table 1).By contrast, faecal coliforms began to be detectedin all MBR samples after 70 days of operationwithout chemical cleaning. A similar pattern was

J. Arévalo et al. / Desalination 243 (2009) 32–41 39
Fig. 5. Influence of influent COD over effluent CODconcentration for tertiary ultrafiltration.
observed by Komesli et al. [17] both for faecaland total coliforms in an MBR system with thesame chemical cleaning regime as the systemassayed here. This cannot result from such micro-organisms passing through the ultrafiltrationmembranes, since the values for turbidity andsuspended solids and even the particle analysisshow an absence of faults due to ruptures in thesystem. Given that the membrane pore size isapproximately 100 times smaller than the bac-teria, penetration would not be possible. In aprevious study, Gómez et al. [3] investigated theorigin of this type of faecal contamination indi-cator in effluents from ultrafiltration membranes,and concluded that the bacteria did not passthrough the membrane but rather arose fromcontamination of the permeate zone. In the pre-sent MBR, such contamination would be greaterthan for the CAS-U system, owing to the reducedfrequency of chemical cleaning.
The influence of chemical cleaning of themembranes on the microbiological quality of theeffluent is further demonstrated in the results fortotal aerobic bacteria content (Fig. 6). Presence ofthis indicator was constant in the MBR effluentsand showed a progressive increase, controlledonly through chemical cleaning with chlorine.The tertiary ultrafiltration effluents presented acyclical evolution, with zero values after thechemical cleaning phase, followed by a progres-
Fig. 6. Effluent total aerobic bacteria from membranebioreactor (G) and tertiary ultrafiltration (!).
sive increase up to the next chemical cleaningphase (once a fortnight). These values explain theevolution of the particle distribution analysis andclearly indicate the presence of contamination inthe ultrafiltration membrane permeate zone. It istherefore necessary to control such contaminationthrough chemical cleaning, which may be moreor less exhaustive depending on the final use ofthe treated water.
Bacterial contamination of the permeate zonein ultrafiltration membrane systems could pose adrawback for the reuse of water for domesticpurposes and also for its subsequent treatment byinverse osmosis membranes. Some authors haveargued in favour of stabilizing the water throughchlorination as the best option to combat thisproblem [18]. However, chemical cleaning of themembranes plays an important role in controllingbacterial contamination and should be applied inboth the MBR and CAS-U systems in accordancewith the final use of the water.
A further advantage of ultrafiltration mem-branes is their capacity for retaining viralparticles [3]. As shown in Table 1, the twoexperimental systems presented differences inthis respect, the MBR effluent showing a higherquality with a total absence of coliphages, whilepositive analyses were occasionally recorded forthe tertiary ultrafiltration effluent. Viral particlesshow a strong tendency to associate with particlematter [19] and are highly vulnerable to predationin activated sludge systems [20]. These two

J. Arévalo et al. / Desalination 243 (2009) 32–4140
mechanisms favour the elimination of viral par-ticles in both CAS-U and MBR systems, butparticularly in the MBR system due to the factthat it operates with higher concentrations ofbiomass.
While a CAS system is highly effective ateliminating coliphages [21], the elimination is nottotal, and the influent reaching the tertiary ultra-filtration contains viral particles ranging between100 and 10,000 puf/100 ml [3,21]. Like the MBRmembrane, the tertiary ultrafiltration membranepresents high efficiency in viral particle retention.However, bearing in mind that the size of thecoliphages (20–200 nm) is approximately thesame as the nominal size of the pore, and smallerthan the absolute pore size, their presence aftermembrane ultrafiltration cannot be discounted, asoccurs in the tertiary ultrafiltration effluent understudy. A further consideration is the formation ofa cake layer in ultrafiltration membranes, whichpromotes the retention of viral particles by caus-ing a reduction in the pore size [22]. Cake layerformation is more intense in the MBR membranethan the tertiary ultrafiltration membrane, owingto the higher concentration of biomass in contactwith the membrane and the reduced frequency ofchemical cleaning operations, which have theeffect of facilitating the passage of viral particlesby partially eliminating the cake layer formed onthe membrane.
4. Conclusions
Ultrafiltration membranes facilitate the pro-duction of high-quality treated wastewater, withregard to both physicochemical and microbio-logical parameters. Independently of their appli-cation in the CAS-U or MBR configuration, themembranes produce water suitable for the mostdemanding types of reuse. It should be noted thatthe chemical cleaning process applied to theultrafiltration membranes has a considerableeffect on microbiological quality, particularly on
bacterial content, owing to the progressive foul-ing of the permeate zone, which may be con-trolled by increasing the frequency of chemicalcleaning. The chief differences in water qualityobtained from ultrafiltration membranes appliedas CAS-U and MBR were found to be colour,which is more marked in the MBR system, andorganic matter content (COD). The MBR systemproved more efficient at eliminating COD. Thetwo systems also presented differences withregard to coliphages, which were eliminated moreefficiently by the MBR.
Acknowledgements
This research was funded by the AndalusianGovernment (Andalusian Water Agency) and theBasque Government’s INTEK programme, andwas conducted at the Department of CivilEngineering and the Institute of Water Research,University of Granada, with the collaboration ofCadagua and Emasagra. The article was trans-lated from Spanish by Julian Bourne of theDepartment of Translation and Interpreting,University of Granada.
References
[1] T. Asano, Water Sci. Tech., 45(8) (2002) 23–33.[2] M. Gómez, F. Plaza, G. Garralón, J. Pérez and M.A.
Gómez, 6th IWA Specialty Conference on Waste-water Reclamation and Reuse for Sustainability,Antwerp, 2007.
[3] M. Gómez, A. de la Rua, G. Garralón, F. Plaza,E. Hontoria and M.A. Gómez. Desalination, 190(2006) 16–28.
[4] G. Tchobanoglous, J. Darvy, K. Bourgeous, J.McArdle, P. Genest and M. Tylla, Desalination, 119(1998) 315–322.
[5] M.P. del Pino and B. Durham, Desalination, 124(1999) 271–277.
[6] M. Ortiz, R.G. Raluy, L. Serra and J. Uche,Desalination, 204 (2007) 121–131.
[7] K.N. Bourgeous, J.L. Darby and G. Tchobanoglous,Water Res., 35 (2001) 77–90.

J. Arévalo et al. / Desalination 243 (2009) 32–41 41
[8] M. Gómez, F. Plaza, G. Garralón, J. Pérez and M.A.Gómez, Desalination, 202 (2007) 369–376.
[9] C. Wisniewski, Desalination, 203 (2007) 15–19.10 M.H. Adams, Bacteriophages, Interscience, New
York, 1959.[11] J.M. Poyatos, M. Molina-Muñoz, B. Moreno,
J. González-López and E. Hontoria, J. Envir. Sci.Health, 42 (2007) 1005–1012.
[12] P. Côté, E. Buisson, C. Pound and G. Arakaki,Desalination, 113 (1997) 189–196.
[13] M. Salgot, E. Huertas, S. Weber, W. Dott andJ. Hollender, Desalination, 187 (2006) 29–40.
[14] H. Hasar, C. Kinaci, A. Unlü and U. Ipek,Desalination, 142 (2001) 287–293.
[15] Y. Fan, G. Li, L. Wu, W. Yang, C. Dong, H. Xu andW. Fan, Proc. Biochem., 41 (2006) 1364–1370.
[16] M. Henze, C.P.L. Grady, W. Gujer, Gv.R. Maraisand T. Matsuo, Activated sludge model Nº 1,Scientific and Technical Report Nº 1, IAWPRC,London, 1986.
[17] O.T. Komesli, K. Teschner, W. Hegemann and C.F.Gokcay, Desalination, 215 (2007) 22–28.
[18] L.S. Tam, T.W. Tang, G.N. Lau, K.R. Sharma andG.H. Chen, Desalination, 202 (2007) 106–113.
[19] D.R. Preston and S.R. Farrah, App. Environ.Microbiol., 54(11) (1998) 2650–2654.
[20] T. Kim and H. Unno, Water Sci. Tech., 33(10–11)(1996) 243–250.
[21] K. Zhang and K. Farahbakhsh, Water Res., 41 (2007)2816–2824.
[22] K. Farahbakhsh and D.W. Smith, Water Res., 38(3)(2004) 585–592.