wastewater network plus: business plan - united utilities · network plus price control. it...
TRANSCRIPT

Wastewater Network Plus Business Plan Chapter 7: Supplementary document
Document Reference: S6008
This document provides details of our long term strategy and AMP7 delivery plans for the Wastewater Network Plus price control. It provides details of our costs relative to customer outcomes and performance commitments and provides details of the activities we expect to undertake to achieve our targets.
United Utilities Water Limited

Copyright © United Utilities Water Limited 2018
Chapter 7: Supplementary Document - S6008 unitedutilities.com
1
Contents
1 Executive summary ........................................................................................................................................ 3 2 Business Context – the wastewater service ................................................................................................... 5
2.1 Current and future drivers .................................................................................................................... 6 2.2 Engagement with Bioresources ............................................................................................................ 8 2.3 Transfer pricing between Wastewater Network Plus and Bioresources .............................................. 9
3 Strategic overview ......................................................................................................................................... 9 3.1 Our performance in the 2015-2020 period ........................................................................................... 9 3.2 Summary of ODIs in the 2015-2020 period ......................................................................................... 10 3.3 Our strategy for AMP7 and beyond .................................................................................................... 11 3.4 Customer Strategy .............................................................................................................................. 11 3.5 Systems thinking ................................................................................................................................. 12 3.6 System thinking and our Integrated Catchment Strategy ................................................................... 12 3.7 Natural capital approaches ................................................................................................................. 13 3.8 Our AMP7 ambition for integrated catchment ................................................................................... 14 3.9 Approach to operation and maintenance of assets to deliver a cost effective service ...................... 15 3.10 Our risk management framework ....................................................................................................... 16 3.11 Long term planning to address key resilience threats ........................................................................ 16
4 Our AMP7 Plan ............................................................................................................................................. 17 5 Flood risk is reduced to homes and businesses ........................................................................................... 17
5.1 Customer views ................................................................................................................................... 20 5.2 Risk and resilience ............................................................................................................................... 21 5.3 Activities and costs .............................................................................................................................. 23
5.3.1 Customer Engagement ................................................................................................................... 24 5.3.2 Investing in capacity ....................................................................................................................... 25 5.3.3 Network monitoring ....................................................................................................................... 27 5.3.4 Reactive Resolution ........................................................................................................................ 27 5.3.5 Sewer maintenance ........................................................................................................................ 28 5.3.6 Proactive cyclic cleaning ................................................................................................................. 28
6 We reliably collect and recycle your wastewater ........................................................................................ 29 6.1 Customer views ................................................................................................................................... 32 6.2 Risk and resilience ............................................................................................................................... 33 6.3 Activities and costs ............................................................................................................................. 37
6.3.1 High consequence sewers .............................................................................................................. 37 6.3.2 Wastewater Network Management ............................................................................................... 37 6.3.3 Raising customer awareness........................................................................................................... 38
7 The natural environment is protected and improved in the way we deliver our service............................ 39 7.1 The natural environment is protected and improved in the way we deliver our service – Pollution. 42

Copyright © United Utilities Water Limited 2018
Chapter 7: Supplementary Document - S6008 unitedutilities.com
2
7.1.1 Customer views .............................................................................................................................. 42 7.1.2 Risk and Resilience .......................................................................................................................... 42 7.1.3 Activity ............................................................................................................................................ 43
7.2 The natural environment is protected and improved in the way we deliver our service – Treatment works compliance............................................................................................................................................. 43
7.2.1 Customer views .............................................................................................................................. 44 7.2.2 Risk and resilience........................................................................................................................... 44 7.2.3 Activities and costs ......................................................................................................................... 46
7.3 The natural environment is protected and improved in the way we deliver our service – Protecting the environment from the impact of growth and new development .............................................................. 48
7.3.1 Customer views .............................................................................................................................. 48 7.3.2 Risk and Resilience .......................................................................................................................... 49 7.3.3 Actions and Costs ............................................................................................................................ 52
7.4 The natural environment is protected and improved in the way we deliver our service – Improving river water quality ............................................................................................................................................ 57
7.4.1 Customer views .............................................................................................................................. 57 7.4.2 Risk and resilience........................................................................................................................... 57 7.4.3 Activities and costs ......................................................................................................................... 59
8 The North West’s bathing and shellfish waters are cleaner through our work and the work of others ..... 66 8.1 Customer Views .................................................................................................................................. 67 8.2 Risk and resilience ............................................................................................................................... 67 8.3 Activities and costs .............................................................................................................................. 71 8.4 Our totex plan to deliver the service .................................................................................................. 73
9 Plan Summary .............................................................................................................................................. 73

Copyright © United Utilities Water Limited 2018
Chapter 7: Supplementary Document - S6008 unitedutilities.com
3
1 Executive summary
This business plan provides details of our long-term strategy and AMP7 delivery plans for the Wastewater Network Plus price control. It provides additional details, at a price control level, of how we expect costs to map across customer outcomes and performance commitments and in particular provides detail of the activities we expect to undertake to deliver the targets we have proposed. This plan outlines how we will deliver an effective wastewater service from collecting over 3221 million litres per day of used water (from flushed loos, emptied sinks and showers) to transporting it along 77,000 kilometres of pipes and sewers to one of our 568 wastewater treatment works, before safely returning it to the rivers and sea. We take pride in being a responsible, collaborative and innovative company. We are trusted to provide a reliable wastewater service that is essential to the life and health of seven million customers across England’s North West. We are proud to have been recognised as a leading Water Company for the last three years in the Environment Agency’s Environmental Performance Assessment (EPA). We recognise that maintaining this is extremely important yet challenging as expectations of customers and regulators grow. We will continue to achieve this status by embracing new ways of working that focus on getting the most out of the assets that we own and operate. We constantly confront the wastewater challenges faced across the North West, one of Britain’s most geographically diverse regions. Some of these challenges are longstanding, but others are new and emerging. Our job is to meet these in a way that is affordable for customers today - but is also sufficiently robust to ensure future generations benefit from innovations that underpin all that United Utilities strived for in the future. After considering the efficiency challenges and balancing the needs of customer, the Totex requirement for the Wastewater Network Plus price control is £2,614m, which is £237m less than AMP6. The breakdown of this investment is as follows: -
What we’ve delivered in AMP6 • Proven track record in delivering industry leading pollution performance • We have developed a UK leading approach to integrated catchments solutions • Strong environmental performance, with a top 4* rating as measure by the
Environment Agency for 3 years running • Embraced a partnership approach to innovation and solution development What we’re delivering in AMP7 • We will deliver great service for £237m less compared to AMP6 through innovation,
efficiency and use of market mechanisms • We will sustain industry leading pollution performance and share our experience and
knowledge in this area • Embedding our industry leading integrated catchment approach to deliver natural
capital benefits for customers and the environment • We will deliver a step change in flooding performance through a system thinking
approach and by embracing behavioural science

Copyright © United Utilities Water Limited 2018
Chapter 7: Supplementary Document - S6008 unitedutilities.com
4
Outcome Opex (£m) Capex (£m) Totex (£m)
Maintenance Enhancement
The natural environment is protected and improved
670 530 673 1873
We will reliably collect and recycle your wastewater
357 15 35 407
The risk of sewer flooding for homes and businesses is reduced
209 11 102 322
You’re highly satisfied with our service and find it easy to do business with us
3 4 5 12
Total 1,239 560 815 2,614
Figure 1 summarises how AMP7 totex has been mapped across to the level of service provided to our customers. (from test 7 document)
Through our Helping Life Flow Smoothly approach we have set ourselves exacting goals that are aligned to what we know to be important to customers through continuous and ongoing engagement. Key points that our plan will deliver are: -
• We know we must do more to tackle sewer flooding now and plan for the future demands from growth and climate change. Customers tell us this is a priority for them and we have developed a balanced programme of seeking surface water removal opportunities, partnership working, greater use of technology and customer awareness programmes on flushing products that contribute to the problem and increasing capacity and storage. This plan includes a stretching reduction target over a 10-year period that will deliver a 57% reduction in the incidents of internal flooding making a great difference to the customers of the North West.
• We will continue our development of systems thinking, which is looking to optimise everything we do
from the point where we receive wastewater to when it is safely returned to the environment. We believe this improves resilience and reduces operating costs, despite strong pressure from rising costs of power, chemicals and rates. An example of this is the complete full roll out of our innovative Wastewater Network Management (WwNM) programme which is planned for AMP7.
• We recognise and embrace the crucial role we play in supporting economic and housing growth
across the North West. Effective and timely investment is central to ensuring we meet expectations now and for the future.
• Recognising our role in serving customers, we have challenged ourselves and negotiated with the
Environment Agency (EA) about the scope of this plan. We have agreed an environmental improvement programme to be delivered in the five year period that will continue to improve the rivers, shellfish and bathing water quality for the benefit of customers and visitors to the North West as well as society as a whole.
• We have a dedicated innovation team who look worldwide to seek out new ways of working and new
technologies. This focus on new technology and ways of working has come together to develop our innovative Integrated Catchment Approach. As demonstrated initially in the Petteril, this methodology is challenging the standard approach to delivering environmental schemes and

Copyright © United Utilities Water Limited 2018
Chapter 7: Supplementary Document - S6008 unitedutilities.com
5
developing new techniques to meet permit standards. Working with the EA and other partners we are considering our service and environmental risks in the widest sense. This ensures we identify the most cost-effective outcome for customers even if this involves delivering solutions that are into the wider catchment and on partners’ land.
• We recognise that meeting stretching performance standards cannot be done in isolation and we
need to engage to a greater degree with stakeholders to work in productive partnerships. Strong relationships are supporting the delivery of efficient and effective ways of working that we will build on in AMP7.
• We have set challenging performance commitments to ensure we are delivering the service
customers want, for example we will push the industry forward by stretching performance related to managing blockages and pollution incidents. Then where we face challenges, such as the number of sewer flooding incidents, we have committed to achieve a step change in performance.
• Customers are rightly concerned about some of the resilience hazards facing the services we provide
to them, such as flooding and impacts of climate change. We have systematically reviewed the risks faced and have developed a balanced strategy that seeks to reduce these risks over time whilst avoiding a peak in customer’s bills.
• Our research has shown that 21% of customers have flushed unflushable items down the toilet due to
lack of understanding. Therefore in the next business planning period we plan to have our biggest ever customer awareness campaign on “flushables” to help reduce the risk of flooding and pollution.
• We have set out a plan in AMP7 that will invest £2,614m. This will focus effort and investment
around customer priorities such as flooding and tackling the causes of flooding and improving the rivers and lakes of the North West. We have stretched ourselves and have concluded a plan that results in risk being largely managed by ourselves and not being passed on to customers. Particularly on maintaining our wastewater treatment works, we have understood and quantified a large level of risk and set a stretching target that we will strive to meet through using situational awareness processes, proactive maintenance and operational interventions.
• We have tested our service and costs extensively to optimise the balance between carrying out the
work ourselves, using our supply chain and ultimately delivering our service at the lowest possible cost.
2 Business Context – the wastewater service
We are the wastewater service provider supplying the people and businesses across the North West of England. We serve over 7 million customers from Crewe to Carlisle. More than half of customers live in the large cities of Greater Manchester and Liverpool. Large populations are also found in urban areas of south Lancashire and the Fylde coast around Blackpool who enjoy the improving bathing waters along with thousands of visitors to the region every year.
Additionally, we support around 200,000 businesses (non-household customers) across the region that have a range of needs in-terms of scale and complexity of their discharges. The region is home to the largest proportion of manufacturing industry in the UK, with 13% of UK manufacturing industry located in North West England. These businesses require robust wastewater services and we manage the largest volume of trade effluent from these businesses every day. The North West has one of the highest levels of deprivation in the UK and many of our customers consider utility bills a burden, so we will strive to minimise our costs to ensure we are doing all we can to keep bills as low as they can be.

Copyright © United Utilities Water Limited 2018
Chapter 7: Supplementary Document - S6008 unitedutilities.com
6
Understanding the customers we serve is important to us, it is also essential to building a plan that meets expectations of as many customers and stakeholders as possible.
2.1 Current and future drivers The range of drivers facing the Wastewater Network Plus price control can be summarised under the four categories of customer expectations, resilience, environment and efficiency as shown in Figure 2. At the same time as driving to deliver our service for a lower cost to keep bills affordable we will also need to deliver a higher level of service if we are to meet customer expectations and play our role in protecting the environment. Crucially we must do so in a way that enhances the resilience of the services we provide at a time when pressures such as climate change, population growth and an ageing asset base are faced. Such challenges need to be managed over a long-term horizon, which is why in PR14 we set out a multi AMP approach to delivering the Water Framework Directive (WFD) and why the industry needs to embark on the development of Drainage and Wastewater Management Plans (DWMP) based on the long-term planning framework currently under development through the 21st Century Drainage project.
It would not surprise people of the North West to hear that they live in one of the wettest regions in the UK. Five of the top 10 wettest urban areas are in the North West. The rainfall patterns that we experience add additional risks for us to manage when compared to other regions. This is particularly relevant when considering risks from flooding, pollution and bathing and river water quality.
The annual average amount of rainfall and the volume of runoff subsequently generated are among the highest in England and Wales when compared to other company areas (see Figure 3). Furthermore, factors such as soil type, size of urban areas, location of urban areas between steep areas to the east and flatter, coastal areas to the west all add complexity. These factors also have a significant influence on the amount and configuration of wastewater drainage assets we have to manage in addition to the legal, regulatory and customer requirements.
City Average Rain Days
Preston 153.2
Manchester 151.7
Cardiff 148.6
Carlisle 148.6
Gloucester 145.6
Blackpool 145.5
Liverpool 144.3
Stoke on Trent 143.6
Figure 2 key drivers facing Wastewater Network Plus now and in the future

Copyright © United Utilities Water Limited 2018
Chapter 7: Supplementary Document - S6008 unitedutilities.com
7
Plymouth 142.1
Sheffield 131.6
This results in greater risks when compared to other companies due to amount of runoff flowing into combined networks, and the speed with which this occurs. In order to preserve the integrity of treatment processes and adhere to capacity limitations, large storage volumes have to be provided to attenuate flows. Storage volumes are also required to prevent spills from combined sewer overflows (CSOs). We have the second highest number of CSOs and among the highest network storage volumes in the industry. Furthermore, UU has the highest proportion of combined sewers, which means the impact of rainfall on these combined sewers is more pronounced compared to separate systems.
Rainfall in the north and west of the country is an external factor that is adding additional risk onto our wastewater system (more detail on this is included in the wastewater cost adjustment claim, ref: UUW_WwN1_M). Through spill investigations in AMP7 and developing our DWMP we are tracking the risk of additional interventions at our overflows.
Over the last 25 years through our investment and operational improvements, as well as the significant work of partner organisations, great improvements have been made to coastal and inland waters. Customers value these waters as they are now cleaner than at any time since the industrial revolution. Despite these great improvements and huge contributions we have made to the environment of the North West, we recognise there is still more we have to do which also includes contributions from partners.
The nature of farming in the North West is predominantly dairy or hill farming which has impacts for both environmental quality and on our ability to recycle biosolids to land. The impact of this land use on biosolids recycling is that only 50% of agricultural landbank is available for biosolids recycling (see Figure 4). More on this is described in the Bioresources Price Control document ref: S6009.
Additionally, the natural waste from livestock has the potential to run off the land and add additional nutrient load to the rivers. This agricultural load then combines with discharges from the wastewater treatment system to put pressure on aquatic ecosystems. Agricultural runoff and wastewater discharges are therefore two of the key influences on the fact that large stretches of the rivers of the North West are still in need of improvement to meet the standards as set out in the WFD. This presents challenges in meeting ‘good’ status for measures such as phosphorus and ammonia. Improvements required at our wastewater treatment works are getting more onerous and expensive to deliver and operate. Therefore, we recognise that meeting water quality standards cannot be done in isolation and we need to work with partnerships to develop solutions that are more efficient. You can read in more detail about our approach in the Integrated Catchment Approach section of Ecosystem resilience approach ref: S4004, which is also summarised in this chapter.
Figure 4 Landbank availability for biosolids recycling
Figure 3 UK rainfall patterns

Copyright © United Utilities Water Limited 2018
Chapter 7: Supplementary Document - S6008 unitedutilities.com
8
The other key challenge in terms of meeting good status under the WFD (see Figure 5) is to manage the impact of our combined sewer overflows. This is a particular challenge in the North West due to the levels of runoff into the combined sewer system. Finding cost beneficial solutions to address these overflows presents a significant challenge which we recognise requires innovation. We have already started work on this at our Wetlands Research Centre, which forms part of our River Weaver integrated catchment demonstration. More information on this is included in S4004 Ecosystems resilience approach section 3.2.3. While we need to work ever closer with partners to deliver efficient outcomes we are committed to playing our part of the improving environment of the North West and meeting our environmental legal duties.
As well as phosphorus being a challenge to good water quality status, we are actively engaged with research and studies that are investigating emerging risks such as chemicals and micro-plastics. We support national projects to understand the issues and potential contributions that may be required from us as wastewater provider to the people and the environment of the North West. We positively contribute time, expertise and resource into these studies to ensure we are cognisant of risks and are planning appropriately to manage future demands on our services.
Growth and development is an external factor that we monitor carefully and engage with planning authorities at all levels to understand. Resident population in the North West is forecast to increase by over 1 million (from 7.2 million) by 2045 according to local authority planning information. The increase for each local authority and our approach to managing this risk is described in detail in performance commitment C06 – WWN Protecting the environment from growth. The growth forecasts in the Salford and Cheshire areas are some of the highest with lower levels of growth in some parts of Cumbria where there is less potential for additional housing. Over 136,000 total new connections are forecast on our supply area between 2020 and 2025. As wastewater treatment catchments are usually discrete from each other there is very little scope to offset lack of capacity in areas of high growth with spare capacity in areas with less growth pressures.
In addition to new development, trade effluent forecasts indicate that volume will increase over the next 25 years reaching the levels last seen in 2009 (following some decline since 2008). There may also be local variations in the additional trade load where trader types change or individual traders increase their output. The government’s modern industrial strategy green paper also has a clear ambition to drive growth across the country that may increase levels of trade in some locations. We engage closely with the industrial sector through our Trade Effluent team who manage inputs into the system and also liaise with industrial customers to gather intelligence on emerging trends
2.2 Engagement with Bioresources In preparation for 2020 we have worked closely with Bioresources to define ways of working to ensure we maintain an efficient and effective end-to-end production line and a clear commercial interface through a new Client Services function. This will focus on ensuring Wastewater Network Plus has the appropriate capability in order to fully define its expectations and drive Bioresources to be client focused and deliver a cost beneficial service.
Figure 5 Water Framework Directive river classifications

Copyright © United Utilities Water Limited 2018
Chapter 7: Supplementary Document - S6008 unitedutilities.com
9
End-to-end production line thinking allows both business units to work efficiently, account for regulatory changes, benchmark against best practice and exploit opportunities in an integrated way across wastewater. This will include areas such as resource recovery, catchment solutions and delivery against the Enhancing Natural Capital Value for Customers performance commitment.
We have set the boundary between the two business units based on RAG4 guidelines and have trialled ways of operating commercially. This included a strategic pilot with a non-regulated Bioresources business and the development of service level agreements between Bioresources and Wastewater Network Plus. Both have been successful and allowed us to develop effective levels of service to drive the right outcome for customers.
Service level agreements were deployed in 2018 and will be fully embedded by 2020. They include liquor treatment charging to Bioresources using trade effluent consenting, energy charging to Wastewater Network Plus using power purchase agreements, sludge quality and quantity and sludge removal transactions at the boundary and Bioresources tenancy of Wastewater’s land and facilities.
Costs for Bioresources to treat sludge will vary by sludge treatment centre and by the quality and quantity of sludge produced. The development of site specific charges will be explored during the next business planning period in preparation for full market opening.
2.3 Transfer pricing between Wastewater Network Plus and Bioresources
We believe that our approach to transfer pricing supports the development of Bioresources markets and is in line with the appropriate regulatory accounting guidelines (RAG 5). We will ensure that there is no cross-subsidy between price controls. Costs and revenues crossing the price control boundary will be reported in our annual regulatory accounting data.
Transfer prices are set to include, as a minimum, incremental costs and an appropriate share of the margin. In setting our prices, the extent to which incremental costs need to take account of the potential cost of increasing capacity will depend on the length of the commitment to provide capacity.
The general principle we will apply is that transfer prices will be based on market prices, where possible. This will apply to energy flows and liquor treatment charges. When sludge liquors are returned to a wastewater treatment works, the activity of treating the liquors is a Wastewater Network Plus activity but the cost of treating liquors should be paid for by Bioresources. We believe that marginal costs are inappropriate for this charge as they would not be fully cost reflective. We are using a Mogden based formula as the calculation will be cost-reflective, transparent and provide a level playing field with third parties. As a result liquor costs in the next business planning period are £47m or 13% of the Bioresources £372m totex plan. For further information see S6009.
3 Strategic overview 3.1 Our performance in the 2015-2020 period We are rightly proud of our top 4* rating we have with the EA. The EA collects environment performance data annually from the nine English water and sewerage companies.
This data is collected for the following measures for Wastewater Network Plus:
• Pollution Incidents (Sewerage) • Serious Pollution Incidents (Sewerage) • Discharge Permit Compliance • Self-Reporting of Pollution Incidents • National Environment Programme Delivery

Copyright © United Utilities Water Limited 2018
Chapter 7: Supplementary Document - S6008 unitedutilities.com
10
These measures are then colour coded using a traffic light system and form the overall performance rating. We have been awarded a rating of 4* stated as a “Leading Water Company” based on the results listed below for three years in a row. We are proud of this standard but know that maintaining this is extremely important yet challenging as expectations of customers and regulators grow: -
Maintaining and building on this strong performance underpins the AMP7 plan as we have a key role to play in sustaining these improvements by ensuring we always recycle our wastewater back to the environment in line with our permits. Whilst delivering great environmental improvements we have also recognised and embraced the efficiency challenge. We have transformed the wastewater business to deliver great performance to customers within a stretching budget. In addition to our environmental performance, our successful innovations have seen us delivering industry leading performance so far in the current Business Plan period for blockage and collapse numbers and we now want to push the frontier even further. We have achieved the reduction in blockage, collapse and pollution incidents through implementing our Wastewater Network Operating Model. The benefits of these innovations in technology and technique is leading to improvements in service this business plan period, 2015 to 2020. However, there are interventions that we have not been able to carry out. These risks are being controlled but we are carefully monitoring the risk we are managing on behalf of customers.
3.2 Summary of ODIs in the 2015-2020 period The suite of outcome delivery incentives (ODIs) shown in (Figure 7) have been the main measures of our performance in the 2015-2020 period. We have reported these measures as indices that we will break out in the next period to make our performance reporting more transparent.
The stretching target that we set against the Sewer Flooding Index has proved challenging because individual impacts on specific sub-measures have masked good performance against others. That said we know we must make improvements to our internal flooding performance and we have set stretching targets for AMP7. Whilst we have improved our treatment works compliance over the last three years we are forecasting a penalty in the final year of the AMP as the target becomes more onerous as only two treatment works failing
Figure 6 EA performance rating

Copyright © United Utilities Water Limited 2018
Chapter 7: Supplementary Document - S6008 unitedutilities.com
11
their permits could lead to penalties being incurred if they are the larger treatment works. Again, we know this is an area where we need to target improved performance if we are to meet customer expectations, retain our Environment Agency 4*status and avoid penalties both in AMP6 and AMP7.
Performance Commitment
Actual incentive value Predicted incentive value Projected AMP6
Year 1 Year 2 Year 3 Year 4 Year 5
S-A1: Private sewers service index
£7.4m £7.4m £7.4m £7.4m £7.4m £36.9m
S-A2: Wastewater network performance index
£0.0m £0.0m £0.0m £0.0m £0.0m £0.0m
S-B1: Future flood risk Reputational Reputational Reputational Reputational Reputational Reputational
S-B2: Sewer flooding index
-£1.5m £0.0m £0.0m -£8.9m -£8.7m -£19.2
S-C1: Contribution to bathing waters improved
£0.0m £0.0m £0.0m £0.0m £0.0m £0.0m
S-D1: Protecting rivers from deterioration due to population growth
£0.0m £0.0m £0.0m £0.0m £0.0m £0.0m
S-D2: Maintaining our wastewater treatment works
£0.0m £0.0m £0.0m £0.0m -£4.4m -£4.4m
S-D3: Contribution to rivers improved (Km)
£0.0m £0.4m £0.4m £0.1m -£0.1m £0.8m
S-D4a: Wastewater (category 1 & 2) pollution incidents
£0.0m £0.0m £0.0m £0.0m £0.0m £0.0m
S-D4b: Wastewater category 3 pollution incidents
£3.3m £3.3m £3.3m £3.3m £3.3m £16.4m
Wastewater Service net (outperformance payment)
£9.2m £11.1m £11.1m £1.9m -£2.5m £30.5m
Figure 7 Performance Commitments; current performance and forecast for AMP6
3.3 Our strategy for AMP7 and beyond To meet customers’ expectations in the 2020-2025 period and for the future we must ensure that we invest wisely and efficiently. Chapter 7 – Securing efficient cost, describes in detail how this will be achieved, but we outline the key principles below to provide important context for the following sections.
3.4 Customer Strategy Our customer strategy for the Wastewater Network Plus price control will focus on the following priorities:
Trust and transparency – Whilst levels of trust are reasonably high we know this cannot be taken for granted and therefore we have developed performance commitments for AMP7 with transparency in mind which has resulted in the removal of index based measures. More detail on this can be found in Chapter 5 Great service to customers. Additionally we are targeting retaining our 4* leading company status under the Environmental Performance Assessment (EPA) as this gives customers and stakeholders confidence that we are an environmentally responsible company.
Engaging with customers – Research has shown that awareness amongst customers of actions they can take in their homes to reduce the risk of flooding and environmental pollution is low. Despite efforts over a

Copyright © United Utilities Water Limited 2018
Chapter 7: Supplementary Document - S6008 unitedutilities.com
12
prolonged period we found that 82% of customers have not heard any communication around what not to flush As a result we have undertaken research using behavioural economics to redesign our approach to engaging with customers so they can help play their part in reducing the risk of these types of incidents. We have also developed a performance commitment, which targets a 10% increase in customer awareness of this issue during AMP7. Further detail on this is in G04 WwN Raising customer awareness to reduce the risk of flooding.
Affordable bills – We recognise the affordability constraints for many of our customers and have therefore prioritised finding innovative ways to enhance service levels whilst not putting additional burden on customers’ bills. More information on this can be found in Securing efficient cost – Chapter 7.
3.5 Systems thinking This section summarises information covered in Securing long term resilience – Chapter 4, Using markets and innovation – Chapter 6 and S4004, Ecosystem resilience approach. Greater detail is provided here on Wastewater Network Plus specific projects and opportunities. We are committed to our long-term strategy to embrace Systems Thinking in how we run our service, as we believe this provides the right platform to deliver the best quality service at the lowest cost. We are leading this innovative approach in the industry, and are already benefiting from historical investment in capability and infrastructure, through our Future Concept of Operations (FCO) initiative. FCO has laid the foundation for further developments within our Systems Thinking programme. This work will build on our established approach of operating our business as production lines within geographical areas which are supported by technical expertise and centralised support services in our Integrated Control Centre (ICC). In AMP6 we will have significantly enhanced our understanding and control of asset running costs from implementing transformation projects which include; Remote Monitoring Control, Mobile Asset and Resource Scheduling (MARS), Unit Cost of Treatment, Energy Neutrality Project, RSOMS, Maintenance Strategy, Operational Engineering. We plan to build on this to move towards an end to end ‘systems’ view of the production line to ensure they are optimised, supported by dynamic integrated modelling tools to allow us to balance our service performance whilst minimising cost. Using production planning approaches we will focus on having the right resources in the right place to deliver service at an efficient cost and can easily explain variances in cost due to external factors e.g. weather. As we get increasing remote monitoring control capability, particularly on our network, we will move to a more proactive approach of managing incidents which have the potential to impact customers. Further information on our plans can be found in Systems thinking capability E06-CF. The section below describes our integrated catchment strategy, which embraces the system thinking approach and will underpin our AMP7 plan.
3.6 System thinking and our Integrated Catchment Strategy This section summarises information covered in S4004 Ecosystem resilience approach, which includes our approach to the natural environment, recognising the long term benefits of a resilient environment, taking a systematic approach and adopting Natural Capital thinking.
Catchment approaches and strategies have become established in the water industry over the last few years, however supported by the EU funded Natural Course programme we have developed a strategy that pushes the frontier of industry thinking. Our approach looks across price control boundaries and looks for a broader range of opportunities. This is now a fundamental part of our thinking and it underpins our improvements planned for the wastewater business, particularly for improvements to water quality where we have achieved most success. This is a summary of the strategy which to date has been successful for Wastewater Network Plus, primarily in tackling the need to meet the phosphorus standards under the WFD. However, as we mature our capability with our integrated approach we are already targeting other determinants, managing spills and flooding by applying these principles.
Underpinning the strategy is an understanding that improving water quality standards cannot be met in isolation and that wider environmental pressures, such as flooding and climate change, must be considered as these affect the environments and the communities that live in them. Therefore, a more holistic and

Copyright © United Utilities Water Limited 2018
Chapter 7: Supplementary Document - S6008 unitedutilities.com
13
collaborative approach is required in order to make catchments and communities more resilient to these pressures. We are expanding our catchment management approach beyond our WFD obligations, to drive for more integrated and sustainable solutions that deliver long-term benefits, thereby contributing to a more resilient North West. This means that as we address our regulatory requirements, we will be applying our integrated catchment approach to develop solutions that sustainably treat phosphorus and other nutrients, whilst also delivering additional natural capital benefits.
Our long-term ambition is to act as catchment system operator in which we will dynamically balance, in real-time, the operation of our assets and catchments with actions taken by third parties
This moves us away from a linear model of asset versus catchment and towards a more integrated approach, promoting catchment markets and multiple sources of environmental investment, driving sustainability and catchment resilience. Through this approach, we are exploring opportunities to use alternative market mechanisms and innovative business models to incentivise different ways to deliver catchment improvement. For all the examples of how we are developing models for catchment system operation please see S4004, Ecosystem resilience approach.
As a leading example of the approach we are co-developing a market platform with other partners and piloting it in our Eden catchment, through our strategic Petteril project. This is informing Defra’s catchment Pioneer in Cumbria (Figure 8). We are at the centre of this trial, leading on the proof of concept and drawing in potential other private sector investors, e.g. insurance and supply chain sectors.
Whilst there are challenges to overcome to take this approach to maturity, we have an established strategy and we will work through the challenges systematically as we recognise the wide-ranging benefits for customers, the environment and for cost effective project delivery.
3.7 Natural capital approaches We recognise the importance of the inclusion of natural capital approaches in Defra’s 25 year plan for the environment. As a water company with a strong dependence on the health of ecosystems, we have already
Figure 8 Catchment system operator pilot in the Eden catchment (delivered through the Petteril project)

Copyright © United Utilities Water Limited 2018
Chapter 7: Supplementary Document - S6008 unitedutilities.com
14
taken a number of steps in developing our capability in this area in order to protect and enhance the resilience of the services we deliver. These approaches are embedded within our Integrated Catchment Strategy.
Our natural capital approaches include:
Natural Capital Accounting – incorporating natural capital and ecosystem services into decision-making processes. Examples of natural capital accounting activities supported by Wastewater Network Plus include:
• Development of natural capital account and associated model for the Petteril catchment enabling different interventions to be modelled and valued
• Corporate natural capital account in development for our landholding Natural Capital Solutions – solutions that enhance natural capital to provide multiple benefits e.g. green infrastructure as an alternative to hard engineering. Examples of Wastewater Network Plus natural capital solutions include:
• Green solutions linked to the integrated catchment approach in the Petteril catchment • City of Trees installations with water quality and flood risk benefits in Greater Manchester through
Natural Course • Instrumental in guiding Natural Course/Business in The Community sustainable drainage for schools
project • Development of AMP7 integrated catchment approach programme, supported by an innovative ODI,
see performance commitment C08-CF Enhancing natural capital value for customers.
Engaging, understanding and working with stakeholders is key to piloting these approaches, especially when looking at how to target and co-design the best solutions within a catchment and how to co-deliver them in the most effective way. These pilots will enable us and stakeholders, to see how to make the most of natural capital approaches over the next few years. Further detail on our approach can be found in S4004 Ecosystem resilience approach section 7.
3.8 Our AMP7 ambition for integrated catchment AMP6 has seen a significant step forward in our understanding of how to collaborate successfully with others to drive better solutions for more resilient ecosystems. We are building on our successes to drive this approach further and deliver an ambitious programme for AMP7 (Figure 9), including a performance commitment to incentivise delivery of schemes through natural capital approach. The programme prioritises schemes in 13 sub-catchments across the North West, with five named in the Water Industry National Environment Programme (WINEP) (used as the baseline for calculating our bespoke Natural Capital performance commitment). We are also taking the opportunity to influence schemes in another 15 sub-catchments during AMP7. The visual below outlines the key Wastewater Network Plus projects delivering now and in AMP7: -

Copyright © United Utilities Water Limited 2018
Chapter 7: Supplementary Document - S6008 unitedutilities.com
15
The benefits of the intergrated catchements are wide reaching for cuastomers and the environment and with leveraged funding will seek out cost effective and partner driven solutions. The strategy underpins the Wastewater Network Plus plan for 2020 to 2025, with particular emphasis and opportunity on river water quality schemes identified through the WINEP, which influences the outcome; ‘The natural environment is protected and improved in the way we deliver our services’. This outcome is described in section 4 of this document.
3.9 Approach to operation and maintenance of assets to deliver a cost effective service
A cornerstone of our approach will be to undertake more proactive maintenance work and consequently reduce reactive maintenance. By 2019 we will have delivered and embedded MARS enabling better workforce mobilisation and data capture. This will ensure a feedback loop from work undertaken and informing and optimising future maintenance activities ensuring that it is carried out at the right time and frequency, prioritising the most critical assets. This will look to extend the asset life and identify potential failures before they occur giving a more robust service to customers.
Figure 9 Some of the schemes proposed for our integrated catchment programme in AMP7

Copyright © United Utilities Water Limited 2018
Chapter 7: Supplementary Document - S6008 unitedutilities.com
16
We will also detect adverse trends through the increased use of remote monitoring and control, deterioration modelling, automation of processes and forecasting tools; this will give us visibility of all aspects of how the treatment works is performing and allow proactive intervention only when necessary. This is being implemented by the increased centralisation and monitoring from our ICC and local hubs. This drives consistency in our approach across the region with our skilled workforce monitoring the data and performance of our sites remotely. Our escalation process, which ensures any issues are captured, raised and addressed before they become failures closes the loop when issues are identified.
We will extend asset lives and detect functional failure (when subcomponents fail that will eventually lead to treatment works failure) through:
• increased operational engineering field teams • upskilling our Field Service Engineers • improved condition based monitoring • creation of an enhanced risk capture and prioritisation system
This will enable a more intelligent work bank for effective scheduling of maintenance activities. This will allow us to maintain more for less.
3.10 Our risk management framework A best practice integrated risk assessment process enables us to be proactive and prepared with risks prioritised in order of importance. Our risk management framework incorporates a number of aligned top-down and bottom-up processes that are used to analyse, capture and escalate risks within the business. This aligns to our business risk management framework that follows an enterprise-wide approach and is discussed in detail in Securing long-term resilience – Chapter 4.
The framework used to develop this plan includes:
• Wholesale Risk and Asset Planning (WRAP): Our process to identify risks and issues, identify and monitor strategic performance requirements, and prioritise these for investment or operational management.
• Internal risk assessments (RADAR). • For assessing drainage risks we have Integrated Drainage Area Strategies (IDAS) that are building
on the robust foundation of Sewerage Management Plans (SMPs) • All risks identified are captured using our risk register and are entered onto our investment
prioritisation tool.
We have developed our plan by identifying risks using both bottom up and top down processes, including internal studies and research with external bodies. Through extensive engagement with customers we have established strategies, programmes of work and individual projects to manage these risks. By embracing innovation and robust testing of costs – see Chapters 6 Using markets and innovation and Chapter 4 Securing long-term resilience – we have shaped these into a plan which is the best value for customers.
3.11 Long term planning to address key resilience threats We recognise the importance of long term planning in addressing some of the key risks that have the potential to impact the services we provide to customers. The detail of how we assess and manage key risks to our operational performance is set out in S4005 Operational Resilience. A key focus for us is the long term resilience of the drainage system to continue to deliver service to customers whilst also protecting the environment. In the current AMP, we have developed an asset risk assessment process, based on the Drainage Strategy Framework (DSF), called IDAS which covers our drainage system and in the next Business Plan period we will build on this approach to produce detailed DWMPs for the North West. We will apply the DWMP framework and use tools developed as part of 21st Century Drainage across our region.

Copyright © United Utilities Water Limited 2018
Chapter 7: Supplementary Document - S6008 unitedutilities.com
17
4 Our AMP7 Plan Our forward-looking Wastewater Network Plus plan seeks to deliver enhancing service levels whilst at the same time reducing our costs. The following sections explain our wastewater plan through the customer outcomes we plan to deliver. We strive for a robust 25-year plan with a focus on how we progress to those long-term objectives in the next five-year period. Helping Life Flow Smoothly continues to underpin what we do and the long-term objectives evolve with this principle of supporting the life and health of the over 7 million customers we serve across the North West.
Our performance commitments address customer priorities with stretching targets to drive performance to new levels. The ODIs associated with these commitments are derived from valuations which are based on a wide range of customer research and provide the right incentives to deliver our targets, and outperform where this will be valued by customers.
The Wastewater Network Plus plan includes 13 performance commitments that cover four outcomes: -
The Wastewater Network Plus plan includes 13 performance commitments that cover four outcomes: -
1.The natural environment is protected and improved by the way we deliver our services 2.We collect and recycle your wastewater 3.The risk of sewer flooding for homes and businesses is reduced 4.The North West’s bathing and shellfish waters are cleaner through our work and the work of others
This section summarises information covered in Great service to customers - Chapter 5, Delivering long-term resilience - Chapter 4, Using markets and innovation - Chapter 6, Securing efficient costs - Chapter 7. It also provides greater detail on customer views and delivery at an outcome and performance commitment level.
5 Flood risk is reduced to homes and businesses In order to reduce the risk of flooding to homes and businesses we plan to invest £256m of totex in AMP7. The breakdown of this expenditure by performance commitment is shown in the diagram below. The key activities planned to deliver this outcome take place across our production line and are shown in Figure 10. The expenditure for these measures total at the outcome level with the addition of other costs which were not able to be attributed to a specific performance commitment such as Environment Agency fees and Business Rates.

Copyright © United Utilities Water Limited 2018
Chapter 7: Supplementary Document - S6008 unitedutilities.com
18
Figure 10 Key activities to deliver the outcome "The risk of sewer flooding for homes and businesses is reduced"

Copyright © United Utilities Water Limited 2018
Chapter 7: Supplementary Document - S6008 unitedutilities.com
19
Outcome: Flood risk is reduced to businesses and homes
Totex £256 million
expenditure required to deliver this
outcome.
Current Performance So far this AMP we have reduced the total number of flooding incidents across the region by 20%, reducing internal
incidents by 24% and, in our opinion, achieving upper quartile performance for external flooding incidents. We have delivered a balanced programme of work, increased customer engagement and targeted repeat flooding, which have
reduced by 54%.
Innovation A number of innovative approaches have been
trialled in AMP6 and will continue into AMP7 in order for us to achieve our stretching targets.
We will utilise the results from our Sustainable Drainage Systems (SuDS) mapping tool and work with our partners and stakeholders to manage the flow of
surface water into our systems, including surface water removal opportunities where they arise.
Our WwNM project has identified a number of areas to target which has also lead to innovative research
projects to influence customer behaviours.
Efficiency Every flooding incident is analysed in detail to determine the appropriate course of action with a focus on preventing repeat incidents; this has reduced repeat incidents by 54%. Proactive monitoring is a key part of the Dynamic Network Monitoring (DNM) and Visualisation projects that are part of Wastewater Network Management (WwNM) and our systems thinking approach. This allows us to get ahead of an incident occurring and reduce the risk.
Risks In AMP7 we are required to report all sewer flooding incidents, including severe weather incidents. The North West is especially vulnerable to extreme rainfall; see cost adjustment claim reference UUW_WwN1_M.
Summary Customers rightly view the removal of wastewater as a discrete service which should not interfere with their day-to-
day lives as a priority. Sewer flooding is one of the worst service failures that customers can experience and we understand the significant long-term impact flooding can have on customers in the North West. We are committed to
reducing the number of external flooding incidents that occur and our long term aspiration is to eliminate internal flooding incidents. We manage the risk of sewer flooding through business as usual activity and planned programmes of work but recognise improvement is needed and are committed to achieving upper quartile performance for sewer
flooding over the course of the next two AMPs.
The new DWMP documents, PIONEER and our balanced programme of work will all help manage all
risks associated with flooding and encourage partnership working with our partners and
stakeholder.
In addition, our commitment to jointly resolve flooding issues in partnership will create further efficiencies and benefits to customers.
This has to be viewed in the context that almost 39% (WtP,
2017) of customers find a change to their annual bill a more
important attribute than reducing internal flooding incidents, this is
lower for external flooding.
Customer Expectation Our customer research has shown
there is strong support for reducing the number of internal incidents (ranked 4th
highest in Customer Priority Research) and the majority recognise improving
sewer flooding performance as an essential area to prioritise (57%,
Customer Priority Research).
Our sewer flooding reporting process has developed over a number of years from lessons learned and is under continual review to confirm it remains up to date, customer focused and robust. We believe this is an industry leading process and we will continue to investigated and report to this methodology in AMP7. We have calculated upper quartile flooding targets using historical data that we know includes inconsistency in reporting approach across the industry. We are committed to industry workshops to work through these inconsistencies and manage the risk.
G01-WWN G02-WWN GO3-WWN
G04-WWN G05-WWN G06-WWN
Performance Comittments Technical Document – S3001
!

Copyright © United Utilities Water Limited 2018
Chapter 7: Supplementary Document - S6008 unitedutilities.com
20
5.1 Customer views Customers are clear in their expectation that we should reduce sewer flooding Sewer flooding, in particular internal sewer flooding, is one of the worst service failures that customers can experience and our long term aspiration is to ensure zero internal flooding incidents. The rate that we are able to achieve this has been shaped by the results of our specific research and customer engagement programme on flooding. We have used this to establish customers’ priorities and the value of any improvement against other areas of the service we provide to those customers. We have then used this insight to inform both how we address sewer flooding in our plan and in setting performance targets and incentive rates.
The use of different research approaches has enabled us to ascertain differences across customer demographics and households in addition to any geographic variations. It is clear that sewer flooding is a big issue for many customers and stakeholders and there is strong support for reducing the number of internal incidents (see Figure 11).
Customer Research: High level outcomes Customer Priorities Research (“YourChoice”, June 2016)
• Internal sewer flooding was given a priority of 4th highest out of 26 for improvement in service– the highest value for wastewater
• 57%, the majority of customers, identified sewer flooding performance as an essential area to prioritise
Willingness to Pay (June, 2017)
• 38.6% of customers finding a change to their annual bill a more important attribute for improvement than internal flooding (5.6%) and external flooding (3.7%)
• Internal flooding was ranked 6th out of 10 attributes for relative importance of different aspects of our service
Repeat Flooding Research (August, 2017)
• Repeat flooding is considered five times worse than a one off event. Immersive Willingness to Pay (November, 2017)
• Higher valuations were placed on sewer flooding due to the flood scenario experience • Customers with young children or over 65 were more in favour of prioritising
preventing sewer flooding
Figure 11 United Utilities customer research highlights
In summary, this informs that although customers recognise that reducing sewer flooding incidents, in particular internal flooding, is an important issue, it is not considered as important as a change to their annual bill. This section summarises information found in the customer focus section of G01-WWN, G02-WWN, G03-WWN, G04-WWN, G05-WWN and G06-WWN.
Based on our extensive research, we have listened to our customers and recognise how important reducing internal sewer flooding is to them in respect of their wastewater service. We fully understand the emotional impact that this issue can hold for them. As a result we are working to build on the reductions achieved so far in the current Business Plan period and have a 10 year strategy, targeting further significant reductions in flooding incidents which balances this desire with affordability.

Copyright © United Utilities Water Limited 2018
Chapter 7: Supplementary Document - S6008 unitedutilities.com
21
5.2 Risk and resilience We will continue to transition from reactive to proactive ways of working enabling us to manage our risk better This section summarises information contained in S4005, section 7.2. In the current Business Planning period, we have laid the foundations for a step change in performance. We delivered a pilot of our innovative WwNM programme which we will roll-out fully in the next AMP. This new approach will allow us to understand our system in real time allowing us to manage flood risk in a proactive way. For more information on the WwNM approach please refer to (see case study 2, Innovation in action – S5001).
In the current AMP, we developed an asset risk assessment process based on the DSF and in combination with the principles of WwNM, called IDAS. In the next Business Plan period we will build on this approach to produce detailed DWMPs for the North West. We will apply the DWMP framework (see Figure 12) and use tools developed as part of 21st Century Drainage across our region. This approach will help us to identify and prioritise flood and pollution risk, engage with stakeholders and identify long-term solutions to manage risk and ensure long term resilience. We will be assessing the impact of long-term pressures on our network performance in vulnerable areas as part of the development of these plans. This will identify areas where interventions are required to maintain and improve of level of service in this area. These plans will then be used to inform our Business Plan for the period 2025 to 2030.
We also assess risk using PIONEER (our asset investment forecasting and decision support tool) modelling which is our approach for applying the Common Framework for Capital Maintenance Planning. PIONEER is a modelling tool which uses asset data to predict the long term performance of company assets based against expenditure and service risk targets over 25 years. The programme is used to model and predict optimal refurbishment, replacement and other interventions for our assets.
Figure 12 Journey to development of DWMP approach in United Utilities

Copyright © United Utilities Water Limited 2018
Chapter 7: Supplementary Document - S6008 unitedutilities.com
22
PIONEER outputs enable us to target the delivery of the service that customers require across the next 25 years, whilst striking the right balance between cost and acceptable levels of risk. More information on PIONEER can be found in S4005, section 3.2.1.
To aid our understanding of flood risk, we are updating our hydraulic models and the extent of our model coverage; by the end of AMP6 we will have full model coverage of the region. We already have high coverage of 2D models across the region which allow us to predict overland flow patterns simulating flooding more accurately.
In the current Business Plan period we have worked collaboratively with the local authorities, the EA and other key stakeholders to understand the risk of third party assets and activities and to identify opportunities to reduce flood risk; this is key due to the interconnected nature of flood risk. Moving into the next Business Plan period, we will continue to embed a holistic catchment based approach, with our innovative software developments, to deliver multi-agency sustainable solutions which deliver multiple benefits to customers.
A large proportion of our flooding incidents can be traced back to customer behaviours such as the flushing of wet wipes; we are entering into a new arena of behavioural science, we can influence behaviours through customer engagement, building on new encouraging research. As well as this, approximately 10% of incidents can be labelled as beyond our control, including those caused by interference by third parties. There is extensive evidence from other behavioural studies that shows levels of awareness can deteriorate if communications are not maintained. Despite these issues, we believe managing the risk at source is the best way to reduce blockage numbers in the long term and is a process we are committed to following.
Our sewer flooding reporting process has developed over a number of years from lessons learned and is under continual review to confirm it remains up to date, customer focused and robust (see Figure 13). We believe this is an industry leading process and we will continue to investigated and report to this methodology in AMP7. We have calculated upper quartile flooding targets using historical data that we know includes inconsistency in reporting approaches across the industry. We are committed to industry workshops to work through these inconsistencies and manage the risk.
Call received at the Integrated Control Centre (ICC) Assess incident responsibility If the cause is clearly not UU responsibility the customer is advised on to the relevant agency. All other floods and reports of imminent flooding are scheduled for inspection by a two person United Utilities reactive resolution team to enable us to assess the event on site and ensure that we deal with all issues arising from the public sewer network. The team comprises of one directly employed United Utilities Customer Support Technician (CST) and a contractor supplied operative.
The CST establishes if the incident relates to the public wastewater network If this is confirmed, a Flooding Extent Assessment (FEA) is conducted to accurately record all affected properties FEA - two properties to the side and rear of the affected site until a dry property is reached CCTV is carried out on investigation or arranged for another date (unless carried out in the last six months) on the local network to establish root cause.
On Site Investigation
We utilise rainfall radar information, capturing and recording it for each sewer flooding event that we store on our incident database. The system allows us to have an auditable piece of evidence for each incident we attribute to normal or severe rainfall and removes the need to rely on anecdotal evidence or judgement and assumption.
Further Analysis
Customer Call
Figure 13 United Utilities approach to sewer flood assessment

Copyright © United Utilities Water Limited 2018
Chapter 7: Supplementary Document - S6008 unitedutilities.com
23
In the Business Plan period 2020 to 2025 we are required to report all sewer flooding incidents including those caused by severe weather events. As a result the measure is highly vulnerable to variability in weather, such as high rainfall causing spikes in the numbers of incidents. In years where there are a number of large storm events, (2014/15 had five severe weather incidents where 2016/17 had 1,322), the associated spikes in incidents have the potential to cause significant uplifts in reported numbers yet there is little we can do to mitigate these risks. The impact of extreme rainfall in the North West is discussed in the special factor document UUW_WwN1_M.
5.3 Activities and costs We will continue to manage the risk of sewer flooding through balanced programmes of work across our asset base as well as through partnership working and engagement with
customers
The primary causes of flooding are blockages, structural issues and hydraulic inadequacy. We have researched and observed customer preferences and these have been used to set targets and balance the interventions we will deploy in AMP7.
The main areas of focus for us must relate to blockages as these are the predominant cause of flooding incidents as demonstrated in Figure 15. Detailed analysis is central to informing our options appraisal as discussed in Figure 14.
Supply Demand: We will have a dedicated programme of work dedicated to understanding the impact of development on flood risk, delivering interventions where necessary
Balanced Programme of Work: we will continue to manage the risks of the various types of network serviceability failures through balanced programmes of work across our asset base as a business as usual process
Reactive Resolution: we will continue to drive for first time resolution when attending reactive
incidents in order to reduce the risk of repeat events. Sewer Maintenance: we will target our sewer maintenance to address high risk issues through a prioritised investment programme
Network Monitoring: we will continue to invest in monitoring to understand real time performance and enable us proactively
manage flooding and pollution Proactive Cyclic Cleaning: we will continue to refine and deliver our cyclic cleaning programme, targeting high risk areas
Investing in capacity: We will develop a programme of work dedicated to reducing flood risk to properties which have
experienced repeat flooding
High Consequence Sewers: We will dedicate a programme of work to risk assess high consequence
assets and deliver mitigation where necessary. This should reduce the occurrence of major collapses
Customer Engagement: Our customer engagement campaigns for AMP7 will be the largest ever, focussing on WNTF and WNTP, creating improved customer awareness and reducing the risk of blockages
Modelling: We will continue to improve and verify our models, with particular focus on surface water models, to enable dynamic
network management and better solution development
Figure 14 Proposed AMP7 programme of work on the drainage system to reduce flooding

Copyright © United Utilities Water Limited 2018
Chapter 7: Supplementary Document - S6008 unitedutilities.com
24
5.3.1 Customer Engagement 5.3.1.1 What not to flush and What not to pour The actions of our customers can have a profound effect on the resilience of the drainage system. We have observed significant issues in terms of flooding of the environment from managing the result of items flushed that we believe are better placed in the bin. Wet wipes in particular are a major challenge with approximately 40 million individual wipes sold in the UK in 2016. The effects of this on customers and the environment can be profound; blockages can lead to sewer flooding which impact approximately 1,000 properties and 7,000 gardens each year in the North West. Further still, our research has found that some customers are sometimes having to pay sometimes up to £600 to have blockages cleared.
Whilst we are aware of this issue, our research has shown that 21% of customers have flushed unflushable items down the toilet due to lack of understanding. Therefore in the next business planning period we plan to have our biggest ever customer awareness campaign on “flushables”.
We have undertaken extensive customer research to understand how we can influence customer behaviour around sewer misuse as we know this is a particularly challenging behaviour to shift due to the convenience it offers customers. Through trials of material with different images and messages, we have shown that a 33% reduction in flushing being used for disposal can be achieved through effective communication of the environmental impacts. As well as items being flushed, almost 10% of blockages are as a result of Fats, Oils and Greases (FOG) being poured down the sink; to combat this behaviour a Food Establishment Team has been implemented to resolve the issue at the source.
The outcomes from behaviour trials are being used to influence our customer communications. We are currently working with the Rivers Trust to deliver a flushing behaviour campaign on our behalf in areas where there are sometimes problems with sewage litter in rivers. We recognise that as a Non-Governmental Organisation they are likely to be better placed to convey these messages to customers than ourselves. This is because they will be delivered by local people with a passion for protecting their local environment.
For more information on our approach to engaging with customers please refer to G04-WWN.
Figure 15 Sewer flooding incident data by cause FY15-17
The root cause of over 60%
of flooding incidents is caused by blockages

Copyright © United Utilities Water Limited 2018
Chapter 7: Supplementary Document - S6008 unitedutilities.com
25
5.3.1.2 Sustainable drainage We intend to build on the continual progress made since 2015, to improve customer awareness around the valuable resource that the rainfall which falls on their homes, driveways and gardens can be, and how it can be better utilised. Through demonstrations such as our award winning sustainable drainage (SuDS) garden at the 2017 RHS Tatton Flower Show (see Figure 16), we are leading the way in demonstrating how customers can make changes to play their part in improving resilience. The garden has now been relocated to Moss Bank Park in Bolton, Greater Manchester. This location is central to our customer base so it will be used to raise awareness to a wider demographic about the benefits of sustainable surface water management and how to achieve this at a household level.
Figure 16 RHS Tatton Flower Show 2017 UU SuDS garden
5.3.2 Investing in capacity In AMP7 we will have a dedicated programme to address capacity issues, with a particular focus on reducing flood risk at properties that have experienced flooding multiple times. We will look to increase capacity through a number of activities including but not limited to sewer upsizing, surface water removal and the construction of more surface water capacity and the use of SuDS. 5.3.2.1 Increasing hydraulic capacity Where cost beneficial we will deliver traditional hydraulic solutions to reduce internal and external flood risk. We will target areas which have experienced repeat hydraulic flooding in the past six years.
5.3.2.2 Surface water removal We recognise that there is a significant number of properties affected by flooding within our region and that, in the case of internal flooding, we have a lot more to do than other Water and Sewerage Companies. We are also aware that the cost of solutions and customer Willingness to Pay (WtP) research indicates that we cannot build our way out of the high number of flooding incidents that our customers unfortunately experience. Therefore we need to think differently and broaden our range of interventions and influencing approaches. In addition to customer behavioural change, we have to look at how we can better manage the surface water flows discharging into our predominately combined networks.
In parallel with customer surface water recycling awareness activity, we will look at our existing networks and exploit surface water separation opportunities that exist. In combination, such activity will start to reduce flow volumes and free up capacity within our networks.
‘Slow the Flow’ Award Winning Show Garden
The plot demonstrated a front garden with SuDS solutions instead of traditional hardstanding areas. Staff were available throughout the show to explain the benefits, affordability and practicality of recreating elements of the garden. This project contributed to educating and influencing customers on surface water management at a household level as well as providing us with information on the cost and feasibility of this type of solution.
The garden received excellent feedback, with the Turfstone driveway in particular being an element that visitors felt they could easily implement in their own gardens.

Copyright © United Utilities Water Limited 2018
Chapter 7: Supplementary Document - S6008 unitedutilities.com
26
5.3.2.3 Surface water partnership working We will take a leading role in promoting the value, need and benefit of partnership working to reduce surface water discharging to our sewers and look to harness the funding opportunities that Flood Defence Grant in Aid presents. In addition, where we are designing solutions we will look to utilise sustainable discharge routes or storage solutions wherever possible, which is an area we are already making progress in. We have already made progress in a number of partnership surface water projects which are summarised in Figure 17.
5.3.2.4 SuDS Opportunity Mapping We are actively promoting the use of green infrastructure interventions across the North West. We have recently developed a ‘Sustainable Drainage Systems Studio’ tool which helps us to identify where SuDS could be most efficiently and effectively implemented (see Figure 18). This will enable us to manage surface water more sustainably, reducing flood risk, whilst also delivering additional benefits such as amenity creation and associated wellbeing.
Surface water separation was a key part of a scheme to improve Blackpool’s bathing waters. In 2018 we completed a scheme which involved the construction of open basin SuDs and a new surface water outfall pumping station. This enabled us to take pressure off the drainage system in the area to reduce the risk of combined sewer overflows needing to operate on the Fylde coast
SuDS for schools is a project led by Business in the Community that seeks to demonstrate good practice in improving sustainability, in this case through sustainable drainage systems at a primary school in Sale. We partnered with them to deliver the project which will save the school money on their surface water drainage charges, reduce flood risk, demonstrate best practice to other schools and enhance environmental education of pupils
City of Trees share our ambitions to reduce flood risk and improve wellbeing in Great Manchester through planting street trees. Through this partnership with City of Trees a pilot in Howard Street, Salford was conducted, this also included the University of Manchester, Salford City Council, the Environment Agency and Urban Vision. This pilot showed 81% average storm peak reduction and 78% average water volume retention by the tree pit system. A recent partnership has delivered a bigger scheme on Prestwich High Street, Bury as part of regeneration of the street scene.
Figure 17 example AMP6 surface water partnership projects
Figure 18 SuDS studio output

Copyright © United Utilities Water Limited 2018
Chapter 7: Supplementary Document - S6008 unitedutilities.com
27
5.3.3 Network monitoring In AMP7 we intend to install enhanced network monitoring throughout our drainage system as part of a drive for enhanced monitoring and as part of our WwNM programme. Dynamic Network Monitoring (DNM) and Visualisation are both projects within the larger WwNM venture and will help us to identify where there is an imminent risk of flooding. These aspects along with the other attributes of our WwNM (see case study 2, Innovation in action – S5001) demonstrate our systems thinking approach as outlined in Figure 19. This work should enable us to prevent flooding incidents before they occur.
5.3.4 Reactive Resolution We provide a wastewater network proactive reactive service through a fleet of 78 reactive resolution units (see Figure 20). These allow us to rapidly respond to incidents and address them as soon as possible. The units are well equipped and enable us to resolve issues which could result in internal flooding on the first visit. In AMP7 we will continue to utilise our comprehensive resolution model which has delivered considerable performance improvements since its implementation in 2012.
Figure 19 Telemetry data used to highlight deteriorating performance and inform proactive response. Water levels reaching higher than expected levels for given rainfall events used as an alarm to instigate further investigation or remedial action.
Low predicted level
high predicted levelAsset Seasonal profile
January February March April May June July August September October November December
mm

Copyright © United Utilities Water Limited 2018
Chapter 7: Supplementary Document - S6008 unitedutilities.com
28
5.3.5 Sewer maintenance We will deliver a prioritised programme of capital work to reduce the risk of flooding. This work will be identified through our WRAP process. We will also deliver a prioritised serviceability programme which includes activities such as cyclic cleaning, lining and removing tree roots to reduce known flood risks.
5.3.6 Proactive cyclic cleaning In addition to our ongoing cyclic cleaning programme, we will deliver a proactive cyclic cleaning programme. We will look at two main data sets to help develop a preventative programme of work. Firstly we will focus on looking at historic trends for blockages and using this to inform where to clean. There is a high degree of correlation between historical lockage locations and the future risk of blockage. In AMP7 we will apply this hotspotting approach shown in Figure 21.
Figure 20 One of our reactive resolution units
Figure 21 The diagram below is an example of how we are using our data to increase the efficiency of our programme, allowing us to further reduce sewer flooding and prevent potential future incidents from occurring. This work examined historic flooding locations

Copyright © United Utilities Water Limited 2018
Chapter 7: Supplementary Document - S6008 unitedutilities.com
29
Secondly we will use predictive blockage and deterioration forecasts from PIONEER to shape our proactive inspection and cyclic cleaning programmes (see Figure 22).
Figure 22 Thematic heat mapping showing PIONEER blockage risk with Asset Health of each feature overlaid. Red zones show areas at greatest risk from blockages, used to inform cyclic inspection and cleaning programme.
6 We reliably collect and recycle your wastewater In order to reliably collect wastewater from customers’ homes and businesses and transport it for treatment we plan to invest £338.6m of totex in AMP7. We have two performance commitments, which fall under the outcome ‘We collect and recycle your wastewater’; sewer collapses and sewer blockages (F01-WWN and F02-WWN). The breakdown of this expenditure by performance commitment is shown in the diagram below. Throughout the current Business Plan period, we have focused our approach to effectively minimise operational issues, such as blockages and collapses. Operational issues are the principal cause of incidents of surcharging drainage systems, which lead to flooding and pollutio n and thus is an important area of investment to protect customer service.

Copyright © United Utilities Water Limited 2018
Chapter 7: Supplementary Document - S6008 unitedutilities.com
30
Referring to the Totex table above, the expenditure for these measures total at the outcome level with the addition of other costs which were not able to be attributed to a specific performance commitment such as Environment Agency fees and Business Rates.
A high level summary of some of the key activities we will deliver to achieve each performance commitment is shown in Figure 23.
Figure 23 Key activities planned in order to deliver the outcome "We reliably collect and recycle your wastewater"

Copyright © United Utilities Water Limited 2018
Chapter 7: Supplementary Document - S6008 unitedutilities.com
31
Outcome: We collect and recycle your wastewater
Totex £338.6 million expenditure
required to deliver this outcome
Current Performance Blockages account for over 80% of our sewer flooding incidents, since FY13 the number of blockage incidents in the
region has reduced by 19%. When compared with blockages, the impacts of blockages on customers are often worse due to the scale and complexity of resolving the issue, since FY14 we have reduced the number of collapses
by 37%.
Innovation A number of innovative approaches have been trialled in
AMP6 and will continue into AMP7, namely those as part of the WwNM project (systems thinking, hotspot analysis,
modelling and in-sewer monitoring). Our customer research and trials have identified points of focus for our
AMP7 customer awareness campaigns and will complement our blockage behaviour research. Technology
trialled will also be more widely used in AMP7 such as, Smart Ball technology identifying, surface depressions and
the implementation of a Food Effluent Team.
Efficiency The overarching Wastewater Network Management (WwNM) project has evidenced efficiency savings in AMP6 and the findings from this project will feed into our AMP7 programme. Our transition to more proactive ways of working have enabled us to get ahead of incidents before they occur. Our reactive wastewater network operating model has meant that our post incident investigations have reduced repeat flooding by 54% of which the root cause for the majority is blockages. Our proactive CCTV also detects sewer deformation in its early stages to enable repairs prior to an incident occurring.
Risks We will continue to proactively maintain and CCTV our network to minimise the chances of blockages forming and to check their condition. Our PIONEER tool
Summary Customers rightly view the removal of wastewater as a discrete service which should not interfere with their day-to-day lives as a priority. Operational issues are the principle cause of incidents of surcharging drainage systems, which lead to flooding and pollution incidents where blockages are the most common cause. There is strong customer and
stakeholder support for reducing both flooding and pollution incidents which we will achieve through business as usual activity, innovative technologies and planned programmes to proactively manage our risks.
Customer Expectation The ultimate consequence of a blockage or
collapse is a flooding or pollution incident and customers have shown strong support for
reducing the number of flooding and pollution incidents, particularly for internal flooding which
was ranked as the highest priority for wastewater (Customer Priority Research).
Of the customers asked as part of a customer sewer misuse survey, 32%
said they flushed wipes on a daily basis with 21% thinking they were fine to
flush. Our AMP7 programme will build on this research to help customers see
they can help themselves. Our Asset Health research (July 2018)
hown that 90% of customers are willing to increase their annual bill by 10p to
prevent sewer collapses and that of those asked, rank preventing sewer
blockages a top 3 priority
Performance commitments technical document - S3001
F01-WWN F02-WWN
influences this by identifying hotspot areas of risk. This is in addition to our campaign to raise customer awareness, however this is a longer process (refer to G04-WWN). A large proportion of our sewer network transferred to our ownership in 2011, these are commonly in poor condition and need continued focus to identify at risk assets. Our high consequence sewers project will also identify our highest consequence assets as a priority to monitor.
!

Copyright © United Utilities Water Limited 2018
Chapter 7: Supplementary Document - S6008 unitedutilities.com
32
6.1 Customer views Blockages account for the majority of our sewer flooding and pollution incidents. In AMP6, we have conducted extensive research to understand our customers views towards blockages and the disruption they can cause (see Figure 24). Collapses impact on customers in three main ways; flooding, loss of service and disruption associated with the repair. When compared with blockages the impacts of collapses on customers are often worse, because they usually take longer to fix. This means that customers can be affected through flooding, flow restrictions and traffic disruption for a significant length of time. Notable incidents in AMP6 such as Mancunian Way in Manchester and Edge Lane Liverpool evidence the inconvenience high consequence sewer collapses can cause (see Figure 25).
Figure 24 Customer research into blockages and collapses
Customer views – reliably collecting and recycling wastewater
• Recent customer research to investigate views on Asset Health (July 2018) delved into customer opinion and expectations with regard to blockages and collapses. Customers ranked preventing sewer blockages as a top three priority and 86% are willing to pay an additional £1.10 on their annual bill to prevent blockages.
• We know that there are a number of causes associated with flooding, of which blockages are a significant contribution. The largest of the contributing factors within the blockage category is those caused by rags/wipes (26%), although there are a number of other types of misuse such as soft blockages (16%) or those including FOG (9%).
• Research carried out on our behalf by Keep Britain Tidy, overwhelmingly revealed that people feel they individually use and create such a small amount of FOG that they cannot be significantly contributing to the problem in the sewers. This research also identified that people were generally confused about what does and does not break down or disintegrate in the sewer. When discussing ‘wipes’ specifically, the majority of respondents suggested they have never thought about where the flushed items go or who is responsible for dealing with them.
• This insight was substantiated in our sewer misuse research (February 2017). Results showed a quarter of those questioned put some form of wet wipe down the toilet and 21% of customers felt toilet wipes were fine to flush, 16% tampons, 8% pet/human hair and 7% cleaning/disinfectant wipes. Of all customers that we spoke with, nearly one third (32%) said that they flush toilet wipes on a daily basis. The predominant reason given is that customers believed that they were allowed to as the packaging said that the product was flushable.
• In addition, a clear message from Preston was that 82% of the customers who we spoke with said that they had not heard any communication from us about what not to flush and did not know what was acceptable to flush. From our long term survey where we specifically asked customers if they had seen our engagement campaigns, only an average (based on 3 years) of 12.3% of our customers responded that they had following the recent Wave 23 results (more information can be found in performance commitment G04-WWN).

Copyright © United Utilities Water Limited 2018
Chapter 7: Supplementary Document - S6008 unitedutilities.com
33
6.2 Risk and resilience Detailed analysis of the causes of blockages in the sewer network shows a variety of root causes however, the biggest cause is related to disposal of products to the sewer system that it was never designed to cope with such as wet wipes (see Figure 26).
Blockages account for over 60% of our sewer flooding incidents and are the cause of the majority of pollution incidents. We can influence behaviours through customer engagement, building on new encouraging research; however, this can be a slow and iterative process which may be less effective in the short term than dealing with incidents related to causes within our control. There is also extensive evidence from other behavioural studies that shows levels of awareness can deteriorate if communications are not maintained. In addition, we commissioned our own research to understand how blockages behave in our network to help understand how we can better manage and influence customers (see Figure 27).
Figure 26 root causes of sewer flooding. Over 60% is as a result of some form of blockage
Mancunian Way (Manchester) sewer collapse in 2016 caused the major road to close for nine months to enable
repairs. Long diversions were put in place causing huge delays to customers
Edge Lane sewer collapse in 2017 caused disruption to a major road in Liverpool
Figure 25 Examples of major sewer collapses which occurred in AMP6

Copyright © United Utilities Water Limited 2018
Chapter 7: Supplementary Document - S6008 unitedutilities.com
34
Despite this issue, we believe managing the risk at source is the best way to reduce blockage numbers in the long term and is a process we are committed to following. We have utilised a number of activities in the Business Plan to regain control of customer actions towards unflushable items and have dedicated a measure (G04-WWN) driving awareness. We have targeted a number of campaigns to investigated blockages further in AMP6, an example is shown in Figure 28.
Figure 27 WrC blockage behaviour experiment. Top left: experiment set up to simulate our sewer network; top right, section of pipe mimicking siltation in the sewer and a blockage beginning to form; bottom, fully formed blockage.

Copyright © United Utilities Water Limited 2018
Chapter 7: Supplementary Document - S6008 unitedutilities.com
35
Figure 28 Customer cubical trial to understand customer behaviours towards unflushable items
For sewer collapses, our experience to date informs us that many of the assets transferred under the private sewers legislation in 2011 were often neglected and received the minimum amount of maintenance, this is also the case for rising mains transferred in 2016 from private pumping stations. Consequently, we recognise the need to continue to focus efforts on these assets through AMP7. For those sewer collapse situations that present in the form of ground level subsidence, we will innovate by adapting existing technology to identify surface depressions by using satellites and track deterioration. This will allow us to compare those situations with actual or potential sewer locations and deploy CCTV or sonar profiling equipment to establish if any deformation of the sewer pipeline is occurring. This will allow us to identify even minor shape deformation and programme in timely remedial activity before flow reduction and significant surface subsidence cause customer inconvenience. Additionally this innovative technology can also be adapted to identify soil moisture variations and point to rising mains and sewers that are leaking to ground. Such approaches may indeed increase repair activity but because many of these interventions will take place before the new water industry collapse criteria/definition (resulting in loss of flow) occurs these repairs will legitimately not be recorded as collapses. Where flow is lost, interventions will be deployed in a manner to reduce customer inconvenience and allow us to report proactive repairs as a success measure.
Cubical trials – What Not to Flush The trial measured the number of wet wipes dispensed and binned (wet wipes flushed = wipes dispensed – wipes binned) to provide a quick, cost effective way to test flushing behaviours and responses to messaging. Cubicles were branded as shown in the image, one with a domestic cost message, one with an environmental cost message and the other with no message. Each cubicle had a bin for wipe disposal. Findings from this experiment were positive and proven that point of use messaging was effective and that customers responded well to both domestic and environmental messaging. In summary, as part of this trial 30% fewer wipers were flushed (vs the control). These findings will contribute towards the Customer Awareness performance commitment (G04-WWN).
Domestic cost message
No message (Control group)
Environmental cost message

Copyright © United Utilities Water Limited 2018
Chapter 7: Supplementary Document - S6008 unitedutilities.com
36
Exfiltration of effluent through leaking joints is symptomatic of a sewer collapse. By focusing our efforts on proactive identification and repair of collapses and other defects, combined with our drive to make customers aware of appropriate drainage discharge behaviours will reduce the incidences of sewers surcharging. Additionally reducing such surcharge events will also reduce associated pollution risks. This will significantly benefit customers in terms of incident reduction but it will also benefit those that remain responsible for private drainage systems too.
Our programme of work to CCTV survey some of the high consequence sewers across the North West will allow for planned proactive programmes of repair and rehabilitation work that will reduce inconvenience caused by reactive sewer collapses. Detail of our high consequence sewer inspection programme are contained in the appendix. Such programmes and innovation will increase the number of collapses repaired but will serve to reduce actual sewer flooding incidents, flood risk and will also reduce pollution risk. The ODI measures we propose for AMP7 reflect our aspiration to repair more defects proactively. We have already trialled some emerging technologies to develop an understanding of the condition of our rising mains, in some cases being the first UK water company to trial (WRc Smart Ball trialled at Glebe Road, Bowness on Windermere) as shown in Figure 29. We will also use PIONEER (our asset investment forecasting and decision support tool) to identify assets which may be at risk (Figure 30). The PIONEER modelling software analyses and predicts deterioration in our sewer network by identifying where our highest risk of failure lies in the network in terms of blockage and collapse. We can then carry out proactive investigations where necessary to determine where interventions may be necessary. This level of targeting and proactive intervention allows us to move to target incidents before they occur, reducing the customer impact overall, while also preventing flooding and pollution incidents. This is an example of one of the ways we are using data to drive our asset management strategies to help ensure an efficient and resilient service
This combined understanding will also enable further development of an innovative, improved approach to hot-spotting and sewer cleaning. We are moving towards a pro-active approach using data analytics as a predictive tool, allowing us to prevent blockage issues before they occur. This is another part of our WwNM approach for which elements have been successfully trialled in Preston. Our plan will see the investment of £338.6m to deliver a strategy with three key elements
• Proactive identification and management of risks around the collapse of high consequence sewers • Role out of our innovative Wastewater Network Management approach to enable much more
proactive network management • Raising customer awareness of the role they can play in reducing the risk of blockages leading to
service issues
Figure 30 Example PIONEER output
Figure 29 SmartBall technology being trialled on a rising main

Copyright © United Utilities Water Limited 2018
Chapter 7: Supplementary Document - S6008 unitedutilities.com
37
To increase resilience of our network to service failures, we will build on innovations developed through our WwNM initiative that embraces a systems thinking approach. This includes enhanced hot-spotting analysis, in-sewer monitoring and modelling capability (more can be read on this in the innovation section of this measure and the innovation case study on WwNM S5001). Furthermore, we are developing an extensive customer awareness programme to raise awareness of what not to flush to influence and reduce wipes and other material from being flushed (more on this innovation can be found in case study 22 of our Inovation in action - S5001). We will continue to enhance and develop our Wastewater Network Operating Model by improving the training and awareness of our crews that staff the 78 reactive resolution units we have operating across the region. We will continue to equip those units with leading technology (e.g. CCTV, root cutting etc.) that will provide for increasing the number of reactive incidents we attend where we achieve substantive resolution within our first visit. They also allow for the updating of our asset data records, capturing where our sewers are located and their condition. This approach will continue to reduce repeat incidents and create the capacity to use the resolution units more proactively, trying to identify and resolve issues found before they impact on the service our customers expect from their wastewater system.
6.3 Activities and costs
6.3.1 High consequence sewers Our high consequence sewer programme is aimed at reducing the level of risk in sewers that would cause significant customer impact, particularly the risk of collapse. This will involve understanding the risk of failure for each of our assets and the likely consequence. Based on this work, a prioritised programme of structural surveys will be implemented so that we are surveying our highest risk assets. This allows us to manage risk in our network more effectively as well as giving us the opportunity to intervene where issues are found, reducing or preventing the customer impact.
We will complement our CCTV strategy with innovative new approaches which we will continue to develop. One example of this is adapting existing technology to allow us to identify surface depressions using satellites and track deterioration. This will allow us to identify even minor shape deformation and programme in an intervention before flow is restricted or significant surface subsidence causes customers inconvenience. Another innovative approach is SewerBatt which uses acoustic sensing technology to identify obstructions (see Figure 31).
6.3.2 Wastewater Network Management Our innovative WwNM project, trialled in Preston, will be rolled out across the region. These enhanced ways of working will continue to reduce blockages through preventing both new and recurring incidents. As part of this approach, we will also be developing sewer flow signature monitoring capability where appropriate (see Figure
Figure 31 SewerBatt technology for identifying obstructions in the sewer

Copyright © United Utilities Water Limited 2018
Chapter 7: Supplementary Document - S6008 unitedutilities.com
38
32). Once we have baselined the dynamics of the system, through enhanced monitoring, it will allow us to detect the early formation of blockages or siltation build up and take preventative measures. We will continue to develop predictive tools to understand the risk and consequences of incidents occurring across the network, allowing us to intervene pro-actively, preventing customer impacts.
Figure 32 Sewer flow signature developed through in sewer monitoring as part of the WwNM project
6.3.3 Raising customer awareness During AMP6, we commissioned a study into how blockages form for various scenarios and correlative links to rainfall and associated antecedent situations. Such understanding of how blockages occur, particularly combined with the increased understanding of customer behaviour and asset data from our corporate system, will allow us to better target interventions, enabling us to further improve blockage performance. We will also enable further development of an innovative, improved approach to hot-spotting and sewer cleaning. We are moving towards a pro-active approach using data analytics as a predictive tool, allowing us to prevent blockage issues before they occur. This is another part of our WwNM approach for which elements have been successfully trialled in Preston. We aim to reduce the risk of incidents caused by FOG. We are introducing a Food Effluent Standards Team which will work primarily with takeaways and restaurants on reducing the amount of such products entering the network.
Widespread customer engagement is key to our approach. We have complimented detailed behavioural analysis, carried out on our behalf by Frontier Economics, with a partnership research project working with Keep Britain Tidy. This aims to understand customer attitudes and flushing behaviour in order to enable co-created solutions with customers and supermarkets. This work has also helped establish the optimum engagement methods to adopt in relation to a wide range of customer demographic. With this enhanced understanding we are planning a much larger customer engagement and awareness programme than we have carried out before (G04-WWN). We have conducted a range of customer research to look at behaviours underpinning wipes and FOG disposal and this will serve to shape our programme in AMP7.

Copyright © United Utilities Water Limited 2018
Chapter 7: Supplementary Document - S6008 unitedutilities.com
39
7 The natural environment is protected and improved in the way we deliver our service
In order to deliver our wastewater service to customers whilst also protecting and improving the natural environment we plan to spend £1.557bn in the AMP7 period. This includes £527m of totex expenditure to deliver river water quality improvement outcomes set out in the WINEP. A further £118.8m of expenditure to meet statutory WINEP drivers, which has been allocated to the treatment, works compliance outcome. Whilst we plan to deliver additional natural capital benefits under this outcome we plan to do so by delivering environmental improvements in more innovative ways and therefore there is no additional cost allocated to this outcome. We will work across our production lines to deliver this outcome with a range of activities, some of which are highlighted in Figure 33.
The expenditure for these measures total at the outcome level with the addition of other costs which were not able to be attributed to a specific performance commitment such as Environment Agency fees and Business Rates.

Copyright © United Utilities Water Limited 2018
Chapter 7: Supplementary Document - S6008 unitedutilities.com
40
Figure 33 Key activities planned to deliver the outcome "The natural environment is protected and improved in the way we deliver our services”

Copyright © United Utilities Water Limited 2018
Chapter 7: Supplementary Document - S6008 unitedutilities.com
41
!
Outcome: The natural environment is protected and improved in the way we deliver our services
£1.557bn Totex Expenditure required to deliver
this outcome
Current Performance For the last 3 years we have achieved the highest rating on the Environment Agency’s Environmental Performance Assessment (4*). The only measure that has remained in the amber category is treatment works compliance, which has been on an improving trend over the last 3 years.
Innovation Building on our AMP6 transformation
projects we will optimise maintenance of our assets and move to a more proactive
approach supported by the use of asset analytics. Operation will be increasingly
supported by remote operation and control. Using our Integrated Catchment
Approach we will improve river water quality in a more sustainable way by
recognising the value of natural capital.
Customer Expectation 74% of customers want us to
concentrate on providing reliable and continuous sewerage removal
and processing services and 58% want us to focus on preventing pollution. Additionally 60% of
customers are willing to pay more for river quality improvements
Risks Extreme weather patterns Adaptation to low phosphorus permit limits Increased remote monitoring revealing new performance issues Keeping pace with population growth Successfully influencing customer behaviour
Summary The Wastewater Network Plus price control has significant potential to impact on the outcome “the natural environment is protected and improved in the way we deliver our services”. We continuously manage the risk of returning non-compliant effluent to the environment to protect rivers from deterioration. This not only involves effective operation and maintenance of our assets but also a focus on external risks such as climate change, population growth and changing customer behaviours. Additionally there are customer, stakeholder and regulatory expectations on us to improve the quality of the environment. This means that we have an enhancement programme to improve our treatment works and overflows where there is evidence to justify this action. This will result in improvements to 76 WwTW and 36 storm overflows in
Efficiency Short term risks are mitigated on a local level through reactive and routine cyclical maintenance which is tailored to the specific site. Through the wholesale risk asset planning process we assess the treatment works compliance, growth and pollution risk, we consider the strategic options on risk reduction activity across all available options.
!

Copyright © United Utilities Water Limited 2018
Chapter 7: Supplementary Document - S6008 unitedutilities.com
42
7.1 The natural environment is protected and improved in the way we deliver our service – Pollution
7.1.1 Customer views
Customer Research: High level outcomes Customer Priorities Research (“YourChoice”, June 2016)
• Preventing accidental pollution incidents was ranked 5th out of 26 service priorities • Accidental pollution incidents was scored higher than reducing leaks and unplanned supply
interruptions Willingness to Pay (June 2017)
• The effects of pollution incidents involving the cleanliness of rivers, lakes and the sea were ranked highly (for domestic customers 3rd for rivers and lakes and 4th for sea/lakes being fit for swimming)
• 38.6% of customers find a change to their annual bill more important than accidental pollution incidents
• In the same research, preventing sewer flooding inside your property was ranked 6th which highlights the importance of preventing pollution incidents to customers.
7.1.2 Risk and Resilience This section summarises information contained in S4005, chapter 7.1. Our pollution performance has improved significantly over the past two Business Plan Periods. We have a track record of industry leading performance and when compared with other companies in England and Wales. This level of performance is reflected in the 4* rating awarded to us through the EA’s annual EPA of companies. We have held the 4* rating for the last three years.
This is due, in part, to the significant investment we have made in managing the risk from our discharges through providing additional sewer capacity and improving our first time screening capability at combined sewer overflows and sewer outfalls, which present a risk to water quality. Our comprehensive programme of cyclic inspection and maintenance of our sewer ancillary assets also allows for early identification of issues and intervention to prevent problems causing unplanned sewage discharges to the environment. The risk remains that more serious pollution incidents, categorised 1 or 2 by the EA or repeat category 3 incidents, can result in prosecution under the Environmental Permitting Act which commonly carry significant fines or agreement to significant Environmental Undertakings involving expensive restoration or mitigating works. As the North West receives higher than average surface water runoff, has areas of heavily urbanised regions and is served by large combined sewer networks these systems are particularly susceptible to blockage or becoming overwhelmed. Blockages are the root cause of the majority of category 3 pollutions (see Figure 34).We will continue to influence customer behaviours which is also integrated into our Customer Awareness performance commitment (G04-WWN). Pollution prosecutions are not only expensive but are also damaging for our environmental reputation. Our current levels of pollution performance are recognised as frontier for the industry.

Copyright © United Utilities Water Limited 2018
Chapter 7: Supplementary Document - S6008 unitedutilities.com
43
A further risk is the uncertainty as to how changes to Environmental Permit Conditions will affect existing permits. Under the new conditions, the EA has the right to vary existing permits and also impose new clauses at any time. This could mean that a current day compliant asset could become non-compliant and cause a reportable pollution incident. Our full hydraulic and coastal water quality models ensure we have good understanding of hydraulic capacity factors that represent pollution risk. The proposed installation of in sewer monitors combined with the installed Event Duration Monitors (EDM) will provide real time performance which can be used in conjunction with our models. In addition, operator awareness is key to manging pollution risk so our teams are briefed to understand the process and escalate risks when they occur to mitigate against avoidable incidents. Further information on how we manage the risk around pollution incidents can be found in S4005 Operational Resilience.
7.1.3 Activity The activities to deliver this outcome are closely linked with our sewer flooding activity, and so the activity section of the ‘Flood Risk is Reduced to Homes and Businesses’ should be read in conjunction with this section. In addition to those activities, in the Business Plan period 2020-2025 we will also be investigating overflows which are operating at a high frequency to determine the root cause and continually updating our model base. We will also build on customer awareness campaigns carried out in AMP6 to encourage customers to think before they flush and prevent blockages at the source.
7.2 The natural environment is protected and improved in the way we deliver our service – Treatment works compliance
This section outlines our approach to sustaining and improving the reliability of the wastewater treatment service so that customers can have confidence that their effluent is recycled back to the environment in compliance with environmental standards and at an efficient cost. We have carefully analysed the level of risk within our asset base and the maintenance needs over a 25 year period to arrive at a plan that balances
Figure 34 root cause analysis of category 3 pollution incidents 2014-2017

Copyright © United Utilities Water Limited 2018
Chapter 7: Supplementary Document - S6008 unitedutilities.com
44
efficiency and risk. We are embracing innovative ways of working and developing new operational approaches to get the most from our assets in order to manage the impact on bills.
7.2.1 Customer views
Customer Research: Treatment compliance
• Customers show strong support (74%) for us to provide reliable, resilient and continuous sewerage collection and recycling services. This was the third highest priority in our service priorities research carried out in November 2016
• When customers built their own service levels, only 8% selected to receive compensation to allow for a decrease in river quality.
7.2.2 Risk and resilience As a water company, one of our key operational risks is complying with our Environmental Permits 100% of the time. This is particularly so for wastewater treatment works where we must treat the flows arising from a population equivalent of 8.8 million people whatever the weather and safely return treated effluent to the environment.
Over the last three years, we have driven an improving trend in WwTW compliance, which we need to continue to achieve our ambition of zero failing WwTW Since 2015 we have achieved an industry leading 4* status in the EA’s EPA which we aim to maintain. In order to do this we need to improve our treatment works compliance performance as this is the only aspect of our EPA, which is classified as amber. We have achieved this improved performance in the last three years by managing operational risks with more rigour, whilst driving for efficient solutions. Our approach to managing the risk of permit non-compliance is set out in detail in S4005 Operational Resilience section 7.3. This document outlines our long-term ambition to achieve 100% compliance with discharge permits whilst at the same time complying with more challenging standards and the inclusion of additional aspects of permit compliance such as flow conditions. The basis of our AMP7 performance commitment for treatment works compliance is set out in CF-C002 treatment works compliance. In order to reach these stretching targets we use our WRAP process, which is described in detail in the corporate risk management framework - S4003. This outlines our approach to tackling longer term and more complex risks and to drive step changes in performance and efficiency by considering more innovative and smart solutions including taking advantage of new technologies.
Key risks we need to manage to deliver the service our customers expect include:
• Improving compliance at the same time as managing an ageing asset base • Integrating 75 new phosphorus removal requirements into our operational business as a result of our
environmental enhancement programme. This includes 16 permit limits, which are at the boundary of technical feasibility at 0.25mg/l phosphorus.
• Addressing legacy issues around compliance with flow permits
Within the Asset Health: Supplementary evidence of our approach to asset health (Asset health approach - S4001) document we explain our approach to the assessment of asset health. The profile below (Figure 35) shows the effect of the substantial quality enhancement and maintenance programmes on Wastewater Network Plus treatment, pumping, storage and overflows since privatisation (the majority of the asset value is at wastewater treatment works). The forecast dip in the “youngest assets” for AMP7 is due to the exclusion of the new asset stock associated with the environmental quality programme from this analysis. Inclusion of this investment would be expected to produce a similar profile for AMP7 to AMP6, apart from the “bulge” in assets greater than 70% of the way through their expected lives. This shows that if we are to optimise the

Copyright © United Utilities Water Limited 2018
Chapter 7: Supplementary Document - S6008 unitedutilities.com
45
maintenance of assets through AMP7 there will be a similar value of assets with poor health at the end of AMP7 as AMP6.
Whilst this demonstrates the aging of this part of the wastewater Network Plus asset base from AMP6 to AMP7, this is a managed approach as we extend operational lives across our business by introducing better and more innovative ways of delivering service and performance improvements. There are areas of our asset base where we will need to increase maintenance investment beyond AMP7 planned levels in order to ensure that we are able to continue to deliver excellent customer and environmental service.
Whilst we have been able to drive down the number of failing wastewater treatment through targeted capital investment and operational interventions (see Figure 36) and we plan to continue to do so (see Figure 37) shows we are carrying a higher level of underlying compliance risk than we have done historically and our expectation is that this level of underlying risk will increase.
Figure 35 Forecast Base Asset Health expected life profile – Wastewater Network plus – treatment, pumping, storage and overflows
Figure 36 Number of failing wastewater treatment works 2008-2017

Copyright © United Utilities Water Limited 2018
Chapter 7: Supplementary Document - S6008 unitedutilities.com
46
Size band of WwTW High risk Medium risk
6 (largest works) 0.82 risk points 0.24 risk points
5 (medium works) 0.16 risk points 0.05 risk points
1-4 (small works) 0.08 risk points 0.02 risk points
Figure 38 ODI points incurred for WwTW at high or medium risk of failure (AMP6 Maintaining our WwTW performance commitment)
As we expect to see an increase in the average age and deterioration in the asset health of assets through the AMP7 period, we must increasingly target investment in interventions on assets to ensure that they directed at those with the worst asset health and highest criticality. By doing this we will be able to manage the risk of non-compliance whilst minimising the cost to customers.
We also anticipate needing to invest to address shortfalls in flow compliance as a result of the Environment Agency confirming the approach for measuring flow compliance. These issues are likely to exist due to legacy design shortfalls with treatment works. Whilst the full extent of the risk is emerging we plan to implement a programme of works in AMP7 to address to minimise the risk this presents to our treatment works compliance performance once this measure becomes part of the Environmental Performance Assessment in AMP8. Additionally we will need to improve compliance with our dry weather flow permits. This is a particular challenge in Cumbria where infiltration into the sewer network often results in higher than typical levels of infiltration. Our first step in addressing these issues is to use our models to determine if the current performance is having a detrimental environmental impact. We will only seek to upgrade assets where it is clear that the Environment Agency will not be able to revise the permit requirements.
7.2.3 Activities and costs We plan to provide a higher level of service, which will meet tighter environmental standards whilst doing so more efficiently than we have done previously so we can keep customer bills as low as we can. As we move towards this ambition, we will target upper quartile performance in AMP7, which at 99% compliance is very close to the eventual ambition. We will be transparent with information on our performance, which will be available to customers via our website allowing them to see that we are operating responsibly.
Our ability to deliver the service expected by our customers in an efficient and effective manner is intrinsically linked to maintaining the availability of assets. Our aspiration is to transition the balance of interventions from reactive to proactive where economically viable and to move to a fully enabled risk based approach to understand the inherent risk associated with our wastewater treatment asset base. By the end of AMP7 our position will be that:
• Asset health for assets is known and the cyclic maintenance workbank will be dynamic and based on criticality, performance and reliability.
Figure 37 AMP6 WwTW maintained ODI risk point trend

Copyright © United Utilities Water Limited 2018
Chapter 7: Supplementary Document - S6008 unitedutilities.com
47
• The criticality of assets will be regularly reviewed and updated based on asset type performance. • Our workforce will be fully mobile and deployed efficiently across all areas. • Data analysis will be used to monitor and predict asset performance and target improvements. • Asset health and the impact on performance is understood and optimised to drive efficiency and
reliability. • Stock management for parts and spares is fully embedded and usage, supplier performance and costs
are monitored and reported. • Intelligent ownership considers productivity and efficiency of stock across the supply chain. Tool
requirements move from hardware to software. • Real-time quality assurance will be in place, which is effective and acted upon. • Predictive analytics will identify opportunities for improvement across our maintenance processes. • Commercial partners will utilise the same suite of performance data.
Our planned wastewater treatment works maintenance investment programme in AMP7 totals £354.64m. Investment currently identified in this area for AMP7 includes the capital maintenance associated with quality enhancement projects, which have been defined through detailed engineered solutions and agreed through expert core teams. Successful delivery of the enhancement programme (including delivering the Blackburn WwTW strategic project) will require 31% (£110.2m) of our maintenance programme to support it. This is because although the treatment plants meet their existing permits, the current asset condition is not the same as a brand new asset so they require maintenance improvement as well as environmental enhancement improvement in order to meet the tighter permit limit. In a few cases, we intend to use the environmental improvement drivers as a catalyst to overhaul the treatment process to make it fit for the future (Long term resilience case study – Macclesfield WwTW, Figure 39).
Wastewater treatment works maintenance driven capital investment projects will be subject to prioritisation, including the use of consequence and likelihood scores, through corporate systems during the AMP7 period. This totals £216.4m, which is available for prioritisation to address the management of risk across the wastewater treatment asset base, to ensure we continue to treat sewage in compliance with our permits. It is likely that new maintenance risks are identified during AMP7 which require capital investment within the AMP, these will be prioritised with the rest of the needs ensure investment is appropriately prioritised.
The total investment in this programme area of £354.6m is less than the previous AMP expenditure of £467.1m (see Figure 40). This is largely due to the reduction in expenditure required for successful delivery of the environmental enhancement programme. In AMP6 we undertook major, strategic schemes at Davyhulme, Blackburn, Oldham, Morecambe and Kendal WwTWs. These projects involved the upgrading of the processes at these sites to achieve enhanced discharge permit requirements and improving the asset health of these works. Associated maintenance expenditure for these projects totalled £151.9m. This plus the investment required for successful delivery of the remainder of the AMP6 quality enhancement programme totalled
Long term resilience case study – Macclesfield WwTW
Macclesfield WwTW serves 73,000 people and is the first major wastewater discharge in the River Bollin, a recovering salmon river. This means the resilience of our service here is key to the Bollin achieving its long-term objectives of sustainable salmon populations. The key challenges that we need to address for this site are
• Provision of phosphorus removal to 0.4mg/l to meet moderate status under WFD by 2024. • Reduction in the ammonia permit to 2mg/l to protect from deterioration by 2024. • Population growth of 14,207. • £49m of maintenance required over next 25 years, £24m of which is due by 2030.
By looking at the risks holistically we have determined that the lowest whole life cost option is to rebuild the treatment plant as a biological phosphorus removal plant which will enable us to address all the challenges above whilst minimising the long term impact on bills. Crucially by taking a holistic view we open up the opportunity to transform the service at this site so that phosphorus could be recovered as a resource in the future once global demand reaches a point where it is economic to do so which is forecast to be early in the life of the new plant
Figure 39 Long term resilience case study summary - Macclesfield WwTW

Copyright © United Utilities Water Limited 2018
Chapter 7: Supplementary Document - S6008 unitedutilities.com
48
£219.2m (47% of total maintenance programme). We are not proposing strategic schemes of the same scale in AMP7 and therefore our expenditure in this area is reduced significantly. We have also prioritised to ensure legacy issues around the compliance of our wastewater treatment works with their flow permits are addressed in the AMP7 period.
The majority of Opex associated with the natural environment outcome has been proportioned to the treatment works compliance performance commitment and therefore the wastewater treatment works maintenance programme (£407.2m). Effective operational expenditure is key to maintaining the performance of wastewater treatment works. This will include both the benefits realised from the AMP6 transformation projects and the additional Opex required from the delivery of AMP6 quality enhancement schemes.
7.3 The natural environment is protected and improved in the way we deliver our service – Protecting the environment from the impact of growth and new development
This section sets out how we will accommodate growth and new development within our region and ensure that performance and customer service does not deteriorate as a result of the associated increases in sewage flow and load.
7.3.1 Customer views
Customer Research: Protecting the environment from growth and new development
• Customers tell us that they are concerned about growth and new development impacting on their current wastewater service, particularly with regard to flooding, and do not want to see deterioration in service because of this.
• An assessment of future issues and challenges indicated that this was a high priority with 72% of customers agreeing that is an important consideration as part of our plans.
• When customers built their own service levels, only 8% selected to receive compensation to allow for a decrease in river quality.
• Stakeholders have also indicated that they expect us to facilitate growth and new development and work in partnership during planning stages to ensure there is no impact on current customers or the environment.
Figure 40 AMP6 and AMP7 WwTW Maintenance Expenditure

Copyright © United Utilities Water Limited 2018
Chapter 7: Supplementary Document - S6008 unitedutilities.com
49
7.3.2 Risk and Resilience There are many risks associated with growth and new development that have to be planned for as part of our business plan and in the longer term. Figure 41 shows the risks and the potential impact on the service we provide. The scale of the impact depends on the timing and location.
Figure 41 Growth and new development risks and impact
7.3.2.1 Population and development trends The population in the North West region is forecast to increase from 7.2 million by over 1 million by 2045 according to local authority planning information. The impact of this depends on the timing, location and the capacity available. Occupancy rate is forecast to remain fairly stable over time but it is expected to rise in measured properties from 1.8 to 2.2 occupants per household by 2045. Unmeasured occupancy is forecast to remain stable at 2.2 per property. Change in consumption rate also has an impact on forecast need. Changes in water use behaviour and design standards could have a major impact on future household customer consumption. More information on consumption forecast is available in the revised draft Water Resources Management Plan, 2018.
7.3.2.2 Trade effluent changes Trade effluent volume has declined by 22% since 2007/08 from 132.1 ML/day in 2006/07 to 102.8 ML/day in 2015/16 (see Figure 42) however, forecasts indicate it will increase over the next 25 years reaching the levels last seen in 2009. In terms of trade load there is no increase forecast at a regional level although local variations can occur.

Copyright © United Utilities Water Limited 2018
Chapter 7: Supplementary Document - S6008 unitedutilities.com
50
It is worth noting that the trends shown in Figure 42 do not factor in the governments modern industrial strategy white paper which has a clear ambition to drive growth across the country. It is likely that this will lead to some localised increases in trade effluent volumes. More details of this are included in S4003 Corporate risk management framework, section 4.4.4
7.3.2.3 Urbanisation, population density, creep and climate change With the creation of a Northern Powerhouse as a priority for the government, the Greater Manchester area in particular is likely to continue to be the focus for urbanisation in the North West although similar patterns may also occur in the Merseyside area. Between the 2001 and 2011 census, Manchester was the fastest growing UK city outside London, with an increase in population of 19%1.
Population density in the Northwest (515 people per sq km) is second only to London as a region with 2,193 people per sq km in the Greater Manchester (Metropolitan County) and 2,191 per sq km in Merseyside. This includes some relatively sparse areas with 74 per sq km in Cumbria (see Figure 43).
1 Office for National Statistics “2011 Census Analysis - Comparing Rural and Urban Areas of England and Wales”, 2013
Figure 42 Trade Effluent Regional volume forecast by trader type from PR19 Trade Effluent Demand Forecasting for United Utilities, Experian, February 2017

Copyright © United Utilities Water Limited 2018
Chapter 7: Supplementary Document - S6008 unitedutilities.com
51
Figure 43 Population versus density in the Northwest from Office for National Statistics Estimates of the population for the UK, England and Wales, Scotland and Northern Ireland, Mid 2017 data set
Urban Creep arises from the conversion of existing permeable areas, for example gardens, verges and paths to impermeable areas. There has been a significant increase in the proportion of front gardens that are completely paved over in the North West, up from 4% in 2005 to 21% in 20152, usually to provide space for car parking. Back gardens are developed with new extensions and conservatories that may then be connected into surface water drains. Such changes increase the volume of surface run-off and the speed at which it discharges to the sewer. The pace of urban creep is highest where property density is relatively low. This trend is expected to continue despite increasing public awareness and political interest in promoting sustainable drainage.
In contrast to urban growth, four Garden Villages have been announced for the North West (see Figure 44) at St Cuthberts, near Carlisle; Bailrigg in Lancaster; Handforth in North Cheshire and Halsnead in Knowsley. As new settlements, these areas require specific focus on their plans for drainage and wastewater treatment. We are working with the Garden Villages to ensure they have infrastructure that allows residents to have a reliable and sustainable wastewater service.
The key risk from climate change to our wastewater service is the predicted increase in more intense rainfall across the region. The sustainable management of surface water is vital in adapting to this risk. The impact of climate change is considered in more detail in S4003 Corporate risk management framework, section 4.4.5
2 Royal Horticultural Society “Why we all need Greening Great Britain”, 2015 https://www.rhs.org.uk/communities/pdf/Greener-Streets/greening-grey-britain-report
Figure 44 Garden Village locations in the northwest for which additional infrastructure will be required

Copyright © United Utilities Water Limited 2018
Chapter 7: Supplementary Document - S6008 unitedutilities.com
52
7.3.2.4 Resilience The project design horizon will be far enough ahead to provide resilience for the confirmed future risk, but not too far to drive unsuitable solutions due to uncertainty over growth rates. Consideration to the longer term is given, for example through use of modular solutions or efficient use of land so that future needs can be dealt with as they arise. Flexibility within the programme of work provides resilience to changes in location or timescales of new developments and enables these to be managed within the financial constraints.
Better interaction and development of plans with local authorities, or combined authorities will enable strategies to be aligned and infrastructure plans to accommodate longer tem risk. Interventions will be delivered ahead of the impact thereby reducing the potential risk of permit non-compliance and providing more resilience to growth and new development. Consistent planning with developers and management of surface water at new developments will increase resilience of downstream sewer networks and treatment works during storm conditions as more surface water will be removed or attenuated at peak times.
7.3.3 Actions and Costs We will invest £46.5 million to protect our wastewater treatment works from the impact of growth and new development. Additionally, we plan to invest over £50 million of infrastructure charges, on sewer enhancement, sewer requisitions and adoptions to increase the capacity of the sewer network and accommodate the additional population equivalent. There are three potential areas of intervention for us to focus on to mitigate the impact of supply demand; planning, source and catchment (illustrated in Figure 45). Communication initiatives, customer incentives and partnership working can be applied at each level of intervention and may incorporate all three areas if appropriate as well as combinations of the more traditional engineering solutions developed as part of the capital and maintenance programmes.
We will manage growth and new development across the system from the source through to the impact.
Details of how we will deliver the interventions are given below in more detail.
Figure 45 Interventions that enable us to facilitate new development and improve resilience to growth

Copyright © United Utilities Water Limited 2018
Chapter 7: Supplementary Document - S6008 unitedutilities.com
53
7.3.3.1 Planning Stage Interventions Our recent stakeholder events have indicated that local authorities are keen to collaborate during the development of their local plans. They would like greater support, particularly when they undergo external scrutiny as they frequently lack the technical expertise to defend SuDs requirements. In the last few years we have been more proactive in our contact with local authorities and included their views in our household forecasting, but they would like to see more consistent working processes, co-creation of solutions, more opportunity and risk mapping to be completed and for our data to be shared. The inclusion of all affected stakeholders is required to identify areas we could work together to resolve a combination of needs.
We will continue to work closely with local authorities during development of their local plans to improve our corporate systems further with a view of sharing more information during the planning process. More detailed risk maps to assess the impact on the wastewater network for prioritised areas will also be produced. This will follow our successful IDAS approach and continue with the DWMPs.
We are working with the Greater Manchester Combined Authorities to support their production of a strategy and plan to manage the supply of land for jobs and new homes across Greater Manchester. The Greater Manchester Spatial Framework (GMSF) will ensure that there is the right land in the right places to deliver the homes and jobs needed up to 2035, along with identification of new infrastructure (such as roads, rail, Metrolink and utility networks) required to achieve this as well as developing a strategic flood risk management plan. The framework will also set out how they plan to enhance and protect the quality of the natural environment, conserve wildlife and tackle low carbon and flooding issues, so that they can accommodate new homes and jobs sustainably. By working at this level in the development of an infrastructure plan we hope to influence the sustainability of the much needed housing growth thereby easing the concerns of residents. We also hope to develop best practice in strategic planning with multiple local authorities to enable us to apply it elsewhere in our region.
We will work with local authorities to embed sustainable development in local and strategic plans with technical support and partnership interventions that will include the adoption of SuDS
Across the North West we will continue to provide guidance on surface water management to all local authorities to illustrate the risks and impacts of surface water on drainage systems and how we can work together to reduce this risk. We will also continue to influence government policy to provide more consistency between planning and water industry law such that customers’ interests and the environment are better protected. We will adopt a proactive policy on surface water to be agreed with planning authorities to ensure all planning applications consider mitigation of surface water as a priority. More detail on this policy is included under the Outcome “The risk of flooding for homes and businesses is reduced”.
We will continue to factor in the impact of climate change when we design solutions for projects such as schemes to reduce the frequency of sewer overflow operation or to reduce flood risk. Likewise, we will apply an assumption for increased runoff due to urban creep when designing improvements to a future standard. As part of this, we will identify headroom capacity at our high priority assets to enable us to plan for long term increases in flow and load.
7.3.3.2 Source Interventions Education, influencing and incentivisation are key considerations to address the source of risk. Household customers are becoming more aware of the impact of surface water run off on the drainage networks on our community surface water partnership initiatives have indicated that they are amenable to doing their bit to reduce this impact.
Research from the Tatton flower show demonstrated that permeable driveways are something most gardeners would consider as an alternative to hardstanding areas with the main barrier to installing any small scale intervention being the cost. Likewise, Salford residents also appreciated the additional benefits of greener spaces, but would not have proactively done them without the incentive of construction being completed on their behalf. Twitter and Facebook surveys reinforce this view (see Figure 46).
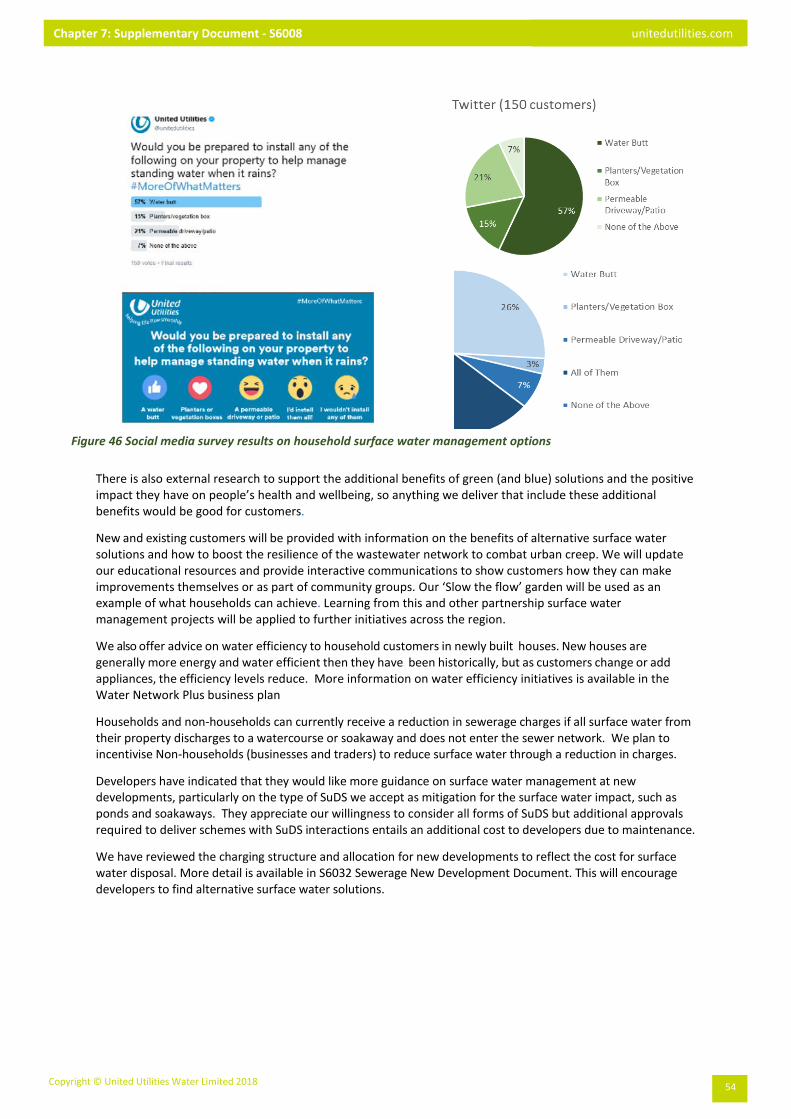
Copyright © United Utilities Water Limited 2018
Chapter 7: Supplementary Document - S6008 unitedutilities.com
54
There is also external research to support the additional benefits of green (and blue) solutions and the positive impact they have on people’s health and wellbeing, so anything we deliver that include these additional benefits would be good for customers.
New and existing customers will be provided with information on the benefits of alternative surface water solutions and how to boost the resilience of the wastewater network to combat urban creep. We will update our educational resources and provide interactive communications to show customers how they can make improvements themselves or as part of community groups. Our ‘Slow the flow’ garden will be used as an example of what households can achieve. Learning from this and other partnership surface water management projects will be applied to further initiatives across the region.
We also offer advice on water efficiency to household customers in newly built houses. New houses are generally more energy and water efficient then they have been historically, but as customers change or add appliances, the efficiency levels reduce. More information on water efficiency initiatives is available in the Water Network Plus business plan
Households and non-households can currently receive a reduction in sewerage charges if all surface water from their property discharges to a watercourse or soakaway and does not enter the sewer network. We plan to incentivise Non-households (businesses and traders) to reduce surface water through a reduction in charges.
Developers have indicated that they would like more guidance on surface water management at new developments, particularly on the type of SuDS we accept as mitigation for the surface water impact, such as ponds and soakaways. They appreciate our willingness to consider all forms of SuDS but additional approvals required to deliver schemes with SuDS interactions entails an additional cost to developers due to maintenance.
We have reviewed the charging structure and allocation for new developments to reflect the cost for surface water disposal. More detail is available in S6032 Sewerage New Development Document. This will encourage developers to find alternative surface water solutions.
Figure 46 Social media survey results on household surface water management options

Copyright © United Utilities Water Limited 2018
Chapter 7: Supplementary Document - S6008 unitedutilities.com
55
We now consider adoption of sustainable surface water interventions at new developments, providing they meet our guidance criteria. This ensures we are able to manage and maintain these assets over time and that they provide the resilience required for a defined volume and flow of surface water. We will continue to liaise with developers and local authorities as this process matures, to ensure that they have enough support in all stages of planning and building to achieve our requirements for adoption. There is a need to coordinate different development stages so that the most sustainable and efficient surface water solution can be developed, with co-operation from all parties over the development timescales.
Trader consents are set to meet the operational requirements with some headroom included for seasonality and operational variances depending on the nature of the process. This is reviewed periodically to ensure they are still appropriate for our control and risk and for compliance purposes. This enables us to better predict the future flows and loads as they cannot substantially increase without consultation and approval with us.
7.3.3.3 Programme identification and catchment interventions Supply demand investment is required to upsize wastewater treatment works, network or sludge assets. We follow the framework outlined in the UK Water Industry Research (UKWIR) report No. 07/RG/08/2 “Long term/least cost planning for wastewater supply-demand” to identify areas for investment. This approach represents national best practice and is consistent with our approach to PR14. More detail on this is given in
Case Study: Steele’s Bank Road, Wetheral
We received a section 104 application for a development of 41 properties with the potential for further future development. The initial proposal was for a pumped surface water outfall to the nearest watercourse. Instead, we worked closely with the developer and the designer to facilitate adoption of an infiltration basin. By working closely with the developer we were able to technically vet the solution to ensure it was compliant with standards and were able to adopt the SuDS.

Copyright © United Utilities Water Limited 2018
Chapter 7: Supplementary Document - S6008 unitedutilities.com
56
C06-WWN Protecting the environment from growth and new development, Performance Commitment for AMP7.
The risk based programme will deliver the defined schemes discussed in S6033 and C06-WWN Protecting the environment from growth and new development. Our assumption based on experience is that contingent schemes where a risk is defined during the business plan period will be equivalent to those sites where the risk is reduced, deferred or does not materialise and so is accommodated within the programme scope.
At each stage, we consider the full range of potential responses we can use in response to a risk. This challenges us to think about all the solutions to that risk, and not just defaulting to the “build something new/ replace an asset” option. In order to ensure the most cost beneficial approach is adopted all feasible and sufficiently reliable options have been identified for appraisal when considering an intervention. Opportunities are considered to address multiple drivers when developing a project to ensure better cost-benefit.
The IDAS process will be rolled out to other prioritised areas in line with 21st Century Drainage guidance and the development of DWMPs. Risk maps for the region have been developed so that a true view of the catchment can be viewed and more sustainable solutions developed. Further information on this process and the outcomes is included in the “risk of flooding for homes and businesses is reduced”.
We will ensure that partnership approaches are considered as solutions and will build on our experience in AMP6 where we have successfully removed surface water in the Blackpool area to reduce the frequency of sewer overflow operation and therefore impact on bathing waters. We will work proactively with other organisations (local authorities, EA, highways authorities, charities and commercial bodies) to deliver customer outcomes.
This will be achieved by:
• Fully participating and helping to improve the existing Flood Risk Management process
• Leading (if appropriate) project development
• Supporting other organisations project development
• Defining asset standards or providing guidance
• Considering aspirations of all parties and the associated risk through development of solutions
Initially the focus is on managing flood risk, however best practice and the partnership approach is being applied to other project solutions as part of our integrated catchment approach.
Targeted surface water separation is being reviewed as an option for all wastewater projects and as part of the network flooding and rivers improved programmes. Work is ongoing to identify network locations where it could be cost effective to remove surface water upstream of the connection to a combined sewer. This will contribute to the reduction of downstream flooding, reduce the frequency and volume of discharges at pumping stations and overflows and increase resilience of the network and WwTWs. These locations will be reviewed in combination with other risks within a catchment and a solution that reduces all risks (flooding, pollution, asset deterioration, permit compliance) will then be developed.
Where potential changes to sludge treatment centres are identified, a review of the future increase (or decrease) in sludge treatment liquors to the works is undertaken to ensure that supply demand has been accounted for and areas of risk or opportunity following rationalisation will be considered in line with the supply demand strategy. We will use the service level agreements that we have put in place to manage the interface between our Wastewater Network Plus and Bioresouces units to ensure that we formally recognize the impacts of each units changing plans.
These interventions will be applied over 25 years alongside Infrastructure and Non-infrastructure interventions.

Copyright © United Utilities Water Limited 2018
Chapter 7: Supplementary Document - S6008 unitedutilities.com
57
7.4 The natural environment is protected and improved in the way we deliver our service – Improving river water quality
In this section, we will describe our plans to ensure that we play our part in delivering improvements to the rivers and lakes of the North West of England. This will cover customer views, key risks around the impact of our discharges and our planned actions and costs to enhance river water quality. Where the information is included elsewhere in the business plan, this is sign posted. The majority of the improvements included in our plan are driven by the need to improve water quality so that rivers can reach good status in order to support healthy ecosystems. The principle impacts our discharges are having on reaching this target are due to phosphorus from our final effluent discharges and ammonia or biological oxygen demand associated with storm discharges. In particular, we will need to meet low standards for phosphorus at many treatment works in order to meet the targets for WFD good status. In some cases, the standards required are at the technically achievable limit set by the Environment Agency following the national phosphorus removal trials. This means that we have 31 schemes in our plan, which are targeting achieving moderate status instead.
7.4.1 Customer views
Customer Research: Improving river water quality
• In our recent choice experiment, the cleanliness of rivers ranked third out of 10 service attributes behind only the level of the bill and drinking water quality.
• When customers built their own service levels, 60% of customers chose to improve the cleanliness of rivers whilst only 8% selected a decrease.
• Our immersive ecosystem services research showed that customers placed even greater priority on creation of green infrastructure to support recreation than improving river water quality which is a consideration when we develop solutions to water quality issues.
• Stakeholders are also looking for us to maximise the use of green infrastructure solutions when we improve river water quality because of the benefits this gives to ecosystem resilience and mental wellbeing.
7.4.2 Risk and resilience River water quality in the North West has improved dramatically from the days of very visible pollution and rivers devoid of life however in common with the rest of the country many of the rivers do not yet meet the “good” standard aimed at supporting healthy ecosystem. We recognise that ecosystems deliver many services to people which are set out in S4004 Ecosystems resilience approach. As a result, it is important that as a water company we play a role in improving the overall resilience where it is relevant to the services we provide.
Our wastewater discharges primarily impact on the North West and Solway/Tweed River Basin Management Plans which the EA produce every six years (RBMP). The majority of our discharges fall into the North West RBMP where the EA forecast that by 2021, 30% of rivers will meet the good standard. Figure 47 shows that the condition of rivers is generally better in the northern half of the area we serve where population density is significantly less. In the southern half of the region, there are significant pressures on water quality arising from the large urban centres of the Greater Manchester, Merseyside and South Lancashire draining to relatively small rivers, as well as significant areas of livestock farming in areas such as Cheshire.

Copyright © United Utilities Water Limited 2018
Chapter 7: Supplementary Document - S6008 unitedutilities.com
58
We recognise that we have a key role to play in increasing the percentage of North West rivers meeting good status as wastewater discharges have been assessed by the EA as contributing to 29.1% of the water management issues identified (Figure 48). We have used our modelling capability and worked closer than ever before with the EA to establish the level of confidence we have around the need to improve our discharges to the environment. We explain the detail of the approach taken in S6027 and S6028.
The primary water quality issue is the levels of phosphorus in our discharges, for which we only have control measures for at 10% of our treatment works. Phosphorus is a nutrient and therefore it can lead to excessive plant or algae growth and therefore alteration of the ecosystem from the natural state. Blue green algal blooms can also arise in some water bodies, which cause problems for people and animals wanting to use the water body.
Additionally, our extensive combined sewer system with 2,048 combined sewer overflows designed to relieve the system in times of high flows and discharge to the water environment can sometimes lead to adverse impacts. Through water quality data and the use of our Integrated Catchment models, we have identified that some of our sewer overflows are contributing to breaches of ammonia standards or
adversely affecting the oxygen available for fish to thrive. This is a particular problem in the River Irwell, Glaze, Calder and Mersey catchments, which drain major urban areas with significant combined sewer networks.
Due to the multiple reasons for water bodies not achieving good status we recognise that it is important that we work with partner organisation to bring about sustainable improvements as part of the catchment based approach. More information on how we have been maturing our approach to working in partnership can be found in S4004 Ecosystem resilience approach section 6.
Micropollutants such as priority substances and pharmaceuticals are also of growing concern. We have actively participated in the national collaborative Chemical Investigations Programme 2 (CIP2), which has provided some very valuable insight into the role of wastewater treatment effluents in breaches of Environmental Quality Standards for priority substances3. The CIP2 programme does not complete until 2020 however, the first two phases of investigations were complete by March 2018. These results have shown some clear national trends which have changed thinking in terms of which substances are a problem in the environment and the role of wastewater treatment effluents. In particular Cypermethrin, a pesticide and Hexabromocyclododecane (HBCDD) a flame retardant, have been identified as key substances with widespread failures river water quality standards and a proven contribution from wastewater effluents. The widespread nature of these contaminants indicates that there are few major point sources of these substances and thus more needs to be understood on how these substances are entering wastewater networks and therefore treatment systems.
3 Priority substances are listed in the Priority Substances Directive, a daughter Directive of the WFD seeks to eliminate or minimise the impact of particularly damaging substances, many of which are banned and highly persistent in the environment. A list of potential priority substances is also exists to alert member states to substances of emerging concern.
Figure 47 Water Framework Directive classifications for North West England 2011

Copyright © United Utilities Water Limited 2018
Chapter 7: Supplementary Document - S6008 unitedutilities.com
59
As well as existing water quality issues, aquatic ecosystems are at threat from a number of risks including population growth and climate change. Our approach to ensuring that we continue to discharge in line with our Environmental Permit conditions despite growing populations is set out in Enhancement supplementary Ww7. There are also some circumstances where the existing permit conditions are no longer appropriate to protect the environment from deterioration and therefore a requirement for a more onerous permit has been included in WINEP3. We have 13 schemes included in our plan with no deterioration drivers. Apart from one scheme in Cumbria, the rest are all included to protect rivers in Greater Manchester and Cheshire from the impacts of growing populations. This coincides with where the population growth rate is highest in the region we serve. Further information on population growth trends can be found in S6033.
The threat of changing weather conditions as a result of climate change has a particular impact on our combined sewer overflow discharges as rainfall intensity is likely to increase leading to more frequent operation. Our approach to managing these threats to ecosystem resilience is set out in S4004 Ecosystem resilience approach section 4.2.
7.4.3 Activities and costs During AMP7 we plan to invest £626.4m capex in environmental enhancement needs included in the WINEP, with 84% of this directed at improving river water quality. This is forecast to lead to an improvement in water quality in 1315km of rivers in the North West. The remainder is split between a range of drivers including protection and improvement of shellfish waters and bathing waters. The Urban Wastewater Treatment Directive is driving the need to upgrade treatment works in increase storm tank capacity, put in place phosphorus removal and put in place flow measurement facilities. We also have a significant investigation programme which will enable us to ensure that emerging needs are fully investigated such that our PR24 business plan is built on sound evidence. The bathing and shellfish interventions are covered in detail in later in this document under the Outcome “The North West’s bathing and shellfish waters are cleaner through our actions and those of others”. The remaining major capital projects included in the WINEP. Further detail on the flow measurement and event duration monitoring programmes can be found in S6030.
Whilst the majority of the river water quality improvement schemes are aimed at achieving good status under the WFD, we do have 31 schemes which are targeting achieving moderate status. This is because it is not possible to achieve good status with the current levels of confidence in phosphorus removal technologies which has resulted in the Environment Agency setting the technically achievable limit at 0.25mg/l based on an annual average. These schemes are in the Bollin, Glaze, Irwell, Dane, Crossens, Lostock, Darwen, Mid Ribble, Irk, Irwell and Upper Weaver.
Figure 48 Reasons for not achieving good status from EA NW River Basin Management Plan (RBMP)

Copyright © United Utilities Water Limited 2018
Chapter 7: Supplementary Document - S6008 unitedutilities.com
60
In addition to capital expenditure, we are forecasting an additional £23.8m of operating costs during AMP7 as a result of meeting the tighter permit requirements arising from delivering this programme of improvements. The majority of this increased expenditure is associated with carrying out phosphorus removal which requires a significant amount of iron salts to precipitate the phosphorus as well as alkalinity correction to ensure there is no detrimental impact on the process or degradation of the concrete structures.
In managing the risk of our discharges negatively affecting river water quality we consider the full range of options set out in our Wholesale Risk Asset Planning framework, which are set out in S4003 Corporate risk management framework. We place significant emphasis on working in partnership due to the diverse range of risks that are not fully under our control, which can contribute to rivers not achieving the good status under the Water Framework Directive. The detail of how we have ensured that the right interventions are included in our plan, the options considered and how we have ensured costs are robust is included in S6027-S6031.
7.4.3.1 Integrated catchment approach In AMP6 we have significantly scaled up our partnership working, for example by being a key player in the EU funded Natural Course project, which specifically seeks to build collaborative capability to deliver the challenging requirements of the Water Framework Directive. Further information about this project and our role in it is included in S4004 Ecosystems resilience approach section 6.2. We have developed our Integrated Catchment approach, which is set out in S4004 Ecosystems resilience approach. We piloted our approach on the River Petteril catchment in Cumbria where several small rural wastewater treatment works needed to meet more onerous permit conditions in order to bring the river up to WFD good status. S4004 Ecosystems resilience section 3.2.2 describes how we have taken a catchment view to come up with a plan that delivers greater natural capital benefits at a lower cost than a conventional solution. We are now further developing our approach through our River Weaver resilient catchment demonstration (see S4004, section 3.2.3). We have already identified several integrated catchment solutions, which are embedded, in our plan, for example a partnership scheme at Burscough wastewater treatment works to deliver a wetland treatment solution to not only polish the effluent but also deliver a significant natural capital benefits through the extension of the habitat at Martin Mere WWT reserve – see Figure 49.
Our strategy to deliver cost effective environmental improvements for the people of the North West encompasses the following components:
• Taking an integrated catchment approach which involves having a good understanding of the impact we have on
ecosystems resilience and considering options at the catchment scale to improve the overall sustainability of delivery. This is set out in S4004 Ecosystems resilience approach section 3.1.
• Working in partnerships in order to find the most efficient way of bringing about the improvements people want is a core component of our integrated catchment approach (see S4004 Ecosystems resilience approach section 6)
• Technology innovation to meet the challenges of removing phosphorus to low concentrations and moving towards sustainable phosphorus removal
• Where possible making use of our existing asset base and adapting it to meet new phosphorus standards, for example by converting Continuously Operating Upward Flow (COUF) filters to the BluPro process which can meet low phosphorus limits.
• Improving the stewardship of phosphorus as a valuable resource by putting in place phosphorus recovery at our largest wastewater treatment works at Davyhulme and by optimising the amount of phosphorus we remove biologically.
• Delivering innovative investigations such as a feasibility study into combined mine water and sewage effluent treatment at Rhodes Farm near Bolton wastewater treatment works (See S4004 Ecosystems resilience approach section 3.2.5) and the River Weaver resilient catchment trial (see 4004 Ecosystems resilience approach section 3.2.3)
• Increasing the flow sent to full treatment where this offers the most cost effective and resilient solution to address the impact of storm tank overflow operation (see Enhancement supplementary Ww2).

Copyright © United Utilities Water Limited 2018
Chapter 7: Supplementary Document - S6008 unitedutilities.com
61
As we move forward towards our PR24 Business Plan, we intend to take significant steps to embed natural capital approaches in our business such that they play a significant role in the development of our PR24 business plan.
7.4.3.2 Sustainable Phosphorous Removal One of the big challenges in improving water quality is removing phosphorous in sustainable ways that do not use large quantities of chemical or lock up phosphorous which is a finite resource required for crop growth. We have therefore been looking to find more sustainable ways to remove phosphorus at both our treatment works serving less than 1000 people and much larger plants serving several hundred thousand people. In the case of smaller treatment works we are under taking significant trials in our River Weaver Demonstration Catchment to determine the effectiveness and applicability of a range of low tech, sustainable technologies including reactive media and constructed wetland treatment systems. We have identified four sites where we are confident that reactive media is the right solution to meet the environmental needs with a high level of confidence and one site where we will build a constructed wetland. As we continue our research and development we will seek to stretch the applicability of these technologies to more situations.
An integrated catchment approach to addressing a non-cost beneficial Water Framework Directive need for Burscough WwTW
Burscough Wastewater Treatment Works serves over 30,000 people and discharges upstream of Martin Mere which is a Wildfowl and Wetlands Trust (WWT) nature reserve. A conventional treatment solution to meet the phosphorus standards required by the Water Framework Directive is non-cost beneficial so without innovation the phosphorus load upstream of this important habitat would not be improved. In AMP7 our plan is to work in partnership with the WWT to develop and deliver a partnership solution which would include:
• Developing both treatment and conservation reed beds in agricultural land adjacent to the existing Martin Mere reserve, thereby expanding the area of habitat
• Diverting the final effluent from Burscough treatment works to the treatment reed bed for polishing • Optimising the existing phosphorus removal at Burscough treatment works to reduce the load discharged to the
reed bed • Enhancing the amenity value and public access to deliver further natural capital benefits
Figure 49 Martin Mere, Burscough WwTW integrated catchment approach

Copyright © United Utilities Water Limited 2018
Chapter 7: Supplementary Document - S6008 unitedutilities.com
62
For larger treatment works we have done a significant amount of research and development into the use of the Nereda granular activated sludge process (see Figure 50) both by ourselves and on behalf of the industry under the Advanced Phosphorus Innovation Programme. We originally started to trial Nereda as its low physical footprint offered significant capital savings on our AMP6 programme where we needed to significant extend or replace treatment processes on sites with little available land. Successful trials led to us awarding contracts to build the process at Kendal, Morecambe, Blackburn and Failsworth wastewater treatment works. For the Advanced Phosphorous trial we selected Macclesfield WwTW as this site is typical of many in the North West with relatively weak influent sewage, which has previously been a barrier to biological phosphorous removal. Additionally this treatment works was likely to have future investment needs. The process was originally developed in the Netherlands where sewer systems are largely separate however working with Royal Haskoning the proprietors of the technology and Delft University the inventors, we have pushed the boundaries in terms of the conditions the process can successfully operate under and proven the weak combined sewage is not an barrier to its use. This technology has significant potential, however the rate of deployment may be limited while we continue to challenge the cost to deliver. We have currently only found it to be cost effective on a whole life cost basis where there is a need to rebuild the existing works or where the footprint is limited. We have a small number of schemes in our programme of this nature. We only have one site we have currently identified this technology for in AMP7, which is Macclesfield as there are multiple investment drivers. A case study on our options appraisal for this site can be found in S6027 - WINEP phosphorus. Additionally, further information on our innovation journey with Nereda can be found in Innovation in action S5001 – case study 9. 7.4.3.3 Investigations programme We have a wide ranging investigations programme included in our plan which will largely be delivered by 2021 in order to inform our next business plan (see Figure 51). This part of the plan will gather evidence around a number of emerging issues and opportunities such as priority substances, options to move bathing waters to excellent status and options to improve protected habitats to a near natural state. In most case we will firstly identify whether there are risks associated with our discharges which are impacting on ecosystems and secondly what the most appropriate means of control might be and whether it is cost beneficial to put in place control. This will ensure any future interventions are well evidenced.
Figure 50 Granular activated sludge

Copyright © United Utilities Water Limited 2018
Chapter 7: Supplementary Document - S6008 unitedutilities.com
63
Investigation category WINEP driver code No of drivers
Purpose of investigation
Chemical Investigations Programme 3
WFD_MON_CHEM, WFD_INV_CHEM1, WFD_INV_CHEM2, WFD_INV_CHEM3, WFD_INV_CHEM5, WFD_INV_CHEM6, WFD_INV_CHEM7, WFD_INV_CHEM8, WFD_INV_CHEM9, WFD_INV_CHEM10, WFD_INV_CHEM11, WFD_INV_CHEM12, WFD_INV_CHEM14
35
To investigate: • trends in influent and effluent concentrations for
priority substances. • performance of coastal WwTW in relation to key
priority substances. • the risk presented by WwTW discharging to
groundwaters • the role of WwTW in the emerging issues of
microplastics and anti-microbial resistance • drainage catchment sources of cypermethrin and
HBCDD • the occurrence of priority substances in sludge
treatment and sludge to land. • mechanisms of priority substances removal in WwTW • die off of triclosan and TBT concentrations • the effectiveness of phosphorus removal technologies
at removing priority substances
Water Framework Directive load standstill investigations
WFD_NDLS_CHEM1, WFD_NDLS_CHEM2
4 To implement load standstill limits for either zinc or mercury at 4 WwTWs
Bathing water investigations
BW_INV3, BW_INV4 21 To investigate if there are cost beneficial options to move to good or excellent status at 21 bathing waters
Habitats Directive investigations
HD_INV 5 To develop options to meet long term targets to protect habitats from nutrient enrichment due to phosphorus (Lake Bassenthwaite and Rivers Eden, Derwent, Kent and Eden). This has the potential to impact 101 wastewater treatment works
UWWTD – high frequency spiller investigations
U_INV 195 To undertake Environmental impact assessment and cost benefit analysis for 195 overflows identified as spilling frequently
UWWTD- flow measurement investigations
U_INV2 84
To investigate whether existing MCERT flow meters can be used to determine flows passed to full treatment in lieu of installation of additional flow meters
Water Framework Directive investigations
WFD_INV 3 To investigate the impact of storm overflows discharging to Pennington Flash and the River Bollin. To investigate the feasibility of co-treating final effluent and storm discharges at Rhodes Farm using minewater.
Invasive non-native species investigations
INNS_INV 3 To investigate pathways for spread of invasive non-native species as a result of our activities and develop an options appraisal.
Fish passage investigations
WFD_INV_FISH 3 To determine the impact of the weirs on fish distributions and productivity. Options appraisal to be undertaken to address any identified impacts.
River Alt partnership investigations
WFD_IMPm 1 To work in partnership with the Catchment host to develop a plan to address priority substances in the River Alt catchment.
Manchester Ship Canal/Irwell phosphorus investigations
WFD_ND (required as a condition of the following WINEP unique IDs 7UU200731, 7UU200734, 7UU200768, 7UU200770, 7UU200127)
1 To investigate the current and future sources of phosphorus which could lead to further deterioration in the phosphorus concentrations in the Manchester Ship Canal. Undertake an options appraisal to determine the best long term options to reduce the impact of phosphorus in the Manchester Ship Canal.
Figure 51 AMP7 investigations programme

Copyright © United Utilities Water Limited 2018
Chapter 7: Supplementary Document - S6008 unitedutilities.com
64
Our AMP7 plan includes all Water Framework Directive schemes that are currently cost beneficial and therefore likely to be included in the approval of River Basin Management Plan 3 in December 2021. Figure 52 shows our planned profile of Water Framework Directive expenditure across AMPs. Whilst this shows a significant peak of expenditure in AMP8 in reality this is likely to reduce significantly as these schemes are currently non-cost beneficial which means alternative objectives may be required which involve greater amounts of asset optimisation and less new build processes. Alternatively through innovation and our integrated catchment approach different interventions may be found that allow more Water Framework Directive improvements to become cost beneficial. A good example of this is the feasibility study we are undertaking for Bolton wastewater treatment works in AMP7 with the aim of finding a cost beneficial way to improve effluent quality. Details of this innovative study can be found in S4004 Ecosystems resilience approach section 3.2.5.
Figure 52 Profile of Water Framework Directive expenditure (NOTE: AMP8 assumes all schemes become cost beneficial)

Copyright © United Utilities Water Limited 2018
Chapter 7: Supplementary Document - S6008 unitedutilities.com
65
Outcome: The North West’s bathing and shellfish waters are cleaner through our work and the work of others
Summary We continuously manage the risk of returning non-compliant effluent to the environment to protect bathing and shellfish waters from deterioration. This not only involves effective operation and maintenance of our assets but also a focus on external risks such as climate change, land use, population growth and changing
customer behaviours. Additionally there is customer, stakeholder and regulatory interest on us to improving the quality of bathing waters. This means that we have a targeted enhancement programme to improve 6
overflows and one final effluent discharge in AMP7. Additionally, we will investigate options to move bathing water quality to excellent where it is not already at this status.
Current Performance Since 2012 bathing water quality has improved significantly from a position where 18 bathing waters were
predicted to fail the new Bathing Water Directive standards to 100% compliance for 2 years. Additionally, there has been nearly a 4 fold increase in Excellent bathing waters. Whilst many of the shellfish beds are located near bathing waters they have not improved as significantly over this timeframe, potentially due to their location in
estuaries where they are more exposed to pollution.
Innovation Building on our AMP6 transformation projects
we will optimise maintenance of our assets and move to a more proactive approach supported by the use of asset analytics.
Operation will be increasingly supported by remote operation and control. Using our
Integrated Catchment Approach we will improve river water quality in a more
sustainable way by recognising the value of natural capital.
Risks Extreme weather patterns Increased remote monitoring revealing new performance issues Keeping pace with population growth Successfully influencing customer behaviour Deterioration due to diffuse pollution including the impact of salt marsh grazing
Efficiency Using our full suite of coastal models we have identified targeted interventions to improve bathing and shellfish water quality. Our models have also given useful insight into the impact of our discharges, which is informing our approach to resilience. By working in partnership through Turning Tides we will develop options to improve bathing waters to excellent.
Customer Expectation
A survey of 1800 North West beach visitors found recreation
and relaxation are the overwhelming reasons for
visiting beaches with only 8% of visitors intending to swim or
paddle. However, 58% of customers are willing to pay
more to improve the cleanliness of our lakes and seas for
swimming.

Copyright © United Utilities Water Limited 2018
Chapter 7: Supplementary Document - S6008 unitedutilities.com
66
8 The North West’s bathing and shellfish waters are cleaner through our work and the work of others
This section describes our approach to sustaining and improving the quality of the bathing and shellfish waters of the North West. There are 30 designated bathing waters which range from rural beaches in Cumbria such as Allonby to the major resort of Blackpool (see Figure 53). Whilst 26 are coastal there are also four inland bathing waters on Lake Windermere, the home of the Great North Swim, which is Europe’s largest open water swimming event.
Additionally the North West coast provides many suitable environments for shellfish to grow that can be harvested commercially. Mussels and cockles are harvested from many of the estuaries and bays along the coast, such as Morecambe Bay.
In order to protect both bathing and shellfish waters over 1.9m of the population equivalent we serve are connected to treatment works which have received significant upgrades to reduce the risk of bacteria or viruses reaching these sensitive locations.
Customers are protected from deterioration in water quality by two ODIs (treatment works compliance and pollution) which hold us to account for operating in line with our permits. Additionally, the EA have enforcement powers available to them in the event of discharges being made which are not in line with permit conditions.
Figure 53 Location of designated bathing waters in the North West

Copyright © United Utilities Water Limited 2018
Chapter 7: Supplementary Document - S6008 unitedutilities.com
67
8.1 Customer Views
Customer Research: The North West’s bathing and shellfish waters are cleaner through our work and the work of others
• Across the North West coast we found beach based recreation and relaxation are the overwhelming reasons for visiting with usage for swimming and paddling low at just 8% of visitors
• Many customers are however interested in paying a bit more to improve bathing water quality. When we asked customers to build their own service levels as part of a choice experiment 58% opted to improve the cleanliness of our lakes and seas for swimming and only 10% opted for compensation to accept a deterioration.
• We have not specifically spoken to customers to seek their views on shellfish water quality as this is an issue that is quite removed from most customers. We do however recognise that stability in water quality classifications is important for the shellfish industry if they are to invest in their businesses with confidence.
• The diversity of the North West’s beaches was highlighted by revealed preference research which shows the nature of visits varies widely from the resort of Blackpool to rural beaches in Cumbria. The draw of Blackpool is highlighted by the finding that 50% of visitors are overnight visitors and day trippers to Blackpool also travel nearly twice as far as day trippers to other beaches (57 miles versus 32 miles).
8.2 Risk and resilience In 2012, we became a founding member of the Turning Tides partnership which was set up to address the threat that the North West’s bathing waters were at significant risk of performing poorly under the tighter standards of the revised Bathing Water Directive, which came fully into force in 2015. This had the potential to cause a significant impact for the North West particularly in terms of the reputation of its coastal environment. Since then we have seen 18 bathing waters moved from a risk of being classed as poor water quality under the revised Bathing Water Directive to 100% classed as at least sufficient status and nearly a four fold increase in the number of excellent bathing waters. This led to Blackpool South receiving its first ever Blue Flag in 2016 which it has sustained for three years (see Figure 54). This represents a much more significant improvement than planned. However we are not complacent about these gains and thus we continue to work through Turning Tides to ensure we have an up to date view on bathing water performance risks so that appropriate actions can be planned (see Figure 55).
Figure 54 Blackpool South beach being awarded its first ever blue flag in 2016

Copyright © United Utilities Water Limited 2018
Chapter 7: Supplementary Document - S6008 unitedutilities.com
68
Bathing water quality can deteriorate over the long term or during short-term incidents due to a range of factors some of which are under our control. These include:
• Asset failure at either treatment works or on the sewerage system • Operational error • Non flushable objects causing blockages or damage to the sewerage system or treatment works • Poor asset design • Growth in demand exceeding the capacity of the system • Weather conditions – particularly heavy rainfall triggering overflow operation • Run off of animal waste from agricultural land including grazed salt marshes • Drainage misconnections • Birds/wildlife • Dog fouling
The sewerage system in coastal areas is at risk of causing pollution, which can result in loss of public amenity as discharges are in close proximity to bathing waters. This is a particular concern to local authorities and businesses in coastal areas where there is a risk to the reputation of the beach. As parts of the North West coast are heavily urbanised this is a contributory factor to the risk. Blackpool in particular has a high population density with 4,013 people her km24 which is on a par with many cities in the UK such as Birmingham, Liverpool and Nottingham. This results in a significant pollutant load, which needs to be managed in order to avoid an adverse impact on public health or loss of amenity value. Tourist visitors further add to the load that we must manage at a time when amenity value is at its highest in the summer months.
4 Office for National Statistics Estimates of the population for the UK, England and Wales, Scotland and Northern Ireland, Mid 2017 data set
Figure 55 Bathing water performance in the North West based on the revised Bathing Water Standards which came into force in 2015 (source EA)

Copyright © United Utilities Water Limited 2018
Chapter 7: Supplementary Document - S6008 unitedutilities.com
69
Following our AMP6 investment we now have a full suite of coastal water quality models for the whole of the North West which means we have a good understanding of the factors impacting on water quality at each location. This has provided further evidence to support our existing understanding on high risk assets but also identified further ones we were not aware of. We have shared the outputs from these models as well as customer research with stakeholders through the Turning Tides partnership to gain greater insight into the issues and to support a fully integrated action plan for the partnership. These models have confirmed that Fleetwood wastewater treatment works is one of our biggest risks to bathing water quality due to the proximity of large sewage flows to multiple bathing waters. If an issue were to develop it could impact on up to 7 bathing waters on the Fylde coast including the whole Blackpool resort.
Fleetwood wastewater treatment works serves most of the Fylde coast, including Blackpool treating nearly 200,000m3 a day with a system upstream of it storing up to a further 200,000m3 of sewage in wet weather. Once the system is full three large outfalls along the Fylde coast can discharge flows of circa 10,000 l/s. A particular risk occurs when the sewer system first flushes out after dry weather as significant amounts of debris including wet wipes and grit are rapidly re-suspended having settled out in the 11km long tunnel which is immediately upstream of the inlet pumps to the wastewater treatment works. These solids can result in pump blockage or blockage of the inlet screens to the treatment works. We use the ‘4 Rs’ of resilience in order to manage this risk:
Coastal modelling capability
• Five coastal models built in AMP6 covering the whole North West coast
• Built by modelling experts from Intertek supported by Prof David Kay, Aberystwyth University
• Environment Agency engaged throughout to ensure models reflect the best understanding of environmental conditions
• Models subjected to external independent audit by Prof Roger Faulkner, Cardiff University
• Models will be updated to inform an AMP7 investigation to move to excellent water quality status
•Operating philosophy optimised to reduce the risk of conditions developing in the tunnel which might give rise to a blockage
•Anchorsholme pumping station outfall extension will complete in 2019 which will move one of the three discharges so it is very unlikely to impact the beaches
Resistance
•Condition based monitoring for inlet pumps•Enhanced cleaning and maintenance regimes on all critical assets
Reliability
•Temporary supplementary inlet pumping is in place should the permanent inlet block
Redundancy
•24hour Integrated Control Centre Response Manager in place to coordinate response•Established contingency plans in place•Established procedures for notifying the Environment Agency ahead of any discharge occurring•Boxed spares available for critical assets
Response & Recovery

Copyright © United Utilities Water Limited 2018
Chapter 7: Supplementary Document - S6008 unitedutilities.com
70
More broadly, prior to every bathing season we carry out specific pre-season checks on all treatment and sewerage assets which are at risk of impacting bathing waters if they were to malfunction. This is in addition to our regular cyclical maintenance, which ensures we have these assets in the best possible condition ahead of the bathing season. Operational teams are also briefed at the start of every season to highlight the specific risk around bathing waters and to ensure they are clear on the importance of raising and escalating risks when they occur. Whilst asset failure is not totally predictable, asset condition monitoring can give a good insight into impending issues. This is therefore an approach we apply to higher risk assets. Other approaches to managing uncertainty include holding boxed spares to ensure rapid reinstatement of service in the event of failure. In addition to these specific approaches used for bathing waters we also use our WRAP framework to identify risks and escalate them for intervention if this is appropriate. This approach is described S4003 Corporate risk management framework – section 4.1.
One of the key areas of uncertainty impacting bathing and shellfish water quality is the weather conditions. When the weather is atypically wet as was the case in the 2012 bathing season it can lead to a significant deterioration in bathing water quality due to sewer overflows operating more frequently (see Figure 56) and also due to run off from agricultural land. The Environment Agency operate a pollution risk forecasting system to cover these eventualities so that the public can be advised if there is a heightened risk of water quality deteriorating. In addition to this, we operate our own real time spill warning system for sewer overflows so that the public can make an informed decision about bathing when an overflow has operated. This data is also shared with Surfers Against Sewage so they can share the information with their members.
When upgrading our sewerage system we take account of the variability in rainfall when modelling solutions and we also account for climate change. Modelling techniques have improved significantly over the last 20 years so historic asset designs may not account for the variability we now see in rainfall. During AMP7, we will be investigating overflows which are operating at a high frequency to determine the root cause. This may identify where there are assets that no longer cope with the rainfall patterns we now see. By using our coastal models, we will be able to investigate the impact of this operation.
We accept that we cannot remove risk entirely from our treatment works/sewerage assets due to the varied and unpredictable nature of events, which could occur. It would not be customers best interests to invest in assets to mitigate against all eventualities, we do however have plans in place supported by our integrated control centre, that if incidents do occur we have an appropriate response to the scale of the incident. Scenarios are routinely run to test these processes to ensure we are always ready.
We also work with the Environment Agency to understand where there are bathing waters at risk of decline that our discharges may be affecting. In early 2017, the Environment Agency identified six North West bathing waters were at risk of decline. By the end of our £250m AMP6 bathing and shellfish water investment
Figure 56 UU Real time storm overflow spill warning system

Copyright © United Utilities Water Limited 2018
Chapter 7: Supplementary Document - S6008 unitedutilities.com
71
programme we anticipate that most of the bathing waters that are at risk of decline will become more stable in their classification. Residual risks are likely to remain in Cumbria where a mix of issues including diffuse pollution from agriculture, privately owned septic tanks and storm discharges from a small number of our rural wastewater treatment works may remain. Allonby South is the only bathing water where there is a risk of the bathing water declining to poor where our discharges are a significant contributory factor. We gained this insight following the development of our coastal model for this area as well as through installing spill monitoring on the storm tanks of rural wastewater treatment works in the inland catchment.
Whilst bathing water quality has improved dramatically over the last 20 years; the pace of improvement for shellfish beds has been less marked despite them being located near bathing waters in many cases. There are a number of potential reasons for this including:
• The location of shellfish beds at the mouth of urbanised estuaries
• The accumulation of bacteria in the flesh of shellfish which are filter feeders so they accumulate bacteria from the water column.
• The sediment that shellfish live in acting as a reservoir for bacteria
Only one shellfish bed (Morecambe Bay Leven) in the North West currently meets the standards set out in the Water Framework Directive. This situation is common with other parts of the country where improving shellfish water quality has been challenging. The risk of declining water quality at shellfish beds is associated with the same factors as for bathing waters.
Whilst the current compliance situation is unlikely to affect public health because there are controls in place to prevent this it does have an economic impact. In order to understand the impact on the shellfish industry it is useful to refer to the Shellfish Hygiene standards which dictate if shellfish can be harvested and what (if any) pre-treatment is required before entering the human food chain. In most cases, the shellfish beds are long term class B which means they need pre-treatment through purification or cooking using approved methods. The long-term nature of the classification is important as it allows the shellfish industry to make commercial decisions about whether to invest in pre-treatment technology with confidence and will not be abortive expenditure. Class C beds do exist at the mouths of the Ribble and Wyre estuaries. These are the lowest quality that can be harvested and the shellfish must be relayed in cleaner waters before they can go into the food chain. We are carrying out investment that will benefit both the Ribble and Wyre shellfish beds during the AMP6 period.
8.3 Activities and costs In managing the risk of impacting bathing and shellfish water quality we consider the full range of options set out in our Wholesale Risk Asset Planning framework which are set out in more detail in S4003 Corporate risk management framework. We place significant emphasis on working in partnership due to the diverse range of risks that are not fully under our control which can contribute to declining bathing water quality. We continue to play an active role in Turning Tides; the pan North West bathing water partnership with representation at senior levels across the following sectors: local authorities, agriculture NGOs, tourism, Environment Agency, public health as well as ourselves. The partnership’s objectives have recently been refreshed in order to build on the water quality improvements achieved to date and to put more focus on realising the benefits. For example, the Director of Public Health for Blackpool is now a board member and activity has started to engage
Figure 57 Location of shellfish beds in the North West

Copyright © United Utilities Water Limited 2018
Chapter 7: Supplementary Document - S6008 unitedutilities.com
72
local people in using the beach as a place of exercise and social interaction. This is seen as a priority for the partnership as Blackpool has a fantastic natural capital asset – the beach. However, despite the town’s population living no more than 3km from the sea they have the lowest life expectancy in England at just 74.3 years.
We part fund the role of Turning Tides (Figure 58) Communications and Engagement Manager, which is a key role in drawing together the partnership’s activities. In recognition of the ongoing benefits of the partnership in protecting water quality and realising the benefits of UU investment, we continue to support this key role. As well as coordinating work in the North West we have supported the role being used to coordinate some communications campaigns nationally such as #binitforbeaches as we recognise the importance of consistent messaging in driving behaviour change.
A key objective for the Board of Turning Tides is to ensure that there is a multi-sector action plan in place, which will realise the ambitions to improve bathing water quality where it is cost beneficial to do so. By being involved with this we can ensure that all sectors play their part and importantly we can share key information for example our technical expertise gained from building models of the North West coast or our customer insight relating to bathing waters.
Historically we have built a significant number of new assets to improve bathing and shellfish water quality as our sewerage and treatment systems were not adequate to meet the standards. As we move forwards into AMP7 our focus will switch more to operational interventions, optimisation and refurbishment of existing assets in order to sustain the significant improvements in water quality that have been achieved. There will also be a modest programme of enhancement schemes that will require new assets. We have thoroughly reviewed the need for these enhancement schemes as the WINEP has developed which is explained in detail in S6028 Supplementary Ww2.
We will also carry out comprehensive investigations and options appraisals to determine if there is a cost beneficial plan, which could move bathing waters securely to good or excellent status. We have chosen this option as it is important that we monitor the benefits delivered by the AMP6 programme, which have been more substantial than planned before we start to embark on further significant expenditure. Alongside this, we will build a range of innovative partnership options to deliver future enhancements where they have customer support.
In terms of shellfish waters our plan focuses on preventing deterioration in quality, which is an issue for Silloth and Morecambe Bay Leven shellfish beds. This is valued by the shellfish industry who rely on consistent quality in order to be able to harvest shellfish efficiently. We also recognise that our discharges do contribute to non-compliance with the shellfish standards at many locations on the North West coast. For example, our modelling study for the North Wirral/Mersey area showed that non-compliance of the North Wirral shellfish beds is significantly influenced by our discharges. However, we would need to carry out very substantial upgrades to sewerage and treatment assets in the Liverpool and Wirral areas in order to comply with this. The scale of work required would be in excess of £800m which the Environment Agency have confirmed is not cost beneficial and additionally it may not be technically feasible. In the case of the Ribble estuary we are carrying out significant work in AMP6 which we need to monitor the impact of prior to considering further work. Even without focused interventions to improve shellfish waters it is likely that the Ribble and other catchments will gain some benefit from work carried out to meet Water Framework Directive standards on inland rivers, for example through the significant upgrade planned for Burnley wastewater treatment works (see S6028 Supplementary Ww2)
In order to bring about a step change in shellfish waters significant innovation and long term planning is required. The development of DWMPs in AMP7 will be prioritised based on a range of both environmental
Figure 58 Turning Tides logo

Copyright © United Utilities Water Limited 2018
Chapter 7: Supplementary Document - S6008 unitedutilities.com
73
and customer needs, which will include shellfish waters. This will help to identify the right long-term plan to manage the drainage system. We will also work to improve the way we work with local authorities to support management of surface water being at the heart of development plans. Further information on this can be found in the “Protecting the environment from growth and new development section of this document”.
8.4 Our totex plan to deliver the service Our enhancement totex expenditure associated with bathing and shellfish waters is £40.8m (excluding the Blackburn WwTW project to increase FTFT carryover expenditure, which is included in WwS2 line 33 and S6027). Additionally there are interventions that will be carried out using our base maintenance expenditure to help sustain bathing and shellfish water quality.
[] []
Figure 59 []
9 Plan Summary Our purpose is to provide a great wastewater service to the customers and communities in the North West, creating long-term value for all stakeholders. A sound understanding of customer priorities and the current and future risks to wastewater service provision underpin our plan. Through our corporate approach to managing risk and solution development as well as market testing of costs we have developed a plan that offers great value to customers. As we move forward through AMP7 we will mature our approach to natural capital accounting, which will further sharpen our focus on understanding where we can deliver even better value to the people of the North West. We will use our integrated catchment approach to innovate to find more cost effective and sustainable approaches to enhance services without putting undue burden on customers’ bills. At the same time, we will make increasing use of systems thinking to run our production lines and build on the transformation projects we have delivered in AMP6 to pursue, our vision is to be the best UK water and wastewater company. We have been consistently clear that we will achieve this by providing great service to our customers, at the lowest sustainable cost, in a responsible manner. We commit this plan for Wastewater Network Plus as central to achieving this vision.
[]
[]