waste to energy a solution for energy and environmental crisis -final
TRANSCRIPT
2014-15
BRIJRAJ PANDEY
PGPEM
INDIAN INSTITUTE OF MANAGEMENT,
RANCHI
2014-15
" Waste To Energy - A Solutionfor energy and environmentalcrisis "
ACKNOWLEDGEMENTS
I am sincerely grateful to Dr. Priyanka Kaushal without whom this study would not have
been possible. Six Months ago, Dr. Priyanka opened my eyes to the global solid waste
management problem, which has made me more conscious about my own garbage
generation and recycling habits. Since then, I have carried with me a sense of urgency about
the solid waste management crisis in India, where I grew up. I thank her for her interest in
promoting waste-to-energy in India and his support and guidance throughout this project.
I thank Prof. Amit Sachan, Core Faculty of Indian Institute of Management, Ranchi, for his
help in providing Pathway and greatly appreciate his support in completing this report.
I am highly indebted to Ms. Anita Singh Sravano for their guidance and constant supervision
as well as for providing necessary information regarding the project.
I would like to express my gratitude towards my parents & member of (Energy information
Administration-EIA & Waste-To-Energy Research and Technology Council –WTERT) for their
kind co-operation and encouragement which help me in completion of this project
I also need to thank Yuvraj Pandey and Nicky Pandey for their invaluable support and help
in editing the report.
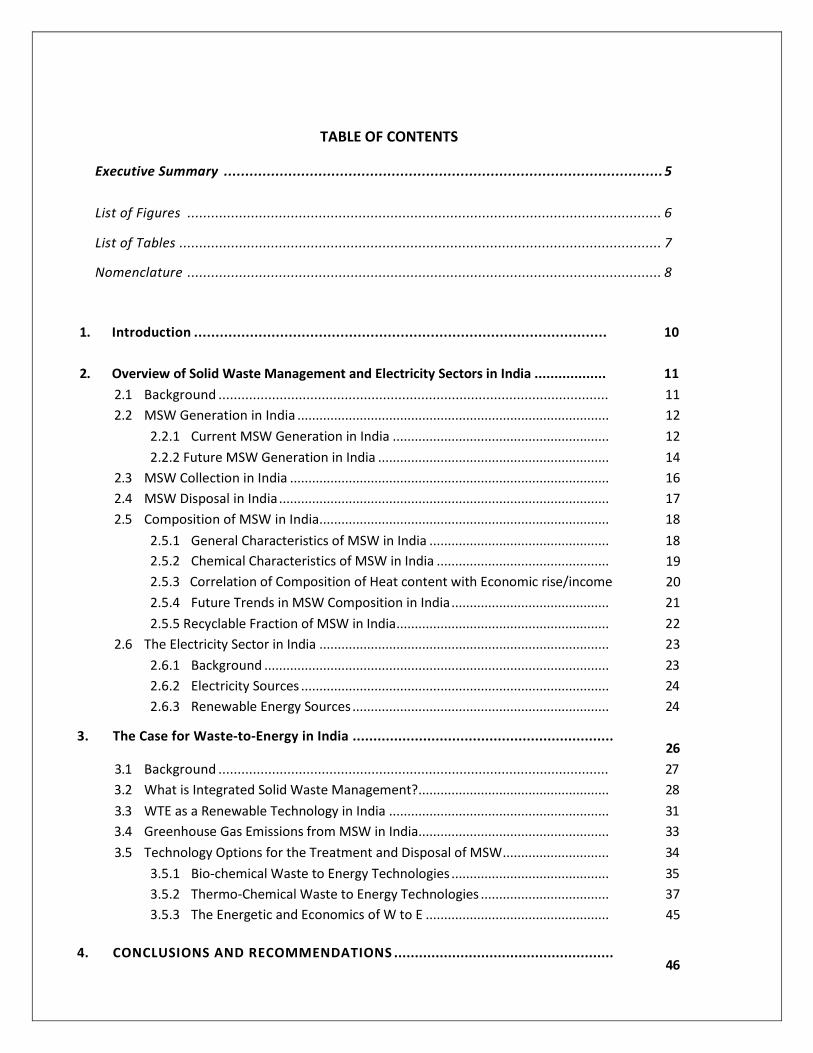
TABLE OF CONTENTS
Executive Summary ...................................................................................................... 5
List of Figures ....................................................................................................................... 6
List of Tables ......................................................................................................................... 7
Nomenclature ....................................................................................................................... 8
1.
2.
Introduction ................................................................................................
Overview of Solid Waste Management and Electricity Sectors in India ..................
10
11
2.1 Background ...................................................................................................... 11
2.2 MSW Generation in India ..................................................................................... 12
2.2.1 Current MSW Generation in India ........................................................... 12
2.2.2 Future MSW Generation in India ............................................................... 14
2.3 MSW Collection in India ....................................................................................... 16
2.4 MSW Disposal in India.......................................................................................... 17
2.5 Composition of MSW in India............................................................................... 18
2.5.1 General Characteristics of MSW in India ................................................. 18
2.5.2 Chemical Characteristics of MSW in India ............................................... 19
2.5.3 Correlation of Composition of Heat content with Economic rise/incomelevels
20
2.5.4 Future Trends in MSW Composition in India........................................... 21
2.5.5 Recyclable Fraction of MSW in India.......................................................... 22
2.6 The Electricity Sector in India ............................................................................... 23
2.6.1 Background .............................................................................................. 23
2.6.2 Electricity Sources .................................................................................... 24
2.6.3 Renewable Energy Sources...................................................................... 24
3. The Case for Waste-to-Energy in India ...............................................................26
3.1 Background ...................................................................................................... 27
3.2 What is Integrated Solid Waste Management?.................................................... 28
3.3 WTE as a Renewable Technology in India ............................................................ 31
3.4 Greenhouse Gas Emissions from MSW in India.................................................... 33
3.5 Technology Options for the Treatment and Disposal of MSW............................. 34
3.5.1 Bio-chemical Waste to Energy Technologies ........................................... 35
3.5.2 Thermo-Chemical Waste to Energy Technologies ................................... 37
3.5.3 The Energetic and Economics of W to E .................................................. 45
4. CONCLUSIONS AND RECOMMENDATIONS .....................................................46
Appendices
1. Estimating the waste generation and related carbon dioxide emissions in 2030 49
2.Decision Support Matrix: Statistical Summary of Opinion of the Experts 50
3.SWOT matrix to be used by the customer and provider of technology for management of MSW 51
4.Recommendations on Public Private Partnerships (PPP) in Waste to Energy Projects (Report of TaskForce on Waste to Energy 57
References ..................................................................................................................... …………59
5
Waste To Energy- A Solution of Environmental & Energy Crisis l PGPEM, IIMR l BRIJRAJPANDEY
EXECUTIVE SUMMARY
For a number of years, India has been facing a solid waste management crisis. The
infrastructure has been unable to keep pace with economic development and population growth,
resulting in insufficient collection of municipal solid waste (MSW) and over-burdened dumps.
Improper disposal of solid wastes over the decades and open burning of garbage have led to serious
environmental pollution and health problems. In order to move towards a sustainable future and
achieve its goal of becoming a world-class, India needs to adopt an integrated solid waste
management approach.
The Government of India -- Ministry of Environment and Forests promulgated the Municipal
Solid Wastes (Management and Handling) Rules in 2000 requiring that municipalities across India
adopt sustainable and environmentally friendly means of processing MSW, including incineration.
Our Honorable Prime Minister Shri.Narendra Modi is also started mission “SWAACH BHARAT
ABHIYAAN” In this regard, waste-to-energy provides a solution towards both complying with the
central government regulations as well as achieving integrated solid waste management. Waste-to-
energy is perceived as a means to dispose municipal solid waste, produce energy, recover materials,
and free up scarce land that would otherwise have been used for landfilling. Contrary to public
perception, waste-to-energy can accomplish these goals in a more efficient and environmentally
benign manner than landfilling.
6
Waste To Energy- A Solution of Environmental & Energy Crisis l PGPEM, IIMR l BRIJRAJPANDEY
LIST OF FIGURES
Figure 1 Map of MSW Generation in India ....................................................................................11
Figure 2 Map of MSW Generation as per TPD ..................................................................................12
Figure 3 Urban population and waste generation in India (1995-2030)........................................ 15
Figure 4 Waste generation and carbon dioxide emissions in India (1995-2030...............................15
Figure 5 Characteristics of current MSW in low-income countries.............................................18
Figure 6a Characteristics of MSW in India in 1995 ..........................................................................18
Figure 6b Characteristics of MSW in India in 2011 ..........................................................................18
Figure 7 steady increase in the heat content of waste since 1989 in USA............................20
Figure 8 Characteristics of future MSW in current low-income countries in 2025 .........................21
Figure 9 Cost & Tariff of Electricity from 2008 to 2011 ....................................................................24
Figure 10 Waste disposal Hierarchy..................................................................................................28
Figure 11 Graphical representation of the integrated solid waste management approach ..............29
Figure 12 Integrated MSW Management System for the Population of more than 2 Million ..........30
Figure 13 PPP Agreement options for Integrated MSW management available to
municipal authority 30
Figure 14 Technology Options for the Treatment and Disposal of MSW ..................................35
Figure 15 Performance of various thermo-chemical conversion technologies ........................38
Figure 16 Converting MSW,Solid Waste into energy,gases,fuels and chemicals..............................39
Figure 17 Process Schematic, MSW to Electricity via Pyrolysis. ........................................................40
Figure 18 Process Schematic, MSW to Electricity via Gasification.....................................................41
Figure 19 Process Schematic, MSW to Electricity via Incineration ....................................................42
Figure 20 waste plastic to liquid fuel .................................................................................................44
7
Waste To Energy- A Solution of Environmental & Energy Crisis l PGPEM, IIMR l BRIJRAJPANDEY
LIST OF TABLES
Table 1 Waste generation per capita in Indian cities ............................................................... 12
Table 2 Waste generation in selected countries ...................................................................... 13
Table 3 Per capita generation, disposal and collection efficiency of MSW for Indian state..... 16
Table 4 Methods of disposal of municipal solid waste in selected countries (%) ...................... 17
Table 5 Chemical comparison of waste in developing and developed countries ...................... 19
Table 6 Composition of municipal solid waste in Indian cities .................................................. 20
Table 7 Recyclable material in MSW in Indian cities (%) ..............................................................22
Table 8 Cost of electricity in selected countries in 2000 .............................................................24
Table 9 Installed capacity in India as of February 2007 ...............................................................25
Table 10 India Renewable Energy Potential and Installed Capacity as of 2005 ................................25
Table 11 : Potential MSW and Power Generation from MSW and Industrial Waste in India ............33
Table 12 Estimated* waste generation in the country state-wise ......................................33-34
Table 13 Details of some successfully operated biomethanation plants ..........................................36
Table 14 Process details of conversion technologies.........................................................................44
Table 15 State-wise* Status of MSW Processing Facilities in India (2011)........................................44
8
Waste To Energy- A Solution of Environmental & Energy Crisis l PGPEM, IIMR l BRIJRAJPANDEY
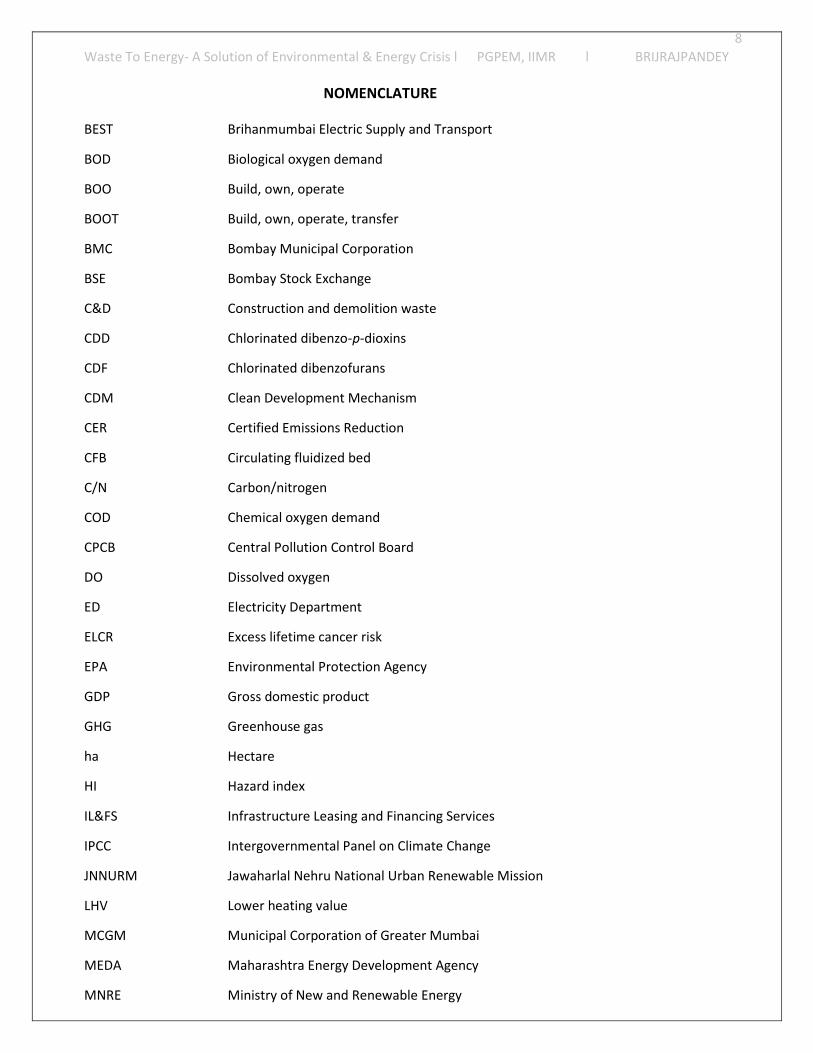
NOMENCLATURE
BEST Brihanmumbai Electric Supply and Transport
BOD Biological oxygen demand
BOO Build, own, operate
BOOT Build, own, operate, transfer
BMC Bombay Municipal Corporation
BSE Bombay Stock Exchange
C&D Construction and demolition waste
CDD Chlorinated dibenzo-p-dioxins
CDF Chlorinated dibenzofurans
CDM Clean Development Mechanism
CER Certified Emissions Reduction
CFB Circulating fluidized bed
C/N Carbon/nitrogen
COD Chemical oxygen demand
CPCB Central Pollution Control Board
DO Dissolved oxygen
ED Electricity Department
ELCR Excess lifetime cancer risk
EPA Environmental Protection Agency
GDP Gross domestic product
GHG Greenhouse gas
ha Hectare
HI Hazard index
IL&FS Infrastructure Leasing and Financing Services
IPCC Intergovernmental Panel on Climate Change
JNNURM Jawaharlal Nehru National Urban Renewable Mission
LHV Lower heating value
MCGM Municipal Corporation of Greater Mumbai
MEDA Maharashtra Energy Development Agency
MNRE Ministry of New and Renewable Energy
9
Waste To Energy- A Solution of Environmental & Energy Crisis l PGPEM, IIMR l BRIJRAJPANDEY
MoEF Ministry of Environment and Forests
MoP Ministry of Power
MPCB Maharashtra Pollution Control Board
MSEB Maharashtra State Electricity Board
MSW Municipal solid waste
MUD Ministry of Urban Development
NEERI National Environmental Engineering Research Institute
NIMBY Not In My BackYard
NO3/N Nitrates
NSEI National Stock Exchange of India
PCB Polychlorinated biphenyls
PCDD Polychlorinated dibenzo-p-dioxins
PCDD/F Polychlorinated dibenzo-p-dioxins/furans
PCDF Polychlorinated dibenzofurans
PCG Plasma converted gas
PO4/P Phosphates
PM Particulate matter
RDF Refuse derived fuel
REL Reliance Energy Limited
SEB State Electricity Board
SWM Solid waste management
SWMD Solid Waste Management Department
TCDD 2,3,7,8-tetrachlorodibenzo-p-dioxin
TDS Total dissolved solids
TEQ Toxic Equivalents
TPC Tata Power Company
tpd Tons per day
TSP Total suspended particles
VER Voluntary Emissions Reduction
WTE Waste-to-energy
10
Waste To Energy- A Solution of Environmental & Energy Crisis l PGPEM, IIMR l BRIJRAJPANDEY
I NT RO D U CT IO N
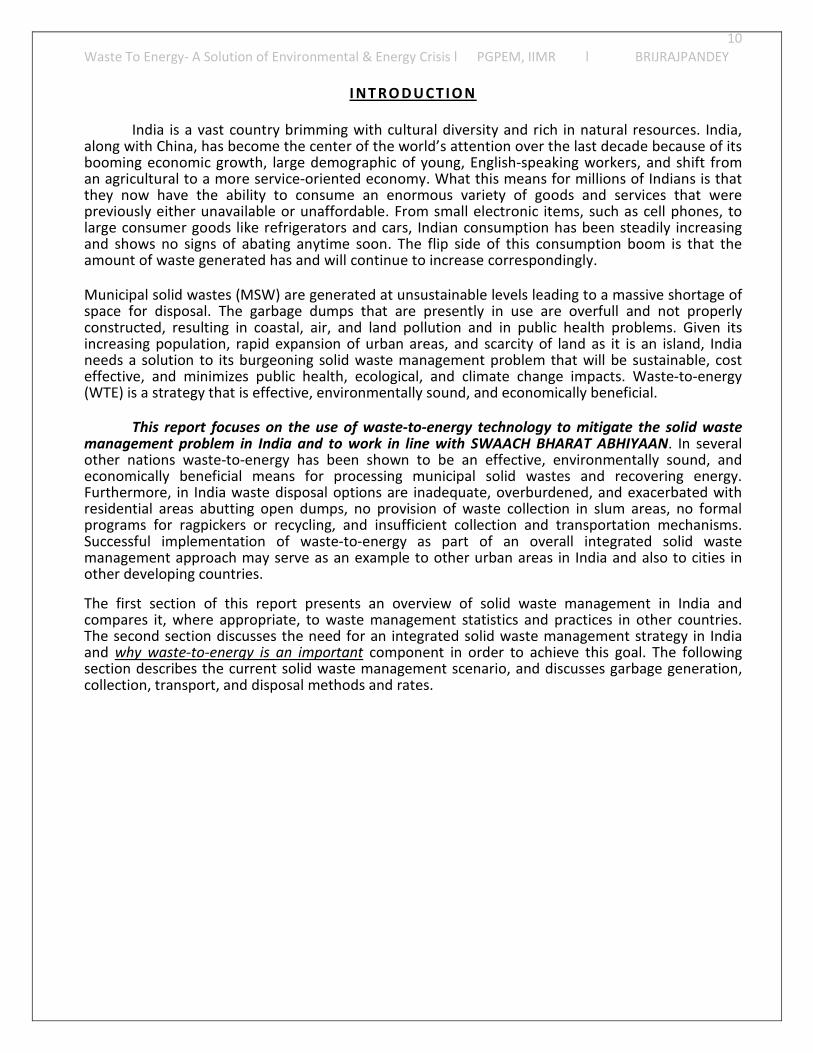
India is a vast country brimming with cultural diversity and rich in natural resources. India,along with China, has become the center of the world’s attention over the last decade because of itsbooming economic growth, large demographic of young, English-speaking workers, and shift froman agricultural to a more service-oriented economy. What this means for millions of Indians is thatthey now have the ability to consume an enormous variety of goods and services that werepreviously either unavailable or unaffordable. From small electronic items, such as cell phones, tolarge consumer goods like refrigerators and cars, Indian consumption has been steadily increasingand shows no signs of abating anytime soon. The flip side of this consumption boom is that theamount of waste generated has and will continue to increase correspondingly.
Municipal solid wastes (MSW) are generated at unsustainable levels leading to a massive shortage ofspace for disposal. The garbage dumps that are presently in use are overfull and not properlyconstructed, resulting in coastal, air, and land pollution and in public health problems. Given itsincreasing population, rapid expansion of urban areas, and scarcity of land as it is an island, Indianeeds a solution to its burgeoning solid waste management problem that will be sustainable, costeffective, and minimizes public health, ecological, and climate change impacts. Waste-to-energy(WTE) is a strategy that is effective, environmentally sound, and economically beneficial.
This report focuses on the use of waste-to-energy technology to mitigate the solid wastemanagement problem in India and to work in line with SWAACH BHARAT ABHIYAAN. In severalother nations waste-to-energy has been shown to be an effective, environmentally sound, andeconomically beneficial means for processing municipal solid wastes and recovering energy.Furthermore, in India waste disposal options are inadequate, overburdened, and exacerbated withresidential areas abutting open dumps, no provision of waste collection in slum areas, no formalprograms for ragpickers or recycling, and insufficient collection and transportation mechanisms.Successful implementation of waste-to-energy as part of an overall integrated solid wastemanagement approach may serve as an example to other urban areas in India and also to cities inother developing countries.
The first section of this report presents an overview of solid waste management in India andcompares it, where appropriate, to waste management statistics and practices in other countries.The second section discusses the need for an integrated solid waste management strategy in Indiaand why waste-to-energy is an important component in order to achieve this goal. The followingsection describes the current solid waste management scenario, and discusses garbage generation,collection, transport, and disposal methods and rates.
11
Waste To Energy- A Solution of Environmental & Energy Crisis l PGPEM, IIMR l BRIJRAJPANDEY
2. OVERVIEW OF SOLID WASTE MANAGEMENT AND ELECTRICITY SECTORS IN INDIA
2.1 Background
India is one of the fastest growing
economies in the world today. Increasing
prosperity and standard of living of millions
of people will increase consumption of
energy and consumer goods. Concurrently,
this growth will likely put a strain on the
environment and on the availability of
natural resources. Already, India has 17.5%
of the world’s population (est. 2011) and
only 2.2% of the world’s total land area.
In India, as in other developing
countries, solid waste management and
sanitation are the least prioritized public
services.These services are necessary for
preventing the spread of diseases,
promoting general well being, and
improving the standard of living. However,
due to lack of knowledge about the linka
environmental protection, unwillingness on th
and a lack of funds for implementing and ma
received the attention it requires.
This chapter provides an overview of wa
for India as a whole. Where appropriate, comp
India has similar solid waste management prac
energy is both an effective waste reduction stra
chapter also provides an overview of the electri
a
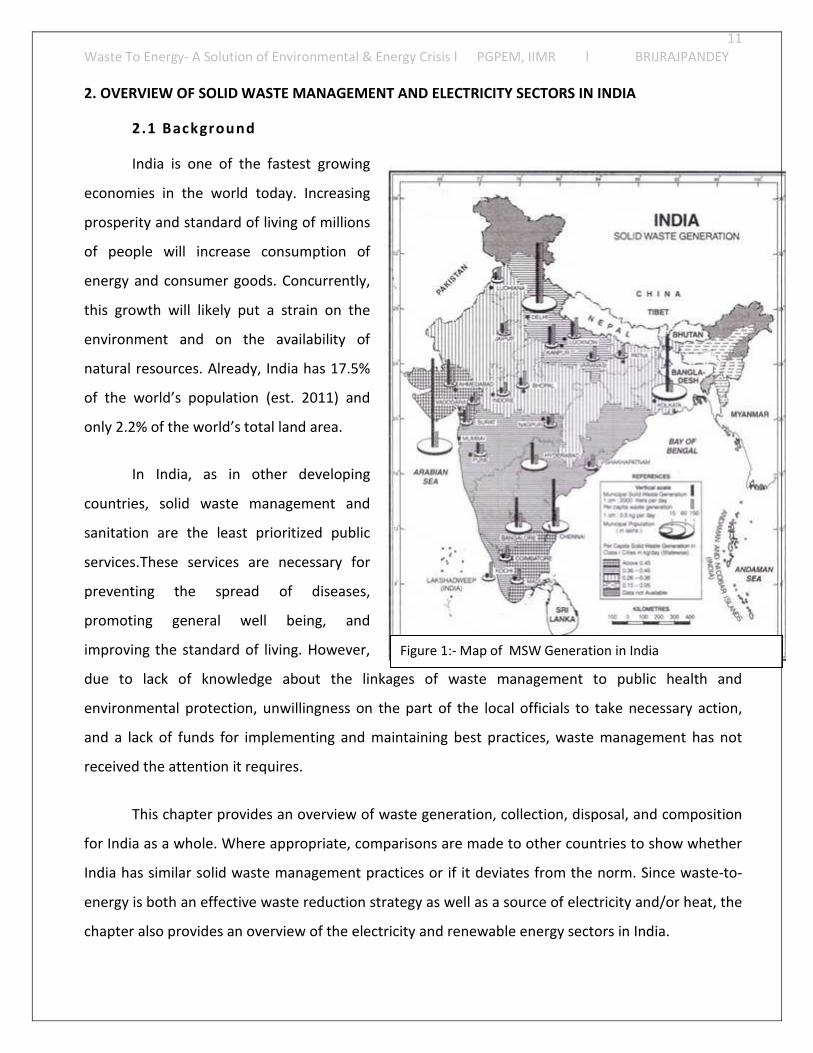
Figure 1:- Map of MSW Generation in Indiges of waste management to public health and
e part of the local officials to take necessary action,
intaining best practices, waste management has not
ste generation, collection, disposal, and composition
arisons are made to other countries to show whether
tices or if it deviates from the norm. Since waste-to-
tegy as well as a source of electricity and/or heat, the
city and renewable energy sectors in India.
12
Waste To Energy- A Solution of Environmental & Energy Crisis l PGPEM, IIMR l BRIJRAJPANDEY
2.2 MSW Generation in India
The amount of waste generated in a region or country is directly proportional to economic
growth and consumption levels. On a per capita basis, low-income countries generally consume
fewer goods and hence generate less waste than developed countries. Low-income countries also
generally use less recyclable materials, especially in packaging.
2.2.1 Current MSW Generation in In
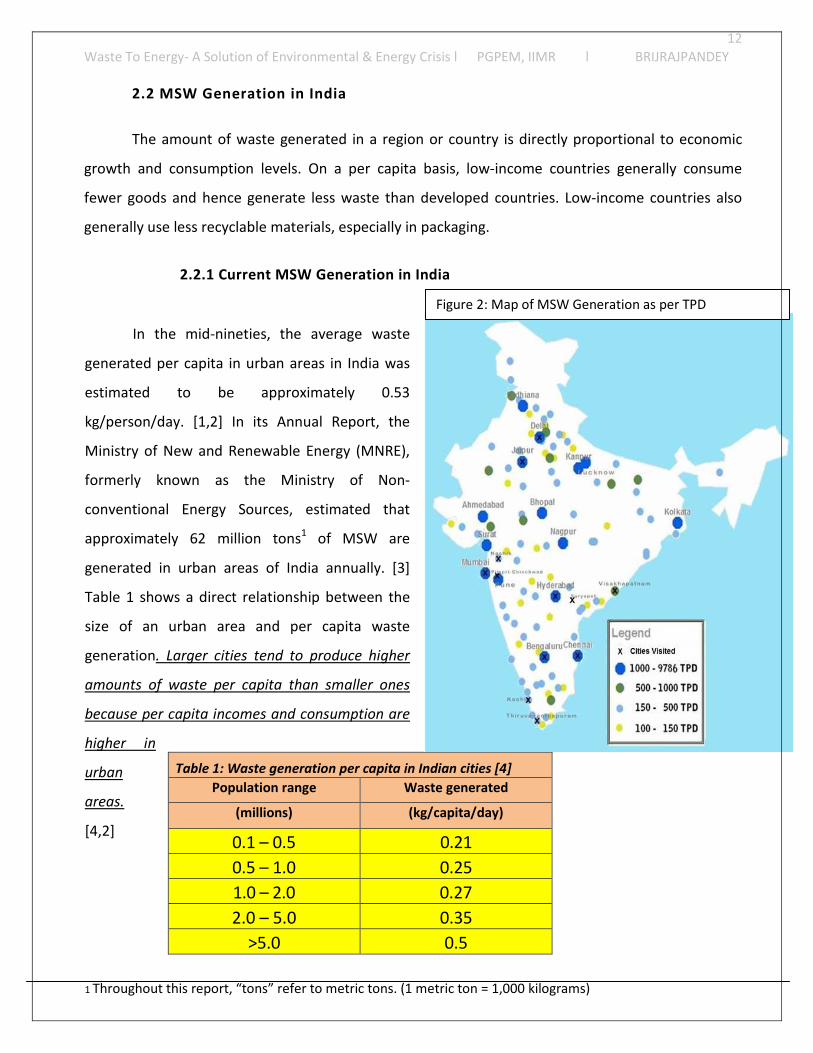
In the mid-nineties, the average waste
generated per capita in urban areas in India was
estimated to be approximately 0.53
kg/person/day. [1,2] In its Annual Report, the
Ministry of New and Renewable Energy (MNRE),
formerly known as the Ministry of Non-
conventional Energy Sources, estimated that
approximately 62 million tons1 of MSW are
generated in urban areas of India annually. [3]
Table 1 shows a direct relationship between the
size of an urban area and per capita waste
generation. Larger cities tend to produce higher
amounts of waste per capita than smaller ones
because per capita incomes and consumption are
higher in
urban
areas.
[4,2]
1 Throughout this report, “tons” refer to metric tons. (1 m
Table 1: Waste generation per capita in In
Population range Was
(millions) (kg
0.1 – 0.5
0.5 – 1.0
1.0 – 2.0
2.0 – 5.0
>5.0
D
dia
Figure 2: Map of MSW Generation as per TP
etric ton = 1,000 kilograms)
dian cities [4]
te generated
/capita/day)
0.21
0.25
0.27
0.35
0.5
13
Waste To Energy- A Solution of Environmental & Energy Crisis l PGPEM, IIMR l BRIJRAJPANDEY
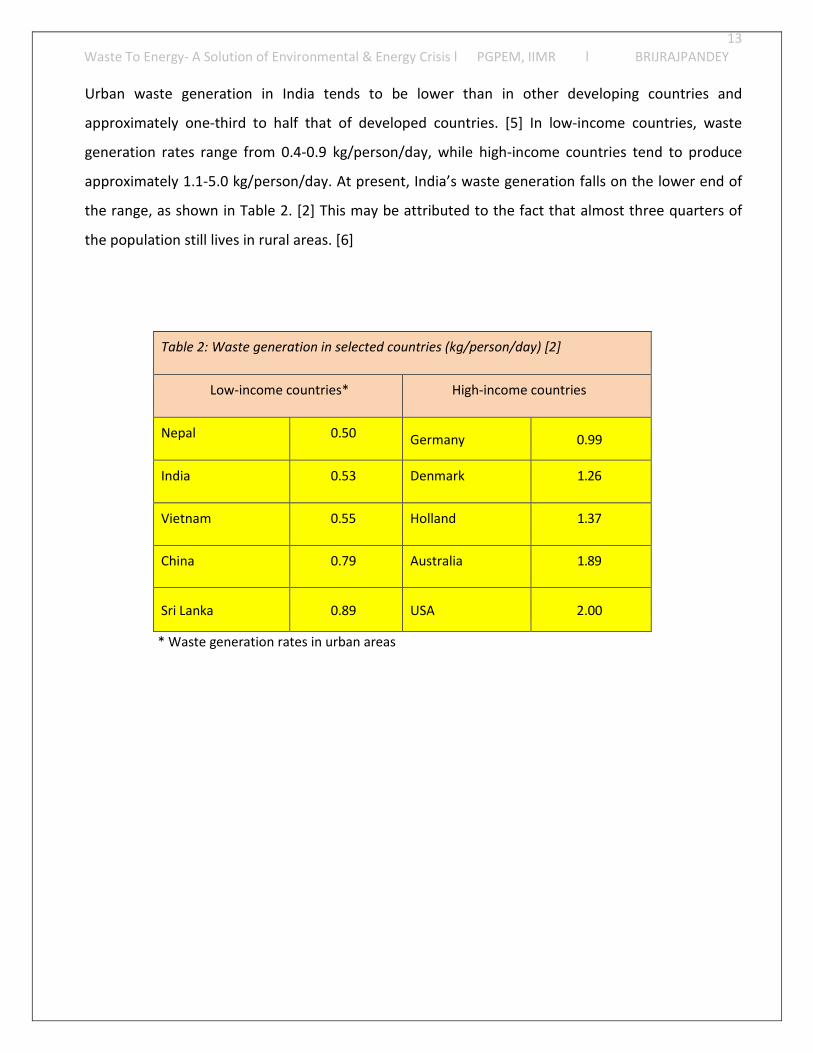
Urban waste generation in India tends to be lower than in other developing countries and
approximately one-third to half that of developed countries. [5] In low-income countries, waste
generation rates range from 0.4-0.9 kg/person/day, while high-income countries tend to produce
approximately 1.1-5.0 kg/person/day. At present, India’s waste generation falls on the lower end of
the range, as shown in Table 2. [2] This may be attributed to the fact that almost three quarters of
the population still lives in rural areas. [6]
Table 2: Waste generation in selected countries (kg/person/day) [2]
Low-income countries* High-income countries
Nepal 0.50 Germany 0.99
India 0.53 Denmark 1.26
Vietnam 0.55 Holland 1.37
China 0.79 Australia 1.89
Sri Lanka 0.89 USA 2.00
* Waste generation rates in urban areas
14
Waste To Energy- A Solution of Environmental & Energy Crisis l PGPEM, IIMR l BRIJRAJPANDEY
2.2.2 Future MSW Generation in India
Waste generation in India is expected to increase rapidly in the future. As more people
migrate to urban areas and as incomes increase, consumption levels are likely to rise, as are rates of
waste generation. This has significant impacts on the amount of land that is and will be needed for
disposal, economic costs of collecting and transporting the waste, and the environmental
consequences of increased MSW generation levels.
It is estimated that the amount of waste generated in India will increase at a per capita rate
of approximately 1-1.33% annually. [1] A World Bank publication reports that the waste generation
rate in urban areas of India will be approximately 0.7 kg/person/day in 2025, which is roughly four to
six times higher than it was in 1999. [2]
15
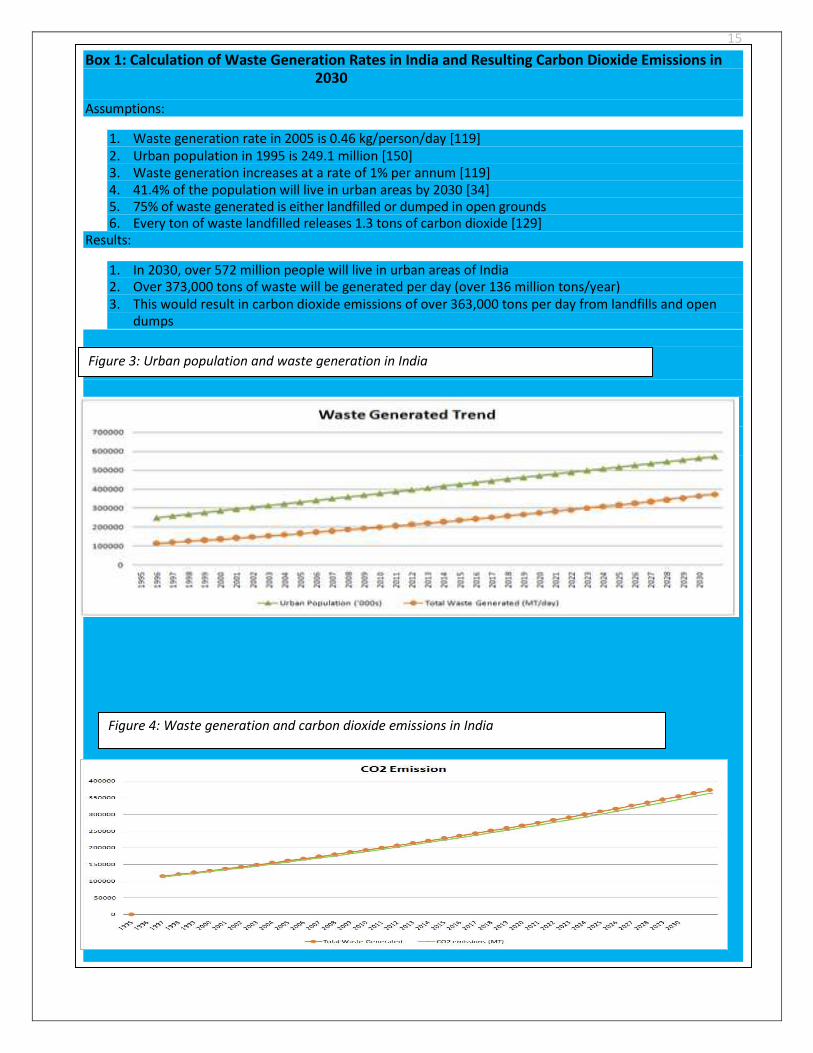
Waste To Energy- A Solution of Environmental & Energy Crisis l PGPEM, IIMR l BRIJRAJPANDEYBox 1: Calculation of Waste Generation Rates in India and Resulting Carbon Dioxide Emissions in2030
Assumptions:
1. Waste generation rate in 2005 is 0.46 kg/person/day [119]2. Urban population in 1995 is 249.1 million [150]3. Waste generation increases at a rate of 1% per annum [119]4. 41.4% of the population will live in urban areas by 2030 [34]5. 75% of waste generated is either landfilled or dumped in open grounds6. Every ton of waste landfilled releases 1.3 tons of carbon dioxide [129]
Results:
1. In 2030, over 572 million people will live in urban areas of India2. Over 373,000 tons of waste will be generated per day (over 136 million tons/year)3. This would result in carbon dioxide emissions of over 363,000 tons per day from landfills and open
dumps
Figure 4: Waste generation and carbon dioxide emissions in India
For detailed calculations, see Appendix 1.Figure 3: Urban population and waste generation in India
16
Waste To Energy- A Solution of Environmental & Energy Crisis l PGPEM, IIMR l BRIJRAJPANDEY
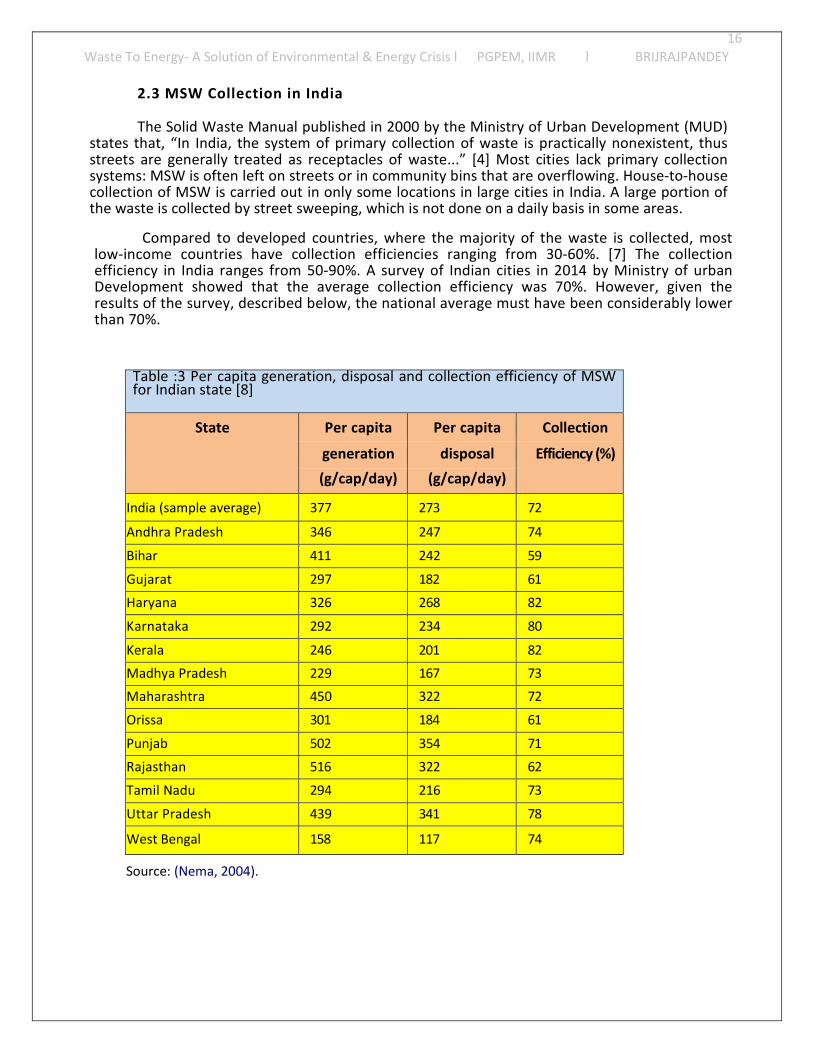
2.3 MSW Collection in India
The Solid Waste Manual published in 2000 by the Ministry of Urban Development (MUD)states that, “In India, the system of primary collection of waste is practically nonexistent, thusstreets are generally treated as receptacles of waste...” [4] Most cities lack primary collectionsystems: MSW is often left on streets or in community bins that are overflowing. House-to-housecollection of MSW is carried out in only some locations in large cities in India. A large portion ofthe waste is collected by street sweeping, which is not done on a daily basis in some areas.
Compared to developed countries, where the majority of the waste is collected, mostlow-income countries have collection efficiencies ranging from 30-60%. [7] The collectionefficiency in India ranges from 50-90%. A survey of Indian cities in 2014 by Ministry of urbanDevelopment showed that the average collection efficiency was 70%. However, given theresults of the survey, described below, the national average must have been considerably lowerthan 70%.
Table :3 Per capita generation, disposal and collection efficiency of MSWfor Indian state [8]
State Per capita Per capita Collection
generation disposal Efficiency (%)
(g/cap/day) (g/cap/day)
India (sample average) 377 273 72
Andhra Pradesh 346 247 74
Bihar 411 242 59
Gujarat 297 182 61
Haryana 326 268 82
Karnataka 292 234 80
Kerala 246 201 82
Madhya Pradesh 229 167 73
Maharashtra 450 322 72
Orissa 301 184 61
Punjab 502 354 71
Rajasthan 516 322 62
Tamil Nadu 294 216 73
Uttar Pradesh 439 341 78
West Bengal 158 117 74
Source: (Nema, 2004).
17
Waste To Energy- A Solution of Environmental & Energy Crisis l PGPEM, IIMR l BRIJRAJPANDEY
2.4 MSW Disposal in India
In most cities and towns in India, MSW is disposed in open dumps in an unregulated and
unscientific manner in low-lying areas on the outskirts of the cities.2 Most dumps lack systems for
leachate collection, landfill gas collection or monitoring, nor do they use inert materials to cover
the waste. [9, 10] This results in groundwater contamination from leachate, surface water
contamination from runoff and lack of covering, air pollution caused by fires, toxic gases, and
odor, and public health problems due to mosquitoes and scavenging animals. [4]
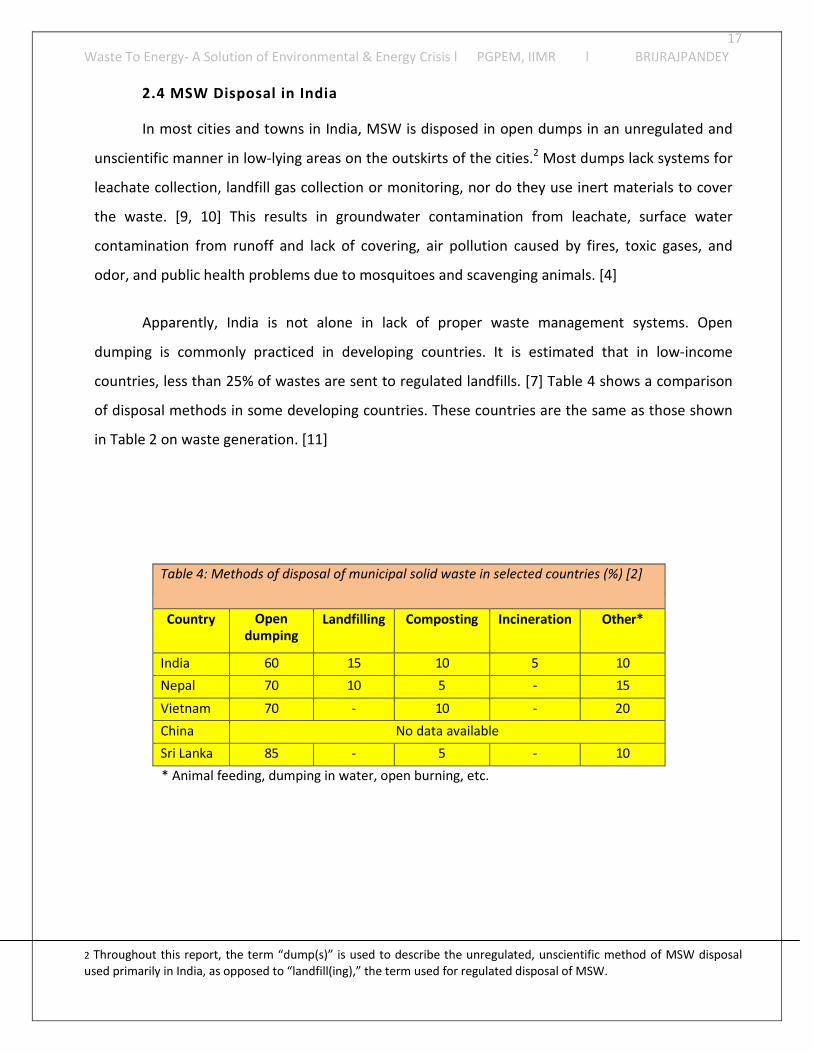
Apparently, India is not alone in lack of proper waste management systems. Open
dumping is commonly practiced in developing countries. It is estimated that in low-income
countries, less than 25% of wastes are sent to regulated landfills. [7] Table 4 shows a comparison
of disposal methods in some developing countries. These countries are the same as those shown
in Table 2 on waste generation. [11]
Table 4: Methods of disposal of municipal solid waste in selected countries (%) [2]
Country Opendumping
Landfilling Composting Incineration Other*
India 60 15 10 5 10
Nepal 70 10 5 - 15
Vietnam 70 - 10 - 20
China No data available
Sri Lanka 85 - 5 - 10
* Animal feeding, dumping in water, open burning, etc.
2 Throughout this report, the term “dump(s)” is used to describe the unregulated, unscientific method of MSW disposalused primarily in India, as opposed to “landfill(ing),” the term used for regulated disposal of MSW.
18
Waste To Energy- A Solution of Environmental & Energy Crisis l PGPEM, IIMR l BRIJRAJPANDEY
2.5 Composition of MSW in India
Municipal solid waste in India has a high percentage of organic matter and a low recyclablecontent. It also contains high amounts of ash due to the use of traditional biomass sources for fueland heat and other inert materials.
2.5.1 General Characteristics of MSW in India
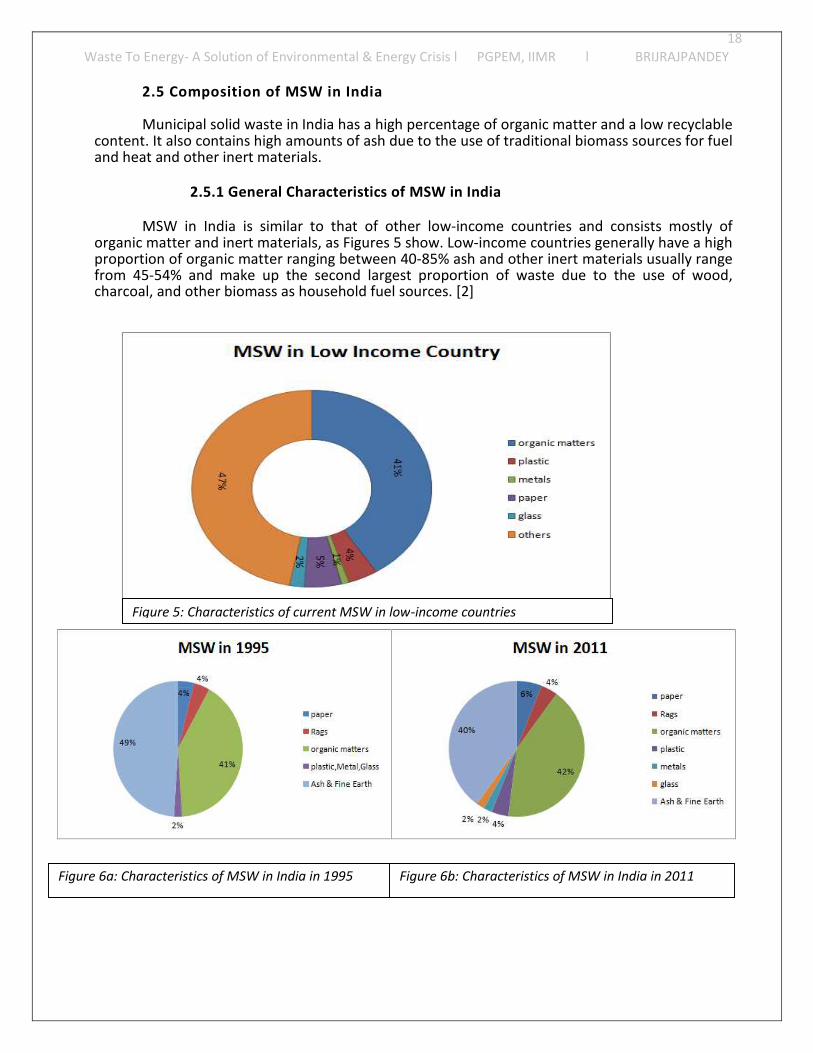
MSW in India is similar to that of other low-income countries and consists mostly oforganic matter and inert materials, as Figures 5 show. Low-income countries generally have a highproportion of organic matter ranging between 40-85% ash and other inert materials usually rangefrom 45-54% and make up the second largest proportion of waste due to the use of wood,charcoal, and other biomass as household fuel sources. [2]
Figure 6a: Characteristics of MSW in India in 1995
Figure 6b: Characteristics of MSW in India in 2011Figure 5: Characteristics of current MSW in low-income countries
19
Waste To Energy- A Solution of Environmental & Energy Crisis l PGPEM, IIMR l BRIJRAJPANDEY
As Figures 6a and 6b show, between 1995 and 2011, the biggest changes in municipal solidwaste composition in India resulted from an increase in recyclable materials, such as plastics,glass, and paper, while the proportion of ash and fine earth decreased. [10, 2] The high fraction ofinert materials is a result of including street sweepings, silt, and construction and demolition(C&D) waste in municipal waste dumps. [4]
2.5.2 Chemical Characteristics of MSW in India
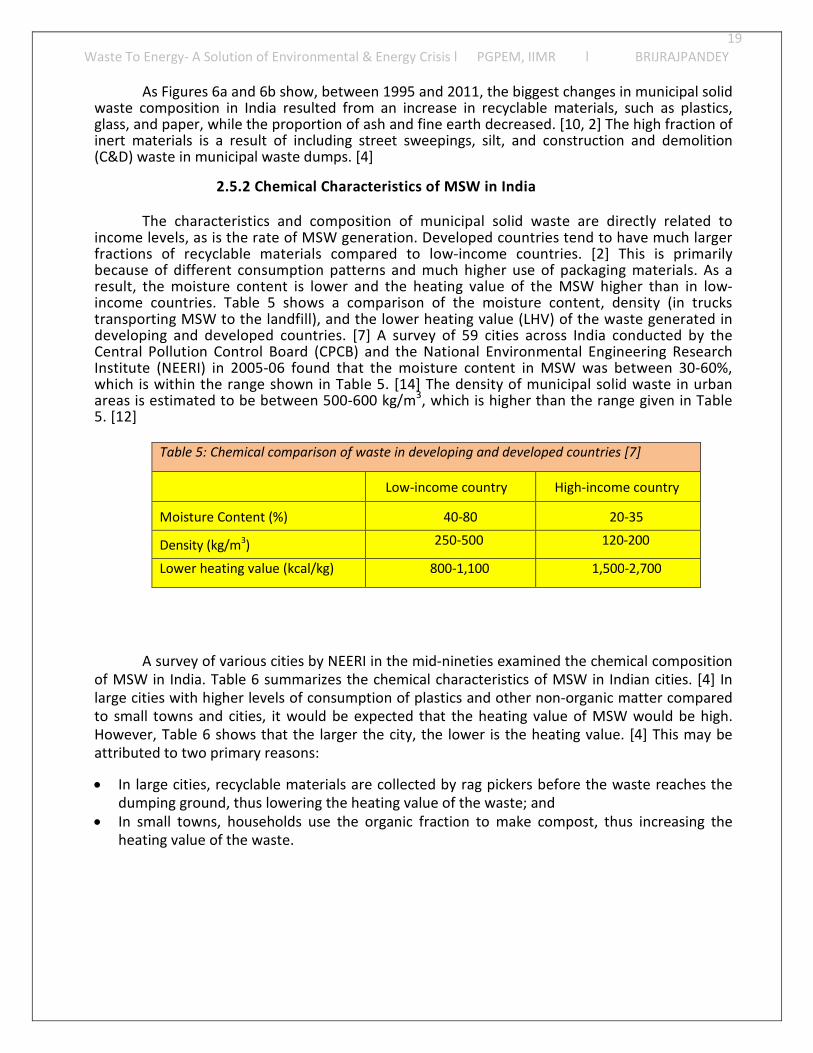
The characteristics and composition of municipal solid waste are directly related toincome levels, as is the rate of MSW generation. Developed countries tend to have much largerfractions of recyclable materials compared to low-income countries. [2] This is primarilybecause of different consumption patterns and much higher use of packaging materials. As aresult, the moisture content is lower and the heating value of the MSW higher than in low-income countries. Table 5 shows a comparison of the moisture content, density (in truckstransporting MSW to the landfill), and the lower heating value (LHV) of the waste generated indeveloping and developed countries. [7] A survey of 59 cities across India conducted by theCentral Pollution Control Board (CPCB) and the National Environmental Engineering ResearchInstitute (NEERI) in 2005-06 found that the moisture content in MSW was between 30-60%,which is within the range shown in Table 5. [14] The density of municipal solid waste in urbanareas is estimated to be between 500-600 kg/m3, which is higher than the range given in Table5. [12]
Table 5: Chemical comparison of waste in developing and developed countries [7]
Low-income country High-income country
Moisture Content (%) 40-80 20-35
Density (kg/m3) 250-500 120-200
Lower heating value (kcal/kg) 800-1,100 1,500-2,700
A survey of various cities by NEERI in the mid-nineties examined the chemical compositionof MSW in India. Table 6 summarizes the chemical characteristics of MSW in Indian cities. [4] Inlarge cities with higher levels of consumption of plastics and other non-organic matter comparedto small towns and cities, it would be expected that the heating value of MSW would be high.However, Table 6 shows that the larger the city, the lower is the heating value. [4] This may beattributed to two primary reasons:
In large cities, recyclable materials are collected by rag pickers before the waste reaches thedumping ground, thus lowering the heating value of the waste; and
In small towns, households use the organic fraction to make compost, thus increasing theheating value of the waste.
20
Waste To Energy- A Solution of Environmental & Energy Crisis l PGPEM, IIMR l BRIJRAJPANDEY
Table 6: Composition of municipal solid waste in Indian cities [4]
Populationrange
(millions)
Moisturecontent (%)
Calorificheating
(kcal/kg)
C/N ratio Organicmatter (%)
Inert (%)
0.1 – 0.5 26 1,010 31 37 44
0.5 – 1.0 20 900 21 25 48
1.0 – 2.0 27 980 24 27 45
2.0 – 5.0 21 907 22 26 49
>5.0 39 800 20 39 54
2.5.3 Correlation of Composition of Heat content with Economicrise/income levels
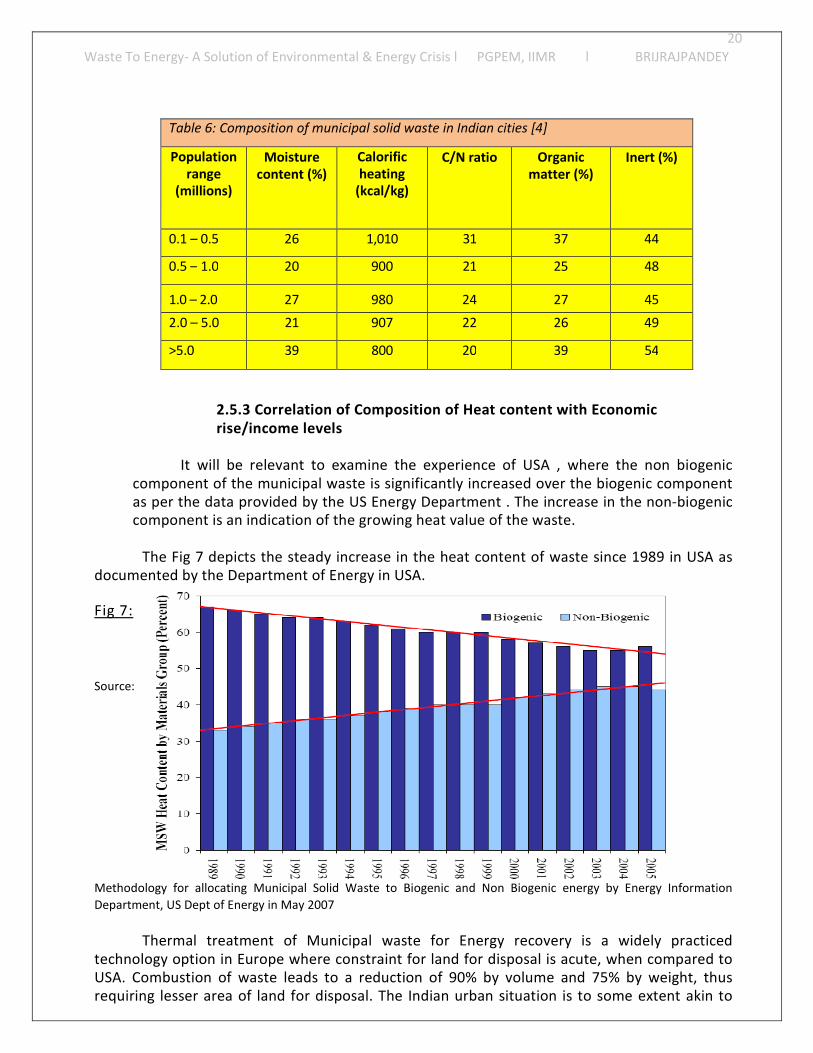
It will be relevant to examine the experience of USA , where the non biogeniccomponent of the municipal waste is significantly increased over the biogenic componentas per the data provided by the US Energy Department . The increase in the non-biogeniccomponent is an indication of the growing heat value of the waste.
The Fig 7 depicts the steady increase in the heat content of waste since 1989 in USA asdocumented by the Department of Energy in USA.
Fig 7:
Source:
Methodology for allocating Municipal Solid Waste to Biogenic and Non Biogenic energy by Energy Information
Department, US Dept of Energy in May 2007
Thermal treatment of Municipal waste for Energy recovery is a widely practicedtechnology option in Europe where constraint for land for disposal is acute, when compared toUSA. Combustion of waste leads to a reduction of 90% by volume and 75% by weight, thusrequiring lesser area of land for disposal. The Indian urban situation is to some extent akin to
21
Waste To Energy- A Solution of Environmental & Energy Crisis l PGPEM, IIMR l BRIJRAJPANDEY
the European situation with acute paucity of land for Solid waste management. Planning wasteto energy facilities is highly imperative for the Indian metros and major cities in order tominimize the increasing hauling costs of waste. Besides it will also conserve the limited land areaavailable for the solid waste management.
2.5.4 Future Trends in MSW Composition in India
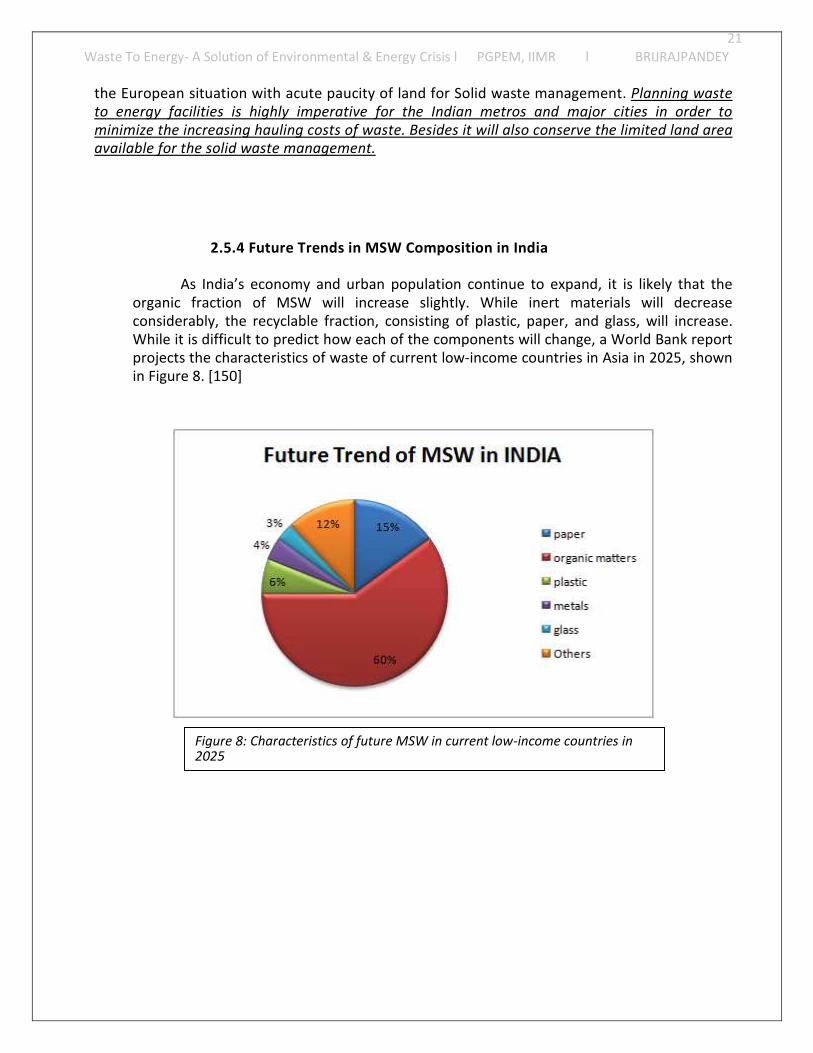
As India’s economy and urban population continue to expand, it is likely that theorganic fraction of MSW will increase slightly. While inert materials will decreaseconsiderably, the recyclable fraction, consisting of plastic, paper, and glass, will increase.While it is difficult to predict how each of the components will change, a World Bank reportprojects the characteristics of waste of current low-income countries in Asia in 2025, shownin Figure 8. [150]
Figure 8: Characteristics of future MSW in current low-income countries in2025
22
Waste To Energy- A Solution of Environmental & Energy Crisis l PGPEM, IIMR l BRIJRAJPANDEY
2.5.5 Recyclable Fraction of MSW in India
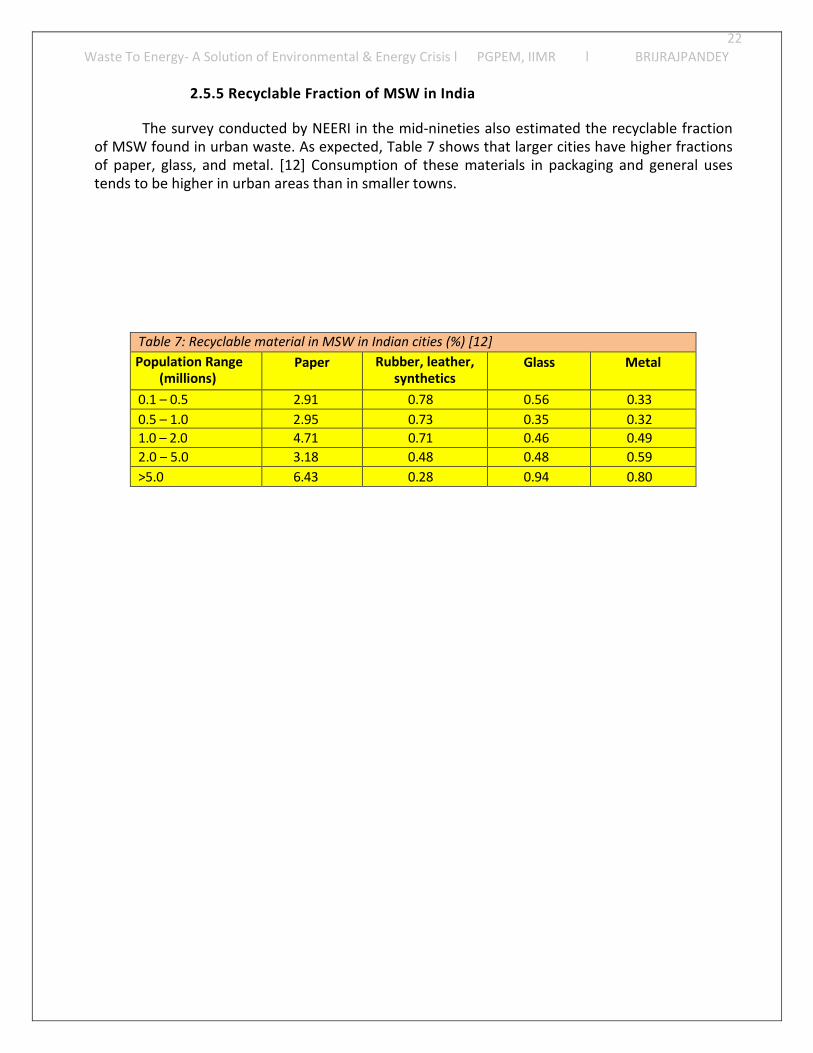
The survey conducted by NEERI in the mid-nineties also estimated the recyclable fractionof MSW found in urban waste. As expected, Table 7 shows that larger cities have higher fractionsof paper, glass, and metal. [12] Consumption of these materials in packaging and general usestends to be higher in urban areas than in smaller towns.
Table 7: Recyclable material in MSW in Indian cities (%) [12]
Population Range(millions)
Paper Rubber, leather,synthetics
Glass Metal
0.1 – 0.5 2.91 0.78 0.56 0.33
0.5 – 1.0 2.95 0.73 0.35 0.32
1.0 – 2.0 4.71 0.71 0.46 0.49
2.0 – 5.0 3.18 0.48 0.48 0.59
>5.0 6.43 0.28 0.94 0.80
23
Waste To Energy- A Solution of Environmental & Energy Crisis l PGPEM, IIMR l BRIJRAJPANDEY
2.6 The Electricity Sector in India
As mentioned earlier, one of the benefits of waste-to-energy technology is energyrecovery. The process of combustion is the same as that of a fossil fuel-based plant; however,instead of coal, oil, or natural gas, municipal solid waste is combusted at high temperatures toproduce steam, which powers turbines that generate power. In the United States and EuropeanUnion approximately 600 kilowatt-hours (kWh) of electricity are generated per ton of MSWcombusted. [13]
When looking at India as a whole, WTE would make up only a small fraction of the totalenergy capacity (See Section 2.6.3). It is nonetheless an effective method because it reduces thevolume of MSW that would be sent to a landfill and prevents landfill-related pollution. Moreimportantly, it is a renewable technology. (See Section 3.3 for a discussion of the renewableaspect of WTE) This section provides a brief overview of the electricity sector in India.
2.6.1 Background
One of the key infrastructure and development problems India faces is a massiveshortage of electricity. This is mainly because electricity demand has outpaced thedevelopment of new power plants, transmission and distribution losses are excessive due tothe use of antiquated equipment, electricity is provided free of cost to the agricultural sector,and electricity theft is common, all of which result in reduction of revenues to the electricitygenerators. Even large cities including India’s Silicon Valley, Bangalore, face regular power cuts.As a result, businesses and residences regularly rely on diesel generators for electricity. InNovember 2014, peak electricity demand was 137,620 MW while the peak supply was 132,530MW. Thus, there was a power deficit of 5,090 MW or 5.09%. [14] India’s peak shortfallcontinues to increase over time as the population and the economy expand without a similargrowth in the power sector.
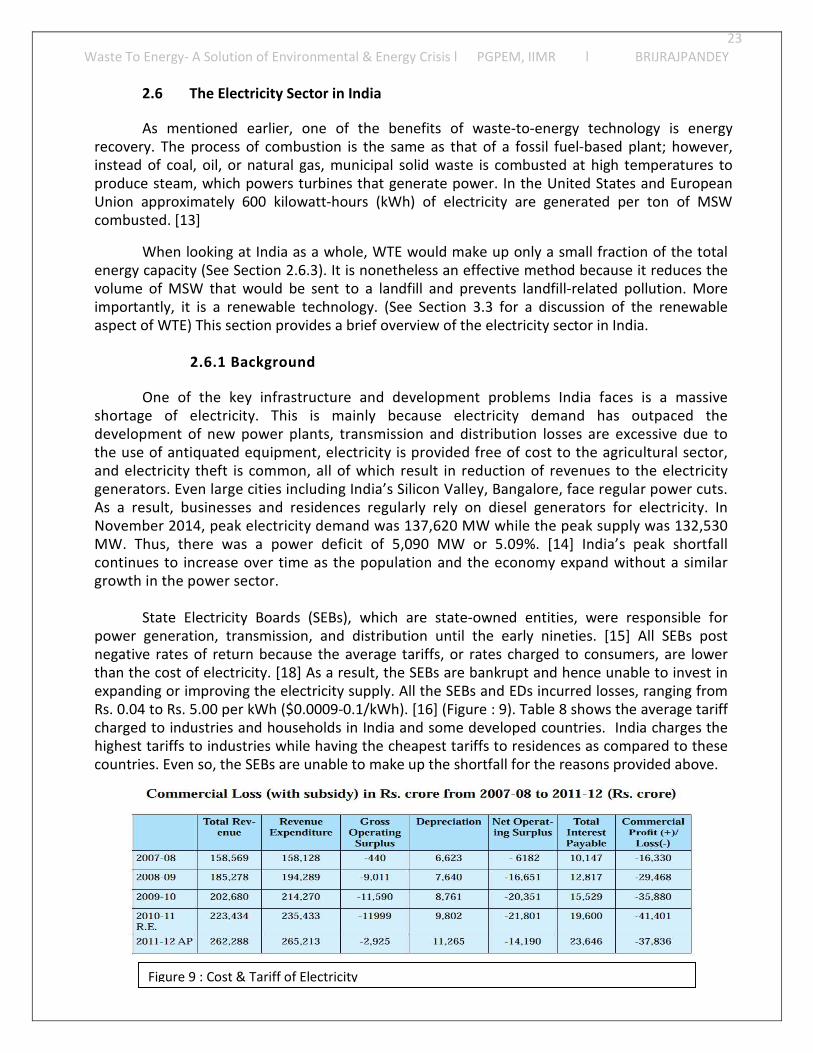
State Electricity Boards (SEBs), which are state-owned entities, were responsible forpower generation, transmission, and distribution until the early nineties. [15] All SEBs postnegative rates of return because the average tariffs, or rates charged to consumers, are lowerthan the cost of electricity. [18] As a result, the SEBs are bankrupt and hence unable to invest inexpanding or improving the electricity supply. All the SEBs and EDs incurred losses, ranging fromRs. 0.04 to Rs. 5.00 per kWh ($0.0009-0.1/kWh). [16] (Figure : 9). Table 8 shows the average tariffcharged to industries and households in India and some developed countries. India charges thehighest tariffs to industries while having the cheapest tariffs to residences as compared to thesecountries. Even so, the SEBs are unable to make up the shortfall for the reasons provided above.
y
Figure 9 : Cost & Tariff of Electricit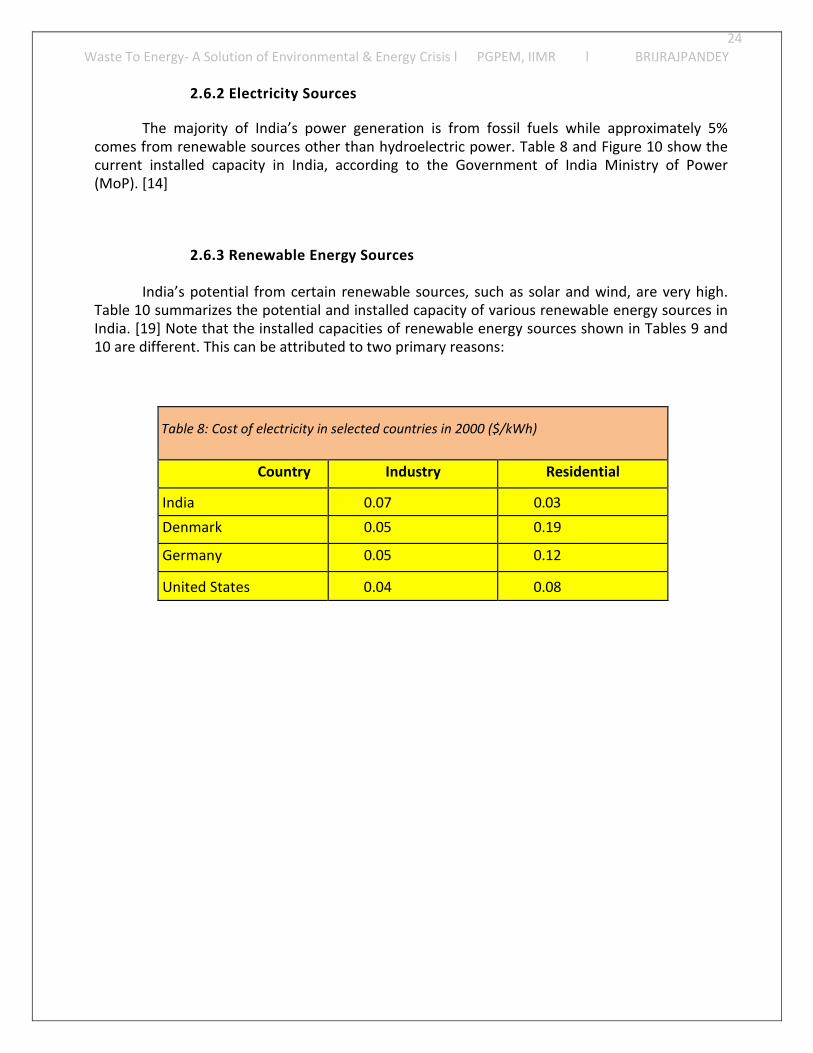
24
Waste To Energy- A Solution of Environmental & Energy Crisis l PGPEM, IIMR l BRIJRAJPANDEY
2.6.2 Electricity Sources
The majority of India’s power generation is from fossil fuels while approximately 5%comes from renewable sources other than hydroelectric power. Table 8 and Figure 10 show thecurrent installed capacity in India, according to the Government of India Ministry of Power(MoP). [14]
2.6.3 Renewable Energy Sources
India’s potential from certain renewable sources, such as solar and wind, are very high.Table 10 summarizes the potential and installed capacity of various renewable energy sources inIndia. [19] Note that the installed capacities of renewable energy sources shown in Tables 9 and10 are different. This can be attributed to two primary reasons:
Table 8: Cost of electricity in selected countries in 2000 ($/kWh)
Country Industry Residential
India 0.07 0.03
Denmark 0.05 0.19
Germany 0.05 0.12
United States 0.04 0.08
25
Waste To Energy- A Solution of Environmental & Energy Crisis l PGPEM, IIMR l BRIJRAJPANDEY
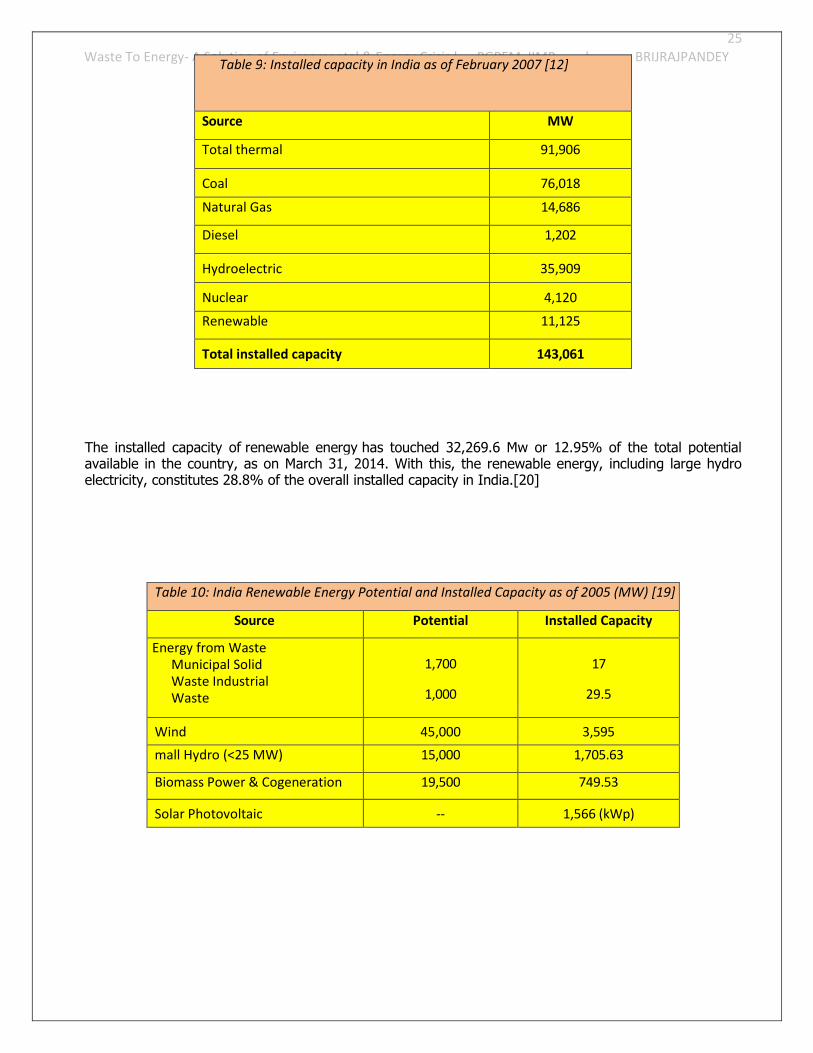
The installed capacity of renewable energy has touched 32,269.6 Mw or 12.95% of the total potentialavailable in the country, as on March 31, 2014. With this, the renewable energy, including large hydroelectricity, constitutes 28.8% of the overall installed capacity in India.[20]
Table 9: Installed capacity in India as of February 2007 [12]
Source MW
Total thermal 91,906
Coal 76,018
Natural Gas 14,686
Diesel 1,202
Hydroelectric 35,909
Nuclear 4,120
Renewable 11,125
Total installed capacity 143,061
Table 10: India Renewable Energy Potential and Installed Capacity as of 2005 (MW) [19]
Source Potential Installed Capacity
Energy from WasteMunicipal SolidWaste IndustrialWaste
1,700
1,000
17
29.5
Wind 45,000 3,595
mall Hydro (<25 MW) 15,000 1,705.63
Biomass Power & Cogeneration 19,500 749.53
Solar Photovoltaic -- 1,566 (kWp)
26
Waste To Energy- A Solution of Environmental & Energy Crisis l PGPEM, IIMR l BRIJRAJPANDEY
3. THE CASE FOR WASTE-TO-ENERGY IN INDIA
This section discusses the various aspects of introducing waste-to-energy in India. WTE isnot only an effectual method of reducing the volume of waste that is sent to landfills but alsoprovides a supplemental source of energy that is renewable.
The need for an integrated solid waste management strategy in a city, state, or countrybecomes more evident as that region’s economy grows and the standard of living improves. Withincreases in consumption, the amount of waste generated also increases. This creates stresseson the land used for disposal, can lead to environmental pollution, and can be detrimental topublic health if the waste is not disposed properly. This section makes the case for waste-to-energy in India by describing the benefits of this technology as applicable to India and discussesthe energy potential and funding opportunities available for WTE programs.
Municipal Solid Waste (MSW) has to be managed by technologies and methods that enable
keeping our cities clean, prevent pollution and protect the environment and at the same time
minimize the cost through recovery of resources and energy. As per CPCB report 2012-13
municipal areas in the country generate 1, 33,760 metric tonnes per day of MSW, of which only
91,152 TPD waste is collected and 25,884 TPD treated. The MSW, therefore, dumped in low
lying urban areas is a whopping 1,07,876 TPD, which needs 2,12,752 cubic meter space every
day and 776 hectare of precious land per year.
As per 2011 census, the 377 million people living in 7,935 urban centres (with 4,041 statutory
municipal authorities and 3,894 town with more than 5,000 people of which 75% are male
involved in non-agricultural activity), generate 1, 70,000 TPD and 62 million tonnes of MSW per
year which is based on an average per capita generation of 450gm per person per day. It needs to
be noted that 62 million tonnes of waste generation reported, annually, does not include wastes
picked up by kabadiwalas from households and from the streets by rag pickers. As per MoUD, 70
million tonnes of waste is generated currently in urban centers. There are thus conflicting data
about the quantum of waste actually generated in urban areas in the country, principally because
there is no system of periodically collecting and updating country wide data base on quantity and
composition of waste.
As per information available for 2012, compiled by CPCB, municipal authorities have so far only
set up 279 compost plants, 172 biomethanation plants, 29 RDF plants and eight Wastes to
Energy (W to E) plants in the country. World Health Organization (WHO) has observed that 22
types of diseases can be prevented/ controlled in India by improving Municipal Solid Waste
Management (MSWM) system. Scientific management of MSW will save, huge financial
resources currently spent on medical services and the health of our young population.
Principal reasons for the prevailing unhygienic conditions in our cities is the casual attitude of
the citizens as well as the municipal authorities towards managing solid waste, lack of priority to
this essential service, inadequate and inappropriate institutional structure, lack of technical
knowhow and paucity of financial resources.
27
Waste To Energy- A Solution of Environmental & Energy Crisis l PGPEM, IIMR l BRIJRAJPANDEY
3.1 Background
Historically, solid waste management has been one of the most neglected public servicesectors in India. A World Bank study declared that parts of India, as well as China, Indonesia, andthe Philippines, are facing the “greatest waste management challenge.” [2] However, initiatives atboth the national level, such as the Municipal Waste Management and Handling Rules (2000)introduced by the Government of India Ministry of Environment and Forests (MoEF) and theSupreme Court directive to set up a schedule for compliance with the Rules, and at the local level,such as 100% waste segregation at source in Suryapet to Mumbai’s ban on plastic bags, haveresulted in a growing awareness and emphasis on solid waste management.
India faces severe deficiencies in all areas of solid waste management. For instance:
With respect to collection, households and institutions need to segregate their wastes intowet and dry garbage and house-to-house collection needs to be implemented.
With respect to transportation, covered vehicles need to be introduced in order to preventodor problems and scattering of garbage along routes. [21]
With respect to disposal, safe and effective methods need to be adopted in order to preventpollution and health-related problems.
From an integrated solid waste management standpoint, waste-to-energy can be aneffective solution to India’s waste & Energy crisis for the following reasons.
Waste-to-energy is a renewable technology. It prevents the emission of greenhouse gases(GHG) from landfills, displaces fossil fuels used for power generation by creating energy fromthe combustion of MSW, and is an environmentally superior form of waste disposal ascompared to landfills.
Economic growth increases the amount of goods that are consumed, thus increasing theamount of waste generated. A strategy of whether this waste will be recycled or incineratedor landfilled needs to be developed, keeping in mind economic, social, and environmentalcosts and benefits.
When urban areas begin to develop the space available for dumping or landfilling wastebecomes scarce as the need for housing, schools, parks, and overall urban developmentbecomes a priority. WTE provides an effective way to reduce the volume of waste byapproximately 90% and thereby lower the space needed for landfills.
The consumption of plastics is expected to increase sharply in the future. To the extentpossible, plastics should be recycled; however, not all forms of plastic are suitable forrecycling. In this case, waste-to-energy is preferable to landfilling since plastics have a highheating value.
28
Waste To Energy- A Solution of Environmental & Energy Crisis l PGPEM, IIMR l BRIJRAJPANDEY
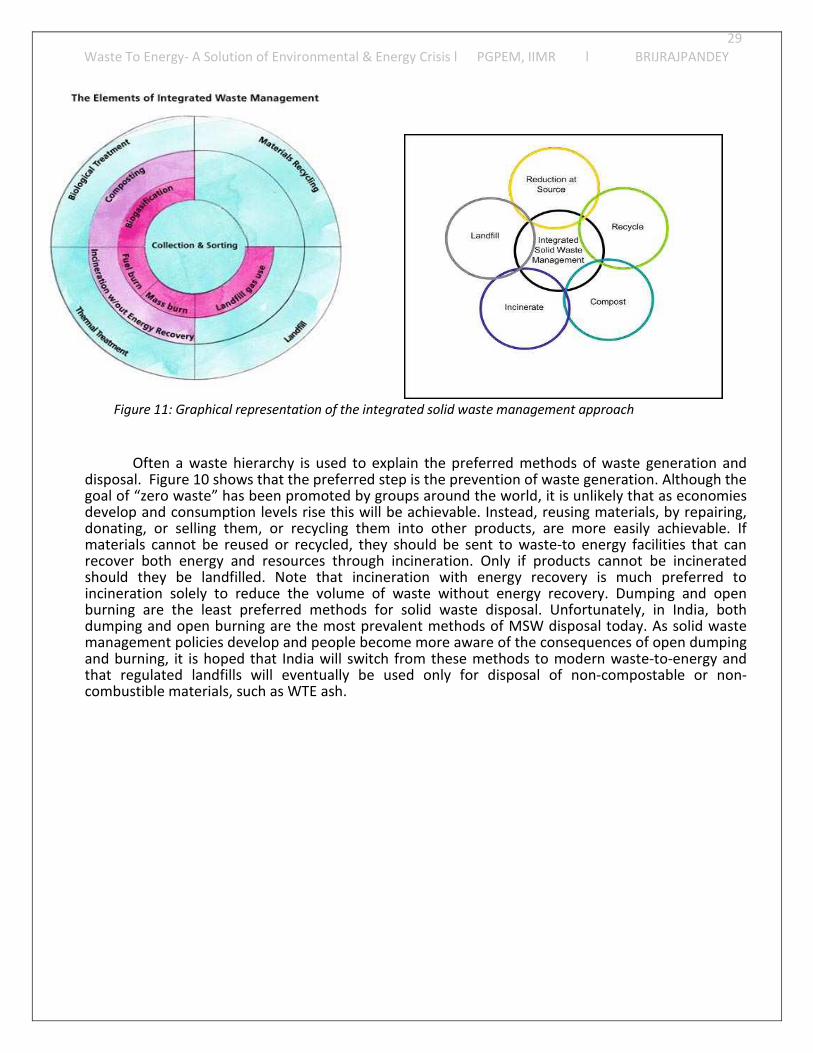
3.2 What is Integrated Solid Waste Management?
India, as well as all other developing countries, would benefit from adopting the“integrated solid waste management” approach established by the US EnvironmentalProtection Agency (EPA) in the early nineties. [22] This approach deals effectively andefficiently with all aspects of solid waste management, starting from the generation of wasteby an individual to final disposal by local government. It is based on the fact that there is not asingle solution to the waste management problem, but by adopting five main approaches --source reduction, recycling, composting, incineration, and landfills – one can effectivelymanage the waste generated. [22]
Source reduction begins with reducing the amount of waste generated, reusing materials toprevent them from entering the waste stream, and recycling them to prevent materials frombeing disposed in landfills.
Recycling is the method of taking used plastic, glass, metals, and paper and reprocessingthem into new products. It reduces the amount of materials that need to be sent to landfillsand conserves energy by lowering the amount of virgin materials that need to be used.
Composting is the process of converting organic material into compost through aerobic oranaerobic decomposition. Compost is used as a fertilizer or soil.
Incineration is the process of combusting waste at high temperatures and in the presence ofair. The heat is then used to produce steam for electricity or district heating (cooling) or both.Incineration lowers the volume of trash to be disposed in landfills and is considered to be arenewable energy sources in many countries, including India. (See Section 3.3 for moreinformation on WTE as a renewable technology).
Landfills are used for the disposal of wastes that cannot be recycled, composted, orincinerated. Landfills have been known to cause pollution in air and water and are a majorsource of greenhouse gases. Hence, landfilling should be used as a last resource and onlywhen the first four components of integrated solid waste management have been exhausted.
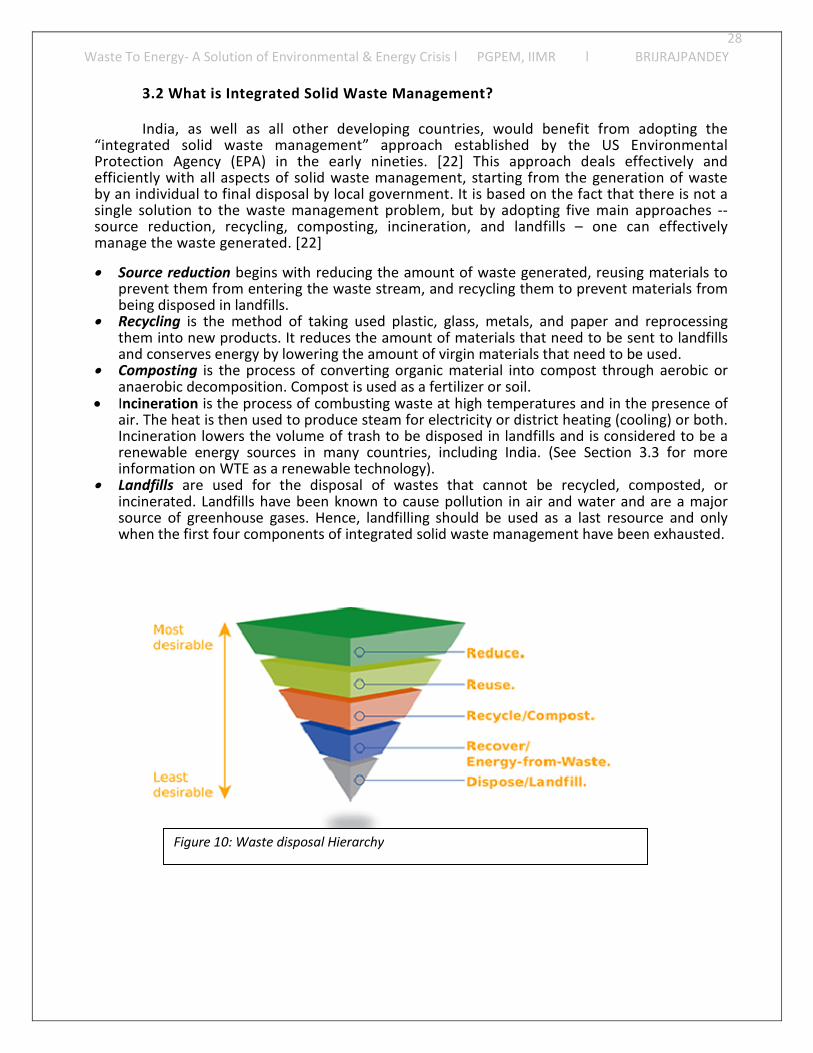
Figure 10: Waste disposal Hierarchy
29
Waste To Energy- A Solution of Environmental & Energy Crisis l PGPEM, IIMR l BRIJRAJPANDEY
Often a waste hierarchy is used to explain the preferred methods of waste generation anddisposal. Figure 10 shows that the preferred step is the prevention of waste generation. Although thegoal of “zero waste” has been promoted by groups around the world, it is unlikely that as economiesdevelop and consumption levels rise this will be achievable. Instead, reusing materials, by repairing,donating, or selling them, or recycling them into other products, are more easily achievable. Ifmaterials cannot be reused or recycled, they should be sent to waste-to energy facilities that canrecover both energy and resources through incineration. Only if products cannot be incineratedshould they be landfilled. Note that incineration with energy recovery is much preferred toincineration solely to reduce the volume of waste without energy recovery. Dumping and openburning are the least preferred methods for solid waste disposal. Unfortunately, in India, bothdumping and open burning are the most prevalent methods of MSW disposal today. As solid wastemanagement policies develop and people become more aware of the consequences of open dumpingand burning, it is hoped that India will switch from these methods to modern waste-to-energy andthat regulated landfills will eventually be used only for disposal of non-compostable or non-combustible materials, such as WTE ash.
Figure 11: Graphical representation of the integrated solid waste management approach
30
Waste To Energy- A Solution of Environmental & Energy Crisis l PGPEM, IIMR l BRIJRAJPANDEY
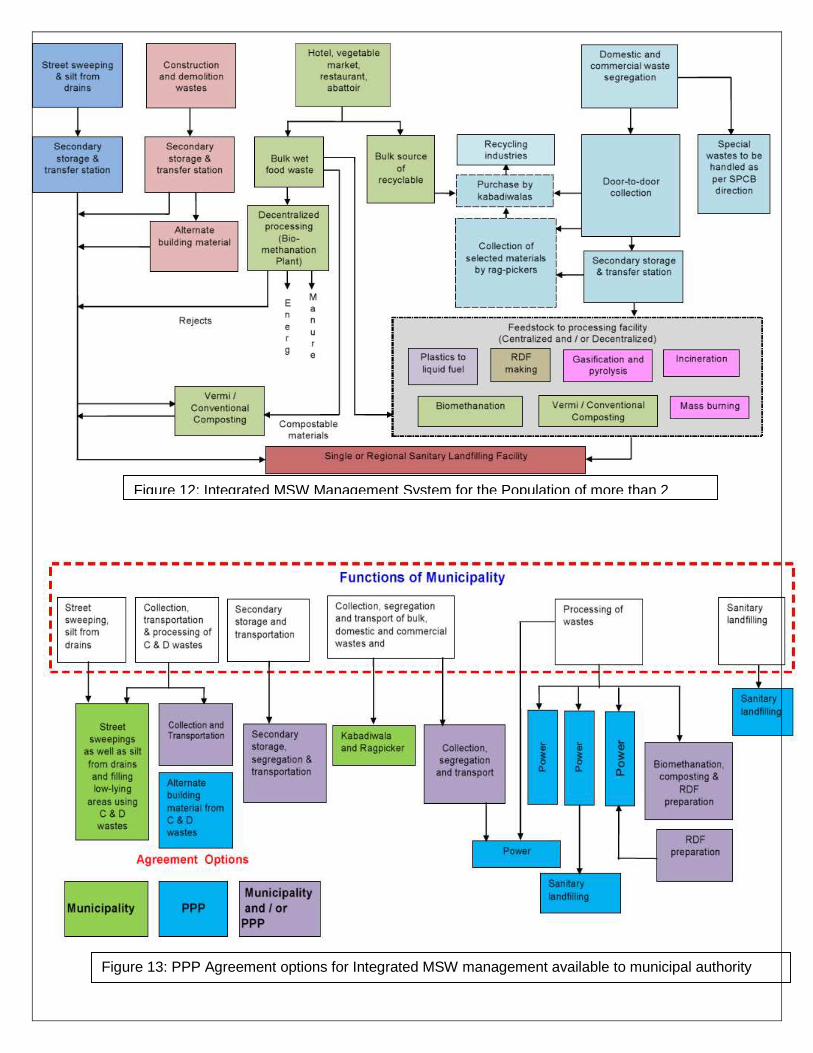
Figure 12: Integrated MSW Management System for the Population of more than 2
Figure 13: PPP Agreement options for Integrated MSW management available to municipal authority
31
Waste To Energy- A Solution of Environmental & Energy Crisis l PGPEM, IIMR l BRIJRAJPANDEY
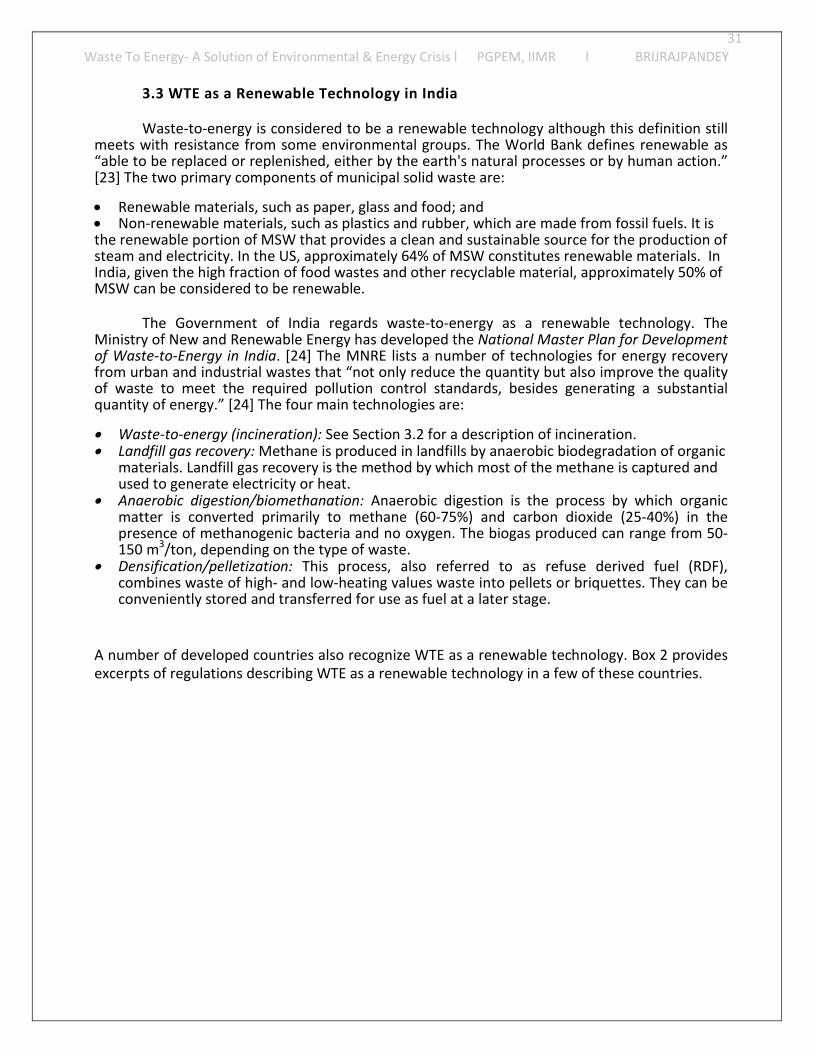
3.3 WTE as a Renewable Technology in India
Waste-to-energy is considered to be a renewable technology although this definition stillmeets with resistance from some environmental groups. The World Bank defines renewable as“able to be replaced or replenished, either by the earth's natural processes or by human action.”[23] The two primary components of municipal solid waste are:
Renewable materials, such as paper, glass and food; and Non-renewable materials, such as plastics and rubber, which are made from fossil fuels. It isthe renewable portion of MSW that provides a clean and sustainable source for the production ofsteam and electricity. In the US, approximately 64% of MSW constitutes renewable materials. InIndia, given the high fraction of food wastes and other recyclable material, approximately 50% ofMSW can be considered to be renewable.
The Government of India regards waste-to-energy as a renewable technology. TheMinistry of New and Renewable Energy has developed the National Master Plan for Developmentof Waste-to-Energy in India. [24] The MNRE lists a number of technologies for energy recoveryfrom urban and industrial wastes that “not only reduce the quantity but also improve the qualityof waste to meet the required pollution control standards, besides generating a substantialquantity of energy.” [24] The four main technologies are:
Waste-to-energy (incineration): See Section 3.2 for a description of incineration. Landfill gas recovery: Methane is produced in landfills by anaerobic biodegradation of organic
materials. Landfill gas recovery is the method by which most of the methane is captured andused to generate electricity or heat.
Anaerobic digestion/biomethanation: Anaerobic digestion is the process by which organicmatter is converted primarily to methane (60-75%) and carbon dioxide (25-40%) in thepresence of methanogenic bacteria and no oxygen. The biogas produced can range from 50-150 m3/ton, depending on the type of waste.
Densification/pelletization: This process, also referred to as refuse derived fuel (RDF),combines waste of high- and low-heating values waste into pellets or briquettes. They can beconveniently stored and transferred for use as fuel at a later stage.
A number of developed countries also recognize WTE as a renewable technology. Box 2 providesexcerpts of regulations describing WTE as a renewable technology in a few of these countries.
32
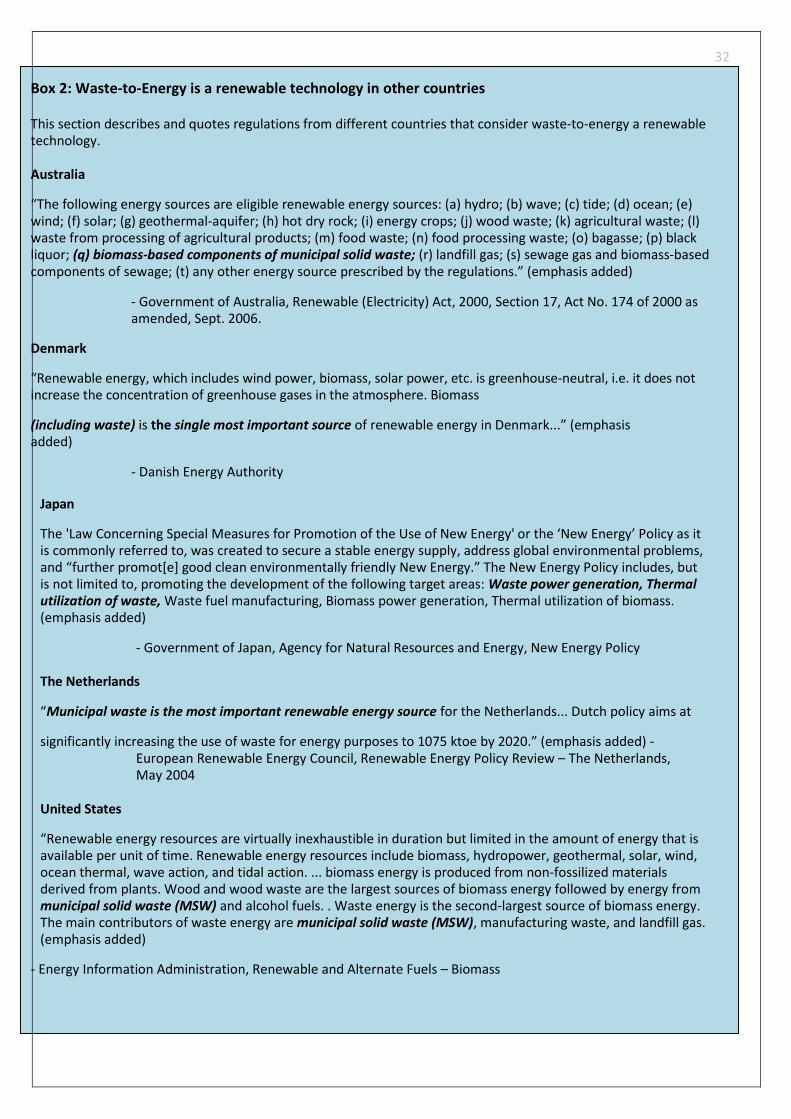
Waste To Energy- A Solution of Environmental & Energy Crisis l PGPEM, IIMR l BRIJRAJPANDEYBox 2: Waste-to-Energy is a renewable technology in other countries
This section describes and quotes regulations from different countries that consider waste-to-energy a renewabletechnology.
Australia
“The following energy sources are eligible renewable energy sources: (a) hydro; (b) wave; (c) tide; (d) ocean; (e)wind; (f) solar; (g) geothermal-aquifer; (h) hot dry rock; (i) energy crops; (j) wood waste; (k) agricultural waste; (l)waste from processing of agricultural products; (m) food waste; (n) food processing waste; (o) bagasse; (p) blackliquor; (q) biomass-based components of municipal solid waste; (r) landfill gas; (s) sewage gas and biomass-basedcomponents of sewage; (t) any other energy source prescribed by the regulations.” (emphasis added)
- Government of Australia, Renewable (Electricity) Act, 2000, Section 17, Act No. 174 of 2000 asamended, Sept. 2006.
Denmark
“Renewable energy, which includes wind power, biomass, solar power, etc. is greenhouse-neutral, i.e. it does notincrease the concentration of greenhouse gases in the atmosphere. Biomass
(including waste) is the single most important source of renewable energy in Denmark...” (emphasisadded)
- Danish Energy Authority
Japan
The 'Law Concerning Special Measures for Promotion of the Use of New Energy' or the ‘New Energy’ Policy as itis commonly referred to, was created to secure a stable energy supply, address global environmental problems,and “further promot[e] good clean environmentally friendly New Energy.” The New Energy Policy includes, butis not limited to, promoting the development of the following target areas: Waste power generation, Thermalutilization of waste, Waste fuel manufacturing, Biomass power generation, Thermal utilization of biomass.(emphasis added)
- Government of Japan, Agency for Natural Resources and Energy, New Energy Policy
The Netherlands
“Municipal waste is the most important renewable energy source for the Netherlands... Dutch policy aims at
significantly increasing the use of waste for energy purposes to 1075 ktoe by 2020.” (emphasis added) -European Renewable Energy Council, Renewable Energy Policy Review – The Netherlands,May 2004
United States
“Renewable energy resources are virtually inexhaustible in duration but limited in the amount of energy that isavailable per unit of time. Renewable energy resources include biomass, hydropower, geothermal, solar, wind,ocean thermal, wave action, and tidal action. ... biomass energy is produced from non-fossilized materialsderived from plants. Wood and wood waste are the largest sources of biomass energy followed by energy frommunicipal solid waste (MSW) and alcohol fuels. . Waste energy is the second-largest source of biomass energy.The main contributors of waste energy are municipal solid waste (MSW), manufacturing waste, and landfill gas.(emphasis added)
- Energy Information Administration, Renewable and Alternate Fuels – Biomass
33
Waste To Energy- A Solution of Environmental & Energy Crisis l PGPEM, IIMR l BRIJRAJPANDEY
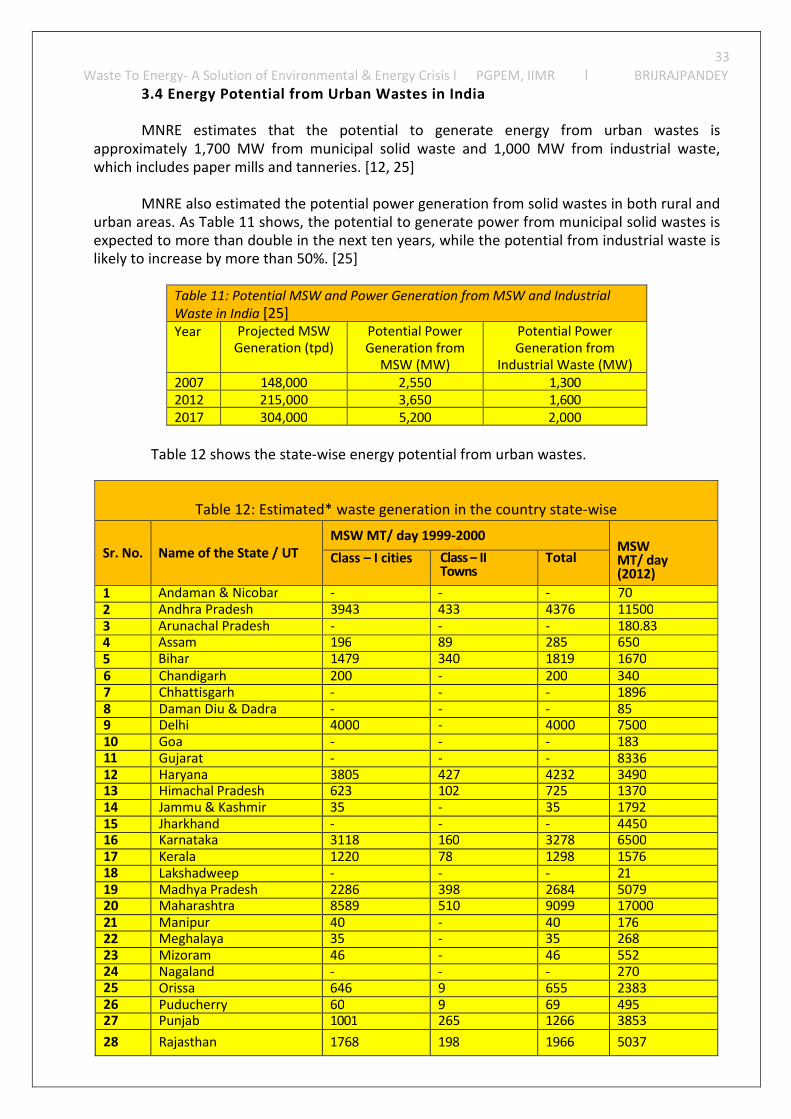
3.4 Energy Potential from Urban Wastes in India
MNRE estimates that the potential to generate energy from urban wastes isapproximately 1,700 MW from municipal solid waste and 1,000 MW from industrial waste,which includes paper mills and tanneries. [12, 25]
MNRE also estimated the potential power generation from solid wastes in both rural andurban areas. As Table 11 shows, the potential to generate power from municipal solid wastes isexpected to more than double in the next ten years, while the potential from industrial waste islikely to increase by more than 50%. [25]
Table 11: Potential MSW and Power Generation from MSW and IndustrialWaste in India [25]Year Projected MSW
Generation (tpd)Potential PowerGeneration from
MSW (MW)
Potential PowerGeneration from
Industrial Waste (MW)2007 148,000 2,550 1,3002012 215,000 3,650 1,6002017 304,000 5,200 2,000
Table 12 shows the state-wise energy potential from urban wastes.
Table 12: Estimated* waste generation in the country state-wise
Sr. No. Name of the State / UTMSW MT/ day 1999-2000
MSWMT/ day(2012)
Class – I cities Class – IITowns
Total
1 Andaman & Nicobar - - - 702 Andhra Pradesh 3943 433 4376 115003 Arunachal Pradesh - - - 180.834 Assam 196 89 285 6505 Bihar 1479 340 1819 16706 Chandigarh 200 - 200 3407 Chhattisgarh - - - 18968 Daman Diu & Dadra - - - 859 Delhi 4000 - 4000 750010 Goa - - - 18311 Gujarat - - - 833612 Haryana 3805 427 4232 349013 Himachal Pradesh 623 102 725 137014 Jammu & Kashmir 35 - 35 179215 Jharkhand - - - 445016 Karnataka 3118 160 3278 650017 Kerala 1220 78 1298 157618 Lakshadweep - - - 2119 Madhya Pradesh 2286 398 2684 507920 Maharashtra 8589 510 9099 1700021 Manipur 40 - 40 17622 Meghalaya 35 - 35 26823 Mizoram 46 - 46 55224 Nagaland - - - 27025 Orissa 646 9 655 238326 Puducherry 60 9 69 49527 Punjab 1001 265 1266 3853
28 Rajasthan 1768 198 1966 5037
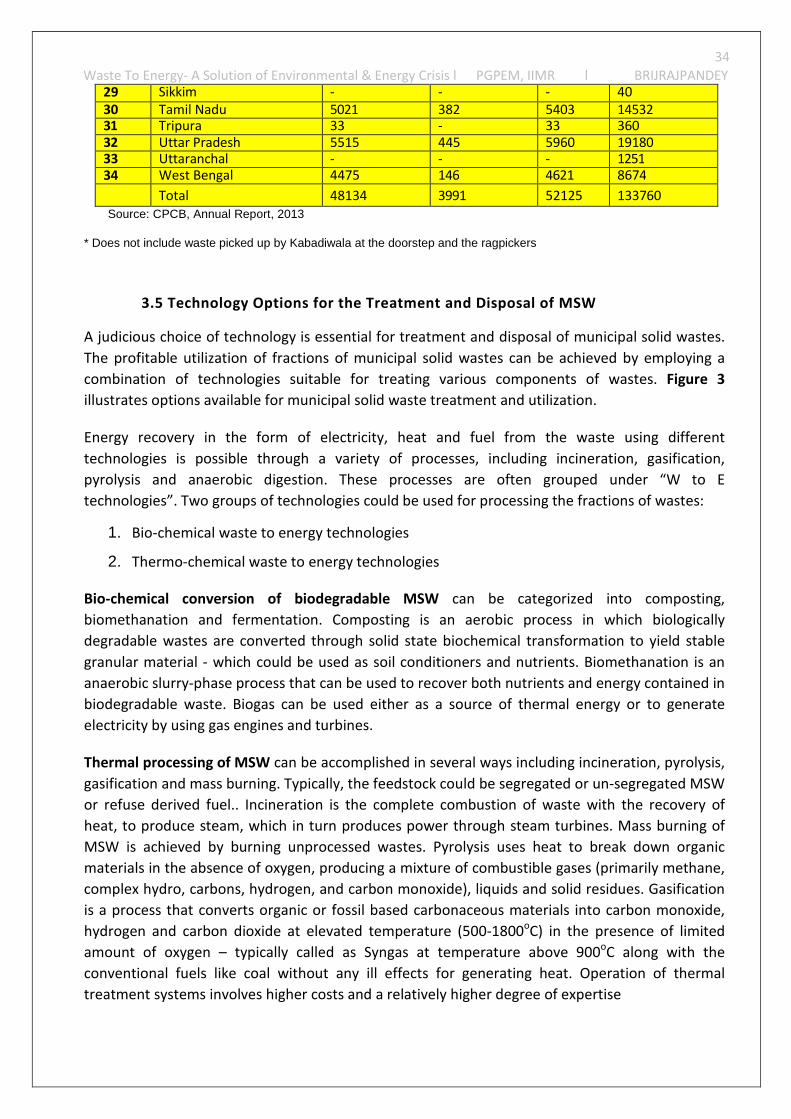
34
Waste To Energy- A Solution of Environmental & Energy Crisis l PGPEM, IIMR l BRIJRAJPANDEY29 Sikkim - - - 4030 Tamil Nadu 5021 382 5403 1453231 Tripura 33 - 33 36032 Uttar Pradesh 5515 445 5960 1918033 Uttaranchal - - - 125134 West Bengal 4475 146 4621 8674
Total 48134 3991 52125 133760Source: CPCB, Annual Report, 2013
* Does not include waste picked up by Kabadiwala at the doorstep and the ragpickers
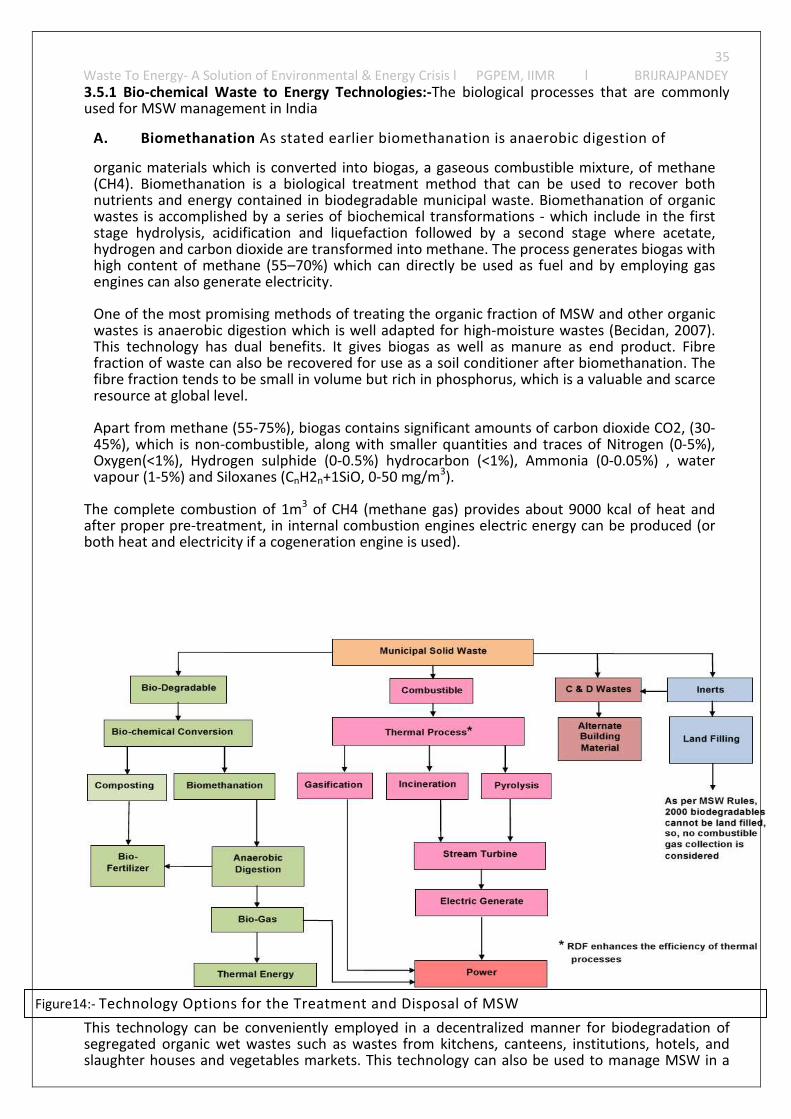
3.5 Technology Options for the Treatment and Disposal of MSW
A judicious choice of technology is essential for treatment and disposal of municipal solid wastes.
The profitable utilization of fractions of municipal solid wastes can be achieved by employing a
combination of technologies suitable for treating various components of wastes. Figure 3
illustrates options available for municipal solid waste treatment and utilization.
Energy recovery in the form of electricity, heat and fuel from the waste using different
technologies is possible through a variety of processes, including incineration, gasification,
pyrolysis and anaerobic digestion. These processes are often grouped under “W to E
technologies”. Two groups of technologies could be used for processing the fractions of wastes:
1. Bio-chemical waste to energy technologies
2. Thermo-chemical waste to energy technologies
Bio-chemical conversion of biodegradable MSW can be categorized into composting,
biomethanation and fermentation. Composting is an aerobic process in which biologically
degradable wastes are converted through solid state biochemical transformation to yield stable
granular material - which could be used as soil conditioners and nutrients. Biomethanation is an
anaerobic slurry-phase process that can be used to recover both nutrients and energy contained in
biodegradable waste. Biogas can be used either as a source of thermal energy or to generate
electricity by using gas engines and turbines.
Thermal processing of MSW can be accomplished in several ways including incineration, pyrolysis,
gasification and mass burning. Typically, the feedstock could be segregated or un-segregated MSW
or refuse derived fuel.. Incineration is the complete combustion of waste with the recovery of
heat, to produce steam, which in turn produces power through steam turbines. Mass burning of
MSW is achieved by burning unprocessed wastes. Pyrolysis uses heat to break down organic
materials in the absence of oxygen, producing a mixture of combustible gases (primarily methane,
complex hydro, carbons, hydrogen, and carbon monoxide), liquids and solid residues. Gasification
is a process that converts organic or fossil based carbonaceous materials into carbon monoxide,
hydrogen and carbon dioxide at elevated temperature (500-1800oC) in the presence of limited
amount of oxygen – typically called as Syngas at temperature above 900oC along with the
conventional fuels like coal without any ill effects for generating heat. Operation of thermal
treatment systems involves higher costs and a relatively higher degree of expertise
35
Waste To Energy- A Solution of Environmental & Energy Crisis l PGPEM, IIMR l BRIJRAJPANDEY3.5.1 Bio-chemical Waste to Energy Technologies:-The biological processes that are commonlyused for MSW management in India
A. Biomethanation As stated earlier biomethanation is anaerobic digestion of
organic materials which is converted into biogas, a gaseous combustible mixture, of methane(CH4). Biomethanation is a biological treatment method that can be used to recover bothnutrients and energy contained in biodegradable municipal waste. Biomethanation of organicwastes is accomplished by a series of biochemical transformations - which include in the firststage hydrolysis, acidification and liquefaction followed by a second stage where acetate,hydrogen and carbon dioxide are transformed into methane. The process generates biogas withhigh content of methane (55–70%) which can directly be used as fuel and by employing gasengines can also generate electricity.
One of the most promising methods of treating the organic fraction of MSW and other organicwastes is anaerobic digestion which is well adapted for high-moisture wastes (Becidan, 2007).This technology has dual benefits. It gives biogas as well as manure as end product. Fibrefraction of waste can also be recovered for use as a soil conditioner after biomethanation. Thefibre fraction tends to be small in volume but rich in phosphorus, which is a valuable and scarceresource at global level.
Apart from methane (55-75%), biogas contains significant amounts of carbon dioxide CO2, (30-45%), which is non-combustible, along with smaller quantities and traces of Nitrogen (0-5%),Oxygen(<1%), Hydrogen sulphide (0-0.5%) hydrocarbon (<1%), Ammonia (0-0.05%) , watervapour (1-5%) and Siloxanes (CnH2n+1SiO, 0-50 mg/m3).
The complete combustion of 1m3 of CH4 (methane gas) provides about 9000 kcal of heat andafter proper pre-treatment, in internal combustion engines electric energy can be produced (orboth heat and electricity if a cogeneration engine is used).
Figure14:- Technology Options for the Treatment and Disposal of MSW
This technology can be conveniently employed in a decentralized manner for biodegradation ofsegregated organic wet wastes such as wastes from kitchens, canteens, institutions, hotels, andslaughter houses and vegetables markets. This technology can also be used to manage MSW in a
36
Waste To Energy- A Solution of Environmental & Energy Crisis l PGPEM, IIMR l BRIJRAJPANDEYcentralized manner in small towns and decentralized manner in large cities provided the municipalauthorities collect segregated biodegradable wet wastes from households and establishments.Currently, this technology has been successfully employed in 172 locations in India ranging from100kg/day to 10 TPD
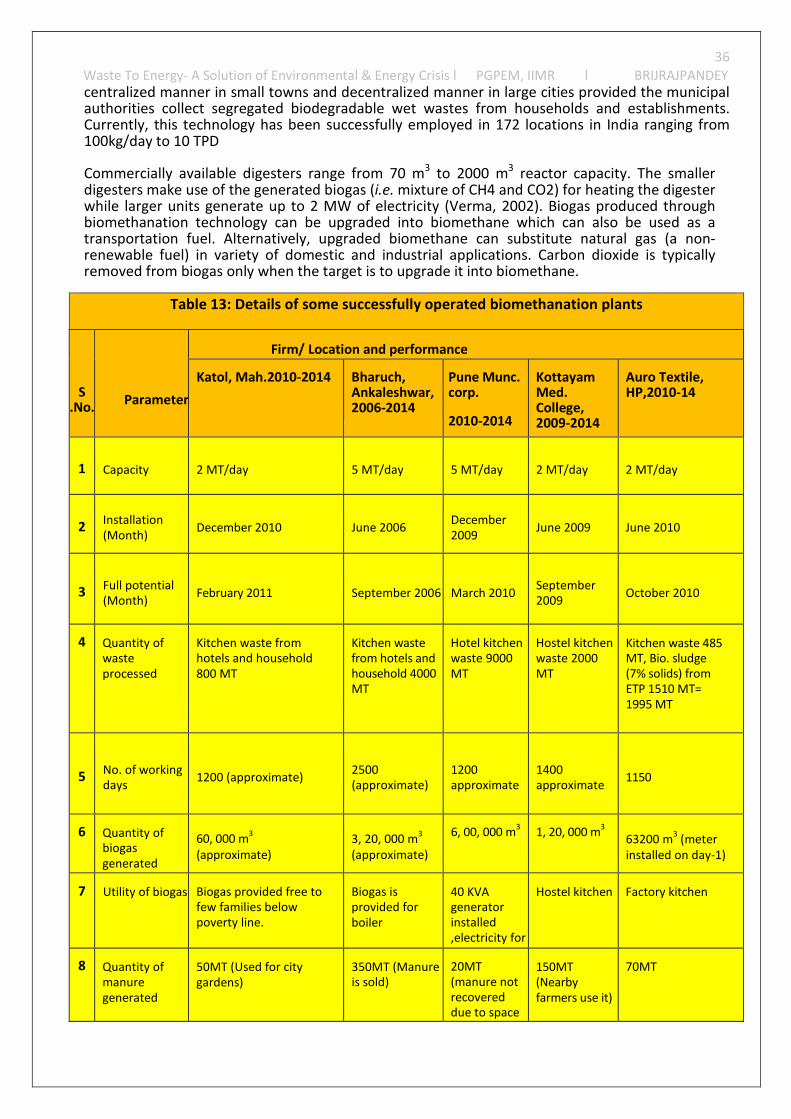
Commercially available digesters range from 70 m3 to 2000 m3 reactor capacity. The smallerdigesters make use of the generated biogas (i.e. mixture of CH4 and CO2) for heating the digesterwhile larger units generate up to 2 MW of electricity (Verma, 2002). Biogas produced throughbiomethanation technology can be upgraded into biomethane which can also be used as atransportation fuel. Alternatively, upgraded biomethane can substitute natural gas (a non-renewable fuel) in variety of domestic and industrial applications. Carbon dioxide is typicallyremoved from biogas only when the target is to upgrade it into biomethane.
Table 13: Details of some successfully operated biomethanation plants
S.No.
Parameter
Firm/ Location and performance
Katol, Mah.2010-2014 Bharuch,Ankaleshwar,2006-2014
Pune Munc.corp.
2010-2014
KottayamMed.College,2009-2014
Auro Textile,HP,2010-14
1 Capacity 2 MT/day 5 MT/day 5 MT/day 2 MT/day 2 MT/day
2Installation(Month)
December 2010 June 2006December2009
June 2009 June 2010
3 Full potential(Month)
February 2011 September 2006 March 2010September2009
October 2010
4 Quantity ofwasteprocessed
Kitchen waste fromhotels and household800 MT
Kitchen wastefrom hotels andhousehold 4000MT
Hotel kitchenwaste 9000MT
Hostel kitchenwaste 2000MT
Kitchen waste 485MT, Bio. sludge(7% solids) fromETP 1510 MT=1995 MT
5 No. of workingdays
1200 (approximate)2500(approximate)
1200approximate
1400approximate
1150
6 Quantity ofbiogasgenerated
60, 000 m3
(approximate)3, 20, 000 m
3
(approximate)
6, 00, 000 m3
1, 20, 000 m3
63200 m3
(meterinstalled on day-1)
7 Utility of biogas Biogas provided free tofew families belowpoverty line.
Biogas isprovided forboiler
40 KVAgeneratorinstalled,electricity forcaptive use
Hostel kitchen Factory kitchen
8 Quantity ofmanuregenerated
50MT (Used for citygardens)
350MT (Manureis sold)
20MT(manure notrecovereddue to spaceproblem)
150MT(Nearbyfarmers use it)
70MT
37
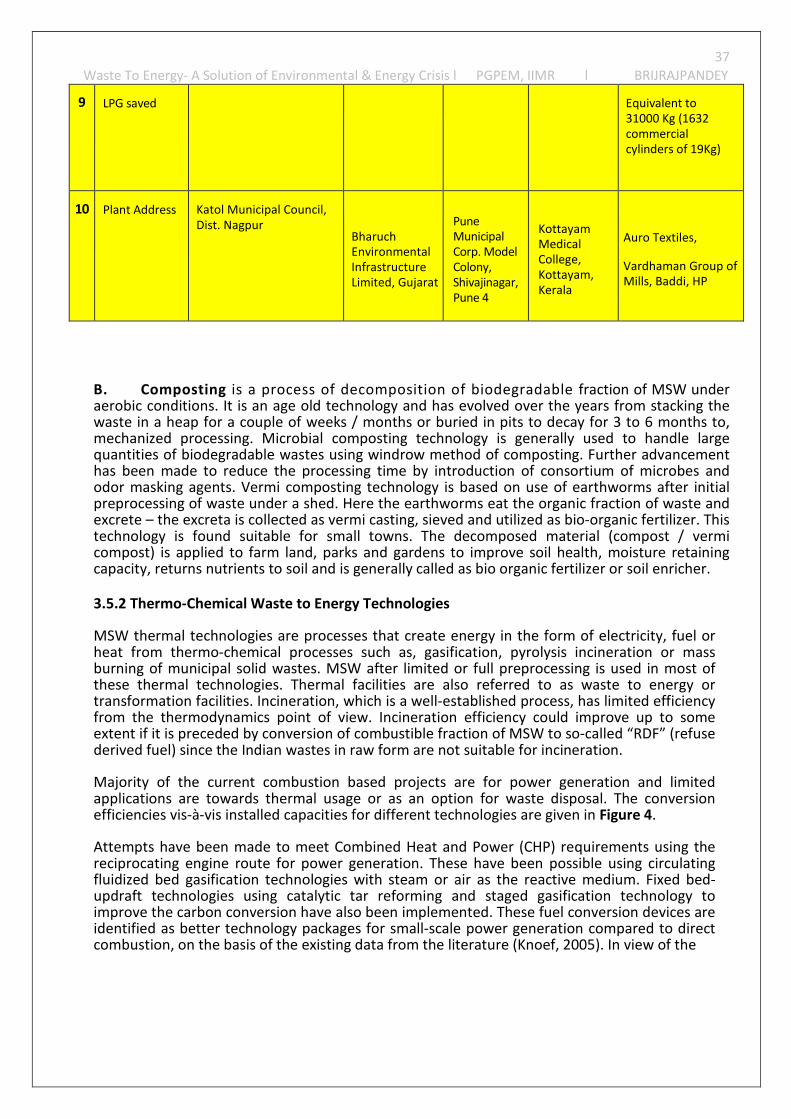
Waste To Energy- A Solution of Environmental & Energy Crisis l PGPEM, IIMR l BRIJRAJPANDEY
9 LPG saved Equivalent to31000 Kg (1632commercialcylinders of 19Kg)
10 Plant Address Katol Municipal Council,Dist. Nagpur
BharuchEnvironmentalInfrastructureLimited, Gujarat
PuneMunicipalCorp. ModelColony,Shivajinagar,Pune 4
KottayamMedicalCollege,Kottayam,Kerala
Auro Textiles,
Vardhaman Group ofMills, Baddi, HP
B. Composting is a process of decomposition of biodegradable fraction of MSW underaerobic conditions. It is an age old technology and has evolved over the years from stacking thewaste in a heap for a couple of weeks / months or buried in pits to decay for 3 to 6 months to,mechanized processing. Microbial composting technology is generally used to handle largequantities of biodegradable wastes using windrow method of composting. Further advancementhas been made to reduce the processing time by introduction of consortium of microbes andodor masking agents. Vermi composting technology is based on use of earthworms after initialpreprocessing of waste under a shed. Here the earthworms eat the organic fraction of waste andexcrete – the excreta is collected as vermi casting, sieved and utilized as bio-organic fertilizer. Thistechnology is found suitable for small towns. The decomposed material (compost / vermicompost) is applied to farm land, parks and gardens to improve soil health, moisture retainingcapacity, returns nutrients to soil and is generally called as bio organic fertilizer or soil enricher.
3.5.2 Thermo-Chemical Waste to Energy Technologies
MSW thermal technologies are processes that create energy in the form of electricity, fuel orheat from thermo-chemical processes such as, gasification, pyrolysis incineration or massburning of municipal solid wastes. MSW after limited or full preprocessing is used in most ofthese thermal technologies. Thermal facilities are also referred to as waste to energy ortransformation facilities. Incineration, which is a well-established process, has limited efficiencyfrom the thermodynamics point of view. Incineration efficiency could improve up to someextent if it is preceded by conversion of combustible fraction of MSW to so-called “RDF” (refusederived fuel) since the Indian wastes in raw form are not suitable for incineration.
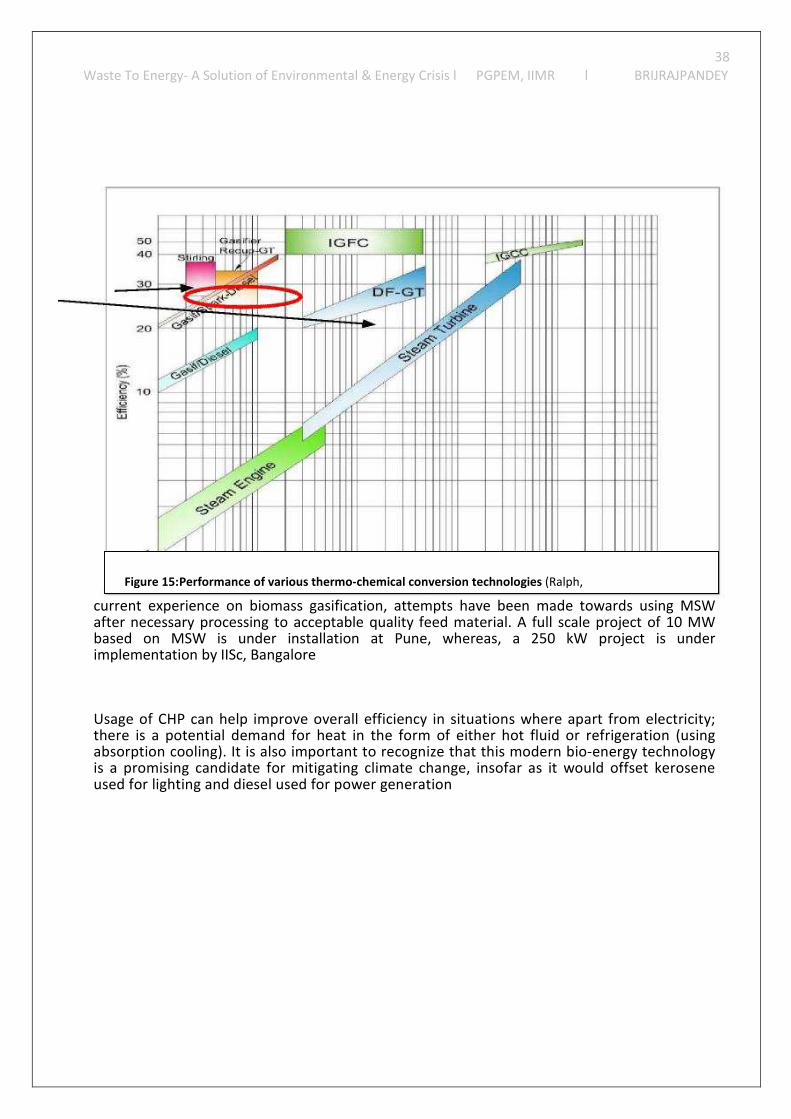
Majority of the current combustion based projects are for power generation and limitedapplications are towards thermal usage or as an option for waste disposal. The conversionefficiencies vis-à-vis installed capacities for different technologies are given in Figure 4.
Attempts have been made to meet Combined Heat and Power (CHP) requirements using thereciprocating engine route for power generation. These have been possible using circulatingfluidized bed gasification technologies with steam or air as the reactive medium. Fixed bed-updraft technologies using catalytic tar reforming and staged gasification technology toimprove the carbon conversion have also been implemented. These fuel conversion devices areidentified as better technology packages for small-scale power generation compared to directcombustion, on the basis of the existing data from the literature (Knoef, 2005). In view of the
38
Waste To Energy- A Solution of Environmental & Energy Crisis l PGPEM, IIMR l BRIJRAJPANDEY
curraftebasimp
Usatherabsis ause
Figure 15:Performance of various thermo-chemical conversion technologies (Ralph,
ent experience on biomass gasification, attempts have been made towards using MSWr necessary processing to acceptable quality feed material. A full scale project of 10 MW
ed on MSW is under installation at Pune, whereas, a 250 kW project is underlementation by IISc, Bangalore
ge of CHP can help improve overall efficiency in situations where apart from electricity;e is a potential demand for heat in the form of either hot fluid or refrigeration (using
orption cooling). It is also important to recognize that this modern bio-energy technologypromising candidate for mitigating climate change, insofar as it would offset kerosene
d for lighting and diesel used for power generation
39
Waste To Energy- A Solution of Environmental & Energy Crisis l PGPEM, IIMR l BRIJRAJPANDEY
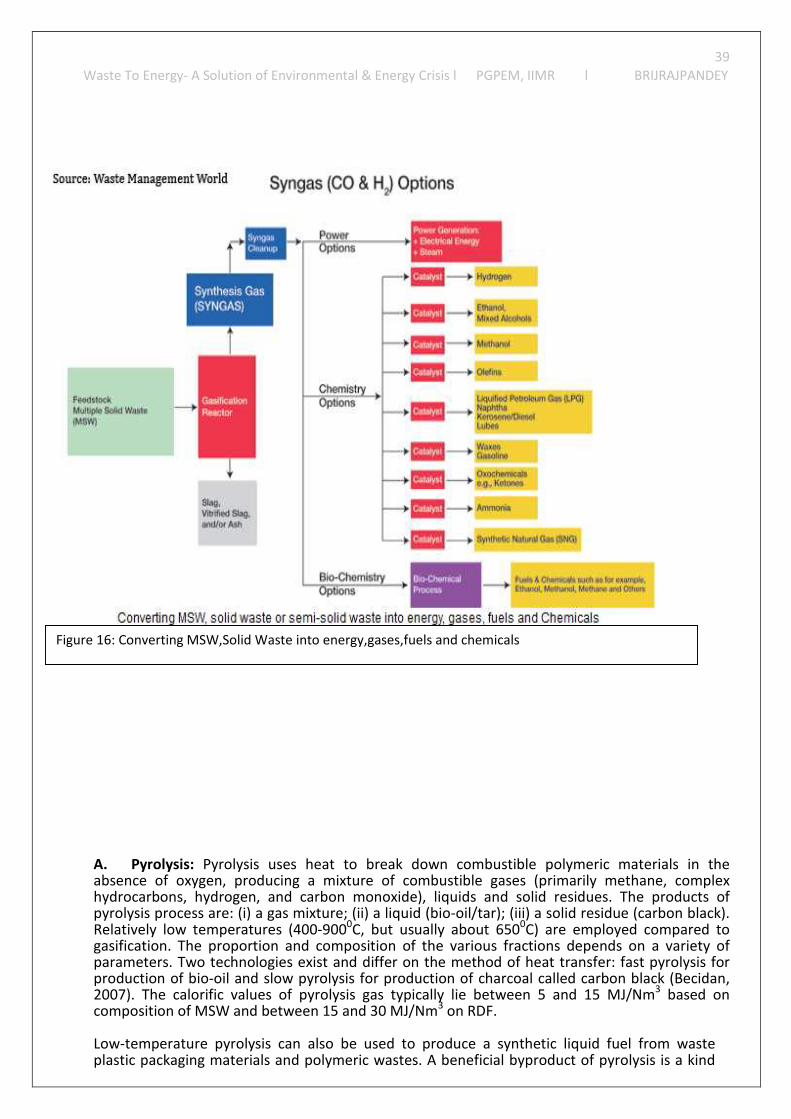
Figure 16: Converting MSW,Solid Waste into energy,gases,fuels and chemicals
A. Pyrolysis: Pyrolysis uses heat to break down combustible polymeric materials in theabsence of oxygen, producing a mixture of combustible gases (primarily methane, complexhydrocarbons, hydrogen, and carbon monoxide), liquids and solid residues. The products ofpyrolysis process are: (i) a gas mixture; (ii) a liquid (bio-oil/tar); (iii) a solid residue (carbon black).Relatively low temperatures (400-9000C, but usually about 6500C) are employed compared togasification. The proportion and composition of the various fractions depends on a variety ofparameters. Two technologies exist and differ on the method of heat transfer: fast pyrolysis forproduction of bio-oil and slow pyrolysis for production of charcoal called carbon black (Becidan,2007). The calorific values of pyrolysis gas typically lie between 5 and 15 MJ/Nm3 based oncomposition of MSW and between 15 and 30 MJ/Nm3 on RDF.
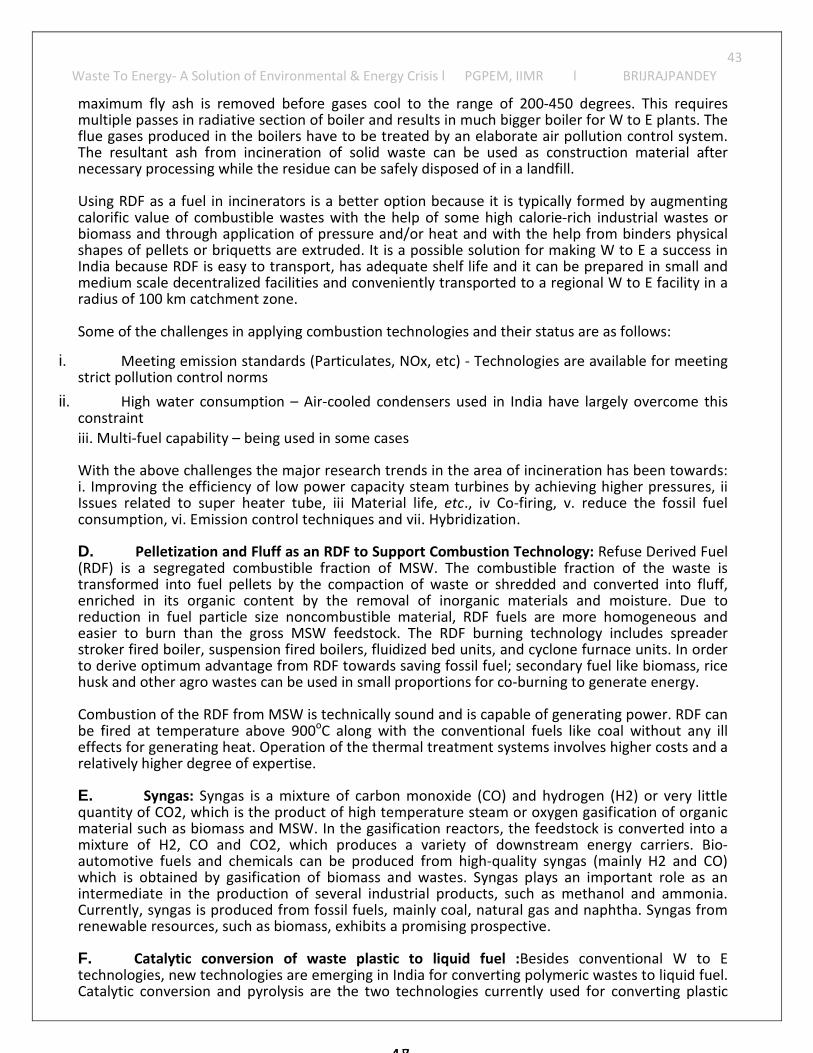
Low-temperature pyrolysis can also be used to produce a synthetic liquid fuel from wasteplastic packaging materials and polymeric wastes. A beneficial byproduct of pyrolysis is a kind
40
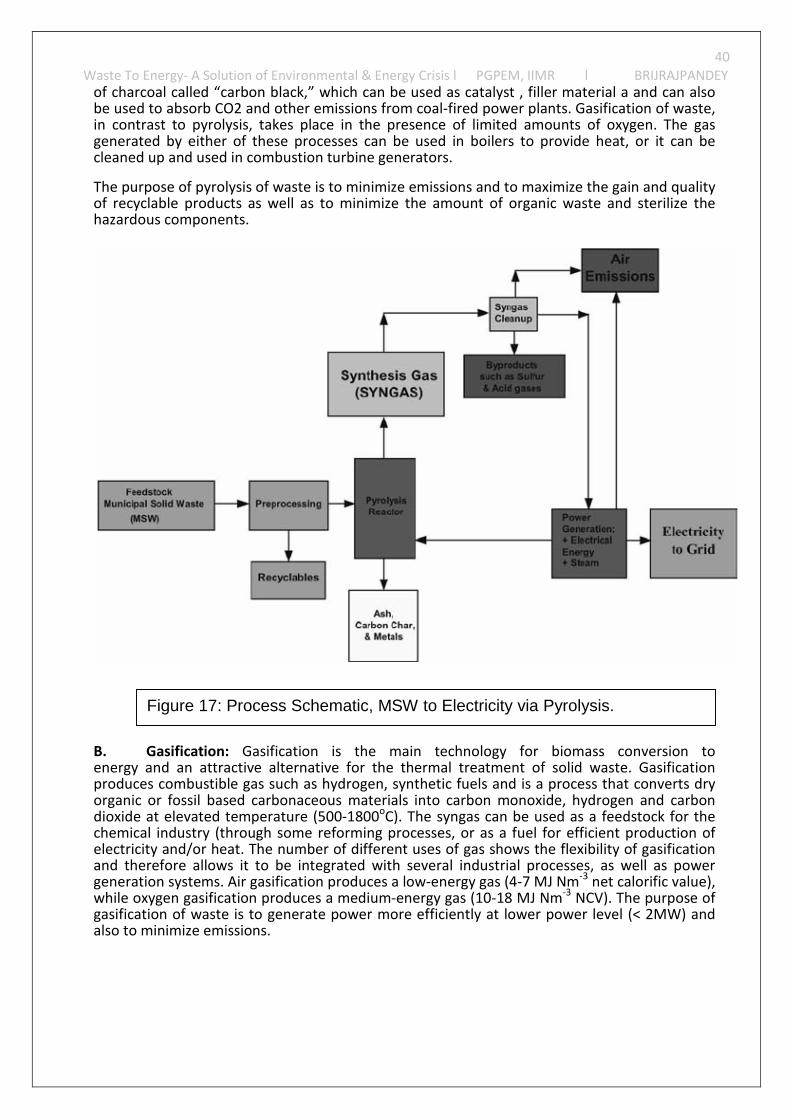
Waste To Energy- A Solution of Environmental & Energy Crisis l PGPEM, IIMR l BRIJRAJPANDEYof charcoal called “carbon black,” which can be used as catalyst , filler material a and can alsobe used to absorb CO2 and other emissions from coal-fired power plants. Gasification of waste,in contrast to pyrolysis, takes place in the presence of limited amounts of oxygen. The gasgenerated by either of these processes can be used in boilers to provide heat, or it can becleaned up and used in combustion turbine generators.
The purpose of pyrolysis of waste is to minimize emissions and to maximize the gain and qualityof recyclable products as well as to minimize the amount of organic waste and sterilize thehazardous components.
B.energyproducorganicdioxidechemicelectricand thgenerawhile ogasificaalso to
Figure 17: Process Schematic, MSW to Electricity via Pyrolysis.
Gasification: Gasification is the main technology for biomass conversion toand an attractive alternative for the thermal treatment of solid waste. Gasification
es combustible gas such as hydrogen, synthetic fuels and is a process that converts dryor fossil based carbonaceous materials into carbon monoxide, hydrogen and carbonat elevated temperature (500-1800oC). The syngas can be used as a feedstock for the
al industry (through some reforming processes, or as a fuel for efficient production ofity and/or heat. The number of different uses of gas shows the flexibility of gasificationerefore allows it to be integrated with several industrial processes, as well as powertion systems. Air gasification produces a low-energy gas (4-7 MJ Nm-3 net calorific value),xygen gasification produces a medium-energy gas (10-18 MJ Nm-3 NCV). The purpose oftion of waste is to generate power more efficiently at lower power level (< 2MW) andminimize emissions.
41
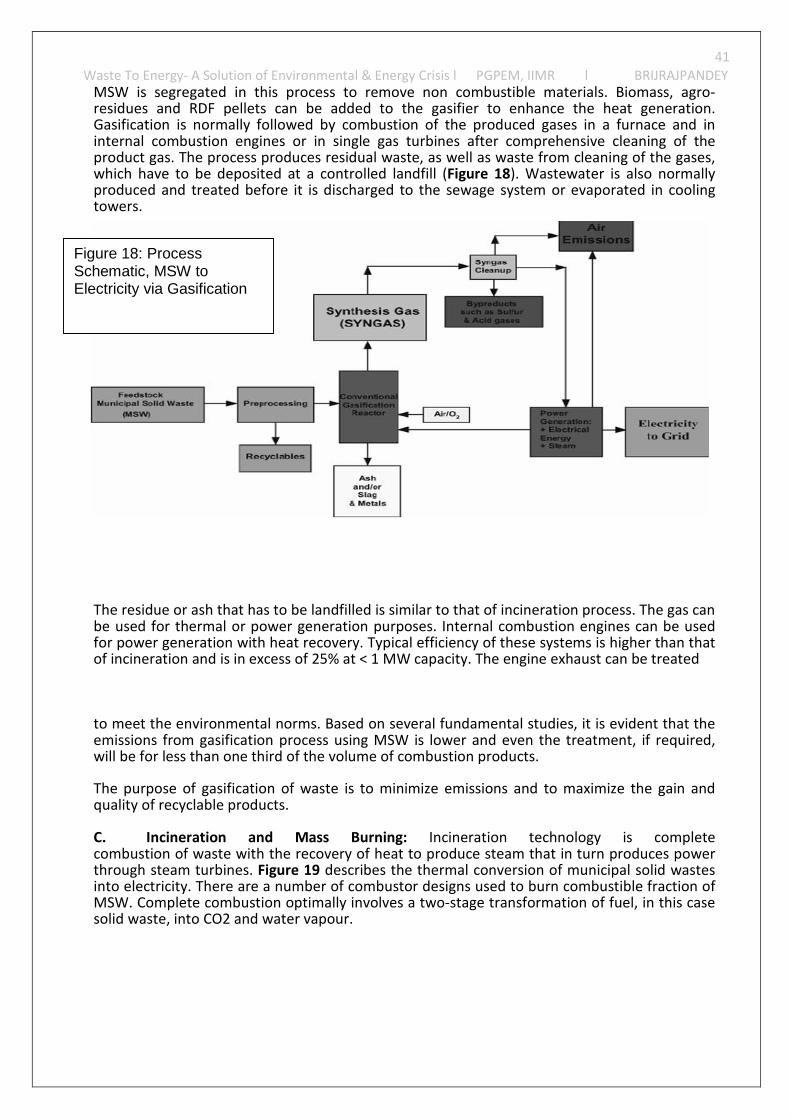
Waste To Energy- A Solution of Environmental & Energy Crisis l PGPEM, IIMR l BRIJRAJPANDEYMSW is segregated in this process to remove non combustible materials. Biomass, agro-residues and RDF pellets can be added to the gasifier to enhance the heat generation.Gasification is normally followed by combustion of the produced gases in a furnace and ininternal combustion engines or in single gas turbines after comprehensive cleaning of theproduct gas. The process produces residual waste, as well as waste from cleaning of the gases,which have to be deposited at a controlled landfill (Figure 18). Wastewater is also normallyproduced and treated before it is discharged to the sewage system or evaporated in coolingtowers.
The residue or ash that has to be landfilled is similar to that of incineration process. The gas canbe used for thermal or power generation purposes. Internal combustion engines can be usedfor power generation with heat recovery. Typical efficiency of these systems is higher than thatof incineration and is in excess of 25% at < 1 MW capacity. The engine exhaust can be treated
to meet the environmental norms. Based on several fundamental studies, it is evident that theemissions from gasification process using MSW is lower and even the treatment, if required,will be for less than one third of the volume of combustion products.
The purpose of gasification of waste is to minimize emissions and to maximize the gain andquality of recyclable products.
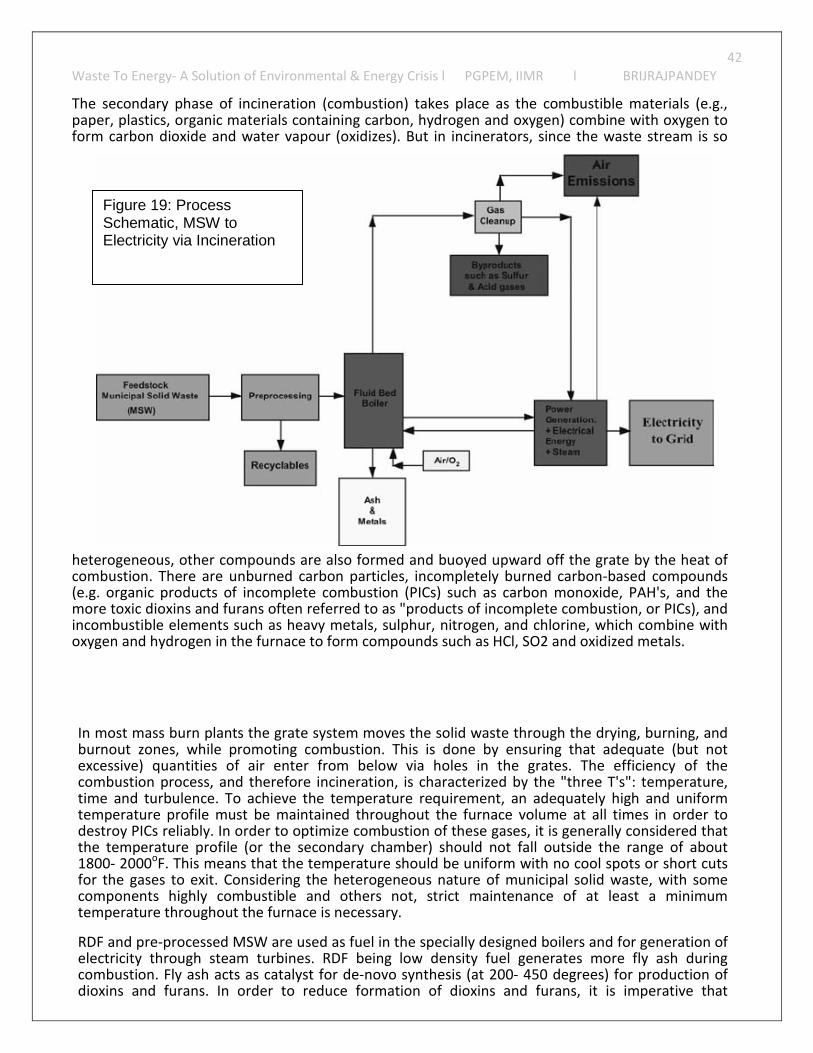
C. Incineration and Mass Burning: Incineration technology is completecombustion of waste with the recovery of heat to produce steam that in turn produces powerthrough steam turbines. Figure 19 describes the thermal conversion of municipal solid wastesinto electricity. There are a number of combustor designs used to burn combustible fraction ofMSW. Complete combustion optimally involves a two-stage transformation of fuel, in this casesolid waste, into CO2 and water vapour.
Figure 18: ProcessSchematic, MSW toElectricity via Gasification
42
Waste To Energy- A Solution of Environmental & Energy Crisis l PGPEM, IIMR l BRIJRAJPANDEY
The secondary phase of incineration (combustion) takes place as the combustible materials (e.g.,paper, plastics, organic materials containing carbon, hydrogen and oxygen) combine with oxygen toform carbon dioxide and water vapour (oxidizes). But in incinerators, since the waste stream is so
heterogeneous, other compounds are also formed and buoyed upward off the grate by the heat ofcombustion. There are unburned carbon particles, incompletely burned carbon-based compounds(e.g. organic products of incomplete combustion (PICs) such as carbon monoxide, PAH's, and themore toxic dioxins and furans often referred to as "products of incomplete combustion, or PICs), andincombustible elements such as heavy metals, sulphur, nitrogen, and chlorine, which combine withoxygen and hydrogen in the furnace to form compounds such as HCl, SO2 and oxidized metals.
In most mass burn plants the grate system moves the solid waste through the drying, burning, andburnout zones, while promoting combustion. This is done by ensuring that adequate (but notexcessive) quantities of air enter from below via holes in the grates. The efficiency of thecombustion process, and therefore incineration, is characterized by the "three T's": temperature,time and turbulence. To achieve the temperature requirement, an adequately high and uniformtemperature profile must be maintained throughout the furnace volume at all times in order todestroy PICs reliably. In order to optimize combustion of these gases, it is generally considered thatthe temperature profile (or the secondary chamber) should not fall outside the range of about1800- 2000oF. This means that the temperature should be uniform with no cool spots or short cutsfor the gases to exit. Considering the heterogeneous nature of municipal solid waste, with somecomponents highly combustible and others not, strict maintenance of at least a minimumtemperature throughout the furnace is necessary.
RDF and pre-processed MSW are used as fuel in the specially designed boilers and for generation ofelectricity through steam turbines. RDF being low density fuel generates more fly ash duringcombustion. Fly ash acts as catalyst for de-novo synthesis (at 200- 450 degrees) for production ofdioxins and furans. In order to reduce formation of dioxins and furans, it is imperative that
Figure 19: ProcessSchematic, MSW toElectricity via Incineration
43
Waste To Energy- A Solution of Environmental & Energy Crisis l PGPEM, IIMR l BRIJRAJPANDEY
maximum fly ash is removed before gases cool to the range of 200-450 degrees. This requiresmultiple passes in radiative section of boiler and results in much bigger boiler for W to E plants. Theflue gases produced in the boilers have to be treated by an elaborate air pollution control system.The resultant ash from incineration of solid waste can be used as construction material afternecessary processing while the residue can be safely disposed of in a landfill.
Using RDF as a fuel in incinerators is a better option because it is typically formed by augmentingcalorific value of combustible wastes with the help of some high calorie-rich industrial wastes orbiomass and through application of pressure and/or heat and with the help from binders physicalshapes of pellets or briquetts are extruded. It is a possible solution for making W to E a success inIndia because RDF is easy to transport, has adequate shelf life and it can be prepared in small andmedium scale decentralized facilities and conveniently transported to a regional W to E facility in aradius of 100 km catchment zone.
Some of the challenges in applying combustion technologies and their status are as follows:
i. Meeting emission standards (Particulates, NOx, etc) - Technologies are available for meetingstrict pollution control norms
ii. High water consumption – Air-cooled condensers used in India have largely overcome thisconstraint
iii. Multi-fuel capability – being used in some cases
With the above challenges the major research trends in the area of incineration has been towards:i. Improving the efficiency of low power capacity steam turbines by achieving higher pressures, iiIssues related to super heater tube, iii Material life, etc., iv Co-firing, v. reduce the fossil fuelconsumption, vi. Emission control techniques and vii. Hybridization.
D. Pelletization and Fluff as an RDF to Support Combustion Technology: Refuse Derived Fuel(RDF) is a segregated combustible fraction of MSW. The combustible fraction of the waste istransformed into fuel pellets by the compaction of waste or shredded and converted into fluff,enriched in its organic content by the removal of inorganic materials and moisture. Due toreduction in fuel particle size noncombustible material, RDF fuels are more homogeneous andeasier to burn than the gross MSW feedstock. The RDF burning technology includes spreaderstroker fired boiler, suspension fired boilers, fluidized bed units, and cyclone furnace units. In orderto derive optimum advantage from RDF towards saving fossil fuel; secondary fuel like biomass, ricehusk and other agro wastes can be used in small proportions for co-burning to generate energy.
Combustion of the RDF from MSW is technically sound and is capable of generating power. RDF canbe fired at temperature above 900oC along with the conventional fuels like coal without any illeffects for generating heat. Operation of the thermal treatment systems involves higher costs and arelatively higher degree of expertise.
E. Syngas: Syngas is a mixture of carbon monoxide (CO) and hydrogen (H2) or very littlequantity of CO2, which is the product of high temperature steam or oxygen gasification of organicmaterial such as biomass and MSW. In the gasification reactors, the feedstock is converted into amixture of H2, CO and CO2, which produces a variety of downstream energy carriers. Bio-automotive fuels and chemicals can be produced from high-quality syngas (mainly H2 and CO)which is obtained by gasification of biomass and wastes. Syngas plays an important role as anintermediate in the production of several industrial products, such as methanol and ammonia.Currently, syngas is produced from fossil fuels, mainly coal, natural gas and naphtha. Syngas fromrenewable resources, such as biomass, exhibits a promising prospective.
F. Catalytic conversion of waste plastic to liquid fuel :Besides conventional W to Etechnologies, new technologies are emerging in India for converting polymeric wastes to liquid fuel.Catalytic conversion and pyrolysis are the two technologies currently used for converting plastic
4 74 8
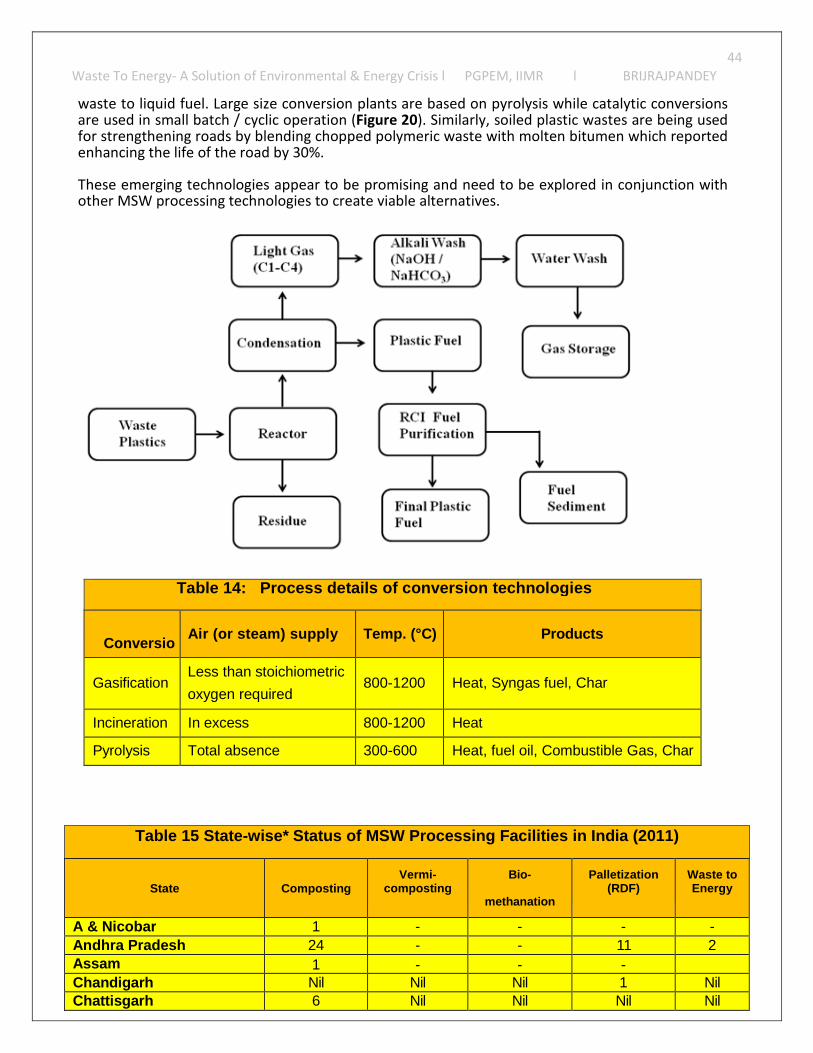
44
Waste To Energy- A Solution of Environmental & Energy Crisis l PGPEM, IIMR l BRIJRAJPANDEY
waste to liquid fuel. Large size conversion plants are based on pyrolysis while catalytic conversionsare used in small batch / cyclic operation (Figure 20). Similarly, soiled plastic wastes are being usedfor strengthening roads by blending chopped polymeric waste with molten bitumen which reportedenhancing the life of the road by 30%.
These emerging technologies appear to be promising and need to be explored in conjunction withother MSW processing technologies to create viable alternatives.
Table 14: Process details of conversion technologies
Conversio
n process
Air (or steam) supply Temp. (°C) Products
GasificationLess than stoichiometric
oxygen required800-1200 Heat, Syngas fuel, Char
Incineration In excess 800-1200 Heat
Pyrolysis Total absence 300-600 Heat, fuel oil, Combustible Gas, Char
Table 15 State-wise* Status of MSW Processing Facilities in India (2011)
State CompostingVermi-
compostingBio-
methanation
Palletization(RDF)
Waste toEnergy
A & Nicobar 1 - - - -
Andhra Pradesh 24 - - 11 2
Assam 1 - - -Chandigarh Nil Nil Nil 1 NilChattisgarh 6 Nil Nil Nil Nil
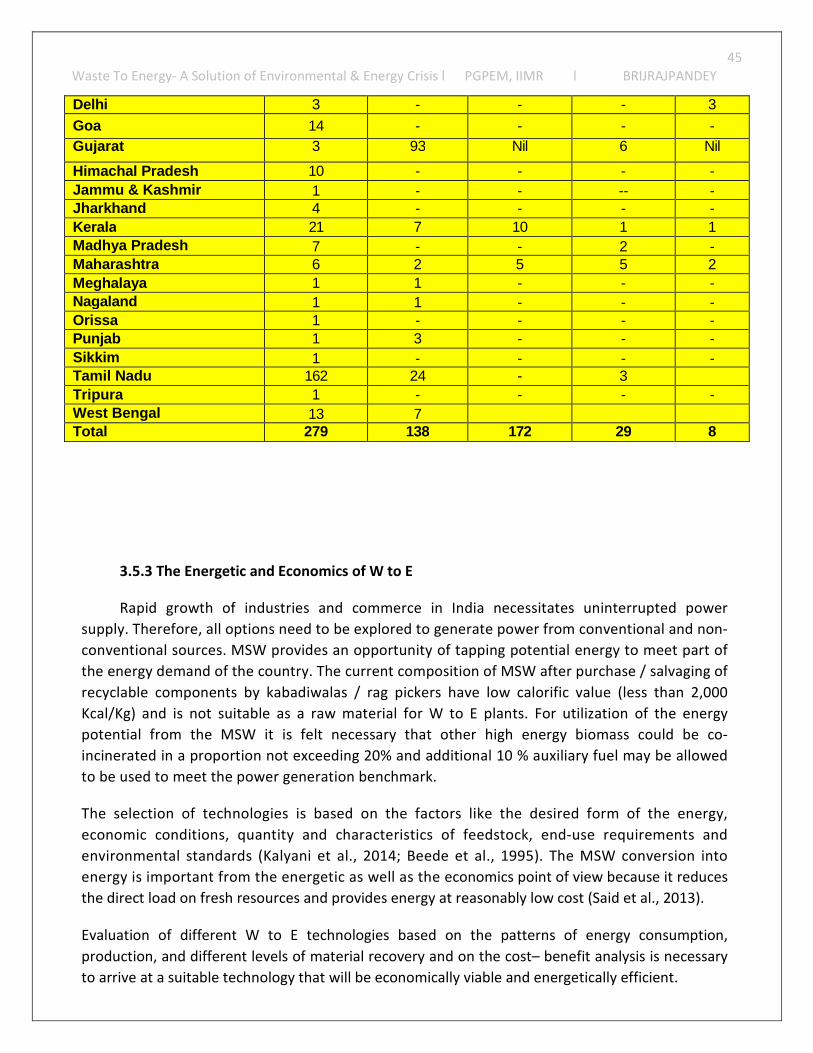
45
Waste To Energy- A Solution of Environmental & Energy Crisis l PGPEM, IIMR l BRIJRAJPANDEY
Delhi 3 - - - 3
Goa 14 - - - -
Gujarat 3 93 Nil 6 Nil
Himachal Pradesh 10 - - - -
Jammu & Kashmir 1 - - -- -Jharkhand 4 - - - -
Kerala 21 7 10 1 1
Madhya Pradesh 7 - - 2 -Maharashtra 6 2 5 5 2
Meghalaya 1 1 - - -
Nagaland 1 1 - - -Orissa 1 - - - -Punjab 1 3 - - -
Sikkim 1 - - - -Tamil Nadu 162 24 - 3
Tripura 1 - - - -
West Bengal 13 7Total 279 138 172 29 8
3.5.3 The Energetic and Economics of W to E
Rapid growth of industries and commerce in India necessitates uninterrupted power
supply. Therefore, all options need to be explored to generate power from conventional and non-
conventional sources. MSW provides an opportunity of tapping potential energy to meet part of
the energy demand of the country. The current composition of MSW after purchase / salvaging of
recyclable components by kabadiwalas / rag pickers have low calorific value (less than 2,000
Kcal/Kg) and is not suitable as a raw material for W to E plants. For utilization of the energy
potential from the MSW it is felt necessary that other high energy biomass could be co-
incinerated in a proportion not exceeding 20% and additional 10 % auxiliary fuel may be allowed
to be used to meet the power generation benchmark.
The selection of technologies is based on the factors like the desired form of the energy,
economic conditions, quantity and characteristics of feedstock, end-use requirements and
environmental standards (Kalyani et al., 2014; Beede et al., 1995). The MSW conversion into
energy is important from the energetic as well as the economics point of view because it reduces
the direct load on fresh resources and provides energy at reasonably low cost (Said et al., 2013).
Evaluation of different W to E technologies based on the patterns of energy consumption,
production, and different levels of material recovery and on the cost– benefit analysis is necessary
to arrive at a suitable technology that will be economically viable and energetically efficient.
46
Waste To Energy- A Solution of Environmental & Energy Crisis l PGPEM, IIMR l BRIJRAJPANDEY
4. CONCLUSIONS AND RECOMMENDATIONS
As presented in this report, India face significant solid waste management challenges. Thesechallenges present numerous opportunities to improve methods in waste collection, transport, anddisposal. Given that solid waste management directly affects public health, land use, and theenvironment, stringent waste management regulations need to be formulated, enforced, andmonitored.
Although the Indian economy has been rapidly developing over the last decade or so, it stilllacks sanitary landfills. Similar to other developing countries, the majority of MSW disposal takesplace in open dumping grounds. These dumping grounds do not have mechanisms for landfill gascapture or leachate collection, thus contributing to both increased greenhouse gas emissions as wellas environmental pollution. The average waste generated in urban areas is 0.53 kg/person/day,which is very low compared to developed countries. However, it is estimated that the amount ofMSW generated will increase by 1-1.33% annually. India is also similar to other developing countriesin terms of its general waste characteristics: it has a high fraction of organic matter and inertmaterials and moisture content between 30-60%.
Following the creation of the Municipal Solid Wastes (Management and Handling) Rules,2000 by the central government, the Municipal Corporation of Indian states has adopted a numberof approaches to improve its waste management services. It has introduced source segregation inneighborhoods across the city and plans to establish composting, biomethanation, and RDF facilitiesto treat the MSW
The goal of this report is to highlight the suitability and benefits of introducing waste-to-energy technology in India, and uses it as a case study. As India’s GDP increases, the amount ofwaste generated will increase correspondingly. Many Cities in india has already run out of space forlandfills and faces strong NIMBY-ism in neighborhoods where landfills could have been constructed.
The Government of India recognizes incineration as a renewable technology and providesvarious funding mechanisms for development of WTE facilities. The Ministry of New and RenewableEnergy estimates that the potential power generation from MSW and industrial waste is 7,200 MWas of 2017.
Although there is strong environmental opposition to waste-to-energy, it offers a moreenvironmentally friendly option of waste disposal compared to landfilling. It reduces the amount ofgreenhouse gas emissions by diverting MSW from landfills and providing a renewable source ofpower. Emissions of pollutants from waste-to-energy, such as dioxins, are often much lower thannational limits. Finally, waste-to-energy prevents surface and groundwater and air pollution fromlandfills. From an economic standpoint, an integrated waste management approach that includeswaste-to-energy is also favorable for a city like Mumbai. The revenues generated from tipping fees,selling electricity, and greenhouse gas emission reduction credits make waste-toenergy a profitableventure.
In terms of future work, two important topics stand out: more research and more outreach.More research is needed to quantify various aspects of the solid waste management sector. Anumber of key statistics, such as the value of recyclables, the amount of environmental pollutionfrom waste sources, and the quantity of industrial waste generated, need to be computed to8
1
47
Waste To Energy- A Solution of Environmental & Energy Crisis l PGPEM, IIMR l BRIJRAJPANDEY
get a better understanding of this sector. In terms of research related to waste-toenergy, detailedanalysis of costs and available funding is needed. In addition, investigating the suitability andquantifying the costs and benefits of combined heat and power for Mumbai would be useful.Independent researchers or consultants should carry out such research in order to prevent anybiases that may otherwise occur.
Outreach to both environmental groups as well as the public at large is important in order todemonstrate the benefits of waste-to-energy technology to the community, city, and localgovernment. This can be achieved by educating the public through campaigns, workshops, town hallmeetings, university lectures, and so on. Creating an open dialogue with environmental groups is anessential first step to sharing information and collaborating to create better environmentalconditions.
Furthermore, it would be useful to develop a methodology for incineration to be included inthe approved CDM methodologies. This would make incineration a more viable option for localpromoters and encourage funding from foreign companies in developed countries.
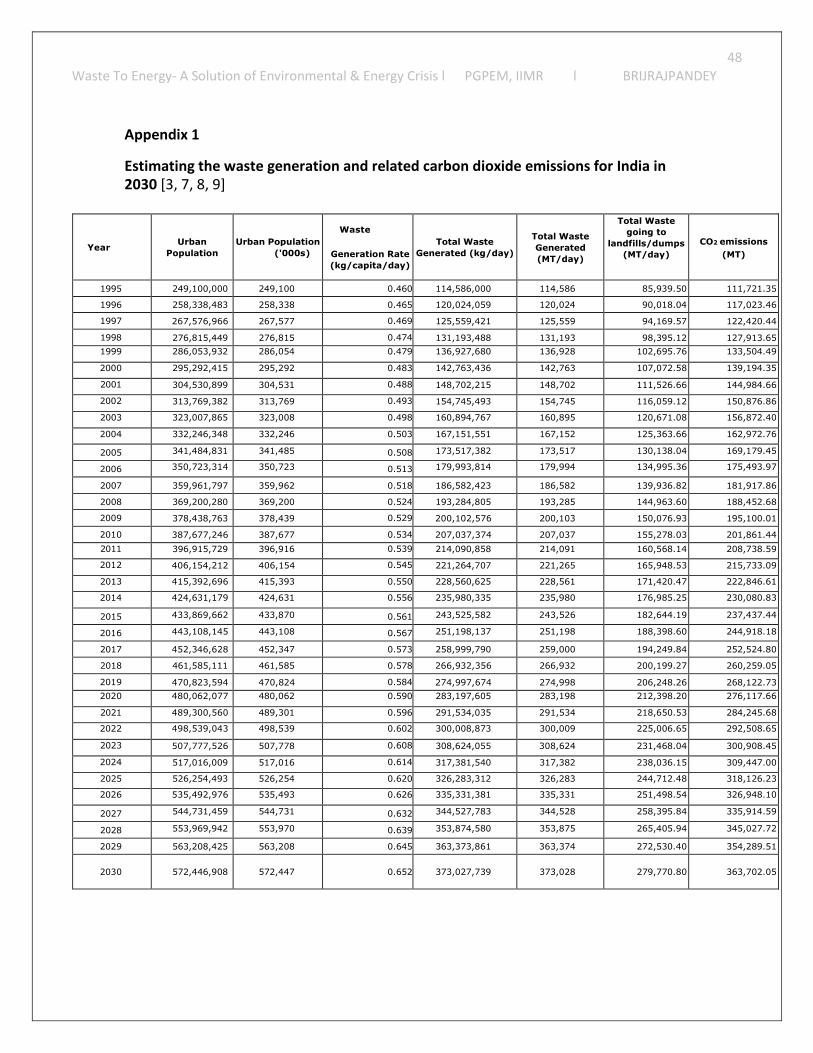
48
Waste To Energy- A Solution of Environmental & Energy Crisis l PGPEM, IIMR l BRIJRAJPANDEY
Appendix 1
Estimating the waste generation and related carbon dioxide emissions for India in2030 [3, 7, 8, 9]
YearUrban
Population
Urban Population
('000s)
Waste
Generation Rate
(kg/capita/day)
Total Waste
Generated (kg/day)
Total Waste
Generated
(MT/day)
Total Waste
going to
landfills/dumps
(MT/day)
CO2 emissions
(MT)
1995 249,100,000 249,100 0.460 114,586,000 114,586 85,939.50 111,721.35
1996 258,338,483 258,338 0.465 120,024,059 120,024 90,018.04 117,023.46
1997 267,576,966 267,577 0.469 125,559,421 125,559 94,169.57 122,420.44
1998 276,815,449 276,815 0.474 131,193,488 131,193 98,395.12 127,913.65
1999 286,053,932 286,054 0.479 136,927,680 136,928 102,695.76 133,504.49
2000 295,292,415 295,292 0.483 142,763,436 142,763 107,072.58 139,194.35
2001 304,530,899 304,531 0.488 148,702,215 148,702 111,526.66 144,984.66
2002 313,769,382 313,769 0.493 154,745,493 154,745 116,059.12 150,876.86
2003 323,007,865 323,008 0.498 160,894,767 160,895 120,671.08 156,872.40
2004 332,246,348 332,246 0.503 167,151,551 167,152 125,363.66 162,972.76
2005 341,484,831 341,485 0.508 173,517,382 173,517 130,138.04 169,179.45
2006 350,723,314 350,723 0.513 179,993,814 179,994 134,995.36 175,493.97
2007 359,961,797 359,962 0.518 186,582,423 186,582 139,936.82 181,917.86
2008 369,200,280 369,200 0.524 193,284,805 193,285 144,963.60 188,452.68
2009 378,438,763 378,439 0.529 200,102,576 200,103 150,076.93 195,100.01
2010 387,677,246 387,677 0.534 207,037,374 207,037 155,278.03 201,861.44
2011 396,915,729 396,916 0.539 214,090,858 214,091 160,568.14 208,738.59
2012 406,154,212 406,154 0.545 221,264,707 221,265 165,948.53 215,733.09
2013 415,392,696 415,393 0.550 228,560,625 228,561 171,420.47 222,846.61
2014 424,631,179 424,631 0.556 235,980,335 235,980 176,985.25 230,080.83
2015 433,869,662 433,870 0.561 243,525,582 243,526 182,644.19 237,437.44
2016 443,108,145 443,108 0.567 251,198,137 251,198 188,398.60 244,918.18
2017 452,346,628 452,347 0.573 258,999,790 259,000 194,249.84 252,524.80
2018 461,585,111 461,585 0.578 266,932,356 266,932 200,199.27 260,259.05
2019 470,823,594 470,824 0.584 274,997,674 274,998 206,248.26 268,122.73
2020 480,062,077 480,062 0.590 283,197,605 283,198 212,398.20 276,117.66
2021 489,300,560 489,301 0.596 291,534,035 291,534 218,650.53 284,245.68
2022 498,539,043 498,539 0.602 300,008,873 300,009 225,006.65 292,508.65
2023 507,777,526 507,778 0.608 308,624,055 308,624 231,468.04 300,908.45
2024 517,016,009 517,016 0.614 317,381,540 317,382 238,036.15 309,447.00
2025 526,254,493 526,254 0.620 326,283,312 326,283 244,712.48 318,126.23
2026 535,492,976 535,493 0.626 335,331,381 335,331 251,498.54 326,948.10
2027 544,731,459 544,731 0.632 344,527,783 344,528 258,395.84 335,914.59
2028 553,969,942 553,970 0.639 353,874,580 353,875 265,405.94 345,027.72
2029 563,208,425 563,208 0.645 363,373,861 363,374 272,530.40 354,289.51
2030 572,446,908 572,447 0.652 373,027,739 373,028 279,770.80 363,702.05
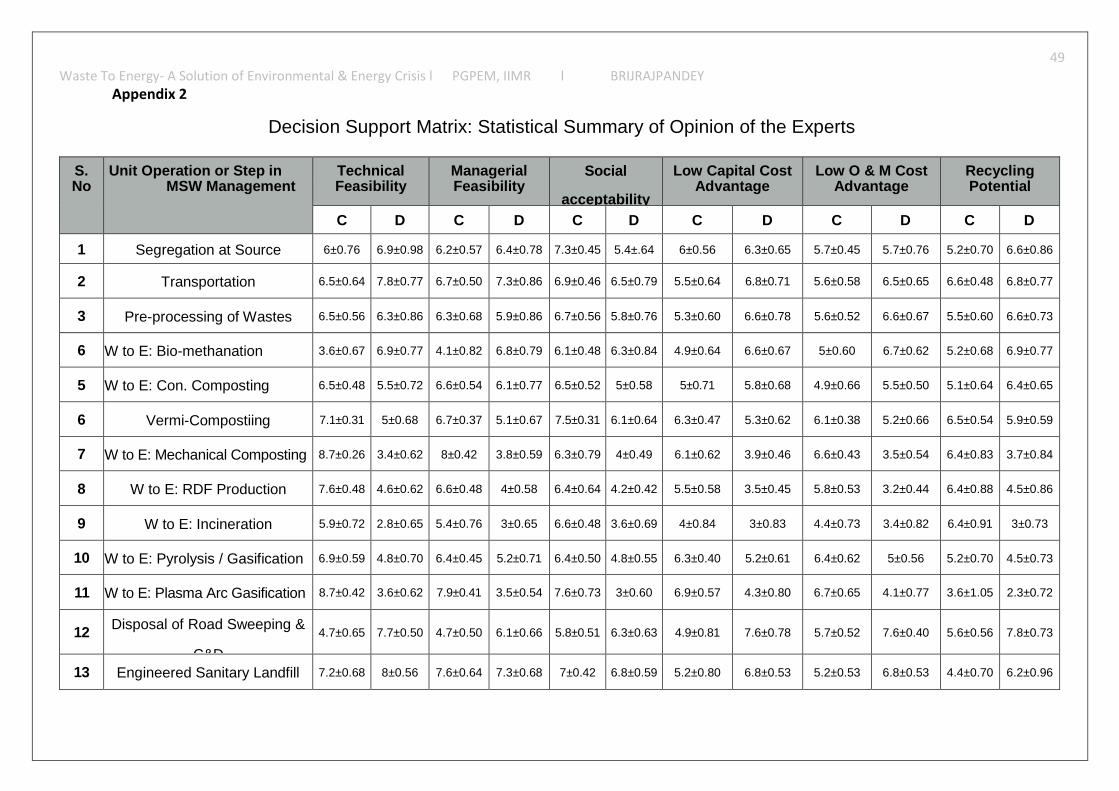
49
Waste To Energy- A Solution of Environmental & Energy Crisis l PGPEM, IIMR l BRIJRAJPANDEY
Appendix 2
Decision Support Matrix: Statistical Summary of Opinion of the Experts
S.No
Unit Operation or Step inMSW Management
TechnicalFeasibility
ManagerialFeasibility
Social
acceptability
Low Capital CostAdvantage
Low O & M CostAdvantage
RecyclingPotential
C D C D C D C D C D C D
1 Segregation at Source 6±0.76 6.9±0.98 6.2±0.57 6.4±0.78 7.3±0.45 5.4±.64 6±0.56 6.3±0.65 5.7±0.45 5.7±0.76 5.2±0.70 6.6±0.86
2 Transportation 6.5±0.64 7.8±0.77 6.7±0.50 7.3±0.86 6.9±0.46 6.5±0.79 5.5±0.64 6.8±0.71 5.6±0.58 6.5±0.65 6.6±0.48 6.8±0.77
3 Pre-processing of Wastes 6.5±0.56 6.3±0.86 6.3±0.68 5.9±0.86 6.7±0.56 5.8±0.76 5.3±0.60 6.6±0.78 5.6±0.52 6.6±0.67 5.5±0.60 6.6±0.73
6 W to E: Bio-methanation 3.6±0.67 6.9±0.77 4.1±0.82 6.8±0.79 6.1±0.48 6.3±0.84 4.9±0.64 6.6±0.67 5±0.60 6.7±0.62 5.2±0.68 6.9±0.77
5 W to E: Con. Composting 6.5±0.48 5.5±0.72 6.6±0.54 6.1±0.77 6.5±0.52 5±0.58 5±0.71 5.8±0.68 4.9±0.66 5.5±0.50 5.1±0.64 6.4±0.65
6 Vermi-Compostiing 7.1±0.31 5±0.68 6.7±0.37 5.1±0.67 7.5±0.31 6.1±0.64 6.3±0.47 5.3±0.62 6.1±0.38 5.2±0.66 6.5±0.54 5.9±0.59
7 W to E: Mechanical Composting 8.7±0.26 3.4±0.62 8±0.42 3.8±0.59 6.3±0.79 4±0.49 6.1±0.62 3.9±0.46 6.6±0.43 3.5±0.54 6.4±0.83 3.7±0.84
8 W to E: RDF Production 7.6±0.48 4.6±0.62 6.6±0.48 4±0.58 6.4±0.64 4.2±0.42 5.5±0.58 3.5±0.45 5.8±0.53 3.2±0.44 6.4±0.88 4.5±0.86
9 W to E: Incineration 5.9±0.72 2.8±0.65 5.4±0.76 3±0.65 6.6±0.48 3.6±0.69 4±0.84 3±0.83 4.4±0.73 3.4±0.82 6.4±0.91 3±0.73
10 W to E: Pyrolysis / Gasification 6.9±0.59 4.8±0.70 6.4±0.45 5.2±0.71 6.4±0.50 4.8±0.55 6.3±0.40 5.2±0.61 6.4±0.62 5±0.56 5.2±0.70 4.5±0.73
11 W to E: Plasma Arc Gasification 8.7±0.42 3.6±0.62 7.9±0.41 3.5±0.54 7.6±0.73 3±0.60 6.9±0.57 4.3±0.80 6.7±0.65 4.1±0.77 3.6±1.05 2.3±0.72
12Disposal of Road Sweeping &
C&D
4.7±0.65 7.7±0.50 4.7±0.50 6.1±0.66 5.8±0.51 6.3±0.63 4.9±0.81 7.6±0.78 5.7±0.52 7.6±0.40 5.6±0.56 7.8±0.73
13 Engineered Sanitary Landfill 7.2±0.68 8±0.56 7.6±0.64 7.3±0.68 7±0.42 6.8±0.59 5.2±0.80 6.8±0.53 5.2±0.53 6.8±0.53 4.4±0.70 6.2±0.96
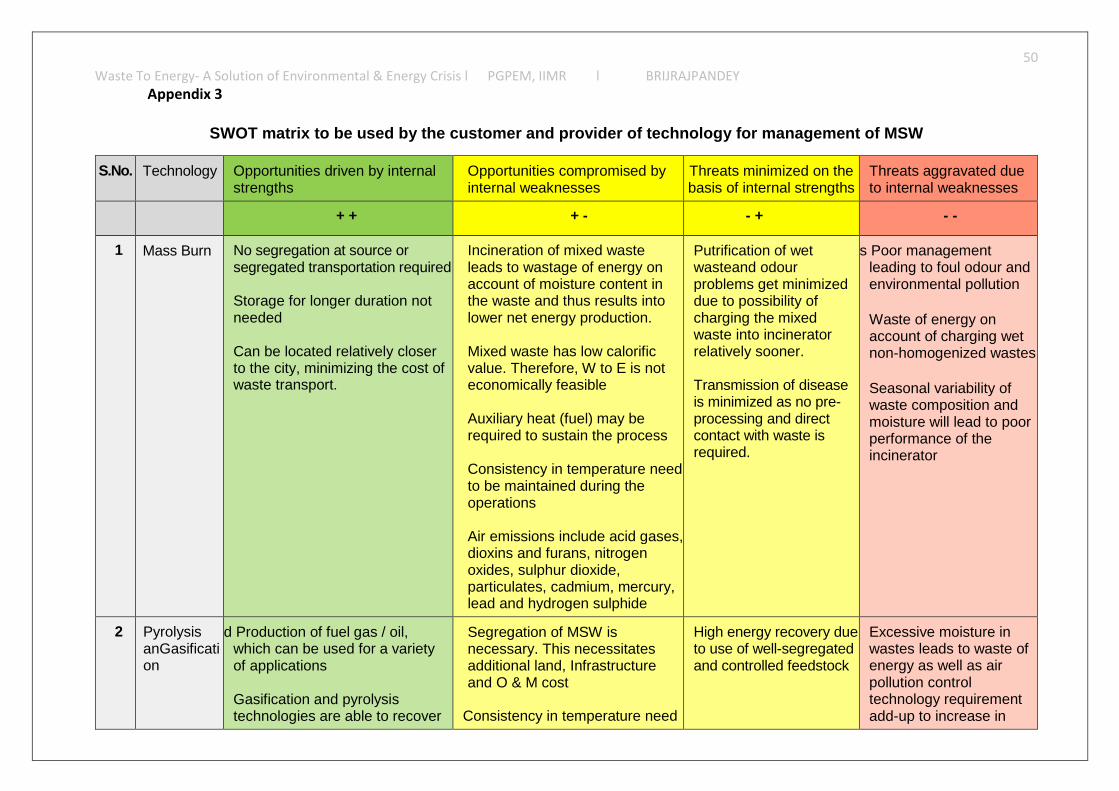
50
Waste To Energy- A Solution of Environmental & Energy Crisis l PGPEM, IIMR l BRIJRAJPANDEY
Appendix 3
SWOT matrix to be used by the customer and provider of technology for management of MSW
S.No. Technology Opportunities driven by internalstrengths
Opportunities compromised byinternal weaknesses
Threats minimized on thebasis of internal strengths
Threats aggravated dueto internal weaknesses
+ + + - - + - -
1 Mass Burn No segregation at source orsegregated transportation required
Storage for longer duration notneeded
Can be located relatively closerto the city, minimizing the cost ofwaste transport.
Incineration of mixed wasteleads to wastage of energy onaccount of moisture content inthe waste and thus results intolower net energy production.
Mixed waste has low calorificvalue. Therefore, W to E is noteconomically feasible
Auxiliary heat (fuel) may berequired to sustain the process
Consistency in temperature needto be maintained during theoperations
Air emissions include acid gases,dioxins and furans, nitrogenoxides, sulphur dioxide,particulates, cadmium, mercury,lead and hydrogen sulphide
Putrification of wetwasteand odourproblems get minimizeddue to possibility ofcharging the mixedwaste into incineratorrelatively sooner.
Transmission of diseaseis minimized as no pre-processing and directcontact with waste isrequired.
s Poor managementleading to foul odour andenvironmental pollution
Waste of energy onaccount of charging wetnon-homogenized wastes
Seasonal variability ofwaste composition andmoisture will lead to poorperformance of theincinerator
2 PyrolysisanGasification
d Production of fuel gas / oil,which can be used for a varietyof applications
Gasification and pyrolysistechnologies are able to recover
Segregation of MSW isnecessary. This necessitatesadditional land, Infrastructureand O & M cost
Consistency in temperature need
High energy recovery dueto use of well-segregatedand controlled feedstock
Excessive moisture inwastes leads to waste ofenergy as well as airpollution controltechnology requirementadd-up to increase in
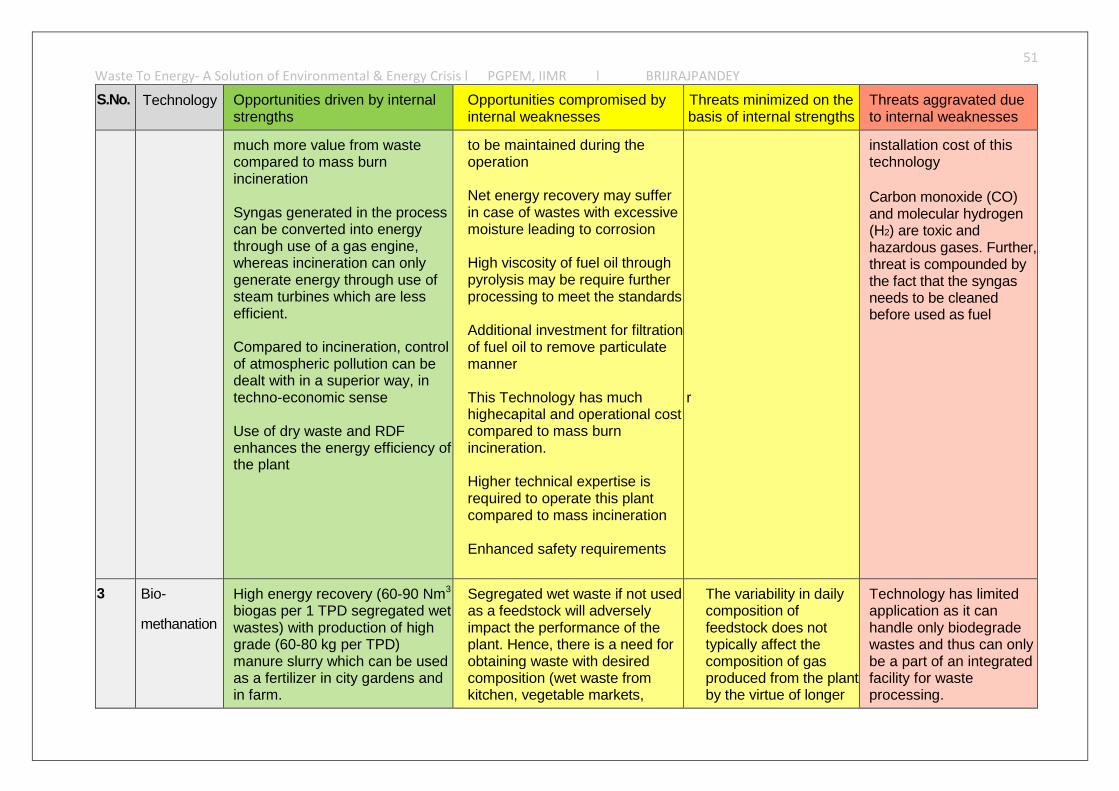
51
Waste To Energy- A Solution of Environmental & Energy Crisis l PGPEM, IIMR l BRIJRAJPANDEY
S.No. Technology Opportunities driven by internalstrengths
Opportunities compromised byinternal weaknesses
Threats minimized on thebasis of internal strengths
Threats aggravated dueto internal weaknesses
much more value from wastecompared to mass burnincineration
Syngas generated in the processcan be converted into energythrough use of a gas engine,whereas incineration can onlygenerate energy through use ofsteam turbines which are lessefficient.
Compared to incineration, controlof atmospheric pollution can bedealt with in a superior way, intechno-economic sense
Use of dry waste and RDFenhances the energy efficiency ofthe plant
to be maintained during theoperation
Net energy recovery may sufferin case of wastes with excessivemoisture leading to corrosion
High viscosity of fuel oil throughpyrolysis may be require furtherprocessing to meet the standards
Additional investment for filtrationof fuel oil to remove particulatemanner
This Technology has muchhighecapital and operational costcompared to mass burnincineration.
Higher technical expertise isrequired to operate this plantcompared to mass incineration
Enhanced safety requirements
r
installation cost of thistechnology
Carbon monoxide (CO)and molecular hydrogen(H2) are toxic andhazardous gases. Further,threat is compounded bythe fact that the syngasneeds to be cleanedbefore used as fuel
3 Bio-
methanation
High energy recovery (60-90 Nm3
biogas per 1 TPD segregated wetwastes) with production of highgrade (60-80 kg per TPD)manure slurry which can be usedas a fertilizer in city gardens andin farm.
Segregated wet waste if not usedas a feedstock will adverselyimpact the performance of theplant. Hence, there is a need forobtaining waste with desiredcomposition (wet waste fromkitchen, vegetable markets,
The variability in dailycomposition offeedstock does nottypically affect thecomposition of gasproduced from the plantby the virtue of longer
Technology has limitedapplication as it canhandle only biodegradewastes and thus can onlybe a part of an integratedfacility for wasteprocessing.
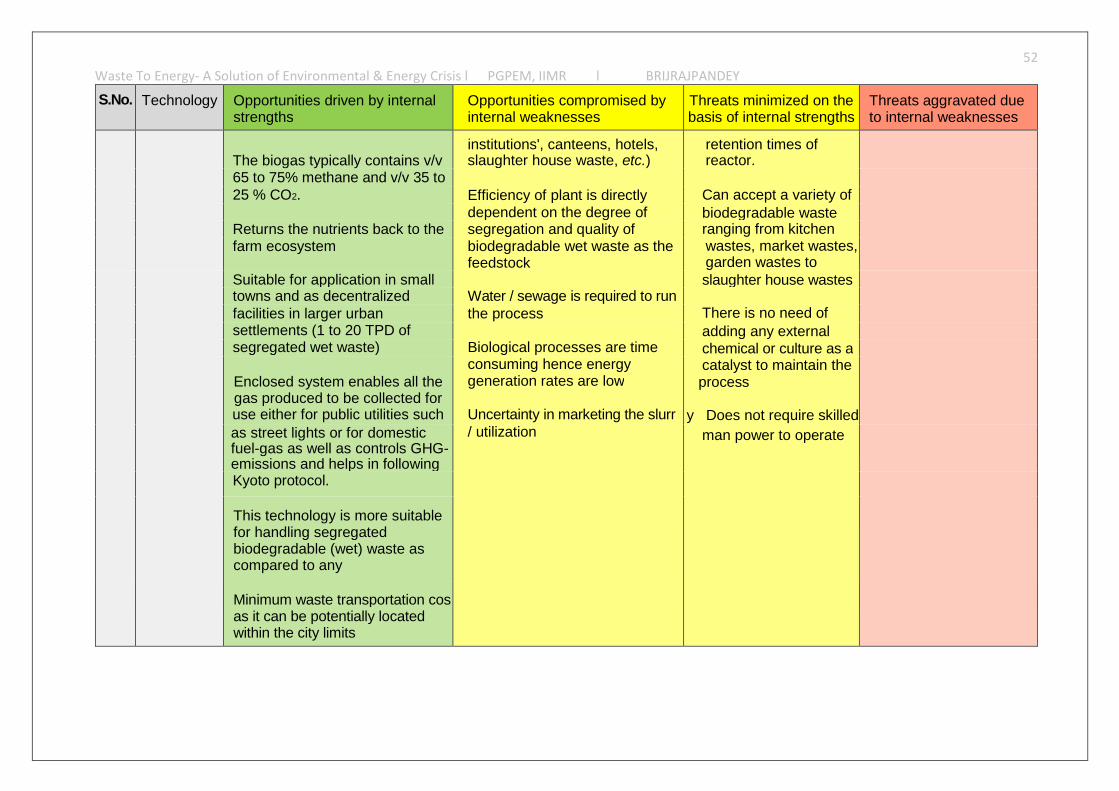
52
Waste To Energy- A Solution of Environmental & Energy Crisis l PGPEM, IIMR l BRIJRAJPANDEY
S.No. Technology Opportunities driven by internalstrengths
Opportunities compromised byinternal weaknesses
Threats minimized on thebasis of internal strengths
Threats aggravated dueto internal weaknesses
The biogas typically contains v/vinstitutions', canteens, hotels,slaughter house waste, etc.)
retention times ofreactor.
65 to 75% methane and v/v 35 to25 % CO2. Efficiency of plant is directly Can accept a variety of
dependent on the degree of biodegradable wasteReturns the nutrients back to the segregation and quality of ranging from kitchenfarm ecosystem biodegradable wet waste as the
feedstockwastes, market wastes,garden wastes to
Suitable for application in small slaughter house wastestowns and as decentralized Water / sewage is required to runfacilities in larger urban the process There is no need ofsettlements (1 to 20 TPD of adding any externalsegregated wet waste) Biological processes are time chemical or culture as a
consuming hence energy catalyst to maintain theEnclosed system enables all thegas produced to be collected foruse either for public utilities such
generation rates are low
Uncertainty in marketing the slurr
process
y Does not require skilledas street lights or for domesticfuel-gas as well as controls GHG-emissions and helps in following
/ utilization man power to operate
Kyoto protocol.
This technology is more suitablefor handling segregatedbiodegradable (wet) waste ascompared to any
Minimum waste transportation cosas it can be potentially locatedwithin the city limits
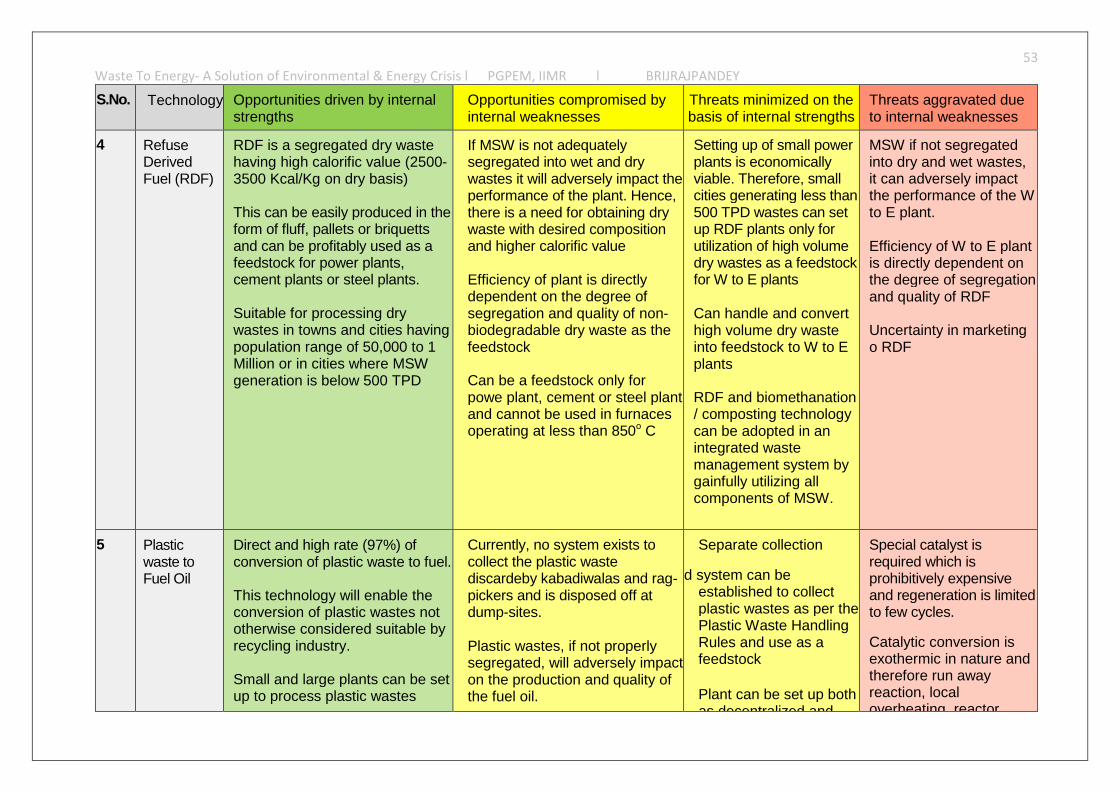
53
Waste To Energy- A Solution of Environmental & Energy Crisis l PGPEM, IIMR l BRIJRAJPANDEY
S.No. Technology Opportunities driven by internalstrengths
Opportunities compromised byinternal weaknesses
Threats minimized on thebasis of internal strengths
Threats aggravated dueto internal weaknesses
4 RefuseDerivedFuel (RDF)
RDF is a segregated dry wastehaving high calorific value (2500-3500 Kcal/Kg on dry basis)
This can be easily produced in theform of fluff, pallets or briquettsand can be profitably used as afeedstock for power plants,cement plants or steel plants.
Suitable for processing drywastes in towns and cities havingpopulation range of 50,000 to 1Million or in cities where MSWgeneration is below 500 TPD
If MSW is not adequatelysegregated into wet and drywastes it will adversely impact theperformance of the plant. Hence,there is a need for obtaining drywaste with desired compositionand higher calorific value
Efficiency of plant is directlydependent on the degree ofsegregation and quality of non-biodegradable dry waste as thefeedstock
Can be a feedstock only forpowe plant, cement or steel plantand cannot be used in furnacesoperating at less than 850o C
Setting up of small powerplants is economicallyviable. Therefore, smallcities generating less than500 TPD wastes can setup RDF plants only forutilization of high volumedry wastes as a feedstockfor W to E plants
Can handle and converthigh volume dry wasteinto feedstock to W to Eplants
RDF and biomethanation/ composting technologycan be adopted in anintegrated wastemanagement system bygainfully utilizing allcomponents of MSW.
MSW if not segregatedinto dry and wet wastes,it can adversely impactthe performance of the Wto E plant.
Efficiency of W to E plantis directly dependent onthe degree of segregationand quality of RDF
Uncertainty in marketingo RDF
5 Plasticwaste toFuel Oil
Direct and high rate (97%) ofconversion of plastic waste to fuel.
This technology will enable theconversion of plastic wastes nototherwise considered suitable byrecycling industry.
Small and large plants can be setup to process plastic wastes
Currently, no system exists tocollect the plastic wastediscardeby kabadiwalas and rag-pickers and is disposed off atdump-sites.
Plastic wastes, if not properlysegregated, will adversely impacton the production and quality ofthe fuel oil.
Separate collection
d system can beestablished to collectplastic wastes as per thePlastic Waste HandlingRules and use as afeedstock
Plant can be set up bothas decentralized and
Special catalyst isrequired which isprohibitively expensiveand regeneration is limitedto few cycles.
Catalytic conversion isexothermic in nature andtherefore run awayreaction, localoverheating, reactor
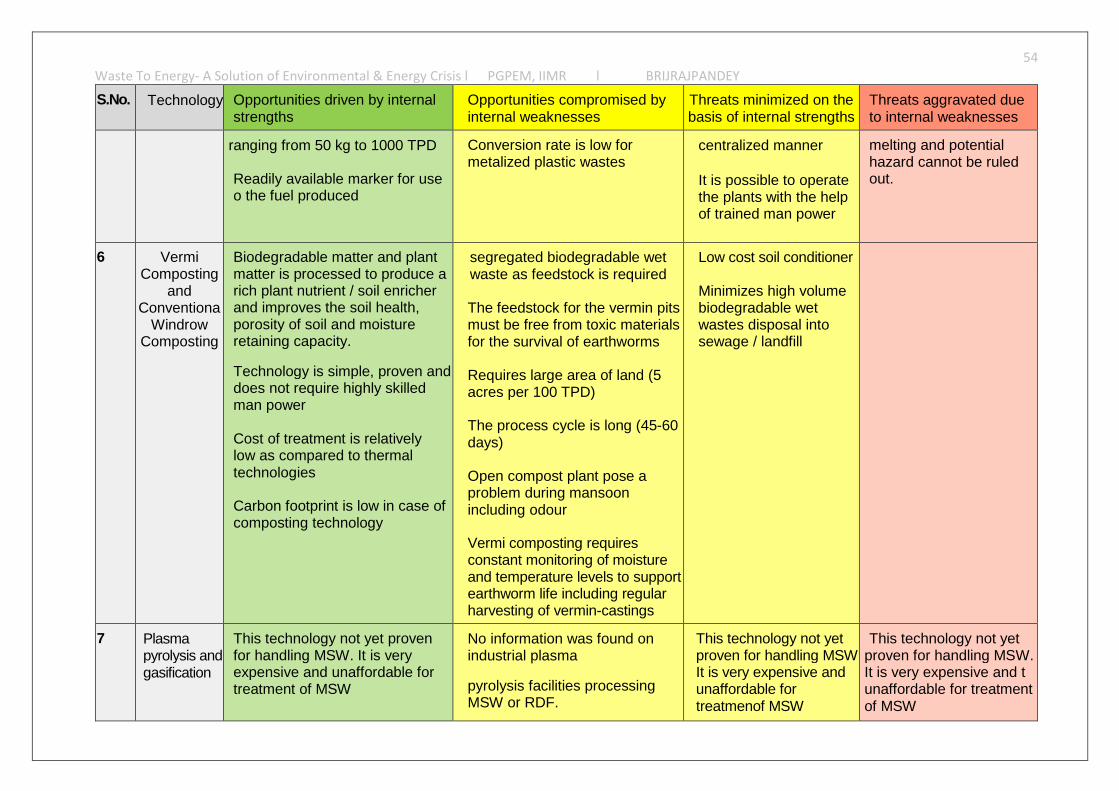
54
Waste To Energy- A Solution of Environmental & Energy Crisis l PGPEM, IIMR l BRIJRAJPANDEY
S.No. Technology Opportunities driven by internalstrengths
Opportunities compromised byinternal weaknesses
Threats minimized on thebasis of internal strengths
Threats aggravated dueto internal weaknesses
ranging from 50 kg to 1000 TPD
Readily available marker for useo the fuel produced
Conversion rate is low formetalized plastic wastes
centralized manner
It is possible to operatethe plants with the helpof trained man power
melting and potentialhazard cannot be ruledout.
6 VermiComposting
andConventiona
WindrowComposting
Biodegradable matter and plantmatter is processed to produce arich plant nutrient / soil enricherand improves the soil health,porosity of soil and moistureretaining capacity.
Technology is simple, proven anddoes not require highly skilledman power
Cost of treatment is relativelylow as compared to thermaltechnologies
Carbon footprint is low in case ofcomposting technology
segregated biodegradable wetwaste as feedstock is required
The feedstock for the vermin pitsmust be free from toxic materialsfor the survival of earthworms
Requires large area of land (5acres per 100 TPD)
The process cycle is long (45-60days)
Open compost plant pose aproblem during mansoonincluding odour
Vermi composting requiresconstant monitoring of moistureand temperature levels to supportearthworm life including regularharvesting of vermin-castings
Low cost soil conditioner
Minimizes high volumebiodegradable wetwastes disposal intosewage / landfill
7 Plasmapyrolysis andgasification
This technology not yet provenfor handling MSW. It is veryexpensive and unaffordable fortreatment of MSW
No information was found onindustrial plasma
pyrolysis facilities processingMSW or RDF.
This technology not yetproven for handling MSWIt is very expensive andunaffordable fortreatmenof MSW
This technology not yetproven for handling MSW.It is very expensive and tunaffordable for treatmentof MSW
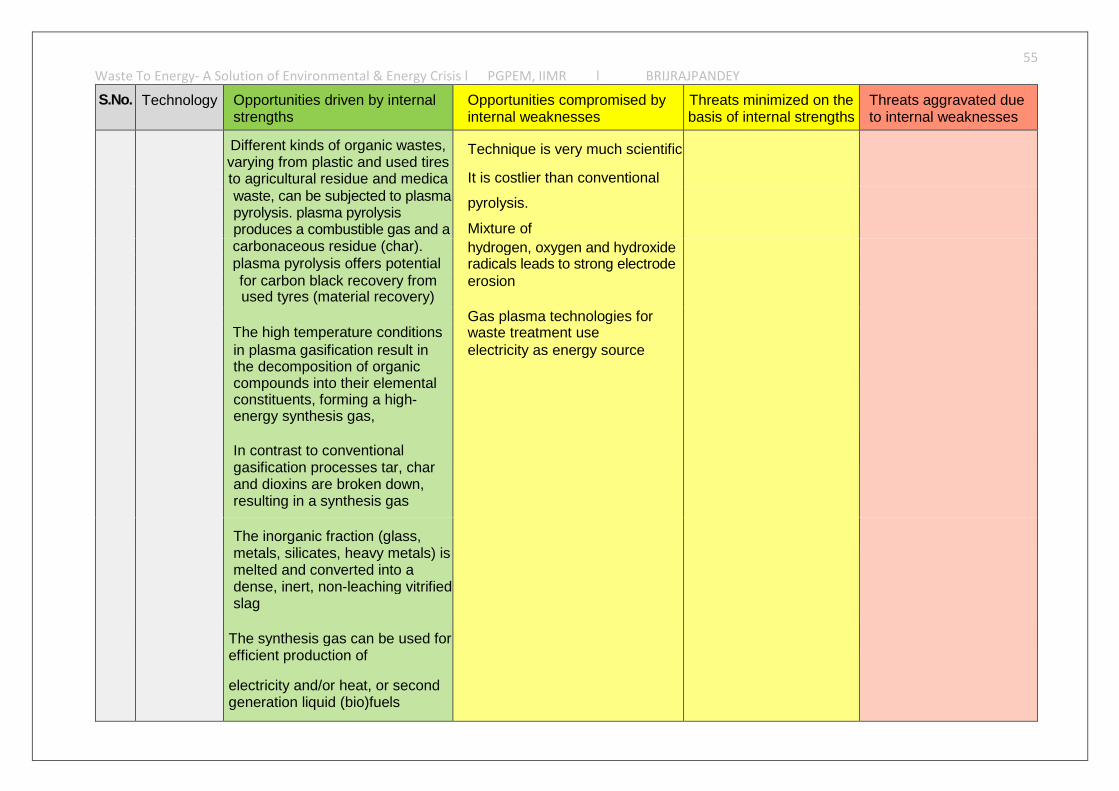
55
Waste To Energy- A Solution of Environmental & Energy Crisis l PGPEM, IIMR l BRIJRAJPANDEY
S.No. Technology Opportunities driven by internalstrengths
Opportunities compromised byinternal weaknesses
Threats minimized on thebasis of internal strengths
Threats aggravated dueto internal weaknesses
Different kinds of organic wastes,varying from plastic and used tiresto agricultural residue and medica
Technique is very much scientific
It is costlier than conventionalwaste, can be subjected to plasmapyrolysis. plasma pyrolysisproduces a combustible gas and a
pyrolysis.
Mixture ofcarbonaceous residue (char). hydrogen, oxygen and hydroxideplasma pyrolysis offers potential radicals leads to strong electrodefor carbon black recovery fromused tyres (material recovery)
erosion
Gas plasma technologies forThe high temperature conditions waste treatment usein plasma gasification result inthe decomposition of organiccompounds into their elementalconstituents, forming a high-energy synthesis gas,
electricity as energy source
In contrast to conventionalgasification processes tar, charand dioxins are broken down,resulting in a synthesis gas
The inorganic fraction (glass,metals, silicates, heavy metals) ismelted and converted into adense, inert, non-leaching vitrifiedslag
The synthesis gas can be used forefficient production of
electricity and/or heat, or secondgeneration liquid (bio)fuels
56
Waste To Energy- A Solution of Environmental & Energy Crisis l PGPEM, IIMR lBRIJRAJPANDEY
Appendix 4
Recommendations on Public Private Partnerships (PPP) in Waste to EnergyProjects (Report of Task Force on Waste to Energy)
Following are the recommendations on Public Private Partnerships (PPP) in Waste to
Energy projects.
1. The ULBs lack the financial and institutional capacity necessary for
integrated management of municipal solid waste which requires investments,
especially for Waste to Energy projects. In such projects, it is appropriate to
transfer the commercial risks to the private sector in order to ensure an efficient
system for collection, transportation and processing of waste for generation of
electricity. The Task Force, therefore, recommends that integrated Waste to
Energy projects may be set up by the ULBs on public private partnership (PPP)
basis.
2. The Waste to Energy projects should be structured and awarded on the
basis of standard bidding documents. The Model Request for Qualification
(RFQ) and Model Request for Proposal (RFP) published by the Ministry of
Finance may be used for conducting the bidding process for award of such
projects. The Feasibility study for these projects may be undertaken through
consultants selected on the basis of the Model RFP for selection of Technical
Consultants, as published by the Finance Ministry.
3. The projects should be based on a Model Concession Agreement (MCA)
for Waste to Energy projects. Planning Commission has already commenced
the drafting of the MCA. The Committee recommends that the same may be
evolved in consultation with the principal stakeholders and finalised within three
months.
57
Waste To Energy- A Solution of Environmental & Energy Crisis l PGPEM, IIMR lBRIJRAJPANDEY
4. The Committee noted that in the Budget Speech for 2013-14, it was
proposed to support municipalities that will implement Waste to Energy projects
through different instruments such as viability gap funding, repayable grant and low
cost capital. The Committee recommends that as a special dispensation, the Central
Government may grant Viability Gap Funding (VGF) of up to 40 % (forty per cent) for
Waste to Energy projects. Alternatively, the Central Government may give a VGF
Grant of 20% as per the existing scheme and also provide an interest-free loan
equal to 30% of the Project cost.
5. The State Governments may also provide an additional 20% by way of
VGF or interest free loan with a moratorium of five years from commencement of
commercial operation and a repayment period of 10 years. However, the total grant
and soft loans from the Central Government and State Governments should not
exceed 60% of the project cost with the remaining 40% to be financed by the PPP
Concessionaire.
6. The State Electricity Regulatory Commissions (SERCs) should be
approached to specify electricity tariffs for Waste to Energy power stations at par
with the tariffs currently payable for solar energy.
58
Waste To Energy- A Solution of Environmental & Energy Crisis l PGPEM, IIMR lBRIJRAJPANDEY
References
1.Singhal, S. and S. Pandey. 2001. Solid waste management in India: status and future directions.
TERI Information Monitor on Environmental Science
2.World Bank. 2005. What a Waste – Solid Waste Management in Asia. Urban Development Sector
Unit. East Asia and Pacific Region
3.Electricity Authority. Monthly Review of Power Sector (Executive Summary). November 2014. On-
line. Available at http://www.cea.nic.in/reports/monthly/executive_rep/nov14.pdf
4.Ministry of Urban Development. 2000. Government of India, Solid Waste Management Manual.
5.Asnani, P.U. 2006. Solid Waste Management (Chapter 8). India Infrastructure Report. pp. 160-
189
6.Office of the Registrar General, India. 2005. Census of India 2001, Rural - Urban Distribution of
Population. On-line. Available at http://www.censusindia.net/results/rudist.html, accessed
January 29, 2007
7.Occupational and Environmental Health Issues of Solid Waste Management – Special Emphasis on
Middle- and Lower-Income Countries. World Bank - Urban Sector Board
8.Nema, A.K., 2004. Collection and transport of municipal solid waste. In:Training Program on Solid
Waste Management. springer, Delhi, India.
9.Asnani, P.U. 2006. Solid Waste Management (Chapter 8). India Infrastructure Report. pp. 160- 189
(2)
10.Gupta, S., K. Mohan, R. Prasad, S. Gupta, and A. Kansal. 1998. Solid waste management in India:
options and opportunities. Resources, Conservation and Recycling 24:137-154
11.United Nations Economic and Social Commission for Asia and the Pacific and Asian Development
Bank (137)
12.Loikala, J., S. Hulkkonen, S. Itkyal, A. Kaushik, S. Keränen, R. Nisula, U. Roiha, H. Saren, et al. 2006.
Opportunities for Finnish Environmental Technology in India. Sitra Reports 63. 172 pp
59
Waste To Energy- A Solution of Environmental & Energy Crisis l PGPEM, IIMR lBRIJRAJPANDEY
13. Themelis, N. 2006-07. Director. Earth Engineering Center, Columbia University. Personal
communication.
14.Central Electricity Authority. 2014. Monthly Review of Power Sector (Executive Summary).
November 2014. On-line. Available at
http://www.cea.nic.in/reports/monthly/executive_rep/nov14.pdf
15.Mody, V. 2005. Improving Electricity Services in Rural India. Working Papers Series Center on
Globalization and Sustainable Development. Columbia University. Working Paper No. 30.
December 2005.
16.Wolak, F. 2004. Reforming the Indian Electricity Supply Industry (Draft). pp. 46. On-line. Available
at http://scid.stanford.edu/events/India2004/Wolak.pdf,
17.Rajya Sabha. Starred Question No.157 on July 30, 2003. State-wise Average Tariff for Sale of
Electricity in India (2001-02). On-line. Available on www.indiastat.com,
18.http://planningcommission.nic.in/ Planning commission report
http://planningcommission.nic.in/reports/genrep/arep_seb11_12.pdf. accessed on 28 Dec 2014
19.Loikala, J., S. Hulkkonen, S. Itkyal, A. Kaushik, S. Keränen, R. Nisula, U. Roiha, H. Saren, et al. 2006.
Opportunities for Finnish Environmental Technology in India. Sitra Reports 63. 172 pp.(55)
20.http://www.business-standard.com/article/economy-policy/india-achieves-12-95-of-renewable-
energy-potential-114060501140_1.html.
21.Ministry of Environment and Forests. Government of India. 2000. Municipal Solid Wastes
(Management and Handling) Rules, 2000.
22.Tennesse Solid Waste Education Project. 2007. Integrated Solid Waste Management. On-line.
Available at http://www-tnswep.ra.utk.edu
23.World Bank. 2014. Glossary. On-line. Available at
http://youthink.worldbank.org/glossary.php#rrr, accessed Dec 5, 2014.(147)
60
Waste To Energy- A Solution of Environmental & Energy Crisis l PGPEM, IIMR lBRIJRAJPANDEY
24.Ministry of New and Renewable Energy. Government of India. National Master Plan for
Development of Waste-to-Energy in India.(71)
25.Ministry of New and Renewable Energy. Government of India. Annual Reports
26.CPCB, Annual Report, 2013
27.Lemieux, P., C. Lutes, and D. Santoianni. 2004. Emissions of organic air toxics from open
burning: a comprehensive review. Progress in Energy and Combustion Science 30:1-32.
28.Loikala, J., S. Hulkkonen, S. Itkyal, A. Kaushik, S. Keränen, R. Nisula, U. Roiha, H. Saren, et al. 2006.
Opportunities for Finnish Environmental Technology in India. Sitra Reports 63. 172 pp.
29.Ministry of Environment and Forests. Government of India. 2007. Annual Report 2006-07. Online.
Available at http://envfor.nic.in/,
30.Ministry of New and Renewable Energy. Government of India. National Master Plan for
Development of Waste-to-Energy in India. On-line. Available at
http://www.indiawteplan.com/index.htm,
31.Ministry of New and Renewable Energy. Government of India. Major Programmes of Renewable
Energy Sources. On-line. Available at http://mnes.nic.in/frame.htm?majorprog.htm,