waste rock and lean ore geochemical...
TRANSCRIPT

Waste Rock and Lean Ore Geochemical Characterization Plan
NorthMet Project, Minnesota
Prepared for
PolyMet Mining Corporation
Prepared by
May 2006

Waste Rock and Lean Ore Geochemical Characterization Plan
NorthMet Project, Minnesota
Polymet Mining Corporation
SRK Consulting (Canada) Inc.
Suite 800, 1066 West Hastings Street Vancouver, B.C. V6E 3X2
Tel: 604.681.4196 Fax: 604.687.5532
E-mail: [email protected] Web site: www.srk.com
SRK Project Number 1UP005.001
May 2006
Author
Stephen Day, P.Geo. Principal Geochemist

SRK Consulting Waste Rock and Lean Ore Geochemical Characterization Plan Page i
SJD/sdc 1UP005.001_sample_selection_20060504.SJD.rev02.doc, May. 5, 06, 1:33 PM May 2006
Table of Contents 1 Introduction .................................................................................................................. 1
1.1 Background ......................................................................................................................... 1 1.2 Geological Setting ............................................................................................................... 1 1.3 Agency Consultation and Design Process .......................................................................... 1 1.4 Organization of this Document............................................................................................ 2 1.5 Acknowledgements ............................................................................................................. 3 1.6 Analytical Laboratues.......................................................................................................... 3
2 Characterization Design .............................................................................................. 4 2.1 Background ......................................................................................................................... 4 2.2 Design Basis ....................................................................................................................... 4 2.3 Sampling Matrix for Waste Rock......................................................................................... 5 2.4 Characterization of Lean Ore .............................................................................................. 7
3 Sampling....................................................................................................................... 8 3.1 Methods .............................................................................................................................. 8
3.1.1 Sample Selection for Non-Reactive and Reactive Waste Types ............................................8 3.1.2 Core Recovery ........................................................................................................................9
3.2 Sample List ......................................................................................................................... 9
4 Sample Preparation and Analysis ............................................................................ 13 4.1 Solids Characterization ..................................................................................................... 13
4.1.1 Sample Preparation...............................................................................................................13 4.1.2 Chemical Analysis .................................................................................................................13 4.1.3 Optical Analysis.....................................................................................................................14 4.1.4 Sub-Optical Analysis .............................................................................................................14
4.2 Kinetic Test Methods......................................................................................................... 14 4.2.1 Humidity Cell .........................................................................................................................14 4.2.2 MDNR Reactor ......................................................................................................................14 4.2.3 Leachate Analysis .................................................................................................................14
4.3 Quality Assurance/Quality Control .................................................................................... 16
5 Analytical Results for Samples Selected ................................................................. 17
6 Implementation Schedule.......................................................................................... 19
7 Use of Data for Water Quality Predictions ............................................................... 20 7.1 Purpose of this Section ..................................................................................................... 20 7.2 General Context to Water Quality Predictions in Mine Planning....................................... 20 7.3 Approach to Developing Water Quality Predictions .......................................................... 22
7.3.1 Theoretical Approach ............................................................................................................22 7.3.2 Site Comparisons ..................................................................................................................23 7.3.3 The Empirical Method ...........................................................................................................24 7.3.4 Implementation for the NorthMet Project ..............................................................................31
7.4 Conclusions....................................................................................................................... 31
8 References.................................................................................................................. 32

SRK Consulting Waste Rock and Lean Ore Geochemical Characterization Plan Page ii
SJD/sdc 1UP005.001_sample_selection_20060504.SJD.rev02.doc, May. 5, 06, 1:33 PM May 2006
List of Tables
Table 1: Matrix for Sample Selection in Waste Rock Types.......................................................... 6 Table 2: List of Non-Reactive and Reactive Samples Selected .................................................. 10 Table 3: List of Lean Ore Samples Selected. .............................................................................. 12 Table 4: List of Parameters for Humidity Cell Leachate Analyses. Concentrations in mg/L except where indicated......................................................................................... 16 Table 5: Comparison of Weighted Sample Characteristics Used for Sample Selection with Analytical Results for Interval Composites ............................................................. 18 Table 6: Example of Empirical (Scale-up) Calculation of Waste Rock Seepage Chemistry for pH Neutral Drainage Using Humidity Cell Data (from Red Chris Development Co. 2004) ...................................................................... 28
List of Figures
Figure 1: Flow of Information for Water Quality Predictions During Mine Planning ...................... 21 Figure 2: Strong Correlation between Aluminum Concentrations and pH for Porphyry Copper Deposits in Western Canada (Red Chris Development Co. 2004) ................... 23 Figure 3: Correlation of Sulfur Content and Sulfate Release for MDNR ASTM Procedure Humidity Cells. ............................................................................................. 25 Figure 4: Particle Surface Area as a Function of Particle Size for Cubic Particles ....................... 26 Figure 5: Example of Relationship Between Nickel Concentrations and pH (Red Chris Development Company 2004)..................................................................... 30
List of Appendices
Appendix A: Parameter Lists and Detection Limits for Analysis of Solids Appendix B: Options and Variance in ASTM Humidity Cell Procedure Appendix C: Design of MDNR Reactor

SRK Consulting Waste Rock and Lean Ore Geochemical Characterization Plan Page 1
SJD/sdc 1UP005.001_sample_selection_20060504.SJD.rev02.doc, May. 5, 06, 1:33 PM May 2006
1 Introduction
1.1 Background
PolyMet Mining (PolyMet) is proposing to develop the NorthMet Project (Dunka Road Project of US Steel) near Babbitt, Minnesota. As a part of the Minnesota Department of Natural Resources (MDNR) “Permit to Mine” process a complete “mine waste characterization” will be required (Minnesota Rules Chapter 6132.1000). This document describes the plan developed for selection and testing of waste rock samples for the NorthMet Project, and the context for interpretation of the results.
The issues associated with waste rock at the NorthMet are expected to include acid rock drainage (ARD) and leaching of some heavy metals. The latter in particular are expected to include nickel and cobalt both of which do not require acidic conditions to be mobilized at elevated concentrations.
The specific objectives of this program include:
• Refinement of preliminary waste rock management criteria developed by PolyMet and MDNR.
• Development of mass-loading rates for input into water quality predictions for impact assessment and mitigation design.
1.2 Geological Setting
The NorthMet Deposit is located in the intrusive Duluth Complex of northern Minnesota. Disseminated copper-nickel-iron sulfides (chalcopyrite, cubanite, pentlandite and pyrrhotite) with associated platinum group element (PGE) mineralization will be extracted from several igneous stratigraphic horizons.
In the vicinity of the NorthMet deposit, the Duluth Complex intruded and assimilated the Virginia Formation, which consists of argillite and greywacke with minor interbeds of siltstone, graphitic argillite, chert, and carbonate. This formation is the stratigraphic footwall of the NorthMet deposit, but also occurs as xenoliths (“inclusions”) within the deposit.
1.3 Agency Consultation and Design Process
This document was developed in consultation with staff from the Minnesota Department of Natural Resources (MDNR). The consultation included the following steps:
• December, 2004. PolyMet submitted a draft “Work Plan for Geochemical Characterization of Rock and Concentrator Flotation Tailings”. The plan was presented to MDNR representatives.
• January 31 and February 1, 2005. Meetings were held by teleconference between SRK and MDNR representatives to further discuss the variables potentially affecting water chemistry from waste stockpiles.
SRK Consulting Waste Rock and Lean Ore Geochemical Characterization Plan Page 2
SJD/sdc 1UP005.001_sample_selection_20060504.SJD.rev02.doc, May. 5, 06, 1:33 PM May 2006
• March 17, 2005. MDNR requested additional information on the tonnages of the major units and rock types, and the distribution of sulfur and minerals.
• March 28, 2005. PolyMet provided the requested information.
• April 12, 2005. MDNR provided a sample selection matrix. This matrix was accepted by PolyMet and is the basis for the selection of samples described in this document.
• May 15, 2005. MDNR provided a design for specific testwork.
• May 17, 2005. MDNR provided a design for specific testwork.
• June 6, 2005. A draft of this sampling plan was submitted to MDNR.
• June 15, 2005. MDNR provided comments on the draft plan.
• June 22, 2005. SRK provided responses and discussion of the MDNR comments in a letter to MDNR which were discussed during a teleconference on June 27, 2005.
• July 5, 2005. SRK provided results of candidate samples selected for kinetic testing to in a memorandum to MDNR.
• July 13, 2005. MDNR provided comments on the July 5, 2005 SRK memorandum.
• July 15, 2005. SRK provided clarification on sample selection in a memorandum to MDNR.
• July 20, 2005. MDNR notified SRK and PolyMet that kinetic testing on the majority of waste rock samples could be initiated. It was recognized that analysis of a few candidate samples was ongoing.
• August 4, 2005. MDNR Provided recommendations for lean ore characterization.
• August 29, 2005. As requested by SRK, MDNR provided additional rationale for the recommendations on lean ore sampling selection.
• September 14, 2005. Lean ore sample selection was further discussed during a conference call which were provided the basis for completion of this plan.
The plan was fully implemented in October 2005.
This document has been prepared to conclude the design process and seek MDNR approval of PolyMet’s plans to respond to the waste rock characterization component of requirements under Minnesota Rules 6132.1000.
1.4 Organization of this Document
This document describes:
• Section 2. Design basis for the program.
• Section 3. Sample selection. This section describes the methods used to select samples from the NorthMet Project drill hole database.

SRK Consulting Waste Rock and Lean Ore Geochemical Characterization Plan Page 3
SJD/sdc 1UP005.001_sample_selection_20060504.SJD.rev02.doc, May. 5, 06, 1:33 PM May 2006
• Section 4. Analytical methods. This section describes methods used to analyse solids and leachates.
• Section 5. Use of the results in the context of water chemistry predictions.
1.5 Acknowledgements
The following individuals cooperated in the preparation of this plan:
• John Borovsky, Barr Engineering Company.
• Stephen Day, SRK Consulting.
• Paul Eger, MDNR.
• Jennifer Engstrom, MDNR.
• Steve Geerts, PolyMet.
• Don Hunter, PolyMet.
• Kim Lapakko, MDNR.
• Richard Patelke, PolyMet.
• Jim Scott, PolyMet.
1.6 Analytical Laboratues
The following laboratories are performing the procedures described in this document (contact names for each laboratory are shown):
• ALS Chemex, North Vancouver, British Columbia – solids analysis listed in Section 4.1.1 (Bill Anslow).
• Optical – PolyMet (Richard Patelke).
• Sub-Optical Lab – McSwiggen and Associates (Pete McSwiggen).
• Canadian Environmental and Metallurgical Inc (CEMI), North Vancouver, British Columbia - kinetic testing (Rik Vos).
• Cantest Inc.. Vancouver, British Columbia - Kinetic test leachate analysis (Richard Jornitz).

SRK Consulting Waste Rock and Lean Ore Geochemical Characterization Plan Page 4
SJD/sdc 1UP005.001_sample_selection_20060504.SJD.rev02.doc, May. 5, 06, 1:33 PM May 2006
2 Characterization Design
2.1 Background
Sample selection for this project was based on the December 2004 PolyMet geologic and assay database (assembled by PolyMet) and the February 2005 block model by Dr. Phil Hellman of Hellman & Schofield. Ultimately, the rock characterization data from these tests will be linked to the mine plan through this database and block model. Current and anticipated future geochemical data collection from drilling is described in documents submitted to MDNR by PolyMet on August 23, 2004 and September 15, 2004.
2.2 Design Basis
Based on discussions between SRK and MDNR on January 31 and February 1, 2005, the following critical variables were identified that potentially could affect drainage quality from waste rock stockpiles:
• Sulfur content.
• Sulfide mineral type.
• Rock type.
• Fragment particle size.
Other important variables include, mineral content, mineral grain size, mineral chemistry, and mode of mineral occurrence.
Sulfur content is considered the primary factor affecting the potential for acid generation and metal mobility based on existing research conducted by MDNR. At higher sulfur concentrations, it appears that acid generation starts earlier and results in lower pHs resulting in increased metal leaching. At lower sulfur concentrations, acid generation is not expected to occur, but sulfur content is correlated with metal content and is therefore expected to be related to metal release.
Sulfide mineral type can be important in terms of rate of reaction and metal release. For example, it is well know that pyrrhotite is more reactive than pyrite. Chalcopyrite and pentlandite are sources of copper and nickel, respectively in drainage. However, since the dominant sulfide mineral in the waste rock appears to be pyrrhotite (based on distribution of metal content) and the commodity sulfide minerals (chalcopyrite, pentlandite and cubanite) are expected to be present at low concentrations, sulfide mineral type was not considered as a primary variable for sample selection. As described below, concentrations of copper, nickel, cobalt and zinc were used as secondary factors for sample selection which is expected to capture variations in sulfide mineralogy. Lean ore characterization is considered separately. All samples are being characterized to evaluate assumptions about the mineralogical occurrence of the important metals.

SRK Consulting Waste Rock and Lean Ore Geochemical Characterization Plan Page 5
SJD/sdc 1UP005.001_sample_selection_20060504.SJD.rev02.doc, May. 5, 06, 1:33 PM May 2006
All rock types in the Duluth Complex are variants of troctolite and to a lesser extent ultramafic rocks. Carbonate minerals are absent or occur at very low concentrations in this rock type. Therefore, the variation in silicate content of these rocks is considered to be an important variable controlling drainage pH.
MDNR also considered that igneous layer in the intrusive complex may be a significant variable. because the reactivity of the minerals may be different in each of the layers. SRK and PolyMet did not agree with this position based on evidence from MDNR’s past testwork. Nonetheless, this variable has been carried through the sampling design.
Finally fragment particle size is an important factor because it controls exposure of the reactive minerals and the overall surface area available for reaction.
2.3 Sampling Matrix for Waste Rock A sampling matrix for waste rock characterization (Table 1) was developed by MDNR, SRK and PolyMet through a series of discussions and exchange of relevant data. Table 1 shows how the main variables have been translated to a sampling design. The table also provides estimates of the tonnages of each major rock type within each unit. Reading from left to right, the columns in the table show the following:
• Unit. This refers to the stratigraphic igneous layers in the complex (number 1 to 7). Unit 20 refers to the footwall of the deposit composed of Virginia Formation and localized igneous intrusions
• Rock Type. This refers to a generalized rock description in the associated unit.
• Estimated Rock Tonnages. These tonnages indicate the estimated amounts of each rock type within each layer and therefore their relative importance. The categories were developed by MDNR and PolyMet to indicate rock with sulfur less than 0.05%1 (“non-reactive”), sulfur greater than 0.05% but not likely ore grade (“reactive”), and rock with marginal ore grade (lean ore).
Selection of samples for each unit and rock type combination was based on sulfur concentrations in order to develop correlations between reactivity and bulk characteristics such as sulfur and metal content. This provides a basis for water chemistry predictions using bulk characteristics, prediction of waste management criteria (based on sulfur content and metal content) and ultimately for the selection of easily-measured parameters that can be used for waste management during mining (see Section 5.2 below, for additional discussion).
1 Note that the non-reactive classification is a temporary criterion which will be refined by this testwork program.

SRK Consulting Waste Rock and Lean Ore Geochemical Characterization Plan Page 6
SJD/sdc 1UP005.001_sample_selection_20060504.SJD.rev02.doc, May. 5, 06, 1:33 PM May 2006
Table 1: Matrix for Sample Selection in Waste Rock Types
Approximate sulfur contents Reactive Rock Non-
Reactive Reactive Non-reactive1 Reactive1 Lean Ore1 P size Unit Rock Type
M. tons M. tons NR1 NR2 NR3 P10 P25 P50 P75 P80 P85 P90 P95 P100 P10 P25 P50 P75 P80 P85 P90 P95
1 Anorthositic 0.57 0.99 0.08 0.1 0.15 0.29 1.09 1.09 0.11 0.26 0.36 0.93 1.95 4
1 Gabbroic 0 0.68 0.06 0.07 0.07 0.08 0.19 0.5 0.09 0.1 0.18 0.37 0.5 1 Sedimentary hornfels 0 1.6 0.08 0.35 0.69 2.2 2.32 2.81 3.38 3.5 3.78 0.34 1.37 1.58 1.76 4.91
1 Troctolitic 17.2 40.1 0.01 0.03 0.05 0.06 0.07 0.1 0.18 0.21 0.26 0.34 0.62 1.97 0.08 0.15 0.24 0.42 0.49 0.55 0.68 0.98 4
1 Ultramafic 0.21 1.1 0.07 0.08 0.1 0.13 0.2* 0.3* 0.5* 0.8* 1.35 0.07 0.09 0.14 0.33 0.55 0.56 0.65 0.81 1 Vein 0.055 0.022 0 0 0 0 0
2 Anorthositic 2.4 0.56 0.01 0.03 0.05 0.06 0.06 0.08 0.11 0.19 0.09 0.12 0.17 0.21 0.25 2 Basalt inclusions 0.28 0 0 0 0 0 0 2 Gabbroic 0 0.082 0 0 0 0 0 2 Troctolitic 16.9 9.7 0.01 0.03 0.05 0.06 0.06 0.07 0.09 0.09 0.1 0.11 0.12 0.25 0.05 0.07 0.12 0.18 0.2 0.22 0.26 0.32
2 Ultramafic 0.38 0.25 0.03 0.04 0.05 0 0 0 0 0 0.04 0.05 0.07 0.12 0.14 0.16 0.19 0.23
3 Anorthositic 9.4 1.2 0.01 0.03 0.05 0.07 0.08 0.08 0.12 0.14 0.06 0.08 0.12 0.27 0.38
3 Fault-Breccia 0 0.055 0 0 0 0 0 3 Gabbroic 0.2 0.72 0.09 0.15 0.18 0.27 0.29 0 0 0 0 0 3 Noritic 0.11 0 3 Sedimentary hornfels 0.38 0.46 0.12 1.42 1.67 1.97 2.22 1.66 1.77 1.85 2.43 3.26
3 Troctolitic (augite) 41.2 12.5 0.01 0.03 0.05 0.06 0.06 0.08 0.1 0.11 0.12 0.14 0.19 0.36 0.05 0.13 0.19 0.32 0.35 0.45 0.48 0.52 4
3 Ultramafic 0.24 0.071 0 0 0 0 0 0 0 0 0 0
4 Anorthositic 0.16 0.055 0 0 0 0 0 4 Sedimentary hornfels 0 0.055 0 0 0 0 0
4 Troctolitic 7 2.2 0.01 0.03 0.05 0.06 0.07 0.09 0.18 0.19 0.19 0.48 0.92 1.53 0.09 0.15 0.22 0.47 1.52 4
4 Vein 0.055 0
5 Troctolitic 2.5 2 0.01 0.05 0.07 0.09 0.11 0.16 0.22 0.22 0.12 0.17 0.26 0.37 0.45 6 Chlorite 0.16 0 0 0 0 0 0 6 Fault-Breccia 0.055 0.055 0 0 0 0 0 6 Troctolitic 6.8 0.59 0.02 0.04 0 0 0 0 0 0.01 0.01 0.03 0.07 0.19 6 Ultramafic 0 0.11 0 0 0 0 0 7 Ultramafic 0.082 0 0 0 0 0 0
20 Troctolitic 0 0.27 3.18 3.45 3.76 4.3 4.31
20 Virginia 0 10.4 0.59 1.25 2.98 4.15 4.49 4.85 5.07 6.06 7.45 0 0 0 0 0 4 Notes: 1. Non-reactive rock categories (lower, medium and higher sulfur contents). 2. Sulfur percentiles for reactive rock types calculated by PolyMet are shown. “*” indicates approximate percentiles. 3. Grey – sampling plan. 4. Bold and italic – samples obtained. 5. Bold border – duplicate cell in operation.
SRK Consulting Waste Rock and Lean Ore Geochemical Characterization Plan Page 7
SJD/sdc 1UP005.001_sample_selection_20060504.SJD.rev02.doc, May. 5, 06, 1:33 PM May 2006
Separate sulfur ranges were defined for the “non-reactive” and “reactive” categories. Within the non-reactive category, three sulfur concentrations were selected to represent the lowest possible sulfur concentration in the rock type (typically 0.01%), the upper limit to this category (0.05%) and an intermediate (0.03%). The need for samples was identified for relatively abundant rock types contributing more than 1,000,000 tons (ie more than 1% of the rock mass). For the reactive category, sample selections were based on sulfur concentration percentiles calculated by Polymet. Again, rock types contributing more than 1,000,000 tons were identified for testing.
Sulfide mineral variability was considered by preferring samples with higher concentrations of Ni and Co, Cu and Zn.
The search for suitable samples included all candidate sulfur values indicated in grey shading Table 1.
2.4 Characterization of Lean Ore
Lean ore is defined as rock containing grades of commodity minerals below that at which processing can currently be justified, but may eventually be processed if project economics improve. In terms of sulfur content, lean ore mainly overlaps the “reactive” waste rock category and also some to degree the non-reactive catagory but contains higher nickel and copper concentrations than waste rock. Therefore, the main difference between lean ore and waste rock is expected to be in the mineralogical occurrence of sulfur. In waste rock, sulfur occurs mainly as iron sulfide but in lean ore the commodity minerals pentlandite, chalcopyrite and cubanite are expected to be more important. This has important implications for drainage chemistry. In particular, oxidation and leaching of pentlandite is expected to release more nickel than pyrrhotite due to the higher Ni/Fe ratio in pentlandite. This limits the co-precipitation of nickel with iron oxhydroxides during oxidation.
The overall approach to selection of samples was similar to that of waste rock.

SRK Consulting Waste Rock and Lean Ore Geochemical Characterization Plan Page 8
SJD/sdc 1UP005.001_sample_selection_20060504.SJD.rev02.doc, May. 5, 06, 1:33 PM May 2006
3 Sampling
3.1 Methods
3.1.1 Sample Selection for Non-Reactive and Reactive Waste Types
Samples were selected from the NorthMet Project drill hole database. The following sequence was used to select samples:
1. The database was reduced to rock core. Only diamond drill holes were considered because this method of drilling results in the best characterised samples by eliminating mixing of intervals and allowing accurate logging.
2. Separate datasets were created for “waste rock” (non-reactive and reactive) and “lean ore”.
3. Due to ease of recovery from the core archives, core obtained by PolyMet drilling was preferred. In cases where suitable samples could not be found from this source, US Steel drillholes were considered.
4. To select samples, 20-foot moving-averages for consistent rock types were calculated for all parameters. This interval was selected to reduce the potential for characterizing small-scale local heterogeneity, and provide a sample width that relates to mining scale. The wider interval also ensured that sufficient sample is available for all the different tests. In practice, the need to obtain samples with specific unit, rock type and �ulphur combinations resulted in sampling intervals of 5 to 20 feet. In three cases, sample intervals from two different locations had to be selected to yield sufficient material for testing.
5. Within each rock type and unit combination, samples were identified based on a �ulphur range straddling the desired concentrations. The range was calculated as between the midpoint concentration to the two nearest �ulphur concentrations. For example, a target concentration of 0.03% between 0.01% and 0.05% could be selected from intervals with �ulphur concentrations between 0.02% and 0.04% (with a preference for 0.03%). This approach was necessary to provide candidate samples in all ranges and incorporate the need to target higher metal concentrations for tests.
6. If more than one candidate interval was identified, the interval with the highest nickel and cobalt concentrations was selected with a primary focus on nickel content. If several samples could still be chosen, copper and zinc concentrations were considered. This approach resulted in selection of samples with nickel concentrations approaching the highest values in the database. For example, the highest nickel concentration in a non-reactive sample is 0.043% compared to a maximum value of 0.043% in the database. Similarly, the highest reactive nickel concentration in the database is 0.042%, and the highest sample is 0.038%.

SRK Consulting Waste Rock and Lean Ore Geochemical Characterization Plan Page 9
SJD/sdc 1UP005.001_sample_selection_20060504.SJD.rev02.doc, May. 5, 06, 1:33 PM May 2006
The sample lists (Table 2 and 3) were re-generated several times due to limitations of core availability. The first pass attempted to use PolyMet core only. Subsequent lists included US Steel core.
Lean ore sample selection was performed in two passes. The first pass targeted samples containing �ulphur concentrations at the P95 level. The second pass selected samples for the remaining samples. To ensure that delays did not occur in the second pass, a large number of intervals were selected to ensure that at least one sample would be available for each target �ulphur concentration.
3.1.2 Core Recovery
Samples were recovered from archived core boxes by PolyMet personnel. Since the core had previously halved for initial analysis, the remaining half core was quartered for this sampling.
All required intervals were sampled on a continuous basis and placed in plastic bags for shipment to the analytical laboratory.
3.2 Sample List
The resulting lists of waste rock samples and lean ore samples shipped to the laboratory are shown in Tables 2 and 3.

SRK Consulting Waste Rock and Lean Ore Geochemical Characterization Plan Page 10
SJD/sdc 1UP005.001_sample_selection_20060504.SJD.rev02.doc, May. 5, 06, 1:33 PM May 2006
Table 2: List of Non-Reactive and Reactive Samples Selected
Selected Interval Weighted Average Characteristics Calculated from Drill Hole Database
From To Length S Ni Co Cu Zn Unit Rock Type S Percentile – Non-Reactive and Reactive Waste Rock1 DDH
Feet Feet Feet % % mg/kg % mg/kg
1 Anorthositic P25 99-320C 830 850 20 0.12 0.015 35.8 0.035 72
1 Anorthositic P50 00-361C 310 320 10 0.16 0.018 36.0 0.013 51
1 Anorthositic P75 00-361C 345 350 5 0.33 0.026 53.0 0.038 68
1 Anorthositic P95 00-343C 240 250 10 0.67 0.020 38.0 0.069 69
1 Sedimentary Hornfels P10 26030 1047 1052 5 0.17 0.006 10.0 0.006 34
1 Sedimentary Hornfels P25 26061 1218 1233 15 0.43 0.011 19.3 0.012 193
1 Sedimentary Hornfels P50 00-340C 990 995 10 0.62 0.012 24.0 0.031 148
1 Sedimentary Hornfels P75 00-340C 965 974.5 15 1.49 0.015 23.7 0.031 249
1 Sedimentary Hornfels P85 26043 1501 1506 5 2.76 0.024 36.0 0.037 344
1 Sedimentary Hornfels P85(a) 26027 740 745 5 2.59 0.035 67.0 0.051 48
1 Troctolitic NR1 26029 815 825 10
1 Troctolitic NR2 00-340C 595 615 20 0.03 0.025 49.8 0.013 71
1 Troctolitic NR3 00-334C 580 600 20 0.05 0.024 52.0 0.024 83
1 Troctolitic P25 00-334C 640 660 20 0.08 0.038 63.8 0.024 102
1 Troctolitic P50 00-347C 795 815 20 0.09 0.034 70.8 0.035 94
1 Troctolitic P80 00-350C 580 600 20 0.22 0.027 55.5 0.041 115
1 Troctolitic P90 00-327C 225 245 20 0.44 0.015 50.5 0.032 73
1 Troctolitic P95 00-371C 435 440 5 0.65 0.014 32.0 0.036 54
1 Troctolitic P100 00-340C 765 780 15 1.72 0.022 78.0 0.064 69
1 Ultramafic P25 00-357C 335 340 5 0.08 0.015 35.0 0.026 68
1 Ultramafic P80 00-326C 680 685 5 0.21 0.016 33.0 0.085 82
1 Ultramafic P85 00-357C 535 540 5 0.26 0.026 34.0 0.095 62
1 Ultramafic P90 99-318C 725 735 10 0.44 0.011 23.0 0.032 45
1 Ultramafic P95 99-317C 460 470 10 1.10 0.018 33.0 0.056 86
2 Anorthositic NR1 00-366C 185 205 20 0.01 0.018 35.0 0.008 47
2 Anorthositic NR2 00-366C 230 240 10 0.02 0.014 32.0 0.011 51
2 Anorthositic NR3 99-320C 165 175 10 0.04 0.023 46.0 0.012 63
2 Troctolitic NR1 99-318C 250 270 20 0.02 0.022 42.3 0.011 64
2 Troctolitic NR2 00-373C 95 115 20 0.03 0.036 64.0 0.019 84
2 Troctolitic NR3 00-373C 75 95 20 0.05 0.031 55.3 0.020 75
2 Troctolitic P50 00-357C 110 130 20 0.07 0.024 53.5 0.029 88
2 Troctolitic P80 99-320C 315 330 15 0.09 0.017 39.3 0.026 65
2 Troctolitic P95 00-369C 335 345 10 0.16 0.021 43.0 0.046 68
2 Ultramafic NR1 00-368C 460 465 5 0.03 0.042 70.0 0.033 98
2 Ultramafic NR2 26055 940 945 5 0.04 0.037 69.0 0.025 88
2 Ultramafic NR3 26098 145 148.5 3.5 0.05 0.037 76.0 0.014 112
SRK Consulting Waste Rock and Lean Ore Geochemical Characterization Plan Page 11
SJD/sdc 1UP005.001_sample_selection_20060504.SJD.rev02.doc, May. 5, 06, 1:33 PM May 2006
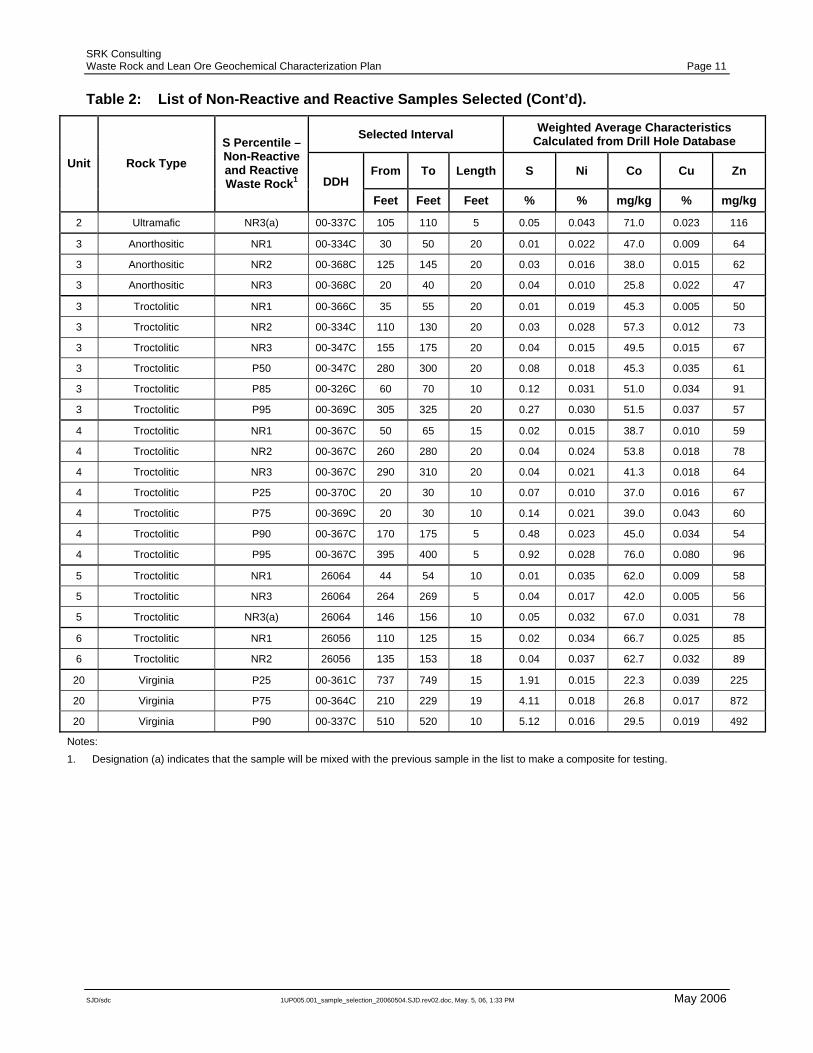
Table 2: List of Non-Reactive and Reactive Samples Selected (Cont’d).
Selected Interval Weighted Average Characteristics Calculated from Drill Hole Database
From To Length S Ni Co Cu Zn Unit Rock Type S Percentile – Non-Reactive and Reactive Waste Rock1 DDH
Feet Feet Feet % % mg/kg % mg/kg
2 Ultramafic NR3(a) 00-337C 105 110 5 0.05 0.043 71.0 0.023 116
3 Anorthositic NR1 00-334C 30 50 20 0.01 0.022 47.0 0.009 64
3 Anorthositic NR2 00-368C 125 145 20 0.03 0.016 38.0 0.015 62
3 Anorthositic NR3 00-368C 20 40 20 0.04 0.010 25.8 0.022 47
3 Troctolitic NR1 00-366C 35 55 20 0.01 0.019 45.3 0.005 50
3 Troctolitic NR2 00-334C 110 130 20 0.03 0.028 57.3 0.012 73
3 Troctolitic NR3 00-347C 155 175 20 0.04 0.015 49.5 0.015 67
3 Troctolitic P50 00-347C 280 300 20 0.08 0.018 45.3 0.035 61
3 Troctolitic P85 00-326C 60 70 10 0.12 0.031 51.0 0.034 91
3 Troctolitic P95 00-369C 305 325 20 0.27 0.030 51.5 0.037 57
4 Troctolitic NR1 00-367C 50 65 15 0.02 0.015 38.7 0.010 59
4 Troctolitic NR2 00-367C 260 280 20 0.04 0.024 53.8 0.018 78
4 Troctolitic NR3 00-367C 290 310 20 0.04 0.021 41.3 0.018 64
4 Troctolitic P25 00-370C 20 30 10 0.07 0.010 37.0 0.016 67
4 Troctolitic P75 00-369C 20 30 10 0.14 0.021 39.0 0.043 60
4 Troctolitic P90 00-367C 170 175 5 0.48 0.023 45.0 0.034 54
4 Troctolitic P95 00-367C 395 400 5 0.92 0.028 76.0 0.080 96
5 Troctolitic NR1 26064 44 54 10 0.01 0.035 62.0 0.009 58
5 Troctolitic NR3 26064 264 269 5 0.04 0.017 42.0 0.005 56
5 Troctolitic NR3(a) 26064 146 156 10 0.05 0.032 67.0 0.031 78
6 Troctolitic NR1 26056 110 125 15 0.02 0.034 66.7 0.025 85
6 Troctolitic NR2 26056 135 153 18 0.04 0.037 62.7 0.032 89
20 Virginia P25 00-361C 737 749 15 1.91 0.015 22.3 0.039 225
20 Virginia P75 00-364C 210 229 19 4.11 0.018 26.8 0.017 872
20 Virginia P90 00-337C 510 520 10 5.12 0.016 29.5 0.019 492
Notes: 1. Designation (a) indicates that the sample will be mixed with the previous sample in the list to make a composite for testing.

SRK Consulting Waste Rock and Lean Ore Geochemical Characterization Plan Page 12
SJD/sdc 1UP005.001_sample_selection_20060504.SJD.rev02.doc, May. 5, 06, 1:33 PM May 2006
Table 3: List of Lean Ore Samples Selected
Selected Interval Weighted Average Characteristics Calculated from Drill Hole Database
From To Length S Ni Co Cu Zn Unit Rock Type S Percentile DDH
Feet Feet Feet % % mg/kg % mg/kg
1 Anorthositic P50 99-320C 400 405 5 0.32 0.06 63 0.07 68
1 Anorthositic P75 00-331C 255 260 5 0.95 0.05 38 0.16 42
1 Anorthositic P95 26027 616 626 10 2.31 0.054 77.0 0.144 75
1 Sedimentary Hornfels P50 26058 704 715 11 1.59 0.04 40 0.08 175
1 Sedimentary Hornfels P95 26062 993 998 5 5.49 0.049 81.0 0.153 166
1 Sedimentary Hornfels P95 26026 565 568 3 3.83 0.033 70.0 0.074 88
1 Troctolitic P25 00-326C 250 265 15 0.15 0.04 49 0.07 73
1 Troctolitic P50 00-340C 910 925 15 0.33 0.04 50 0.15 77
1 Troctolitic P85 00-331C 190 210 20 0.54 0.04 41 0.17 43
1 Troctolitic P95 00-340C 725 745 20 1.06 0.045 116.0 0.114 95
1 Ultramafic P50 00-326C 495 505 10 0.14 0.06 91 0.06 128
1 Ultramafic P75 00-344C 630 635 5 0.33 0.05 54 0.13 82
1 Ultramafic P85 00-330C 275 280 5 0.60 0.06 123 0.10 86
1 Ultramafic P95 00-344C 515 520 5 1.10 0.057 72.0 0.090 130
2 Troctolitic P85 99-318C 325 330 5 0.21 0.05 63 0.14 90
2 Troctolitic P95 00-340C 380 385 5 0.30 0.04 56 0.13 84
2 Ultramafic P80 00-326C 225 235 10 0.13 0.06 87 0.10 122
2 Ultramafic P95 00-361C 240 245 5 0.20 0.085 103.0 0.017 130
3 Troctolitic P75 00-367C 495 500 5 0.28 0.05 52 0.16 58
3 Troctolitic P95 26049 358 362 4 0.55 0.058 73.0 0.151 60
3 Troctolitic P95 26030 291 296 5 0.50 0.055 78.0 0.149 104
4 Troctolitic P95 00-367C 400 405 5 1.52 0.031 79.0 0.116 86
5 Troctolitic P95 26056 302 312 10 0.45 0.04 50 0.11 67
6 Troctolitic P95 26142 360 365 5 0.15 0.043 50.0 0.109 80

SRK Consulting Waste Rock and Lean Ore Geochemical Characterization Plan Page 13
SJD/sdc 1UP005.001_sample_selection_20060504.SJD.rev02.doc, May. 5, 06, 1:33 PM May 2006
4 Sample Preparation and Analysis
4.1 Solids Characterization
4.1.1 Sample Preparation
Samples were shipped to Canadian Environmental and Metallurgical Inc (CEMI) as whole core pieces. The following procedures were used for sample preparation:
• Upon arrival, each sample was weighed and its weight recorded. Specific gravity was determined.
• Each sample was crushed to pass a 0.25 inch screen.
• A 3 kg split of crushed sample was split and saved for humidity cell testing. This provides sufficient sample for duplicate kinetic testing if needed
• A 200 g split was used for solids characterization
• A 50 g split was saved for additional archive and petrographic analysis
4.1.2 Chemical Analysis
A split of each sample was submitted for an extensive suite of analysis, as follows:
• Acid base accounting (total S, carbonate, paste pH). Sulfur as sulfate is not needed because previous work shows that sulfur occurs exclusively as sulfide. Carbonate rather than neutralization potential is being determined because neutralization potential determinations on rocks containing reactive silicates are ambiguous and do not reflect field capacity to neutralize acid. Carbonate indicates the field reactive component of acid neutralization potential.
• 27 elements by ICP scan following four-acid (nitric-hydrochloric-perchloric-hydrofluoric) digestion (near total) (0.5 g).
• 34 elements by ICP scan following aqua regia (nitiric-hydrochloric acid) digestion (0.5 g).
• Whole rock oxides (0.5 g).
These methods were selected to provide continuity with the earlier work and will therefore allow the samples selected to be compared with the existing project database.
Method detection limits are provided in Appendix A.
In addition, 200 g of all samples were split into four size fractions (-100+270 mesh, -35+100 mesh, -10+35 mesh and -0.25”+10 mesh) for analysis of total S and 27 elements by four acid digestion.
Chemical analysis of all samples was completed prior to implementation of kinetic testing.

SRK Consulting Waste Rock and Lean Ore Geochemical Characterization Plan Page 14
SJD/sdc 1UP005.001_sample_selection_20060504.SJD.rev02.doc, May. 5, 06, 1:33 PM May 2006
4.1.3 Optical Analysis
Two pieces of typical core from each interval sampled were taken for preparation of polished thin sections to confirm the rock type and quantify reactive minerals. Optical mineralogy reports will indicate mineral types, mineral abundance, grain sizes and mineral occurrence.
4.1.4 Sub-Optical Analysis
Sub-optical analysis included determination of the trace element content of major minerals on selected samples using microprobe analyses.
4.2 Kinetic Test Methods
4.2.1 Humidity Cell
Humidity cell testing is being performed using ASTM Procedure D 5744 – 96 (Reapproved 2001). This procedure was selected for the following reasons:
• Similar procedures have been in use under different names since the late 1980s (e.g. MEND 1991). The results can therefore be evaluated in the context of more than a decade of experience using the procedure.
• It is a standard procedure approved by the ASTM and is therefore defensible as a method.
The ASTM procedure provides some options for varying the test procedure. Appendix B provides a detailed listing of the requirement of the ASTM procedure, options chosen and any variances from the ASTM procedure
4.2.2 MDNR Reactor
To evaluate size fraction effects, four size fractions (-100 mesh, -35+100 mesh, -10+35 mesh and -0.25”+10 mesh) from five samples are being tested using a procedure referred to as the “MDNR Reactor” experiment. The two smallest size fractions are being tested in a specifically designed apparatus designed by MDNR (Appendix C) to contain 75 g. The two coarser fractions are being tested in cells with the same configuration as ASTM Procedure D 5744–96. Details of the construction of the smaller MDNR reactors as provided by MDNR are attached in Appendix C.
For the small reactors, a weekly volume of 200 mL is being used. For the larger samples, the leachate volume is 300 mL.
4.2.3 Leachate Analysis
Leachates from kinetic tests are being analyzed for the parameters indicated in Table 4 every four weeks beginning on the first rinsing cycle (week 0). Every four weeks on weeks 2, 6, 10 etc. the leachates are analysed for a higher level scan to evaluate trends in major elements. Based on experience, testing of non-reactive rock samples with very low sulfur concentrations is expected to

SRK Consulting Waste Rock and Lean Ore Geochemical Characterization Plan Page 15
SJD/sdc 1UP005.001_sample_selection_20060504.SJD.rev02.doc, May. 5, 06, 1:33 PM May 2006
result in very dilute leachates containing low concentrations of the metals of interest. Back-calculation of metal concentrations from other testwork performed by DNR indicates that nickel and cobalt concentrations could be as low as 0.0002 mg/L (200 ng/L) and 0.00001 (10 ng/L), respectively. Quantification of these low metal concentrations is needed to provide reasonably constrained estimates of metals concentrations in waste rock seepage.
A number of different approaches are available to quantify low levels of metals:
• The routine leachate analysis will achieve a detection level of 0.0001 mg/L (100 ng/L). Should concentrations be undetected, detection limits of 50 ng/L can be obtained with additional processing effort using the same routine method.
• Specialist methods can achieve lower detection limits. These are non-routine (for example, evaporation to increase concentrations) and will need to be developed as the need arises. In order to generate a 10 times decrease in detection limit, the samples would need to be concentrated at 1east 10 times. A composite leachate sample would be prepared from several cycles.
• Existing testwork demonstrates that good correlations exist between cobalt and nickel concentrations in leachates. Detectable nickel concentrations can be used to estimate cobalt concentrations if this relationship can be demonstrated.
• The particle size experiments provide a larger surface area and provide greater likelihood that lower concentrations will be detected.
• In the event of undetectable low levels, detection limit values would be used in subsequent calculations. A scale-up methodology will be agreed upon with MDNR to translate non-detectable concentrations to waste rock seepage concentrations. Section 5.2 provides discussion of possible scale-up approaches.

SRK Consulting Waste Rock and Lean Ore Geochemical Characterization Plan Page 16
SJD/sdc 1UP005.001_sample_selection_20060504.SJD.rev02.doc, May. 5, 06, 1:33 PM May 2006
Table 4: List of Parameters for Humidity Cell Leachate Analyses. Concentrations in mg/L except where indicated
Parameter Limit Parameter Limit pH (standard units) - Acidity 1
Conductivity (µS/cm) 1 Alkalinity 1
Chloride 0.2 Sulfate 0.5
Fluoride 0.05 Total Inorganic Carbon 1
ORP (mV) -
Dissolved Elements
Aluminum 0.001 Molybdenum 0.00005
Antimony 0.0001 Nickel 0.0001 (0.00005)1
Arsenic 0.0001 Potassium 0.02
Barium 0.0001 Selenium 0.0002
Beryllium 0.0002 Silicon 0.05
Bismuth 0.0002 Silver 0.00005
Boron 0.005 Sodium 0.01
Cadmium 0.00004 Strontium 0.0001
Calcium 0.01 Tellurium 0.0002
Chromium 0.0002 Thallium 0.00002
Cobalt 0.0001 (0.00005)1 Thorium 0.0001
Copper 0.0001 Tin 0.0001
Iron 0.01 Titanium 0.0002
Lead 0.00005 Uranium 0.00005
Lithium 0.0002 Vanadium 0.0002
Magnesium 0.005 Zinc 0.001
Manganese 0.00005 Notes: 1. Low detection limits are available for cobalt and nickel as shown.
4.3 Quality Assurance/Quality Control
To summarize, QA/QC includes the following components:
• Roughly 10% of all solids analyses are performed in duplicate.
• Roughly 10% of all cell and reactor tests are run as duplicates.
• A blank cell and reactor containing no sample is being operated to check for contamination of leachates by construction materials.
• Individual leachate results are reviewed.
• Ion balances on leachate results are reviewed. In general, imbalances of ±10% are considered acceptable. Re-analysis if requested depending on the nature of the imbalance.
• Data trends in kinetic test leachates are analysed to check for anomalies.

SRK Consulting Waste Rock and Lean Ore Geochemical Characterization Plan Page 17
SJD/sdc 1UP005.001_sample_selection_20060504.SJD.rev02.doc, May. 5, 06, 1:33 PM May 2006
5 Analytical Results for Samples Selected Table 5 compares analytical results for all samples selected with concentrations calculated from individual intervals in the database. This table reflects the final sample selection following review of data to locate potential replacements, and replacement of one sample. The final three columns indicate the difference between calculated and analytical results using:
% Difference = Target- Actual x 100%
Target
Sulfur results showed the greatest percentage differences for samples in the non-reactive category. However, these differences reflect small absolute differences (0.01 to 0.02%) resulting from analytical variability near the detection limit. One sample was replaced in this category because it had 0.05% sulphur compared to target of 0.01%.
A few samples in the reactive class had differences between 50% and 100%. Review of the database indicated no suitable replacements.
One sample in the lean ore class showed a difference of 50%.
Based on these results, MDNR, SRK and PolyMet agreed that the sample selections mostly provided good coverage with respect to the targeted sample ranges indicated in Table 2 and that set up of kinetic tests could proceed.

SRK Consulting Waste Rock and Lean Ore Geochemical Characterization Plan Page 18
SJD/sdc 1UP005.001_sample_selection_20060504.SJD.rev02.doc, May. 5, 06, 1:33 PM May 2006
Table 5: Comparison of Weighted Sample Characteristics Used for Sample Selection with Analytical Results for Interval Composites
Percentiles for Sulfur Contents Deviations
Non-reactive Reactive Lean Ore Non-reactive Reactive Lean Ore Unit Rock Type Parameter
NR1 NR2 NR3 P10 P25 P50 P75 P80 P85 P90 P95 P100 P10 P25 P50 P75 P80 P85 P90 P95 NR1 NR2 NR3 P10 P25 P50 P75 P80 P85 P90 P95 P100 P10 P25 P50 P75 P80 P85 P90 P951 Anorthositic Target Total S, % 0.08 0.1 0.15 0.29 1.09 1.09 0.11 0.26 0.36 0.93 1.95
Test
Material Total S, % 0.09 0.18 0.05 0.68 0.18 0.86 1.83 -10% 20% -83% -38% -50% -8% -6% Sedimentary hornfels Target Total S, % 0.08 0.35 0.69 2.2 2.32 2.81 3.38 3.5 3.78 0.34 1.37 1.58 1.76 4.91
Test
Material Total S, % 0.24 0.44 0.55 1.74 2.47 1.46 4.46 200% 26% -20% -21% -12% -8% -9% Troctolitic Target Total S, % 0.01 0.03 0.05 0.06 0.07 0.1 0.18 0.21 0.26 0.34 0.62 1.97 0.08 0.15 0.24 0.42 0.49 0.55 0.68 0.98
Test
Material Total S, % 0.02 0.04 0.06 0.07 0.19 0.44 0.88 1.68 0.08 0.36 0.42 0.91 100% 33% 20% -30% -10% 29% 42% -15% -47% 50% -24% -7% Ultramafic Target Total S, % 0.07 0.08 0.1 0.13 0.2 0.3 0.5 0.8 1.35 0.07 0.09 0.14 0.33 0.55 0.56 0.65 0.81
Test
Material Total S, % 0.08 0.3 0.2 0.72 1.24 0.16 0.34 0.75 1.2 0% 50% -33% 44% 55% 14% 3% 34% 48%2 Anorthositic Target Total S, % 0.01 0.03 0.05 0.06 0.06 0.08 0.11 0.19 0.09 0.12 0.17 0.21 0.25
Test
Material Total S, % 0.02 0.02 0.03 100% -33% -40% Troctolitic Target Total S, % 0.01 0.03 0.05 0.06 0.06 0.07 0.09 0.09 0.1 0.11 0.12 0.25 0.05 0.07 0.12 0.18 0.2 0.22 0.26 0.32
Test
Material Total S, % 0.04 0.04 0.06 0.08 0.07 0.18 0.17 0.15 300% 33% 20% 14% -22% 50% -23% -53% Ultramafic Target Total S, % 0.03 0.04 0.05 0 0 0 0 0 0.04 0.05 0.07 0.12 0.14 0.16 0.19 0.23
Test
Material Total S, % 0.06 0.06 0.1 0.12 0.06 100% 50% -14% -74%3 Anorthositic Target Total S, % 0.01 0.03 0.05 0.07 0.08 0.08 0.12 0.14 0.06 0.08 0.12 0.27 0.38
Test
Material Total S, % 0.02 0.04 0.04 100% 33% -20% Troctolitic (augite) Target Total S, % 0.01 0.03 0.05 0.06 0.06 0.08 0.1 0.11 0.12 0.14 0.19 0.36 0.05 0.13 0.19 0.32 0.35 0.45 0.48 0.52
Test
Material Total S, % 0.02 0.04 0.06 0.06 0.14 0.25 0.28 0.59 100% 33% 20% -25% 17% 32% -13% 13%4 Troctolitic Target Total S, % 0.01 0.03 0.05 0.06 0.07 0.09 0.18 0.19 0.19 0.48 0.92 1.53 0.09 0.15 0.22 0.47 1.52
Test
Material Total S, % 0.03 0.04 0.04 0.08 0.21 0.51 0.77 1.37 200% 33% -20% 14% 17% 6% -16% -10%5 Troctolitic Target Total S, % 0.01 0.05 0.07 0.09 0.11 0.16 0.22 0.22 0.12 0.17 0.26 0.37 0.45
Test
Material Total S, % 0.02 0.06 0.23 0.32 100% 20% -12% -29%6 Troctolitic Target Total S, % 0.02 0.04 0 0 0 0 0 0.01 0.01 0.03 0.07 0.19
Test
Material Total S, % 0.04 0.05 100% 25% 20 Virginia Target Total S, % 0.59 1.25 2.98 4.15 4.49 4.85 5.07 6.06 7.45 0 0 0 0 0
Test
Material Total S, % 2 3.79 5.68 60% -9% 12% Notes Notes: Target sulfur levels for samples tested in humidity cells (selected by DNR). Greater than 100% deviation for non-reactive samples and between 50% and 100% deviation for reactive and lean ore samples.
Greater than 100% deviation for reactive and lean ore samples.

SRK Consulting Waste Rock and Lean Ore Geochemical Characterization Plan Page 19
SJD/sdc 1UP005.001_sample_selection_20060504.SJD.rev02.doc, May. 5, 06, 1:33 PM May 2006
6 Implementation Schedule The majority of waste rock testwork and some lean ore test work was implemented beginning August 8, 2005 following approval by MDNR on July 20, 2005. The balance of lean ore testwork was started on October 28, 2005. Based on the agreement between PolyMet and MDNR that 26 weeks will provide sufficient data for initial analysis, and allowing 8 weeks for reporting and quality assurance evaluations of metals results, the timing of 26 weeks of available data is as follows:
• Waste Rock –Early April, 2006.
• Lean Ore – Late June, 2006.
Based on these time frames, waste rock data will be reported in mid-May and lean ore in early August. These reports will contain recommendations for modifications to the test program. Termination of testwork will consider the following factors:
• Observation of stable trends for all monitored parameters. Stable is defined as a either flat or steady decrease in metal release.
• Demonstration that results for tests are similar and results can be grouped. Selected tests represent the groups of tests will be continued to demonstrate stability of trends.
• Similarity of results with previous DNR testwork.
It is recognized based on MDNR long term experience with kinetic testing of waste rock from other locations in the Duluth Complex that the pH of initial leachates may be elevated compared to long term pH, and that this may result in under-estimation of metal release. This factor will be considered when selecting samples for continuation.

SRK Consulting Waste Rock and Lean Ore Geochemical Characterization Plan Page 20
SJD/sdc 1UP005.001_sample_selection_20060504.SJD.rev02.doc, May. 5, 06, 1:33 PM May 2006
7 Use of Data for Water Quality Predictions
7.1 Purpose of this Section
This section of the plan describes how the data obtained from kinetic tests are used as inputs into prediction of water chemistry for the NorthMet Project. Section 5.2 describes how water quality predictions fit into the overall mine planning process. Section 5.3 provides discussion on scaling up data obtained from small lab experiments to full scale site stockpiles and waste dumps.
7.2 General Context to Water Quality Predictions in Mine Planning
The ultimate objectives of geochemical characterization are to obtain data that can be used as inputs to:
1. Waste management planning (for example, is the rock/tailings acid generating and/or metal leaching?); and
2. Impact assessment (what concentrations of metals and other components might leach from rock/tailings?).
Figure 1 illustrates the general flow of data collection to achieve the above objectives. The bulk geological and geochemical characteristics (indicated by the geological and lithogeochemical models) are interpreted in the context of release rates and geochemical waste classification criteria, and are input into waste scheduling. The resulting waste composition allows release rate information to be used in scale-up calculations, which in turn are used to develop water chemistry predictions.

SRK Consulting Waste Rock and Lean Ore Geochemical Characterization Plan Page 21
SJD/sdc 1UP005.001_sample_selection_20060504.SJD.rev02.doc, May. 5, 06, 1:33 PM May 2006
Correlation of Bulk Characteristics to Release
Rates and Mineralogy
Geochemical ModelGeological Model
Scale-Up Modelling and Calculations
Adjustment to Reflect Solubility Controls
Source Term Chemistry
Water Quality Impact Assessment
Waste Scheduling
Bulk Characteristics
Figure 1: Flow of Information for Water Quality Predictions During Mine Planning

SRK Consulting Waste Rock and Lean Ore Geochemical Characterization Plan Page 22
SJD/sdc 1UP005.001_sample_selection_20060504.SJD.rev02.doc, May. 5, 06, 1:33 PM May 2006
The overall components of geochemical characterization therefore include:
1. Bulk characterization of the rock mass using geological and/or geochemical variables that can be used to predict the waste characteristics for the purpose of waste management planning.
2. Correlation of the characteristics used for bulk characterization with relevant ML/ARD (metal leaching/acid rock drainage) variables and development of criteria based on that correlation (e.g. correlate sulfur content with acid generation and correlate metal leaching rates with bulk metal content).
3. Prediction of contaminant release rates on a mass basis from rock and tailings under various disposal scenarios.
4. Determination of water quality controls (e.g. solubility limits, attenuation effects etc.) for prediction of source term concentrations for individual facilities. Data obtained for this component will be used to adjust water quality predictions obtained from scale-up of laboratory kinetic tests.
All four components are relevant to both objectives and the process is iterative. For example, the last component may indicate parameters that should be used for classification of waste leading to requirements for waste modeling in the first component (Figure 1).
7.3 Approach to Developing Water Quality Predictions
A number of general approaches are available to obtain water quality predictions. These include:
• Theoretical (“First Principals”);
• Site comparisons; and
• Empirical
Discussion of each of these approaches is provided in the following sections.
7.3.1 Theoretical Approach
The theoretical approach involves working from first principals with reaction kinetics and thermodynamics for the processes involved in sulfide oxidation, acid neutralization and metal leaching and attenuation (MEND 2000). There are a number of limitations to this approach which include the difficulty of modeling processes for site-specific conditions. For example, sulfide mineral reactivity can vary widely due to differences in mineral type, occurrence, crystallinity and trace element content. To address these limitations, practitioners typically introduce site-specific calibrations for some processes resulting in predictions that contain empirical aspects. These calibrations may involve actual measurements of oxygen consumption rates, heat generation and seepage chemistry, most of which require that a waste rock dump exists. The ability to make predictions for completely new facilities is therefore limited using purely theoretical approaches (MEND 1995) and should not be pursued further for the NorthMet Project

SRK Consulting Waste Rock and Lean Ore Geochemical Characterization Plan Page 23
SJD/sdc 1UP005.001_sample_selection_20060504.SJD.rev02.doc, May. 5, 06, 1:33 PM May 2006
7.3.2 Site Comparisons
Site comparisons are based on the assumption that mineralogy has a strong influence on water quality, and therefore that comparison of mineral deposits with similar mineralogy is a legitimate approach to making water quality predictions for facilities in the same geological setting.
For example, Caruccio and Ferm (1974) first proposed that paleo-environment is an important factor in determining water quality for coal mines because coal seams formed in salt water environments have higher initial sulfur content and are therefore more prone to generation of acid due to the formation of pyrite during lithification.
Recently, Red Chris Development Co. (2005) compiled data for six porphyry copper mine sites in western Canada and found strong similarities between geographically scattered sites despite variations in host rock geology and climate (for example Figure 2). Porphyry deposits form by interaction of hot water with volcanic or plutonic rocks typically in a sub-volcanic environment. The similarities in drainage chemistry reflected the relatively simple sulfide mineralogy of these deposits and the formation of common alumino-silicate alteration minerals.
0.001
0.01
0.1
1
10
100
1000
10000
2 3 4 5 6 7 8 9
pH
Filte
red
Al (
mg/
L)
Island CopperGibraltarMount PolleyHuckleberryKitsault
Figure 2: Strong Correlation between Aluminum Concentrations and pH for Porphyry Copper Deposits in Western Canada (Red Chris Development Co. 2004)

SRK Consulting Waste Rock and Lean Ore Geochemical Characterization Plan Page 24
SJD/sdc 1UP005.001_sample_selection_20060504.SJD.rev02.doc, May. 5, 06, 1:33 PM May 2006
A limitation of these comparisons is that geographical proximity does not always guarantee geological similarity because ore forming processes can vary over short lateral and vertical distances, especially as a result of interaction with different rock types. An example of this limitation is seen at the Mount Washington mine site on Vancouver Island where two nearby pits have strongly acidic copper-bearing and non-acidic arsenic-bearing drainages (SRK 2000). The host rock geology is clearly different though for the two pits.
Based on the experience with site comparisons, there are a number of reasons to indicate that mineral deposits within the Duluth Complex can be compared including:
• Uniform, troctolitic to ultramafic composition of the mineralization and metamorphosed siliclastic footwall rocks (Virginia Formation);
• Relatively simple iron sulfide mineralogy; and
• Magmatic rather than hydrothermal mineral deposit formation.
The latter is particularly important because the ore-forming process in the NorthMet Deposit and nearby occurrences have not altered the associated primary silicate minerals. It is concluded therefore that the water quality data collected from nearby full-scale facilities (such as the Dunka Pit Duluth Complex waste rock dumps) and testwork should be factored into the water quality predictions for the NorthMet Project.
7.3.3 The Empirical Method
Introduction
The Empirical Method is also sometimes referred to as “scale-up calculations” because it involves translation of results from small laboratory or field tests to full-scale facilities. The attraction of this approach is that it involves the use of site-specific laboratory and field data, and does not rely on theoretical calculations. The results are transparent and easily explained. However, a significant issue is that the resulting concentrations are typically excessively conservative. This may be attractive for environmental assessment purposes but the resulting predictions may unreasonably over-predict the need for mitigation measures to address potential water quality impacts. A necessary component of the Empirical Method is the adjustment of resulting predictions to reflect basic geochemical controls and experience from other sites.
There are three main steps in the method:
1. Design of a laboratory program to collect rate information;
2. Calculation of concentrations based on rock mixtures, scale-up factors, and hydrological considerations; and
3. Adjustment of calculated concentrations to reflect geochemical constraints indicated by testwork, thermodynamic constraints and experience.
Additional description of these steps is provided in the following sections.

SRK Consulting Waste Rock and Lean Ore Geochemical Characterization Plan Page 25
SJD/sdc 1UP005.001_sample_selection_20060504.SJD.rev02.doc, May. 5, 06, 1:33 PM May 2006
Laboratory Program
The laboratory program is designed to obtain weathering rates, typically expressed as mass of component released per mass of rock per week. Rates are obtained for all rock types and a range of the characteristics for each rock type. Generally, the objective is to obtain rates that can be correlated with bulk characteristics of the rock so that overall rates can be calculated for mixtures. Examples of strong correlations of sulfur content with sulfate release are common and include MDNR’s humidity cell data (Figure 3). When good correlations are established, the data can be interpolated between points. For example, in Figure 3, although no rate was specifically measured at a sulfur concentration of 0.9%, it is reasonable to use the overall trend to interpolate a rate. Figure 3 also shows that since the correlation indicates no sulfate release if no sulfur is present, it is also reasonable to extrapolate between 0 and 0.2% sulfur.
MDNR 1-Year Humidity Cells
0
5
10
15
20
25
0 0.5 1 1.5
Total S, %
Last
Sul
fate
Rat
e,
mg/
kg/w
eek
BabbittNorthMet
Figure 3: Correlation of Sulfur Content and Sulfate Release for MDNR ASTM Procedure Humidity Cells.
Calculation of Concentrations Using Scale-Up Factors
The purpose of the scale-up calculation is to convert laboratory measured generation rates (R) (for example in mg/kg/week) to seepage concentrations (C) (in mg/L). The scale-up calculations need to consider the rock type mixture, temperature effects, grain size, rock mass, flow path development, and water volume. Pore water concentrations are calculated for each rock type, then mixed according to the proportion of rock types indicated by the mine planners.
Temperature should be considered because oxidation rates decrease as temperatures decreases and vice versa. This correction is typically applied based on the average annual site temperature, and can be calculated using the Arrhenius equation. This equation provides a good approximation of actual

SRK Consulting Waste Rock and Lean Ore Geochemical Characterization Plan Page 26
SJD/sdc 1UP005.001_sample_selection_20060504.SJD.rev02.doc, May. 5, 06, 1:33 PM May 2006
rate decrease observed in laboratory experiments. The laboratory rate (R) is therefore adjusted using a constant factor (kT) to obtain the adjusted rate (Ra):
Ra = R.kT
This correction should be applied cautiously for reactive materials because the sulfide oxidation reaction is exothermic and will offset cooler site conditions.
The next step is to consider particle size effects. There are two issues to consider:
• Oxidation is a surface area phenomenon. A larger surface area provides a greater reactive surface area, and
• Reactive minerals encapsulated in large rock types do not oxidize at the same rate as exposed reactive particles because oxygen must diffuse through a solid rather than a gas.
Figure 4 illustrates the relationship between particle size and surface area for particles occurring as cubes. The graph shows that below a particle size of 0.1 cm, the available surface area increases exponentially. For larger particles, the area contribution is insignificant. Therefore, a standard humidity cell containing -¼” (0.6 cm) material provides a good representation of the surface area of a rock mixture containing much larger particles. For example, in a typical rock mixture containing 5% by weight finer than this size, the particles finer than 0.6 cm can account for 95% of the surface area.
020406080
100
0.001 0.01 0.1 1
Particle Size (cm)
Surf
ace
Area
(m2 /k
g)
Figure 4: Particle Surface Area as a Function of Particle Size for Cubic Particles
The correction for particle size then becomes a ratio of the fine-grained reactive mass (Mr) to the total mass (M):
Ra = R.kT.(Mr/M).
The scale up of rate to full scale is then obtained by multiplying by M to obtain:
Ra’ = R.kT.Mr (in mg/week).

SRK Consulting Waste Rock and Lean Ore Geochemical Characterization Plan Page 27
SJD/sdc 1UP005.001_sample_selection_20060504.SJD.rev02.doc, May. 5, 06, 1:33 PM May 2006
Ra’ is the scale-up of laboratory rate to field rate for total mass; however, it represents production
rather than release because humidity cells are designed to be fully flushed. Under field conditions, the entire rock mass is not flushed due to flow path development. For thin waste rock dumps, flushing is likely to be relatively thorough but as the flow path length increases the degree of flushing decreases (eg Morin 1991; Morin and Hutt 1997). Simple calculations for long flow paths indicate that the proportion flushed may be as low as 20% (Day and Harpley 1992). Ra
’ can therefore be converted to leached mass (L) by multiplying by a flushed proportion (kf):
L = R.kT.Mr. kf (mg/week).
This leached loading can then converted to a concentration (C) by dividing by the volume of infiltrating water (Q):
C = R.kT.Mr.kf/Q (mg/L).
The application of this method to calculation of actual concentrations is illustrated by the following example.
Adjustment of Calculated Concentrations – Example Calculation
Example Dataset
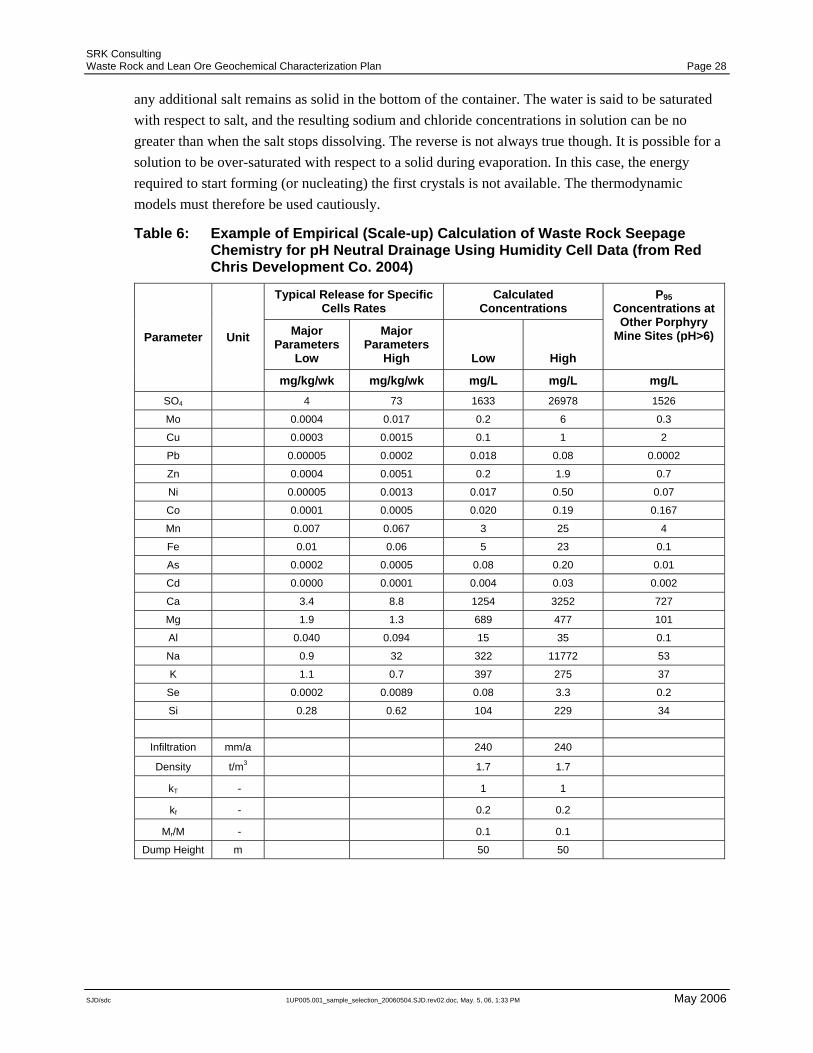
As noted previously, calculation of concentrations using the empirical method often results in unusually high concentrations and it is therefore necessary to evaluate the individual concentrations with consideration of chemical principals and experience from other sites. In order to explain the approach, a recently released dataset from the environmental assessment of a porphyry copper project is used (Red Chris Development Company 2004). For that project, fourteen ASTM-style humidity cells were operated on several rock types which included mineralized quartz diorite and andesitic volcanics and unmineralized siltstones. The resulting calculated average rates from two tests representing a range of conditions are provided in Table 6. The calculation applies to non-acidic drainage.
As an example calculation, concentrations were calculated using an input infiltration rate of 240 mm/year acting on a waste rock dump 50 m high. No temperature correction was applied (kT), but it was assumed that the bulk of the surface area is contained in 10% of the waste rock and that 20% of the rock is actually flushed.
Evaluation and Adjustment of Major Parameters
The first step in evaluation of the calculated scale-up concentrations is to examine the major parameters (sulfate, calcium, magnesium, etc). An appropriate approach is to enter the data into a thermodynamic equilibrium model (such as MINTEQ, PHREEQE). These models can assist with identifying concentrations that are not supportable thermodynamically. For example, when dissolving common salt in a container of water, only a finite amount can be dissolved after which
SRK Consulting Waste Rock and Lean Ore Geochemical Characterization Plan Page 28
SJD/sdc 1UP005.001_sample_selection_20060504.SJD.rev02.doc, May. 5, 06, 1:33 PM May 2006
any additional salt remains as solid in the bottom of the container. The water is said to be saturated with respect to salt, and the resulting sodium and chloride concentrations in solution can be no greater than when the salt stops dissolving. The reverse is not always true though. It is possible for a solution to be over-saturated with respect to a solid during evaporation. In this case, the energy required to start forming (or nucleating) the first crystals is not available. The thermodynamic models must therefore be used cautiously.
Table 6: Example of Empirical (Scale-up) Calculation of Waste Rock Seepage Chemistry for pH Neutral Drainage Using Humidity Cell Data (from Red Chris Development Co. 2004)
Typical Release for Specific Cells Rates
Calculated Concentrations
Major Parameters
Low
Major Parameters
High Low High
P95 Concentrations at
Other Porphyry Mine Sites (pH>6) Parameter Unit
mg/kg/wk mg/kg/wk mg/L mg/L mg/L SO4 4 73 1633 26978 1526
Mo 0.0004 0.017 0.2 6 0.3
Cu 0.0003 0.0015 0.1 1 2
Pb 0.00005 0.0002 0.018 0.08 0.0002
Zn 0.0004 0.0051 0.2 1.9 0.7
Ni 0.00005 0.0013 0.017 0.50 0.07
Co 0.0001 0.0005 0.020 0.19 0.167
Mn 0.007 0.067 3 25 4
Fe 0.01 0.06 5 23 0.1
As 0.0002 0.0005 0.08 0.20 0.01
Cd 0.0000 0.0001 0.004 0.03 0.002
Ca 3.4 8.8 1254 3252 727
Mg 1.9 1.3 689 477 101
Al 0.040 0.094 15 35 0.1
Na 0.9 32 322 11772 53
K 1.1 0.7 397 275 37
Se 0.0002 0.0089 0.08 3.3 0.2
Si 0.28 0.62 104 229 34
Infiltration mm/a 240 240
Density t/m3 1.7 1.7
kT - 1 1
kf - 0.2 0.2
Mr/M - 0.1 0.1
Dump Height m 50 50

SRK Consulting Waste Rock and Lean Ore Geochemical Characterization Plan Page 29
SJD/sdc 1UP005.001_sample_selection_20060504.SJD.rev02.doc, May. 5, 06, 1:33 PM May 2006
In the case of this dataset, the initial evaluation would allow the following example incompatibilities to be assessed:
• Sulfate and calcium concentrations are much higher in the “high” case than would be expected based on the solubility of gypsum. Since gypsum is well known to form readily, the calcium and sulfate concentrations could be adjusted to reflect precipitation of gypsum.
• Aluminum is not soluble at these levels at neutral pH and could be adjusted to reflect the solubility of basic aluminum sulfates.
• Iron may be present at these concentrations but not under well-oxygenated conditions as would be present in a coarse waste rock pile. Iron hydroxides would be expected to form significantly lowering dissolved iron concentrations.
• Alkalinity was not calculated but can be estimated by assuming a carbonate mineral is present.
Downward adjustment of sulfate obviously impacts the charge balance of the water probably leaving a positive imbalance due to the high sodium and potassium concentrations. While this can be rectified by adding another anion (like chloride), the source of that anion needs to be justified (ie. chloride may not be present in the rock).
In summary, the result of the empirical calculation is a set of concentrations for major ions that typically exceed expected values. This indicates that some products of the weathering reactions remain stored in the rock and are not leached by infiltrating processes. This fact can be applied to adjustment of minor and trace parameters.
Evaluation and Adjustment of Minor and Trace Parameters
Evaluation of these parameters is treated separately because they occur at concentrations that are not a major component of the ion balance and with some exceptions occur at concentrations below limits implied by saturation controls. Copper and manganese concentrations in Table 5 are expected to be close to saturation limits for their carbonates and oxides at neutral pH and can therefore be adjusted to reflect the solubility of these minerals.
Other elements, including for example, lead, zinc, nickel cobalt, cadmium and selenium are predicted to be released at concentrations which seem to be “high” based on experience. In some cases, the concentrations are result of scaling up of detection limit values (for example, arsenic and lead). To refine the predictions for the project in the example, a database of seepage chemistry for other similar porphyry copper mine sites was evaluated. The 95th percentile concentrations from the database are shown in Table 7. Comparison of these concentrations to the calculated concentrations indicated that the calculated low-end lead, arsenic, cadmium and selenium concentrations are higher than the database concentrations, and all calculated high end concentrations are greater than the database concentrations. In other words, the empirical calculation is most likely over-estimating the concentrations of the main trace parameters.

SRK Consulting Waste Rock and Lean Ore Geochemical Characterization Plan Page 30
SJD/sdc 1UP005.001_sample_selection_20060504.SJD.rev02.doc, May. 5, 06, 1:33 PM May 2006
The explanation for this effect is probably that these elements are being released as part of weathering processes but remain stored in the rock. The expected retention of iron represents a sink for these elements through sorption processes. Pyrite is the dominant source of iron, and is likely also the source for many trace elements. The ratio of iron to other metals is very high and represents a significant source of sorptive capacity. Since this process is pH dependent, it is expected that metal concentrations would be negatively correlated with pH. An example of this type of relationship used as part of this example is shown in Figure 5. Data for two sites show that nickel concentrations are strongly related to pH. For example, between pH 4 and 7.5, the data from Huckleberry Mine shows a negative correlation with pH. Likewise, the Island Copper Mine dataset shows a good correlation throughout the pH range.
0.0001
0.001
0.01
0.1
1
10
2 3 4 5 6 7 8 9
pH
Filte
red
Ni (
mg/
L)
Island CopperMount PolleyHuckleberry
Figure 5: Example of Relationship Between Nickel Concentrations and pH (Red Chris Development Company 2004).
Example of Combined Empirical and Site Comparison Approach in Alaska
Water quality predictions waste rock and dry stack tailings for the recently permitted Pogo Project in Alaska were obtained using a combination of empirically-calculated concentrations scaled-up from humidity cells adjusted to reflect concentrations observed in groundwater, surface water, leach columns, meteoric water extraction procedures and seepage from a pile of waste rock from underground development.

SRK Consulting Waste Rock and Lean Ore Geochemical Characterization Plan Page 31
SJD/sdc 1UP005.001_sample_selection_20060504.SJD.rev02.doc, May. 5, 06, 1:33 PM May 2006
Documentation from the project can be obtained from:
http://www.dnr.state.ak.us/mlw/mining/largemine/pogo/
7.3.4 Implementation for the NorthMet Project
The proposed overall approach is comparable to the combined empirical and site comparisons approach described in the example above. The initial empirical calculation will be based on interpolation and extrapolation of humidity cell results with adjustments for major parameters based on thermodynamic equilibrium calculations and reference to concentrations measured in test pile and waste rock pile drainage.
Scale-up of low concentrations of nickel and cobalt in the non-reactive rock category (sulfur less than 0.05%) is expected to require additional data since the majority of testwork to date has been focused on “reactive” rock containing higher concentrations of sulfur. Since drainage from non-reactive materials is expected to be non-acidic, reliable relationships that indicate correlations between metal concentrations and pH (for example, as shown in Figure 3 and see also Norecol Dames & Moore 1996) may be used to predict metal concentrations. The limitation of the current dataset is that nickel can be expected to be very mobile under non-acidic conditions when the metal to iron ratio is high (for example, if pentlandite is present). A distinctive water quality dataset is needed for low sulfur rock piles. The following approaches may be considered:
• Sampling of seepage from existing Duluth Complex waste rock piles or rock exposures known to contain low concentrations of sulfur.
• Evaluation of oxide coatings to understand the attenuation of metals and comparison with loads leached from humidity cells. Generally speaking, sulfate is conservative in slowly reactive humidity cells, therefore if the nickel to sulfur ratio is lower in the leachate than the sulfide minerals, then nickel is being attenuated (assuming that nickel originates from oxidation of sulfides). Likewise, comparison of iron and nickel release with iron and nickel ratios in sulfides and oxides coatings will indicate how nickel is attenuated relative to iron.
7.4 Conclusions
An empirical scale-up approach is proposed to translate weathering rates observed in humidity cells to full-scale concentrations. The resulting predicted concentrations will be evaluated and adjusted based on solubility constraints and data from existing monitoring. The incorporation data from past or existing waste rock facilities (AMAX test piles, Dunka Pit waste rock) ensures that the predictions are consistent with large scale operational experience. Additional testing may be designed to evaluate mobility and attenuation of metals such as nickel and cobalt.

SRK Consulting Waste Rock and Lean Ore Geochemical Characterization Plan Page 32
SJD/sdc 1UP005.001_sample_selection_20060504.SJD.rev02.doc, May. 5, 06, 1:33 PM May 2006
8 References Caruccio, F.T., and Ferm, J.C., 1974. Paleoenvironment-Predictor of acid mine drainage problems: National Coal Association/ Bituminous Coal Research Inc., 5th Symposium on Coal Mine Drainage Research, Louisville, Ky., p. 5-9.
Day, S.J. and Harpley, D.H., 1992. Physical flow in waste rock dumps and implications for predicting leachate quality. Proceedings of the 17th Annual B.C. Mine Reclamation Symposium, Port Hardy, B.C., May 1993. p. 233. (Abstract).
Day, S. and Rees, B. 2005. Geochemical controls on waste rock dump seepage chemistry at several porphyry mines in the Canadian Cordillera. Accepted for presentation at the 7th International Conference on Acid Rock Drainage.
Mine Environment Neutral Drainage Program, (1991). Acid Rock Drainage Prediction Manual. Mine Environment Neutral Drainage Program. Report 1.16.1b.
Mine Environment Neutral Drainage Program, 1995. Critical Review of Geochemical Processes and Geochemical Models Adaptable for Prediction of Acidic Drainage from Waste Rock. Report 1.42.1. April 1995.
Mine Environment Neutral Drainage Program, 2000. MEND Manual – Prediction. Volume 3. Report 5.4.2c. December 2000.
Morin, K., 1991. Critical Literature Review of Acid Drainage from Waste Rock, April 1991. Mine Environment Neutral Drainage Program Report 1.11.1.
Morin, K. and Hutt, N., 1997. History of Eskay Creek Mine's Waste-Rock Dump from Placement to Disassembly, May 1997. Mine Environment Neutral Drainage Program Report 1.44.1.
Norecol Dames & Moore, 1996. Guide for Predicting Water Chemistry from Waste Rock Piles, July 1996.
Red Chris Development Company, 2004. Application for Environmental Assessment Certificate for the Red Chris Porphyry Project (October 2004). http://www.eao.gov.bc.ca/epic/output/html/deploy/epic_document_238_19374.html
SRK Consulting, 2000. Hydrogeological and Hydrological Evaluations for Development of Remediation Options for Mt. Washington, Courtenay, B.C. SRK Report 1CE002.00. Report prepared for Environment Canada.

Appendix A Parameter Lists and Detection Limits for Analysis of Solids

ALS/CHEMEX METHOD CODE ITEM UINTS CHEMEX DETECTION LIMITME-ICP61 (four acid) CU% % 0.001ME-ICP61 (four acid) NI% % 0.001
S-IR08 (LECO SULFUR) S%TOT % 0.01ME-ICP61 (four acid) S%ICP % 0.01
PGM-ICP23 (30 GRAM) PT_PPB PPB 5PGM-ICP23 (30 GRAM) PD_PPB PPB 1PGM-ICP23 (30 GRAM) AU_PPB PPB 1ME-ICP61 (four acid) CO_PPM PPM 1ME-ICP61 (four acid) AG_PPM PPM 0.5ME-ICP61 (four acid) ZN_PPM PPM 2ME-ICP61 (four acid) CD_PPM PPM 0.5ME-ICP61 (four acid) MO_PPM PPM 1ME-ICP61 (four acid) PB_PPM PPM 2ME-ICP61 (four acid) AS_PPM PPM 5ME-ICP61 (four acid) CR_PPM PPM 1ME-ICP61 (four acid) V_PPM PPM 1ME-ICP61 (four acid) TI% % 0.01ME-ICP61 (four acid) AL% % 0.01ME-ICP61 (four acid) CA% % 0.01ME-ICP61 (four acid) FE% % 0.01ME-ICP61 (four acid) K% % 0.01ME-ICP61 (four acid) NA% % 0.01ME-ICP61 (four acid) MG% % 0.01ME-ICP61 (four acid) MN_PPM PPM 5ME-ICP61 (four acid) P_PPM PPM 10ME-ICP61 (four acid) BA_PPM PPM 10ME-ICP61 (four acid) BE_PPM PPM 0.5ME-ICP61 (four acid) BI_PPM PPM 2ME-ICP61 (four acid) SB_PPM PPM 5ME-ICP61 (four acid) SR_PPM PPM 1ME-ICP61 (four acid) W_PPM PPM 10

ALS/CHEMEX METHOD CODE ITEM UINTS CHEMEX DETECTION LIMIT
ME-ICP41 (Aqua regia digestion) CU% % 0.001ME-ICP41 (Aqua regia digestion) NI% % 0.001ME-ICP41 (Aqua regia digestion) S%ICP % 0.01ME-ICP41 (Aqua regia digestion) CO_PPM PPM 1ME-ICP41 (Aqua regia digestion) AG_PPM PPM 0.2ME-ICP41 (Aqua regia digestion) ZN_PPM PPM 2ME-ICP41 (Aqua regia digestion) CD_PPM PPM 0.5ME-ICP41 (Aqua regia digestion) MO_PPM PPM 1ME-ICP41 (Aqua regia digestion) PB_PPM PPM 2ME-ICP41 (Aqua regia digestion) AS_PPM PPM 2ME-ICP41 (Aqua regia digestion) CR_PPM PPM 1ME-ICP41 (Aqua regia digestion) V_PPM PPM 1ME-ICP41 (Aqua regia digestion) TI% % 0.01ME-ICP41 (Aqua regia digestion) AL% % 0.01ME-ICP41 (Aqua regia digestion) CA% % 0.01ME-ICP41 (Aqua regia digestion) FE% % 0.01ME-ICP41 (Aqua regia digestion) K% % 0.01ME-ICP41 (Aqua regia digestion) NA% % 0.01ME-ICP41 (Aqua regia digestion) MG% % 0.01ME-ICP41 (Aqua regia digestion) MN_PPM PPM 5ME-ICP41 (Aqua regia digestion) P_PPM PPM 10ME-ICP41 (Aqua regia digestion) B_PPM PPM 10ME-ICP41 (Aqua regia digestion) BA_PPM PPM 10ME-ICP41 (Aqua regia digestion) BE_PPM PPM 0.5ME-ICP41 (Aqua regia digestion) BI_PPM PPM 2ME-ICP41 (Aqua regia digestion) GA_PPM PPM 10ME-ICP41 (Aqua regia digestion) HG_PPM PPM 1ME-ICP41 (Aqua regia digestion) LA_PPM PPM 10ME-ICP41 (Aqua regia digestion) SB_PPM PPM 2ME-ICP41 (Aqua regia digestion) SC_PPM PPM 1ME-ICP41 (Aqua regia digestion) SR_PPM PPM 1ME-ICP41 (Aqua regia digestion) W_PPM PPM 10ME-ICP41 (Aqua regia digestion) TL_PPM PPM 10ME-ICP41 (Aqua regia digestion) U_PPM PPM 10
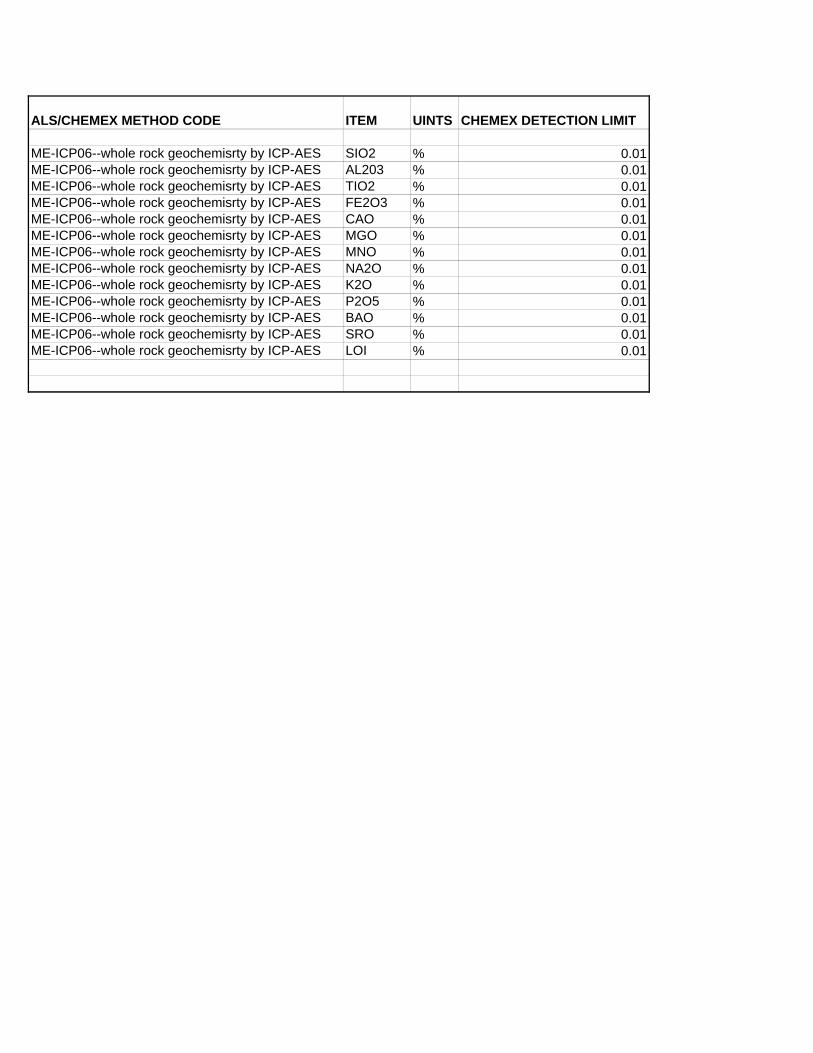
ALS/CHEMEX METHOD CODE ITEM UINTS CHEMEX DETECTION LIMIT
ME-ICP06--whole rock geochemisrty by ICP-AES SIO2 % 0.01ME-ICP06--whole rock geochemisrty by ICP-AES AL203 % 0.01ME-ICP06--whole rock geochemisrty by ICP-AES TIO2 % 0.01ME-ICP06--whole rock geochemisrty by ICP-AES FE2O3 % 0.01ME-ICP06--whole rock geochemisrty by ICP-AES CAO % 0.01ME-ICP06--whole rock geochemisrty by ICP-AES MGO % 0.01ME-ICP06--whole rock geochemisrty by ICP-AES MNO % 0.01ME-ICP06--whole rock geochemisrty by ICP-AES NA2O % 0.01ME-ICP06--whole rock geochemisrty by ICP-AES K2O % 0.01ME-ICP06--whole rock geochemisrty by ICP-AES P2O5 % 0.01ME-ICP06--whole rock geochemisrty by ICP-AES BAO % 0.01ME-ICP06--whole rock geochemisrty by ICP-AES SRO % 0.01ME-ICP06--whole rock geochemisrty by ICP-AES LOI % 0.01

Appendix B Options and Variance in ASTM Humidity Cell Procedure

NorthMet Project Description of ASTM D 5744 – 96 (Reapproved 2001) and Modifications Page 1 Standard Test Method for Accelerated Weathering of Solid Materials Using a Modified Humidity Cell July 8, 2005
SRK Consulting
9. Sample Preparation Section ASTM Procedure Description Description of CEMI Procedure
NA – Not applicable to this Project ASTM – ASTM Procedure Followed
CEMI Variance from ASTM
9.1 Air dry as-received bulk samples of solid material to prevent the additional oxidation of reactive minerals or compounds. If air drying is not practicable, oven dry the solid material at a maximum temperature of 50 ± 2°C for 24 h, or until a constant weight is reached.
Samples were air-dried at room temperature (~ 20 °C).
9.1.1 If exploration-generated or run-of-mine solid material samples are not readily available, archived dried and crushed samples from geological exploratory or development drilling programs may be used for preliminary evaluations of ore and waste rock from new operations; this is provided that the available solid material samples are not significantly finer than 95 % passing a No. 12 (1.7-mm) sieve. Document the sample drying and preparation procedures used during the drill sampling program in order to interpret the results properly. Evaluate the effects of drying temperature on metals volatilization (for example, mercury in cinnabar vaporizes at temperatures exceeding 80 to 90°C) and mineral morphology and chemistry modifications (for example, on heating at temperatures exceeding 100°C, chalcocite changes crystal form and is oxidized subsequently from Cu2S to CuO, CuSO4, and SO2). Especially ensure that the effects of particle size distribution changes resulting from the more finely crushed sample are considered in the interpretation (this is, the potential for increased liberation of acid-producing and acid-consuming minerals with an attendant increase in mineral surface area).
NA
9.1.2 In mining waste evaluations, the particle size for mill tailings will be significantly finer (commonly less than 150 µm/100 mesh) than the particle size distributions from ore and waste rock. Pilot plant tailings should be used if mill tailings are not available.
NA
9.2 Screen the air-dried bulk samples through a 6.3-mm (¼-in.) screen in accordance with Test Method E 276. Crush any oversize material so that 100 % passes the screen.
ASTM

NorthMet Project Description of ASTM D 5744 – 96 (Reapproved 2001) and Modifications Page 2 Standard Test Method for Accelerated Weathering of Solid Materials Using a Modified Humidity Cell July 8, 2005
SRK Consulting
Section ASTM Procedure Description Description of CEMI Procedure NA – Not applicable to this Project ASTM – ASTM Procedure Followed
CEMI Variance from ASTM
Note 7 Caution: Recent accelerated weathering studies of run-of mine waste rock from metal mines demonstrate that crushing a bulk sample so it passes a 6.3-mm (¼-in.) screen may change the character of the sample by artificially increasing liberation and consequent surface areas of acid-producing and acid-consuming minerals contained in the + 6.3-mm (¼-in.) material. A suggestion for avoiding this problem is to segregate the - 6.3-mm (¼-in.) fraction by screening rather than crushing, and to test that fraction according to the protocol and equipment described in this text. The + 6.3-mm (¼-in.) material can be tested separately (for example, Brodie, et al (10) describe a large-scale humidity cell test that would accommodate – 75-mm material). Samples from the drill core and cuttings also present material sizing problems, which must be considered when interpreting drill core and cuttings accelerated data. The drill core must be crushed to -6.3-mm (¼-in.) to fit the cell described in this test method. The resulting size distribution from crushing will differ from that of run-of-mine due to differences in fracture patterns inherent to blasting practices that produce run-of-mine material. By contrast, drill cuttings size fractions are commonly less than 6.3-mm (¼-in.) due to the rotary-percussive nature of obtaining the sample.
NA

NorthMet Project Description of ASTM D 5744 – 96 (Reapproved 2001) and Modifications Page 3 Standard Test Method for Accelerated Weathering of Solid Materials Using a Modified Humidity Cell July 8, 2005
SRK Consulting
Section ASTM Procedure Description Description of CEMI Procedure NA – Not applicable to this Project ASTM – ASTM Procedure Followed
CEMI Variance from ASTM
9.3 Mix and divide the bulk sample to obtain a representative test unit with a weight in the range of 8 to 10 kg, using a riffle splitter with 1-in. (2.54-cm) chutes. Divide the test unit into eight nominal 1-kg specimens. Seal each test specimen in a moisture-barrier bag.
Samples mixed by riffle splitter, but different sample weights were available (see column at the right).
All material available for each sample was mixed by the riffle splitter (0.552 kg – 10.54 kg). The test unit was divided into the following amounts: Samples received June 06, 2005 (lean ore): 150 – 200 g for Chemex Assay; Reject for archive, screen assay, etc. Samples received May 20, 2005 (waste rock): 200 g for Chemex Assay, 50 g of crushed archive, 100 g for screen assay, store rejects for HC
Note 8 The dried sample should be mixed through the riffle splitter at least once before making any splits; recombine the splits resulting from the sample mixing exercise by pouring individual splits either over each other or through the splitter again. Once the actual split is made, it is wise to re-mix it (according to the above procedure) prior to making the next split.
Samples were mixed through the riffle splitter once.
9.4 Select one test specimen at random, and determine the moisture content by weighing and drying to constant weight at 80 ±5°C.
Determined at 20 °C
9.4.1 Crush the dried test specimen so that at least 95 % passes a 1.7-mm (10-mesh) screen, in accordance with Test Method E 276.
See 9.3
9.4.2 Divide the crushed test specimen in half twice, using a riffle splitter with 6.35-mm (¼-in.) chutes, and select a ¼ subsample at random.
See 9.3
9.4.3 Transfer the selected subsample to a ring and puck grinding mill and grind to a nominal of 95 % passing a 150-µm (100-mesh) screen, in accordance with Test Method E 276. Use the subsample for chemical and mineralogical characterization of the test unit.
See 9.3

NorthMet Project Description of ASTM D 5744 – 96 (Reapproved 2001) and Modifications Page 4 Standard Test Method for Accelerated Weathering of Solid Materials Using a Modified Humidity Cell July 8, 2005
SRK Consulting
Section ASTM Procedure Description Description of CEMI Procedure NA – Not applicable to this Project ASTM – ASTM Procedure Followed
CEMI Variance from ASTM
9.5 Select one test specimen at random, and determine the particle size distribution in accordance with Test Method E 276.
100 g were removed after 9.3 for screen assays: -1/4" + 10 mesh, -10 mesh + 35 mesh, -35 mesh + 100 mesh, -270 mesh; each size was weighed and submitted to Chemex for Total S (S-IR08) and four acid digestion (ME-ICP61).
9.6 Select one test specimen at random for use in the accelerated test method. Divide the test specimen into four nominal 250-g subsamples using the riffle splitter with 25.4-mm (1-in.) chutes, and label and store in vapor-barrier bags until it is time to load the humidity cells.
See 9.3 - variance column
9.7 Reserve the remaining test specimens for replicated testing or to resolve disputed results.
See 9.3 - variance column

NorthMet Project Description of ASTM D 5744 – 96 (Reapproved 2001) and Modifications Page 5 Standard Test Method for Accelerated Weathering of Solid Materials Using a Modified Humidity Cell July 8, 2005
SRK Consulting
10. Apparatus Assembly Section ASTM Procedure Description Description of CEMI Procedure
NA – Not applicable to this Project ASTM – ASTM Procedure Followed
CEMI Variance from ASTM
10.1 The humidity cells are table-mounted at a height sufficient to accommodate the placement of both the humidifier and one Erlenmeyer flask for effluent collection from the bottom of each cell. During the water-saturated and dry-air portions of each weekly cycle, feed air is metered to the bottom of each cell at the selected rate (1 to 10L/min). Feed air for the three-day dry–air portion is routed first through a desiccant column and then to each of the cells through a dry-air manifold. Feed air for the water-saturated air portion is routed through a water-filled humidifier by means of aeration stones or gas dispersion fritted cylinders/disks, and then to each humidity cell lid air exit port to prevent the short circuiting of air through cells containing more permeable solid material samples. A separatory funnel rack is mounted on the table that holds the cells if the weekly water leach is applied dropwise (drip trickle). Multiple separatory funnels (one for each cell) are held in the rack during the drip trickle leach that is performed on the seventh day of each weekly cycle. The separatory funnel can be used to meter the required water volume slowly down the sides of the cell wall until the sample is flooded if the weekly leach is to be a flooded leach.
Humidity cells are constructed of acrylic tubing with an inside diameter of four inches and an overall height of twelve inches, with an acrylic base plate. The base plate is glued to the tube and threaded with a nylon hose adapter to which a length of tubing is attached to allow for leachate drainage into a collection container. A perforated PVC support plate is positioned inside the cell, one inch above the base plate and covered with six layers of nylon mesh. A nylon adapter is threaded into the side of the cell between the support plate and the base plate and a length of tubing was connected from the side adapter to the humidifier to facilitate the inflow of humid air to the cell. A dry air line is also connected to each cell. Each cell is covered with a removable acrylic lid.
Approximately 16 cells per humidifier Flood leaching: peristaltic pump using a peristaltic pump Temperature: 20 ± 2°C. Feed air rate to be determined.

NorthMet Project Description of ASTM D 5744 – 96 (Reapproved 2001) and Modifications Page 6 Standard Test Method for Accelerated Weathering of Solid Materials Using a Modified Humidity Cell July 8, 2005
SRK Consulting
11. Procedure Section ASTM Procedure Description Description of CEMI Procedure
NA – Not applicable to this Project ASTM – ASTM Procedure Followed
CEMI Variance from ASTM
11.1 Cell Loading: 11.1.1 If more than one humidity cell is used at one time, label each with a
sequential number, and use the same number for the matching collection vessel (Erlenmeyer flask).
ASTM
11.1.2 Weigh each humidity cell (without its lid) and each collection vessel; record the tare weights of each to the nearest 0.1 g.
ASTM
11.1.3 Cut the filter media (such as 12-oz/yd2 polypropylene described in 6.11) to the humidity cell’s inside diameter dimensions so that it fits snugly yet lies flat on the perforated support.
PVC perforated disk & nylon mesh
11.1.4 Re-weigh the humidity cell, and record the resulting tare to the nearest 0.1 g; the original cell tare (11.1.2) minus the new cell tare is the weight of the filter media.
ASTM
11.1.5 Transfer the contents from each of the four bags containing the 250-g samples (9.6) into the humidity cell. Prior to the transfer, mix the contents of each bag by gentle rolling to eliminate possible stratification that may have occurred during sample storage.
ASTM
11.1.6 Re-weigh the loaded cell, and record the weight to the nearest 0.1 g; the loaded cell weight minus the combined cell and filter-media tare weight is the weight of the sample charge.
ASTM
11.2 First Leach:

NorthMet Project Description of ASTM D 5744 – 96 (Reapproved 2001) and Modifications Page 7 Standard Test Method for Accelerated Weathering of Solid Materials Using a Modified Humidity Cell July 8, 2005
SRK Consulting
Section ASTM Procedure Description Description of CEMI Procedure NA – Not applicable to this Project ASTM – ASTM Procedure Followed
CEMI Variance from ASTM
11.2.1 The first leach (whether drip trickle or flooded), designated as the Week 0 leach, initiates the 20-week long humidity cell test and establishes the starting or initial characteristics of the leachate. Either a 500-mL or 1-L volume of water may be used for the weekly leachates, depending on the weekly pore volume desired or the quantity of solution required for analytical purposes; however, once a weekly volume has been selected, that weekly volume must remain constant throughout the 20-week testing period. A centrifuged cell culture of Thiobacillus ferrooxidans may be used in the first leach in order to ensure that optimum conditions for accelerates weathering are present at the beginning of the test.
500 mL Flood Leach
Note 9 In the testing of mining wastes, cation (including metals and trace metals) and anion loadings are commonly high in the Week 0 leachate due to the dissolution of pre-existing soluble oxidation salts present in the sample prior to sample collection. The average number of weekly accelerated weathering cycles required to flush these pre-existing salts ranges from 3 to 5 weeks. Oxidation products observed during these 3 to 5 weeks are principally from the pre-existing salts, while those products observed after this period are considered to be solely a function of the accelerated weathering procedure. A method for estimating the amount of pre-existing oxidation salts present in a solid material sample is described by Sobek, et al (6). A comparison of estimated salt storage data obtained using this method with the first thee weeks of humidity cell effluent loadings from three different samples is describes by White and Jeffers (7).
NA
11.2.2 Fill a separatory funnel with for each cell with de-ionized water using a volumetric flask. If the leach is to be performed using the drip trickle method, set each separatory funnel above its corresponding cell, and adjust the drip rate (approximately 3 to 4 L/min) so that the solid material sample is wetted thoroughly but not flooded.
NA
11.2.3 A minimum of 2 to 3 h is commonly required to complete the drip trickle leach.
NA

NorthMet Project Description of ASTM D 5744 – 96 (Reapproved 2001) and Modifications Page 8 Standard Test Method for Accelerated Weathering of Solid Materials Using a Modified Humidity Cell July 8, 2005
SRK Consulting
Section ASTM Procedure Description Description of CEMI Procedure NA – Not applicable to this Project ASTM – ASTM Procedure Followed
CEMI Variance from ASTM
11.2.4 If the leach is to be performed by flooding, the separatory funnel can be used to meter the selected water volume slowly down the sides of the cell wall until the sample is flooded. This application method reduces hydraulic agitation of the sample surface commonly caused by pouring liquid from an open-mouthed vessel. Alternatively, flooding may be accomplished by any application apparatus (for example, a peristaltic pump) that supplies the selected volume of leachant at a reasonable rate without causing agitation and suspension of the finer fractions contained in the sample charge.
ASTM
11.2.4.1 Allow the flooded cell to sit for a period of 1 h before draining the leachate into the Erlenmeyer collection flask. The 1-h leach time commences after all of the leachant has been placed in the cell. The solid material sample should be saturated and covered with leachant to a depth sufficient to maintain sample saturation. In testing mining wastes, the observed depth of leachant cover from a 500-mL flooded leach performed in 10.2-cm (4.0-in.) ID cells is approximately 2.5 cm (1.0 in.).
ASTM
11.2.5 The following is performed once the leaching process has been completed: to reduce the effects of evaporation, and to prevent the contamination of each cell by airborne contaminants, place the lids on their corresponding cells and let the cells complete the leachate draining process for the remainder of the leaching day and overnight.
ASTM
11.2.6 Disconnect the cells on the day following the leach, and weigh and record the weight of each cell and Erlenmeyer collection flask. Set each filled collection flask aside for leachate analyses. (Measurements of pH and Eh and sample preservation procedures must be performed as soon as possible after leachate collection.) Return each cell, replace the filled collection flasks with clean, tared Erlenmeyer flasks, hook up all connections, and begin the dry-air cycle.
ASTM
11.3 Dry-Air Cycle:

NorthMet Project Description of ASTM D 5744 – 96 (Reapproved 2001) and Modifications Page 9 Standard Test Method for Accelerated Weathering of Solid Materials Using a Modified Humidity Cell July 8, 2005
SRK Consulting
Section ASTM Procedure Description Description of CEMI Procedure NA – Not applicable to this Project ASTM – ASTM Procedure Followed
CEMI Variance from ASTM
11.3.1 The commencement of the three-day dry-air period marks the beginning of each new weekly cycle of the accelerated weathering humidity cell test; the first full-week cycle after the first leaching is designated Week 1; subsequent weeks (commencing with the second dry-air period) are designated as Week 2, Week 3 … . Week n, etc.
ASTM
11.3.2 To perform the dry-air cycle, feed air is metered to the humidity cell array with a flowmeter (see 6.3) set at a target rate in the range of 1 to 10 L/min per cell, depending on the objectives of the testing. The air flow rate must be checked daily and adjusted to the target value ± 0.5 L/min.
ASTM
11.3.3 Feed air from the flowmeter is routed first through a desiccant column and then to each of the sells through a dry-air manifold. Air exiting the desiccant column should have a relative humidity of less than 10 % as measured with a hygrometer (see 6.23).
ASTM
11.3.4 To maintain similar positive air pressure through the cells, attach a water-bubbling vessel to each humidity cell air exit port coming out of the humidity cell lid; a 50-mL Erlenmeyer flask with a rubber stopper containing a vent and air inlet tube serves as a simple and efficient bubbler.
ASTM
11.3.5 The dry air is passed through each humidity cell for three days. Air flow rates from each of the cells should be checked each day, recorded, and adjusted, if necessary. See also Note 10.
ASTM
11.4 Wet-Air Cycle: 11.4.1 The three-day wet-air period commences on the fourth day of each
weekly cycle. ASTM
11.4.2 To perform the wet-air cycle of the method, feed air is routed through a water-filled humidifier via aeration stones or gas dispersion fritted cylinders/disks and then to each humidity cell.
ASTM
11.4.3 The water temperature in the humidifier is maintained at 30 ± 2°C to ensure that the sparged air maintains a relative humidity of approximately 95 % as measured with a hygrometer (see 6.23) from one of the humidifier exit lines. Air flow rates to each of the cells should be checked each day, recorded, and adjusted, if necessary.
ASTM

NorthMet Project Description of ASTM D 5744 – 96 (Reapproved 2001) and Modifications Page 10 Standard Test Method for Accelerated Weathering of Solid Materials Using a Modified Humidity Cell July 8, 2005
SRK Consulting
Section ASTM Procedure Description Description of CEMI Procedure NA – Not applicable to this Project ASTM – ASTM Procedure Followed
CEMI Variance from ASTM
Note 10 It is good practice to measure the air flow rates and relative humidity of the air exiting each humidity cell during each day of the three-day dry- and wet-air periods; the measurements should be taken at the same time each day from the humidity cell air exit port; these measurements can be accomplished by installing a quick-disconnect fitting in the tubing that connects the air exit port to the bubbler.
NA
Note 11 Coals spoils in eastern states are commonly saturated; Caruccio (10) has suggested the following geographic control alternative to the dry-air versus saturated-air scheduling: (1) Eastern States Samples – Six days of saturated air (versus three days dry/three days wet); and (2) Western States Samples – Three days dry/three days wet.
NA
11.5 Subsequent Weekly Leaches: 11.5.1 A second leach with water is performed on the day following the end
of the three-day wet-air period (that is, day seven of the first weekly cycle). This leach marks the end of the first weekly cycle and is designated as the Week 1 leach.
ASTM
11.5.2 Subsequent leaches are designates as Week2, Week 3 … Week n, and they mark the end of the weekly cycle for that numbered week. Perform each weekly leach as described in 11.2.2 – 11.2.5. Weekly weighing of the test cells is optional.
ASTM No weekly weighing of the cells.
11.6 It is recommended that the weekly accelerated weathering cycles described in 11.2, 11.3, 11.4 and 11.5 be performed for a minimum of 20 weeks.
ASTM
Note 12 Additional weeks of accelerated weathering may be required to demonstrate the nature of the material, depending on the chemical composition of the solid material. For some metal mining wastes, researchers have shown that as much as 60 to 120 weeks of accelerated weathering data may be required to demonstrate the complete weathering characteristics of a particular sample (7, 12). The criteria for ending the testing may be site specific and should be agreed before initiating the testing.
ASTM
11.7 Leachate Analyses:

NorthMet Project Description of ASTM D 5744 – 96 (Reapproved 2001) and Modifications Page 11 Standard Test Method for Accelerated Weathering of Solid Materials Using a Modified Humidity Cell July 8, 2005
SRK Consulting
Section ASTM Procedure Description Description of CEMI Procedure NA – Not applicable to this Project ASTM – ASTM Procedure Followed
CEMI Variance from ASTM
11.7.1 Analyze the leachates for specific constituents or properties, or use them for biological testing procedures as desired, using (1) appropriate ASTM test methods or (2) methods accepted for the site where disposal will occur. Where no appropriate ASTM test method exists, other test methods may be used and recorded in the report, provided that they are sufficiently sensitive to assess potential water quality impacts at the proposed disposal site. Suggested minimum weekly analyses should include pH, Eh, conductivity, and selected metals could be analyzed less frequently (for example, at Weeks 0, 1, 2, 4, 8, 12, 16, and 20), especially if changes in leachate chemistry are slow. Whether visible phase separation during storage of the leachates occurs or not, appropriate mixing should be used to ensure the homogeneity of the leachates prior to their use in such analyses.
At the end of weekly cycle the volume of leachate collected is recorded. The leachate is filtered through a Gelman magnetic filter funnel fitted with a membrane filter with pore size of 0.45 microns and analyzed for the parameters listed in Table 2 of the RFP. Filtered leachate samples will be submitted to ALS Environmental/Cantest Ltd. for dissolved metals analysis as requested in Table 4 of the Waste Rock and Lean Ore Geochemical Characterization Plan. Conductivity, Eh, and pH are measured in the CEMI laboratory using standard procedures. An aliquot of filtered leachate is titrated with standardized sulphuric acid to pH 4.5 to calculate total alkalinity. Standardized sodium hydroxide is used to titrate an aliquot of leachate to pH 4.5 and to pH 8.3 to calculate total acidity. Analysis frequency: pH, cond, Eh every cycle; SO4, Cl, F, alkalinity, TIC, acidity cycle 0, 2, 4, 6 etc.; ICP-MS including Hg and Si cycle 0, 4, 8, 12, etc., ICP-ES including Si cycle 2, 6, 10, 14, etc.
11.7.2 Table 1 is an example of a spreadsheet format used for recording 20 weeks of leachate analytical data.
ASTM
11.7.3 Fig. 5 is an example of a method used to plot the temporal variation (by week) of leachate pH, sulfate load, and cumulative sulfate load from 21 weeks of accelerated load and release rates).
ASTM
11.8 Weathered Solid Material Analyses:

NorthMet Project Description of ASTM D 5744 – 96 (Reapproved 2001) and Modifications Page 12 Standard Test Method for Accelerated Weathering of Solid Materials Using a Modified Humidity Cell July 8, 2005
SRK Consulting
Section ASTM Procedure Description Description of CEMI Procedure NA – Not applicable to this Project ASTM – ASTM Procedure Followed
CEMI Variance from ASTM
11.8.1 Weigh the humidity cell after collection of the final effluent and completion of a three-day dry-air period.
ASTM
11.8.2 Transfer the weathered residue and filter media to a clean drying pan, and dry to constant weight at 50 ± 5°C. Record the final weight.
ASTM
Note 13 Perform any gross sample examination (for example, sample texture and weathering product mineralogic characterization) desired for the weathered residues prior to pulverization. To facilitate such an examination, empty the humidity cell contains into a clean drying pan carefully by pushing gently on the bottom of the perforated plate with a wooden dowel until the sample exits the cell mouth. The perforate plate is accessed through the humidity cell drain port.
NA
11.8.3 Identify and mark the top versus bottom portions of the sample for gross sampling purposes. Formations of cemented lumps of sample termed “ferricrete” that result from the accelerated weathering process arte common in iron-sulfide-mineral rich samples. Depending on the sample mineralogy, the degree of “ferricrete” cementation may vary vertically within the sample, and the investigator may wish to segregate the sample into upper, middle, and lower thirds to document and characterize such changes.
Procedure to be determined
11.8.4 After drying to constant weight and prior to splitting, use an instrument such as a rolling pin to break up cemented lumps in the sample (if the cemented lumps cannot be sufficiently reduced to pass through the chutes of a riffle splitter, remove, record, and weigh separately):
ASTM
11.8.4.1 Split the sample into halves using a riffle splitter with 2.54-cm (1-in.) chutes, and reserve one half to determine the particle size distribution in accordance with Test Method E 276.
Repeat same screen assay method as for pre-test characterization (s.9.5)
11.8.4.2 Split the remaining half sample into two quarters using a riffle splitter with 2.54-cm (1-in.) chutes, and submit one quarter for mineralogical characterization; pulverize the other quarter in either a ring-and-puck or disk-pulverizing machine to 95 % passing a 150-µm (100-mesh) screen in accordance with Test Method E 276.
Procedure to be determined

NorthMet Project Description of ASTM D 5744 – 96 (Reapproved 2001) and Modifications Page 13 Standard Test Method for Accelerated Weathering of Solid Materials Using a Modified Humidity Cell July 8, 2005
SRK Consulting
Section ASTM Procedure Description Description of CEMI Procedure NA – Not applicable to this Project ASTM – ASTM Procedure Followed
CEMI Variance from ASTM
11.8.5 Mix the pulverized residue in a blender or on a rolling cloth. Use the prepared residue for chemical characterization and for comparison with the pre-weathered solid material sample.
Procedure to be determined

Appendix C Design of MDNR Reactor
1
Day, Stephen
From: Kim Lapakko [[email protected]]Sent: Tuesday, May 17, 2005 9:55 AMTo: Stephen DayCc: Dave Antonson; Jennifer Engstrom; Paul EgerSubject: RE: Small reactor
Attachments: MN DNR psize methods 050517.doc
MN DNR psize methods 050517.do..
Steve,
Attached is a description of the reactors, masses, and rinse volumes used for various sizefractions of Duluth Complex rock in our particle size experiment. As indicated in the attachment, I won't have access to the trace metal data from that experiment until tomorrow. I will need to examine this to help evaluate the expected metal concentrations in drainage relative to detection limits. I'm not sure it will give us as much as hoped because the sulfur contents of the samples typically were on the order of 0.9% to 1.3%. This may make extrapolation by more than an order of magnitude tenuous. It will be another pertinent piece of information.
Kim
>>> "Stephen Day" <[email protected]> 5/17/2005 11:18:50 AM >>>Dave
A design drawing should be fine along with description of the procedure.
The main question is what do you do to scale-up the sample mass as the particle size increases? I want to copy your procedure exactly.
ThanksSteve.
-----Original Message-----From: Kim Lapakko [mailto:[email protected]]Sent: Tuesday, May 17, 2005 8:38 AMTo: Stephen DayCc: Dave AntonsonSubject: Small reactor
Steve,
Dave Antonson will email a figure depicting our small reactor, along with some design details (perforated plate, adehesive, filter). He could also send a reactor. Please contact him directly, with an address to send it, if you think that would be helpful.
Kim

17 May 2005 Steve, In our particle size tests we used a small reactor and 75-g mass for particle sizes of –270, +270/-100, and +100/-35 mesh. We used the ASTM cell and 1000-g mass for +35/-10, +10/-0.25 inch, and +0.25/-0.75 inch particle sizes. For rinse volumes, we used 200 mL for the 75-g samples and 300 mL for the 1000-g samples. The 300-mL rinse volume was determined as the quantity of water, rounded up to the nearest 100 mL, required to submerge the solids. I won’t have access to the metal release data for the particle size experiment until tomorrow. As mentioned on the phone, sulfate release rates appear to vary linearly with surface area. It seems likely that nickel release rates will vary similarly, and I’ll look into this further tomorrow. Hopefully this information will shed some light on the maximum particle size question.

1
Day, Stephen
From: Dave Antonson [[email protected]]Sent: Tuesday, May 17, 2005 11:53 AMTo: Kim LapakkoSubject: reactor
Attachments: small reactor.doc
small reactor.doc (271 KB)
see if this makes any sense. you can edit it if you want. if it seems adequate you can forward it to steve. maybe he doesn't need a sample of the base.
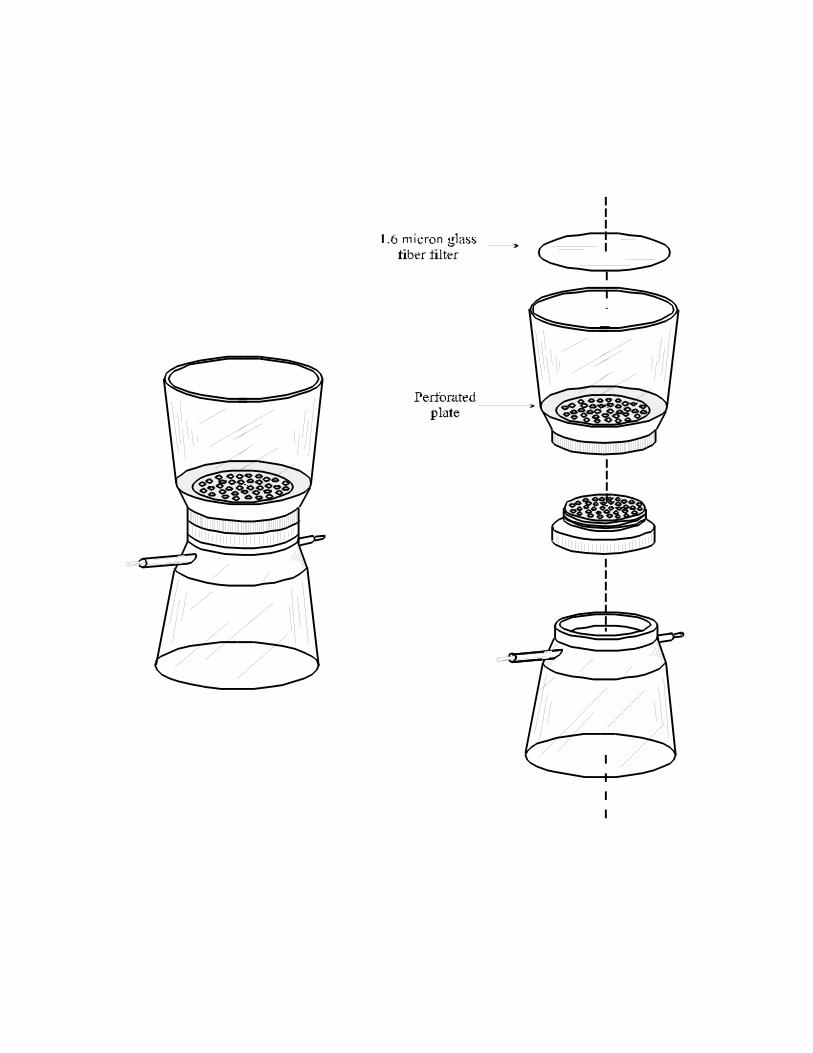
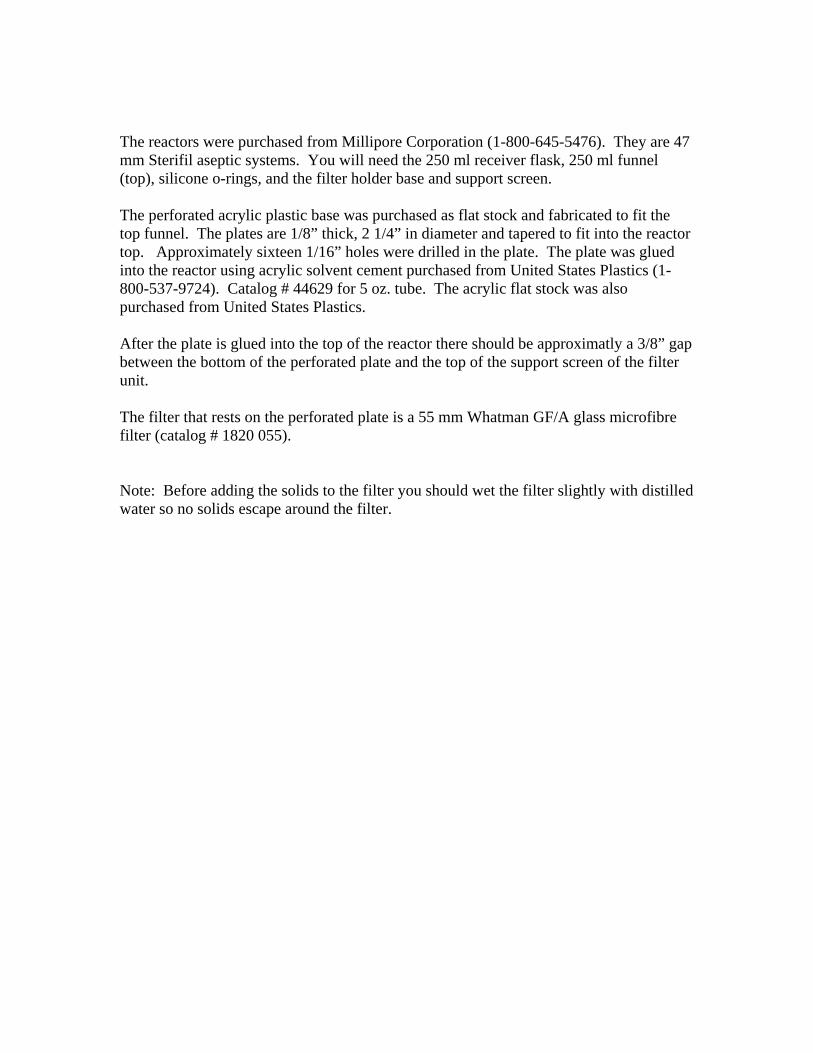
The reactors were purchased from Millipore Corporation (1-800-645-5476). They are 47 mm Sterifil aseptic systems. You will need the 250 ml receiver flask, 250 ml funnel (top), silicone o-rings, and the filter holder base and support screen. The perforated acrylic plastic base was purchased as flat stock and fabricated to fit the top funnel. The plates are 1/8” thick, 2 1/4” in diameter and tapered to fit into the reactor top. Approximately sixteen 1/16” holes were drilled in the plate. The plate was glued into the reactor using acrylic solvent cement purchased from United States Plastics (1-800-537-9724). Catalog # 44629 for 5 oz. tube. The acrylic flat stock was also purchased from United States Plastics. After the plate is glued into the top of the reactor there should be approximatly a 3/8” gap between the bottom of the perforated plate and the top of the support screen of the filter unit. The filter that rests on the perforated plate is a 55 mm Whatman GF/A glass microfibre filter (catalog # 1820 055). Note: Before adding the solids to the filter you should wet the filter slightly with distilled water so no solids escape around the filter.