waste management system in gated communities - example vit ... the vellore institute of technology...
TRANSCRIPT

Waste Management System in gated communities - example VIT-University-Campus
Sebastian Meier *, Dirk Weichgrebe*, Karl-Heinz Rosenwinkel*
Leibniz University Hannover, ISAH - Institute for Sanitary Engineering and Waste Management, Division of waste management, material flows and anaerobic processes, 30167 Hannover, Germany
*{surname}@isah.uni-hannover.de
Abstract The Vellore Institute of Technology (VIT) University, Vellore, Tamil Nadu is well known for their green and eco-friendly campus in India. The campus is still growing and it can be identified as a gated community. In former times, it generated considerable amounts of waste which was not handled properly. VIT with the help of a NGO designed waste management system named as “Zero Waste Emission Concept”. Nowadays, VIT operates this system on its own. Biodegradable wastes are mostly treated while the inorganic wastes are segregated and wastes with wealth are sold. This paper is an example case study of a situation of waste management in India and the problems in collecting data for Life Cycle Inventory (LCI) modeling in developing countries are discussed. Further, possibilities and recommendations for collection of data for proper scientific analysis and assessment are provided in this paper. Present waste management system practiced in VIT beginning from collection, transportation, segregation to treatment are shown in the form of material flows (organic, inorganic) as modeled by LCI Software Umberto®. Based on LCI analysis specific recommendations are provided to improve and optimize the present waste management system to be effective and environmental friendly, and moreover can be adapted to other gated communities.
1 Introduction
In Megacities thousands of tones of Municipal Solid Waste (MSW) are generated on a daily basis. Due to rapid industrialization and population explosion to 1.21 billion in 2011 with a growth rate of 17.6% [1] more and more villages are getting transformed into cities in India like Vellore, a town in South-India in the Federal State of Tamil Nadu, where the Vellore Institute of Technology (VIT) University its campus located.

In general, MSW is dumped without precaution or operational controls. Therefore, Municipal Solid Waste Management is one of the major issues in India but is not really taken into consideration. It is still a challenge. It involves activities associated with the generation, storage, collection, transfer and transport, processing and disposal of solid wastes. But mostly if systems exist, they comprise of only four activities, i.e., waste generation, collection, transportation, and dumping. Moving from open dumping areas to simple sanitary landfills in conjunction with separation, recycling and composting as well as digestion of biodegradable waste is likely to result in significant benefits. Pollution of surface and groundwater by leachate, emission of greenhouse gases (methane), odor and breeding of disease carriers can be minimized. Contaminated sites can be avoided. According to social aspects, the living conditions of waste pickers can be improved and health risks reduced. Their formal involvement in the collecting, sorting and recycling of materials can offer these people the potential to supplement their income and increase recycling rates. The composition and the quantity of the generated MSW form the basis and make balances possible on which the management system needs to be planned, designed operated and modeled. The following work gives a first survey about the challenge to get data about amount and quality of MSW and about their management in gated communities with the example of the campus of VIT-University.
2 General Information about the gated community VIT
The VIT-University is located in the north of Tamil Nadu between Bangalore (200 km west) and Chennai (136 km east). Approx. 15,000 students and approx. 3,000 employees and external staff are working and studying there. Thereby the 140 hectares of eco-friendly area is divided into the educational part including ladies-hostel and faculty-homeland and, the gent's hostel side divided by a railway. It's famous for beeing one of the greenest campus in India [6]. In following figure it can be clearly seen, that all facilities for a gated community are available including energy and water supply from rain harvesters, bore wells and waste water treatment. Furthermore VIT identified an area for carrying out bio-conversion and recycling activities. They built two halls, one hall for separation and storage and one hall for composting including vermicomposting and a stall for cattle. Also two biogas plants built up next to the composting hall. Figure 1 shows thematically the map of VIT campus.

Fig. 1: Thematic Map of gated community of VIT-Campus, Vellore (India) [4]
3 Method of data collection
Collection of data in VIT-Campus is quite difficult. Initially the person responsible for waste management, infrastructure, inhabitants and other facilities has to be figured out. Due to the availability of less data for sensible assumption to be made, data collection was focused on oral interviews and monitored at VIT, mostly with employees of the segregation plant and gardening of VIT-Campus in charge, supervisor (plant in charge), chief warden gent's hostel-side and assistant director estate. A lot of discussions and interviews are held. Simultaneously the available data about the municipal solid waste situation in India especially in the Federal state of Tamil Nadu in urbanized and rural areas were collected by a literature study [3,5] and compared with existing data from the gated community of VIT. In VIT there is no protocol for the characteristics and amount of waste available, because there is a lack of a defined fee structure and not much importance is given to it. Only data of wastes with value i.e. which can be sold in the secondary

market, like plastic, paper or metal are weighed and are carried out in protocols, but often they are not complete and hand written and even more difficult to interpolate. Furthermore getting in contact with the former operator (NGO), to find out how they manage and operate the transport, segregation and treatment was difficult. Unfortunately there was lack of written data from their side or they didn’t want to cooperate.
Fig. 2: Information system to get valuable data for further modeling. But nevertheless by using the system in Fig. 2 the data was collected and a survey of VIT regarding characteristic and amount of waste was carried out and applicable assumption were made based on literature, rough monitoring and interviews. For verification and accuracy, an intensive monitoring of these waste streams in the future is recommended.
4 Collection and transportation in campus
VIT-University operates the collection and transportation system on its own. The people responsible for the collection and transport are paid directly from the university. Only one vehicle (Tata, small lorry) is enough to collect and transport the whole waste at VIT- Campus. It has a maximum capacity of 750 kg (see Fig. 3, left). Two persons and one driver collect the waste from the whole campus in 12 hours. 40 sweepers that work in the buildings put the waste into approx. 50 kg bags and store the waste in front of each building. Also 224 employees for gardening are involved in waste collection. They are responsible for a clean campus outside of the building. The waste lorry delivers every day eight times the

segregation plant. Liquid Food waste is transported by hand cart and man power (5 to 7 people) in 50 l barrels (see Fig. 3).
Fig. 3: left: Tata lorry for food waste and all other waste, right: vehicle for liquid
food waste from kitchen [4] Previously the waste was collected in manual tricycles and transported to the waste recycling centre. The waste is not only taken by the lorry to the segregation plant, but also local people take a part of the kitchen waste from the mess to feed their animals. But it is very difficult to find out the amount of waste which they take. And also the dried sludge from the sewage water treatment plant as well as medical waste from the health center is transported by external companies outside of VIT.
5 Segregation and Composition of waste
The waste is not segregated at the source directly in the hostel or educational building. At the segregation plant 25 workers separate the waste into three broad categories: recyclable sellable waste, biodegradable waste and non recyclable waste. Another category is in the health center. This medical and hazardous waste are directly collected by an external company and carried regularly for incineration. It can be neglected as it is already under strict regulations. Like in whole India or other agro industrial countries, the main part of waste in VIT-Campus is the biodegradable fraction. While the part of collected biodegradable waste in MSW in urbanised cities like Chennai is 44% [2], the collected biodegradable waste in rural areas like in Vellore district is 80% [3]. In VIT-Campus as an educational constitution the collected biodegradable waste is 85%.

Fig. 4: Characteristic and amount of collected biodegradable waste in 2007 [4]
Fig. 5: Characteristic and amount of collected recycle able and non-recycle able
waste in 2007 [4]

In Fig. 4 the biodegradable waste is characterized according to the data collected by oral interviews, in Fig. 5 the data are calculated by sale reports. Here the main part of biodegradable waste is of course food waste (see Fig. 4). Especially the South-Indian tradition and life style leads to waste containing a large organic but meat free fraction with a high moisture content of 50% by weight so far, therefore it is an ideal material for biological treatment. The rest (15%) of the whole collected waste at VIT is the inorganic waste fraction (see Fig. 5) without construction or bulky waste. The biggest part of the inorganic waste is paper based on the educational institution followed by plastic and chocolate paper and metal. Glass is not very common at VIT-Campus, because most of the soft drinks are filled in plastic bottles and drinking water is everywhere available produced by Reverse Osmosis plant from bore well water. All inorganic main groups are separated manually. The characteristic of all main groups is shown in figure Fig. 6.
Fig. 6: Characteristic of all inorganic collected main groups in 2007 (in percentage by weight)
18%
18%
13%13%
23%
3%
12%
Paper note book paper
white record
colour record
BP = Paper cups
english news papers
books/Magazine
boxes
39%
14%7%
29%
4%
4% 2% 1%
Plastic mica (carry bags, plastic)
plastic I (good quality)
PET bottles
Plastic II (black plastick, not so good)PVC
Tea Cups
milk cover
thermocol = Styropor
65%
35%
Glass waste bottles
waste glass
52%
18%
2%0%
7%
1%3%
1%
0%
15%
1%
Metal Iron
Iron sheet
Aluminium
Aluminium paste
Brass (Messing) = copper + zinc
Copper
M.S. Boring = metal mile steel
S.Steel
oil cover
chapples = metal, copper
copper mine
18%
2%
0%
80%
0%
Others Tube light (NOS)
Battery
I lit shoes
damaged cotts
wastage wood
57%29%
14%
Medical Waste
Waste sharps (needles,syrings, blades and glass)
Solid waste (cotton, contaminated with blood, dressing beddings)
chemical waste

6 Modeling Organic Waste Streams by Umberto®-Software
The collected and calculated data are the basis for the modeling of mass flows using Life Cycle Inventory software Umberto®. Two different variants are compared with following assumptions as shown in Tab 1. Tab.1: Comparision between variant A and variant B Variant A Variant B Capacity of segregation, biogasproduction and composting
existing higher
In these variants the biogas and the composting processes were calculated in Umberto®. Different parameters/assumptions were taken from literature. The system boundary includes the whole campus and consists of an inner circle of the segregation plant area. The input is represented by green colored symbols and the output by red colored symbols. The blue transition rectangles represent the processes. The variant A shows the existing biogas plants (2m³ each) and the composting plant whereby the processes of composting and digestion are simplified. Only 9.6% of the produced cow dung is used in the biogas plant, mixed with fresh water. Another part (16%) is used in the composting plant to maintain the moisture content, the rest is carried out and used as a fertilizer by local people. Food waste that is not used as cattle fodder is used for the composting plant. By these configurations and assumption the biogas plants can produce 273,8 m³ Biogas/a. By using a virtual CHP (n el = 0.39%; n therm = 0.4 %) 640 kWh/a electrical and 657 kWh/a thermal energy could be produced. This less amount of energy makes it unsuitable for using a conventional CHP. But on the other hand it could be used for burning for boiling water or lighting. The input of the composting plant is cow dung, food waste, gardening waste and slurry from the biogas plants. The composting plant produces approx. 69,000 kg/a fertilizer, which could be used at the VIT-Campus directly or sold to local people. The rest of the organic waste mostly grease and oil from the sewage water treatment plant, liquid food waste from messes and canteens are stored in so called open pits. Furthermore dried organic sludge from the sewage water treatment plant food waste for feeding the animals of local people are carried out of the VIT Campus.

The whole organic waste material flow (including food and food for consumers in hostel messes and canteens) for variant A is shown in Fig. 7. In variant B a larger biogas plant and a larger composting plant in which all available biodegradable materials at VIT-Campus are treated is assumed. Here the processes of composting and digestion are also simplified. 100% of the cow dung produced is used in the biogas plant. The rest of the food waste which is not used as cattle feed is carried to biogas plant. 61.7% of the total food waste produced is used in the biogas plant. Liquid food waste, grease and oil and dried sludge from the sewage water treatment plant are also input materials for the digester. By this configuration and assumptions the biogas plant can produce 62,860 Nm³ CH4/a or 2,45,157 kWhel/a and 2,51,443 kWhtherm/a if a conventional CHP (n el = 0.39%; n therm = 0.4 %) is used. By this, only 28 kWhel/h and 28.7 kWhtherm/h is produced like variant A. So it could be used for lighting, cooking or boiling purposes.
Fig. 7: Sankey diagram of the whole organic waste in VIT-Campus (Variant A) The input of the composting plant is food waste, gardening waste and slurry from the biogas plants. With composting 1,32,581 kg/a fertilizer can be produced, which could be used in the VIT-Campus directly or sold to local people. In this scenario no organic waste would be carried out of VIT-Campus or stored in open pits. The material flow for variant B is shown as a Sankey Diagram in Fig. 8.
P1: Food/InputT1: VIT-Campus
P12
T2: Transport
P2: local people
P3: Feed for cattle
P4: Composting
P5: Dumping
P6: Segregation Plant
T3: Segregation Plant
P7: Secondary Market
P8: Sewage
P9: Water:Borewell / RO-Plant
T4: Sewage Water Treatment Plants
P10: Reuse in VIT
P11: Dried Sludge(outside VIT, reuse)
T5: Cattle Digestion
P15: Biogas-Plant
T6: BiogasplantP16: ElectricityP18: Water
P17: Gardening Waste
Inside ofVellore Institute of TechnologyVellore, Tamil Nadu, India
Inside of:Segregation Area
T7: Composting Plant
P20: Emission (H20, CO2)
P2: local people
P19: ConsumptionStudents Food
P21: Incineration
FoodOrganic wasteFeed for animals local peopleFeed for cattle segregationOrganic waste for compostingGardening wasteLiquid food wastePrimary sludge from SWTPFood wasteCowdungSlurryGreace and oilFood waste, Organic waste for compostingFertil izerConsumption Food Student
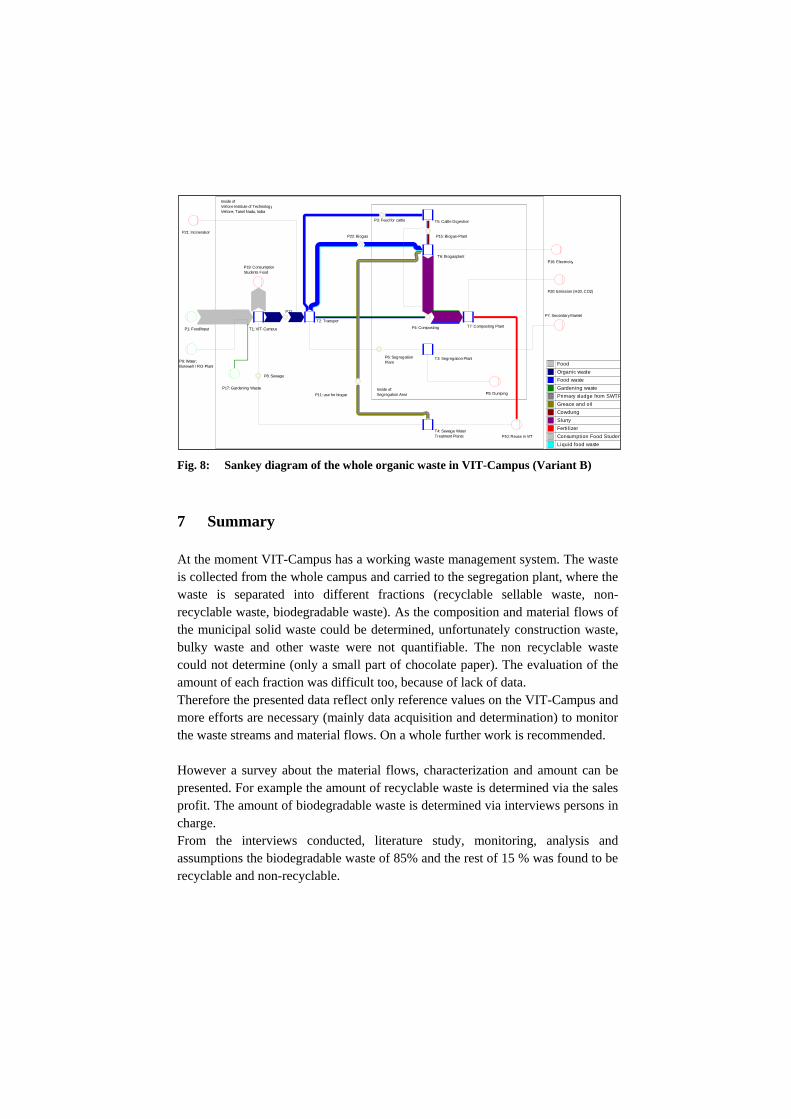
Fig. 8: Sankey diagram of the whole organic waste in VIT-Campus (Variant B)
7 Summary
At the moment VIT-Campus has a working waste management system. The waste is collected from the whole campus and carried to the segregation plant, where the waste is separated into different fractions (recyclable sellable waste, non-recyclable waste, biodegradable waste). As the composition and material flows of the municipal solid waste could be determined, unfortunately construction waste, bulky waste and other waste were not quantifiable. The non recyclable waste could not determine (only a small part of chocolate paper). The evaluation of the amount of each fraction was difficult too, because of lack of data. Therefore the presented data reflect only reference values on the VIT-Campus and more efforts are necessary (mainly data acquisition and determination) to monitor the waste streams and material flows. On a whole further work is recommended. However a survey about the material flows, characterization and amount can be presented. For example the amount of recyclable waste is determined via the sales profit. The amount of biodegradable waste is determined via interviews persons in charge. From the interviews conducted, literature study, monitoring, analysis and assumptions the biodegradable waste of 85% and the rest of 15 % was found to be recyclable and non-recyclable.
P1: Food/Input T1: VIT-Campus
P12
T2: Transport
P3: Feed for cattle
P4: Composting
P5: Dumping
P6: Segregation Plant
T3: Segregation Plant
P7: Secondary Market
P8: Sewage
P9: Water:Borewell / RO-Plant
T4: Sewage Water Treatment Plants P10: Reuse in VIT
P11: use for biogas
T5: Cattle Digestion
P15: Biogas-Plant
T6: BiogasplantP16: Electricity
P17: Gardening Waste
Inside ofVellore Institute of TechnologyVellore, Tamil Nadu, India
Inside of:Segregation Area
T7: Composting Plant
P20: Emission (H20, CO2)
P19: ConsumptionStudents Food
P21: IncinerationP22: Biogas
FoodOrganic wasteFood wasteGardening wastePrimary sludge from SWTPGreace and oilCowdungSlurryFertil izerConsumption Food StudenLiquid food waste

On basis of the current available data, variants were modeled by Life Cycle Inventory analysis software named Umberto®. Variant A shows the material flows by using the existing biogas and composting plant and producing fertilizer. The variant B is an assumption by using all the biodegradable biomass to treat it in biogas and composting plant and using the fertilizer in the VIT-Campus. In variant A (0.03 m³/h) and variant B (56 m³/h) biogas is produced, which could be used for lighting or cooking processes (for heating water). Even in variant B the biogas production is not efficient for using a CHP-plant. Potential for optimization are in operation and maintenance. Furthermore structural measures could decrease the impact on the environment and to health of the workers (concrete ground plate, temporary waste storage). For dimensioning a bigger biogas plant, it is necessary to have a correct balance of organic waste, which could be used for biogas production. These plants would be efficient only when the people who are using and operating it are well educated and well trained. In general the concept of the waste management for collection and transporting in VIT-Campus is working fair and no waste is lying or dumped in the campus side, because every day gardening people /scavenger cleaning the campus very well. But in general it has to be said, that even the best models are useless without accurate, relevant and accessible data to enter into them. In gated communities also the common treatment of sewage and biowaste could an option to optimize the resource efficiency. As anaerobic treatment takes out the carbon for energy production, but holds back the nutrients for use as fertilizer. Moreover the water is treatment reusable for irrigation.
8 References
[1] <http://www.hindu.com/2011/04/01/stories/2011040157920100.htm>, (Accessed 01.04.2011).
[2] Mufeed Sharholy et al., Municipal solid waste management in Indian cities - A review, Journal of Waste Management, Vol. 28, Elsevier, 2008, pp. 459 - 467
[3] Pragyan Patnaik, Collection, Transportation, Recycling and treatment of municipal solid waste in Vellore District, Tamil Nadu, India with the aim of sustainable resource management. Master thesis, Leibniz University Hannover, Institute for Water Quality and Waste Management and Vellore Institute of Technology University, SMBS, Hannover, 2009
[4] Sebastian Meier, Municipal Solid Waste in VIT-Campus - Status quo & possibilities for optimisation. Report, Leibniz University Hannover, Institute for Sanitary Engineering and Waste Management and Vellore Institute of Technology University, Hannover, 2011 (unpublished)

[5] Monika Bredemeier, Abfallwirtschaft im Vellore-District, Tamil Nadu, Indien. Master thesis , Leibniz University Hannover, Institute for Water Quality and Waste Management and Vellore Institute of Technology University, SMBS, Hannover, 2009
[6] VIT-University (Publisher), VIT - A place to learn; A chance to grow, Information brochure, Vellore 2010
[7] Logesh, Operation Diary of the segregation plant between 2004 until 2007 and since May 2010, Vellore Institute of Technology University, Vellore 2010 (unpublished)