waste management hierarchy
TRANSCRIPT

Table of Contents
Trends in Waste Generation
Impact of waste – poor waste management
Waste Management Hierarchy
Integrated Solid Waste Management
Towards Circular Economy

What is Waste?

Typical Contribution of Waste streams in Urban Areas
Source: EMC Master database , 2014

Waste Treatment Infrastructure
Treatment Storage Disposal Collection
Landfill
Incineration
Treatment
Recycling
Waste to Energy
Segregation

Waste Generation Across Various Regions of the World
Total waste currently generated is approx. 3532 tons/day in which OECD
countries generate maximum waste. By 2025 in which East Asia could make
major contribution.
Source: What a Waste, World Bank:

Waste Generation is Linked to Per Capita Income
Source: Economic Times
Source: EMC’s Master Country Database (n.p., 2014) using primarily
data from the EU, OECD and World Bank; Lawless (2014), Waste
Atlas: Recycling and resource recovery around the world (Unpublished
master’s thesis). University of Leeds, Leeds, UK.

Organic waste
enjoys maximum
fraction of the
waste generated
across all income
level while paper
waste is high in
upper-middle and
high income
countries.
Waste characteristics by Income Levels
Source: EMC’s Master Country Database (n.p., 2014) using primarily data from the UN and World Bank and Hoornweg & Bhada-Tata (2012)

Cost of inaction
In Asia 50-70% of revenues are spent on waste management and the cost of inaction eats away 5% of the GDP

World’s 50 Biggest Waste Dumpsites
Largest number of dump sites are found in African countries followed by Asia
Source: Waste Atlas Partnership (2014).
Waste Atlas: The World’s 50 Biggest Dumpsites, 2014 Report.

.
GHG emissions at various stages of waste disposal and
management
Greenhouse Gases (GHG) are gases
that trap heat in the atmosphere. The primary
GHG water vapour, carbon dioxide, methane,
Nitrogen oxide, sulphur dioxide and ozone.
Different stages of Waste Management
contribute to GHG emissions.
The yellow lines depicts the emissions
from different process and the green
lines shows the remediation technique
or the methods to avoid GHG
emissions.

Reduce
Reuse
Recycle
Reduce
Reuse
Recycle
Priority Adoption
Long Term
?


Phasing out open dumping & controlling disposal is an important first step

Waste streams that can be recycled to recover valuable secondary resources
SCRAP METALS • Aluminium • Ferrous (Steel) • Lead • Zinc • Copper
15

MSW • Paper • Plastic • Glass
Waste streams that can be recycled to recover valuable secondary resources
16

Waste is a resource and should be recognized as such
In fact the whole waste management system should be
designed around recycling and resource recovery.
Decentralized solutions are effective

The private sector (both formal and informal) is a key player in solid waste management. They can support the local authority and innovate in recycling
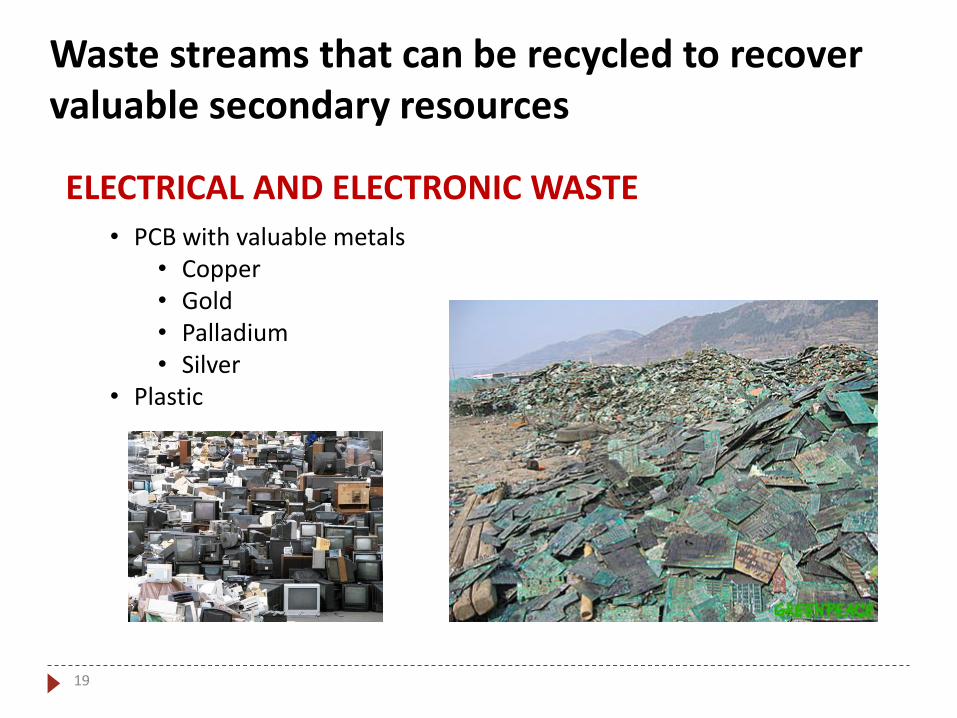
ELECTRICAL AND ELECTRONIC WASTE • PCB with valuable metals
• Copper • Gold • Palladium • Silver
• Plastic
Waste streams that can be recycled to recover valuable secondary resources
19
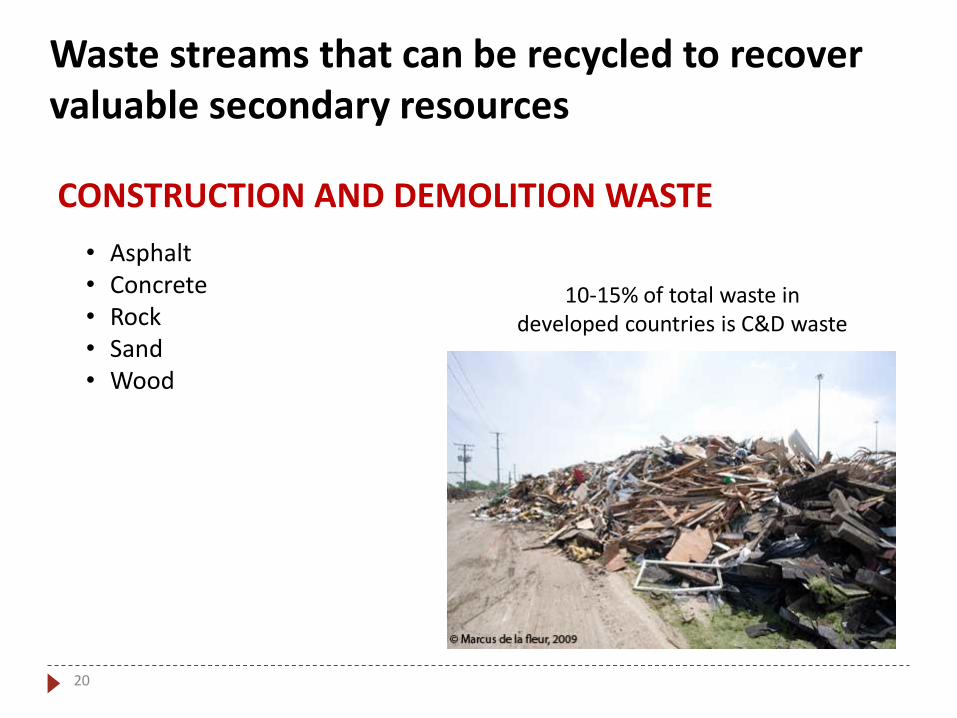
CONSTRUCTION AND DEMOLITION WASTE
• Asphalt • Concrete • Rock • Sand • Wood
Waste streams that can be recycled to recover valuable secondary resources
10-15% of total waste in developed countries is C&D waste
20

•One ton of electronic scrap from PCs contains more gold than that recovered from 17 tons of gold ore and 40 times more concentration of copper than that in copper
•Recycling 1 ton of aluminium saves, 1.3 metric tonne of bauxite residues 15 m3of cooling water 0.86 m3 of process water 2TCO2 avoided 11 kg of SO2 avoided
• Recycling 1 ton of paper will save up to 17 trees and 50 %
water
Benefits of recycling – some facts and figures
21

Benefits of recycling waste streams - Example
Recovery of Obsolete Mobiles - Japan
Recycling campaign launched in Nov 2009 involving 1886 stores and super markets selling mobiles •People who return mobiles had a chance to enter a lottery to win 12 – 600 dollars •569,464 mobiles collected •22 kg gold, 140 mg silver, 10 g copper, 4 mg palladium recovered in 4 months
22

PPP Model for Centralized Community
Based Composting in Dhaka by Waste Concern (WC)
Communities
Private Fertilizer
Companies.
Waste Concern
DCC & PWD
MoEF
Providing Seed
Money
Coordinating the
Program
Communities
participate in door-to-
door waste collection
program & contribute
towards its cost.
PUBLIC PRIVATE COMMUNITY
Providing
Land and
other
logistics
WC
ensures the
quality of
compost
WC provides technical
support and facilitation
for community based
SWM and composting
Fertilizer
companies buy
all the
compost
PPP MODEL: CASE FOR COMMUNITY BASED COMPOSTING IN BANGLADESH
Donor
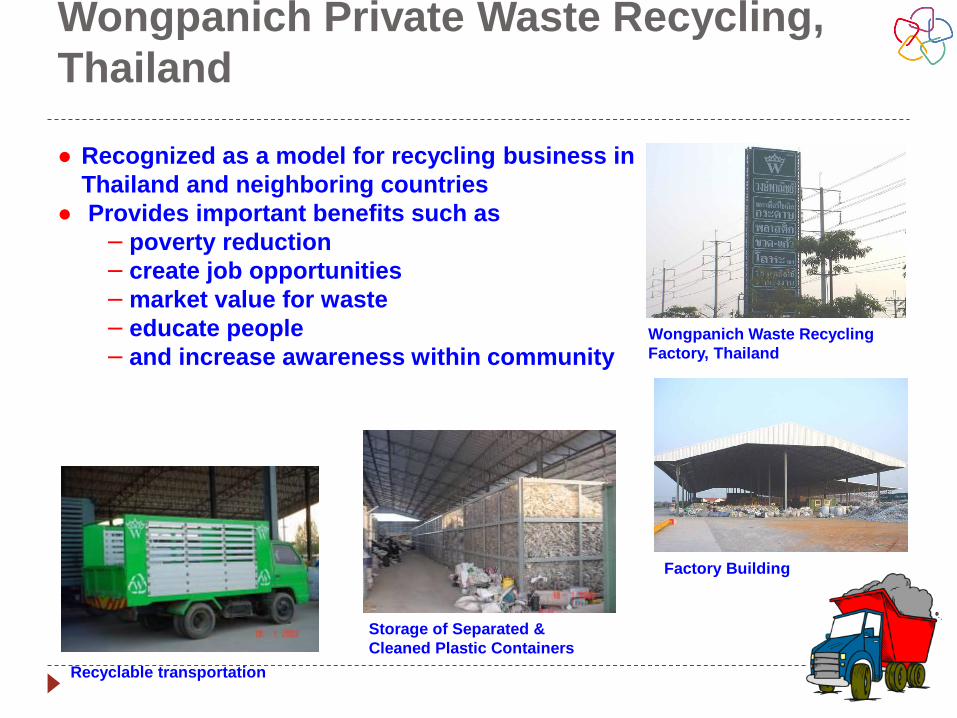
Wongpanich Private Waste Recycling,
Thailand
● Recognized as a model for recycling business in
Thailand and neighboring countries
● Provides important benefits such as
−poverty reduction
− create job opportunities
−market value for waste
− educate people
− and increase awareness within community
Wongpanich Waste Recycling
Factory, Thailand
Factory Building
Storage of Separated &
Cleaned Plastic Containers
Recyclable transportation

Case study: Credai Clean City Movement, Kerala,
2007
The Confederation of Real Estate Developer's
Associations of India (CREDAI)
Launched a corporate social responsibility (CSR)
project
Aim: spreading awareness to help citizens
implement self-contained solid waste management
systems in their communities
Technology: Decentralized systems applicable to
different conditions – such as bio digester bins for
apartments and bio digester pots for individual
homes
Achievements
Processed 72 tonnes of biodegradable waste from
48000 apartments in the city
It has created jobs for people below the poverty line
for the last three years
Saved Rs. 8.91 Crores (@ Rs. 3391 per tonne) for
the government.
25

Case study - The Clean City Championship – A
Participatory Approach for Improved Solid Waste
Management in Warangal, 2012
Low cost participatory approach
Strong leadership from the administrators and politicians
Financial grants for the championship were first secured from different departments at State level
Intensive pre-championship activities were carried out
Transportation plan and rationalization of vehicles
Route and loading plans for entire city on GIS maps
Tie-ups
Stakeholder involvement
Training and capacity building
Championship spread over 7 days
Achievements
WMC was able to reduce 30 to 40% of waste going to the dumpsite.
Solid waste management wing was established
Data updated on real-time basis
There has been a reduction in O&M costs by 30%
This model of championship has been replicated in Guntur and Visakhapatnam in Andhra Pradesh and many more have showed interest
26
Source: http://www.indiaenvironmentportal.org.in/files/file/municipal%20solid%20waste%20management.pdf

Quezon City, Philippines
Started with ‘Linis Ganda’ Linkages across supply chain
Recognition & respectability
uniforms, ID, access
politically connected
Organise co-operatives
Facilitate affordable credit Photo credits: Embassy of Japan in the Philippines; Government of the Philippines, 2006
Year Total IWBs
1997 6% 4%
2006 25% 16%
2009 37% 24%
10 year increase in recycling
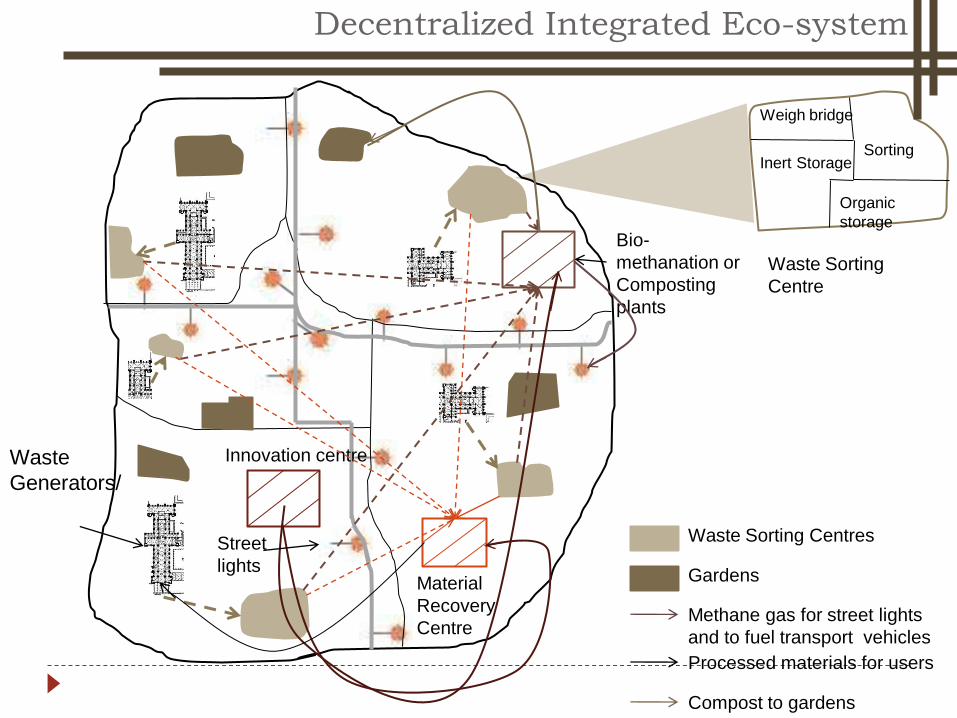
Weigh bridge
Sorting Inert Storage
Organic
storage
Bio-
methanation or
Composting
plants
Material
Recovery
Centre
Innovation centre
Street
lights
Waste Sorting Centres
Gardens
Methane gas for street lights
and to fuel transport vehicles
Processed materials for users
Compost to gardens
Waste Sorting
Centre
Waste
Generators/
Decentralized Integrated Eco-system

Sudokwon Eco-Energy Complex Town
Sludge-to-Solid Fuel
(2,700ton/day)
Organic Waste-to-Biogas
(1,500ton/day)
Construction Waste-to-Fuel
(4,000ton/day) Testing complex
Other energy plants
Combustible WtE plant
(2,000ton/day)
RDF plant
(200ton/day, Apr. 2010) Sludge solidification plant
(1,000ton/day, Dec. 2008)
RDF-dedicated Boiler
(600ton/day)
21

Wastes Not Being Viewed as “Resources”
Need for fundamental change in our mindset and attitudes
Resource efficiency and circular economy
The Closed Loop Economy By reducing production of wastes, and by maximising the use of reusable and recyclable
materials, a city can achieve greater resource efficiency
Source: ADB and IGES (2008). Toward Resource-Efficient Economics in Asia and the Pacific: Reduce Reuse Recycle. Asian Development Bank, Manila
• Closed-Loop Economy
• Recycle Based Society
• Sound Material-Cycle Society
• Green Growth and Circular Economy

Moving from Negative
Loop to Positive
* Depletion, Degradation, Deterioration, Deforestation, Desertification

Linear to Circular
Economy Linear and Circular Economy

Regulations on recycling of waste
• Waste Electrical and Electronic Equipment (WEEE) Regulations Sets targets for recycling e-waste in EU, China, California (USA), Saskatchewan (Canada) and Ireland.
• Voluntary criteria for recycled paper Standard for recycled paper products GECA 11-200
under the Australian Ecolabel Program Blue Angel Basic Criteria for Award of the
Environmental Label for Recycled Paper (RAL-UZ 14) in Germany
Hong Kong Green Label Scheme (HKGLS) Product Environmental Criteria for Paper Folders with Recycled Content (GL-001-004)
Ecomark criteria for recycled paper in India
• Regulation for recycling batteries EU, USA, Japan, India, Taiwan, Thailand, Turkey
33

Schemes to stimulate recycling - Examples
TAKE BACK PROGRAMS
• German Packaging Ordinance 1991 -
Packaging waste recycled through Duales System Deutschland (DSD)
• British Columbia Recycling Regulation 2004 -
Left over paint returned at 100 depots operated by Product Care.
Eco-fees or eco-taxes collected
DEPOSIT REFUND SYSTEMS
• South Korea – Food containers, tires,
batteries, lubricants, pesticide containers, and plastics
• Bottle bills in U.S
34

환경부 자원순환국
Online waste disposal verification system
(Allbaro)
Asbestos disposal measures
Follow-up management performance
deposit for waste disposal facility
Volume based waste fee system
Reduce the use of disposable items
and packaging
Waste charge system
Promote the recycling of construction
wastes and used metal scrap
EPR system(24 items)
Eco-Assurance system for WEEE and
vehicles
Nature
Materials
Natural Resources
Recyclable
Resources
WtE and biomass
Eco-energy complex towns
Low-carbon green villages
①Energy-efficient
Production, Distribution, Consumption
④Advanced treatment
for pollution prevention
③Energy recovery
from waste resources
②Material recycling
to reduce raw materials
Waste
10
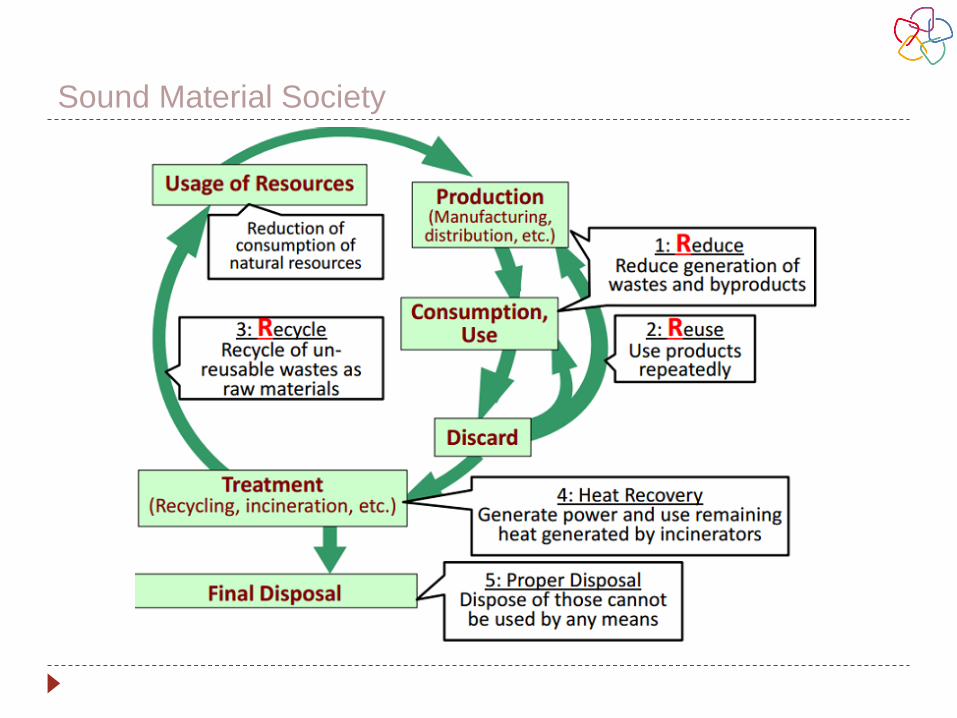
Sound Material Society
