washoe k-16 data profile - education alliance · melisa choroszy associate vice president for...
TRANSCRIPT

Washoe K-16Data Profile
Truckee Meadows Community College ~ University of Nevada, Reno ~ Washoe County School District
WCSD Graduates Attending UNR and TMCC in 2006-2007
December 2007
Prepared By:
The Education Collaborative of Washoe County
Joint Data Profile Committee

[Page Intentionally Blank]

Washoe K-16Data Profile
Truckee Meadows Community College ~ University of Nevada, Reno ~ Washoe County School District
WCSD Graduates Attending UNR and TMCC in 2006-2007
December 2007
Prepared By:
The Education Collaborative of Washoe County
Joint Data Profile Committee

[Page Intentionally Blank]

Washoe County School DistrictPaul LaMarca Assistant Superintendent, Public Policy, Accountability and Assessment
Jan Hall Data Analyst, Public Policy, Accountability and Assessment
Committee Members� Page �
Data Profile Committee
University of Nevada, Reno
Bill Cathey Vice Provost, Instruction and Undergraduate Programs
Melisa Choroszy Associate Vice President for Records/Enrollment
John Mahaffy Director of Assessment
Nevada System of Higher Education Linda Heiss Director of Institutional Research
The Education Collaborative of Washoe County
Denise Hedrick Executive Director
Ginny Jackson Past President and Committee Member
Anne Loring Member of the Board of Directors
Truckee Meadows Community College Elena Bubnova Director of Institutional Research
Serge Herzog Director of Institutional Analysis

� Page �
Washoe County School District Public Policy, Accountability and Assessment
University of Nevada, Reno Office of Institutional Analysis
Jennifer Todd Program Services Coordinator
Jim Grace Reporting Specialist
Jennifer Kimball Program Services Technician
Arthur Chenin Institutional Research Analyst
Acknowledgements
The preparation of this report was made possible through the special assistance of:
Acknowledgments
Truckee Meadows Community College Office of Institutional Research
Jason Oetjen Research Analyst

� Page �
Washoe County School District Public Policy, Accountability and Assessment
Office of the Nevada State Demographer
Kathy Butler Program Services Technician
Jim Grace Reporting Specialist
Jennifer Kimball Program Services Technician
Jeff Hardcastle State Demographer
Acknowledgements
The Committee extends special thanks to Washoe County School District Superintendent, Paul Dugan, for his support of the High School Graduation Rate study.
Acknowledgements
Special thanks are also extended to the following for their in-dispensable contributions to the High School Graduation Rate study.
Washoe County School District Information Technology
Janet McKillip Data Analyst

� � ���Throughout her thirty-three year career with the Washoe County School District, Kendyl Depoali applied her energy and skill to the complex and often intense process of shifting public education to a higher level. We miss her innovative style, steady leadership and dynamic energy, but her legacy to the District will endure for years to come. A fourth-generation Nevadan, Kendyl graduated from Sparks High School and earned Bachelor’s and Master’s degrees from the University of Nevada, Reno. She began her career as a teacher at Clayton Middle School, later moving to McQueen High School, where she taught standard and Advanced Placement courses as diverse as art, English, geography, German, government, history, home economics, math, speech and debate, science and sociol-ogy. In addition to her role as a secondary school teacher, she taught at the University of Nevada, Reno. A consummate teacher, Kendyl had an immeasurable impact on her students, steadfastly applying her incomparable skills and guiding philosophy:
Teachingisanartandascienceandisanextraordinarily creativeprocess.Youtakethesubjectmatterandpresent itinacompelling,effectivemanner.Whenitworks,itisa joytobehold.
As an administrator, Kendyl’s influence on students was less direct, but even more profound. After serving as Vice Principal at Hug High School, Principal of Sparks High School, District Curricu-lum Coordinator and Assistant Superintendent of Secondary Edu-cation, she became the Superintendent for Public Policy, Special Projects and Legislation. In each of these roles, she committed
her intellect, experience and energy to continually advancing the quality of a WCSD education.
Kendyl’s dedication to public education extended far beyond teaching and administration. She served on the national se-lection committee for the Horatio Alger Scholarship Program, served on the Board of Directors for the Education Collaborative of Washoe County, served as national faculty member for the National Geographic Society and received numerous awards and honors for her long and distinguished career as a preemi-nent educator.
In her final year with the District, Kendyl assumed the role of Superintendent for Public Policy, Special Projects and Legisla-tion, which, among many other responsibilities, included par-ticipation in the WCSD K-1� Data Profile project. Her influence on the project was evident in the broader scope and cleaner presentation of the 200� report – improvements that carried over into the present edition, and will undoubtedly continue to be reflected in future editions.
In an interview for the Reno Gazette Journal, Kendyl succinctly summarized her thoughts on her career, her family and her un-sentimental view of the cancer that took her life:
I’mproudofwhatIdidinmycareerandI’mveryproud ofmyfamily.Youcanmakethebestoutofyourcircum- stance.Don’tevertakeanyoneoranythingforgranted. Lifehappens,soyouwanttomakesureyouappreciate everymomentofit.
� Page � Dedication
In Memory of Kendyl Depoali

Data Profile Participants
� Page � Participants
WCSD High Schools1
Nevada System of Higher Education
Damonte RanchGalena
HugInclineMcQueenNorth ValleysReed
RenoSpanish SpringsSparksTMCC HSWashoeWooster
Gerlach
University of Nevada, RenoTruckee Meadows Community College
1 Data are limited for high schools that opened after the initial year of this project: North Valleys (2001-02), Spanish Springs (2001-02), Damonte Ranch (2003-04) and Regional Technical Institute (200�-0�).
Regional Technical Institute

Tracked and analyzed data from the 1��� WCSD graduating cohort
Established baseline dataCompared district trends with state and national
trends
»
»»
Introduction
1��� First Edition
Added analyses of college admissions and college success of WCSD graduates from 1��� through 200�
»
Data Profile Milestones
For the past ten years, the Washoe County School District, Truckee Meadows Community College and the University of Nevada, Reno have worked in concert through the Education Collaborative of Washoe County to produce the Washoe K-1� Data Profile, formerly called the High School Data Profile. The Nevada Department of Education and the Nevada System of Higher Education have also participated in this effort. The Data Profile is the collection and presentation of data about Washoe County School District high school students and their matriculation into college, with special emphasis on the graduates who attend the University of Nevada, Reno and Truckee Meadows Community College. Through this effort, we hope to identify factors that can increase the success of our students as they proceed from high school to post-secondary education. The Data Profile has expanded in scope each year. The 2002 edi-tion reported a two-year increasing trend in the percentage of Washoe County School District graduates enrolled in remedial English and/or mathematics courses at both UNR and TMCC. Con-cern about this trend and its potential impact on students led to an increased focus on the remediation issue for the 2003 through 200� editions of the Data Profile. The 200� edition included col-lege success data for the first and second cohorts tracked by the Data Profile, the WCSD 1��� and 1��� graduating classes. This tenth anniversary edition adds a comparison of methods used to calculate high school graduation rates, and the rates produced by each method for the WCSD Class of 200�.
The Education Collaborative of Washoe County hopes that this and future issues of the Data Profile will continue to help educa-tors, parents, students, and our community better prepare our graduates for a successful transition into higher education and for continued success throughout their college careers.
Reported eye-opening statistics on the English and math remediation needs of WCSD graduates attending UNR and TMCC
» 2002
200�
Reviews and compares six high school graduation rate formulas
Reports the results of a comprehensive cohort analysis of high school graduation rates for the WCSD 2002-2003 freshman cohort
»
»
200� Tenth Edition
� Page 10 Introduction

� Page 11 Contents
Washoe K-16 Data Profile 2007
Annual Data Profile Report
Section I: Freshman Cohort of 2002-2003 – Who Graduated by 2006?Washoe County School District High School Graduation Study
Section II:
Tenth Anniversary Special ReportPages 12-3�
Pages 3�-�4

Tenth Anniversary Special Report
Part II: Calculation of the EC/NGA Cohort High School Graduation Rate for the 2002-2003 WCSD Freshman Cohort
Averaged Freshman Graduation RateEducation Collaborative/National Governors Association Cohort Rate
Part I: Comparison of Graduation Rate Formulas
Causes of Different Results
Introduction
� Page 12 Special Report: High School Graduation Rate
Freshman Cohort of 2002-2003 – Who Graduated by 2006?Washoe County School District High School Graduation Study
Leaver RateCumulative Promotion IndexCompletion RatioManhattan Institute for Policy Research Method
Part III: Accounting for Non-Graduates from the 2002-2003 Freshman Cohort
Page 14
Page 28
Page 24
Page 21Page 21Page 20Page 20Page 20Page 18Page 16
Tenth Anniversary Special Report
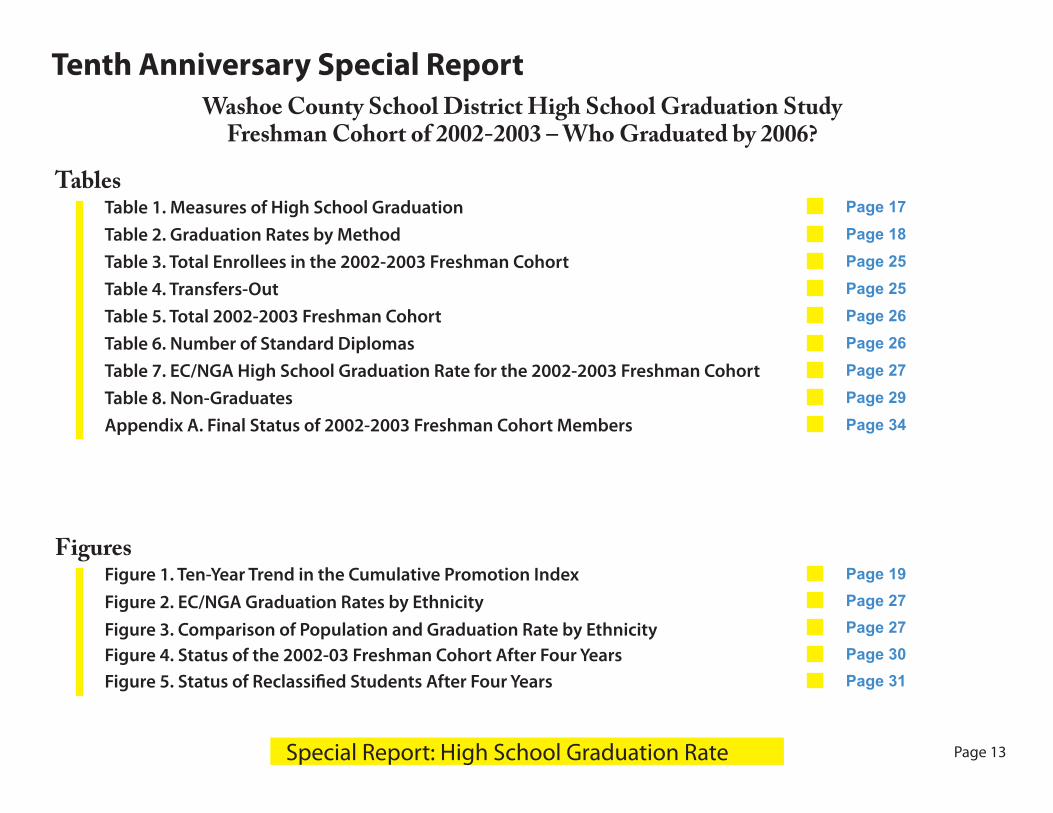
Table 5. Total 2002-2003 Freshman CohortTable 6. Number of Standard Diplomas
Tables
Table 7. EC/NGA High School Graduation Rate for the 2002-2003 Freshman Cohort
� Page 13 Special Report: High School Graduation Rate
Freshman Cohort of 2002-2003 – Who Graduated by 2006?Washoe County School District High School Graduation Study
Table 1. Measures of High School GraduationTable 2. Graduation Rates by MethodTable 3. Total Enrollees in the 2002-2003 Freshman CohortTable 4. Transfers-Out
Table 8. Non-GraduatesAppendix A. Final Status of 2002-2003 Freshman Cohort Members
Figure 5. Status of Reclassified Students After Four Years
FiguresFigure 1. Ten-Year Trend in the Cumulative Promotion IndexFigure 2. EC/NGA Graduation Rates by EthnicityFigure 3. Comparison of Population and Graduation Rate by EthnicityFigure 4. Status of the 2002-03 Freshman Cohort After Four Years
Page 17
Page 27
Page 34Page 29Page 27Page 26Page 26Page 25Page 25Page 18
Page 31Page 30
Page 27Page 19

� Page 14 Special Report: High School Graduation Rate
Special Report: High School Graduation Rate
Passage�of�the�No�Child�Left�Behind�Act�(NCLB),�enacted�in�2002,�has�drawn�attention�to�the�issue�of�high�school�graduation�rates�by�requiring�that�all�high�schools,�school�districts,�and�states�be�held�accountable�for�reporting�and�improving�their�rate�of�high�school�graduation.�Most�people�consider�“high�school�graduation�rate”�to�signify�the�per-centage�of�a�freshman�class�that�graduates�four�years�later.�Using that same concept, NCLB defined the high school graduation�rate�as�the�“percentage�of�students,�measured�from�the�beginning�of�high�school,�who�graduate�from�high�school�with�a�regular�diploma�(not�including�an�alternative�degree�that�is�not�fully�aligned�with�the�State’s�academic�standards, such as a certificate or a GED) in the standard number�of�years”�(1). Inherent in this definition of high school�graduation�rate�is�the�expectation�that�there�will�be�a�student-by-student�count�of�which�high�school�freshman�graduate.�However,�for�very�large�school�districts�and�for�states,�even�with�computers,�such�student-by-student�ac-counting�is�challenging.
Given the difficulties in tracking large numbers of students over�four�years�or�more,�researchers�have�devised�various
formulas�to�provide�measurements�of�graduation�that�do�not require tracking of individual students. These formu-las�use�annually�reported�totals�of�student�enrollment�by�grade,�numbers�of�graduates,�and�numbers�of�dropouts�(often�referred�to�as�aggregated�data)�that�are�released�by�the National Center for Education Statistics (NCES). Some of�these�formulas�attempt�to�estimate�the�percentage�of�a�freshman�class�that�graduates�in�four�years,�without�actually�following�a�freshman�cohort�on�a�student-by-student�basis.�Other�formulas�are�surrogates,�i.e.�measurements�of�some�aspect�of�graduation�that�are�not�and�have�never�represented�themselves�to�be�“the�percentage�of�a�freshman�class�that�graduates.”�
With�the�reporting�requirements�of�NCLB�but�recognizing�that�few�states�had�the�capability�to�report�student-by-stu-dent�data�for�a�freshman�cohort,�the�federal�government�gave states the flexibility to choose the formula they use to calculate�graduation�rate�as�well�as�to�set�goals�and�targets�for improving their rate over time. This flexibility, coupled with�the�variety�of�formulas�that�had�already�been�devel-oped�to�estimate�graduation�rate,�has�led�to�a�confusing
Washoe County School District High School Graduation Study
Who Graduated by 2006?Freshman Cohort of 2002-2003

Special Report: High School Graduation Ratearray�of�percentages,�all�purporting�to�represent�the�rate�of�high�school�graduation.
Recognizing�this�confusion�and�wanting�to�develop�a�single�method�for�calculating�high�school�graduation�rates�that�would�be comparable from state to state, the National Governors As-sociation (NGA) assembled a task force to address the issue. The result was agreement in 2005 by the governors of all fifty states to move as quickly as possible to develop the capability of�calculating�a�student-by-student,�cohort�high�school�gradu-ation�rate�(2). The governors also reached agreement on a com-mon�formula�that�each�state�would�use�as�soon�as�the�student�data could be gathered. The NGA cohort formula differs from previous�ones�in�relying�on�actual�student�cohort�data�rather�than on aggregated counts of students. To date, most states, including Nevada, are not yet ready to report the NGA cohort graduation�rate.�About�16�states�were�able�to�report�a�cohort�graduation�rate�in�2007.
The 2007 Data Profile has undertaken a two-part study of high school graduation rates for the Washoe County School District (WCSD). Part I compares the results of five common gradu-ation rate formulas, calculated using aggregated WCSD data for the Class of 2006, and the NGA cohort formula, calculated
using student-by-student data from the WCSD 2002-2003 freshman�cohort�(whose�four-year�graduates�would�be�part�of�the�Class�of�2006).�It�should�be�noted�that�“Class�of�2006”�as used in these formulas refers to all graduates in the 2005-2006�school�year,�regardless�of�when�those�students�originally�entered high school as freshmen. To distinguish that phrase from the graduates of the 2002-2003 freshman cohort, some of whom graduated in school years other than 2005-2006, the graduates in the NGA formula will be referred to as “gradu-ates of the 2002-2003 freshman cohort.” Part II describes in detail�calculation�of�the�high�school�graduation�rate�for�the�cohort of students who were first-time freshmen in the 2002-2003 school year, using the NGA formula as further defined by the Education Collaborative of Washoe County and re-ferred to as the EC/NGA cohort rate. Based on calculation of the EC/NGA cohort rate, Part III accounts for what happened to�the�non-graduates.�
� Page 1� Special Report: High School Graduation Rate

Special Report: High School Graduation RatePart I: Comparison of Graduation Rate Formulas
Attempting�to�calculate�a�cohort�high�school�graduation�rate�remains�beyond�the�capability�of�most�large�school�districts�and�states�at�the�present�time�due�to�various�logistical�chal-lenges. This section describes five of the alternative formulas that�have�often�been�described�as�“high�school�graduation�rates.” The Data Profile Group has calculated the rate for each of these formulas for WCSD using data for the Class of 2006�in�order�to�compare�the�calculations�and�results�with�the�“EC/NGA, 4-Year, Cohort, High School Graduation Rate for the 2002-2003 Freshman Cohort” that is based on the NGA formula; Part II describes calculation of the EC/NGA cohort rate in detail. The various calculations yield disparate results ranging from 44% to 75%. Those results that are closest to the EC/NGA cohort rate for WCSD (56%) appear to be close due to the complex offsetting effects of reclassified enroll-ees, growth, and the fact that all but the EC/NGA rate are not cohort�formulas.�Table 1 summarizes the five alternative measures of high school�graduation�that�have�often�been�referred�to�as�“high�school�graduation�rate”�and�also�includes�a�summary�of�the�formula for the EC/NGA cohort rate for the 2002-2003 fresh-man cohort described in Part II of this report. Table 2 gives the calculated rates for WCSD using each formula.
Leaver Rate
The Leaver Rate(1) was originally selected in 2002 by 33 states,�including�Nevada,�to�meet�the�requirement�of�NCLB�for�accountability�for�“high�school�graduation�rate;”�prior�to�NCLB,�Nevada�had�also�reported�the�Leaver�Rate�as�its�rate of high school graduation. The formula was developed by NCES. However, it was never intended to describe “the percentage�of�a�freshman�class�that�graduates�in�four�years.”�Rather�it�describes�the�percentage�of�those�students�in�a�given graduating class who officially leave school, either by completion�or�by�dropping�out,�that�leaves�as�graduates�with�an�adult,�standard,�advanced,�or�honors�diploma.�Put�simply,�the�Leaver�Rate�answers�the�question,�“Of�those�students�who officially leave, how many leave by graduating?” The denominator of this formula (3,664 students) is much smaller than the 2002-2003 freshman cohort (5,058 students) used in the EC/NGA cohort rate formula and is also smaller than the enrollment�data�used�in�the�other�formulas,�which�results�in�a�much higher rate for the Leaver Rate (75%) compared to the other rates (Table 2). There are a variety of reasons for the smaller�denominator�of�the�Leaver�Rate,�including�the�fact�that�this�calculation�does�not�include�students�who�did�not�of-ficially leave school, e.g. credit-deficient students.
� Page 1� Special Report: High School Graduation Rate

Special Report: High School Graduation Rate
Leaver Rate (Used by Nevada for Adequate Yearly Progress for No Child Left Behind)
[(Standard + Advanced + Honors + Adult Diplomas 05-06)] ÷ [(Standard + Advanced + Honors + Adult Diplomas 05-06) + Certifi-cates of Attendance 05-06 + Adjusted Diplomas 05-06 + 12th grade dropouts 05-06 + 11th grade dropouts 04-05 + 10th grade dropouts 03-04 + 9th grade dropouts 02-03]
Cumulative Promotion Index (enrollment includes reclassified 9th, 10th, and 11th graders and 5th yr seniors)
(10th grade enroll. Fall 06 ÷ 9th grade enroll. Fall 05) X (11th grade enroll. Fall 06 ÷ 10th grade enroll. Fall 05) X (12th grade en-roll. Fall 06 ÷ 11th grade enroll. Fall 05) X [(Standard+Advanced+Honors+Adult Diplomas 06) ÷ 12th grade enroll. Fall 05)]
Completion Ratio (enrollment includes reclassified 9th graders)
(Standard+Advanced +Honors + Adult Diplomas 05-06) ÷ (9th grade enrollment at count day 02)
Manhattan Institute for Policy Research Method (enrollment includes reclassified 9th and 10th graders)
(Standard+ Adv+Hon+Adult diplomas 2005-06) ÷ [((8th enroll. fall 01+9th enroll. fall 02+10th enroll. fall 03)÷3) + ((8th enroll. fall 01+9th enroll. fall 02+10th enroll. fall 03)÷3) x ((2005 census est.17yr olds – 2002 census est.14 yr olds) ÷ (2002 census est.14 yr olds))]
Averaged Freshman Graduation Rate (AFGR) (enrollment includes reclassified 9th and 10th graders)
(Standard+Advanced +Honors + Adult Diplomas 05-06) ÷ [(8th enroll. fall 01+9th enroll. fall 02+10th enroll. fall 03)÷3]
Education Collaborative of Washoe County / National Governors Association (EC/NGA) Cohort Rate
[On-time graduates in 05-06 ] ÷ [(first-time 9th graders 02-03) + (transfers in) – (transfers out)]
Table 1. Measures of High School Graduation
� Page 1� Special Report: High School Graduation Rate

Special Report: High School Graduation Rate
Leaver Rate 75%Cumulative Promotion Index 44%Completion Ratio 49%Manhattan Institute for Policy Research Method Using NV State Demographer’s estimates of 2002 14 yr olds and 2005 17 year olds Using NV State Demographer’s estimates of 2002 10-14 age range, and 2005 15-19 age range Using US Census Bureau’s estimates of 2002 10-14 age range, and 2005 15-19 age range
x48%48%55%
Averaged Freshman Graduation Rate 53%Education Collaborative of Washoe County / National Governors Association Cohort Rate 56%
Table 2. 2006 Graduation Rates by Method
Unlike the Leaver Rate, the next four graduation formulas in Table 1 are based on aggregated enrollment data. For most states, annual aggregated enrollment figures for the various high school grades submitted to the NCES primarily include first-time students at that grade level. But there are about 11 states,�including�Nevada,�for�whom�this�is�not�the�case.�Since�1999 by action of the Nevada State Board of Education, sta-tus�as�a�sophomore,�junior,�or�senior�is�dependent�on�earning�at least five, 11, and 17 credits, respectively. In Nevada, a second-year�high�school�student�who�has�not�earned�at�least�five credits by the start of the school year would be reclassi-fied as a freshman and would be included in the enrollment data for freshmen reported that year to the NCES for Nevada, whereas in another state that did not have a reclassification policy,�that�same�student�would�be�counted�as�a�sophomore.�
States�that�reclassify�students�in�this�way�have�a�much�larg-er�apparent�freshman�enrollment�than�other�states�because�of inclusion of both reclassified and first-year freshman in their enrollment counts. Reclassification affects apparent enrollment�at�the�other�grade�levels,�too,�but�has�the�most�dramatic�effect�on�freshman�enrollment.
Cumulative Promotion Index
The Cumulative Promotion Index (CPI), originally devel-oped�by�the�Urban�Institute(4), was selected by the Editorial Projects in Education Research Center as their reported(1)�
“graduation�rate”�and�forms�the�basis�for�the�graduation�studies published by Education Week(1). Like the Leaver Rate,�the�CPI�is�a�surrogate,�never�intended�to�describe�
� Page 1� Special Report: High School Graduation Rate

Special Report: High School Graduation Rate“the�percentage�of�a�freshman�class�that�graduates�in�four�years.”�Instead�the�CPI�estimates,�given�the�conditions�in�a�single�school�year,�the�chance�that�a�ninth�grader�will�be�pro-moted�to�tenth,�eleventh,�and�twelfth�grades�and�then�gradu-ate.�
For Nevada and WCSD, the 2006 CPI yields the lowest rate (44% for WCSD) (Table 2) for a variety of reasons. Because it only uses one year’s data (fall 2005 to fall 2006 for this study),�it�does�not�account�for�growth�in�student�enrollment�over�four�years.�It�also�assumes�that�growth�or�decline�in�en-rollment�from�one�grade�to�the�next�over�the�year�is�due�solely�to promotion. The most significant problem with this formula is�that�it�relies�on�enrollment�data�for�each�high�school�grade�level and as a result is affected by reclassification in Nevada. The denominators in the CPI calculation, most significantly the 9th graders, fall 2005, are much larger than first-time en-rollments.�
The effect of Nevada’s policy of reclassification of credit-defi-cient�students�on�any�graduation�measure�that�relies�on�enroll-ment data cannot be overstated. Figure 1 shows the 10-year history of the CPI in WCSD and Nevada compared to the na-tion�(1b). Prior to 1999, WCSD’s and Nevada’s CPI was around 70%, slightly higher than the national average.
In 1999, when Nevada instituted reclassification, the CPI for WCSD and Nevada dropped 20 percentage points in a single
year. This drop was caused by the change in policy regard-ing credit-deficient students, which artificially deflated the CPI.
Figure 1. Ten-Year Trend in the Cumulative Promotion Index for WCSD, Nevada, and the U.S.(From (1) Editorial Projects in Education Research Center, 2006b)
The precipitous drop in the Washoe County School District and Nevada rates in 1999 was the result of introduction of a policy of reclassifying credit-deficient students by the Nevada State Board of Education that changed enrollment data for Nevada used in this calculation.
� Page 1� Special Report: High School Graduation Rate

Special Report: High School Graduation Rate
Completion Ratio
The Completion Ratio(1) is a rather simplified estimate of the�percentage�of�freshmen�that�graduates�four�years�later�that also relies on enrollment data. For that reason, it has the same problem with an inflated denominator as the CPI. The Completion Ratio is the ratio of graduates in a given year�to�the�ninth�grade�enrollment�in�the�school�year�four�years earlier. For districts or states with declining or in-creasing�student�enrollment,�the�Completion�Ratio�will�under-report�or�over-report�the�rate�respectively�because�students�who�have�moved�out�of�the�district�will�not�be�reflected in the numerator and students who have moved in will not appear in the denominator. The Completion Ratio also seriously under-reports the rate for states like Nevada with reclassification (Table 2); the denominator of the Completion Ratio (5,637 students) includes both reclas-sified and first-time ninth graders. The 2006 Completion Ratio for WCSD is 49% (Table 2).
Manhattan Institute for Policy Research Method
The Manhattan Institute for Policy Research method(5)�(Manhattan�rate)�is�an�attempt�to�estimate�the�percentage�of a freshman class that graduates in four years, taking into account both reclassification of credit-deficient students and population changes. The original freshman cohort is
estimated�by�averaging�a�class’s�enrollment�in�its�eighth-grade year (not affected by reclassification), ninth-grade year (affected by reclassification), and tenth-grade year (af-fected by both reclassification and dropouts). Adjustments for�population�change�are�made�based�on�the�U.S.�Census�Bureau’s�annual�estimated�population�of�17-year�olds�and�14-year olds by state. However, the Bureau does not make such�estimates�for�counties,�although�it�does�annually�esti-mate the population of 10-14 year olds and 15-19 year olds for counties. In Nevada, the State Demographer also makes annual�population�estimates�of�both�the�single�ages�and�age�spans used by the Census Bureau; however, because the De-mographer�uses�different�methods�than�the�Census�Bureau,�their growth rates are very different. Table 2 gives the grad-uation�rate�using�all�three�estimates�for�population�change,�resulting in a 2006 Manhattan rate for WCSD ranging from 48% to 55%. The Manhattan rate is usually reported only at�the�state�level�because�the�census�data�it�requires�are�not�available�by�school�district�in�those�states�(most�in�the�U.S.)�where�school�districts�cross�county�lines.
Averaged Freshman Graduation Rate
Most recently, the National Center for Education Statistics(6)�has developed the Averaged Freshman Graduation Rate (AFGR), which in a study of two states yielded the closest rate�to�a�cohort�high�school�graduation�rate�as�computed�in�those states. The AFGR combines elements of the Comple-
� Page 20 Special Report: High School Graduation Rate

Special Report: High School Graduation Ratetion Ratio and the Manhattan rate. The number of graduates receiving�a�regular�diploma�in�a�given�school�year�is�divided�by�the�average�of�the�eighth-grade�enrollment�four�years�previously,�the�ninth-grade�enrollment�three�years�previously,�and the tenth-grade enrollment two years previously. The averaging is an attempt to mitigate the effects of reclassifica-tion. However, this method does not take into account enroll-ment growth over the four years. The 2006 AFGR for WCSD is 53% (Table 2).
Education Collaborative/National Governors Association Cohort Rate
As described in detail in Part II of this report, the Data Profile Group undertook the first-ever attempt to calculate a student-by-student,�cohort,�four-year�high�school�graduation�rate�based on the NGA formula as further defined by the Educa-tion Collaborative of Washoe County (EC/NGA cohort rate of Table 1 and Table 2). Unlike all five of the formulas just described, the EC/NGA cohort rate is based on a student-by-student analysis and not on aggregated data. The 2006 EC/NGA cohort rate for WCSD is 56%, higher than the AFGR, Manhattan�rate,�and�Completion�Ratio�that�are�all�estimates�of�the�same�concept�of�“percentage�of�a�freshman�cohort�that graduates.” The EC/NGA cohort rate of 56% for WCSD is also significantly higher than the CPI but is significantly lower�than�the�Leaver�Rate,�neither�of�which�measures�the�“percentage�of�a�freshman�cohort�that�graduates.”�
Causes of Different Results
There appear to be four major contributors to the different results�from�these�six�formulas:•� Cohort�as�opposed�to�aggregated�data•� Student�population�growth�and�whether�it�is�factored��� into�the�formulas• Whether or not students are reclassified based on the number of credits earned, which is reflected in aggre- gate enrollment data including both first-year and re- � peating�students�at�a�grade�level•� What�the�formula�is�or�is�not�measuring
Of�the�various�formulas�for�high�school�graduation�rate�dis-cussed in this report, only the EC/NGA cohort rate is based on a cohort of individually identified students using longitu-dinal student data. The other formulas use aggregated enroll-ment,�dropout,�and�graduation�data�reported�on�an�annual�basis. This is a significant distinction in areas of population change and/or student mobility. Only by using longitudinal student cohort data will a formula accurately reflect what the student�population�of�a�district�is�doing.�In�contrast,�aggre-gated data will mask what may have happened to students who�enrolled�in�but�later�left�the�district�or�who�entered�the�district�after�their�freshman�year.�While�this�is�an�important�philosophical�distinction�and�one�that�is�often�cited�to�ex-plain�the�results�of�the�formulas�that�use�aggregated�data,�its�impact on the final calculation of graduation rates for WCSD
� Page 21 Special Report: High School Graduation Rate

Special Report: High School Graduation Rate
may�not�be�high�and�is�almost�certainly�much�lower�than�that�caused�by�the�other�different�factors.�Clearly�some�of�the difference in the 2,750 graduates used as the numerator in�the�formulas�that�use�aggregated�data�compared�to�the�2,848 graduates in the cohort formula is the result of not using or using cohort data, but most of the 2,750 Class of 2006 graduates are from the 2002-2003 freshman cohort. A major cause of this difference is that the Nevada Depart-ment of Education does not include students who earn an Adult Diploma through an adult program in the aggregated graduate�data,�even�if�those�students�belong�to�the�2002-2003 freshman cohort. There are also differences in the denominators�resulting�from�using�aggregated�instead�of�cohort�data,�but�they�are�probably�smaller�than�differences�caused by effects of reclassification and growth.
From fall of 2002 through spring of 2006, WCSD was experiencing�rapid�growth�as�it�had�for�about�20�years;�the�rate of growth district wide declined significantly from 2004 to 2005. Neither the Cumulative Promotion Index, the Completion Ratio, nor the AFGR takes growth or decline in�a�district’s�student�population�into�account�in�the�calcula-tion. This omission will be reflected in the different results to�the�extent�a�district�is�gaining�or�losing�student�popula-tion. For a growing district like WCSD, failure to account for�growth�will,�by�itself,�tend�to�over-report�the�graduation�rate. In the case of WCSD using the 2002-2003 freshman cohort and the Completion Ratio formula, failing to take
into�account�transfers�in�and�out�over�three�years�would�yield a graduation rate of 61% compared to the 56% cal-culated taking net growth into account. It should be noted that it is difficult to compensate for growth using aggregate enrollment�data�rather�than�cohort�data�as�evidenced�by�the�three different results for the Manhattan rate shown in Table 2�that�use�growth�estimates�from�the�U.S.�Census�Bureau�and the Nevada State Demographer, which are very differ-ent estimates. The Nevada State Demographer estimated an 18% growth rate in the cohort covered by this study over three years, compared to an estimated 2% growth rate in the same�cohort�as�estimated�by�the�U.S.�Census�Bureau;�this�difference�produced�a�seven�percentage�point�difference�in�the�resulting�calculation�of�graduation�rate.
Far more significant in its effect on the graduation rate calculation is whether a state and/or district reclassifies students�based�on�credits�earned�and�consequently�includes�repeating�students�in�enrollment�counts�for�a�given�grade�level.�Nevada�is�one�of�the�few�states�that�does�assign�students to grade levels based on reclassification. When Nevada then reports its enrollment figures by high school grade, the figures include both first-time and repeating stu-dents. As vividly illustrated in Figure 1, Nevada’s policy of reclassification resulted in a 20 percentage point drop in the high�school�graduation�rate�in�1999�using�the�Cumulative�Promotion Index compared to not using reclassification the year before. Based on using the 2002-2003 freshman cohort
� Page 22 Special Report: High School Graduation Rate

Special Report: High School Graduation Rate
� Page 23 Special Report: High School Graduation Rate
and�the�Completion�Ratio�formula,�it�is�estimated�that�the�state�policy of reclassification alone results in at least an 11 percent-age�point�drop�in�the�graduation�rate�compared�to�using�only�first-time freshmen in the calculations. The Manhattan Rate and AFGR try to compensate for reclassification by averaging eighth-,�ninth-,�and�tenth-grade�enrollments,�but�because�two�of the three grades averaged are impacted by reclassification, this�is�only�a�partial�compensation.
Also very significant in causing differences in the results of the�various�calculations�is�the�nature�of�each�formula,�includ-ing�what�each�formula�is�trying�to�describe�and�the�nature�of�the�data�used.�By�using�aggregate�data�from�the�graduating�class of 2006 for the number of graduates, the five non-cohort formulas all include graduates who have taken more than four years to graduate, in contrast to the four-year EC/NGA cohort calculation. This causes an over-reporting of the graduation rate�of�about�one�percentage�point.�More�important�are�issues�such�as�the�basis�of�the�Leaver�Rate,�which�is�based�only�on�graduates, certified completers, and dropouts, ignoring other non-graduates.�Because�of�the�much�smaller�denominator�in�this formula, it significantly over-reports the “graduation rate.” The CPI also has assumptions in the formula that affect the resulting�“graduation�rate,”�e.g.�the�assumptions�that�promo-tion is directly reflective of graduation and that the number of students�in�a�grade�compared�to�the�number�in�the�next-lower�grade�the�previous�year�is�due�solely�to�promotion.�
To summarize, the policy of reclassifying students based on credits�earned,�as�Nevada�and�a�few�other�states�do,�causes�under-reporting�of�high�school�graduation�rates�by�as�much�as�11�to�20�percentage�points�in�formulas�that�use�aggregate,�an-nually�reported�enrollment�data,�such�as�the�CPI,�Completion�Ratio, Manhattan Rate, and AFGR. Over-reporting or under-reporting�of�the�graduation�rate�by�a�similar�magnitude�can�be�caused�by�assumptions�and�bases�of�various�formulas�that�are�used�as�surrogates�for�graduation-rate�estimates,�such�as�the Leaver Rate and CPI. Failure to take growth into account in formulas such as the CPI, Completion Ratio, or AFGR that use�aggregated�rather�than�cohort�data�causes�over-reporting�of�graduation�rates�in�growing�districts,�e.g.�over-reporting�by five percentage points in the case of the Completion Ratio. While�using�longitudinal�student�data�in�a�cohort�is,�in�and�of�itself,�more�accurate�than�using�aggregate�data,�one�of�its�real�advantages�may�be�that�it�is�the�only�method�that�can�effec-tively take into account change in student population, growth, and reclassification. Combined with an accurate formula that calculates�a�four-year�graduation�rate,�longitudinal�student�data such as that used in the EC/NGA cohort rate yields the most�accurate�estimate�of�graduation�rate.�However,�as�dis-cussed�in�Part�II�of�this�report,�the�longitudinal�data�must�be�accurate�to�be�of�value,�especially�in�distinguishing�dropouts�from�students�who�transfer�out.�

Special Report: High School Graduation Rate
� Page 24 Special Report: High School Graduation Rate
The Advocacy Committee of the Education Collaborative of Washoe County developed the following definition of high school�graduation�rate�that�is�aligned�to�both�the�requirements�of NCLB and the definition developed by the National Gover-nors�Association.
The high school graduation rate for the 2002-2003 freshman cohort is specifically defined as: Out of a freshman cohort made up of all first-time freshmen enrolled and present for at least one day in the 2002-2003 school year plus transfers into�the�cohort�minus�transfers�out�of�the�cohort�over�the�next�three�years,�the�percentage�who�graduated�with�a�standard,�advanced, honors, or adult diploma by August of 2006. Trans-fers�out�of�the�cohort�are�limited�to�four�groups�of�students:�1)�Students�who�left�to�enroll�in�a�Washoe�County�private,�parochial,�or�charter�school�or�who�there�was�reasonable�evi-dence�to�believe�had�moved�from�Washoe�County�and�were�attending�school�elsewhere�inside�or�outside�of�Nevada,�or�2)�Students who withdrew to undertake a program of distance education from a provider other than WCSD or a program of home schooling, or 3) Students who were incarcerated out-side of Washoe County and who had not returned to WCSD by the end of their fourth year of schooling, or 4) Students who�died�prior�to�graduation.�Reasonable�evidence�to�count�a�student as a transfer-out enrolled in school outside of WCSD
must�be�one�of�the�following:�1)�Request�for�transcript�by�the�receiving school to the WCSD school, or 2) Parent comple-tion of a withdrawal form that included checking the box to indicate�intention�to�enroll�the�child�in�a�school�at�the�new�location, or 3) A statement by an adult upon investigation by WCSD who said that the student had moved from Washoe County�and�was�believed�to�be�in�school�elsewhere.�
Expressed as a formula, the EC (Education Collaborative) / NGA (National Governors Association) cohort rate equals:
Number of 4-Yr Graduates (1st-Time Freshmen) + (Total Transfers In) - (Total Transfers Out)
4-Yr Graduates includes standard, advanced, honors and adult diplomas.1st-Time Freshmen includes 9th graders who transferred in during the 2002-03 school year.Total Transfers In includes all transfers-in that occured between the cohort’s sophomore and senior years.Total Transfers Out includes all transfers-out that occured between the cohort’s freshman and senior years.
WSCD, as is true of most districts and states, has never be-fore�attempted�to�calculate�a�cohort�high�school�graduation�rate,�i.e.�a�rate�that�follows�a�freshman�class�on�an�individual�student�basis�to�determine�which�students�graduate.�Other�formulas�use�aggregated�student�data,�i.e.�counts�of�the�num-ber of graduates or enrollees in a given school year. This study represents the first attempt to calculate a cohort high school graduation rate for WCSD.
Part II: Calculation of the EC/NGA High School Graduation Rate for the WCSD 2002-2003 Freshman Cohort

Special Report: High School Graduation Rate
� Page 2� Special Report: High School Graduation Rate
Calculation of the Graduation Rate
The first step in this calculation is determination of the number of students in the 2002-2003 freshman cohort. Table 3 shows the�calculation�of�the�total�number�of�students�who�enrolled�in this cohort from the first day of the 2002-2003 school year through�June�2006,�regardless�of�whether�the�student�contin-ued enrollment through June 2006. There were 6,001 students enrolled�in�this�cohort�at�some�point�of�the�four�high�school�years. Although Nevada is known for having a highly transient student population, it should be noted that 77% of the total number of enrollees in this cohort entered WCSD for the first time as freshmen and 89% had entered WCSD for the first time�by�the�end�of�their�sophomore�year.�
To determine the total number of students in the 2002-2003 freshman�cohort�over�their�high�school�career,�transfers-out�must be subtracted from the number of total enrollees. The EC/NGA cohort rate formula limits transfers out to those catego-ries described above, and Table 4 calculates the number of stu-
dents from the 2002-2003 freshman cohort who transferred out of WCSD before the end of the 2005-2006 school year and�did�not�return.�It�is�important�to�understand�that�there�are undoubtedly additional students who left WCSD and en-rolled in high school somewhere else, but for whom WCSD has�no�evidence�of�their�having�done�so.�In�the�absence�of�any of the three specific types of evidence for transfer out described�above,�these�students�are�not�subtracted�from�the�cohort.
WCSD Freshman Cohort in 2002-2003 School YearEnrollees = First Time Freshman + Transfers In
Number of 1st-Time Freshmen (2002-03) 4,641Number of 2nd Year Transfers In (2003-04) 682Number of 3rd Year Transfers In (2004-05) 431Number of 4th Year Transfers In (2005-06) 247Total Number of Enrollees 6,001
Table 3. Total Enrollees in the Freshman Cohort of 2002-2003
Table 4. Transfers-Out from the Total Enrollees in the 2002-2003 Fresh-man Cohort
WCSD Freshman Cohort in 2002-2003 School YearVerified Transfers Out Over Four Years
In-State Transfer 407Out-of-State Transfer 486Transfer Out to Home School or Distance Education 33Incarcerated Outside Washoe County 11Died 6Total Verified Transfers-Out (2002-2006) 943
To calculate the total number of students in the 2002-2003 freshman�cohort�over�their�high�school�career,�the�number�of�students�who�transferred�out�is�subtracted�from�the�total�number of enrollees in the cohort. This calculation is shown in Table 5. There were 5,058 students in the 2002-2003 freshman�cohort.

Special Report: High School Graduation Rate
� Page 2� Special Report: High School Graduation Rate
WCSD Freshman Cohort in 2002-2003 School YearFirst Time Freshmen (2002-03) + Transfers-In - Transfers-Out
First Time Freshmen 2002-03 4,641Transfers-In 2003-2006 1,360Transfers-Out 2002-2006 943Total 2002-03 Freshman Cohort 5,058
Table 5. Total 2002-03 Freshman Cohort
WCSD Freshman Cohort in 2002-2003 School YearGraduates by August 2006
Adult Diploma 183Standard Diploma 1,472Advanced Diploma 541Honors Diploma 652Total Graduates 2,848
Table 6. On-Time, 4-Year Graduates from the 2002-2003 Freshman Cohort
From this specific cohort of students, a total of 2,848 had graduated�with�a�standard,�advanced,�honors,�or�adult�diploma�by August of 2006, as itemized in Table 6. These are consid-ered�on-time�graduates,�some�of�whom�graduated�in�fewer�than�four�years.�It�is�important�to�understand�that�there�are�two�additional�categories�of�high�school�completers�autho-rized�by�Nevada�Revised�Statutes�but�not�included�as�“gradu-ates”�either�in�this�study�or�in�aggregated�data�used�in�national�studies. They are students earning an Adjusted Diploma and those earning a Certificate of Attendance. An Adjusted Di-ploma,�under�Nevada�law,�can�only�be�awarded�to�a�Special�Education student who completes whatever graduation re-quirements�are�determined�to�be�appropriate�for�that�student�in�the student’s Individualized Education Plan (IEP) by the IEP team.�Such�requirements�are�less�than�those�required�by�the�Nevada Department of Education for either a standard or adult diploma. For that reason and because federal law requires that for�purposes�of�calculating�the�graduation�rate�a�graduate�must�have�met�at�least�the�minimum�academic�requirements�for�his/her state’s regular diploma, Adjusted Diploma graduates are�not�included�in�the�calculation�of�high�school�graduation�
rate. However, under Nevada law, Adjusted Diplomas carry the�same�graduation�status�as�regular�diplomas.
Under Nevada law, a student is awarded a Certificate of At-tendance if he/she has completed all of the credits required for�graduation�but�has�failed�to�pass�one�or�more�sections�of�the High School Proficiency Examination; a student must pass all sections of the High School Proficiency Examination to be awarded a regular diploma. A Certificate of Attendance does�not�have�the�status�of�a�diploma�under�Nevada�law.�Stu-dents earning a Certificate of Attendance are not included as “graduates”�in�calculating�high�school�graduation�rates.�
The EC/NGA cohort rate for the 2002-2003 freshman cohort�is�calculated�by�dividing�the�number�of�graduates�within�four�years�by�the�number�of�the�freshman�cohort.�Table 7 shows that calculation. The EC/NGA 4-year cohort high school graduation rate for the 2002-2003 freshman cohort was 56%.

Figure 2. EC/NGA, 4-Year High School Graduation Rate for the 2002-2003 Freshman Cohort by Ethnicity
Figure 3. Distribution of Students by Ethnicity in the 2002-2003 Fresh-man Cohort Compared to the Distribution Among Graduates of the Cohort
Special Report: High School Graduation Rate
� Page 2� Special Report: High School Graduation Rate
In�accordance�with�recommendations�from�the�Advocacy�Committee of the Education Collaborative and aligned with recommendations of the National Governors Association (3), Table 7 also shows the 5-year graduation rate for the same freshman cohort, which is 58%. This includes students who earned�one�of�the�same�recognized�diplomas�by�the�end�of�five, rather than four, years.
WCSD Freshman Cohort in 2002-2003 School YearEC/NGA Cohort High School Graduation Rate
4-Year Gradua-tion Rate
5-year Gradua-tion Rate
Standard, Advanced, Honors and Adult Diplomas 2,848 2,942Total Freshman Cohort 2002-2003 5,058 5,058Graduation Rate 56% 58%
Table 7. EC/NGA, 4-Year and 5-Year High School Graduation Rate for the 2002-2003 Freshman Cohort
Graduation rates for students of various ethnicities in the 2002-2003 freshman cohort vary significantly. Figure 2 compares the EC/NGA rate by ethnicity. Figure 3 displays the�differing�graduation�rates�in�a�different�way�by�compar-ing the ethnic make-up of the 2002-2003 freshman cohort as a whole to the ethnic make-up of the graduates of the cohort. The lower graduation rates (Figure 2) of African-American, American�Indian,�and�Hispanic�students�results�in�a�lower�percentage�of�those�students�among�the�graduates�than�among the original cohort (Figure 3).
Special Report: High School Graduation Rate
� Page 2� Special Report: High School Graduation Rate
An�obvious�question�is�what�happened�to�those�students�who�did not graduate within four years. Formulas using aggre-gated�data�cannot�shed�light�on�this�critical�question.�Only�an�actual�student-by-student�count�of�a�cohort�can�do�that,�and for WCSD the EC/NGA cohort rate shows that 44% of the 2002-2003 freshman cohort did not graduate within four years. As shown on Table 7, 2% of the cohort graduated in their fifth year. In addition (Table 8), 6% earned an Adjusted Diploma or a Certificate of Attendance within four years and “walked across the stage.” Some students (12%) dropped out over the four years, and WCSD was able to verify their status�as�dropouts.�It�should�be�noted�that�the�“dropout�rate”�reported annually by WCSD in accordance with state and federal�guidelines�is�an�annual�rate�across�all�four�grades�of�high school and does not reflect the four-year history of a given�freshman�cohort;�it�bears�no�relationship�to�the�data�in�this�report.
An estimated 11% of the students from the 2002-2003 fresh-man cohort were no longer enrolled in a WCSD high school by the end of the 2005-2006 school year, but there was no information to confirm whether they were dropouts or trans-fers-out (Table 8). These students, referred to as “vanished” by the National Governors Association(3)�and�given�that�same designation in this report, are kept in the cohort and therefore are assumed to be dropouts for the EC/NGA co-hort�rate�calculation,�but�among�these�students�are�certainly�
an�indeterminable�number�who�are�legitimate�transfers�out.�Included�in�this�group�are�students�who�leave�school�between�school�years,�but�there�is�no�record�in�the�student�information�system�of�whether�they�transferred�out�or�dropped�out.
Finally there are students from the 2002-2003 freshman cohort�who�had�not�earned�enough�credits�to�graduate�by�the�end of the 2005-2006 school year; some may also have failed to pass one or more sections of the High School Proficiency Examination, but regardless of that were credit deficient and could not graduate. These students are referred to as credit-deficient non-graduates in Table 8. They can be divided into two groups – credit-deficient seniors and reclassified under-classmen (as described in Part I). Credit-deficient seniors would�have�earned�at�least�17�credits�by�some�time�in�their�senior�year�but�would�have�failed�to�earn�the�minimum�of�22.5 credits needed to earn a standard diploma (20.5 for an adult diploma) by graduation. WCSD’s student information system is not currently configured to distinguish credit-defi-cient seniors from reclassified underclassmen easily. For pur-poses of this report, students classified as “credit deficient” include those whose records show they were credit-deficient at the end of the 2005-2006 school year; non-graduates with no fourth-year withdrawal data who enrolled in their fifth year; non-graduates who received an Adjusted Diploma or Certificate of Attendance after August, 2006 but before December, 2007; students shown as in-district transfers in
Part III: Accounting for Non-Graduates from the 2002-2003 Freshman Cohort

Special Report: High School Graduation Rate
� Page 2� Special Report: High School Graduation Rate
their�fourth�year�who�may�or�may�not�have�actually�enrolled�in another WCSD school; and students enrolled at the start of the 2005-2006 year whose records show no evidence of withdrawal�or�dropping�out�but�who�did�not�graduate�in�2006.�It is acknowledged that this final category may include some students�who�transferred�out�or�dropped�out�in�their�senior�year,�but�no�evidence�exists�in�the�student�information�system�that the student left school. Credit-deficient students constitute the largest single group of non-graduates from the 2002-2003 freshman cohort – 13%, but comparable in size to the groups of students who were verified dropouts or who vanished.
Table 8 shows the number and percentage of the 2002-2003 freshman�cohort�who�had�failed�to�graduate�by�August�2006.�Appendix A shows the breakdown of students in the Credit-Deficient, Vanished, and Verified Dropouts categories based on�withdrawal�codes�used�in�Nevada.Table 8. Students from the Freshman Cohort of 2002-2003 Who Failed to Graduate
WCSD Freshman Cohort in 2002-2003 School YearNon-Graduates by August 2006
Number of Students Percent of Cohort
5th Year Graduates in 2007 94 2%Adjusted Diploma 2006 185 4%Certificate of Attendance 2006 115 2%Credit-Deficient Non-Graduates (2006) 641 13%Vanished Students (2002-2006) 578 11%Verified Dropouts (2002-2006) 597 12%Total Non-Graduates 2,210 44%
Graduation Rate of Reclassified Students
As�discussed�above,�since�1999�in�Nevada,�students�are�classified by grade level according to the number of credits they have earned rather than their year in school (5 credits to be�a�sophomore;�11�to�be�a�junior;�17�to�be�a�senior).�Stu-dents�who�do�not�meet�these�credit�requirements�are�reclas-sified to the next lower grade or an even lower grade for severely credit-deficient students. Of the 5,058 students in the 2002-2003 freshman cohort, 1,247 or 25% were reclas-sified at least once at some point in their high school career, most of them reclassified to a lower grade rather than a higher�one.�
Figure 4 shows the status of all the students of the 2002-2003 freshman cohort as of August 2006, including on-time,�four-year�graduates�and�non-graduates.�Of�those�members�of�the�cohort�who�failed�to�graduate�within�four�years, the largest group is credit-deficient students, closely followed�by�dropouts�and�by�students�for�whom�the�district�cannot�verify�whether�they�transferred�out�or�dropped�out�(vanished).
Figure 5 shows the status of these 1,247 reclassified stu-dents by August 2006. Compared to a four-year EC/NGA graduation rate of 56% for the entire freshman cohort, only 11% of reclassified students graduated within four years, and only an additional 4% graduated within five years.

Special Report: High School Graduation Rate
� Page 30 Special Report: High School Graduation Rate
Figure 4. Status of the Freshman Cohort of 2002-2003 After Four Years
Graduates & Non-Graduates by August 2006 (5,058 Students)

Special Report: High School Graduation Rate
� Page 31 Special Report: High School Graduation Rate
Figure 5. Status of Reclassified Students of the 2002-2003 Freshman Cohort After Four Years

Special Report: High School Graduation Rate
� Page 32 Special Report: High School Graduation Rate
Conclusions
Measurement�of�high�school�graduation�rates�is�an�impor-tant�accountability�indicator�for�high�schools,�school�dis-tricts,�and�states.�While�most�people�consider�“high�school�graduation�rate”�to�signify�the�percentage�of�a�freshman�class�that�graduates�in�four�years,�that�is�a�challenging�sta-tistic�to�measure�directly�for�most�large�school�districts�and�states.�
There are a variety of formulas used to calculate high school�graduation�rate.�Indirect�formulas�that�rely�on�en-rollment�data,�such�as�the�Cumulative�Promotion�Index�and Completion Ratio, seriously inflate the size of the “freshman class” by including reclassified, credit-deficient students in states like Nevada that base class assignment on�the�number�of�credits�earned.�Such�formulas�will�under-state�the�“graduation�rate.”�Other�methods�fail�to�consider�population�growth�or�decline.�One�method,�the�Leaver�Rate,�describes�graduates�as�a�percentage�of�those�stu-dents who officially leave school, which does not consider students�who�stayed�in�school�but�failed�to�graduate;�that�rate is much higher than the other rates. The most accurate measure�of�high�school�graduation�rate�is�a�cohort�study�of�a�given�freshman�cohort,�but�most�very�large�school�districts�and�states,�including�Nevada,�are�not�yet�able�to�complete�such�a�study.
This study calculated each of five commonly used indirect formulas as well as the National Governors Association cohort formula, further defined by the Education Collab-orative (EC/NGA cohort rate), to measure the 2006 high school graduation rates for WCSD. Five of these formulas rely�on�annually�reported,�aggregated�data�rather�than�a�cohort�of�individual�students.�Results�ranged�from�a�Cumu-lative Promotion Index of 44% to the Leaver Rate of 75%. The EC/NGA cohort rate was 56%.
In order to begin the work of increasing the graduation rate for WCSD students, it is important to identify what happened�to�those�students�who�failed�to�graduate.�Only�a�student-by-student�cohort�calculation�can�provide�that�information. Different reasons for not graduating could re-quire different types of interventions, which make this in-formation�so�valuable.�It�is�often�assumed,�incorrectly,�that�all�non-graduates�are�dropouts.�Of�the�students�in�the�2002-2003 freshman cohort, 6% earned either of two completion credentials�recognized�by�Nevada�law,�i.e.,�an�Adjusted�Diploma available only to Special Education students or a Certificate of Attendance for students who passed all of the�credits�required�for�graduation�but�who�failed�one�or�more sections of the High School Proficiency Examina-tion;�these�students�cannot�be�counted�as�graduates�under�federal criteria. Up to 13% of the cohort failed to graduate because�after�four�years�they�still�had�not�earned�enough�

Special Report: High School Graduation Rate
� Page 33 Special Report: High School Graduation Rate
credits to receive a diploma. A total of 12% of the cohort are known to have dropped out. At least 11% were no lon-ger�enrolled�in�school�by�graduation,�but�either�the�district�has�no�information�on�whether�these�students�transferred�out�or�dropped�out�or�such�information�cannot�readily�be�retrieved�through�the�student�data�management�system.
This year’s study of high school graduation rates for WCSD continues the efforts of the Data Profile to provide data�that�can�help�improve�student�achievement�and�the�success of students, K-16. Graduation from high school is�critical�to�the�future�success�of�students�and�to�develop-ment of a skilled workforce in Washoe County. The Data Profile Group thanks Superintendent Paul Dugan and his staff�for�their�efforts�in�completing�the�calculations�for�this�study.
REFERENCES
1. Editorial Projects in Education Research Center, 2006a, Diplomas Count – Nevada; An essential guide to graduation policy and rates: The Graduation Project 2006, 6 p.---2006b, Special report; Washoe County School District, Nevada: The Graduation Project, 2006, 5 p.--- 2007c, Nevada; Ready for what? Preparing students for college, ca-reers, and life after high school: Diplomas Count – The Graduation Project 2007, 7 p.
2. National Governors Association, 2005, Graduation counts; A report of the National Governors Association task force on state high school graduation data.
3. Council of Chief State School Officers, 2006 (December), Implement-ing the NGA Graduation Rate Compact; Recommendations for state data managers, 15 p.
4. Swanson, C. B., 2004 (February 25), Who Graduates? Who Doesn’t? A statistical portrait of public high school graduation, Class of 2001: The Urban Institute, Education Policy Center, Washington, D. C.
5. Greene, J. P. and Winters, M. A., 2005 (February), Public high school graduation and college-readiness rates: 1991-2002: Manhattan Insti tute for Policy Research Education Working Paper, no. 8.
6. Seastrom, M. Chapman, C., Stillwell, R., et al., 2006 (August), User’s guide to computing high school graduation rates, volume 2: Technical evaluation of proxy graduation indicators (NCES 2006-605): U. S. Depart-ment of Education, National Center for Education Statistics, Washington, D. C., U. S. Government Printing Office.

Special Report: High School Graduation Rate
� Page 34 Special Report: High School Graduation Rate
Appendix A: Final Status of 2002-2003 Freshman Cohort MembersCategory Code Description Number Total Percent
On-Time Graduates
B18 Standard Diploma 1472
2848 56%H Honors Diploma 652
B19 Advanced Diploma 541
B24 Adult Diploma 183
5th Year Graduates
B18 Standard Diploma 58
94 2%H Honors Diploma 1
B19 Advanced Diploma 1
B24 Adult Diploma 34
Adjusted Diploma or CertificateB21 Adjusted Diploma 4th Year 185
300 6%B22 Certificate of Attendance 4th Year 115
Credit Deficient
B21 Post 4th Year Adjusted Diploma 28
641 13%
B22 Post 4th Year Certificate of Attendance 16
W11 Withdrawn: Credit Deficient 236
W1C In-District Transfer in 4th Year: Assumed Credit Deficient 1 99
- 05-06 Grade = 12, No Withdrawal Data, Enrolled in 5th Year 11
- 05-06 Grade = 12, No Withdrawal Data, Not Enrolled in 5th Year 89
- 05-06 Grade = 9, 10, 11 or Adult, No Withdrawal Data Enrolled in 5th Year 19
- 05-06 Grade = 9, 10, 11 or Adult, No Withdrawal Data, Not Enrolled in 5th Year 127
- Not Enrolled in 05-06, No Withdrawal Data, Dropout=N 16
Vanished
W6 Withdrawn: 10 Consecutive Days Absent Whereabouts Unknown 124
578 11%W1C In-District Transfer in 1st-3rd Year: Did Not Re-enroll 2 99
- Not Enrolled 05-06, No Withdrawal Data, Dropout=Blank 3 355
Dropout
W4 Withdrawn: Request of School 4 455
597 12%
W5A Withdrawn: Failing 2 or More Classes 2
W5B Withdrawn: Pregnancy 1
W5C Withdrawn: Marriage 2
W5D Withdrawn: Employment 2
W5F Withdrawn: Court Authorized (NRS 392.090) 1
W5G Withdrawn: Self/Parent Support 17
W5I Withdrawn: Other Parent/Student Request 52
W10 Withdrawn: Any Other Reason 24
- No Withdrawal Data, Dropout=Y 5 41
Total 2006 Cohort 5058 100%
�

Special Report: High School Graduation Rate
� Page 3� Special Report: High School Graduation Rate
Appendix A (cont.): Final Status of 2002-2003 Freshman Cohort Members
Category Code Description Number Total Percent
Transferred Out or Deceased
W2 Transfer: In-State 407
943 (Not Appli-cable)
W3 Transfer: Out of State 486
W8 Transfer: Homeschool 33
W7 Transfer: Incarcerated Outside Washoe County 11
W9 Deceased 6
�1. Non-grad with an in-district transfer during 4th year (i.e. transfers to Washoe Adult, some ultimately enrolled, some didn’t). 2. In-district transfer between fall 2002 and summer 2005, but did not re-enroll in a district school. 3. Includes undocumented summer transfers. (NOTE: Dropout field was instituted in 2005.) 4. Detailed description of W4 code: Use W4 when the school decides to withdraw the student for a reason other than those for which there are established codes. One example could be because the student will be gone for an extended period of time but does not fall in the not attending one day in a stat-month category. Must have documentation of why chose to use W4. 5. Includes only records with dropout=Y that did not have a withdrawal date or code . (NOTE: Dropout field was instituted in 2005.)

Annual Report Contents
� Page 3� Contents
High School Measures
State Reported Graduation Rates
State Reported Dropout Rates
Enrollment in Higher Level Courses
College Entrance Exams
Millennium Scholarships
College MeasuresCapture Rates
Remediation
College Going Rates
Persistence Rates
College Success
Overall College Graduation Rates
College Graduation Rates by High School
Summary Trends in 2005-06 Data
Major Areas of Study
UNR College Entrance Exams
Page 94
Page 93
Page 91
Page 66
Pages 37-39
Pages 40-41
Pages 43-45
Pages 46-59
Pages 60-65
Pages 67-69
Pages 70-76
Pages 77-82
Pages 83-86
UNR Graduation Rates Page 92
Pages 87-90

� Page 3� Summary
Summary of Data Trends WCSD Graduates Including the Class of 200�
High School Trends
SAT participation rates surpassed ACT participation rates in 200�. In each school year between 1��� and 2004, a higher percentage of WCSD graduates took the ACT than took the SAT. In 200�, the percentage of students taking the SAT equaled the percentage taking the ACT (3�%), and in 200�, the percentage taking the SAT (40%) surpassed the percentage taking the ACT (33%). Pages51(ACT)
Over the thirteen years for which data are available, average ACT and SAT scores for WCSD graduates have been consistently higher than the national and state averages. Although participation is declining, ACT scores have remained steady over the past seven years. Conversely, SAT scores increased steadily between 1��� and 2003, but have declined over the past three years, as the percentage of students taking the SAT has increased.
Enrollment in Advanced Placement (AP) and International Baccalaureate (IB) courses has steadily increased from 1�% of WCSD juniors and seniors in 1��� to 2�% of WCSD juniors and seniors in 200�.
In 200�-0�, all of WCSD’s comprehensive high schools achieved national ranking status on the AdvancedPlacementChallenge Index.Nationally ranked schools have an index of 1.0 or greater and are in the top five percent of the nation’s public schools on this measure. �
The lower percentage of 200� graduates eligible for the Millennium Scholarship - a reflection of the increased GPA require- ments implemented in 200� - carried over into the 200� graduating class. Fifty-one percent of 200� graduates were eligible. This is 12 percentage points below the 2003 high of �3%, and approaches the initial eligibility rate of �0% in 2000. Page66
»
»
»
»
»
Page62
58(SAT)and
Pages46(ACT) 53(SAT)and
Page65

� Page 3� Summary
College Trends
Over �0% of WCSD 200� graduates went on to higher education in the fall immediately following graduation. This percentage is higher than the 200� national average of ��% and the 200� state average of �3%.
The percentage of WCSD graduates enrolling in UNR has increased overall, from 23% in 1��� to 30% in 200�. Given Washoe County population increases over the last ten years, the comparatively moderate percentage increases do not reflect the true magnitude of the number increases. In 1���, 4�� WCSD graduates enrolled in UNR, compared to ��� graduates in 200�.
The percentage of WCSD graduates enrolling in TMCC has also increased overall, from 14% in 1��� to 2�% in 200�. As with UNR en- rollments, the number of WCSD graduates enrolling in TMCC has increased dramatically, from 2�� in 1��� to �32 in 200�. Pages71-72
With the exception of the Hispanic population, the ethnic diversity of WCSD graduates who entered UNR or TMCC as freshmen in 200� closely mirrored that of the WCSD Class of 200�. The percentage of WCSD Hispanic graduates who entered TMCC was higher than their percentage among graduates, and the percentage who entered UNR was lower than their percentage among graduates. Page76
WCSD’s graduates’ need for remedial college classes has remained steady over the past three years. Thirty-three to thirty-nine per cent of WCSD graduates enrolling in UNR require remedial courses in English and/or math. Seventy-two to seventy-six percent of WCSD graduates enrolling in TMCC require remedial courses in English and/or math. Page78
Persistence rates of WCSD graduates at TMCC and UNR have remained steady over the past six years. Approximately �0% of WCSD graduates attending TMCC return after one semester, and about �0% return after two semesters. Approximately �0% of WCSD graduates attending UNR return after one semester, and about �0% return after two semesters. Page83
»
»
»
»
»
»
WCSD Graduates Including the Class of 200�Summary of Data Trends
Pages71-72
Page68

� Page 3� Summary
Summary of Data Trends
Recommendations for Future Work
Extend the high school graduation rate study to include subsequent graduating classes.
Investigate factors that contribute to a student’s failure to graduate from high school.
Continue to examine Washoe County data at the four key transition points from high school to completion of a college degree: high school graduation rate, college-going rate, persistence rate after two college semesters, college graduation rate.
Continue to disaggregate selective data sets by student ethnicity.
Continue to improve the capability to identify factors that promote or retard student success in higher education.
»
»
»
»
»
College Success Trends: WCSD Graduates
Twenty-eight percent of the students who graduated from WCSD in 1��� (the first cohort studied by the Data Profile project) have earned a college degree. Page91
Similarly, 2�% of WCSD students who graduated in 1��� have earned a college degree. Page91
Twenty-six percent of WCSD students who graduated in 1��� have earned a college degree. Page91
Forty-seven percent of WCSD students who graduated in 2001 and enrolled at UNR have earned a Bachelor’s degree. This is slightly lower than the overall average of UNR 2001 freshmen (4�%), and slightly higher than other Nevada students who enrolled in UNR in 2001 (4�%). Page92
»
»
»
»
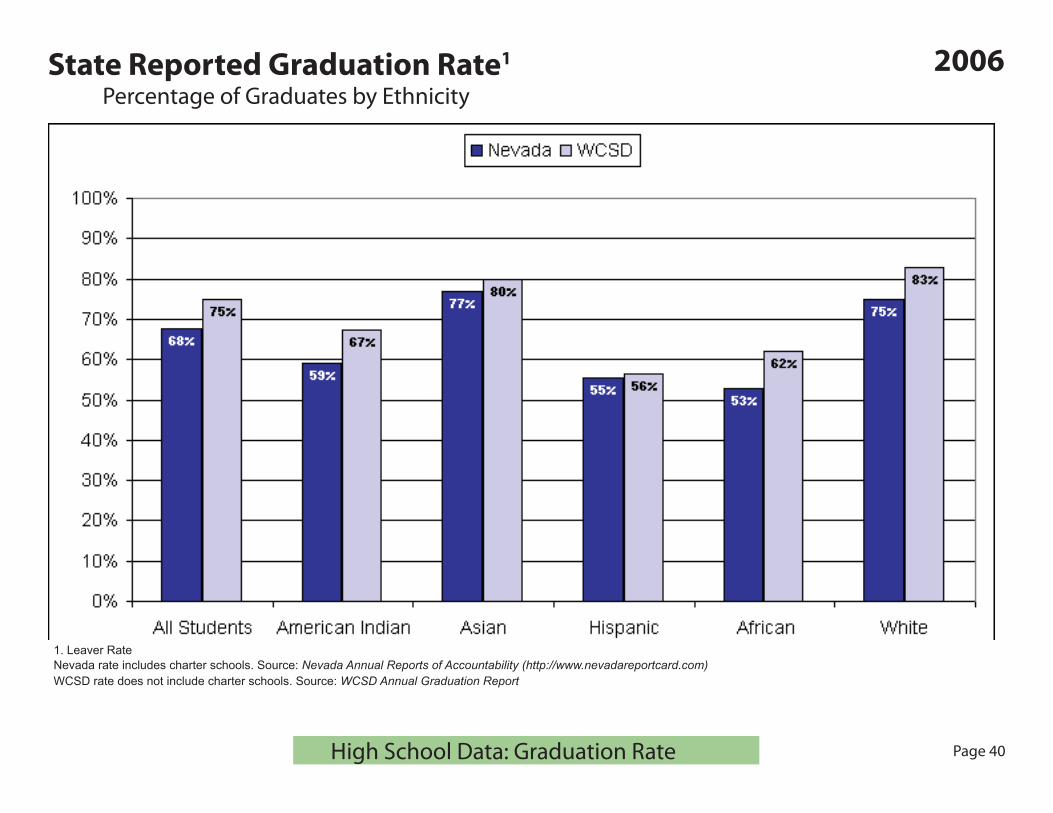
State Reported Graduation Rate1
Percentage of Graduates by Ethnicity
High School Data: Graduation Rate
2006
� Page 40
1. Leaver RateNevada rate includes charter schools. Source: Nevada Annual Reports of Accountability (http://www.nevadareportcard.com)WCSD rate does not include charter schools. Source: WCSD Annual Graduation Report
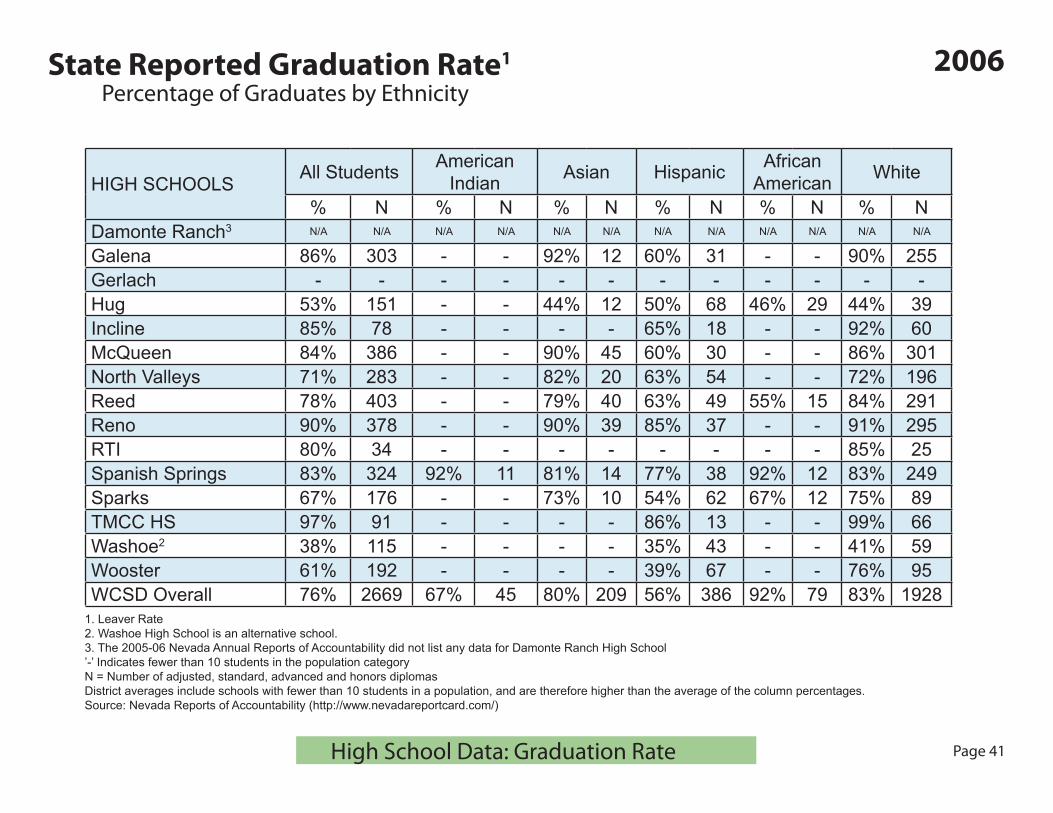
State Reported Graduation Rate1
Percentage of Graduates by Ethnicity
High School Data: Graduation Rate
1. Leaver Rate 2. Washoe High School is an alternative school.3. The 2005-06 Nevada Annual Reports of Accountability did not list any data for Damonte Ranch High School’-’ Indicates fewer than 10 students in the population category N = Number of adjusted, standard, advanced and honors diplomasDistrict averages include schools with fewer than 10 students in a population, and are therefore higher than the average of the column percentages.Source: Nevada Reports of Accountability (http://www.nevadareportcard.com/)
2006
� Page 41
HIGH SCHOOLS All Students American Indian Asian Hispanic African
American White
% N % N % N % N % N % NDamonte Ranch3 N/A N/A N/A N/A N/A N/A N/A N/A N/A N/A N/A N/A
Galena 86% 303 - - 92% 12 60% 31 - - 90% 255Gerlach - - - - - - - - - - - -Hug 53% 151 - - 44% 12 50% 68 46% 29 44% 39Incline 85% 78 - - - - 65% 18 - - 92% 60McQueen 84% 386 - - 90% 45 60% 30 - - 86% 301North Valleys 71% 283 - - 82% 20 63% 54 - - 72% 196Reed 78% 403 - - 79% 40 63% 49 55% 15 84% 291Reno 90% 378 - - 90% 39 85% 37 - - 91% 295RTI 80% 34 - - - - - - - - 85% 25Spanish Springs 83% 324 92% 11 81% 14 77% 38 92% 12 83% 249Sparks 67% 176 - - 73% 10 54% 62 67% 12 75% 89TMCC HS 97% 91 - - - - 86% 13 - - 99% 66Washoe2 38% 115 - - - - 35% 43 - - 41% 59Wooster 61% 192 - - - - 39% 67 - - 76% 95WCSD Overall 76% 2669 67% 45 80% 209 56% 386 92% 79 83% 1928

Types of Diplomas AwardedPercentage of Advanced, Honors, Standard and Adjusted Diplomas by Group
Example: Of the Hispanics who graduated from a WCSD high school in 2006, 58% earned standard diplomas, 26% earned advanced or honors diplomas and 16% earned adjusted diplomas.
2006
� Page 42 High School Data: Diplomas
State Reported Dropout Rates
High School Data: Dropouts
2006
� Page 43
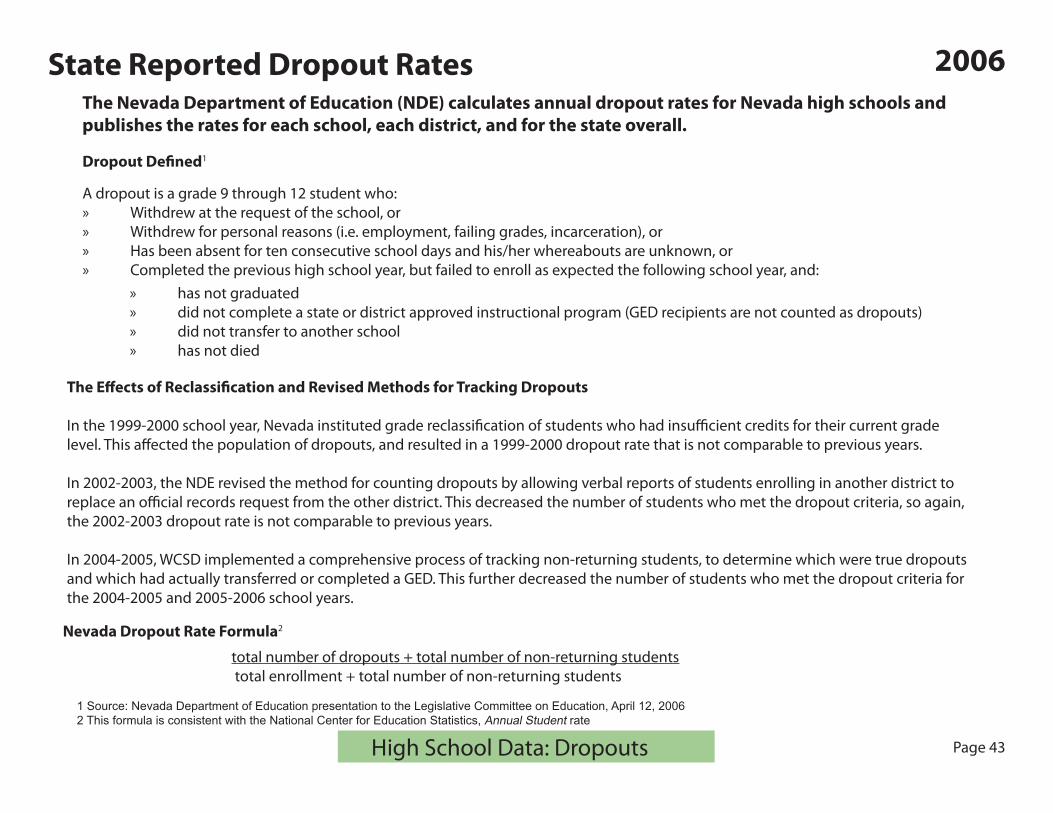
The Nevada Department of Education (NDE) calculates annual dropout rates for Nevada high schools and publishes the rates for each school, each district, and for the state overall.
A dropout is a grade � through 12 student who: Withdrew at the request of the school, orWithdrew for personal reasons (i.e. employment, failing grades, incarceration), orHas been absent for ten consecutive school days and his/her whereabouts are unknown, orCompleted the previous high school year, but failed to enroll as expected the following school year, and:
»»»»
has not graduateddid not complete a state or district approved instructional program (GED recipients are not counted as dropouts)did not transfer to another schoolhas not died
»»»»
Nevada Dropout Rate Formula2
1 Source: Nevada Department of Education presentation to the Legislative Committee on Education, April 12, 20062 This formula is consistent with the National Center for Education Statistics, Annual Student rate
The Effects of Reclassification and Revised Methods for Tracking Dropouts
In the 1���-2000 school year, Nevada instituted grade reclassification of students who had insufficient credits for their current grade level. This affected the population of dropouts, and resulted in a 1���-2000 dropout rate that is not comparable to previous years.
In 2002-2003, the NDE revised the method for counting dropouts by allowing verbal reports of students enrolling in another district to replace an official records request from the other district. This decreased the number of students who met the dropout criteria, so again, the 2002-2003 dropout rate is not comparable to previous years.
In 2004-200�, WCSD implemented a comprehensive process of tracking non-returning students, to determine which were true dropouts and which had actually transferred or completed a GED. This further decreased the number of students who met the dropout criteria for the 2004-200� and 200�-200� school years.
total number of dropouts + total number of non-returning students total enrollment + total number of non-returning students
Dropout Defined1

State Reported Dropout RatesPercentage of Grade �-12 Students Who Dropped Out During the School Year
High School Data: Dropouts
2006
� Page 44
Nevada in-stituted reclas-sification
Verbal report of whereabouts replaced official request for re-cords
WCSD instituted comprehensive tracking of no-shows

State Reported Dropout Rates by High SchoolPercentage of Grade �-12 Students Who Dropped Out During the School Year
High School Data: Dropouts
HIGH SCHOOLS2001-02 2002-03 2003-04 2004-05 2005-06
Dropout definition revised by NDE 2
WCSD begins to track no-shows3
% N % N % N % N % NDamonte Ranch Not Open Not Open Not Open Not Open 1.6% 9 1.1% 10 1.5% 16
Galena 2.5% 47 1.9% 38 1.2% 21 1.4% 21 1.9% 29
Gerlach 2.9% 1 0.0% 0 6.5% 2 0.0% 0 8.0% 2
Hug 5.9% 78 7.2% 92 3.5% 44 2.8% 36 4.4% 52
Incline 2.7% 11 1.2% 5 0.5% 2 1.5% 6 0.8% 3
McQueen 1.7% 33 0.9% 17 2.5% 47 1.9% 37 1.6% 31
North Valleys 2.5% 35 2.5% 44 3.2% 63 1.7% 35 2.9% 62
Reed 1.3% 29 1.8% 40 3.7% 88 0.8% 20 0.9% 23
Reno 2.1% 35 1.7% 29 1.4% 25 1.3% 24 1.1% 21
RTI Not Open Not Open Not Open Not Open Not Open Not Open Not Open Not Open 2.9% 2
Spanish Springs 1.3% 15 1.7% 27 2.2% 40 1.1% 12 1.5% 32
Sparks 1.7% 23 1.9% 22 1.6% 19 0.9% 17 1.9% 20
TMCC HS 2.4% 5 0.6% 1 1.2% 2 1.7% 3 0.6% 1
Washoe1 26.2% 158 10.0% 53 13.8% 66 14.7% 97 18.4% 154
Wooster 4.0% 62 5.2% 80 1.8% 26 1.5% 23 2.2% 32
WCSD Overall 3.4% 532 2.8% 448 2.6% 452 1.9% 341 2.6% 480
1 Washoe HS is an alternative learning site. 2 In 2002-03 the NDE began allowing verbal reports of whereabouts to replace official records requests. Drop out rates are not comparable to previous years.3 Beginning with the 2004-2005 school year, WCSD instituted comprehensive tracking of no-shows, to determine which had transferred and which were true dropouts.More details on dropout rates, including rates by ethnicity, are available at: http://www.nevadareportcard.com
� Page 4�

ACT Composite Score Longitudinal TrendsWCSD, Nevada and National 1��3-200�
High School Data: ACT� Page 4�
ACT scores are reported on a scale from 1 to 36. For purposes of this comparison, the scale has been reduced to enhance visual discrimination.

ACT Math ScoresWCSD, Nevada and National Comparisons
� Page 4� High School Data: ACT
ACT scores are reported on a scale from 1 to 36. For purposes of this comparison, the scale has been reduced to enhance visual discrimination.

ACT Math Scores by High School
� Page 4� High School Data: ACT
High Schools 2001 2002 2003 2004 2005 2006Damonte Ranch Not Open Not Open Not Open Not Open - -Galena 22.2 22.1 21.6 22.2 23.5 23.3Gerlach - - - - - -Hug 20.9 20.6 19.8 19.5 18.7 18.1Incline 21.3 21.6 24.5 - - -McQueen 23.3 23.3 23.7 23.3 22.4 22.6North Valleys Not Open Not Open 19.7 20.7 20.1 21.8Reed 21.1 21.7 22.0 21.1 21.6 22.1Reno 23.0 24.6 24.5 23.2 23.2 22.8RTI Not Open Not Open Not Open Not Open Not Open -Spanish Springs Not Open Not Open 20.2 20.4 21.6 20.8Sparks 20.4 19.9 20.5 19.9 19.4 20.2TMCC HS 22.4 20.8 - - - -Washoe - - - - - -Wooster 22.1 23.1 22.7 22.8 22.9 22.2WCSD Average1 21.9 22.2 22.1 21.9 21.9 22.1
1 The WCSD average is higher than the average of school scores listed in this table because Damonte Ranch, Gerlach, RTI, TMCC and Washoe had fewer than 30 students who took the ACT. Individual school test data are not published for schools with fewer than 30 ACT participants, but the participants’ scores are included in district totals.ACT-Math Scores are reported on a scale from 1 to 36‘-’ Denotes too few students tested to report.

ACT English ScoresWCSD, Nevada and National Comparisons
ACT scores are reported on a scale from 1 to 36. For purposes of this comparison, the scale has been reduced to enhance visual discrimination.
� Page 4� High School Data: ACT
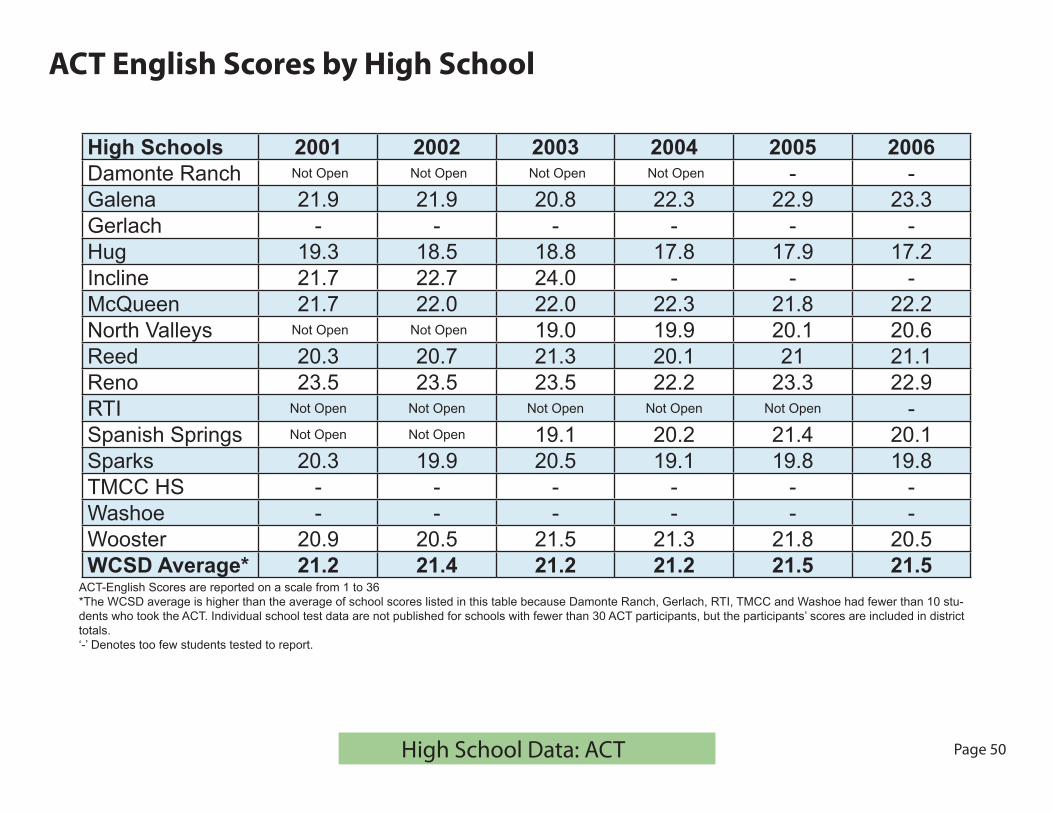
ACT English Scores by High School
� Page �0 High School Data: ACT
High Schools 2001 2002 2003 2004 2005 2006Damonte Ranch Not Open Not Open Not Open Not Open - -Galena 21.9 21.9 20.8 22.3 22.9 23.3Gerlach - - - - - -Hug 19.3 18.5 18.8 17.8 17.9 17.2Incline 21.7 22.7 24.0 - - -McQueen 21.7 22.0 22.0 22.3 21.8 22.2North Valleys Not Open Not Open 19.0 19.9 20.1 20.6Reed 20.3 20.7 21.3 20.1 21 21.1Reno 23.5 23.5 23.5 22.2 23.3 22.9RTI Not Open Not Open Not Open Not Open Not Open -Spanish Springs Not Open Not Open 19.1 20.2 21.4 20.1Sparks 20.3 19.9 20.5 19.1 19.8 19.8TMCC HS - - - - - -Washoe - - - - - -Wooster 20.9 20.5 21.5 21.3 21.8 20.5WCSD Average* 21.2 21.4 21.2 21.2 21.5 21.5
ACT-English Scores are reported on a scale from 1 to 36*The WCSD average is higher than the average of school scores listed in this table because Damonte Ranch, Gerlach, RTI, TMCC and Washoe had fewer than 10 stu-dents who took the ACT. Individual school test data are not published for schools with fewer than 30 ACT participants, but the participants’ scores are included in district totals.‘-’ Denotes too few students tested to report.

ACT ParticipationNumber and Percentage of WCSD Graduates Who Took the ACT
� Page �1 High School Data: ACT

ACT ParticipationWCSD Graduates Who Took the ACT by High School
HIGH SCHOOLS
2001 2002 2003 2004 2005 2006N % N % N % N % N % N %
Damonte Ranch Not Open Not Open Not Open Not Open Not Open Not Open Not Open Not Open - - - -Galena 133 46% 178 46% 183 55% 183 48% 164 52% 165 55%Gerlach - - - - - - - - - - - -Hug 92 32% 78 25% 48 24% 34 23% 42 24% 38 28%Incline 31 33% 27 33% 35 42% - - - - - -McQueen 211 57% 228 55% 229 54% 188 49% 159 42% 163 43%North Valleys Not Open Not Open Not Open Not Open 103 45% 101 41% 95 35% 73 27%Reed 251 56% 225 49% 223 51% 155 40% 206 45% 172 45%Reno 168 52% 137 43% 124 42% 107 33% 116 36% 118 32%RTI Not open Not open Not open Not Open Not Open Not Open Not Open Not Open Not Open Not Open - -
Spanish Springs Not Open Not Open Not Open Not Open 72 37% 62 23% 110 39% 60 19%Sparks 138 48% 109 39% 66 36% 55 37% 48 36% 55 36%TMCC HS 40 38% 37 30% - - - - - - - -Washoe - - - - - - - - - - - -Wooster 90 42% 64 28% 71 40% 65 34% 76 38% 55 31%Total1 1166 46% 1092 40% 1185 42% 996 36% 1075 38% 967 33%
� Page �2 High School Data: ACT
1 Total numbers are higher than the sum of individual schools because Gerlach, TMCC and Washoe had too few students tested to report. Individual school test data are not pub-lished for schools with fewer than 30 ACT participants, but the participants are included in district totals.Corrections have been made to data from previous years.‘-’ Denotes too few students tested to report.

SAT Combined Score Longitudinal TrendsWCSD, Nevada and National 1��3-200�
� Page �3 High School Data: SAT
The SAT was re-centered for the 1993-1994 and 1994-1995 school years; score comparisons from previous years are not valid. Substantial changes to the SAT format and content were instituted in March 2005 and are first reflected in the 2005-2006 scores.

SAT Verbal ScoresWCSD, Nevada and National Comparisons
� Page �4 High School Data: SAT
SAT Verbal scores range from 200 - 800, with 500 considered average. For purposes of this comparison, the scale has been reduced to enhance visual discrimination.The SAT was re-centered for the 1993-1994 and 1994-1995 school years; score comparisons from previous years are not valid. Substantial changes to the SAT format and content were instituted in March 2005 and are first reflected in the 2005-2006 scores.

SAT Verbal Scores by High School
� Page �� High School Data: SAT
High Schools 2001 2002 2003 2004 2005 2006Damonte Ranch Not Open Not Open Not Open Not Open - -Galena 526 519 531 533 544 539Gerlach - - - - - -Hug 515 479 - - - 457Incline 540 526 533 545 534 549McQueen 530 549 564 555 535 523North Valleys Not Open Not Open 486 511 499 490Reed 510 517 534 510 525 506Reno 549 559 558 549 556 538RTI Not Open Not Open Not Open Not Open Not Open -Spanish Springs Not Open Not Open 484 486 524 492Sparks 492 532 - - - -TMCC HS 580 571 559 534 553 551Washoe - - - - - -Wooster 522 512 525 514 530 516WCSD Average1 529 533 539 530 533 518
1 The WCSD average is higher than the average of school scores listed in this table because Damonte Ranch, Gerlach, Sparks and Washoe had fewer than 20 students who took the SAT. Individual school test data are not published for schools with fewer than 20 SAT participants, but the participants’ scores are included in district totals.‘-’ Denotes fewer than 20 students tested
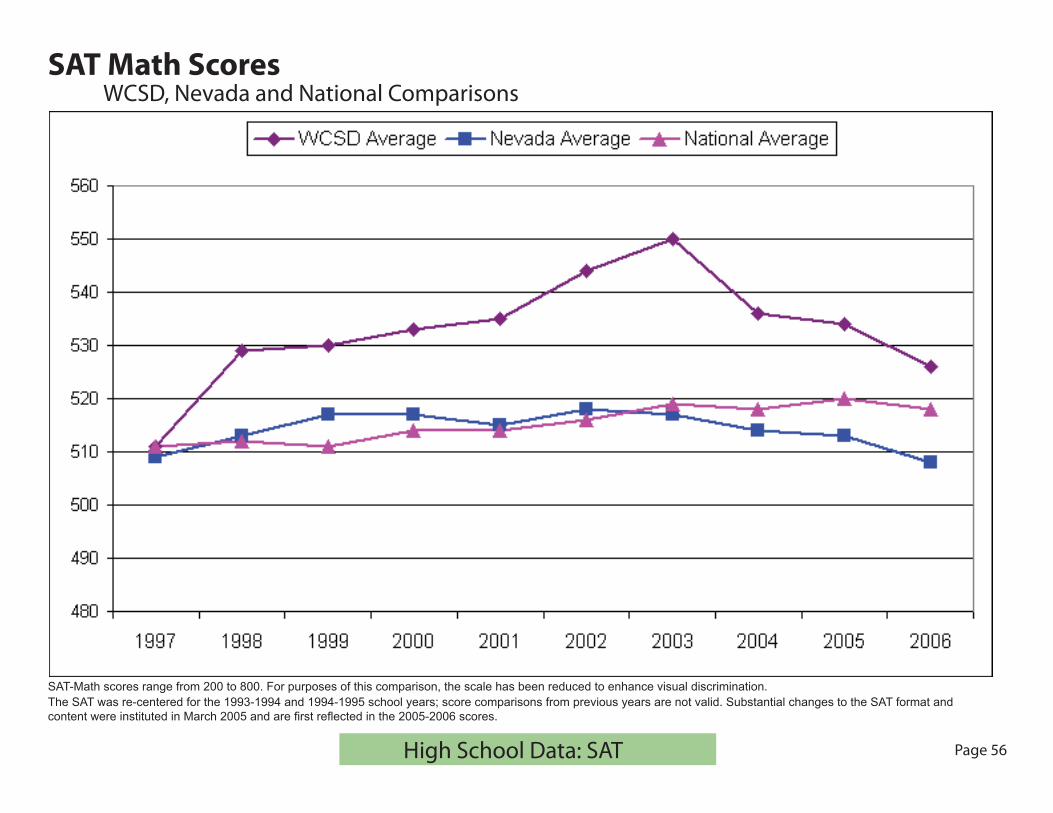
SAT Math ScoresWCSD, Nevada and National Comparisons
� Page �� High School Data: SAT
SAT-Math scores range from 200 to 800. For purposes of this comparison, the scale has been reduced to enhance visual discrimination. The SAT was re-centered for the 1993-1994 and 1994-1995 school years; score comparisons from previous years are not valid. Substantial changes to the SAT format and content were instituted in March 2005 and are first reflected in the 2005-2006 scores.

SAT Math Scores by High School
� Page �� High School Data: SAT
SAT-Math scores range from 200 to 800. *The WCSD average is higher than the average of school scores listed in this table because Damonte Ranch, Gerlach, Sparks and Washoe had fewer than 20 students who took the SAT. Individual school test data are not published for schools with fewer than 20 SAT participants, but the participants’ scores are included in district totals. ‘-’ Denotes fewer than 20 students tested. � � � �
High Schools 2001 2002 2003 2004 2005 2006Damonte Ranch Not Open Not Open Not Open Not Open - -Galena 527 529 534 535 547 550Gerlach - - - - - -Hug 523 522 - - - 450Incline 549 530 564 553 544 554McQueen 552 562 579 564 540 534North Valleys Not Open Not Open 511 500 490 492Reed 517 533 546 526 531 529Reno 546 560 566 550 556 538RTI Not Open Not Open Not Open Not Open Not Open -Spanish Springs Not Open Not Open 500 493 515 497Sparks 514 536 - - - -TMCC HS 549 551 550 566 530 513Washoe - - - - - -Wooster 536 545 534 546 537 536WCSD Average 535 544 550 536 534 526
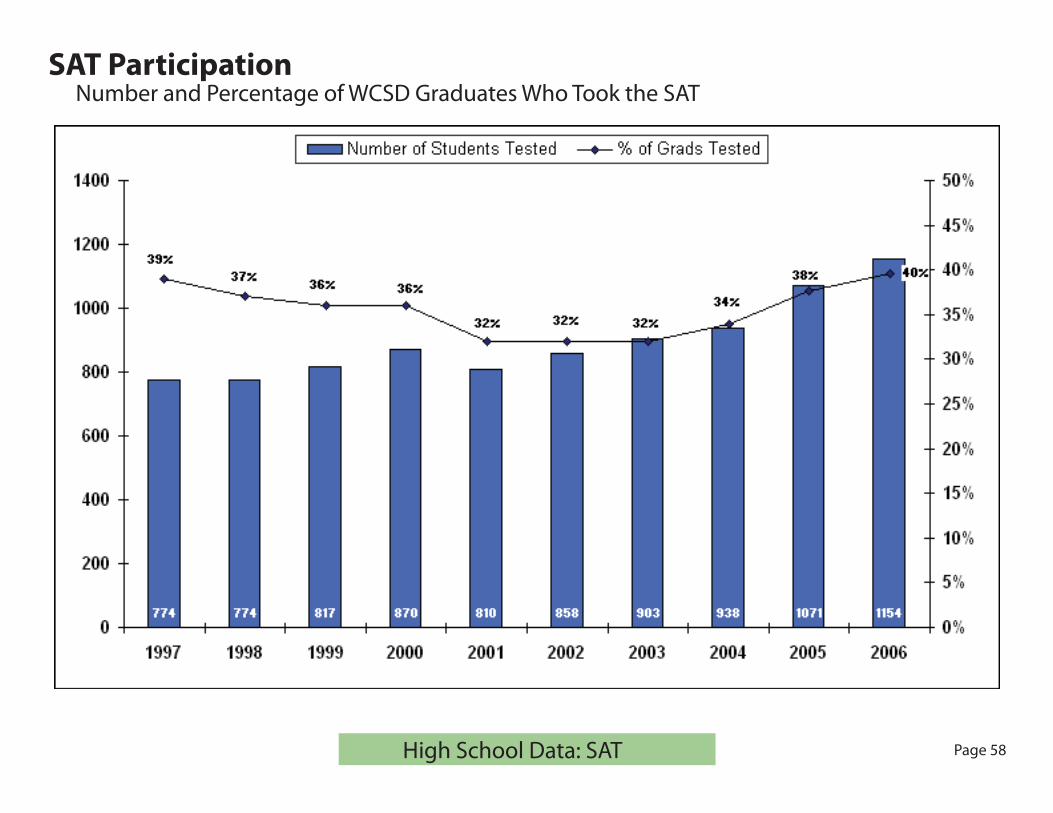
SAT ParticipationNumber and Percentage of WCSD Graduates Who Took the SAT
� Page �� High School Data: SAT

SAT Participation by High School
� Page �� High School Data: SAT
1 Total numbers are higher than the sum of individual schools because some schools had fewer than 20 students take the SAT. Individual school test data are not published for schools with fewer than 20 test participants, but the participants are included in district totals.‘-’ Denotes fewer than 20 students tested.
HIGH SCHOOLS 2001 2002 2003 2004 2005 2006N % N % N % N % N % N %
Damonte Ranch Not Open Not Open Not Open Not Open Not Open Not Open Not Open Not Open - - 53 49%Galena 134 46% 190 49% 163 49% 166 43% 195 62% 155 51%Gerlach - - - - - - - - - - - -Hug 46 16% 32 10% - - - - 21 12% 28 21%Incline 53 57% 48 59% 54 64% 45 55% 45 58% 38 50%McQueen 121 32% 140 34% 152 36% 153 40% 172 46% 162 43%North Valleys Not Open Not Open Not Open Not Open 39 17% 44 18% 67 25% 82 30%Reed 125 28% 135 30% 119 27% 118 31% 162 36% 158 41%Reno 191 69% 189 60% 211 72% 200 61% 192 59% 240 64%RTI Not Open Not Open Not Open Not Open Not Open Not Open Not Open Not Open Not Open Not Open - -Spanish Springs Not Open Not Open Not Open Not Open 23 12% 95 35% 85 30% 134 42%Sparks 43 15% 23 8% - - - - - - - -TMCC HS 29 27% 34 28% 29 32% 21 23% 24 37% 20 22%Washoe - - - - - - - - - - - -Wooster 63 30% 61 26% 61 35% 69 36% 81 40% 68 38%Total1 810 32% 858 32% 903 32% 938 34% 1071 38% 1154 40%

Gateway CurriculumPercentage of 2004 through 200� Graduates Who Met Gateway Science and Math Requirements
� Page �0 High School Data: Gateway Curriculum
HIGH SCHOOLS
Earned 3 Science Credits Earned 4 Math Credits Earned Math Credit Beyond Algebra 3-4
Class of 2004
Class of 2005
Class of 2006
Class of 2004
Class of 2005
Class of 2006
Class of 2004
Class of 2005
Class of 2006
Damonte Ranch No Seniors 51% 60% No Seniors 18% 23% No Seniors 18% 19%Galena 80% 80% 74% 40% 60% 50% 32% 50% 45%Gerlach1 44% 33% 86% 78% 33% 0% 44% 17% 0%Hug 46% 50% 53% 24% 33% 26% 12% 17% 15%Incline 56% 65% 70% 40% 42% 37% 35% 45% 33%McQueen 72% 81% 75% 47% 56% 46% 38% 40% 37%North Valleys 65% 69% 69% 35% 42% 42% 24% 33% 31%Reed 71% 77% 74% 42% 50% 53% 39% 43% 49%Reno 86% 89% 85% 56% 57% 59% 51% 50% 47%RTI No Seniors No Seniors 40% No Seniors No Seniors 7% No Seniors No Seniors 3%Spanish Springs 64% 66% 73% 26% 37% 41% 19% 33% 33%Sparks 76% 60% 77% 60% 25% 29% 27% 21% 28%TMCC HS 48% 54% 60% 5% 20% 21% 10% 45% 51%Washoe2 9% 8% 25% 2% 2% 1% 1% 2% 3%Wooster 53% 54% 37% 21% 43% 25% 18% 38% 25%Total 67% 69% 69% 38% 45% 41% 30% 37% 36%
1 Gerlach percentages are based on very small numbers of students (usually fewer than 10).2 Washoe High School is an alternative school.

Percentage of Seniors Taking Four, Five and Six or More Classes
� Page �1 High School Data: Gateway Curriculum
Gateway Curriculum
HIGH SCHOOLS
Four Classes Five Classes Six or More ClassesClass of
2004Class of
2005Class of
2006Class of
2004Class of
2005Class of
2006Class of
2004Class of
2005Class of
2006Damonte Ranch No Seniors 3% 24% No Seniors 11% 19% No Seniors 86% 56%Galena 25% 38% 36% 34% 30% 34% 41% 31% 30%Gerlach - - 14% - - 0% 100% 100% 86%Hug 6% 15% 29% 19% 23% 28% 75% 62% 43%Incline 29% 22% 20% 33% 39% 26% 39% 39% 54%McQueen 13% 28% 20% 34% 31% 35% 54% 42% 45%North Valleys 8% 22% 20% 25% 36% 32% 67% 42% 48%Reed 30% 5% 5% 32% 41% 37% 38% 53% 59%Reno 24% 44% 41% 41% 31% 28% 35% 26% 31%RTI Not Open No Seniors NA Not Open No Seniors NA Not Open No Seniors NA
Spanish Springs 18% 32% 27% 27% 27% 36% 56% 41% 37%Sparks 27% 4% 4% 31% 16% 18% 42% 80% 78%TMCC HS1 NA NA NA NA NA NA NA NA NA
Washoe1 NA NA NA NA NA NA NA NA NA
Wooster 20% 32% 33% 36% 28% 31% 44% 41% 36%Total 22% 25% 24% 31% 31% 31% 46% 45% 45%
1 RTI, TMCC and Washoe high schools have unique scheduling options, so are not included.

Enrollment in Advanced Placement CoursesPercentage of WCSD Juniors and Seniors Enrolled in Advanced Placement or IB1 Courses
� Page �2 High School Data: AP/IB
1 International Baccalaureate Program2 Data on percentage scoring 3 or higher are not available prior to 2003; percentage includes IB scores of 4 or higher

Advanced Placement Course Enrollment by SchoolPercentage of Graduates Who took At Least One Advanced Placement or IB1 Exam as Juniors or Seniors
� Page �3 High School Data: AP/IB
1 International Baccalaureate ProgramAP classes are not offered at Washoe or TMCC

Enrollment in Advanced Placement/IB1 Courses
� Page �4 High School Data: AP/IB
1 International Baccalaureate Program2 Data are not available for 2001-2004; includes IB students scoring 4 or higherSeveral corrections have been made to data from previous years to eliminate duplicate counting of students taking more than one exam. AP courses are not offered at TMCC and Washoe high schools. ‘-’ Denotes no students enrolled or too few students to report.
High Schools
Number of AP Candidates Percentage of Juniors and Seniors Taking AP Exams
Percent-age of AP Students Scoring 3 or Higher
on AP Exams2
2001 2002 2003 2004 2005 2006 2001 2002 2003 2004 2005 2006 2006Damonte Ranch Not Open Not Open Not Open - 60 91 Not Open Not Open Not Open - 26% 29% 41%Galena 188 205 235 290 267 277 24% 27% 30% 36% 39% 43% 69%Gerlach - 3 - 4 1 3 - 20% - 24% 8% 30% 0%Hug 62 34 41 31 56 78 7% 7% 11% 8% 15% 23% 7%Incline 53 51 48 49 47 61 28% 29% 27% 29% 31% 35% 75%McQueen 216 256 268 279 291 277 24% 29% 30% 34% 33% 35% 62%North Valleys Not Open 30 51 80 173 229 Not Open 12% 10% 13% 26% 34% 32%Reed 103 163 141 143 180 214 9% 17% 16% 15% 18% 24% 47%Reno 200 219 263 251 292 297 25% 32% 39% 35% 39% 36% 66%Spanish Springs Not Open 11 37 61 105 183 Not Open 4% 7% 10% 16% 24% 35%Sparks 68 110 91 86 99 151 8% 20% 24% 23% 24% 39% 17%TMCC HS - - - - - - - - - - - - -Washoe - - - - - - - - - - - - -Wooster 76 74 71 88 104 125 12% 15% 14% 15% 21% 28% 46%WCSD 967 1156 1246 1365 1675 1986 16% 19% 21% 21% 27% 29% 51%

Advanced Placement Challenge IndexRatio of AP-IB1 Exams to Graduating Class Size
� Page �� High School Data: AP/IB
The Challenge Index, developed by WashingtonPost education writer Jay Mathews, measures a public high school’s effort to challenge its stu-dents. The Index is calculated by dividing the number of AP or IB or exams taken by the number of seniors who graduated in June. Exam scores are not included in the calculation and exams taken by all students, not just seniors, are counted. The rating is not a measurement of the overall quality of the school but illuminates one factor that many educators and researchers consider important. For purposes of this calculation, the WCSD graduating class includes all students who earned a diploma plus those students who had enough credits to graduate but failed one or more sections of a state-mandated graduation exam. A Challenge Index of 1.0 or higher meets the benchmark defined by the measure’s author.
2006
1 International Baccalaureate Program2 National rankings published in Newsweek. All of the ranked schools have an index of at least 1.0 and are in the top 5 percent of the nation’s public schools on this measure. Source: The Complete List: 1,200 Top U.S. Schools; http://www.msnbc.msn.com/id/12532678/site/newsweek/The rankings do not include schools in the first or second year of operation, so RTI is not included in the results.‘-’ Denotes fewer than 10 students in the graduating class.AP classes are not offered at Washoe or TMCC high schools
SCHOOLNumber of 2006 June Graduates
Number of AP-IB Exams in
2006
Challenge Index
National Ranking2
Galena 301 559 1.86 509Wooster 178 310 1.74 598McQueen 379 611 1.61 684Incline 76 122 1.61 690Reno 374 586 1.57 732North Valleys 269 420 1.56 736Sparks 154 237 1.54 754Damonte Ranch 108 133 1.23 1014Reed 386 417 1.08 1162Hug 136 143 1.05 1201Spanish Springs 320 330 1.03 1219Gerlach - - - -

Millennium ScholarshipPercentage of Graduates Eligible for the Millennium Scholarship by Year
� Page �� High School Data: Millennium Scholarship
High Schools 2000 2001 2002 2003 2004 20051 2006Damonte Ranch Not Open Not Open Not Open Not Open Not Open 37% 45%Galena 64% 58% 65% 69% 69% 71% 65%Gerlach 13% 67% 50% 67% 67% 67% 71%Hug 33% 44% 42% 40% 49% 41% 40%Incline 49% 71% 59% 59% 59% 61% 58%McQueen 54% 59% 65% 63% 59% 58% 56%North Valleys Not Open Not Open Not Open 51% 53% 45% 48%Reed 49% 61% 59% 71% 61% 52% 58%Reno 68% 67% 67% 78% 70% 63% 62%RTI Not Open Not Open Not Open Not Open Not Open Not Open 37%Spanish Springs Not Open Not Open Not Open 52% 54% 53% 48%Sparks 44% 53% 56% 58% 47% 39% 45%TMCC 66% 74% 75% 78% 74% 75% 73%Washoe 16% 54% 44% 31% 24% 10% 8%Wooster 43% 60% 51% 63% 63% 57% 46%WCSD 50% 59% 56% 63% 57% 52% 51%
1 The eligibility requirements for the Millennium Scholarship increased in 2005 to a GPA of 3.1, with no rounding allowed. Prior to 2005, the cut off was 3.0, and rounding up from 2.95 was allowed.
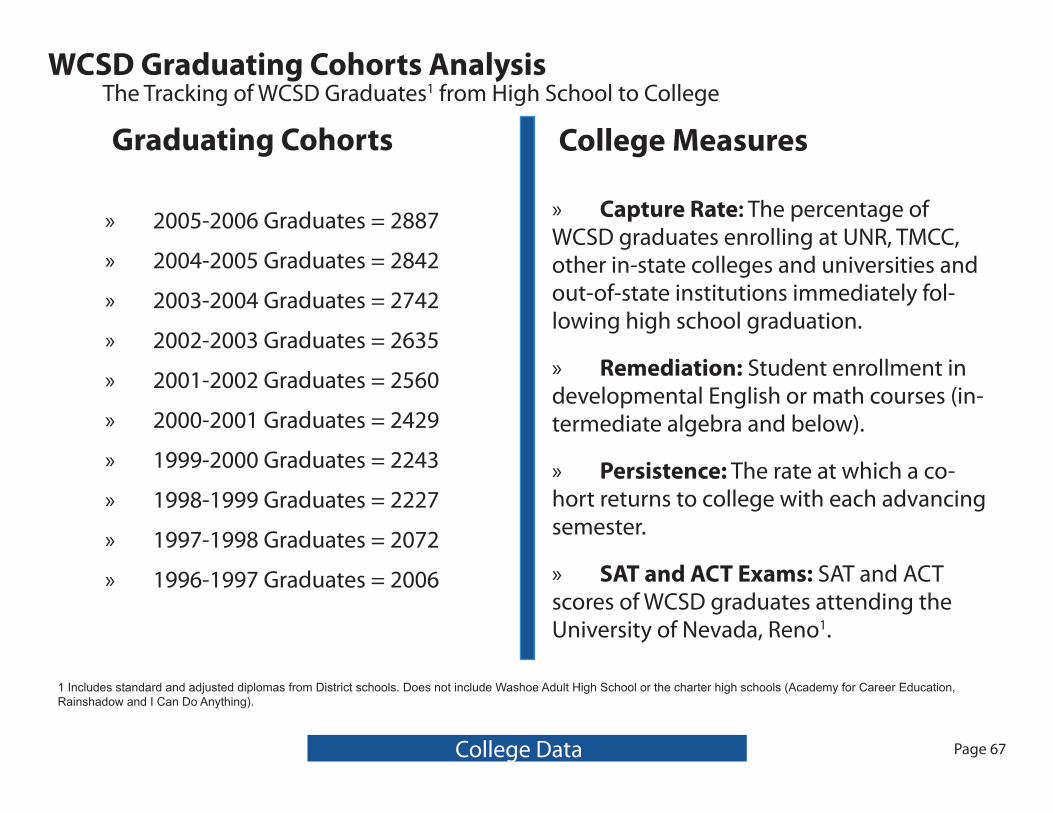
WCSD Graduating Cohorts AnalysisThe Tracking of WCSD Graduates1 from High School to College
� Page �� College Data
1 Includes standard and adjusted diplomas from District schools. Does not include Washoe Adult High School or the charter high schools (Academy for Career Education, Rainshadow and I Can Do Anything).
Graduating Cohorts
200�-200� Graduates = 2���
2004-200� Graduates = 2�42
2003-2004 Graduates = 2�42
2002-2003 Graduates = 2�3�
2001-2002 Graduates = 2��0
2000-2001 Graduates = 242�
1���-2000 Graduates = 2243
1���-1��� Graduates = 222�
1���-1��� Graduates = 20�2
1���-1��� Graduates = 200�
»
»
»
»
»
»
»
»
»
»
College Measures
Capture Rate: The percentage of WCSD graduates enrolling at UNR, TMCC, other in-state colleges and universities and out-of-state institutions immediately fol-lowing high school graduation.
Remediation: Student enrollment in developmental English or math courses (in-termediate algebra and below).
Persistence: The rate at which a co-hort returns to college with each advancing semester.
SAT and ACT Exams: SAT and ACT scores of WCSD graduates attending the University of Nevada, Reno1.
»
»
»
»
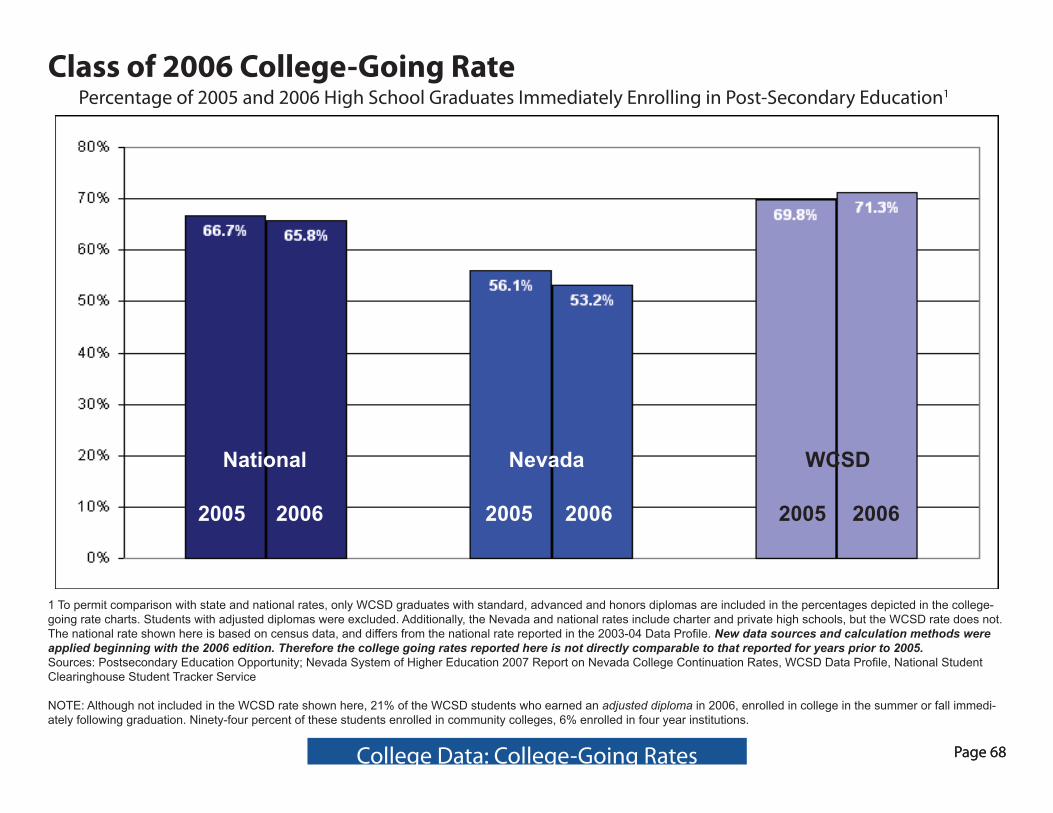
Class of 2006 College-Going RatePercentage of 200� and 200� High School Graduates Immediately Enrolling in Post-Secondary Education1
� Page ��
1 To permit comparison with state and national rates, only WCSD graduates with standard, advanced and honors diplomas are included in the percentages depicted in the college-going rate charts. Students with adjusted diplomas were excluded. Additionally, the Nevada and national rates include charter and private high schools, but the WCSD rate does not. The national rate shown here is based on census data, and differs from the national rate reported in the 2003-04 Data Profile. New data sources and calculation methods were applied beginning with the 2006 edition. Therefore the college going rates reported here is not directly comparable to that reported for years prior to 2005.Sources: Postsecondary Education Opportunity; Nevada System of Higher Education 2007 Report on Nevada College Continuation Rates, WCSD Data Profile, National Student Clearinghouse Student Tracker Service
NOTE: Although not included in the WCSD rate shown here, 21% of the WCSD students who earned an adjusted diploma in 2006, enrolled in college in the summer or fall immedi-ately following graduation. Ninety-four percent of these students enrolled in community colleges, 6% enrolled in four year institutions.
� Page �� College Data: College-Going Rates
National Nevada WCSD
2005 20062005200620052006

1 To permit comparison with state rates, only WCSD graduates with standard, advanced and honors diplomas are included in the percentages depicted in the college-going rate charts. Students with adjusted diplomas were excluded. Additionally, the Nevada rates include charter and private high schools, but the WCSD rate does not. Sources: Nevada System of Higher Education Annual Reports on College Continuation and College remediation. WCSD Data Profile, National Student Clearinghouse Student Tracker Service
Class of 2006 College-Going RatesPercentage of Nevada and WCSD High School Graduates Enrolling in Local, In-State and Out-of-State Institutions1
� Page �� � Page �� College Data: College-Going Rates

Capture Rates Based on UNR and TMCC Enrollment Counts
� Page �0 College Data: Capture Rates
The college-going rate for Washoe County School District reported in the pre-vious two pages was calculated using student-matched data collected by the National Student Clearinghouse Student Tracker Service. The student-matched data generate a more precise college-going rate than the rates published in previous Data Profile reports. Using student-matched data, WCSD students who received an adjusted diploma or did not graduate (i.e. drop outs and stu-dents who received a certificate of attendance), but nevertheless enrolled in college, can be identified and excluded from the analysis. Additionally, stu-dents who are dual-enrolled (i.e. taking classes at both UNR and TMCC during the same term) can be identified so that they are only counted once in the col-lege-going rate.
The TMCC and UNR capture rates reported on the following pages differ from the college-going rates reported on pages �� and �� in that they may include WCSD students who received an adjusted diploma, students who did not grad-uate, and/or students dual-enrolled at UNR and TMCC.

WCSD High School Graduates Attending UNR or TMCCNumber of WCSD Graduates Enrolling by Year
� Page �1 College Data: Capture Rates
Numbers may include WCSD students who did not receive a diploma and students co-enrolled at both institutions, and are not comparable to the college-going rates reported on pages 68 and 69.

Capture Rates of High School Cohorts By UNR and TMCCPercentage of WCSD Graduates Enrolling in UNR or TMCC by Year
� Page �2 College Data: Capture Rates
Data have been corrected from previous years.Numbers may include WCSD students who did not receive a diploma and students co-enrolled at both institutions, and are not comparable to the college-going rates reported on pages 68 and 69.
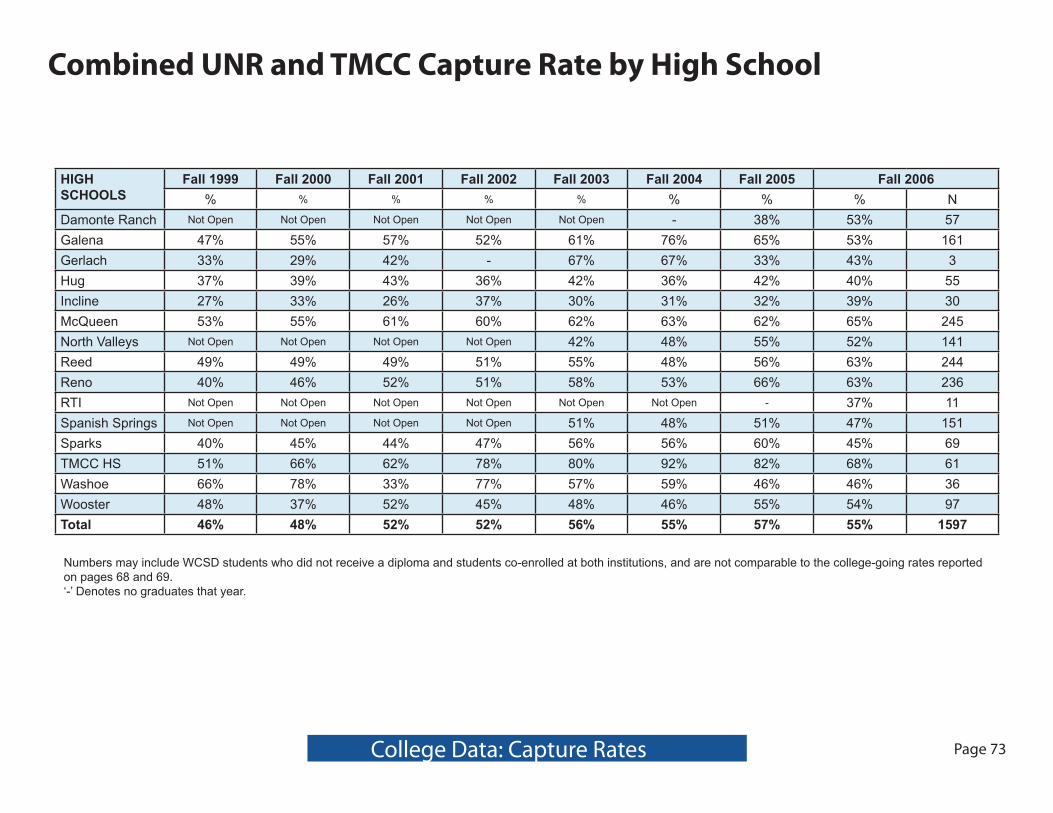
Combined UNR and TMCC Capture Rate by High School
� Page �3 College Data: Capture Rates
HIGH SCHOOLS
Fall 1999 Fall 2000 Fall 2001 Fall 2002 Fall 2003 Fall 2004 Fall 2005 Fall 2006% % % % % % % % N
Damonte Ranch Not Open Not Open Not Open Not Open Not Open - 38% 53% 57Galena 47% 55% 57% 52% 61% 76% 65% 53% 161Gerlach 33% 29% 42% - 67% 67% 33% 43% 3Hug 37% 39% 43% 36% 42% 36% 42% 40% 55Incline 27% 33% 26% 37% 30% 31% 32% 39% 30McQueen 53% 55% 61% 60% 62% 63% 62% 65% 245North Valleys Not Open Not Open Not Open Not Open 42% 48% 55% 52% 141Reed 49% 49% 49% 51% 55% 48% 56% 63% 244Reno 40% 46% 52% 51% 58% 53% 66% 63% 236RTI Not Open Not Open Not Open Not Open Not Open Not Open - 37% 11Spanish Springs Not Open Not Open Not Open Not Open 51% 48% 51% 47% 151Sparks 40% 45% 44% 47% 56% 56% 60% 45% 69TMCC HS 51% 66% 62% 78% 80% 92% 82% 68% 61Washoe 66% 78% 33% 77% 57% 59% 46% 46% 36Wooster 48% 37% 52% 45% 48% 46% 55% 54% 97Total 46% 48% 52% 52% 56% 55% 57% 55% 1597
Numbers may include WCSD students who did not receive a diploma and students co-enrolled at both institutions, and are not comparable to the college-going rates reported on pages 68 and 69.‘-’ Denotes no graduates that year.

TMCC Capture Rate by High School
� Page �4 College Data: Capture Rates
Numbers may include WCSD students who did not receive a diploma and students co-enrolled at both institutions, and are not comparable to the college-going rates reported on pages 68 and 69.‘-’ Denotes no graduates that year
HIGH SCHOOLSFall 1999 Fall 2000 Fall 2001 Fall 2002 Fall 2003 Fall 2004 Fall 2005 Fall 2006
% % % % % % % % NDamonte Ranch Not Open Not Open Not Open Not Open Not Open - 26% 21% 23Galena 17% 15% 25% 20% 26% 23% 24% 17% 51Gerlach 0% 14% 25% 0% 67% 11% 0% 29% 2Hug 23% 17% 26% 24% 29% 27% 25% 26% 35Incline 6% 8% 10% 16% 14% 12% 13% 12% 9McQueen 18% 15% 22% 18% 23% 21% 22% 23% 89North Valleys Not Open Not Open Not Open Not Open 22% 31% 29% 28% 74Reed 25% 23% 21% 24% 24% 27% 28% 27% 106Reno 11% 12% 17% 18% 17% 16% 22% 23% 85RTI Not Open Not Open Not Open Not Open Not Open Not Open Not Open 37% 11Spanish Springs Not Open Not Open Not Open Not Open 27% 27% 19% 22% 70Sparks 23% 20% 21% 23% 30% 32% 39% 25% 38TMCC HS 43% 53% 46% 52% 60% 46% 53% 49% 44Washoe 64% 78% 33% 77% 57% 71% 43% 46% 36Wooster 23% 18% 22% 24% 23% 24% 25% 33% 59Total 21% 19% 23% 24% 26% 26% 25% 25% 732

UNR Capture Rate by High School
� Page �� College Data: Capture Rates
HIGH SCHOOLSFall 1999 Fall 2000 Fall 2001 Fall 2002 Fall 2003 Fall 2004 Fall 2005 Fall 2006
% % % % % % % % NDamonte Ranch Not Open Not Open Not Open Not Open Not Open - 12% 31% 34Galena 30% 41% 33% 33% 37% 39% 41% 37% 110Gerlach 33% 14% 17% 10% 0% 33% 33% 14% 1Hug 14% 18% 18% 11% 13% 15% 17% 15% 20Incline 21% 25% 17% 21% 16% 17% 19% 28% 21McQueen 36% 41% 40% 43% 40% 41% 39% 41% 156North Valleys Not Open Not Open Not Open Not Open 20% 21% 26% 25% 67Reed 23% 27% 30% 28% 32% 29% 28% 36% 138Reno 30% 34% 38% 34% 42% 37% 44% 40% 151RTI Not Open Not Open Not Open Not Open Not Open Not Open - 0% 0Spanish Springs Not Open Not Open Not Open Not Open 24% 22% 32% 25% 81Sparks 17% 25% 23% 24% 28% 18% 22% 20% 31TMCC HS 8% 16% 18% 26% 30% 20% 28% 19% 17Washoe 2% 0% 0% 0% 0% 0% 2% 0% 0Wooster 25% 20% 30% 21% 25% 25% 30% 21% 38Total 25% 29% 29% 28% 30% 29% 32% 30% 865
Numbers may include WCSD students who did not receive a diploma and students co-enrolled at both institutions, and are not comparable to the college-going rates reported on pages 68 and 69.‘-’ Denotes no graduates that year

Ethnic Composition of WCSD Graduates Attending UNR and TMCCFall 200� Freshmen
� Page �� College Data

WCSD Graduates’ Need for Remediation
The percentage of students enrolled in remedial English or math as freshmen at UNR and TMCC is lower than the percentage of stu- dents who need remedial English or math based on their placement scores.
Over �0% of students enrolled in remedial English or math as freshman are there because of their placement exam scores and not because of self-selection.
Enrollment in high school mathematics beyond the level of Algebra 3-4 dramatically reduces the likelihood that a student will need math remediation in college. Enrollment in Advanced Placement English and mathematics courses in high school also appears to reduce the likelihood that a student will need remediation in those content areas in college.
In general, students who registered for remedial math in college are characterized by not having taken four years of high school math, not having taken math beyond Algebra 3-4, and often not even having taken and passed Algebra 3-4.
Those students enrolled in remedial math in college who had completed Algebra 3-4 in high school were generally students who earned a C grade or lower in Algebra 3-4. The average cumulative math GPA in high school of these students was 2.43.
»
»
»
»
»
Prior Conclusions of 4-Year Review of Remediation Data for WCSD Graduates Enrolled as Freshmen at UNR and TMCC
� Page �� College Data: Remediation
Remediation Study Conducted Between 2002 and 200�

Need for Remediation Based on Exam ScoresPercentage of WCSD Graduates With ACT, SAT or Accuplacer Scores Demonstrating a Need for Remedial Math or Eng-lish Placement1
� Page �� College Data: Remediation
1 This chart depicts students whose scores on placement exams were below the cut-off for college level work. Not all of these students enrolled in English or math in their first se-mester at UNR or TMCC. Placement exam cut-off scores: UNR English: ACT verbal <21; SAT verbal < 501; UNR Math: ACT math <21; SAT math <501; TMCC : Accuplacer, ACT or SAT score below cut for college level. Approximately 5% of UNR and 15% of TMCC WCSD freshmen do not have placement exam scores.

Enrollment in Remedial ClassesPercentage of Nevada and WCSD 200� High School Graduates Enrolling in Remedial Courses in Fall 200�1
� Page �� College Data: Remediation
1 Not all students who place at the remedial level enroll in English and/or math classes their freshman year. This chart depicts the percentage of high school graduates actually enrolling in remedial classes in Fall 2006. WCSD students are not included in the State (NV) percentages. The State percentages include charter schools, the WCSD percentages do not.Sources: Nevada System of Higher Education January 2007 Remedial Report, WCSD Data Profile.

Remediation Rates by InstitutionPercentage of WCSD Graduates Registered in a Remedial Course
� Page �0 College Data: Remediation
Sources: Nevada System of Higher Education January 2007 Remedial Report; WCSD Data Profile.

Remediation by High School - TMCCPercentage of WCSD Graduates Enrolled in a TMCC Remedial Course
� Page �1 College Data: Remediation
1 Total includes schools with fewer than five students attending TMCC, and is therefore higher than the sum of individual schools. ‘-’ Denotes fewer than 5 students enrolled.
HIGH SCHOOLS
Fall 1999 Fall 2000 Fall 2001 Fall 2002 Fall 2003 Fall 2004 Fall 2005 Fall 2006% % % % % % % % N
Damonte Ranch Not Open Not Open Not Open Not Open Not Open - 58% 74% 17Galena 37% 39% 49% 65% 59% 64% 65% 71% 36Gerlach - - - - - - - - -Hug 52% 63% 68% 59% 80% 65% 89% 77% 27Incline - 100% - 77% 55% 60% 50% 78% 7McQueen 52% 56% 47% 73% 60% 55% 73% 64% 57North Valleys Not Open Not Open Not Open Not Open 71% 66% 61% 74% 55Reed 54% 52% 59% 69% 63% 71% 66% 71% 75Reno 32% 55% 47% 62% 47% 46% 68% 58% 49RTI Not Open Not Open Not Open Not Open Not Open Not Open No Seniors 73% 8Spanish Springs Not Open Not Open Not Open Not Open 71% 63% 79% 80% 56Sparks 61% 66% 68% 67% 65% 65% 75% 76% 29TMCC HS 26% 15% 29% 24% 35% 27% 40% 32% 14Washoe 53% 57% 62% 62% 57% 45% 67% 69% 25Wooster 42% 84% 65% 59% 66% 65% 59% 71% 42Total 48% 54% 55% 61% 61% 59% 67% 68% 4981
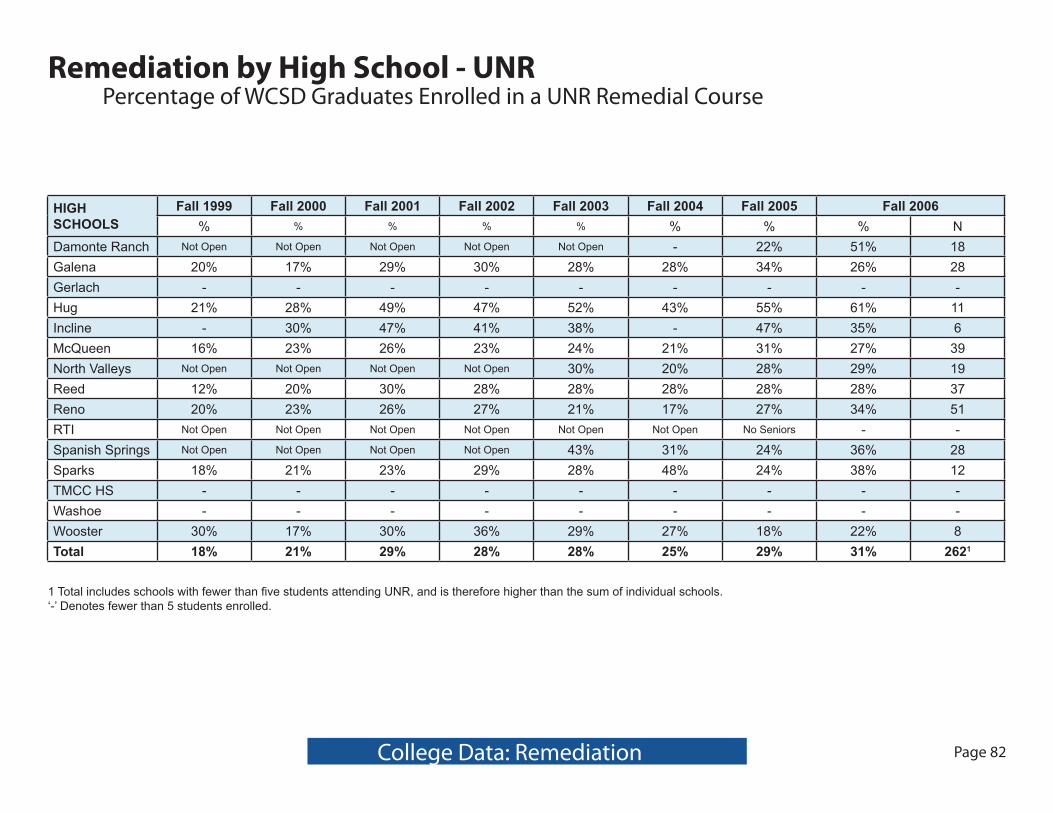
Remediation by High School - UNRPercentage of WCSD Graduates Enrolled in a UNR Remedial Course
� Page �2 College Data: Remediation
HIGH SCHOOLS
Fall 1999 Fall 2000 Fall 2001 Fall 2002 Fall 2003 Fall 2004 Fall 2005 Fall 2006% % % % % % % % N
Damonte Ranch Not Open Not Open Not Open Not Open Not Open - 22% 51% 18Galena 20% 17% 29% 30% 28% 28% 34% 26% 28Gerlach - - - - - - - - -Hug 21% 28% 49% 47% 52% 43% 55% 61% 11Incline - 30% 47% 41% 38% - 47% 35% 6McQueen 16% 23% 26% 23% 24% 21% 31% 27% 39North Valleys Not Open Not Open Not Open Not Open 30% 20% 28% 29% 19Reed 12% 20% 30% 28% 28% 28% 28% 28% 37Reno 20% 23% 26% 27% 21% 17% 27% 34% 51RTI Not Open Not Open Not Open Not Open Not Open Not Open No Seniors - -Spanish Springs Not Open Not Open Not Open Not Open 43% 31% 24% 36% 28Sparks 18% 21% 23% 29% 28% 48% 24% 38% 12TMCC HS - - - - - - - - -Washoe - - - - - - - - -Wooster 30% 17% 30% 36% 29% 27% 18% 22% 8Total 18% 21% 29% 28% 28% 25% 29% 31% 2621
1 Total includes schools with fewer than five students attending UNR, and is therefore higher than the sum of individual schools. ‘-’ Denotes fewer than 5 students enrolled.

TMCC and UNR Persistence RatesWCSD Graduating Cohorts
� Page �3 College Data: Persistence
Nationally, 73.5% will return after 2 semesters at Universities and 55.8% at Community Colleges (2003, ACT Institutional Data Questionnaire).

Persistence at TMCC by High SchoolPercentage Returning After One Semester
� Page �4 College Data: Persistence
Total numbers include schools with fewer than 5 students attending TMCC, and are therefore higher than the sums of individual schools. ‘-’ Denotes fewer than 5 students attended TMCC
HIGH SCHOOLSWCSD Class
of 1999WCSD Class
of 2000WCSD Class
of 2001WCSD Class
of 2002WCSD Class
of 2003WCSD Class
of 2004WCSD Class
of 2005 WCSD Class of 2006
% % % % % % % % NDamonte Ranch Not Open Not Open Not Open Not Open Not Open - 68% 65% 15Galena 80% 65% 80% 77% 71% 77% 77% 71% 36Gerlach - - - - - - - - -Hug 79% 73% 68% 74% 65% 60% 59% 51% 18Incline - - 78% 62% 55% 50% 60% 67% 6McQueen 65% 78% 59% 73% 74% 61% 68% 80% 71North Valleys Not Open Not Open Not Open Not Open 67% 70% 71% 68% 50Reed 70% 74% 75% 77% 69% 75% 76% 77% 82Reno 56% 70% 72% 80% 73% 65% 68% 74% 63RTI Not Open Not Open Not Open Not Open Not open Not Open Not Open 73% 8Spanish Springs Not Open Not Open Not Open Not Open 69% 100% 69% 76% 53Sparks 65% 72% 82% 73% 71% 45% 65% 71% 27TMCC HS 81% 66% 75% 75% 73% 79% 71% 77% 34Washoe 44% 61% 48% 57% 65% 61% 42% 72% 26Wooster 67% 65% 65% 73% 74% 72% 71% 73% 43Total 68% 70% 71% 74% 70% 69% 69% 73% 533

Persistence at UNR by High SchoolPercentage Returning After One Semester
� Page �� College Data: Persistence
Total numbers include schools with fewer than five students attending UNR, and are therefore higher than the sums of individual schools. ‘-’ Denotes fewer than 5 students attended UNR.
HIGH SCHOOLS
WCSD Class of 1999
WCSD Class of 2000
WCSD Class of 2001
WCSD Class of 2002
WCSD Class of 2003
WCSD Class of 2004
WCSD Class of 2005 WCSD Class of 2006
% % % % % % % % NDamonte Ranch Not Open Not Open Not Open Not Open Not Open - 44% 79% 27Galena 97% 90% 92% 90% 89% 91% 89% 95% 104Gerlach - - - - - - - - -Hug 94% 81% 84% 88% 84% 87% 90% 80% 16Incline 95% 95% 93% 71% 77% 100% 100% 86% 18McQueen 93% 91% 95% 95% 92% 90% 95% 92% 144North Valleys Not Open Not Open Not Open Not Open 82% 87% 86% 87% 58Reed 95% 89% 81% 90% 87% 81% 91% 90% 124Reno 94% 91% 88% 96% 90% 95% 90% 95% 143RTI Not Open Not Open Not Open Not Open Not Open Not Open Not Open - -Spanish Springs Not Open Not Open Not Open Not Open 86% 84% 89% 85% 69Sparks 86% 88% 85% 92% 90% 89% 83% 94% 29TMCC HS 83% 92% 89% 81% 78% 89% 67% 88% 15Washoe - - - - - - - - -Wooster 92% 93% 87% 86% 93% 85% 93% 89% 34Total 93% 90% 88% 91% 88% 89% 91% 90% 782
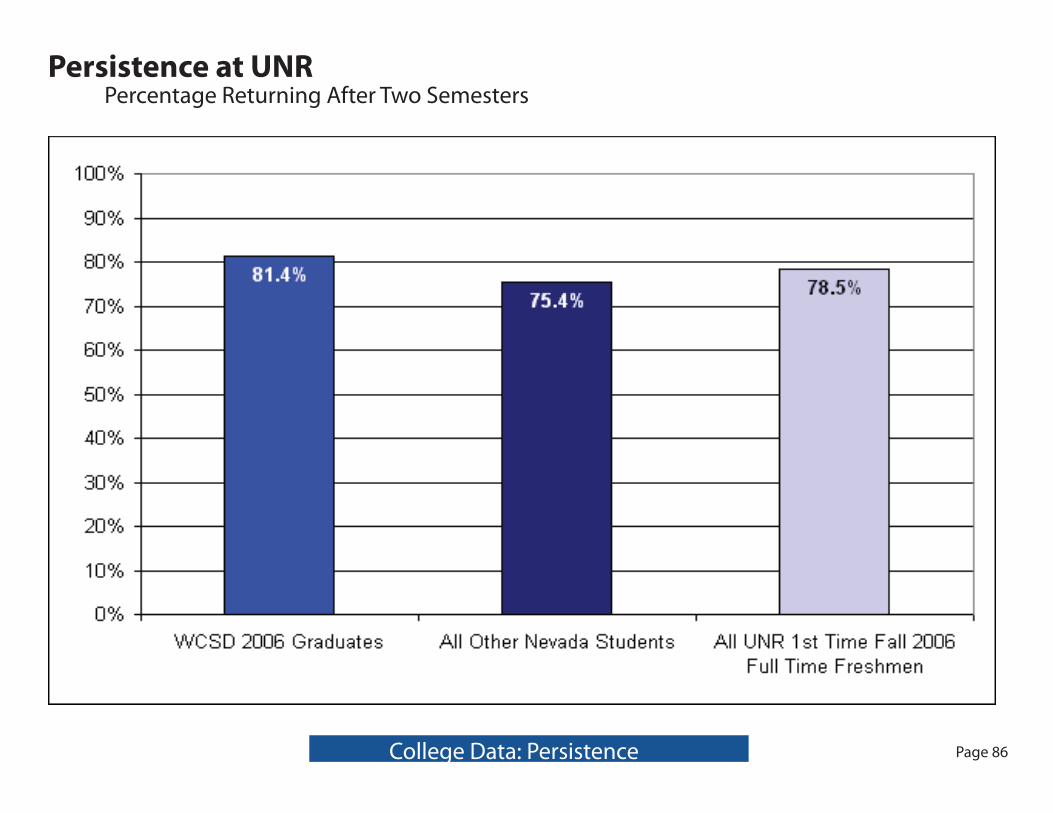
Persistence at UNRPercentage Returning After Two Semesters
� Page �� College Data: Persistence

ACT Scores - UNRACT Composite Scores of WCSD Graduating Cohorts Attending UNR
� Page �� College Data: ACT
The maximum composite ACT score is 36.

Average ACT Scores by High SchoolWCSD Graduating Cohorts Attending UNR
� Page �� College Data: ACT
1. Weighted mean2 Total numbers include schools with fewer than five students attending UNR, and are therefore higher than the sums of individual schools. ‘-’ Denotes fewer than 5 students attending UNR
HIGH SCHOOLS
WCSD Class of
1999
WCSD Class of
2000
WCSD Class of
2001
WCSD Class of
2002
WCSD Class of
2003
WCSD Class of
2004
WCSD Class of
2005WCSD Class of 2006
Score Score Score Score Score Score Score Score NDamonte Ranch Not Open Not Open Not Open Not Open Not Open - 22.0 20.8 9Galena 23.0 23.8 23.5 22.9 22.7 22.8 22.8 22.8 90Gerlach - - - - - - 20.0 - -Hug 22.3 21.7 20.3 22.0 20.1 21.7 20.0 19.8 12Incline 21.9 22.5 19.5 20.8 22.0 25.0 23.7 23.1 14McQueen 24.5 23.5 22.9 23.0 23.5 23.1 22.7 23.1 110North Valleys Not Open Not Open Not Open Not Open 21.8 22.3 22.1 23.3 40Reed 23.3 23.2 22.0 22.6 23.2 21.6 22.1 22.5 109Reno 21.9 22.1 23.1 23.4 23.7 22.8 22.7 22.2 68RTI Not Open Not Open Not Open Not Open Not Open Not Open Not Open - -Spanish Springs Not Open Not Open Not Open Not Open 21.5 20.7 22.6 21.6 33Sparks 22.3 21.6 22.0 21.3 21.6 21.5 21.5 21.8 29TMCC HS 23.8 23.2 23.9 22.5 23.1 23.2 23.8 23.8 9Washoe - - - - - - 21.0 - -Wooster 21.4 22.7 23.4 22.4 23.0 23.0 23.4 21.5 24Avg Score1 | Total N 23.0 22.9 22.5 22.6 22.9 22.4 22.4 22.5 548

� Page ��
SAT Scores - UNRCombined Verbal and Math SAT Scores of WCSD Graduating Cohorts Attending UNR
� Page �� College Data: SAT
The maximum combined SAT score is 1600.

Average SAT Scores by High SchoolWCSD Graduating Cohorts Attending UNR
� Page �0 College Data: SAT
1. Weighted mean2 Total numbers include schools with fewer than five students attending UNR, and are therefore higher than the sums of individual schools. ‘-’ Denotes fewer than 5 students attending UNR
HIGH SCHOOLS
WCSD Class of
1999
WCSD Class of
2000
WCSD Class of
2001
WCSD Class of
2002
WCSD Class of
2003
WCSD Class of
2004
WCSD Class of
2005WCSD Class of 2006
Score Score Score Score Score Score Score Score NDamonte Ranch Not Open Not Open Not Open Not Open Not Open - 964 1013 29Galena 1065 1099 1061 1062 1043 1072 1066 1088 72Gerlach - - - - - - 900 - -Hug 1095 1025 1053 992 1077 1077 978 896 11Incline 1038 1008 1017 999 1034 1004 1051 1126 12McQueen 1102 1115 1078 1113 1158 1122 1069 1080 89North Valleys Not Open Not Open Not Open Not Open 1035 1038 1061 1039 47Reed 1038 1058 1030 1058 1103 1055 1051 1065 94Reno 1039 1053 1076 1095 1112 1071 1068 1053 120RTI Not Open Not open Not Open Not Open Not Open Not Open Not Open - -Spanish Springs Not Open Not Open Not Open Not Open 1024 1023 1070 1038 68Sparks 1115 1030 1068 1127 1019 1041 1030 892 5TMCC HS - 1061 1133 1155 1140 1040 1132 1033 12Washoe - - - - - - - - -Wooster 1018 1039 1064 1098 1079 1064 1094 1047 21Avg Score1 | Total N 1057 1069 1062 1082 1091 1068 1063 1055 581

� Page �1 College Success
College Success of WCSD GraduatesPercentage of Students Awarded College Degrees1
1 For WCSD Class of 1997, college degrees earned by March 2005; WCSD Class of 1998, college degrees earned by March 2006; WCSD Class of 1999, college degrees earned by March 2007.2 “Unspecified” means the type of degree was not specified in the retrieved college dataTo avoid artificially inflating the number of degrees, only the highest degree obtained by an individual was counted.Source: National Student Clearinghouse Student Tracker Service

� Page �2 College Success
College Success of WCSD Graduates at UNRPercentage of Students Awarded College Degrees Within Six Years of Initial College Enrollment
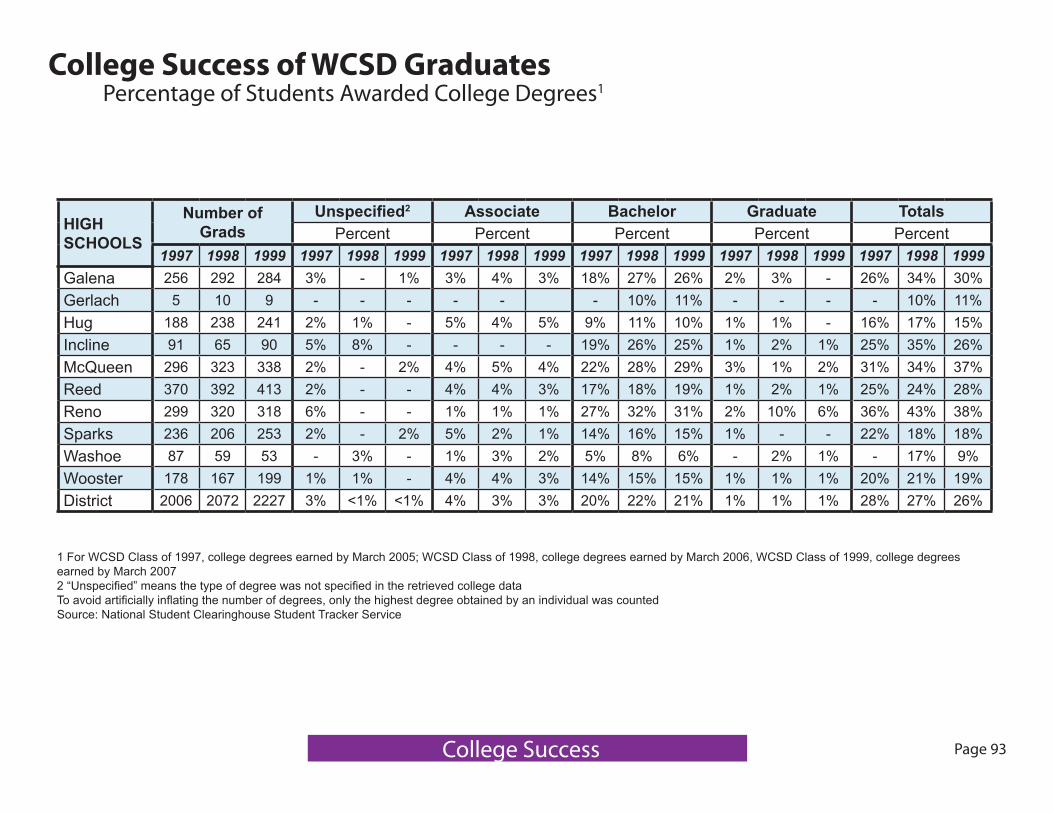
College Success of WCSD GraduatesPercentage of Students Awarded College Degrees1
� Page �3 College Success
HIGH SCHOOLS
Number of Grads
Unspecified2 Associate Bachelor Graduate TotalsPercent Percent Percent Percent Percent
1997 1998 1999 1997 1998 1999 1997 1998 1999 1997 1998 1999 1997 1998 1999 1997 1998 1999Galena 256 292 284 3% - 1% 3% 4% 3% 18% 27% 26% 2% 3% - 26% 34% 30%Gerlach 5 10 9 - - - - - - 10% 11% - - - - 10% 11%Hug 188 238 241 2% 1% - 5% 4% 5% 9% 11% 10% 1% 1% - 16% 17% 15%Incline 91 65 90 5% 8% - - - - 19% 26% 25% 1% 2% 1% 25% 35% 26%McQueen 296 323 338 2% - 2% 4% 5% 4% 22% 28% 29% 3% 1% 2% 31% 34% 37%Reed 370 392 413 2% - - 4% 4% 3% 17% 18% 19% 1% 2% 1% 25% 24% 28%Reno 299 320 318 6% - - 1% 1% 1% 27% 32% 31% 2% 10% 6% 36% 43% 38%Sparks 236 206 253 2% - 2% 5% 2% 1% 14% 16% 15% 1% - - 22% 18% 18%Washoe 87 59 53 - 3% - 1% 3% 2% 5% 8% 6% - 2% 1% - 17% 9%Wooster 178 167 199 1% 1% - 4% 4% 3% 14% 15% 15% 1% 1% 1% 20% 21% 19%District 2006 2072 2227 3% <1% <1% 4% 3% 3% 20% 22% 21% 1% 1% 1% 28% 27% 26%
1 For WCSD Class of 1997, college degrees earned by March 2005; WCSD Class of 1998, college degrees earned by March 2006, WCSD Class of 1999, college degrees earned by March 20072 “Unspecified” means the type of degree was not specified in the retrieved college dataTo avoid artificially inflating the number of degrees, only the highest degree obtained by an individual was countedSource: National Student Clearinghouse Student Tracker Service
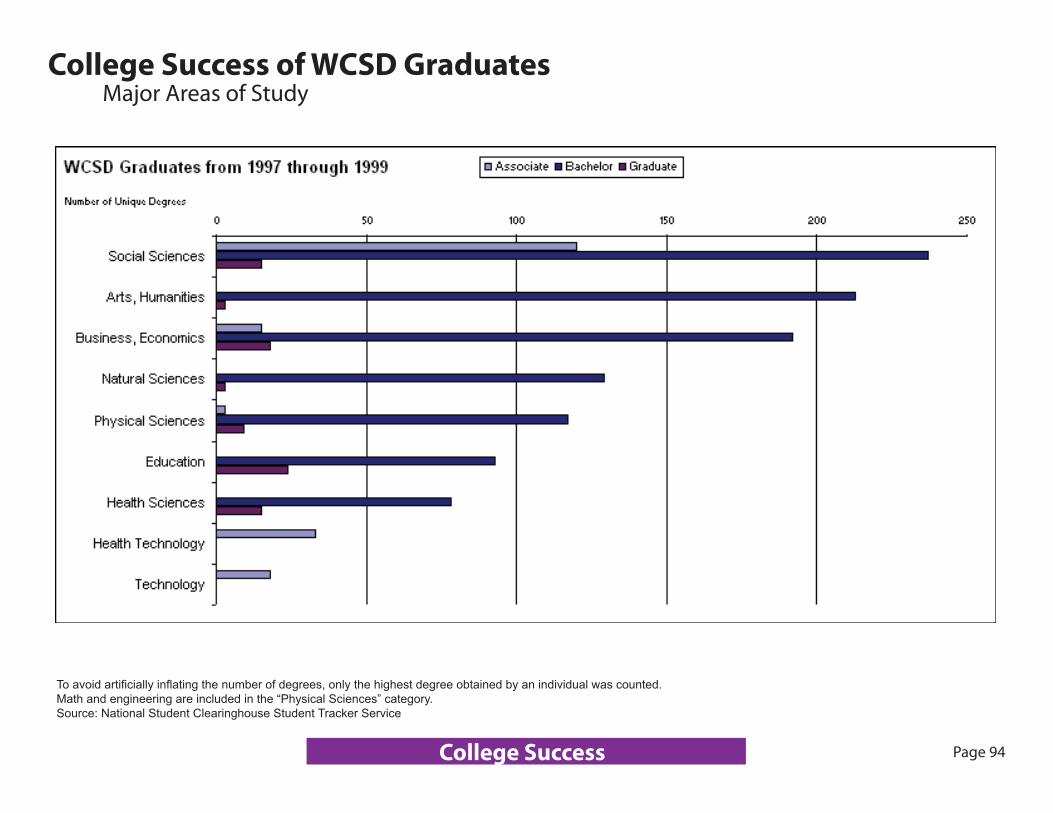
College Success of WCSD GraduatesMajor Areas of Study
To avoid artificially inflating the number of degrees, only the highest degree obtained by an individual was counted.Math and engineering are included in the “Physical Sciences” category.Source: National Student Clearinghouse Student Tracker Service
� Page �4 College Success