warwick economic research papers · the impacts of liberalisation on a brazilian air shuttle market...
TRANSCRIPT

THE IMPACTS OF LIBERALISATION ON A BRAZILIAN AIR SHUTTLE MARKET
Alessandro V.M. Oliveira
No 676
WARWICK ECONOMIC RESEARCH PAPERS
DEPARTMENT OF ECONOMICS

THE IMPACTS OF LIBERALISATION
ON A BRAZILIAN AIR SHUTTLE MARKET
Alessandro V.M. Oliveira♣
ABSTRACT
This paper aims at assessing the impacts of recent economic liberalisation on an important
subset of the Brazilian airline industry: the air shuttle market on the route Rio de Janeiro –
São Paulo, a pioneer service created in 1959. In order to estimate structural relationships of
the competition model, a product differentiated setting with conduct parameter was designed.
Results permitted inferring about a rupture in the degree of firms' heterogeneity and in the
extent of the deviation from Nash behaviour due to regulatory reform, as well as estimation of
pertinent route-level cost information.
Key words: air shuttle - airline industry - competition - deregulation - product differentiation
JEL Classification: L93
♣ Department of Economics, University of Warwick – UK. Email: [email protected]. The author would like to thank Michael Waterson, Margareth Slade, Peter Mackie, Jeremy Toner, José Maria Silveira, Carlos Müller, Milton Valdir Feitosa, Frederico Turolla, André Busto, Adalberto Febeliano, Dario Rais Lopes, Amrah Cardoso, Jorge Silveira, Clarisse Rodrigues, Robson Ramos, Allemander Pereira Filho, Manuel G. Flores, the Department of Civil Aviation, the participants of respective sessions at ANPET 2001 (Campinas, Brazil), ANPEC 2002 (Nova Friburgo, Brazil), and RES 2003 (Coventry, UK) conferences, and CAPES. Special thanks to Rachel Oliveira. All errors are the author's.

1
1. INTRODUCTION
This paper aims at developing a competition model in order to assess the impacts of recent
economic liberalisation in a relevant subset of the Brazilian airline industry: the air shuttle
service on the route Rio de Janeiro - São Paulo. This market was where the first air shuttle in
the world, the ‘Ponte Aérea’, was created, in 1959, by an agreement of airline managers, and
which dominated the airport-pair linking the city centres of the cities for almost forty years.
Air shuttles are usually characterised by very frequent service, walk-on flights with even
intervals, no reservations and short-haul markets. This concept is nowadays widespread in the
airline industry, usually providing service for highly time-sensitive passengers, with well-
known examples being the Eastern Airlines’ Boston-New York-Washington and the Iberia’s
Madrid-Barcelona. These airlines were pioneers in launching air shuttles in the United States
(1961) and in Europe (1974), respectively1.
The competition model presented here was developed to represent the rivalry and strategic
interdependence among airlines in a shuttle market with product differentiation. Firms are
assumed to play a static oligopoly game in which price is the strategic choice variable. As
route level costs are non-observable by the econometrician, the approximation of Brander and
Zhang (1990) is then performed in parallel with the estimation of first-order conditions for
firm' profit maximisation.
In order to estimate the impacts of liberalisation in the air shuttle market, this paper performs
analyses in two main directions: competitive conduct and product differentiation.
Firstly, it makes use of the conduct parameter approach (as in Porter, 1984, and Genesove and
Mullin, 1998) to infer the extent of deviation from Nash equilibrium, and the behaviour of
airlines during the process of quasi-deregulation, especially with respect to the new strategies
emerged in the post-liberalisation period - such as demand segmentation and frequent flyer
programmes -, some exogenous shocks - such as a fire in one of the endpoint airports
1 Eastern Airlines’ shuttle was purchased by Donald Trump in 1989 and became The Trump Shuttle. This service was operated by USAir after it went bankrupt in 1992, and was finally acquired by US Airways in 1998.

2
(February 1998) and a shift in costs due to currency devaluation (January 1999)-, and the
interference of macroeconomic authorities in airline's pricing freedom.
In conjunction with conduct analysis, it also investigates a rupture in the degree of product
differentiation due to liberalisation, by making use of an index of heterogeneity (as in Singh
and Vives, 1984).
The paper is divided into the following sections: firstly, some characteristics of the Brazilian
airline industry are given, along with a historical background of the economic liberalisation
performed by country's aviation authorities. Then, main elements of air shuttle markets are
provided and the evolution of the Rio de Janeiro - São Paulo air shuttle is described, what is
followed by the theoretical structure and empirical model. Finally, main results are presented,
along with the conclusions.

3
2. HISTORICAL BACKGROUND
2.1 The Brazilian Airline Industry
The domestic air transportation in Brazil is a fast-growing industry. According to the
Department of Civil Aviation, there were 20.5 million passenger-kilometres flown in 2000
against 11.8 million in 1992, representing growth of more than nine percent per year, a much
higher rate than the country's overall economy.
As with most airline industries around the world, Brazilian air transport is rather dependent on
both domestic and international economic conditions on account of derived demand
characteristics. In fact, this situation is even aggravated due to usual currency exchange
instability in the country, which usually affects not only demand for international travel, but
also aircraft lease, maintenance, and fuel costs, causing recurrent financial crises. Besides
that, airlines face very high taxation, with overall rates around thirty-five percent, compared
with 7.5% for North American and 9% for European airlines, and much higher fuel tax2
(Airfinance Journal, 2000), what makes them usually demanding for governmental help.
One of the most relevant characteristics of Brazilian airline industry is the gradual and
continuous process of economic liberalisation that has been undertaken since early nineties.
Next section provides details of the measures towards deregulation led by Department of Civil
Aviation, the country's aviation authority.
2.2 Economic Liberalisation and the Path Towards Quasi-Deregulation
Economic liberalisation of the industry started at the beginning of the nineties within a
broader governmental program for deregulation of country's economy. Most important
measures undertaken so far are described in the summary of policies regarding the sector
during the past thirty years, in Appendix 1.
2 They actually pay twice as much for fuel due to fuel tax (Airfinance Journal, 2000).

4
The most representative phase of the regulatory period was from 1973 to 1986, where
regulation was performed along with mechanisms of development policy. In fact, the
government accomplished a framework of "four national airlines and five regional airlines" in
order to both regulate and promote industry's development, in a policy completely enacted by
1976. Prices were fixed by authorities, entry was banned, and the country was divided into
five main monopolies for regional airlines. Besides that, competition between regionals and
national (trunk) airlines was virtually absent.
From 1986 to 1992, the government started being more intrusive in terms of macroeconomic
interference in the industry, especially with respect to stabilisation policy targeting. This
policy was remarkable in terms of interfering in all infrastructure industries in the country and
led to artificially low real prices, which caused great losses for airlines.
Liberalisation effectively started from 1992 on, although some measures of deregulation were
already present since 1989 (fare bounds, for example). During this First Round of
Liberalisation, regionals' monopolies were abolished, with exception to the airport-pairs
linking city centres of four major cities3 (called "special" airport-pairs, SAP). What is more,
the policy of "four nationals & five regionals" was also abolished, and thus entry was
stimulated by the authorities, what led to a wave of new small airlines in the market.
Also, there were now reference prices and bounds of -50% up to +32% of their values, and
price competition was now seen as "healthy" for the industry, and was therefore encouraged.
This can be regarded as a period of inactive stabilisation policy controls, as there was no need
for the macroeconomic authorities to interfere in the market: no pressure for price increase
due to higher competition, and lower instability in the costs side, as currency exchanges - the
main source of variation in costs - were under control.
In the late nineties the aviation authorities decided removing two relevant regulatory devices
remaining in the market: the fare bounds and the exclusivity of operations of SAPs by
regionals. This generated the Second Round of Liberalisation (enacted in Dec/97-Jan/98),
what triggered much strategic interaction by airlines, with intense price and frequency
competition.
3 São Paulo (CGH), Rio de Janeiro (SDU), Belo Horizonte (PLU) and Brasília (BSB).
5
This phenomenon was exacerbated on the Rio de Janeiro - São Paulo route, the country's
densest flow linking its best known cities. One very relevant subset of this market is the
airport-pair Santos Dumont (SDU, Rio de Janeiro) - Congonhas (CGH, São Paulo), the most
important of the SAPs. Notably, the SDU-CGH airport-pair is closely associated with the
competition of multi-frequency, walk-on, air shuttles in the market. In fact, it was there was
the first air shuttle in the world was created, the ‘Ponte Aérea’ (airlift4), in 1959 - two years
before the pioneer service of Eastern Airlines shuttle in the United States.
With the gradual deregulation measures of the nineties, the agreement started losing strength.
After years of operations under the approval of the regulators5, its dominance started being
criticised, especially due to fears of market power exercise in the newly liberalised market
conditions. In fact, when regional airlines were allowed to enter the route, in 1989, the ‘Ponte
Aérea’ was seen more as a cartel of major airlines than a regular pooling agreement.
With the Second Round of Liberalisation, the consequent increase in the contestability led to
relevant boost in price competition, and even the fire at SDU, in February 1998, did not
represent an impediment to it6. Airlines started having their own strategies on the route, in a
process that ultimately led to the dissolution of the forty-year-old cartel, announced in June
1998.
The end of the cartel did not represent an end of air shuttle features on the route. On the
contrary, new air shuttles were created by the existing airlines, in order to attract highly time-
sensitive demand and to cope with increasingly fiercer competition. The next section provides
a more detailed description of market’s main characteristics after liberalisation.
Another relevant characteristic of the period was the strong instability of currency exchanges
(US dollar), especially the shock of January 1999, which represented major increase in firm's
operational costs. As the pressures for price increase in the whole economy were strong,
4 The term "airlift" first appeared in the city of Berlin during the Cold War, "by virtue of the necessity created by the blockade imposed by the Soviet Union" (Aviation Daily, 2002). 5 Since its creation, the Brazilian aviation authorities considered the agreement beneficial for consumers because of the market expansion it generated. As prices were regulated and entry was banned, it operated as a natural, state-controlled, monopoly on the route, being an exception to regional's monopolies in SAP markets.
6 In fact, prices fell by 27% during the closing of SDU.

6
macroeconomic authorities started interfering in the industry again. This represented relevant
constraint to airlines' strategies, as they could not increase prices whenever they wanted;
besides that, antitrust authorities were now closely monitoring the market.
Finally, in 2001, most of the remaining economic regulation was removed, as well as the
macroeconomic interference. Thus, airlines could set their prices freely from that period on. It
can be called a 'quasi-deregulation' period, as entry, price and frequencies were almost
entirely liberalised.
3. MARKET CHARACTERISTICS
3.1 Definitions and General Elements
Air shuttles usually represent major air corridors linking important political, economical,
social or cultural centres with a very high traffic density - the reason why they can be very
relevant markets to competing airlines. According to Teodorovic (1985) the main
characteristics of this sort of routes are:
i. equal intervals between two successive departures; and
ii. the impossibility of reserving tickets in advance.
Following this definition, it is clear that a typical air shuttle configuration requires the airlines
to provide one or more guarantees to passengers, in order to assure that "[either they] will
depart on the first departing plane, or that within a certain probability, [they] will depart on
the first departing plane, or that [they] will depart on the next departing plane if cannot get a
vacant seat on the first departing plane, etc" (Teodorovic, 1985)7.
In practice, air shuttle markets are characterised by very frequent service8, with intervals
between flights from fifteen minutes to an hour (multi-frequency markets), depending on the
7 Airlines can add other operational guarantees to the typical air shuttle guarantee. For example, in the Boston-New York-Washington market Delta Shuttle commits with 3 guarantees (Triple Guarantee Policy), whereas US Airways Shuttle with five. 8 US Airways Shuttle, for example, flies 24 daily roundtrips between Boston and LaGuardia, and 14 daily roundtrips between LaGuardia and Ronald Reagan Washington National Airport (October 2002).

7
time of day, and commonly operated on short-haul domestic routes, such as Boston-New
York (258 km, with Delta and USAirways Shuttles), Madrid-Barcelona (483 km, with Iberia's
"Puente Aéreo"), Paris Orly-Toulouse (574 km, with the extinct Air Inter Europe's "La
Navette"), etc.
It is important to notice that one might find slight variations in air shuttles around the world,
specially related to the "walk-on" features - that is, the last-minute availability without having
to book -, due to country-specific airline legislation, which may impose relevant constraints9.
In order to cope with that, airlines have nowadays developed mechanisms of increasing
customer's flexibility of time, by introducing automatic ticketing machines and dedicated
boarding gates available at airports. Irrespective of these variations, the main idea of shuttles
is still to serve a demand that is very time-sensitive and business-purposes related, in a
relatively ordered way (equal intervals).
The air shuttle market SDU - CGH is formed by central airports in Rio de Janeiro and São
Paulo, in a non-stop flight of approximately 50 minutes (365 km). As with most dense routes,
it is notable for its very high service levels, with average distance between flights being lower
than 25 minutes (August 1998); actually, this could be down to 17 minutes during peak hours.
The airport-pair is a subset of the market consisted of the route linking the cities, which
includes International Airports of Galeão / Antônio Carlos Jobim (GIG, in Rio de Janeiro) and
Guarulhos (GRU, in São Paulo). Nevertheless, among the four possible airport-pair
compositions, GIG-GRU is the most relevant alternative to SDU-CGH. Table 1 presents how
demand distributes across airport-pairs in the city-pair market:
9 For example, in the Eastern Air Shuttle case, passengers could buy tickets on board, whereas in the Brazilian ‘Ponte Aérea’ this was not permitted by authorities (nowadays it is possible to make reservations in CGH-SDU market, but it is still not allowed to make purchases on board).

8
Table 1 – Demand Distribution across Airport-Pairs10
Airport-Pair
GIG-GRU 396,889 26.4% 359,777 14.8%
GIG-CGH 3,793 0.3% 183,935 7.6%
SDU-GRU 3,166 0.2% 7,010 0.3%
SDU-CGH 1,101,390 73.2% 1,879,428 77.3%
Total RJ-SP 1,505,238 2,430,150
1 SEM 1997 1 SEM 2001
Other alternatives for travellers in the airport-pair include coach and telecommunications. The
former represents the only transport alternative to air travel, due to non-availability of a rail
system for passengers11. The latter is usually reported as relevant by the transport literature,
and air shuttles may be especially influenced: “During the economic downturn of the early
1990s [in the United States] (...) many businesses were relying on facsimile machines,
electronic mail, and videoconferences in place of air travel” (O’Connor, 1995). Besides that,
telecommunication industry was privatised and liberalised during the mid nineties in Brazil,
and the consequent fall in tariffs made this alternative even more attractive.
Although indeed relevant, the three aforementioned alternatives (GIG-GRU, coach and
telecommunications) were not explicitly regarded in this study, and the main reason is the
following: to be able to focus on the behaviour of the typical traveller of SDU-CGH market,
which means a given (and homogeneous) standard of disutility to travel times. Besides that,
considering GIG-GRU would cause estimation problems due to the great amount of
passengers in flight connections (domestic and international) observed12. Coach travellers can
be disregarded using the same reasoning, especially if one takes into account that travel time
is more than seven times longer (almost six hours). Finally, telecommunication effects can be
seen as affecting only in the long run, whereas present analysis deals with short run only.
10 In number of passengers; source: Department of Civil Aviation.
11 A very different situation when compared to the competition provided by train operators in the shuttle markets New York-Washington (Amtrak's "Acela Express") and Tokyo-Osaka (Shinkansen "bullet trains").
12 Unfortunately, the data provided by DAC does not disaggregate traffic into direct trips and flight connections.

9
3.2 Evolution from "Classic" to Product-Differentiated Air Shuttle
The main reasons of establishing an air shuttle service are the provision of higher service
levels to passengers, and the soothing of competition between flights13. The former is reached
by providing departure times closer to passengers' preferred times due to the more even
spread (and dominance) of schedule over an operating day. The latter is reached by the
increase in departure-time differentiation, that is, instead of having clusters of similar
departure times, there is an increase in the distance between them, in order to maximise
spatial product differentiation (as described by Borenstein and Netz, 1999).
On the other hand, however, air shuttle operations may be a very relevant source of product
homogeneity in a given market: one can hypothesise the representative consumer for air
shuttle service as the one who is always interested in getting the first flight available. As
Teodorovic (1985) describes: "After establishing the air shuttle, a large number of passengers
will become familiar with the services offered. Most of them will adjust their arrival at the
airport to the service, trying to minimize waiting time". This interaction between supply and
demand can, ceteris paribus, make airlines' products homogeneous by letting passengers
make their choice based only in their desired departure time, regardless the name and specific
attributes of the airline they are travelling with.
Therefore, one should expect the degree of product differentiation in an air shuttle market to
be determined by the combination of the two aforementioned effects, that is, the increase of
departure-time differentiation and the increase in passengers' desire to get the first flight
irrespective of the airline. What is more, the existence of price regulation and additional
airline coordination (eg. by ticket endorsement14), can be decisive in terms of determining
market outcome, ie., either product homogeneity or product heterogeneity.
13 One can observe that air shuttles are very likely to engender competitive advantage for participant firms, as they create reputation of very frequent and flexible service; this can be demonstrated by Iberia's legal battle of eight years in Spain's Supreme Court in order to be allowed to use the term "Puente Aereo" as its own brand name, and then, preventing its competitors from using it, on the route between Madrid and Barcelona (Aviation Daily, 2002). The air shuttle concept, in this case, represented first mover advantage.
14 That is, a common policy between existing competitors permitting any traveller holding a ticket issued by one airline to be able to go to the ticket counter of any airline, have the ticket endorsed (acknowledged), and board a flight provided by this airline.

10
Indeed, one can observe that air shuttles are potential candidates for coordination of flight
schedules among airlines, mainly because it requires large scale of operations in terms of very
frequent service. In order to spread flight times in an evenly way across the relevant time
period of a day, without causing much increase in departure intervals, conjoint operations is
usually considered a reasonable alternative, either by airlines or even by regulators. For
example, the Tokyo-Osaka shuttle service is performed jointly by All Nippon Airways, Japan
Airline and Japan Air System, with codeshare agreement, ticket endorsement and specific
website for e-ticketing.
If we consider a shuttle route with price regulation (equal fares across airlines) and full ticket
endorsement, this could be undoubtedly regarded as market with homogeneous product. This
situation is defined here as "classic" air shuttle market.
In the CGH-SDU case, the aviation authority indeed allowed the shuttle agreement since its
creation, and, what is more, made it an official monopoly for years. During the eighties, VRG,
TBA, VSP and CRZ operated this market with full ticket endorsement and common ticket
counters at both airports, and in a pooling agreement, the "Ponte Aérea". This could be
undoubtedly considered a "classic" shuttle period.
In the nineties, however, with the liberalisation measures and the allowed entry of regionals
on the route, the market gradually evolved from "classic" to a more modern concept of
shuttle. Especially in 1998, with the Second Round of Liberalisation and the fare war of
March, airlines started introducing several elements of product differentiation, launched after
the post-fire restoration of SDU15: firstly, "Ponte Aérea" was split into individual shuttles; and
secondly, explicit efforts of segmentation were then performed. Indeed, one could observe
VRG and TAM offering frequent flyer programmes, more flight time options, higher peak-
dominance, better service levels at the airports, newer aircrafts, etc., focusing on the more
frequent consumers - which can be called "loyal" travellers segment -, whereas VSP and TBA
providing a basic service with deep discounts, focusing on the less frequent consumers - "non
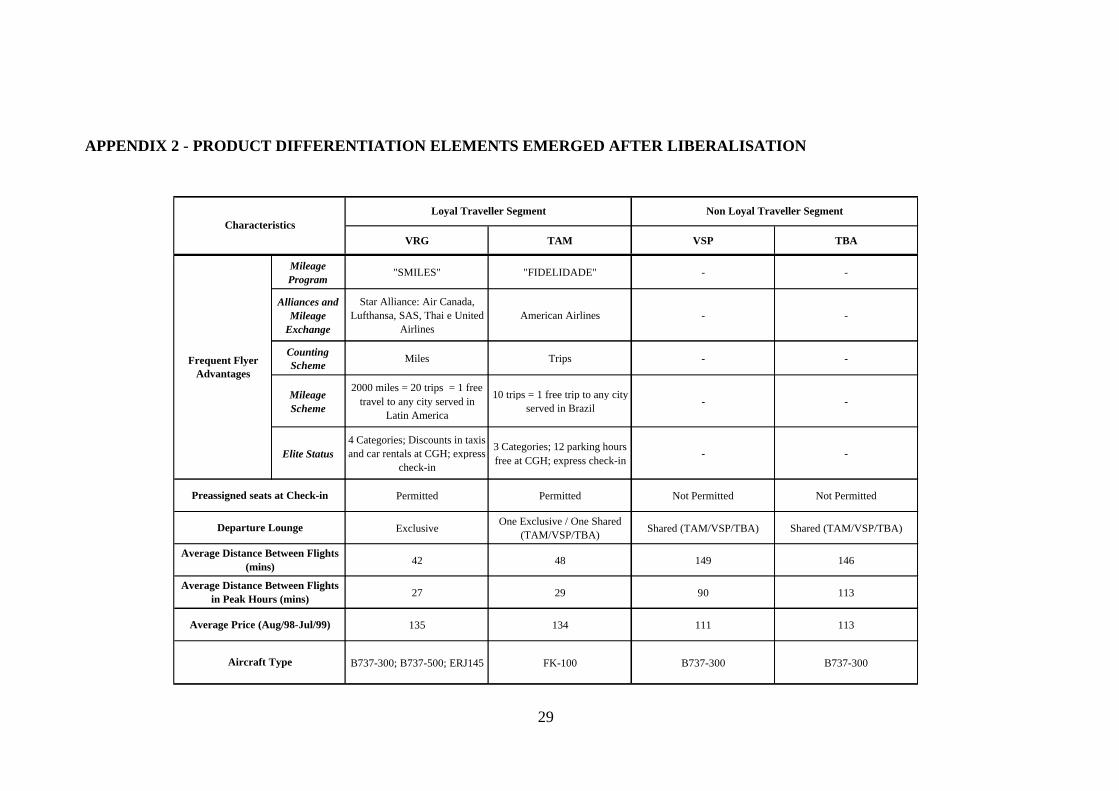
loyal" travellers segment. For more details of firms' products in the market since August
1998, check Appendix 2.
15 SDU was closed for almost six months due to a fire in February 1998. Airlines were then transferred to GIG until SDU's fully restoration, which happened in August 1998.

11
In order to reveal the major elements of product differentiation in the post-liberalisation
period, a survey was performed with passengers on the route (described in Oliveira, 2003).
Results of the field research were very supportive of the idea of the existence of two segments
of passengers. They are detailed in Appendix 3.
In summary, one can observe the existence of two major periods in the air shuttle market after
the first liberalisation measures of the early nineties: one, with competition between "Ponte
Aérea" and the regionals, prevailing until mid 1998; and the other, with competition between
firms in two niches: the "loyal" and the "non-loyal" travellers segment. Both periods
represented a complete rupture with "classic" standards of operations. Table 2 permits
comparisons between periods:
Table 2 - Evolution of Product Differentiation in the Market
Characteristic1. "Classic" Air Shuttle
2. Air Shuttle with Some Product Differentiation
3. Air Shuttle with Higher Product Differentiation
Period Eighties Nineties Until Mid 1998 From Mid 1998 on
Groups of CompetitorsOnly "Ponte
Aérea""Ponte Aérea" versus
RegionalsLoyal versus Non-
Loyal Segment
Full endorsement PresentPresent only among
"Ponte Aérea" airlinesAbsent
Common Counters PresentPresent only among
"Ponte Aérea" airlinesAbsent
Price Competition Absent Present Present
Frequent Flyer Programs Absent Absent Present
Although it is clear from the discussion above that product differentiation was present both
before and after the Second Phase of liberalisation (in the first case, between Ponte Aérea and
the regionals, and in the second case, between VRG-TAM and VSP-TBA), the degree of
product differentiation and the existence of a rupture in it due to the Second Round of
Liberalisation is still an empirical matter. They will be key points of investigation in the
theoretical and empirical modelling of Sections 4 and 5.

12
4. THEORETICAL STRUCTURE
Consider static price competition in a product-differentiated setting, with two groups of firms.
Prices as choice variables are also assumed by Berry, Carnall and Spiller (1996)16, and
"duopoly" assumption is directly derived from the grouping of competitors described in last
section (Table 2). Demand function of each firm is the following:
( )dkijkiki eHYppqq ,,,,, β= , i = {1,2} (1)
Where qki is quantity of firm k of group i, pki and pj are, respectively, own and rival's prices,
Yki is a vector of firm-specific demand shifters, H is a vector of market demand shifters, β are
unknown parameters and ed are disturbances.
Let us define Ψ as the measure of the degree of firm's homogeneity in the market, as in Dixit
(1979) and Singh and Vives (1984):
2211
2112
ββββ
=Ψ (2)
Where β11 and β22 are own-price sensitivity of demand, β12 and β21 are cross-price sensitivity
of demand, for firms on groups 1 and 2, respectively. Ψ is assumed to be between 0
(completely independent groups) and 1 (completely homogeneous groups), and thus the
higher is the index, the higher is the degree of product homogeneity in the market. Ψ permits
checking for rupture in perceived differentiation among groups due to liberalisation - one of
the main targets of this paper.
Suppose now that each firm faces a total cost function, TC, in the sistemwide level, that is, in
the whole industry, considering an aggregation of all domestic routes:
( )ckikikiki eZWQTCTC ,,,, γ= (3)
16 In opposition to Marín (1995), Captain and Sickles (1997), Brander and Zhang (1990), which assume competition in quantities.

13
Where Qki is the systemwide quantity (measured in the whole domestic segment of Brazilian
airline industry) of firm k of group i, Wki is the vector of factor prices paid by firm ki, Zki is a
firm-specific cost shifter vector, γ are unknown parameters and ec are disturbances.
Marginal cost can therefore be developed as:
( )γ,,,1 kikikiki ZWQTCMC = (4)
Whereas in this case one can observe marginal cost at the sistemwide level, this is not true at
the route level17. As the observable variables are only those related to the total cost function in
the systemwide level, that is, the global figures for the domestic airline market provided by
DAC, some sort of approximation is needed. The approach used was to "convert (...) overall
cost per passenger to a route specific cost" of Brander and Zhang (1990)18. Suppose the
following (non-observable) route-level marginal cost:
( ) ( )λγλ ,,,,, kikikikiki ZWQmcMCmcmc == (5)
Where λ provides the conversion of MCki (overall marginal cost) to mcki (route-level marginal
cost), developed in the following way:
λ−
=
kikiki
dd
dMCmc
(6)
Where d is the airport-pair distance and kid is firm ki’s average stage length. λ is a route-
specific parameter; it accounts for the phenomenon of “cost taper” and means that “total cost
per passenger-mile drops as the length of the trip grows” (O’Connor, 1995). Cost taper may
be a relevant feature especially within the context of short-hauls, due to higher costs per seat-
mile – known as the “short-haul problem” and which usually affects air shuttle markets19.
17 Usually, as Brander and Zhang (1990) describe, the appropriate operational definition of route-specific marginal costs is "far from obvious", and one has to develop proxies for it, as for ex., Douglas and Miller (1974). 18 Also in Oum, Zhang and Zhang (1997). 19 O’Connor (1995) mentions the demand and costs side of the short-haul problem: “Not only is the cost per seat-mile higher for shorter stage lengths, but the demand is highly elastic (...) since alternative modes of transportation, notably the private automobile, are relatively attractive over shorter distances”. Air shuttle markets, however, may not feel the demand effect so intensively, as they are characterised by highly time-sensitive and price-inelastic passengers.

14
Following Bresnahan (1989), I define perceived marginal revenue (pmr)20 as:
kikikiki pDqpmr 11−+= θ , kiki pqD ∂∂=1 (7)
Where θki is the conduct parameter, an index of the competitive nature of firm k in a given
group i. θ is usually known as the firm's conjecture, although here I interpret it in the same
way as Slade (2001), that is, "as misspecification parameter that measure the extent of the
deviation from the null hypothesis of static Nash-equilibrium behavior".
Basically, if firms' conduct is consistent with Nash behaviour, then one would expect each
firm's marginal revenue to equate marginal costs (θki =1, for all i). The lower the θ, the more
competitive firms are and, in one extreme, θ = 0 represents marginal cost pricing. On the
other hand, the higher θ, the more collusive firms are and, in the limit, there will be perfect
collusion. Both cases (that is, θ < 1 and θ > 1) shall be regarded as deviations from non-
cooperative Nash equilibrium.
By developing the profit maximisation problem in a similar way of Porter (1984), and using
(1), (6) and (7) one can reach the following first-order condition21:
1
1−−
−
=
ii
i
kikiki d
ddMCp
ηθλ
(8)
Where ηii is the own-price elasticity of demand of firms belonging to group i.
Equations (1), (3) and (8) can be estimated as a system and conduct parameters are identified
and can be then compared with Nash benchmark. Above all, if one considers an empirical
matter to infer the behaviour of firms after liberalisation, as discussed before, this framework
proves to be quite useful, as it permits checking for structural changes in θ before and after
the regulatory reform, in the same approach of the analysis of Ψ.
20 It is "perceived" because it depends on the extent to which firms recognise the distinction between its demand, its marginal revenue, and market marginal revenue functions, what is captured by θ. Check Bresnahan (1989) and Appendix 4.
21 Algebraic developments can be checked in Appendix 4.

15
5. EMPIRICAL MODEL AND ESTIMATION
5.1 Data Discussion
Data for this model is composed by a cross section of airlines in the airport-pair CGH-SDU,
over time, in a panel, as described in Table 1. All information - published and non-published -
was kindly supplied by Brazil’s Department of Civil Aviation (DAC) and collected in the
period Oct/2001 - Jan/2002. Descriptive statistics of most relevant variables can be found in
Appendix 7 (Tables A.3 and A.4).
Table 3 - Data Details
Characteristic Description
MarketTwo directional one-way airport-pairs: SDU-CGH and CGH-SDU (single trips).
Period Jan/1997 - Oct/2001 (58 months).
Missing Data months of SDU closed: filled with GIG data (Feb/1998-Jul/1998)
Observations 466 (Pre-Liberalisation:190, Post-Liberalisation:276)
Firms VRG (116 Obs.), VSP (116), TAM (116), TBA (80), RSL (38)
Here I follow the approach of directional origin-destination markets of Berry, Carnall and
Spiller (1996), that is, considering both CGH-SDU and SDU-CGH data. However, it must be
emphasised that in that paper they could observe round-trip traffic, which is not the case in the
present data sample. By having that kind of disaggregation, the authors were able to allow for
"characteristics of the origin city to affect demand" - a phenomenon considerably less visible
in this case.
Therefore, as the data set permits observing only single trip, one-way markets, one has to be
aware of inevitable crossed-effects in traffic generation, that is, the characteristics of the
demand in one one-way market having considerable influence in the demand for the other
one-way market. This is explained as part of the traffic observed in one market not being

16
generated there, but being merely an extension of the traffic originated in the other market,
and vice versa.
This can be illustrated with a simple example. Suppose two round-trip markets unobserved by
the econometrician: A-B-A (with, say, 70% of total traffic on the route A-B) and B-A-B (with
30%). If, as in the present case, data available only permits observing the one-way markets A-
B and B-A, then it is clear that, under normal circumstances, the composition of both A-B and
B-A will be approximately 35% and 15%, that is, respectively, half of A-B-A and half of B-
A-B22. Thus there is strong tendency for the markets to be homogeneous, and then, to have the
same O-D composition in terms of round-trip markets. The example permits arriving at the
conclusion that having the disaggregation into one-way markets permits the econometrician to
duplicate her sample size (and then having higher statistical significance), without loosing
information or deteriorating characteristics of the whole market. In this sense, having data for
two one-way markets is the same of having data for one market for twice the period, with the
advantage that the second (extended) period does not contain other exogenous shocks than the
ones that already exist in the first one.
Another very important peculiarity of the data set is the existence of a gap due to the fire in
SDU in Feb/1998, as mentioned before; this forced the airport to be closed for six months and
airlines to cease virtually all operations from or to it. In the majority of the cases (air shuttle
included) the alternative was to transfer flights to the international airport, GIG, what made
CGH-GIG data potential candidate for data filling purposes.
Actually, the only reason of not taking into account GIG-CGH data would be related to the
bias that could have been caused by the competition with the existing airlines in the airport-
pair. This matter is not relevant, however, because GIG-CGH was relatively unexplored
before the fire at SDU (the only airline that operated in that market in Jan/1998 was VSP with
less than 300 pax, a very small figure if compared to more than 85,000 total pax in February).
22 What is meant by "normal circumstances" here is the number of people travelling only one-way - and then not returning - in one given month not being significant. Of course it is important to be aware of the fact that a small amount of trips always begin in one month and end in one of the immediate ones, but this phenomenon tends to happen in a reduced scale in such a market where passengers usually have very short stay at destination.

17
Another very important caution about the data is related to codeshare agreements: actually,
when two airlines form an alliance on the route, the econometrician cannot observe how many
passengers carried by one were really this firm's buyers, simply because here data only
permits observing traffic by airline and not revenue tickets by airline (as in most US studies of
airline industry).
5.2 Empirical Specification, Estimation and Results
5.2.1 Model Specification and Estimation
I assume log-linear versions of (1), (3) and (8). Empirical counterparts of those equations are
presented below, and details of variables can be found in Appendix 5.
Demand function is estimated as follows:
dh
N
hh
kijkiki
eDFIRMCDSHVPTBCDSHVPTB
SHSEATSGDPPPNPAS
++−+
++++−=
∑+
=
7
765
43210
21
lnlnlnlnln
βββ
βββββ
(9)
Where NPASki is the number of passengers carried by firm k of group i; Pki is the price of
firm ki; Pj is the average price of firms in group j; GDP is an index of real gross domestic
product; SHSEATSki is firm ki's share of total seats available; CDSHVPTB controls for the
effects of the codeshare VSP-TBA (Aug/98-May/99), on, respectively, their own and rivals'
demand. Finally, the DFIRMh variables are used to control for inter-firm heterogeneity in the
fixed-effects procedure; ed are disturbances.
In order to estimate total costs as in equation (2), I employed a less general concept of
"sistemwide level". By taking the advantage of the fact that DAC provided sistemwide data
disaggregated by aircraft type, the procedure followed here was to only consider the flight
equipment specific for the air shuttle market (B737-300, B737-500, A-319 and FK-100). This
permitted avoiding bias due to different firm-specific fleet composition in the whole-system
18
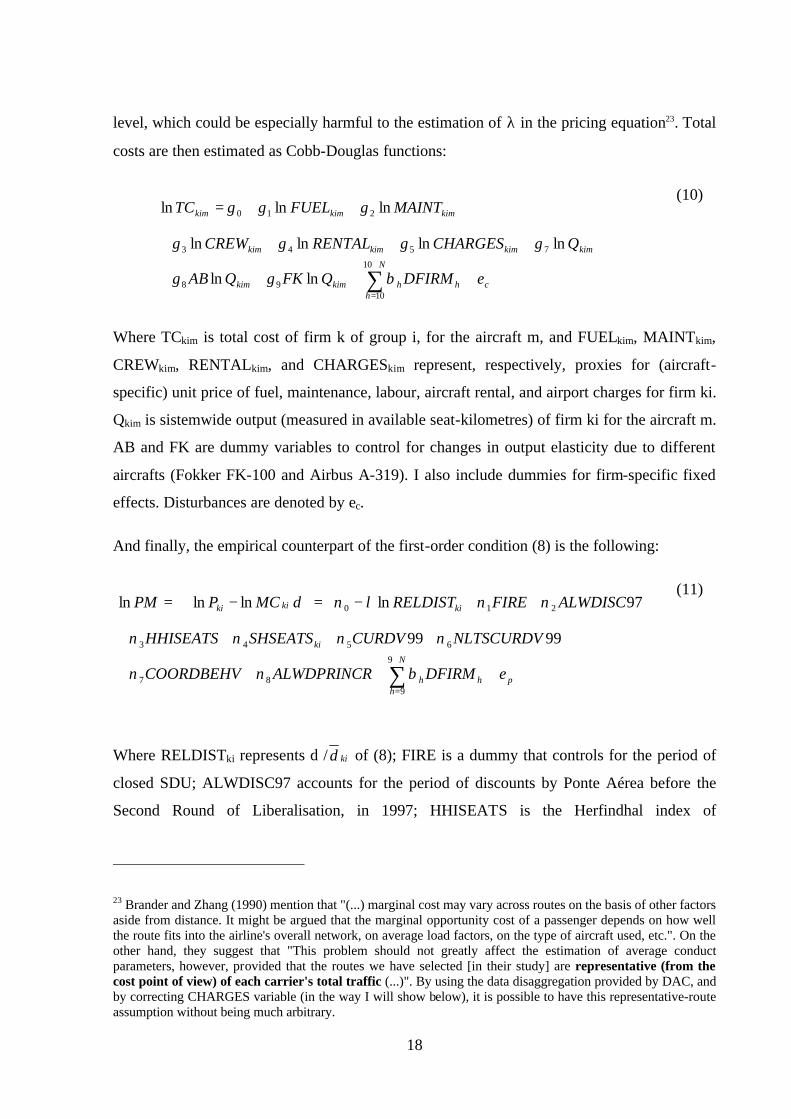
level, which could be especially harmful to the estimation of λ in the pricing equation23. Total
costs are then estimated as Cobb-Douglas functions:
ch
N
hhkimkim
kimkimkimkim
kimkimkim
eDFIRMQFKQAB
QCHARGESRENTALCREW
MAINTFUELTC
++++
+++++
+++=
∑+
=
10
1098
7543
210
lnln
lnlnlnln
lnlnln
βγγ
γγγγ
γγγ
(10)
Where TCkim is total cost of firm k of group i, for the aircraft m, and FUELkim, MAINTkim,
CREWkim, RENTALkim, and CHARGESkim represent, respectively, proxies for (aircraft-
specific) unit price of fuel, maintenance, labour, aircraft rental, and airport charges for firm ki.
Qkim is sistemwide output (measured in available seat-kilometres) of firm ki for the aircraft m.
AB and FK are dummy variables to control for changes in output elasticity due to different
aircrafts (Fokker FK-100 and Airbus A-319). I also include dummies for firm-specific fixed
effects. Disturbances are denoted by ec.
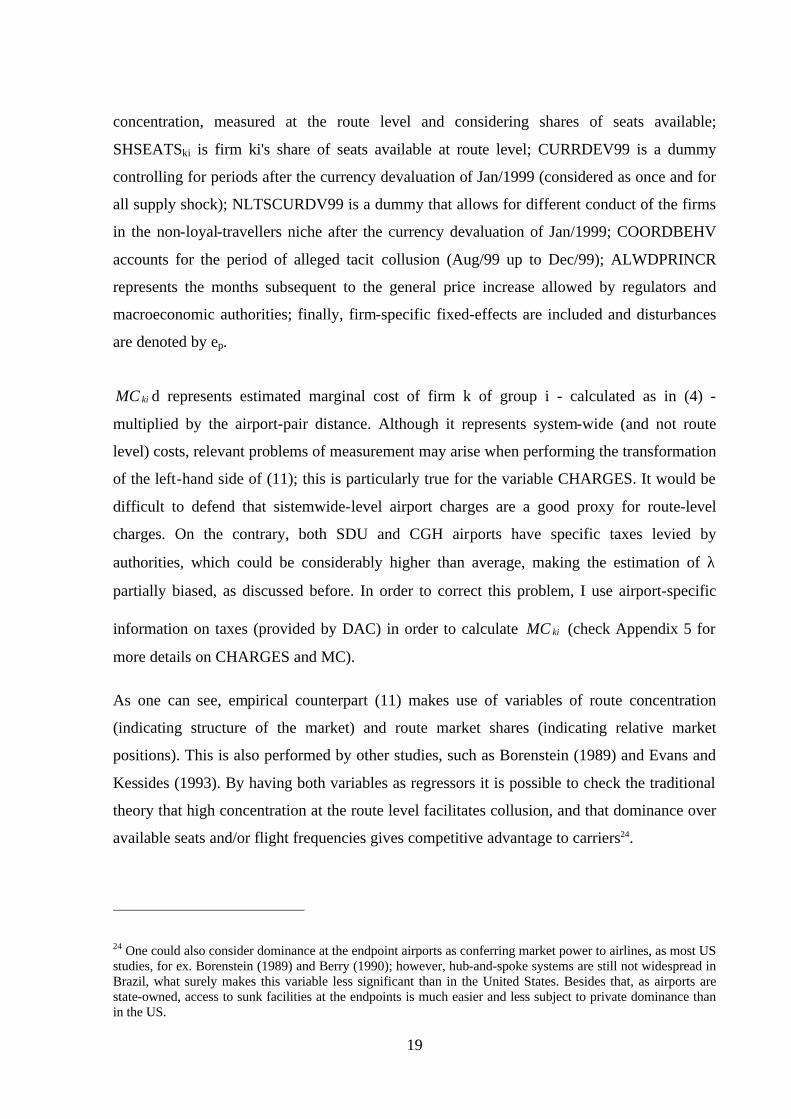
And finally, the empirical counterpart of the first-order condition (8) is the following:
ph
N
hh
ki
kikiki
eDFIRMALWDPRINCRCOORDBEHV
NLTSCURDVCURDVSHSEATSHHISEATS
ALWDISCFIRERELDISTdMCPPM
++++
+++++
+++−=
−=
∑+
=
∧
9
987
6543
210
9999
97lnlnlnln
βνν
νννν
ννλν
(11)
Where RELDISTki represents d / kid of (8); FIRE is a dummy that controls for the period of
closed SDU; ALWDISC97 accounts for the period of discounts by Ponte Aérea before the
Second Round of Liberalisation, in 1997; HHISEATS is the Herfindhal index of
23 Brander and Zhang (1990) mention that "(...) marginal cost may vary across routes on the basis of other factors aside from distance. It might be argued that the marginal opportunity cost of a passenger depends on how well the route fits into the airline's overall network, on average load factors, on the type of aircraft used, etc.". On the other hand, they suggest that "This problem should not greatly affect the estimation of average conduct parameters, however, provided that the routes we have selected [in their study] are representative (from the cost point of view) of each carrier's total traffic (...)". By using the data disaggregation provided by DAC, and by correcting CHARGES variable (in the way I will show below), it is possible to have this representative-route assumption without being much arbitrary.
19
concentration, measured at the route level and considering shares of seats available;
SHSEATSki is firm ki's share of seats available at route level; CURRDEV99 is a dummy
controlling for periods after the currency devaluation of Jan/1999 (considered as once and for
all supply shock); NLTSCURDV99 is a dummy that allows for different conduct of the firms
in the non-loyal-travellers niche after the currency devaluation of Jan/1999; COORDBEHV
accounts for the period of alleged tacit collusion (Aug/99 up to Dec/99); ALWDPRINCR
represents the months subsequent to the general price increase allowed by regulators and
macroeconomic authorities; finally, firm-specific fixed-effects are included and disturbances
are denoted by ep.
kiMC∧
d represents estimated marginal cost of firm k of group i - calculated as in (4) -
multiplied by the airport-pair distance. Although it represents system-wide (and not route
level) costs, relevant problems of measurement may arise when performing the transformation
of the left-hand side of (11); this is particularly true for the variable CHARGES. It would be
difficult to defend that sistemwide-level airport charges are a good proxy for route-level
charges. On the contrary, both SDU and CGH airports have specific taxes levied by
authorities, which could be considerably higher than average, making the estimation of λ
partially biased, as discussed before. In order to correct this problem, I use airport-specific
information on taxes (provided by DAC) in order to calculate kiMC∧
(check Appendix 5 for
more details on CHARGES and MC).
As one can see, empirical counterpart (11) makes use of variables of route concentration
(indicating structure of the market) and route market shares (indicating relative market
positions). This is also performed by other studies, such as Borenstein (1989) and Evans and
Kessides (1993). By having both variables as regressors it is possible to check the traditional
theory that high concentration at the route level facilitates collusion, and that dominance over
available seats and/or flight frequencies gives competitive advantage to carriers24.
24 One could also consider dominance at the endpoint airports as conferring market power to airlines, as most US studies, for ex. Borenstein (1989) and Berry (1990); however, hub-and-spoke systems are still not widespread in Brazil, what surely makes this variable less significant than in the United States. Besides that, as airports are state-owned, access to sunk facilities at the endpoints is much easier and less subject to private dominance than in the US.

20
Estimation of competition models like (9), (10) and (11) is usually performed in the literature
by taking into account of the potential endogeneity of some of the variables in the system of
simultaneous equations. This is especially true for NPASki, Pki, Pj, SHSEATSki, and
HHISEATS25. OLS estimation in this case would generate biased estimates, and therefore
two-stage least squares were performed, using as instruments some of the exogenous demand
and cost variables (GDP, the dummies of code share agreements, and the input prices).
Actually, one may argue that labour’s prices could be endogenous in such a market with
highly skilled workforce; however, this effect is certainly not observed in the short-run,
especially in a period of financial difficulties of all airlines, with recurrent cuts in the
workforce and control of labour expenditures. Another instrument, used when estimating
demand, was USDEFF, an index of the price of real US dollar.
Instruments for available seat market share and concentration were the same measures for
another market: the airport-pair PLU-BSB, linking the city centre of Belo Horizonte to
Brasília. Shocks in demand would be correlated with these variables only in case it would be
possible to transfer flights from one airport-pair to the other in the short-run. This practice is
more difficult to be performed, however, since airlines may lose conceded slots in case they
are left vacant.
One much more reasonable (and allowed) alternative would be to exchange slots in one of the
endpoints CGH/SDU from or to other origin/destination, in response to a given shock. This
certainly provides greater flexibility to the airline, besides not letting it lose valuable flight
time positions. By considering this tactics as more usual in the market, it is possible then to
defend that instruments can be generated by using an airport-pair that does not have any of the
endpoints in common with CGH-SDU - in this case, PLU-BSB was chosen. Measures of
SHSHARE and RHHI on this route were then considered reasonable instruments.
Estimation results for (8), (9) and (10), are presented in Appendix 5. Results are discussed in
the next section.
25 Check, for example, Evans, Froeb and Werden (1993).
21
5.2.1 Discussion of Results
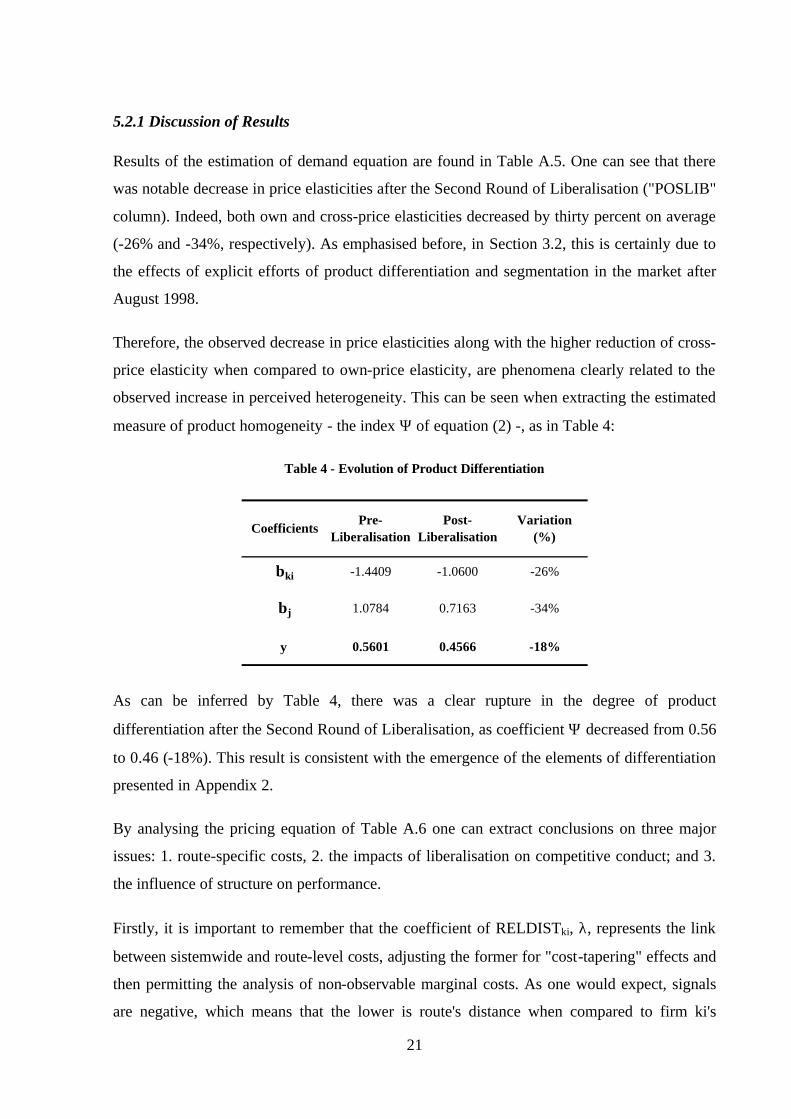
Results of the estimation of demand equation are found in Table A.5. One can see that there
was notable decrease in price elasticities after the Second Round of Liberalisation ("POSLIB"
column). Indeed, both own and cross-price elasticities decreased by thirty percent on average
(-26% and -34%, respectively). As emphasised before, in Section 3.2, this is certainly due to
the effects of explicit efforts of product differentiation and segmentation in the market after
August 1998.
Therefore, the observed decrease in price elasticities along with the higher reduction of cross-
price elasticity when compared to own-price elasticity, are phenomena clearly related to the
observed increase in perceived heterogeneity. This can be seen when extracting the estimated
measure of product homogeneity - the index Ψ of equation (2) -, as in Table 4:
Table 4 - Evolution of Product Differentiation
βki -1.4409 -1.0600 -26%
βj 1.0784 0.7163 -34%
ψ 0.5601 0.4566 -18%
CoefficientsPre-
LiberalisationPost-
LiberalisationVariation
(%)
As can be inferred by Table 4, there was a clear rupture in the degree of product
differentiation after the Second Round of Liberalisation, as coefficient Ψ decreased from 0.56
to 0.46 (-18%). This result is consistent with the emergence of the elements of differentiation
presented in Appendix 2.
By analysing the pricing equation of Table A.6 one can extract conclusions on three major
issues: 1. route-specific costs, 2. the impacts of liberalisation on competitive conduct; and 3.
the influence of structure on performance.
Firstly, it is important to remember that the coefficient of RELDISTki, λ, represents the link
between sistemwide and route-level costs, adjusting the former for "cost-tapering" effects and
then permitting the analysis of non-observable marginal costs. As one would expect, signals
are negative, which means that the lower is route's distance when compared to firm ki's

22
average stage length, the higher are route-specific costs when compared to systemwide level.
Also, the expected value of λ is close to -0.5, defined as the base-case of Brander and Zhang
(1990). Moreover, one can analyse that for the air shuttle market, in which the average
RELDIST is 0.60, λ being approximately equal to -0.7 means that for each marginal unit
spent in sistemwide costs there is 1.43 marginal units spent in that specific market.
Secondly, it is possible to analyse the path of conduct in the market, and to make explicit its
main determinants found in the sample. Figure 1 below presents the estimated average
conduct parameter, identified as shown in Appendix 5.
Figure 1 - Evolution of estimated average conduct parameter (θ̂ )
0.600
0.800
1.000
1.200
J-97 A-97 J-97 O-97 J-98 A-98 J-98 O-98 J-99 A-99 J-99 O-99 J-00 A-00 J-00 O-00 J-01
2nd Round ofLiberalisation
(Dec-97/Jan-98)
SDU reopened(Aug-98)
Alleged Collusion(Aug-99)
Fire at SDU(Feb-98)
US$ devaluation(Jan-99)
Allowed Price Increase(Aug-00)
The main point of Figure 1 is related to the impact of the Second Round of Liberalisation on
conduct: it is quite clear by inspecting the path of θ̂ , that the "average degree of
competitiveness" (Bresnahan, 1989) has increased. Actually, the conduct parameter plunged
from an average of 1.105 to 0.773 (-30.1%). Results visibly indicate a slightly below-Nash-
equilibrium conduct, what could be related to some (or a mix of) the following factors:
interference of macroeconomic authorities not allowing free upward price movements after
the US dollar shock; the fact that TBA became bankrupt and VSP had severe financial
difficulties after 1999, and forced prices downwards; the entry of a budget airline in the GIG-
23
CGH market, from 2001 on; and the pressure caused by the close monitoring of competition
policy authorities.
Three additional results deserve special comments: the effects of FIRE, CURDEV99 and
COORDBEHV on conduct. The dummy FIRE represented the periods in which SDU was
closed (Feb/98 - Jul/98) and when operations were fully transferred to GIG; the observed
decrease in conduct during this period is related to the price war of March, triggered by the
expansion of TAM's flight frequencies and deep discounts concession, in a more than
proportional when compared to the effects of HHISEATS - what is captured by the estimated
pricing equation (Table A.6).
With respect to CURDV99 and NLTSCURDV99, one can observe how the supply shock
caused by the devaluation of the US dollar had different impacts for each group of firms: on
the one hand, it permitted an increase in conduct for the firms serving the loyal traveller
segment (marginal effects of 0.227), but, on the other hand, it caused a decrease in conduct
for firms in the non loyal traveller segment (effects of +0.227-0.450). This was consistent
with observed pricing policies on the route, and may be due to the aforementioned financial
difficulties of the latter group, meaning it needed making cash in the short run, despite of
lower-than-optimum margins.
Last but not least, the positive marginal effects of the dummy variable COORDBEHV means
that firms did increased conduct from August 1999, as was alleged by antitrust authorities on
the occasion26. However, as Figure 1 permits observing, this price coordination was actually
ineffective, as it did not represented collusive behaviour in terms of a conduct parameter
much higher than Nash equilibrium benchmark. On the contrary, θ̂ was still lower than
optimum, and, what is more, it decreased again in January 2000, when VSP cheated the tacit
agreement and conceded 50% of discounts.
A final comment must be made regarding the estimated coefficients of HHISEATS and
SHSEATS in Table A.6. One can observe that, although the former is significant for both
periods in the sample, that is, pre and post-liberalisation, the later was found significant only
26 Actually, all airlines in the market increased prices by the same percentage (10%), on the same day (04-08-1999).

24
during the liberalised regime. Besides that, marginal effects of SHSEATS became slightly
higher. This may represent that route dominance became much more relevant after
liberalisation, especially with the explicit accomplishments of product differentiation in the
market.
CONCLUSIONS
The present paper developed a competition model to investigate the impacts of the Second
Round of Liberalisation of airline industry in Brazil, on one of its most relevant markets: the
air shuttle service linking Rio de Janeiro to São Paulo. Structural parameters were then
estimated in a fixed-effects procedure, in order to permit inference over the degree of product
differentiation and the pattern of firms' conduct before and after the measures undertaken by
authorities in the late nineties.
The main conclusions were a relevant increase in both the degree of competitiveness (the
estimated conduct parameter decreased by 30%) and the degree of product differentiation in
the market (the estimated index of homogeneity decreased by 18%), due to regulatory reform.
The main explanation for the market changes caused by liberalisation were: on the one hand,
the explicit efforts of demand segmentation and incentives for brand loyalty (especially by
means of frequent flyer programmes) by a group of airlines, which started offering better
service levels in conjunction with higher dominance on the route; and, on the other hand,
other airlines started specialising in providing service to a less loyal segment, with basic
service and deep discounts.
Besides that, a supply shock represented by the US dollar devaluation, in January 1999,
greatly affected the extent to which conduct deviated from Nash behaviour. As firms were not
able to promptly adjust prices upwards on account of the interference of macroeconomic
authorities, conduct remained slightly lower than what should be expected in equilibrium.
Other factors keeping the conduct parameter depressed were the monitoring of antitrust
authorities and the observed financial difficulties and state of bankruptcy of some of the
airlines.
Moreover, estimation permitted analysing the effects of concentration levels and route
dominance on the pricing of airlines in the shuttle market; both variables indeed proved to

25
permit significant competitive advantage, especially in the new liberalised environment, a fact
consistent with traditional wisdom in the industry.
REFERENCES
Airfinance Journal, Boardroom battle could force Brazilian government's hand, 2000. Coggeshall.
Aviation Daily, Spanish Court Rules Against Iberia In 'Airlift' Name Battle, 2002. Washington, The McGraw-Hill Companies.
Berry, S. "Airport Presence as Product Differentiation." American Economic Review, Vol. 80, No. 2, 1990, pp. 394-399.
Berry, S., Carnall, M. and Spiller, P. "Airline Hubs: Costs, Markups and the Implications of Customer Heterogeneity." NBER Working Paper Series, Vol. 5561, 1996, pp. 41.
Borenstein, S. "Hubs and High Fares: Dominance and Market Power in the U.S. Airline Industry" Rand Journal of Economics, Vol. 20, No. 3, 1989, pp. 344-365.
Borenstein, S. and Netz, J. "Why Do All the Flights Leat at 8 am?: Competition and Departure-Time Differentiation in Airline Markets" International Journal of Industrial Organization, Vol. 17, 1999, pp. 611-640.
Brander, J. and Zhang, A. "Market Conduct in the Airline Industry: An Empirical Investigation" Rand Journal of Economics, Vol. 21, 1990, pp. 567-583.
Bresnahan, T. "Empirical Studies of Industries with Market Power." Handbook of Industrial Organization.edited by R. Schmalensee and R. Willig, Vol. II, Elsevier Science Publishers, Amsterdam, 1989, pp. 1012-1057.
Captain, P. and Sickles, R."Competition and Market Power in the European Airline Industry: 1976-1990" Managerial and Decision Economics, Vol. 18, 1997, pp. 209-225.
Dixit, A. "A Model of Duopoly Suggesting a Theory of Entry Barriers" Bell Journal of Economics, Vol. 10, No. 1, 1979, pp. 20-32.
Douglas, G. and Miller, J.Economic Regulation of Domestic Air Transport: Theory and Policy, Brookings Institute, Washington, DC.

26
Evans, W., Froeb, L. and Werden, G. "Endogeneity in the Concentration-Price Relationship: Causes, Consequences, and Cures" Journal of Industrial Economics, Vol. 41, No. 4, 1993, pp. 431-438.
Evans, W. and Kessides, I. "Localized Market Power in the U.S. Airline Industry" Review of Economics and Statistics, Vol. 75, No. 1, pp. 66-75.
Genesove, D. and Mullin, W. "Testing Static Oligopoly Models: Conduct and Cost in the Sugar Industry, 1890-1914" Rand Journal of Economics, Vol. 29, No. 2, 1998, pp. 355-377.
Marín, P. "Competition in European Aviation: Pricing Policy and Market Structure." Journal of Industrial Economics, Vol. 43, No. 2, 1995, pp. 141-159.
O'Connor, W. An Introduction to Airline Economics, 5th Edition ed.Praeger, Westport, Connecticut, 1995.
Oliveira, A. "Simulating revenue management in an airline market with demand segmentation and strategic interaction" Journal of Revenue and Pricing Management, Vol. 1, No. 3, 2003.
Oum, T., Zhang, A. and Zhang, Y. "Inter-Firm Rivalry and Firm-Specific Price Elasticities in Deregulated Airline Markets" Transport Economics - Selected Readings, edited by T. e. a. Oum Harwood Academic Publishers, Amsterdam, 1997, pp. 691.
Porter, R. "A Study of Cartel Stability: The Joint Executive Committee, 1880-1886." Bell Journal of Economics, Vol. 14, 1984, pp. 301-314.
Singh, N. and Vives, X. "Price and Quantity Competition in a Differentiated Duopoly" Rand Journal of Economics, Vol. 15, No. 4, 1984, pp. 546-554.
Slade, M. Assessing Market Power in UK Brewing. Department of Economics Discussion Paper: 01/04, University of British Columbia. 2001.
Teodorovic, D. "Multicriteria Ranking of Air Shuttle Alternatives" Transportation Research - B, Vol. 19B, No. 1, 1985, pp. 63-72.

27
APPENDIX 1 - EVOLUTION OF REGULATION IN THE BRAZILIAN AIRLINE INDUSTRY
Phase Regulation with Industrial Policy
Regulation with Active Stabilisation Policy
Controls
Liberalisation with Inactive Stabilisation
Policy Controls
Liberalisation with Stabilisation Policy
Constraint
Current Status of Liberalisation
Period 1973-1986 1986-1992 1992-1997 1998-2001 2001-
Economic Policy in the Sector
Regulation Present Present Partially removed: First Round of Liberalisation
Partially Removed: Second Round of Liberalisation
Removed: Quasi-deregulation
Macroeconomic Interference
Active Very Active Possible, but not Active Active Absent
Fares Reference Price Imposed by DAC Imposed by DAC Not imposed by DAC Not imposed by DAC Absent
Price Increase Control Present Present, with stabilisation policy targeting
Present, but associated with industry's inflation
Present: mix of stabilisation policy targeting and industry's inflation
Absent
Registration Absent Absent ex-ante: 48 hours of advance, and automatically approved if no answer by DAC
ex-ante: only in case of more than 65% discount
ex-post: only for monitoring purposes
Fare Bounds Absent Absent until 1988; [-25%,+10%] in 1989; [-50%,+32%], from 1990 on (only for discount fares);
[-50%, +32%] (both full and discount fares)
Unbounded Unbounded

28
Phase Regulation with Industrial Policy
Regulation with Active Stabilisation Policy
Controls
Liberalisation with Inactive Stabilisation
Policy Controls
Liberalisation with Stabilisation Policy
Constraint
Current Status of Liberalisation
Period 1973-1986 1986-1992 1992-1997 1998-2001 2001-
Entry New Firms Not allowed: "4 nationals & 5 regionals" policy
Not allowed: "4 nationals & 5 regionals" policy
Allowed, both in national and regional levels
Allowed Allowed
Regional Monopolies Present Present Absent, with the exception of SAP routes
Absent Absent
Competition Authority's attitude Avoid Avoid Stimulate Stimulate but with antitrust controls
Stimulate but with antitrust controls
Among Nationals and Regionals
Absent Absent Allowed, with the exception of SAP routes
Allowed Allowed
Capacity and Infrastructure
Frequency, Airways and Aircrafts
Controlled based on load factors; requests needed ex-ante authorisations to CLA
Controlled based on load factors; requests needed ex-ante authorisations to CLA
Ex-ante authorisation (CLA); no economic control; priority to existing airlines
Ex-ante authorisation (COMCLAR); no economic control; simpler and faster process
Ex-ante authorisation (COMCLAR); no economic control; simpler and faster process
Airports and Terminals State-owned enterprise: INFRAERO
State-owned enterprise: INFRAERO
State-owned enterprise: INFRAERO; equal access to airport facilities and terminals.
State-owned enterprise: INFRAERO; equal access to airport facilities and terminals.
State-owned enterprise: INFRAERO; some congested airports causing problems of access and entry.
29
APPENDIX 2 - PRODUCT DIFFERENTIATION ELEMENTS EMERGED AFTER LIBERALISATION
VRG TAM VSP TBA
Mileage Program
"SMILES" "FIDELIDADE" - -
Alliances and Mileage
Exchange
Star Alliance: Air Canada, Lufthansa, SAS, Thai e United
AirlinesAmerican Airlines - -
Counting Scheme
Miles Trips - -
Mileage Scheme
2000 miles = 20 trips = 1 free travel to any city served in
Latin America
10 trips = 1 free trip to any city served in Brazil
- -
Elite Status4 Categories; Discounts in taxis and car rentals at CGH; express
check-in
3 Categories; 12 parking hours free at CGH; express check-in
- -
Permitted Permitted Not Permitted Not Permitted
ExclusiveOne Exclusive / One Shared
(TAM/VSP/TBA)Shared (TAM/VSP/TBA) Shared (TAM/VSP/TBA)
42 48 149 146
27 29 90 113
135 134 111 113
B737-300; B737-500; ERJ145 FK-100 B737-300 B737-300
Non Loyal Traveller Segment
Frequent Flyer Advantages
Preassigned seats at Check-in
Average Distance Between Flights (mins)
Aircraft Type
Departure Lounge
Loyal Traveller SegmentCharacteristics
Average Distance Between Flights in Peak Hours (mins)
Average Price (Aug/98-Jul/99)

30
APPENDIX 3 - SUMMARY OF THE SURVEY OF OLIVEIRA (2003)
In this survey, 402 passengers were interviewed at CGH airport and were asked about their
preferences when choosing an airline in the market.
Table A . 1 - Main Results of the Survey - Disaggregated by Airline
TOTAL % VRG TAM TBA VSP
Yes 251 62% 80% 70% 33% 36%
No 151 38% 20% 30% 67% 64%
TOTAL % VRG TAM TBA VSP
Myself 144 36% 24% 34% 57% 48%
The institution I represent 256 64% 76% 66% 43% 52%
TOTAL % VRG TAM TBA VSP
Very Much / Much Influence 316 79% 87% 87% 64% 62%
No / Medium Influence 84 21% 13% 13% 36% 38%
TOTAL % VRG TAM TBA VSP
Very Much / Much Influence 228 57% 41% 51% 83% 79%
No / Medium Influence 174 44% 59% 49% 17% 21%
TOTAL % VRG TAM TBA VSP
Very Much / Much Influence 306 77% 80% 76% 70% 75%
No / Medium Influence 95 24% 20% 24% 30% 25%
How does AVAILABLE FLIGHT TIME influence your choice ?
Do you always travel with this airline (LOYAL)?
Who payed for the flight ticket?
How do AIRLINE CHARACTERISTICS influence your choice ?
How does PRICE influence your choice ?

31
Table A . 2 - Segments' Different Views about Price
Loyal Traveller 122 49% 127 51% 249 100%
Non-Loyal Traveller 104 69% 47 31% 151 100%
TOTAL 226 57% 174 44% 400 100%
SegmentVery High or
HighVery Low or
LowOverall
Influence of Price

32
APPENDIX 4 - PRICING EQUATION AND CONDUCT PARAMETER
Consider the following first-order conditions for profit maximisation:
( ) 0=∂∂
∂∂
−∂∂
+→−ki
ki
ki
ki
ki
kikikikikikip p
qqtc
pq
pqtcqpMaxki
(12)
Then, let us isolate the price term in the left-hand side of the equation:
kikii
kiki
kiki
ki
kikiki mcq
Dp
pq
mcpq
pq =+→∂∂
=∂∂
+1
1,
ki
kii p
qD
∂∂
=1 (13)
Suppose now there is a parameter θ that measures the extent of deviation from Nash
behaviour (which would be represented by equating marginal revenue to marginal cost):
kikikikii
kiki mcpmrmcqD
p =→=+1
1θ
(14)
Considering then the following developments:
( )( ) ki
ii
kikiki
kiki
kikiki
i
kikiki pmcp
qpqp
qD
mcpηθθ
+=→−=1
(15)
One can reach the following relation:
1
1−
−=
ii
kikiki mcp
ηθ
(16)
By considering equation (5) of Section 4:
1
1−−
−
=
ii
ki
kikiki d
ddMCp
ηθ
λ
(17)
Then it is possible to make the following development. Firstly:

33
−−
−=
ii
ki
kikiki d
ddMCp
ηθ
λ 1lnlnln (18)
And then:
−
−−=−
kiii
kikiki d
ddMCp ln1lnlnln λ
ηθ
(19)
By renaming some terms, one can obtain:
kikiki RELDISTPM lnln λϕ −= (20)
Equation (20) is precisely the pricing equation considered for estimation purposes, as one can
observe in Table A.6 (Appendix 5).
By regressing (20), it is possible to calculate the estimated conduct parameter for each group
of firms:
( ) ( )( )kiiikiii
kiki ϕηθ
ηθ
ϕ ˆexp1ˆˆ1ˆexp −−=→−=− (21)

34
APPENDIX 5 - LIST OF VARIABLES IN THE EMPIRICAL MODEL27
Code Name Main Source
Details
ALWDISC97 Period of 1997 Summer Discounts
Midia Dummy variable that accounts for the periods of Summer discounts permitted by the pooling agreement on the route.
ALWDPRINCR Allowed Price Increase
DAC Represents the months subsequent to the general price increase allowed by regulators and macroeconomic authorities (from Aug/2000).
ASZ Average Aircraft Size
DAC Calculated using the size (number of seats) of each aircraft model in the market, and kilometres flown as weights. DAC provides the information of aircraft types and kilometres flown disaggregated by flight.
CDSHVPTB 1,2 Codeshare agreement
Media Dummies for the periods of codeshare agreements VSP-TBA. CDSHVPTB1 accounts for effects in VSP-TBA's demand and CDSHVPTB2, in TAM-VRG's demand.
CHARGES Unit Cost of Airport Charges
DAC A proxy for unit price of airport changes. Calculated by dividing expenditures on airport charges by LANDINGS. Check CREW for information on disaggregation, deflation process, and currency. Specific CGH and SDU charges were calculated by using method provided by DAC, which considers the class of the airport, the maximum takeoff weight of aircrafts, the usual number of hours of parking during a night, and the usual waiting gate time.
COORDBEHV Effect of Coordinated Behaviour
Media Dummy variable to accounts for the period of alleged tacit collusion (Aug/99 up to Dec/99) by all firms in the market. They all increased their price on the same day (4-Aug) by the same amount (10%).
27 Every variable is available in a monthly basis (period: Jan/1997 - Oct/2001) and is disaggregated by airline. When calculations were performed, they were made by the author, and not by the main source. Note that some variables may not be found in the empirical model, but instead, were used to calculate other variables.

35
Code Name Main Source
Details
CREW Unit Cost of Labour
DAC A proxy for unit price of crew. Calculated by dividing expenditures on crew wages by NCREW. Information on expenditures disaggregated by airline is provided by DAC for the sistemwide, domestic, level. Expenditures are deflated by a general wholesale price index (FGV's IPA) in order to represent current figures of Jan/2002. Figures are in Brazilian currency (R$, reais).
CURDV99 Currency Devaluation
Central Bank
Dummy variable controlling for periods after the currency devaluation, from Jan/1999 on. Variables are built considering shocks as once and for all. Check NLTSCURDV99.
F Flight Frequency
DAC Number of flight frequencies on an average day. Calculated by using the expression: F = kilometres flown / (stage length x number of days in a given month). Kilometres flown disaggregated by airline is available by DAC, and the stage length is 365 km.
FIRE Effects of Closed SDU
Media Dummy that controls the period of closed SDU(Feb/1998 - Jul/1998), due to a fire.
FUEL Unit Cost of Fuel
DAC A proxy for unit price of fuel. Calculated by dividing expenditures on fuel by FUELCONS. Check CREW for information on disaggregation, deflation process, and currency.
FUELCONS Consumption of Fuel
DAC Thousands of litres of aviation fuel (mainly aviation kerosene). Information disaggregated by airline. Not route-specific, but sistemwide (domestic) level.
GDP Gross Domestic Product Index
IPEA DATA
Index of real gross domestic product (Jan/1997 = 100)
HOURS Number of Flight Hours
DAC Information disaggregated by airline. Not route-specific, but sistemwide (domestic) level.
LANDINGS Number of Landings
DAC Information disaggregated by airline. Not route-specific, but sistemwide (domestic) level.

36
Code Name Main Source
Details
MAINT Unit Cost of Maintenance
DAC A proxy for unit price of maintenance. Calculated by dividing expenditures on maintenance by HOURS. Check CREW for information on disaggregation, deflation process, and currency.
MC Marginal Cost Marginal cost - calculated as in function (4) of Section 4, and measured in the sistemwide (aircraft-specific) level. Check Q for the unit of measurement.
NTLSCURDV99 Currency Devaluation
Central Bank
Dummy variable controlling for different conduct of VSP-TBA in the periods after the currency devaluation, from Jan/1999 on. Check CURDV99.
NCREW Number of Crew Staff
DAC Headcount of flight crew (deck and attendants), published yearly by DAC. Monthly data was built by arithmetic extrapolation.
NPAS Number of passengers carried
DAC The airline revenue traffic excluding people travelling for free for any reason.
P Average market price
ATPCO Real prices, that is, prices deflated by a general consumer price index (IBGE's IPCA) in order to represent current figures of Jan/2002. Prices are expressed in Brazilian currency (reais, R$). Average market price, P, is calculated by weighting airline's average prices by their respective NPAS and is measured at the route level.
Pki Price of firm k in group i
ATPCO Airline-specific average real prices, calculated by weighting the peak price (full fare) and off-peak prices (simple average of available discounts) by respective NPAS. DAC provides the information of NPAS disaggregated by airline / flight / day / departure time. For information on peak hours, check PDOM. For information on the deflation process, check P.
Pj Price of rival airlines (group j)
ATPCO Group-specific average real prices, calculated by the prices of each airline in group j by respective NPAS. Check P and Pki for more information.
PDOM Peak Dominance
DAC Peak dominance index, that is, the share of flight frequencies during peak time (all flights except those with departure from 10am to 4.30pm on weekdays, those on Saturdays, and those with departure from 7pm on Sundays). DAC provides the information of flight number / weekdays / departure times, which made possible the segregation into two periods.

37
Code Name Main Source
Details
Q Sistemwide Output
DAC Number of available seat-kilometres (ASK) in the domestic segment of the Brazilian airline industry. DAC provides information disaggregated by airline.
RELDIST Distance over Average Stage Length
DAC RELDIST represents d / kid of equation (7), that is, an index of airport-pair distance divided by firm's average stage length. Average stage length data is provided by DAC.
RENTAL Unit Cost of Aircraft Rental and Insurance
DAC A proxy for unit price of flight equipment rental and insurance. Calculated by dividing expenditures on rental plus insurance by HOURS. Check CREW for information on disaggregation, deflation process, and currency.
RHHI Industry Concentration
DAC Herfindhal index of concentration. Calculated by using airlines' RPK market shares.
SEATS Number of Available seats
DAC Available seats carried are calculated multiplying ASZ by F by the number of days in a given month.
SHSEATS Share of Available Seats
DAC Firm's share of available number of seats (check SEATS).
USDEFF Real US Dollar
IPEA DATA
Index of real currency exchange US dollar / real (Jan 1997 = 100).

38
APPENDIX 6 - LIST OF ABBREVIATIONS AND CODES
Code Description
BSB Brasília Airport
CGH Congonhas Airport, São Paulo (the closest to the city centre)
DAC Department of Civil Aviation of Brazil
GIGGaleão /A.C.Jobim Airport, Rio de Janeiro (outskirts, international gateway)
PLUPampulha Airport, Belo Horizonte (the closest to the city centre)
RJ Rio de Janeiro (city)
SDUSantos Dumont Airport, Rio de Janeiro (the closest to the city centre)
SP São Paulo (city)
TAM Tam (airline)
TBA Transbrasil (airline)
VPTB Revenue pooling/codeshare agreement between VSP and TBA
VRG Varig (airline)
VSP Vasp (airline)
CRZ Cruzeiro (airline)

39
APPENDIX 7 - DESCRIPTIVE STATISTICS BY GROUP OF AIRLINES
Table A . 3 Statistics - Pre Liberalisation
MEAN STDEV MIN MAX MEAN STDEV MIN MAX
NPASki (thousands) 23.1 9.1 10.2 42.5 9.0 5.0 4.0 29.0
SHSEATSki (%) 24.4 2.2 17.6 27.1 14.3 7.4 6.9 37.7
Pki 174.7 23.1 135.9 199.5 179.1 27.8 124.5 199.5
Pj 179.5 27.1 127.6 199.5 174.9 23.2 135.9 199.5
RELDISTki 0.636 0.209 0.405 0.981 0.621 0.041 0.523 0.700
TCki (millions) 64.0 23.4 32.0 105.8 69.7 13.5 48.2 108.8
FUELki (cents) 45.5 6.3 29.6 56.8 54.5 13.8 40.5 91.2
MAINTki 1,260.8 326.1 477.0 1,836.3 620.4 198.3 373.0 1,456.5
CREWki (thousands) 17.7 5.0 8.0 26.6 13.7 2.8 9.5 22.5
RENTALki 1,061.6 596.6 265.7 2,222.9 1,356.6 191.1 1,012.4 1,792.1
CHARGESki 1,073.5 258.0 528.8 1,670.7 507.9 50.0 344.9 608.0
Qki (millions) 618.4 217.3 381.1 1050.7 313.6 61.3 213.8 450.9
Ponte Aérea RegionalsVariable

40
Table A . 4 - Statistics - Post Liberalisation
MEAN STDEV MIN MAX MEAN STDEV MIN MAX
NPASki (thousands) 50.9 18.6 20.3 91.2 18.1 7.4 5.7 31.6
SHSEATSki (%) 38.9 7.7 22.2 56.9 14.5 3.9 7.7 25.6
Pki 173.4 38.6 123.6 267.7 109.3 15.5 76.2 135.9
Pj 107.3 13.5 76.9 135.9 163.3 34.2 130.8 243.8
RELDISTki 0.574 0.142 0.418 0.914 0.592 0.110 0.472 0.868
TCki (millions) 107.2 17.9 79.4 156.1 47.5 10.0 28.9 93.5
FUELki (cents) 51.2 16.3 26.0 88.9 53.9 15.9 33.3 94.6
MAINTki 1,188.8 214.5 761.6 1,635.9 1,356.5 517.9 423.2 2,692.3
CREWki (thousands) 13.4 3.3 9.2 24.4 17.2 5.3 2.6 38.1
RENTALki 1,302.6 416.3 438.6 2,394.7 1,118.6 705.9 200.9 2,817.1
CHARGESki 568.6 103.9 351.5 800.1 773.9 205.7 490.3 1,668.0
Qki (millions) 727.1 257.8 358.9 1091.8 506.8 87.0 245.6 629.0
FF Segment NFF SegmentVariable

41
APPENDIX 8 - RESULTS OF ESTIMATION
Table A . 5 - Demand Equation
Constant -10.565 *** -16.205 ***
ln P ki -1.441 ** -1.060 ***
ln P j 1.078 * 0.716 ***
ln GDP 2.715 *** 3.464 ***
ln SHSEAT ki 0.901 *** 1.582 ***
CDSHVPTP1 0.344 ***
CDSHVPTB2 -0.336 ***
TAM -0.920 *** -0.699 ***
TBA -0.924 *** -0.670 ***
VSP -0.505 *** -0.758 ***
RSL -0.696 ***
ADJ. R-SQUARED OBS
(0.135)
(0.114)
ln NPASki
PRELIB POSLIB
(0.300)
(0.040)
(0.128)
(0.044)
0.827276
(0.085)
(0.033) (0.227)
(0.033) (0.192)
0.946190
Dependent Variable
(2.438)(1.722)
(0.638)
(0.624)
(0.299)
(0.231)
(0.168)
(0.502)
Standard errors in parentheses.
* Significant at 10% level, ** Significant at 5% level, *** Significant at 1% level.

42
Table A . 6 - Pricing Equation
Constant 0.391 1.853 *** -0.798 *
ln RELDIST ki -0.721 *** -0.671 *** -0.717 ***
ln ALWDISC97 -0.195 *** -0.170 ***
ln HHISEATS 0.607 ** 0.557 *** 0.549 **
ln SHSEATS ki 0.463 0.674 ***
FIRE -0.144 *** -0.132 ***
CURDV99 0.227 ***
NLTSCURDV99 -0.450 ***
COORDBEHV 0.197 ***
ALWDPRINCR 0.107 ***
TAM -0.150 * -0.258 *** 0.147 ***
TBA 0.775 ***
VSP 0.972 ***
RSL 0.407 -0.072 *** 0.549 **
ADJ. R-SQUARED OBS
Dependent Variable
(0.035) (0.025)
(0.042)(0.048)
(0.099) (0.458)
(0.054)
(0.267)
(0.042)
(0.243) (0.193)
(0.061)
(0.064)
190 2760.545
(0.033)
1900.701 0.788
(0.143)
(0.375) (0.020) (0.267)
(0.087) (0.020) (0.046)
(0.127)
ln PMki
(0.360) (0.104)
PRELIB with
SHSEATS
PRELIB without
SHSEATSPOSLIB
(0.031) (0.088)
(1.112)
Standard errors in parentheses.
* Significant at 10% level, ** Significant at 5% level, *** Significant at 1% level.

43
Table A . 7 - Total Costs Equation
Constant -6.074 ***
ln FUEL ki 0.246 ***
ln MAINT ki 0.175 ***
ln CREW ki 0.068 ***
ln RENTAL ki 0.200 ***
ln CHARGES ki 0.058 ***
ln Q ki 0.787 ***
TBA -0.295 ***
VSP -0.386 ***
TAM -0.693 ***
DAB*ln Q ki 0.093 ***
DFK*ln Q ki 0.130 ***
ADJ. R-SQUARED OBS
Dependent Variable
ln TCki
(0.212)
(0.021)
(0.011)
(0.013)
(0.012)
(0.014)
(0.019)
(0.015)
(0.009)
0.994300
(0.098)
(0.017)
(0.023)
Standard errors in parentheses.
* Significant at 10% level, ** Significant at 5% level, *** Significant at 1% level.