warehousing and mining
TRANSCRIPT

1
2
Warehousing and Mining
Massive RFID Data Sets
Jiawei HanDepartment of Computer Science
University of Illinois at Urbana-Champaignwww.cs.uiuc.edu/~hanj

3
Themes on Advance Data Mining Applications
Mining sequences and graphs for biological data analysisWeb mining and social network analysisStream and sensor data miningMining moving objects and spatiotemporal dataPattern reduction, understanding, and usageMulti-relational and multi-database miningSoftware bug analysis and miningHigh dimensional data analysisWarehousing and mining RFID data

4
Data Mining: Concepts and Techniques, 2ed. 2006
Mining stream, time-series, and sequence data
Mining data streams
Mining time-series data
Mining sequence patterns in transactional databases
Mining sequence patterns in biological data
Graph mining, social network analysis, and multi-relational data mining
Graph mining
Social network analysis
Multi-relational data mining
Mining Object, Spatial, Multimedia, Text and Web data
Mining object dataSpatial and spatiotemporal data miningMultimedia data miningText miningWeb mining

5
Outline
Introduction to RFID Technology
Why RFID Data Warehousing and Mining?
RFID Data Warehousing
Mining RFID Data Sets
Conclusions

6
What Is RFID?
Radio Frequency Identification (RFID)Technology that allows a sensor (reader) to read, from a distance, and without line of sight, a unique electronic product code (EPC) associated with a tag
ReaderTag

7
RFID System
Source: www.belgravium.com

8
ApplicationsSupply Chain Management: real-time inventory trackingRetail: Active shelves monitor product availabilityAccess control: toll collection, credit cards, building accessAirline luggage management: (British airways) Implemented to reduce lost/misplaced luggage (20 million bags a year)Medical: Implant patients with a tag that contains their medical historyPet identification: Implant RFID tag with pet owner information (www.pet-id.net)

9
Outline
Introduction to RFID Technology
Why RFID Data Warehousing and Mining?
RFID Data Warehousing
Mining RFID Data Sets
Conclusions
10
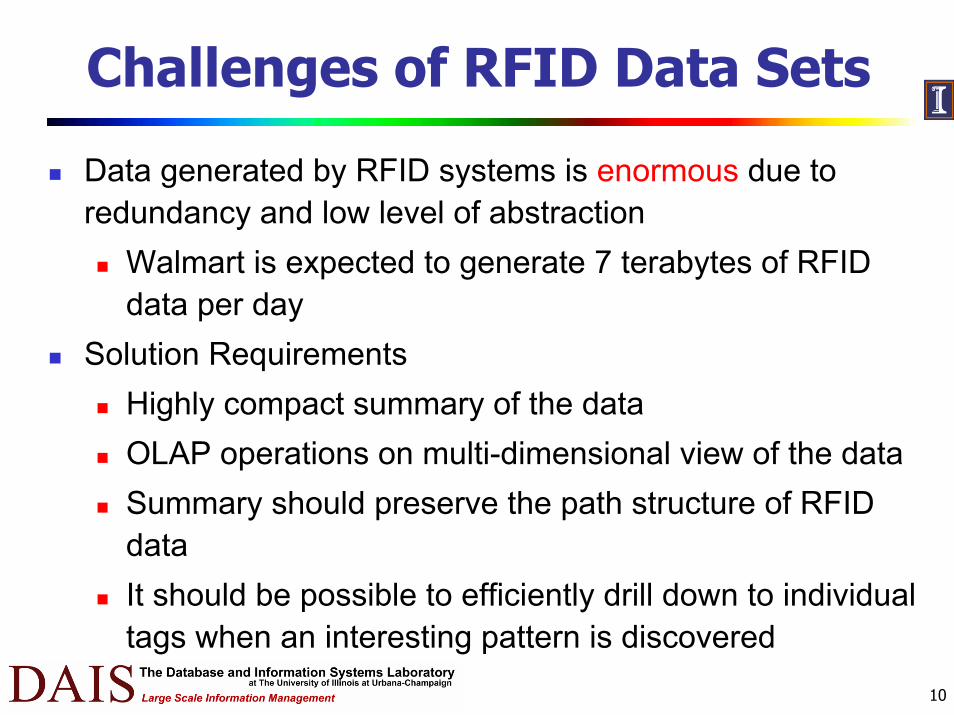
Challenges of RFID Data Sets
Data generated by RFID systems is enormous due to redundancy and low level of abstraction
Walmart is expected to generate 7 terabytes of RFID data per day
Solution RequirementsHighly compact summary of the dataOLAP operations on multi-dimensional view of the dataSummary should preserve the path structure of RFID dataIt should be possible to efficiently drill down to individual tags when an interesting pattern is discovered
11
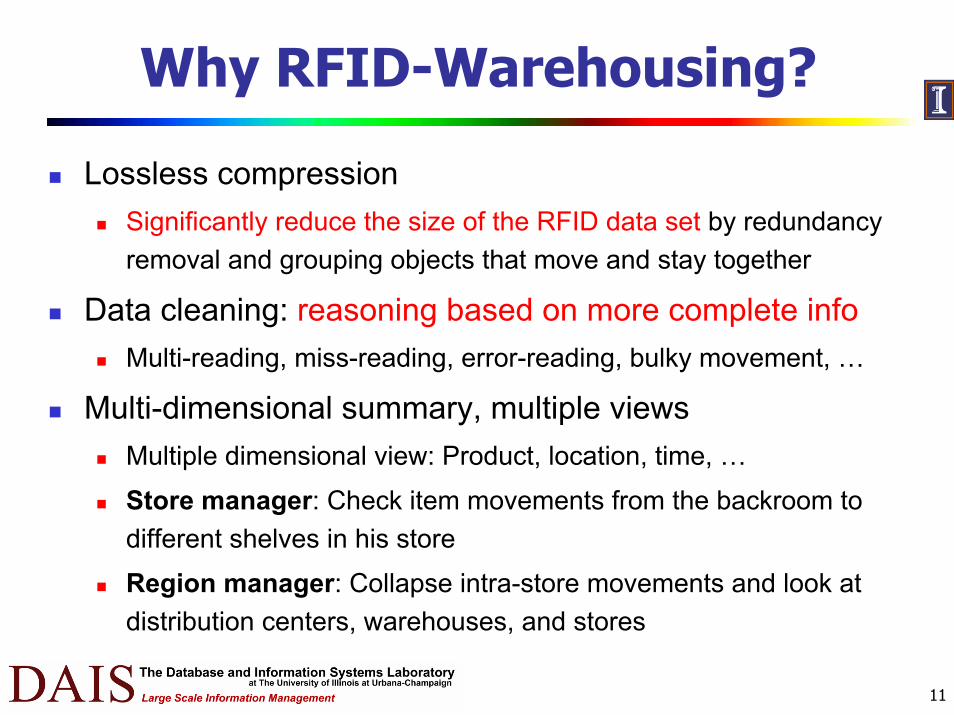
Why RFID-Warehousing?
Lossless compressionSignificantly reduce the size of the RFID data set by redundancy removal and grouping objects that move and stay together
Data cleaning: reasoning based on more complete infoMulti-reading, miss-reading, error-reading, bulky movement, …
Multi-dimensional summary, multiple viewsMultiple dimensional view: Product, location, time, …
Store manager: Check item movements from the backroom to different shelves in his store
Region manager: Collapse intra-store movements and look at distribution centers, warehouses, and stores

12
RFID OLAP, Path Query and Mining
Warehousing supports FRID query processingSupport for OLAP: roll-up, drill-down, slice, and dicePath query: New to RFID-Warehouse, about the structure of paths
What products that go through quality control have shorter paths?What locations are common to the paths of a set of defective auto-parts?Identify containers at a port that have deviated from their historic paths
FRID data miningFind trends, outliers, frequent, sequential, flow patterns, …

13
RFID Warehouse Architecture

14
Example: A Supply Chain Store
A retailer with 3,000 stores, selling 10,000 items a day per store
Each item moves 10 times on average before being sold
Movement recorded as (EPC, location, second)
Data volume: 300 million tuples per day (after redundancy removal)
OLAP query: Costly to answer if scanning 1 billion tuples
Avg time for outwear items to move from warehouse to checkout
counter in March 2006?
Mining query:
Is there a correlation between the time spent at transportation and the
milk in store S rotten?

15
Outline
Introduction to RFID Technology
Why RFID Data Warehousing and Mining?
RFID Data Warehousing
Mining RFID Data Sets
Conclusions

16
Cleaning of RFID Data Records
Raw Data(EPC, location, time)Duplicate records due to multiple readings of a product at the same location(r1,l1,t1) (r1,l1,t2) ... (r1,l1,t10)
Cleansed Data: Minimal information to store, raw data will be then removed
(EPC, Location, time_in, time_out)(r1,l1,t1,t10)
Warehousing can help fill-up missing records and correct wrongly-registered information

17
Data Compression with GIDBulky object movements
Objects often move and stay togetherIf 1000 packs of soda stay together at the distribution center, register a single record
(GID, distribution center, time_in, time_out)
GID is a generalized identifier that represents the 1000 packs that stayed together at the distribution center
Factory
Dist. Center 1
Dist. Center2
…
10 pallets(1000 cases)
store 1
store 2
…
20 cases(1000 packs)
shelf 1
shelf 2
…
10 packs(12 sodas)

18
Compression by Data/Path Generalization
Data generalization
Analysis usually takes place at a much higher level of abstraction than the one present in raw RFID data
Aggregate object movements into fewer records
If interested in time at the day level, merge records at the minute level into records at the hour level
Path generalization: Merge and/or collapse path segments
Uninteresting path segments can be ignored or merged
Multiple item movements within the same store may be uninteresting to a regional manager and thus merged

19
Path-Independent Data Generalization
Category level Clothing
Type level InterestingLevel
Outerwear Shoes
SKU level …Shirt Jacket
Cleansed RFIDDatabase Level
…EPC level Shirt 1 Shirt n

20
Path Generalization
Transportation backroom
Store View:
shelf checkout
backroom shelf checkoutdist. center truck
Transportation View:
dist. center truck Store

21
Why Not Using Traditional Data Cube?
Fact Table: (EPC, location, time_in, time_out)Aggregate: A measure at a single location
e.g., what is the average time that milk stays in the refrigerator in Illinois stores?
What is missing?Measures computed on items that travel through a series of locationse.g., what is the average time that milk stays at the refrigerator in Champaign when coming from farm A, and Warehouse B?
Traditional cubes miss the path structure of the data
22
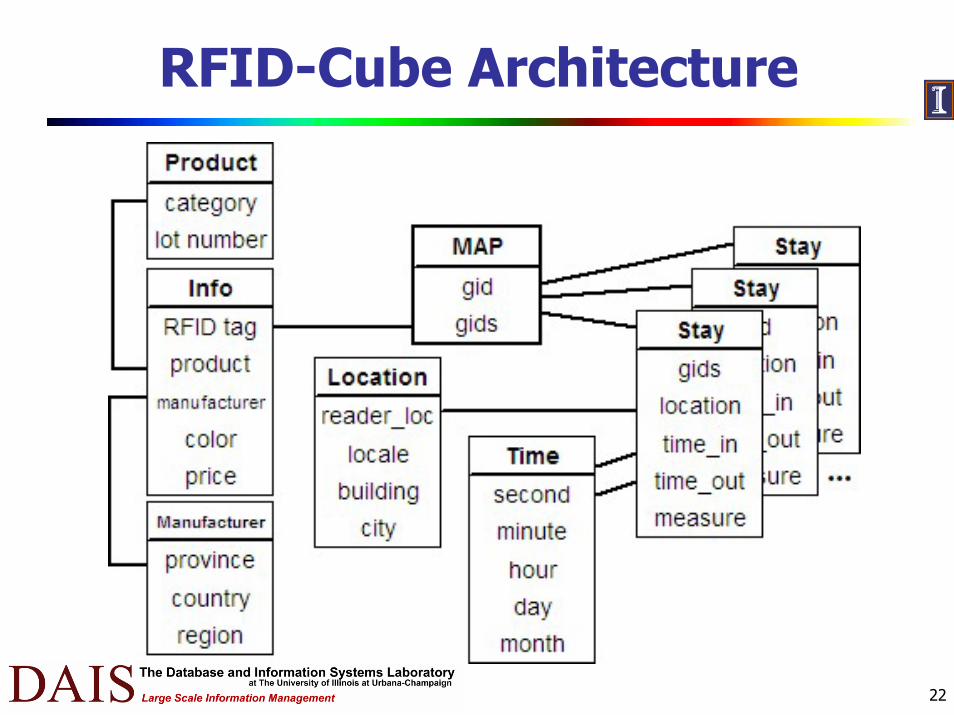
RFID-Cube Architecture

23
Three RFID-Cuboids
Stay Table: (GIDs, location, time_in, time_out: measures)Records information on items that stay together at a given locationIf using record transitions: difficult to answer queries, lots of intersections needed
Map Table: (GID, <GID1,..,GIDn>)Links together stages that belong to the same path. Provides additional: compression and query processing efficiencyHigh level GID points to lower level GIDsIf saving complete EPC Lists: high costs of IO to retrieve long lists, costly query processing
Information Table: (EPC list, attribute 1,...,attribute n)Records path-independent attributes of the items, e.g., color, manufacturer, price

24
RFID-Cuboid ExampleStay Table
t20t15l4r3
t_outt_inlocepc
10t1l1r3
t30t20l3r2
t10t1l1r2
t30t20l2r1
t10t1l1r1
Cleansed RFID Databaset_outt_inlocepcs
t10t1l1r1,r2,r3
gids
r3g1.2
r1,r2g1.1
g1.1,g1.2g1
gidsgid
Map Tablegidsgid
t30t20l2r1,r2
g1
g1.1
t20t15l4r3g1.2

25
Benefits of the Stay Table (I)
Query: What is the average time that items stayat location l ?
Transition GroupingRetrieve all transitions with destination = l Retrieve all transitions with origin = lIntersect results and compute average timeIO Cost: n + m retrievals
Prefix TreeRetrieve n records
Stay GroupingRetrieve stay record with location = lIO Cost: 1
l1 ln+1
l2
ln
ln+2l
… …
ln+m

26
Benefits of the Stay Table (II)Query: How many boxes of milk traveled through the locations l1, l7, l13?
With Cleansed Database With Stay Table
(r1,l1,t1,t2)(r1,l2,t3,t4)
…(r2,l1,t1,t2)(r2,l2,t3,t4)
…(rk,l1,t1,t2)(rk,l2,t3,t4)
Strategy:Retrieve the gids
for l1, l7, l13Intersect the gids
IO Cost:One IO per GID in
locations l1, l7, and l13Observation:
Retrieve records at the group level and thus greatly reduce IO costs
Strategy:Retrieve itemsets for
locations l1, l7, l13Intersect itemsets
IO Cost:One IO per item in
locations l1 or l7 or l13Observation:
Very costly, we retrieverecords at the individual item level
(g1,l1,t1,t2)(g2,l2,t3,t4)
…

27
Benefits of the Map Table#EPCs #GIDs
nl1 1
l2 l3n 3l4
l5 l6 l7 l8 l9 n 6l10
10+n{rm+1,..,rn}{r1,..,ri} {ri+1,..,rj} {rj+1,..,rk} 3n{rk+1,..,rl} {rl+1,..,rm}

28
Path-Dependent Naming of GIDs
l1
0.1Assign to each GID a unique
identifier that encodes the path
traversed by the items that it
points to
Path-dependent name: Makes
it easy to detect if locations
form a path
0.0
l2
l3
0.1.0 0.1.10.0.0
l4
0.0.0.0 0.1.0.1
l5 l6

29
RFID-Cuboid Construction Algorithm
1. Build a prefix tree for the paths in the cleansed database
2. For each node, record a separate measure for each group of items that share the same leaf and information record
3. Assign GIDs to each node:GID = parent GID + unique id
4. Each node generates a stay record for each distinct measure
5. If multiple nodes share the same location, time, and measure, generate a single record with multiple GIDs

30
RFID-Cube Construction
Path Tree Stay Table
l1 l2
l3 l4
l5 l6
0.1.0.1t35,t50: 1
0.1.0.0t40,t60: 2
0.0t1,t10: 3
0.1t1,t8: 3
0.0.0t20,t30: 3
0.1.0t20,t30: 3
0.1.1t10,t20: 2
0.0.0.0t40,t60: 3
l3
l5
{r1,r2,r3} {r5,r6} {r7}
{r8,r9}
3t10t1l10.0
3t30t20l30.0.0
3t60t40l50.0.0.0 5t60t40l50.0.0.00.1.0.0
6t30t20l30.0.00.1.0
countt_outt_inlocGIDs
3t8t1l20.1
1t50t35l60.1.0.1
2t20t10l40.1.1

31
RFID-Cube Properties
The RFID-cuboids can be constructed on a single scan of the cleansed RFID database
The RFID-cuboid provides lossless compression at its level of abstraction
The size of the RFID-cuboid is much smaller than the cleansed data
In our experiments we get 80% lossless compression at the level of abstraction of the raw data

32
Query Processing
Traditional OLAP operationsRoll up, drill down, slice, and diceCan be implemented efficiently with traditional optimization techniques, e.g., what is the average time spent by milk at the shelf
Path selection (New operation)Compute an aggregate measure on the tags that travel through a set of locations and that match a selection criteria on path independent dimensions
σstay.location = 'shelf', info.product = 'milk' (stay gid info)
q à < σc info,(σc1stage1, ..., σck
stagek) >

33
Query Processing (II)
Query: What is the average time spent from l3 to l5?GIDs for l3 <0.0.0>, <0.1.0>GIDs for l5 <0.0.0.0>, <0.1.0.1>Prefix pairs: p1: (<0.0.0>,<0.0.0.0>)
p2: (<0.1.0>,<0.1.0.1>)Retrieve stay records for each pair (including intermediate steps) and compute measureSavings: No EPC list intersection, remember that each EPC list may contain millions of different tags, and retrieving them is a significant IO cost

34
From RFID-Cuboids to RFID-Warehouse
Materialize the lowest RFID-cuboid at the minimum level of abstraction interested to a user
Materialize frequently requested RFID-cuboids
Materialization is done from the smallest materialized RFID-Cuboid that is at a lower level of abstraction

35
Performance Study: RFID-Cube Compression
050
100150200250300350
0.1 0.5 1 5 10
Input Stay Records (millions)
Size
(MB
ytes
)
clean
nomap
map
05
101520253035
a b c d e
Path Bulkiness
Size
(MB
ytes
)clean
nomapmap
Compression vs. Cleansed data size
P=1000, B=(500,150,40,8,1), k = 5
Lossless compression, cuboid is at the same level of abstraction as cleansed RFID database
Compression vs. Data Bulkiness
P=1000, N = 1,000,000, k= 5
Map gives significant benefits for bulky data
For data where items move individually we are better off using tag lists

36
Outline
Introduction to RFID Technology
Why RFID Data Warehousing and Mining?
RFID Data Warehousing
Mining RFID Data Sets
Conclusions

37
Mining RFID Data Sets
Data cleaning by data mining
RFID data flow analysis
Path-based classification and cluster analysis
Frequent pattern and sequential pattern analysis
Outlier analysis in RFID data
Linking RFID data mining with others

38
Data Cleaning by Data MiningRFID data warehouse substantially compresses the RFID data and facilitate efficient and systematic data analysis
Data cleaning is essential to RFID applicationsMultiple reading, miss reading, errors in reading, etc.
How RFID warehouse facilitates data cleaning?Multiple reading: automatically resolved when being compressed
Miss reading: gaps can be stitched by simple look-around
Error reading: use future positions to resolve discrepancies
Data mining helps data cleaningMultiple cleaning methods can be cross-validated
Cost-sensitive method selection by data mining

39
Mining RFID Data Sets
Data cleaning by data mining
RFID data flow analysis
Path-based classification and cluster analysis
Frequent pattern and sequential pattern analysis
Outlier analysis in RFID data
Linking RFID data mining with others

40
RFID Data: A Path Database View
From raw tuples to cleansed data: A Stay Table view
Raw tuples: <EPC, location, time>Stay view: (EPC, Location, time_in, time_out)
A data flow view of RFID data: path forms:<EPC, (l1,t1),(l2,t2),...,(lk,tk)>, where li: location i, ti: duration i
The paths can be augmented with path-independent dimensions to get a Path Databaseof the form:
<Product, Manufacturer, Price, Color, (l1,t1), ..., (lk,tk)>Path independent dimensions Path stages

41
Data Flow Analysis: FlowGraph
Tree shaped workflow that summarizes the flow patterns for an item or group of items
Nodes: LocationsEdges: Transitions
Each node is annotated with:Distribution of durations at the nodeDistribution of transition probabilitiesExceptions to duration and transition probabilities
Minimum support: frequent exceptionsMinimum deviation: Exceptions that have significant deviations in probability

42
FlowGraph: An Example
Path Database: FlowGraph:
Duration Dist:1: 0.22: 0.8
Duration Exceptions:Given (f,5) 1: 0.0
2: 1.0Given (f,10) 1: 0.5
2: 0.5
(f,5)(d,2)(t,3)(s,10)(d,5)adidastennis8
(f,5)(d,2)(t,2)(s,20)adidastennis7
(f,10)(t,1)(w,5)nikejacket6
(f,10)(t,2)(s,5)(c,1)nikejacket5
(f,10)(t,1)(s,5)(c,0)nikeshirt4
(f,10)(d,1)(t,2)(s,5)(c,0)nikesandals3
(f,5)(d,2)(t,1)(s,10)(c,0)niketennis2
(f,10)(d,2)(t,1)(s,5)(c,0)niketennis1
pathbrandproductid checkout
factory
truck
0.65
0.350.67
warehouse0.33
checkout1.00
shelf 0.60
dist. center0.20
0.20
truckdist. center 1.00 1.00
shelf
Duration Dist:1: 0.672: 0.33
Transition Dist:shelf: 0.67warehouse: 0.33
Transition Exceptions:Given (t,1) shelf: 0.5
warehouse: 0.5Given (t,2) shelf: 1.0
warehouse: 0.0

43
FlowGraph: Alternative Design
Duration-Dependent NodesThe FlowGraph incorporates duration information in a compact manner
If we create nodes for each distinct path stage the size of the workflow may explode
Duration-dependent nodes may add little information when transition and duration probabilities are largely path independent
(t,1) (s,5) (c,0)
(f,10)
(d,2) (t,2)
(t,3)
(d,1)
(t,2)
(t,1)
(s,5)
(f,5) (s,20)
(s,10) (d,5)
(d,2) (t,1) (s,5) (c,0)
(t,2) (s,5) (c,0)
(s,5) (c,1)
(s,5) (c,0)
44
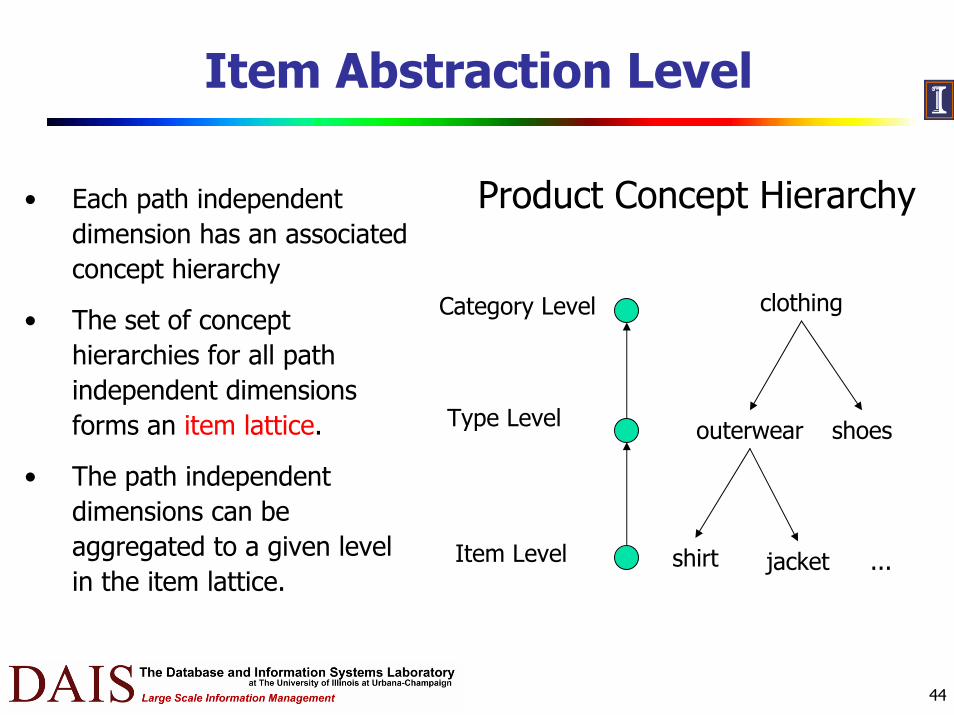
Item Abstraction Level
Product Concept Hierarchy• Each path independent dimension has an associated concept hierarchy
• The set of concept hierarchies for all path independent dimensions forms an item lattice.
• The path independent dimensions can be aggregated to a given level in the item lattice.
clothingCategory Level
Type Level outerwear shoes
Item Level shirt jacket ...

45
Path Abstraction Level
Location Lattice *
The levels for the location and time dimensions of each path stage form a path lattice.
Path stages can be aggregated to a given level in the path lattice.
Transportation Factory Store
Dist. Center Truck Warehouse Backroom Shelf Checkout
Transportation backroom
Store Manager:
Path Views shelf checkout
dist. centerEach path can be aggregated at different abstraction levels
We collapse path stages along the location concept hierarchy
truck backroom shelf checkout
Transportation Manager:dist. center truck Store

46
FlowCube
Data cube computed on the path database, by grouping entries that share the same values on the path independent dimensions.Each cuboid has an associated level in the item and path abstraction lattices.
Level in the item lattice. (product category, country, price)
Level in the path lattice.(<transportation, factory, backroom, shelf, checkout>, hour)
The measure for each cell in the FlowCube is a FlowGraph computed on the paths aggregated in the cell.

47
FlowCube Example
Cuboid for <product type, brand>
3
2
1
cell id
4,5,6nikeouterwear
7,8adidasshoes
1,2,3nikeshoes
path idsbrandproduct
FlowGraph for cell 3shelf checkout
1.0
truck
warehouse
0.67
0.33
factory1.0

48
Mining RFID Data Sets
Data cleaning by data mining
RFID data flow analysis
Path-based classification and cluster analysis
Frequent pattern and sequential pattern analysis
Outlier analysis in RFID data
Linking RFID data mining with others

49
Path- or Segment- Based Classification and Cluster Analysis
Classification: Given class label (e.g., broken goods vs.
quality ones), construct path-related predictive modelsTake paths or segments as motifs and perform motif-based high-
dimensional information for classification
Clustering: Group similar paths or similar stay or
movements of RFIDs, with other multi-dimensional
information into clustersIt is essential to define new distance measure and constraints for
effective clustering

50
Mining RFID Data Sets
Data cleaning by data mining
RFID data flow analysis
Path-based classification and cluster analysis
Frequent pattern and sequential pattern analysis
Outlier analysis in RFID data
Linking RFID data mining with others

51
Frequent Pattern and Sequential Pattern Analysis
Frequent patterns and sequential patterns can be related to movement segments and paths
Taking movement segments and paths base units, one can perform multi-dimensional frequent pattern and sequential pattern analysis
Correlation analysis can be formed in a similar wayCorrelation components can be stay, move segments, and paths
Efficient and scalable algorithms can be developed using the warehouse modeling

52
Mining RFID Data Sets
Data cleaning by data mining
RFID data flow analysis
Path-based classification and cluster analysis
Frequent pattern and sequential pattern analysis
Outlier analysis in RFID data
Linking RFID data mining with others

53
Outlier Analysis in RFID Data
Outlier detection in RFID data is by-product of other mining tasks
Data flow analysis: Detect those not in the major flows
Classification: Treat outliers and normal data as different class labels
Cluster analysis: Identify those that are deviate substantially in major clusters
Trend analysis: Those not following the major trend
Frequent pattern and sequential pattern analysis: anomaly patterns

54
Mining RFID Data Sets
Data cleaning by data mining
RFID data flow analysis
Path-based classification and cluster analysis
Frequent pattern and sequential pattern analysis
Outlier analysis in RFID data
Linking RFID data mining with others

55
Linking RFID Mining with Others
RFID warehouse and cube model makes the data mining better organized and more efficientReal time RFID data mining will need further development of stream data mining methods
Stream cubing and high dimensional OLAP are two key method that will benefit RFID mining
RFID data mining is still a young, largely unexplored fieldRFID data mining has close links with sensor data mining, moving object data mining and stream data mining
Thus will benefit from rich studies in those fields

56
Outline
Introduction to RFID Technology
Why RFID Data Warehousing and Mining?
RFID Data Warehousing
Mining RFID Data Sets
Conclusions
57
ConclusionsA new RFID warehouse model
allows efficient and flexible analysis of RFID data in multidimensional spacepreserves the structure of the datacompresses data by exploiting bulky movements, concept hierarchies, and path collapsing
Mining RFID dataPowerful mining mechanisms can be constructed with RFID data warehouseFlowgraph analysis, data cleaning, classification, clustering, trend analysis, frequent/sequential pattern analysis, outlier analysis
Lots can be done in RFID data analysis

58
References
H. Gonzalez, J. Han and X. Li, “FlowCube: Constructuring RFID
FlowCubes for Multi-Dimensional Analysis of Commodity Flows”,
Proc. 2006 Int. Conf. Very Large Data Bases (VLDB'06), Seoul, Korea,
Sept. 2006.
H. Gonzalez, J. Han, X. Li and D. Klabjan, “Warehousing and Analysis
of Massive RFID Data Sets”, Proc. 2006 Int. Conf. Data Engineering
(ICDE'06), Atlanta, Georgia, April 2006.
J. Han, H. Gonzalez, X. Li and D. Klabjan, Warehousing and Mining
Massive RFID Data Sets, Proc. 2006 Int. Conf. Advanced Data Mining
Applications (ADMA'06), Xi’An, China, Aug. 2006.

59

60
Thanks and Questions