want to get serious about sustainability? use sasb’s ... · the business value of sustainability...
TRANSCRIPT

Smart decisions. Lasting value.™Audit / Tax / Advisory / Risk / Performance
June 2017
A white paper by Gregg E. Anderson, CIA, CRMA
Want to Get Serious About Sustainability? Use SASB’s Standards to Inform ERM

2 June 2017
Global consciousness about sustainability has increased dramatically in recent years. As awareness of the human impact on the health of the planet has grown, so has a widespread recognition of the threat posed by maintaining unsustainable behaviors and processes. The 2017 World Economic Forum’s Global Risks Report shows clear advancement of environmental and societal risks – such as extreme weather events, failure of climate-change mitigation and adaptation, and large-scale involuntary migration – as the predominant risks across the globe.1

3crowe.com
Why Sustainability Matters Many companies and investors have responded to the rising specter of the risks posed by unsustainable behaviors. Companies increasingly publish sustainability reports that detail the sustainability issues they face and how they intend to address those issues. Investors increasingly demand that companies behave in a sustainable manner.
Companies and investors have good reason to emphasize sustainability, even outside of a pure desire to be responsible global citizens. Studies show that companies rated highly on corporate social responsibility and environmental, social, and governance performance benefit from a lower cost of capital and demonstrate superior financial performance by accounting and market measures.2
However, for many companies, sustainability remains a side topic, not a driving force to be managed alongside other core strategic initiatives. Many executives struggle to address sustainability issues, which can be abstract and which tend to play out over a longer time period than other, more traditional risks. Even those at the forefront of thinking proactively about sustainability sometimes struggle to articulate the business value of their sustainability initiatives.
According to the World Business Council for Sustainable Development (WBCSD), 74 percent of sustainability practitioners agree that management generally views sustainability risks as “less likely and less impactful on a company’s performance” as compared with financial risk, and yet 89 percent believe that “failure to manage sustainability risk could lead to significant impacts on a company’s financial performance.”3
Correspondingly, few companies have taken steps to raise sustainability issues in the context of their broader enterprise risk management (ERM) approach. And, while some companies disclose sustainability issues in their SEC filings, they often do so in a boilerplate manner that is inadequate for investment decision-making. Disclosing sustainability issues in a decision-useful format is a process that requires not only thinking deeply about the risks and their implications for the business, but also raises the stakes for companies to be accountable about addressing those risks.
The Sustainability Accounting Standards Board (SASB) has created a set of provisional standards that identify the disclosure topics most likely to be material for 79 industries, as well as accounting metrics to account for performance. These standards can be used to guide an effort to bring sustainability risks into company ERM frameworks. Moreover, SASB’s standards have been designed to align with SEC filings and to comply with U.S. securities laws, and as such, provide a useful framework for companies seeking to disclose material sustainability information in their legal filings. With SASB standards, companies can focus on the sustainability issues most material to their industry.

Want to Get Serious About Sustainability? Use SASB’s Standards to Inform ERM
4 June 2017
Responding to a New Investor ImperativeInvesting based on sustainability – often referred to as ESG investing for its focus on environmental, social, and corporate governance factors – once was a peripheral concern. However, it has become a central component of investment analysis across asset classes.4 This development particularly is true for pension funds and other institutional investors with longer time horizons. According to a 2015 survey by the CFA Institute, 73 percent of portfolio managers and research analysts consider ESG issues in their investment decisions.5
Today, investors may exclude companies they think will not perform well, put more weight in companies they anticipate will proactively address sustainability challenges, or invest in companies that, despite current underperformance, can be influenced through proxy voting to change their practices. Investor support for resolutions requesting board oversight of sustainability issues, requests for board committees on human rights, and requests for experts and committees on environmental issues grew more than sixfold between 1990 and 2014.6 Disclosures of sustainability issues and legal disclosures generally are most aligned in sectors where investors have demanded sustainability information, which underscores how investors can drive change in corporate strategy.7
In addition to adapting investment strategies to incorporate sustainability topics, investors are pushing companies to report on their sustainability performance so that they can track the change in performance over time and compare different companies’ sustainable practices.
Despite growing investor interest and activism, research has shown disconnects between companies and investors in terms of confidence in the companies’ ability to quantify the business value of sustainability8 and how well ESG information is reported.9 These disconnects highlight the need for a standardized system and a set of reporting metrics.


6 June 2017
Want to Get Serious About Sustainability? Use SASB’s Standards to Inform ERM
Growing Prevalence of Sustainability ReportingPublishing a sustainability report is an increasingly common practice for large, public companies. For example, 82 percent of S&P 500 companies published a sustainability report in 2016.10
Companies are realizing that these sustainability reports not only provide information to their various stakeholders (customers, employees, and investors), but that they also can benefit the company more broadly because of the strategic thinking required to draft such a report. Indeed, a sustainability report can function as a map of future risk11 because it reveals the full array of sustainability risks that a company faces. These risks might include environmental, social, human rights, fair labor, and other issues. Ideally, the sustainability report prioritizes which risks should receive the greatest focus from the management team.
Sustainability reporting also sets out specific impact-reduction goals. For example, a goal could state that the company plans to reduce emissions by a certain percentage within 10 years. The report should also delineate how the company will respond to any regulatory changes that may affect its operations from a sustainability standpoint, and detail the policies that will lead to those changes.
While some companies disclose sustainability information in SEC filings, the disclosure is often inadequate. Recent research by SASB shows that 69 percent of companies are already addressing at least three-quarters of SASB disclosure topics for their industry, and 38 percent are already providing disclosure on all SASB disclosure topics. However, more than half of sustainability-related disclosures in SEC filings use boilerplate language, which is not decision-useful to investors.12

7crowe.com
What Is Enterprise Risk Management?Enterprise risk management helps companies specifically identify risks that are broader than any one staff member or department – and to develop appropriate solutions and responses to those risks. An ERM framework defines the approach an organization can take to understand the business environment, identify and assess risks, monitor whether the organization’s exposure in that area is increasing or decreasing, and communicate about the most significant risks – and the company’s approach to mitigating those risks – to its board of directors and other leaders. Companies with mature risk management practices have been found to achieve higher market valuations and outperform competitors financially.13
While ERM is commonly practiced, a 2017 survey by the American Institute of CPAs (AICPA) of members of its business and industry group who serve as chief financial officers (CFOs) or equivalent senior executives found that only 49 percent of public companies and 40 percent of financial services companies – and just 28 percent of all organizations surveyed – believe they have a “complete formal enterprise-wide risk management process in place.”14 This finding demonstrates a widespread need for more comprehensive ERM adoption, in which sustainability issues could play a role.

Want to Get Serious About Sustainability? Use SASB’s Standards to Inform ERM
8 June 2017

9crowe.com
A Path to Better Sustainability ReportingSustainability policies can benefit all stakeholders – across employees, shareholders, customers, and the communities in which companies are based – by promoting faster growth and reducing risk. A number of organizations have developed tools, standards, and frameworks to help companies identify and report on the material sustainability issues they face, including those created by the Global Reporting Initiative; the International Integrated Reporting Council; the United Nations’ sustainable development goals; B-Corporation certification; European Directive on Non-Financial Reporting; and SASB’s standards.
Each of these frameworks can help companies lay out their risks and can help all stakeholders compare different companies’ approaches to addressing the risks over time. However, SASB’s approach is unique in two prominent ways. First, SASB specifically develops its standards so that they are aligned with U.S. securities laws and can be used in mandatory SEC filings. Second, SASB’s standards are industry-specific. This is important because not all sustainability issues are material to all industries, and when they are material, they require industry-specific topics to account for performance. SASB uses a rigorous process to identify the subset of sustainability risks and opportunities that are most likely to have a material impact on companies in an industry. On average, each industry standard has five disclosure topics and 13 accounting metrics.
SASB standards can help U.S.-listed companies report more meaningfully on the sustainability issues that are important to investors. Using a methodical approach including evidence-based research, industry working groups, and public comment periods, SASB has issued standards for 79 industries. With this groundwork, companies can report on the most relevant sustainability topics consistently, enabling comparison over time to their own performance and to peer companies.
As mentioned, much of the disclosure language in legal filings is boilerplate in nature – in other words, vague, nonspecific, and of limited value to investors. SASB’s metrics-based approach facilitates the use of high-quality and detailed information, which can help investors make better decisions.15

Five Steps to ERM and Sustainability How can companies begin to incorporate sustainability into their ERM framework and reporting? First, companies should ensure that this issue has the attention and focus of the management team and the board of directors. From there, the following early steps are critical:
1. Facilitate a discussion between the financial reporting, sustainability reporting, strategy, and enterprise risk management specialists within your organization. The goals of this discussion should be to help all parties understand the importance of sustainability within the company, bring to light some of the specific sustainability issues that are to be addressed, and begin to clarify the roles different staff members will play in this initiative.
2. Understand the differences and nuances embedded in the language of sustainability. In particular, set out clear definitions of the following:
• Stakeholders. This group includes the various people who have a stake in the company, including employees, shareholders, customers, and community members.
• Materiality. This refers to issues that are material to companies in different sectors. SASB has created a materiality map that outlines the specific risks and opportunities by industry and sector.
• Opportunity and risk. Frequently, risk managers focus on the downside of risk. However, sustainability often presents new opportunities, such as cost reductions and new markets.
• Impact, likelihood, and speed of onset. These concepts can enable discussion on the severity of potential risks and how likely a risk event may be. Speed of onset is used to describe how quickly a risk might make an impact.
• Appetite and tolerance. Different leaders and departments have varying views on what is an acceptable amount of risk for the organization. Appetite refers to the desired level of risk, while tolerance refers to the amount of risk the organization is willing to accept.
3. Document a shared understanding of strategy, objectives, and boundaries. This will help to establish a clear understanding of expectations and next steps.
4. Identify cultural challenges and potentially misaligned incentives. These issues can derail the process if they are not anticipated and proactively addressed. Some incentives might be designed to drive shorter-term business performance but then be in conflict with longer-term sustainability objectives.
5. Identify opportunities for internal collaboration. Individuals from different teams across the company can and should work together to advance the company’s sustainability efforts.
Want to Get Serious About Sustainability? Use SASB’s Standards to Inform ERM
June 201710
11crowe.com
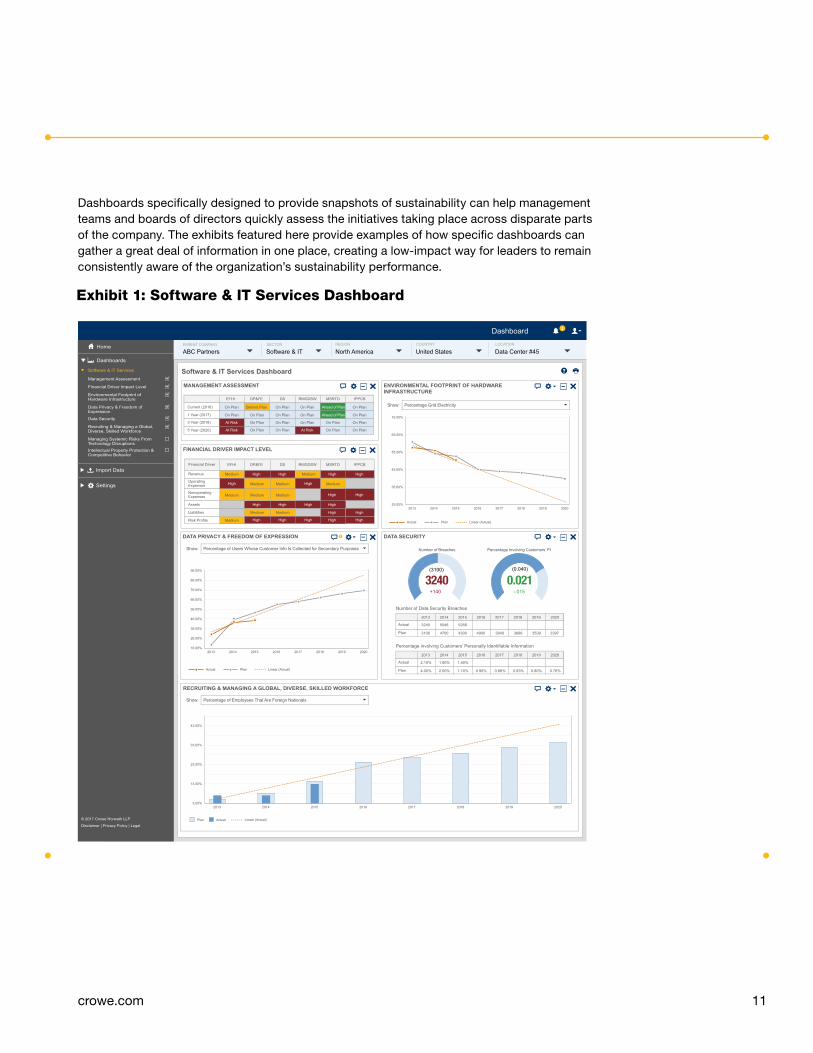
Exhibit 1: Software & IT Services Dashboard
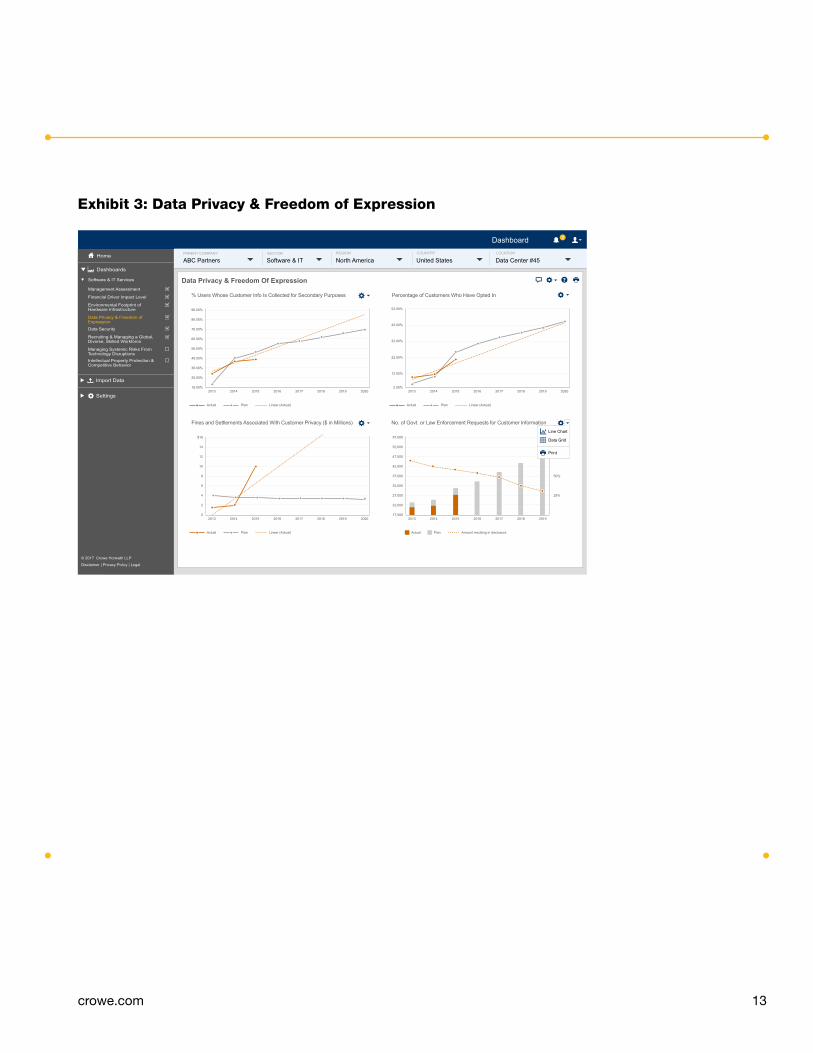
Dashboards specifically designed to provide snapshots of sustainability can help management teams and boards of directors quickly assess the initiatives taking place across disparate parts of the company. The exhibits featured here provide examples of how specific dashboards can gather a great deal of information in one place, creating a low-impact way for leaders to remain consistently aware of the organization’s sustainability performance.
3
Dashboards
Import Data
Software & IT Services
Home
Settings
Management Assessment
Financial Driver Impact Level
Environmental Footprint of Hardware Infrastructure
Data Privacy & Freedom of Expression
Data Security
Recruiting & Managing a Global,Diverse, Skilled Workforce
Managing Systemic Risks FromTechnology DisruptionsIntellectual Property Protection &Competitive Behavior
Software & IT Services Dashboard
Dashboard
© 2017 Crowe Horwath LLP
Disclaimer | Privacy Policy | Legal
MANAGEMENT ASSESSMENT
Current (2016)
1 Year (2017)
3 Year (2018)
5 Year (2020)
DP&FE DS RMGDSWEFHI MSRTD IPPCB
On Plan
On Plan
At Risk
At Risk
Behind Plan
On Plan
On Plan
On Plan
On Plan
On Plan
On Plan
On Plan
On Plan
On Plan
On Plan
At Risk
Ahead of Plan
On Plan
On Plan
On Plan
On Plan
On Plan
On Plan
Ahead of Plan
UT
VA
FINANCIAL DRIVER IMPACT LEVEL
Revenue
OperatingExpenses
Nonoperating Expenses
Assets
Financial Driver
Liabilities
Risk Profile
Medium
Medium
Medium
Medium
Medium
Medium
Medium
Medium
Medium
Medium
High
High High
High High
High High
High
High
High
DP&FE DS RMGDSWEFHI MSRTD IPPCB
High High
Medium
High
High
High
High
High
High
High
ENVIRONMENTAL FOOTPRINT OF HARDWARE INFRASTRUCTURE
25.00%2013
35.00%
45.00%
55.00%
65.00%
75.00%
2014 2015 2016 2017 2018 2019 2020
PlanActual Linear (Actual)
Show: Percentage Grid Electricity
DATA SECURITY
Actual
Plan
2013
Number of Data Security Breaches
2014 2015 2016 2017 2018 2019 2020
3240 5546 5268
3100 4700 4300 4000 3840 3686 3539 3397
Actual
Plan
2013
Percentage involving Customers’ Personally Identifiable Information
2014 2015 2016 2017 2018 2019 2020
2.10% 1.80% 1.40%
4.00% 2.60% 1.10% 0.90% 0.86% 0.83% 0.80% 0.76%
DATA PRIVACY & FREEDOM OF EXPRESSION
16.00%2013
26.00%
36.00%
46.00%
56.00%
66.00%
2014 2015 2016 2017 2018 2019 2020
76.00%
86.00%
96.00%
PlanActual Linear (Actual)
Show: Percentage of Users Whose Customer Info Is Collected for Secondary Purposes
2
RECRUITING & MANAGING A GLOBAL, DIVERSE, SKILLED WORKFORCE
3.00%2013
13.00%
23.00%
2014 2015 2016 2017 2018 2019 2020
33.00%
43.00%
Show: Percentage of Employees That Are Foreign Nationals
Plan Actual Linear (Actual)
0.021(0.040)
Percentage Involving Customers’ PI
-.015
3240+140
(3100)
Number of Breaches
PARENT COMPANY SECTOR REGION COUNTRY LOCATION
ABC Partners Software & IT North America United States Data Center #45

Want to Get Serious About Sustainability? Use SASB’s Standards to Inform ERM
June 201712
Exhibit 2: Automobiles Dashboard
Dashboards
Automobiles
Import Data
Home
Settings
Management Assessment
Financial Driver Impact Level
Materials Efficiency and Recycling
Product Safety
Labor Relations
Fuel Economy and Use-Phase Emissions
Materials Sourcing
Automobiles Dashboard
3Dashboard
© 2017 Crowe Horwath LLP
Disclaimer | Privacy Policy | Legal
MANAGEMENT ASSESSMENT
Current (2016)
1 Year (2017)
3 Year (2018)
5 Year (2020)
Product Safety Labor Relations Fuel Economy andUse-Phase EmissionsTime Period Materials Efficiency
and Recycling
On Plan
On Plan
At Risk
At Risk
Behind Plan
On Plan
On Plan
On Plan
On Plan
On Plan
On Plan
On Plan
On Plan
On Plan
At Risk
On Plan
UT
VA
FINANCIAL DRIVER IMPACT LEVEL
Revenue
OperatingExpenses
Nonoperating Expenses
Assets
Product Safety Labor Relations Fuel Economy andUse-Phase EmissionsFinancial Driver Materials Efficiency
and Recycling
Liabilities
Risk Profile
Medium
Medium
High
Medium
Medium
High
High High
High
High
High
HighHigh
High
High
High
MATERIALS EFFICIENCY AND RECYCLING
75.00%2013
80.00%
85.00%
90.00%
95.00%
100.00%
2014 2015 2016 2017 2018 2019 2020
PlanActual Linear (Actual)
Show: Percentage Recycled (Total Waste From Manufacturing)
LABOR RELATIONS
Actual
Plan
2013
Percentage of U.S. Workforce Covered by Collective-Bargaining Agreements
2014 2015 2016 2017 2018 2019 2020
17% 17% 17%
15% 17.4% 18% 18.3% 18.4% 18.6% 18.8% 19%
Actual
Plan
2013
Percentage of Foreign Workers Covered by Collective-Bargaining Agreements
2014 2015 2016 2017 2018 2019 2020
31% 31% 31%
30.2% 31.4% 32.4% 35.6% 35.9% 36.3% 36.7% 37%
Actual
Plan
2013
Number of Strikes and Lockouts
2014 2015 2016 2017 2018 2019 2020
0 0 0
0 0 0 0 0 0 0 0
Actual
Plan
2013
Total Duration of Strikes and Lockouts (in Worker Days Idle)
2014 2015 2016 2017 2018 2019 2020
0 0 0
0 0 0 0 0 0 0 0
Workforce Under Collective-Bargaining AgreementsWe highly value all our employees and strive to create and maintain a work environment that attracts the best people. Historically, many assembly-line workers at ABC Partners and its competitors have belonged to unions, and that remains the case today. In fact, many of our competitors have substantially similar rates of current union membership. Although the results of our negotiations with these unions are unpredictable, we work to provide employees with competitive wages and benefits in order to reduce the likelihood of conflicts, strikes, and lockouts. Still, it is possible that negotiations may lead to increased costs for ABC, primarily in the form of higher wages and/or benefits. If these cost increas-es occur, they may reduce profits.
Strikes and LockoutsWe cannot prevent every work stoppage, but we attempt to prevent such stoppages, which both indicate employee dissatisfaction and can negatively impact our financial results. Unexpected and/or protracted work stoppages could substantially disrupt manu-facturing operations, the main source of ABC’s revenues. We believe our efforts to main-tain harmonious labor relations reduce the chances of these kinds of work stoppages, but these efforts do not eliminate the risk of them. That risk may increase for a variety of reasons, and an increased number of work stoppages could cause operating revenues to decline. In addition, the fact that no work stoppages have occurred recently does not necessarily indicate they will not occur in the future.
Although we manufacture several aftermarket parts for vehicles, including accessories and service parts, our primary products are passenger cars and light- and heavy-duty trucks. Producing these sophisticated vehicles requires a variety of materials, many of which can be reused, recycled, or remanufactured in order to reduce overall waste and minimize our materials costs. We are committed to reducing the total amount of waste we generate, and of the 203 total facilities we operate, 135 send less than 1 percent of their total waste to landfills. This commitment, and the practices we have implemented as part of it, reflects how highly we value our customers, employees, and the communities in which we operate. Reducing waste and recycling also provide a financial benefit. In 2014, we generated $983 million in recycling-related revenue and saved an estimated $320 million on waste disposal and other costs. Our market research indicates we are leading our competitors in generating revenue from our waste reduction efforts.
Manufacturing Waste and RecyclingOur priority is to produce the world’s best vehicles while respecting the environment. As such, waste reduction is incorporated into our continuous improvement management process. Managers are rewarded for reducing waste. One division within our research and development group devotes its time to designing new methods by which we can further reduce waste and/or reuse or recycle materials. All of our employees who are involved in manufacturing are encouraged to participate in our waste-reduction program, which asks them, on a quarterly basis, to submit ideas to reduce waste. We recognize and reward all participating employees; we consider all submitted ideas, and we imple-ment those that are feasible.
By its nature, vehicle manufacturing will always require a significant amount of resources. However, our designs, processes, and policies can all ensure we use those resources wisely. The benefits of effective waste management extend beyond reducing disposal costs and generating revenues from the sale of recycled materials. Because materials costs constitute a significant share of our total costs of goods sold, any reduction in the amount of wasted material results in direct cost savings.
Additional InformationPRODUCT SAFETY
60.00%2013
62.00%
64.00%
66.00%
68.00%
70.00%
2014 2015 2016 2017 2018 2019 2020
72.00%
74.00%
76.00%
78.00%
PlanActual Linear (Actual)
Show: Percentage of Models Holding Overall 5-Star Safety Rating, North America
Additional Information
FUEL ECONOMY AND USE-PHASE EMISSIONS
$02013
$50,000
$100,000
2014 2015 2016 2017 2018 2019 2020
$150,000
$200,000
Show: Number of Plug-In Electric Vehicle Sales, North America
Plan Actual Linear (Actual)
PARENT COMPANY SECTOR REGION COUNTRY LOCATION
ABC Partners Automobiles North America United States Plant #151
13crowe.com
Exhibit 3: Data Privacy & Freedom of Expression
3
Dashboards
Import Data
Software & IT Services
Home
Settings
Management Assessment
Financial Driver Impact Level
Environmental Footprint of Hardware Infrastructure
Data Privacy & Freedom of Expression
Data Security
Recruiting & Managing a Global,Diverse, Skilled Workforce
Managing Systemic Risks FromTechnology DisruptionsIntellectual Property Protection &Competitive Behavior
Data Privacy & Freedom Of Expression
Dashboard
© 2017 Crowe Horwath LLP
Disclaimer | Privacy Policy | Legal
VA
16.00%2013
26.00%
36.00%
46.00%
56.00%
66.00%
2014 2015 2016 2017 2018 2019 2020
76.00%
86.00%
96.00%
PlanActual Linear (Actual)
% Users Whose Customer Info Is Collected for Secondary Purposes
2.00%2013
12.00%
22.00%
32.00%
42.00%
52.00%
2014 2015 2016 2017 2018 2019 2020
PlanActual Linear (Actual)
Percentage of Customers Who Have Opted In
02013
2
4
6
8
10
2014 2015 2016 2017 2018 2019 2020
12
14
$16
PlanActual Linear (Actual)
Fines and Settlements Associated With Customer Privacy ($ in Millions)
17,0002013
22,000
27,000
32,000
37,000
42,000
2014 2015 2016 2017 2018 2019
47,000
52,000
57,000
25%
50%
75%
100%
Actual Amount resulting in disclosurePlan
No. of Govt. or Law Enforcement Requests for Customer Information
PARENT COMPANY SECTOR REGION COUNTRY LOCATION
ABC Partners Software & IT North America United States Data Center #45
Line Chart
Data Grid

Want to Get Serious About Sustainability? Use SASB’s Standards to Inform ERM
14 June 2017
SASB’s Standards Help Companies Overcome Inherent Challenges Incorporating sustainability risks in ERM and legal filings does not come without challenges. Many business managers simply are unfamiliar with sustainability risks. They struggle to rank these risks against more familiar business risks, let alone respond to risks related to sustainability. Moreover, sustainability risks can be difficult to quantify and often involve a longer time horizon compared with traditional risks. Finally, a lack of collaboration between sustainability and risk management teams and insufficient guidance within the predominant ERM frameworks on how to manage sustainability risks also make sustainability reporting challenging.
Committing openly to sustainability often means publicly acknowledging shortcomings, which can make companies vulnerable. By bringing sustainability efforts into public view, companies hold themselves accountable to follow through and succeed on promised initiatives. However, failing to disclose material sustainability information in a decision- useful format has the potential to put companies in a worse position by leaving investors with the impression that the company is ignoring sustainability risks or that it has something to hide. SASB’s standards can help companies identify the most critical issues for their industry and provide a cost-effective, straightforward approach to reporting on them.

crowe.com
The information in this document is not – and is not intended to be – audit, tax, accounting, advisory, risk, performance, consulting, business, financial, investment, legal, or other professional advice. Some firm services may not be available to attest clients. The information is general in nature, based on existing authorities, and is subject to change. The information is not a substitute for professional advice or services, and you should consult a qualified professional adviser before taking any action based on the information. Crowe is not responsible for any loss incurred by any person who relies on the information discussed in this document. Visit www.crowe.com/disclosure for more information about Crowe LLP, its subsidiaries, and Crowe Global. © 2018 Crowe LLP.
Text created in and current as of June 2017; Cover and artwork updated in May 2018.
Learn MoreGregg AndersonManaging Director+1 630 586 5142 [email protected]
1 “Global Risks Report 2017,” World Economic Forum, Jan. 11, 2017, http://reports.weforum.org/global-risks-2017/
2 “Sustainable Investing: Establishing Long-Term Value and Performance,” DB Climate Change Advisors, June 2012, https://institutional.deutscheam.com/content/_media/Sustainable_Investing_2012.pdf
3 “Sustainability and Enterprise Risk Management: The First Step Towards Integration,” World Business Council for Sustainable Development, Jan. 18, 2017, http://www.wbcsd.org/Projects/Non-financial-Measurement-and-Valuation/Resources/Sustainability-and-enterprise-risk-management-The-first-step-towards-integration
4 “Revealing the Full Picture: Your Guide to ESG Reporting,” London Stock Exchange Group, February 2017, http://www.lseg.com/esg
5 Matt Orsagh, “CFA Institute Survey: How Do ESG Issues Factor Into Investment Decisions?,” CFA Institute, Aug. 17, 2015, https://blogs.cfainstitute.org/marketintegrity/2015/08/17/cfa-institute-survey-how-do-esg-issues-factor-into-investment-decisions/
6 Peter DeSimone, “Board Oversight of Sustainability Issues: A Study of the S&P 500,” Sustainable Investments Institute and Investor Responsibility Research Center Institute, March 31, 2014, http://irrcinstitute.org/wp-content/uploads/2015/09/final_2014_si2_irrci_report_on_board_oversight_of_sustainability_issues_public1.pdf
7 “Sustainability and Enterprise Risk Management: The First Step Towards Integration,”
8 “The Investor Study: Insights From PRI Signatories,” UN Global Compact and Accenture, June 2014, https://www.accenture.com/t20150523T042350__w__/us-en/_acnmedia/Accenture/Conversion-Assets/DotCom/Documents/Global/PDF/Industries_15/Accenture-Investor-Study-Insights-PRI-Signatories.pdf
9 “Investors, Corporates, and ESG: Bridging the Gap,” PricewaterhouseCoopers, October 2016, http://www.pwc.com/us/en/governance-insights-center/publications/esg-environmental-social-governance-reporting.html
10 “82% of the S&P 500 Companies Published Corporate Sustainability Reports in 2016,” May 31, 2017, http://www.ga-institute.com/press-releases/article/flash-report-82-of-the-sp-500-companies-published-corporate-sustainability-reports-in-2016.html
11 Michael Meehan, interviewed by David Kiron and Nina Kruschwitz, “Sustainability Reporting as a Tool for Better Risk Management,” MITSloan Management Review, May 8, 2015, http://sloanreview.mit.edu/article/sustainability-reporting-as-a-tool-for-better-risk-management/
12 Sustainability Accounting Standards Board, “State of Disclosure Report – 2016,” https://library.sasb.org/state-of-disclosure-annual-report/
13 Ibid.
14 Mark Beasley, Bruce Branson, and Bonnie Hancock, “The State of Risk Oversight: An Overview of Enterprise Risk Management Practices,” March 2017, eighth edition, https://www.aicpa.org/InterestAreas/BusinessIndustryAndGovernment/Resources/ERM/Pages/EnterpriseRiskManagementReporting.aspx
15 “The Evolution of SEC Disclosure – The Materiality of ESG Information and Its Use by Investors,” webinar by the Sustainability Accounting Standards Board and Workiva, March 14, 2017, https://fsa.sasb.org/wp-content/uploads/2017/03/Workiva-Webinar.pdf
RISK-17019-009A