walnuts - sutter county, california · walnuts the first english, or persian, walnut* trees were...
TRANSCRIPT


WALNUTS
The first English, or Persian, Walnut* trees were brought to California around 1770 by the Mission
fathers who acquired them in South America. These early trees bore small round nuts with very
hard shells and were cultivated to a limited extent by early California pioneers, In 1856, Ozro W.
Childs is reported to have planted the first commercial orchard in California. Today 99 percent of
the total U.S. walnut crop is produced in California, with Sutter County among the leading walnut
producing counties in the State.
*In Medieval days, walnuts were associated with English merchant sailors and were transported in ships
around the world. Because of this, Persian walnuts were soon called English walnuts.


TABLE OF CONTENTS
FRUIT AND NUT CROPS 1
FRUIT & NUT CROPS-BEARING AND NON-BEARING 2
FIELD CROPS 3
FIELD CROPS, continued 4
VEGETABLE CROPS 5
SEED CROPS 6
NURSERY PRODUCTS 7
APIARY PRODUCTS 7
LIVESTOCK AND POULTRY PRODUCTS 8
SUMMARY-FARM VALUE OF AGRICULTURAL PRODUCTION 9
TEN LEADING CROPS AND VALUE 9
GROSS VALUE OF AGRICULTURAL PRODUCTION 10
AGRICULTURAL PRODUCTION COMPARISON 11
AGRICULTURAL PRODUCTION 11
EXPORT SUMMARY 12
SUSTAINABLE AGRICULTURE REPORT 13
PERSONNEL BACK PAGE

FRUIT AND NUT CROPSACREAGE, PRODUCTION AND VALUE
PRODUCTION VALUEHARVESTED PER PER
CROPS YEAR ACRES ACRE TOTAL UNIT UNIT TOTAL
Almonds, 2000 5,549 0.61 3,385 Tons 1,837.58$ 6,220,200$ Meats 1999 4,476 0.87 3,894 Tons 1,600.00 6,230,400
Almonds, 2000 846 Tons 55.00 46,500 Hulls 1999 974 Tons 70.00 68,200
Apples 2000 600 7.23 4,338 Tons 221.86 962,400 1999 765 7.77 5,944 Tons 233.54 1,388,200
Cherries 2000 31 0.97 30 Tons 2,420.45 72,600 ** 1999 31 4.52 140 Tons 2,513.54 351,900
Kiwifruit 2000 201 3.05 613 Tons 599.50 367,500 1999 206 0.68 140 Tons 678.19 94,900
Peaches, 2000 10,415 17.62 183,512 Tons 209.39 38,425,600 Cling 1999 9,918 17.53 173,863 Tons 233.00 40,510,100
- Peaches, 2000 31 2.31 72 Tons 510.34 36,700 Freestone 1999 MISCELLANEOUS CROP -
- Pears 2000 411 16.80 6,905 Tons 177.17 1,223,400
1999 445 18.35 8,166 Tons 223.22 1,822,800
Persimmons 2000 128 4.24 543 Tons 361.87 196,500 1999 128 3.61 462 Tons 385.03 177,900
Prunes, 2000 27,326 1.95 53,286 Tons 816.55 43,510,700 Dried 1999 24,600 1.77 43,542 Tons 941.44 40,992,200
Walnuts, 2000 15,815 1.35 21,350 Tons 1,243.00 26,538,100 English 1999 15,033 1.89 28,412 Tons 915.78 26,019,100
Walnuts, 2000 71 0.25 18 Tons 111.11 2,000 Black 1999 71 0.50 36 Tons 111.11 4,000
Miscellaneous Fruit * 2000 288 622 Tons 455,100 & Nuts 1999 392 1,163 Tons 940,100
Orchard 2000 Tons 1,618,100 By-Products 1999 Tons 1,387,700
TOTAL 2000 60,866 119,675,400$ 1999 56,065 119,987,500$
*Includes Apricots, Bushberries (Boysenberries, Blackberries & Raspberries), Chestnut, Feijoa/Guava, Figs, Grapefruit, Grapes, Jujube, Lemon, Limes, Loquat, Nectarines, Oranges (Mandarin, Naval & Valencia), Pecan, Pistachios, Plums, Pomegranates, Tangerines, and other miscellaneous fruit and nut crops of a limited number of growers/processors in Sutter County.
**1999 Corrected Figure
1

FRUIT AND NUT CROPSBEARING AND NON-BEARING ACREAGE*
BEARING ACRES NON-BEARING ACRESCROP 1999 2000 1999 2000
Almonds 4,476 5,549 1,457 1,511
Apples 765 724 109 109
Apricots 4 4 0 0
Cherries 33 31 0 2
Chestnuts 25 25 0 0
Grapes 83 83 2 2
Kiwi 206 201 0 0
Nectarines 64 65 1 14
Olives 10 10 0 0
Oranges, Navel 7 7 3 3
Oranges, Valencia 2 2 0 0
Peaches, Cling 9,918 10,415 3,884 2,921
Peaches, Freestone 103 103 3 3
Pears 445 411 93 92
Pecans 11 11 4 13
Persimmons 128 128 52 54
Pistachios 38 38 1 1
Plums 30 26 28 31
Prunes 24,600 27,326 5,858 1,337
Strawberries 24 25 0 0
Walnuts, Black 71 71 8 8
Walnuts, English 15,033 15,815 5,763 5,943
Miscellaneous** 27 8 3 0TOTAL 56,103 61,078 17,269 12,044
* Acreage from California Crop and Livestock Reporting Service.**Includes Bushberries, Chestnut, Feijoa/Guava, Fig, Grapefruit, Jojoba, Jujube, Lemon, Lime, Loquat, Oranges (Mandarin), Pomegranates, Tangelos, Tangerines, and other miscellaneous fruit and nut crops of a limited number of growers/processors in Sutter County.
2
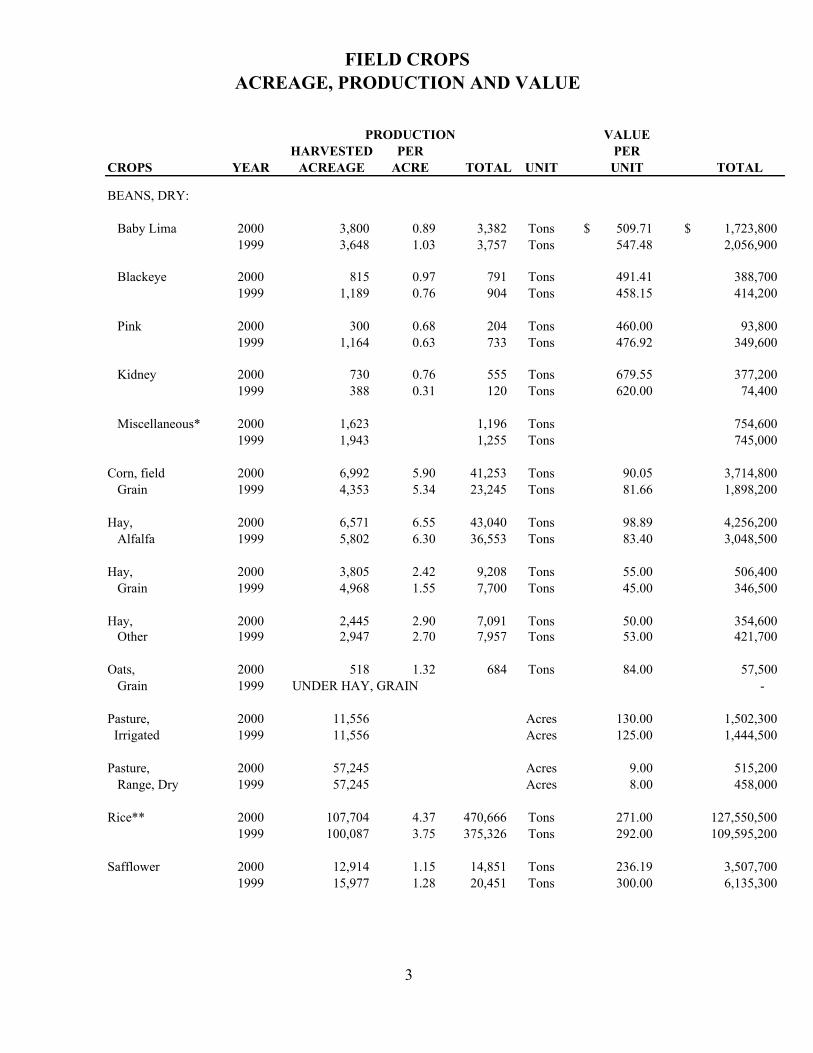
FIELD CROPSACREAGE, PRODUCTION AND VALUE
PRODUCTION VALUEHARVESTED PER PER
CROPS YEAR ACREAGE ACRE TOTAL UNIT UNIT TOTAL
BEANS, DRY:
Baby Lima 2000 3,800 0.89 3,382 Tons $ 509.71 $ 1,723,800 1999 3,648 1.03 3,757 Tons 547.48 2,056,900
Blackeye 2000 815 0.97 791 Tons 491.41 388,700 1999 1,189 0.76 904 Tons 458.15 414,200
Pink 2000 300 0.68 204 Tons 460.00 93,800 1999 1,164 0.63 733 Tons 476.92 349,600
Kidney 2000 730 0.76 555 Tons 679.55 377,200 1999 388 0.31 120 Tons 620.00 74,400
Miscellaneous* 2000 1,623 1,196 Tons 754,600 1999 1,943 1,255 Tons 745,000
Corn, field 2000 6,992 5.90 41,253 Tons 90.05 3,714,800 Grain 1999 4,353 5.34 23,245 Tons 81.66 1,898,200
Hay, 2000 6,571 6.55 43,040 Tons 98.89 4,256,200 Alfalfa 1999 5,802 6.30 36,553 Tons 83.40 3,048,500
Hay, 2000 3,805 2.42 9,208 Tons 55.00 506,400 Grain 1999 4,968 1.55 7,700 Tons 45.00 346,500
Hay, 2000 2,445 2.90 7,091 Tons 50.00 354,600 Other 1999 2,947 2.70 7,957 Tons 53.00 421,700
Oats, 2000 518 1.32 684 Tons 84.00 57,500 Grain 1999 UNDER HAY, GRAIN -
Pasture, 2000 11,556 Acres 130.00 1,502,300 Irrigated 1999 11,556 Acres 125.00 1,444,500
Pasture, 2000 57,245 Acres 9.00 515,200 Range, Dry 1999 57,245 Acres 8.00 458,000
Rice** 2000 107,704 4.37 470,666 Tons 271.00 127,550,500 1999 100,087 3.75 375,326 Tons 292.00 109,595,200
Safflower 2000 12,914 1.15 14,851 Tons 236.19 3,507,700 1999 15,977 1.28 20,451 Tons 300.00 6,135,300
3

FIELD CROPS continued
PRODUCTION VALUEHARVESTED PER PER
CROPS YEAR ACREAGE ACRE TOTAL UNIT UNIT TOTAL
Sorghum, 2000 616 2.91 1,793 Tons $ 85.00 $ 152,400 Grain 1999 199 2.75 547 Tons 83.84 45,900
Sugarbeets 2000 NONE - 1999 1,779 28.00 49,812 Tons 40.95 2,039,800
Wheat, Grain 2000 9,003 2.15 19,356 Tons 87.72 1,697,900 1999 7,921 2.36 18,694 Tons 89.58 1,674,600
Wild Rice 2000 2,716 0.74 2,010 Tons 988.19 1,986,300 1999 3,088 0.66 2,038 Tons 1,000.00 2,038,000
Miscellaneous*** 2000 5,187 18,796 Tons 3,712,700 1999 7,331 28,450 Tons 6,434,900
Field Crop 2000 79,296 Tons 14.00 1,110,100 By-Products 1999 62,461 Tons 12.73 795,100
TOTAL 2000 234,540 $ 153,962,700 1999 231,585 $ 140,016,300
* Includes Beans (Cranberry, Pinto & Black Turtle) and other miscellaneous beans of a limited number of growers/processors in Sutter County.** Includes Production Flexibility Contract (PFC) and Market Loss Assistance Payment.***Includes Barley, Corn (Silage), Cotton, Millet, Popcorn, Sweet Rice and other miscellaneous field crops of a limited number of growers/processors in Sutter County.
4

VEGETABLE CROPSACREAGE, PRODUCTION AND VALUE
PRODUCTION VALUEHARVESTED PER PER
CROPS YEAR ACREAGE ACRE TOTAL UNIT UNIT TOTAL
Melons, 2000 4,356 7.33 31,929 Tons $ 257.61 $ 8,225,200 Honeydew 1999 5,074 6.34 32,169 Tons 183.89 5,915,600
Tomatoes, 2000 9,700 34.22 331,934 Tons 51.84 17,207,500 Canning 1999 18,763 34.71 651,264 Tons 58.39 38,027,300
Watermelons 2000 20 9.82 196 Tons 236.00 46,300 1999 491 14.32 7,031 Tons 102.29 719,200
Miscellaneous* 2000 550 3,026 Tons 1,928,800 1999 1,323 5,748 Tons 2,798,900
TOTAL 2000 14,626 $ 27,407,8001999 25,651 $ 47,461,000
*Includes the following crops:Asparagus, Beans (Yellow, Blue Lake, Favo, Green, Kentucky Wonder & Long) Beets, Broccoli, Brussel Sprouts, Cabbage, Cantaloupe, Carrots, Cauliflower, Chard (Swiss), Chayote, Cilantro, Corn (Sweet), Cucumber, Diakon, Eggplant, Gai-Lon, Garlic, Gourds, Greens (Mustard), Herbs, Jicama, Lettuce,Melons (Mixed & Bitter), Okra, Onion, Peas (Blackeye, Snap & Sugar), Peppers (Bell, Red & Chili),Potatoes, Potato (Sweet), Pumpkin (Farmers Market, Processing, Wholesale/Retail), Radish, Spinach, Squash, Tomatoes (Fresh & Greenhouse), Tomatillo,Turnips, Watercress, and other miscellaneous vegetables of a limited number of growers/processors in Sutter County.
5

SEED CROPSACREAGE, PRODUCTION AND VALUE
PRODUCTION VALUEHARVESTED PER PER
CROPS YEAR ACREAGE ACRE TOTAL UNIT UNIT TOTAL
Beans, 2000 1,543 1,173 1,809,939 Lbs $ 0.34 $ 615,400 Dry 1999 1,334 1,508 2,011,672 Lbs 0.32 643,700
Cantaloupe & 2000 143 479 68,497 Lbs 2.40 164,400 Honeydew 1999 215 409 87,935 Lbs 3.40 299,000
Cucumber 2000 720 288 207,360 Lbs 6.87 1,424,600 1999 1,098 270 296,460 Lbs 7.30 2,164,200
Pumpkin & 2000 479 508 243,332 Lbs 3.04 739,700 Squash 1999 823 640 526,720 Lbs 3.19 1,680,200
Rice 2000 10,453 8,400 87,805,200 Lbs 0.17 14,926,900 1999 4,207 7,130 29,995,910 Lbs 0.16 4,799,300
Safflower 2000 3,164 2,428 7,682,192 Lbs 0.11 845,000 1999 1,984 2,223 4,410,432 Lbs 0.15 661,600
Sunflower 2000 1,765 1,344 2,372,160 Lbs 0.50 1,186,100 1999 1,370 1,569 2,149,530 Lbs 0.60 1,289,700
Watermelon 2000 1,088 227 246,976 Lbs 6.29 1,553,500 1999 1,254 220 275,880 Lbs 4.20 1,158,700
Wheat 2000 497 6,000 2,982,000 Lbs 0.05 149,100 1999 1,771 2,360 4,179,560 Lbs 0.05 209,000
Miscellaneous* 2000 1,653 330,748 Lbs 1,831,600 1999 3,253 1,316,735 Lbs 1,576,700
TOTAL 2000 21,505 $ 23,436,300 1999 17,309 $ 14,482,100
*Includes Brussel Sprouts, Cabbage, Carrot, Clover, Collard, Kale, Onion, Tomato, Turnip, and other miscellaneous seed crops of a limited number of growers/processors in Sutter County.
6

NURSERY PRODUCTSACREAGE, PRODUCTION AND VALUE
FIELD QUANTITYNURSERY PRODUCTS YEAR ACRES SOLD UNIT TOTAL
Fruit & Nut 2000 224 1,747,000 Each $ 6,430,300 Trees & Vines 1999 284 2,278,070 Each 9,776,300
Ornamental Trees, Shrubs 2000 46 1,594,400 and other Nursery Stock 1999 22 2,042,800
2000 270 $ 8,024,700 TOTAL 1999 306 $ 11,819,100
APIARY PRODUCTSPRODUCTION AND VALUE
VALUEPER
ITEM YEAR PRODUCTION UNIT UNIT TOTAL
Honey 2000 144,000 Pounds $ 0.51 $ 73,400 1999 160,276 Pounds 0.45 72,100
Beeswax 2000 2,160 Pounds 1.00 2,200 1999 2,404 Pounds 1.75 4,200
Package Bees 2000 6,930 Pounds 5.25 36,400 1999 7,700 Pounds 5.50 42,400
Queen Bees 2000 32,400 Each 8.00 259,200 1999 36,000 Each 9.50 342,000
Pollination 2000 44,541 Colony 15.71 699,700 1999 42,988 Colony 16.98 729,900
2000 $ 1,070,900 TOTAL 1999 $ 1,190,600
7

LIVESTOCK AND POULTRYPRODUCTS
PRODUCTION AND VALUE
PRODUCTION VALUETOTAL PER
ITEM YEAR NUMBER LIVEWEIGHT UNIT UNIT TOTAL
Cattle & Calves 2000 9,440 69,241 Cwt. $ 76.23 $ 5,278,200 1999 15,875 131,721 Cwt. 62.37 8,215,400
Sheep & Lambs 2000 16,118 19,922 Cwt. 74.25 1,479,200 1999 20,148 24,289 Cwt. 70.48 1,711,900
Wool 2000 99,504 Lbs. 0.18 17,900 1999 120,268 Lbs. 0.35 42,100
Miscellaneous* 2000 3,138,000 1999 3,007,800
Livestock 2000 5,000 By-Products 1999 5,200
TOTAL 2000 $ 9,918,300 1999 $ 12,982,400
*Includes Angora Fur, Aquaculture, Bait Products, Chickens, Chicken Eggs, Chukar, Ducks, Geese, Goats,Milk (Market) Hogs & Pigs, Pheasants, Pigeons, Rabbits, Rabbit Hides, Turkeys and other miscellaneous livestock and poultry of a limited number of growers/processors in Sutter County.
8

SUMMARYFARM VALUE OF AGRICULTURAL PRODUCTION
1999 2000
FRUIT & NUT CROPS * 119,987,500$ FRUIT & NUT CROPS 119,675,400$
FIELD CROPS 140,016,300 FIELD CROPS 153,962,700
SEED CROPS 14,482,100 SEED CROPS 23,436,300
VEGETABLE CROPS 47,461,000 VEGETABLE CROPS 27,407,800
NURSERY PRODUCTS 11,819,100 NURSERY PRODUCTS 8,024,700
APIARY PRODUCTS 1,190,600 APIARY PRODUCTS 1,070,900
LIVESTOCK PRODUCTS 12,982,400 LIVESTOCK PRODUCTS 9,918,300
TOTAL * 347,939,000$ 343,496,100$
TEN LEADING CROPS AND VALUE**
1999 2000
RICE 119,256,600$ RICE 144,556,300$
PRUNES 40,992,200$ PRUNES 43,510,700$
PEACHES 40,697,600$ PEACHES 38,462,300$
TOMATOES 38,142,000$ WALNUTS 26,540,100$
WALNUTS 26,023,100$ TOMATOES 17,544,100$
NURSERY PRODUCTS 11,819,100$ MELONS 10,137,006$
MELONS 8,226,500$ NURSERY PRODUCTS 8,024,700$
CATTLE & CALVES 8,215,400$ ALMONDS 6,266,700$
SAFFLOWER 6,796,900$ CATTLE & CALVES 5,278,200$
ALMONDS 6,298,600$ ALFALFA HAY 4,256,200$
*1999 Corrected Figure
**Includes Seed. Rice does not include Wild Rice. 9

GROSS VALUEOF
AGRICULTURAL PRODUCTION
YEAR VALUE YEAR VALUE
1945 $ 33,381,000 1973 $ 159,204,000
1946 $ 41,347,000 1974 $ 179,719,000
1947 $ 41,291,000 1975 $ 187,517,000
1948 $ 39,684,000 1976 $ 178,554,000
1949 $ 36,731,000 1977 $ 200,878,000
1950 $ 41,930,000 1978 $ 220,502,000
1951 $ 52,003,000 1979 $ 258,666,900
1952 $ 49,494,000 1980 $ 299,014,700
1953 $ 44,815,000 1981 $ 316,465,900
1954 $ 38,783,000 1982 $ 247,784,100
1955 $ 43,224,000 1983 $ 205,335,300
1956 $ 49,381,000 1984 $ 262,285,500
1957 $ 41,313,000 1985 $ 255,449,600
1958 $ 38,786,000 1986 $ 229,364,800
1959 $ 50,707,000 1987 $ 216,183,600
1960 $ 50,536,000 1988 $ 201,345,800
1961 $ 55,585,000 1989 $ 243,940,200
1962 $ 57,322,000 1990 $ 217,400,000
1963 $ 55,155,000 1991 $ 268,941,900
1964 $ 66,740,000 1992 $ 285,622,700
1965 $ 64,564,000 1993 $ 292,108,300
1966 $ 71,627,000 1994 $ 340,171,300
1967 $ 69,313,000 1995 $ 330,170,500
1968 $ 80,275,000 1996 $ 302,706,400
1969 $ 74,006,000 1997 $ 277,169,700
1970 $ 77,238,000 1998 $ 268,323,100
1971 $ 82,209,000 1999* $ 347,939,000
1972 $ 95,118,000 2000 $ 343,496,100
*Corrected Figure 10
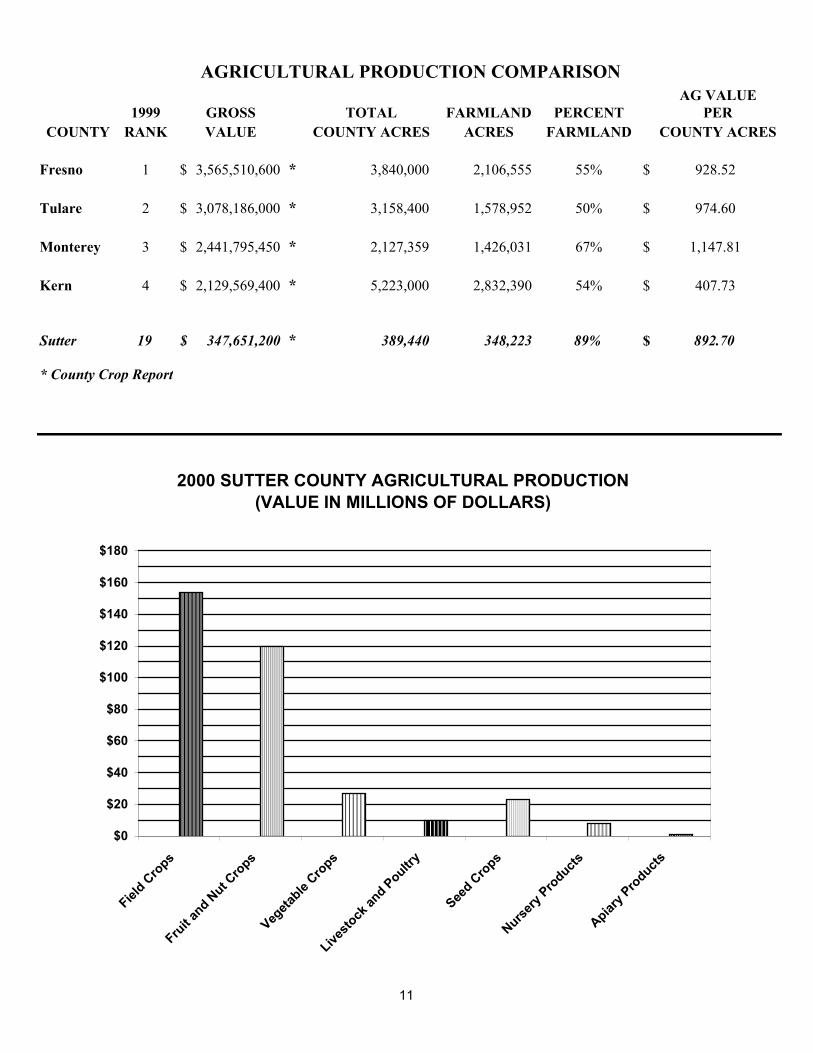
AG VALUE1999 GROSS TOTAL FARMLAND PERCENT PER
COUNTY RANK VALUE COUNTY ACRES ACRES FARMLAND COUNTY ACRES
Fresno 1 3,565,510,600$ * 3,840,000 2,106,555 55% $ 928.52
Tulare 2 3,078,186,000$ * 3,158,400 1,578,952 50% $ 974.60
Monterey 3 2,441,795,450$ * 2,127,359 1,426,031 67% $ 1,147.81
Kern 4 2,129,569,400$ * 5,223,000 2,832,390 54% $ 407.73
Sutter 19 347,651,200$ * 389,440 348,223 89% $ 892.70
* County Crop Report
AGRICULTURAL PRODUCTION COMPARISON
2000 SUTTER COUNTY AGRICULTURAL PRODUCTION (VALUE IN MILLIONS OF DOLLARS)
$0
$20
$40
$60
$80
$100
$120
$140
$160
$180
Field C
rops
Fruit a
nd Nut C
rops
Vegeta
ble Cro
ps
Livesto
ck an
d Poultry
Seed C
rops
Nursery
Products
Apiary P
roducts
11

2000SUTTER COUNTY EXPORTS
VEGETABLE SEEDS DRY BEANS/PEASSeeds include the following: Artichoke, asparagus, bean, Austria Republic of Koreabeet, broccoli, cabbage, cantaloupe, carrot, cauliflower, celery, Australia Netherlandschard (swiss), collard, coriander, corn, cucumber, eggplant, endive, Belize Pakistanflower, garlic, leek, lettuce, melon, mustard, okra, onion, parsley, India Panamapea, pepper, pumpkin, radicchio, radish, spinach, squash, Italy Taiwansunflower, tomato, turnip, watermelon, grass seed Jamaica Trinidad & Tobago
Jordan UruguayArgentina Honduras PeruAustralia Hong Kong PhilippinesBolivia India PortugalBrazil Italy Russia Federation FRESH KIWIChile Jamaica Saudi ArabiaColombia Japan Sri Lanka Japan, Republic of Korea, TaiwanCzech Republic Kenya South AfricaDominican Republic Rep. of Korea SpainEcuador Martinique Thailand WALNUTS - MEATS AND IN SHELLEgypt Mexico Trinidad & TobagoFrance Morocco Turkey Italy, Spain, Netherlands, VenezuelaGermany Netherlands United Arab EmiratesGhana New Zealand UruguayGreece Nicaragua Venezuela WALNUT SHELLS WALNUT BURLSGuatemala Pakistan Germany, SwitzerlandHaiti Panama People's Republic of China
PADDY RICE/WILD RICE WALNUT TREES PEAT MOSSArgentina China
Taiwan
DRIED PRUNES FRESH MELONS PEACHES
Argentina Hong Kong People's Republic of China Japan, Mexico TaiwanAustralia India PolandBelgium Israel Russian RepublicBrazil Italy Spain APRICOT KERNELS PEACH SEEDColombia Japan SwedenCzech Republic Rep. of Korea Switzerland Mexico AustraliaDenmark Lativa TaiwanEcuador Lebanon TurkeyEgypt Malaysia United Arab Emirates FRESH PRUNESFinland Mexico United KingdomFrench Polynesia Netherlands Ukraine TaiwanGreece New Zealand VenezuelaGermany Norway STRAWBERRY PLANTSHolland Panama
Argentina, Columbia, Cyprus, Ecuador, Egypt, France, Mexico, Spain, Tunisia, Uruguay,
12

SUSTAINABLE AGRICULTUREJANUARY - DECEMBER 2000
ORGANIC PRODUCERSTwenty-eight (28) Organic Producers Registered in Sutter County
BIOLOGICAL CONTROLPest Control Agent Program Scope
Puncture Vine Seed & Stem Weevils SurveyTribulus terrestris Microlarinus lareynii Countywide
Microlarinas lypriformis CountywideYellow Starthistle (YST) Flower & Head Weevils Survey
Centaurea solstitialis Bangasternus orientalis 10 sites; no releasesLarinus curtus 2 sites; no releasesYST Hairy WeevilEustenopus villosus 11 sites; 2 releasesYST Gall FlyUrophora sirunaseva Countywide
PEST DETECTION Visual Number of Number of Number ofHours Properties Acres Trees
Commercial 8 1 80Public Contact 140 10 5Nursery Inspection 7 250Certification 1,092 213 5,369Special Survey:
Apple Maggot 96.5 9 615Jointedvetch 0 2 2Purple Loosestrife 42 12 12Cherry-Mediterranean Fruit Fly 9.5 4 33Khapra Beetle 41.5 28 28Exotic Fruit Pests-McPhail 45 12 12Olive Fruit Fly 178 16 34Glassy-Winged Sharpshooter 1,112 186 1,696Plum Pox 40 1 - 7,450
EXOTIC PEST DETECTION Traps in Operation Total Number of PEST ERADICATION(Seasonal High) Services Properties
Mediterranean Fruit Fly 110 1,210 White Horsenettle 5Oriental Fruit Fly 21 208 Purple Starthistle 1Melon Fruit Fly 21 178 Purple Loosestrife 3Gypsy Moth 61 356Japanese Beetle 42 277 Total UnitsEuropean Pine Shoot Moth 5 24 PEST EXCLUSION InspectedKhapra Beetle 176 323 Interstate, Intrastate, 24,725Olive Fruit Fly 18 179 & Foreign ShipmentsCherry-Mediterranean Fruitfly 9 36Apple Maggot 72 504Medfly-McPhail 12 144Glassy-Winged Sharpshooter 251 1,767
VERTEBRATE PEST CONTROL Properties Control Agents Units Used/SoldGround Squirrels, Gophers, 554 Anticoagulant Bait 1,895Jackrabbits, Rats & Mice Anticoagulant, Paraffin Blocks 3,010
Zinc Phosphide Bait 1,505Strychnine (Below ground use only) 8
Muskrats, Skunks, Opossums,Raccoons, Fox, Beavers & Coyotes 736 13