walk/live st. louis: elected officials & staff event
TRANSCRIPT

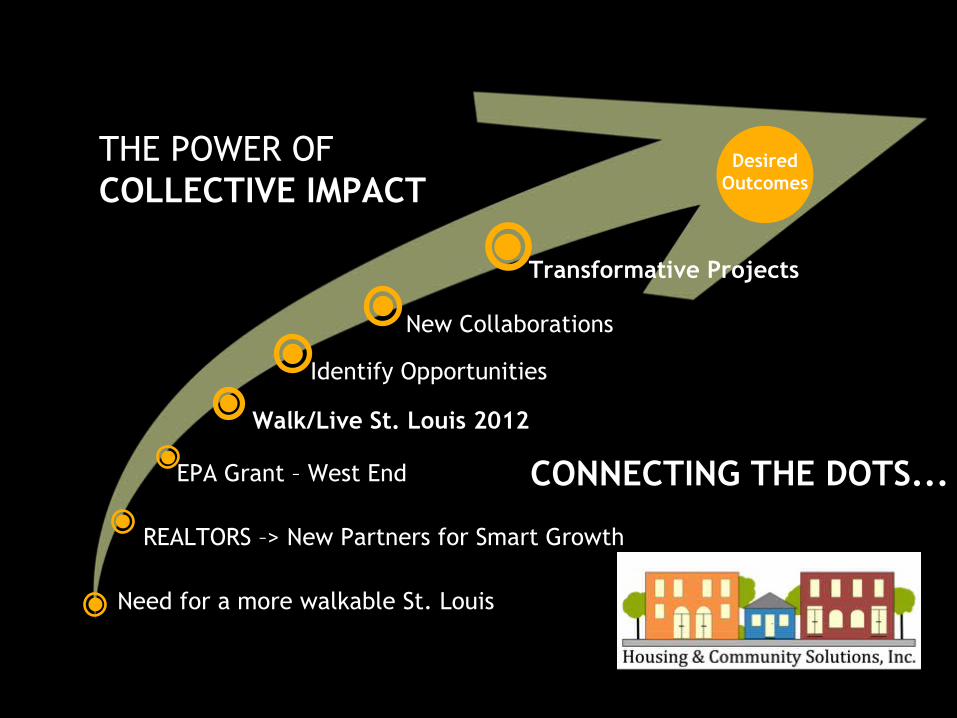
THE POWER OF COLLECTIVE IMPACT
Walk/Live St. Louis 2012
New Collaborations
Transformative Projects
DesiredOutcomes
Identify Opportunities
CONNECTING THE DOTS...
Need for a more walkable St. Louis
REALTORS –> New Partners for Smart Growth
EPA Grant – West End

Livability and the role of Transportation
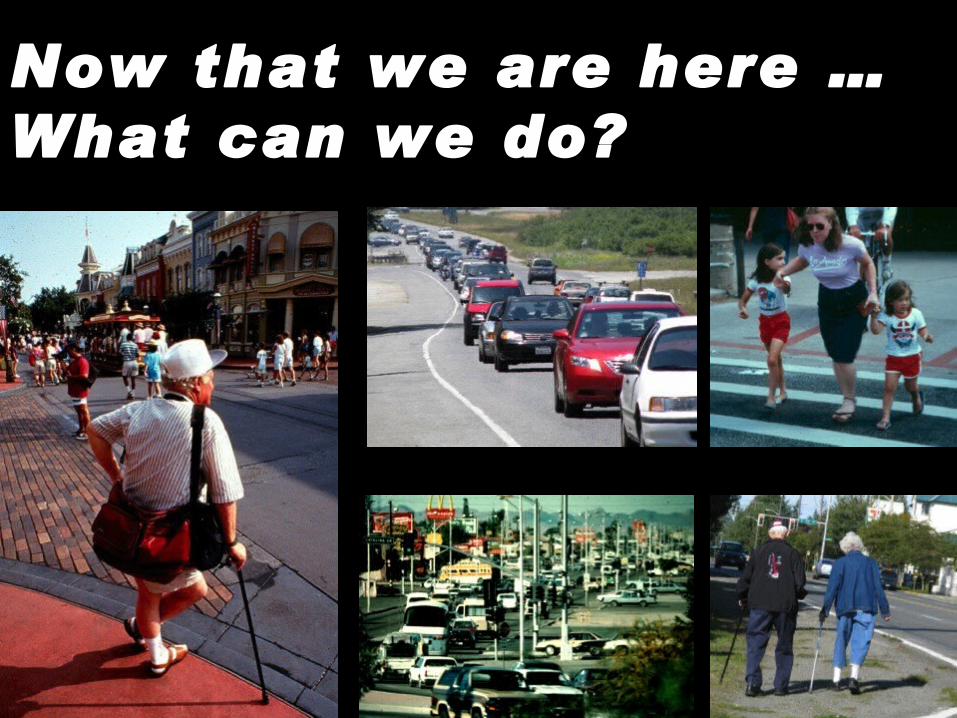
Now that we are here … What can we do?
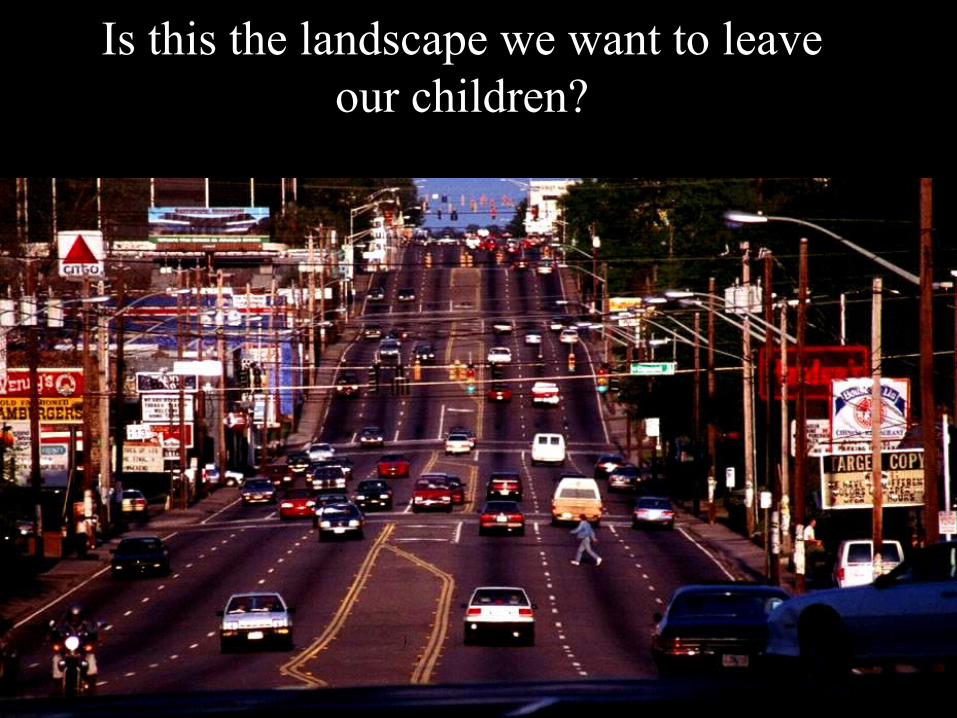
Is this the landscape we want to leave our children?

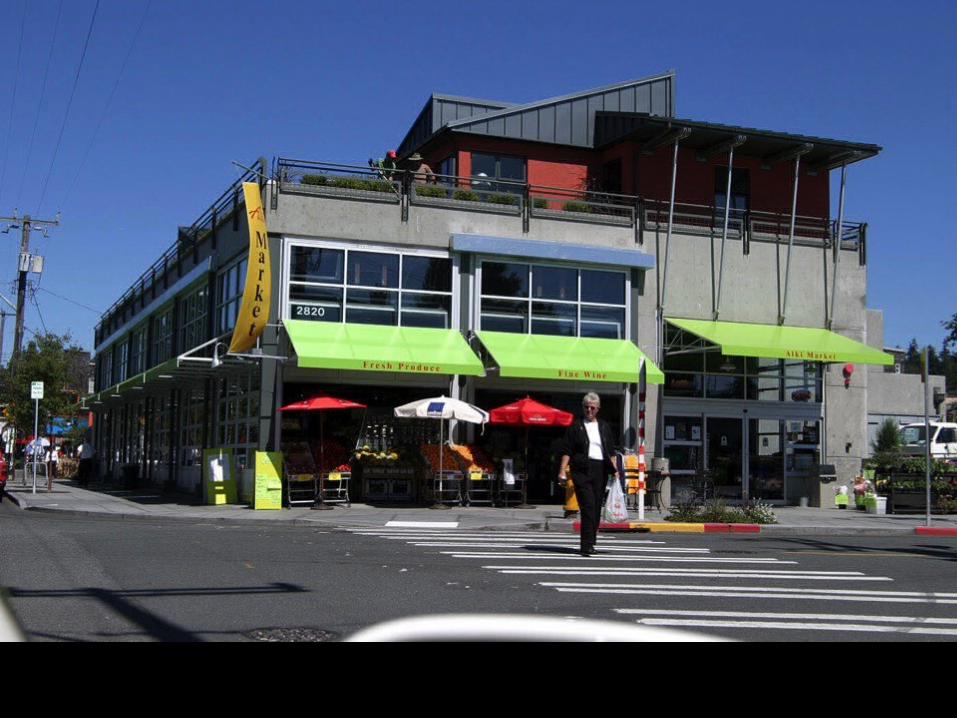
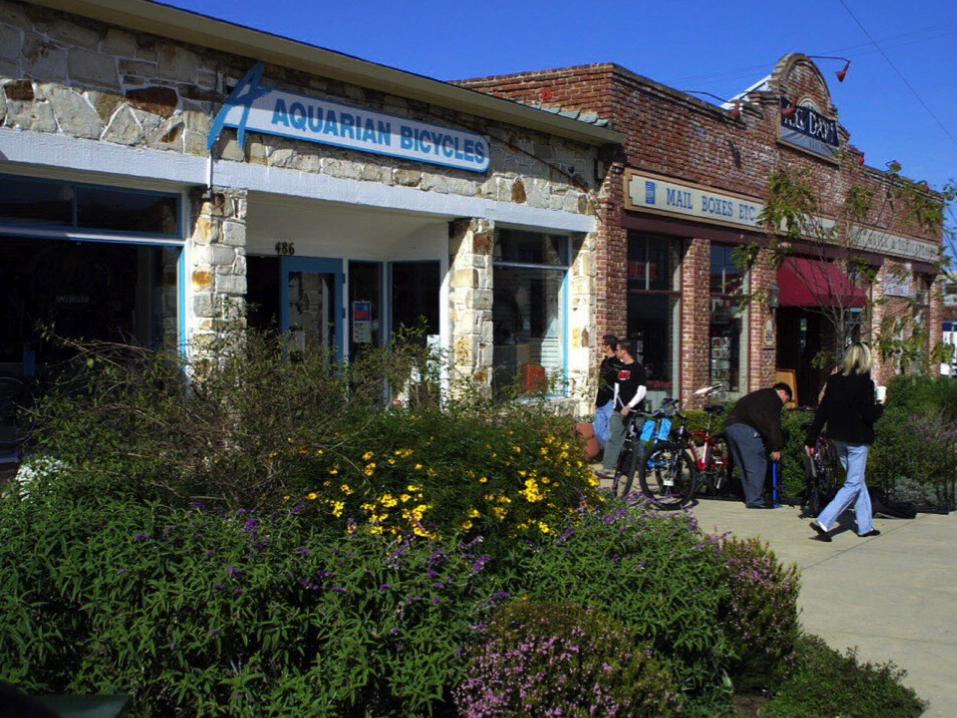
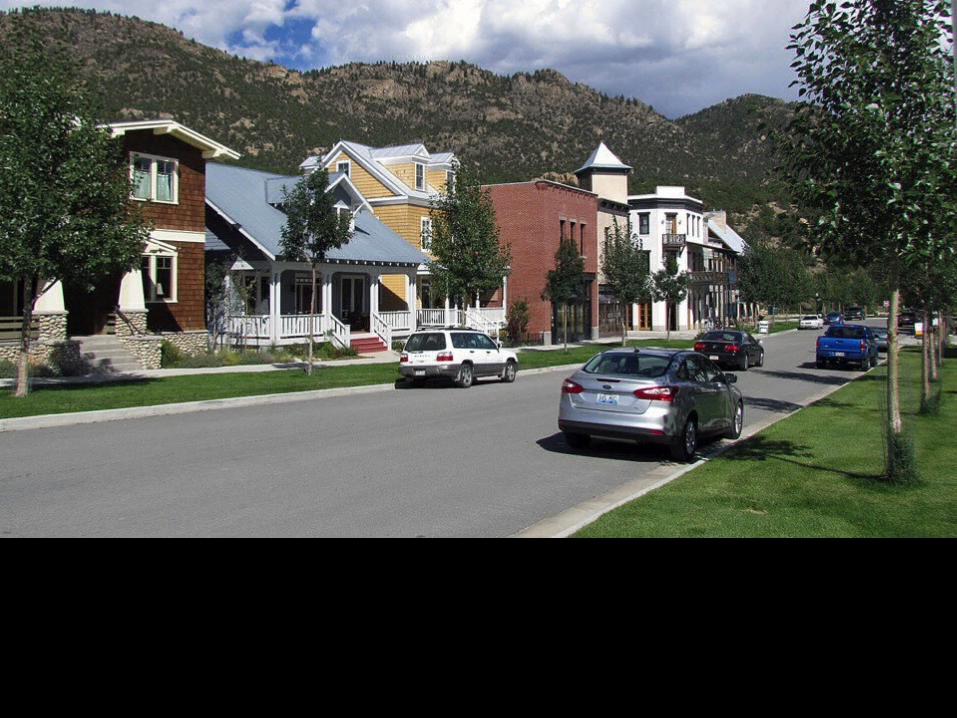
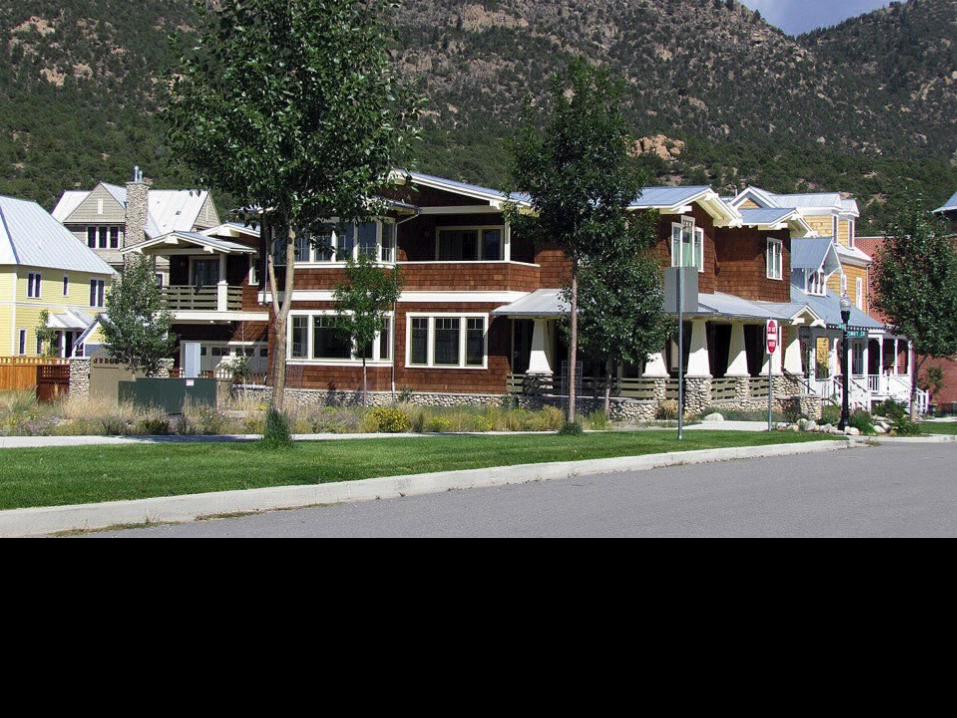
Cottonwood, CAMain Street

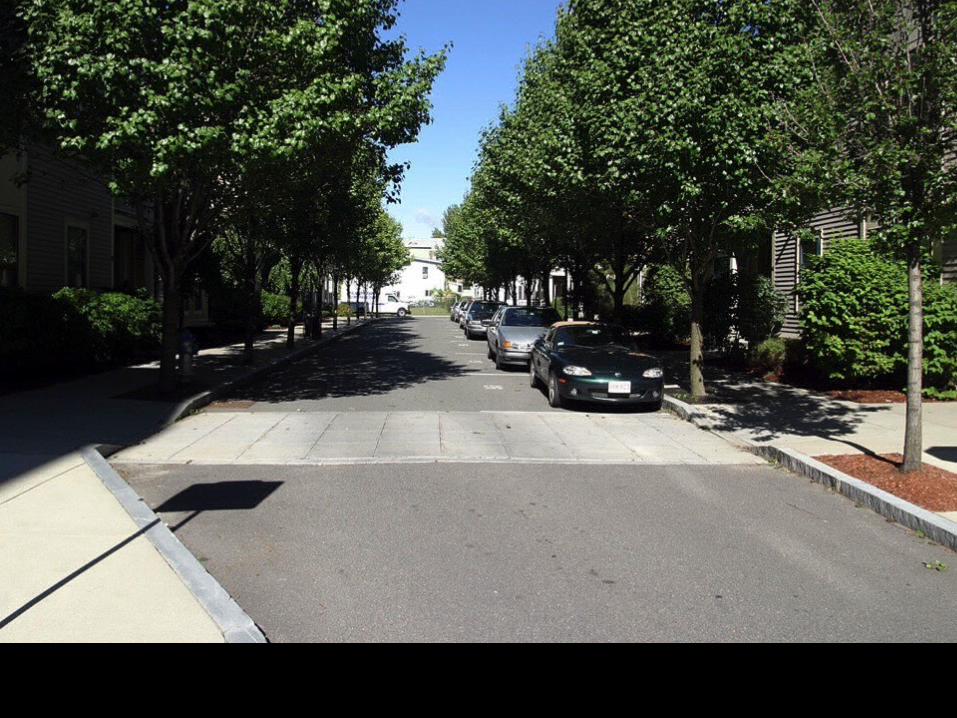
Not Walkable Walkable
High Car Dependency Low Car Dependency
Serious Congestion Moderate Congestion
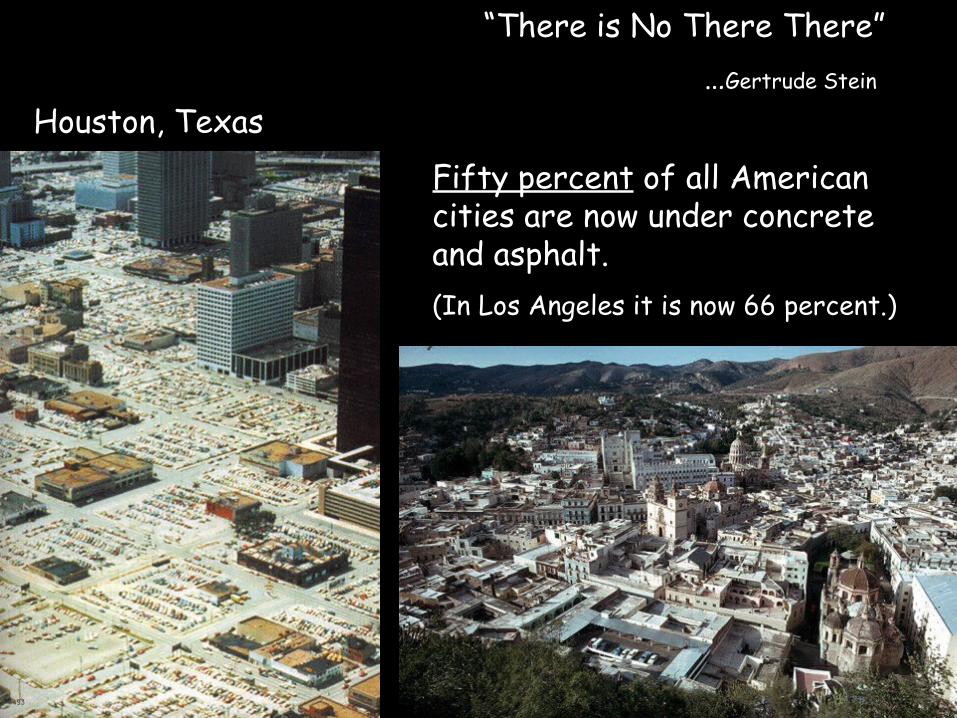
“There is No There There”…Gertrude Stein
Fifty percent of all American cities are now under concrete and asphalt. (In Los Angeles it is now 66 percent.)
Houston, Texas

Courtesy of Ian Lockwood
Courtesy of Ian Lockwood

Courtesy of Ian Lockwood

Courtesy of Ian Lockwood

Cycle of Automobile Dependency
For much of the last century transportation and land use planning practices supported a self-reinforcing cycle of increased automobile dependency and sprawl.
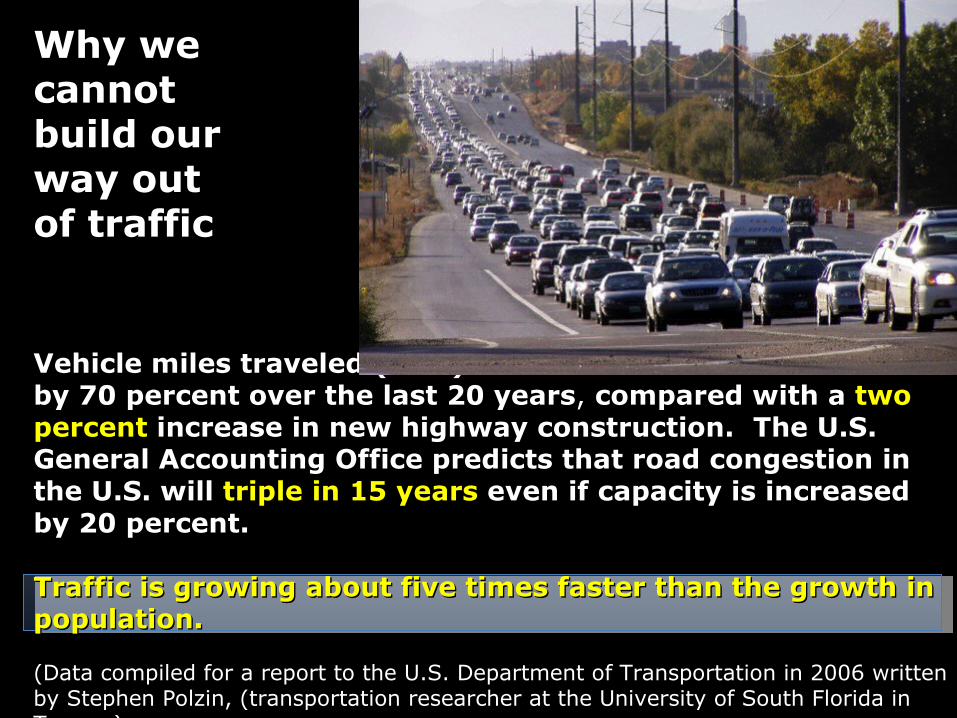
Vehicle miles traveled (VMT) around the U.S. have increased by 70 percent over the last 20 years, compared with a two percent increase in new highway construction. The U.S. General Accounting Office predicts that road congestion in the U.S. will triple in 15 years even if capacity is increased by 20 percent.
Traffic is growing about five times faster than the growth in Traffic is growing about five times faster than the growth in population. population.
(Data compiled for a report to the U.S. Department of Transportation in 2006 written by Stephen Polzin, (transportation researcher at the University of South Florida in Tampa.)
Why we cannot build our way out of traffic

Wid
en
20-Year Forecast
Capacity
Years
Land Use & Transportation – Ideal Traffic Planning
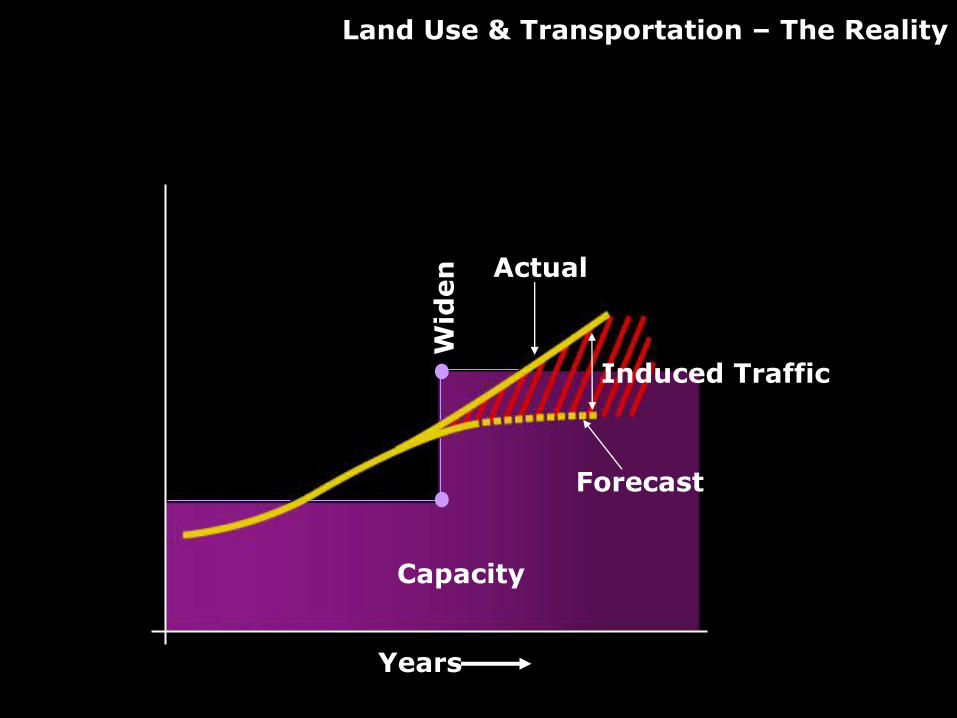
Actual
Induced Traffic
Forecast
Capacity
Years
Wid
en
Land Use & Transportation – The Reality

Con
vent
iona
l App
roac
h
Syst
em
Man
agem
ent
More Pavement
Mor
e La
nes
Mor
e R
oads
ITS
Mor
e C
ars
MoreCar-CarryingCapacity
Lateral Approach
Increa
se Q
uality
of Trav
el
User View and ComfortContext-Sensitive DesignTraffic CalmingPersonal Security
Intensify land use densitiesPromote Mixed Use DevelopmentTransit Supportive DevelopmentDemand Management – Pricing, e-commerce, telecommuting, etc…
Lane LimitsChange Standards
Shift PolicyMove Less People, Fewer Miles
TransitBicyclingWalkingHOV/HOT Lanes
Mov
e Pe
ople,
Not
Car
s
A B a la n c e d T r a n s p o r t a t io n A p p r o a c h

Widen Road
Reduce Delay
Reduce Cost
Move Home
Range Farther
Drive More
Own More Cars
FIRST ORDER
SECOND ORDER
THIRD ORDER
Chain of Impacts
HigherCarbon
Footprint
Increased Energy Demand
LoseBusiness &
JobsCommunit
y Disinvestm
ent
Big Box
InactivityEpidemic
More VMT
IncreasedHousehold
Transportation Costs


Marine Drive, Dundarave, B.C.
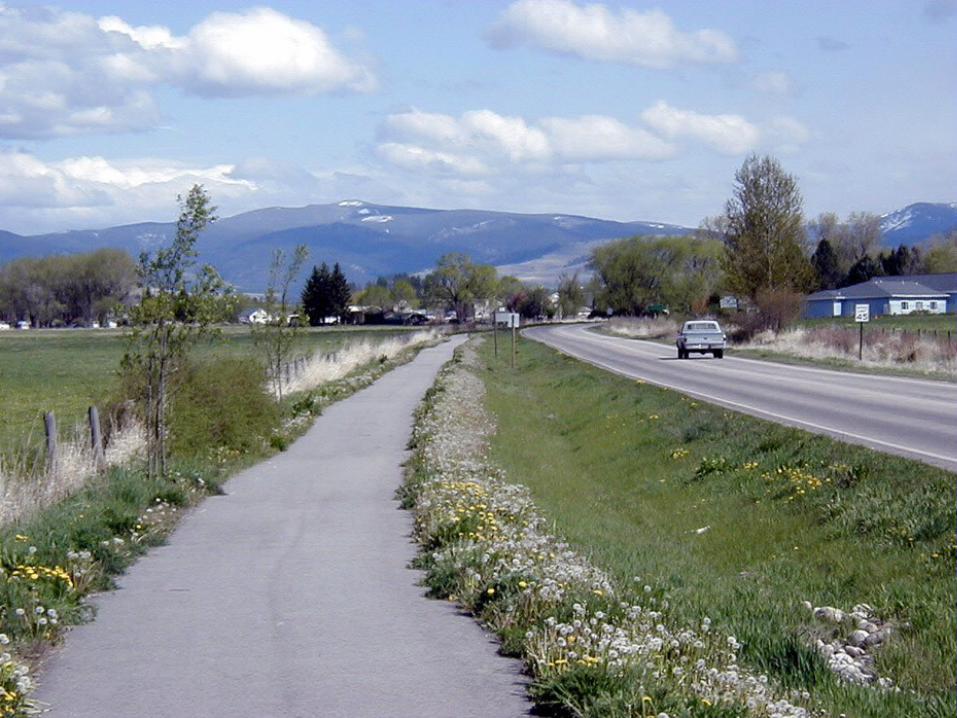
Highway 93, Missoula, Montana
USA
Canada

Marine Drive, Dundarave, B.C.


Back-In Parking, with Road Diet on East Side

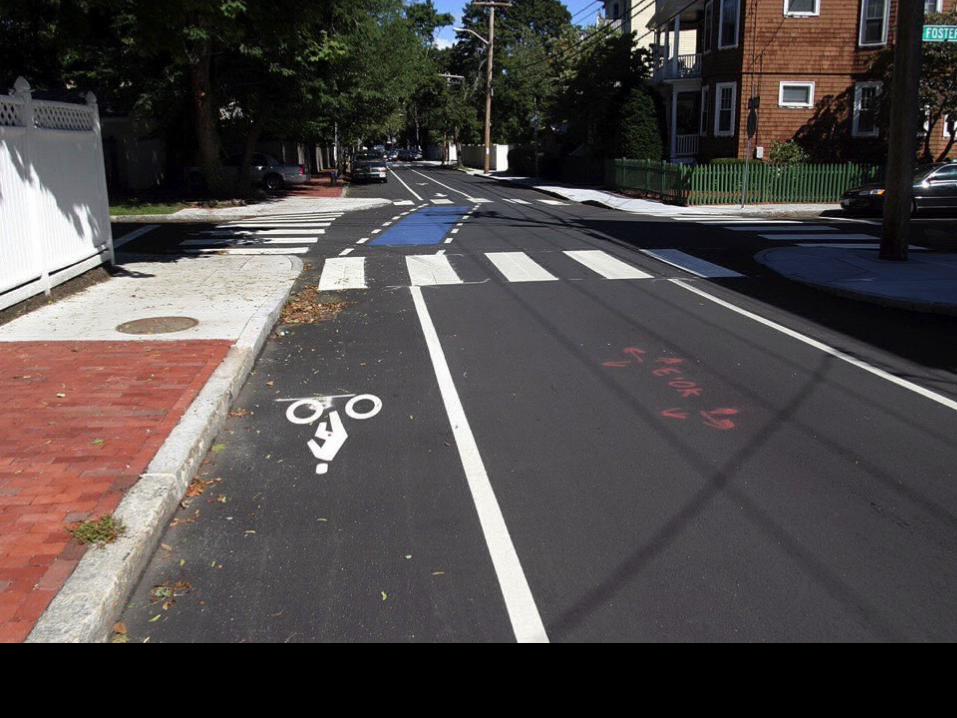
Colorized Bike Lanes

Combination Super Sharrow (Green Sharrow Lane), with Road Diet on East Side

Combination Super Sharrow (Green Sharrow Lane), with Road Diet on East Side
(Low domed or cobbled crossing median) is added
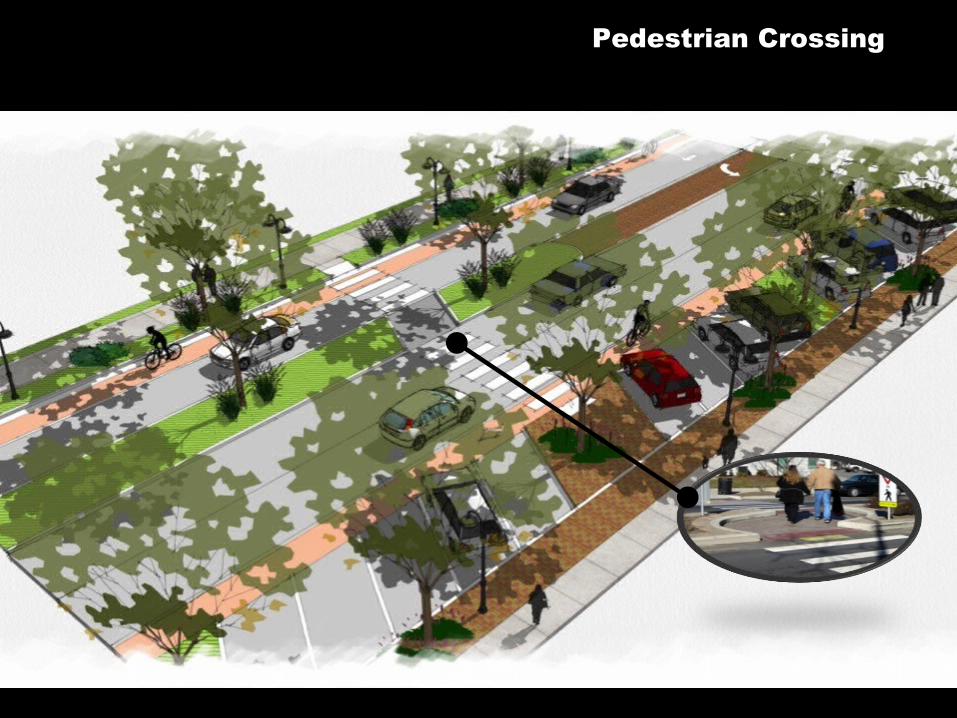
Pedestrian Crossing

Driveway Access, with Road Diet on East Side

You Know When You Have Left Claremont
Claremont, California

Bridgeport Way, University Place, WashingtonBridgeport Way, University Place, Washington
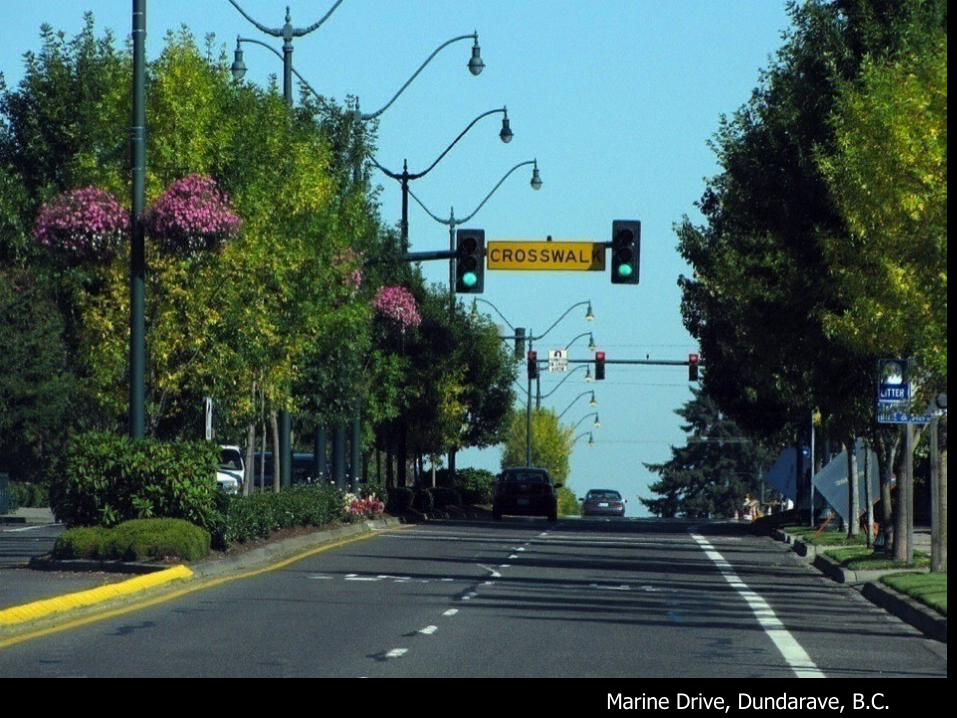
Marine Drive, Dundarave, B.C.
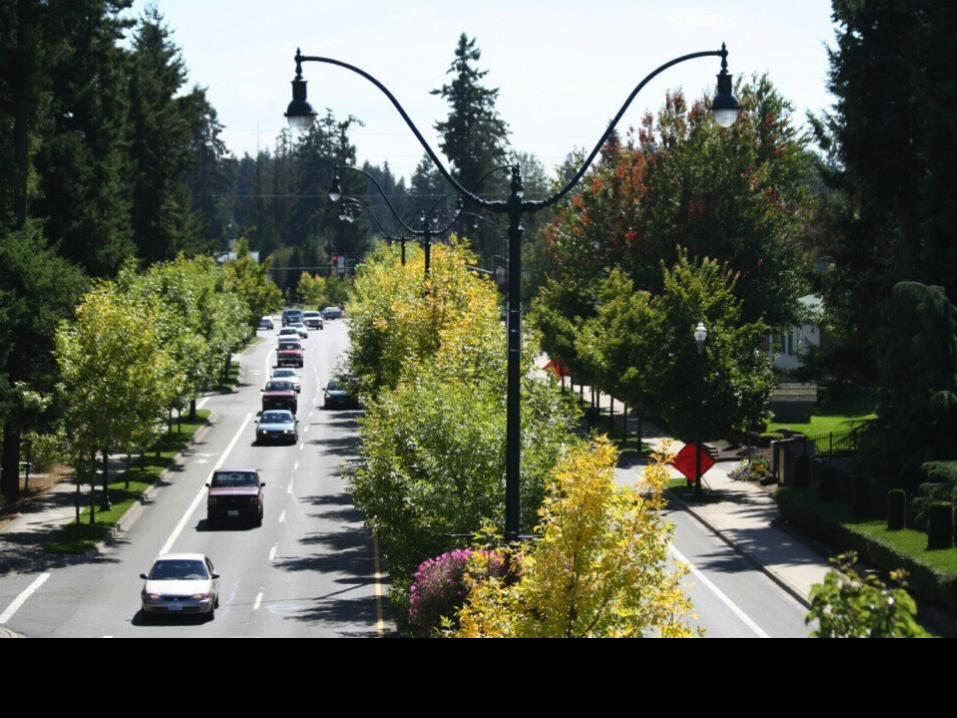
Bridgeport (1999)

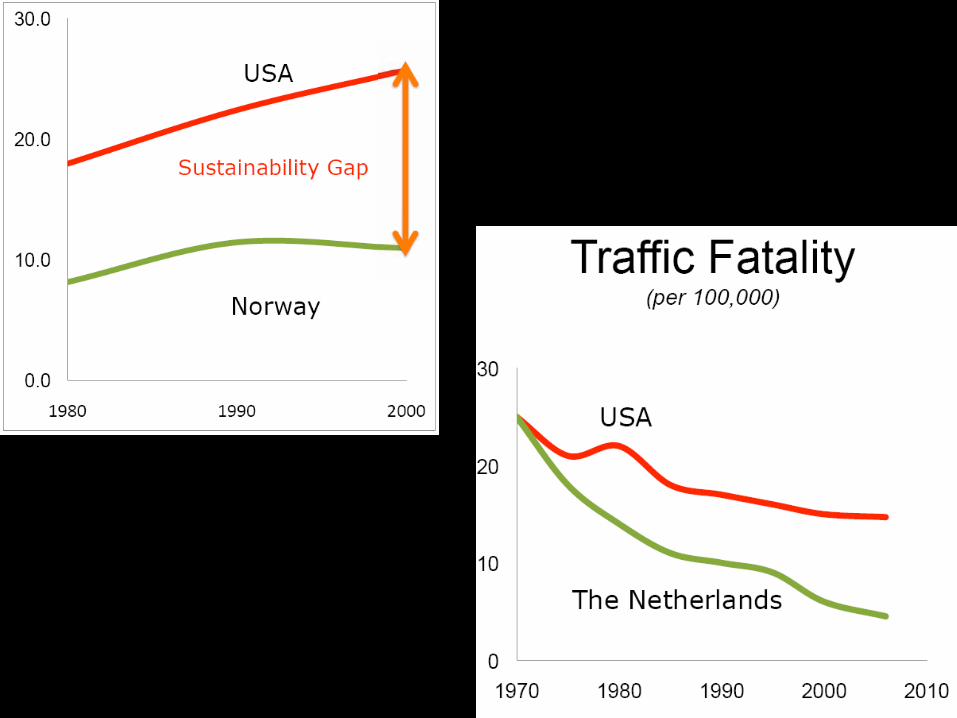
With almost double the cost per capita of the average Western nations, the U.S. receives less in the way of health care and health outcomes.
This makes us vulnerable in global competition
Source: The Kaiser Family Foundation, April 2011
The Average U.S. Family now pays $16,000 per year in health care costs, and this figure is rising.

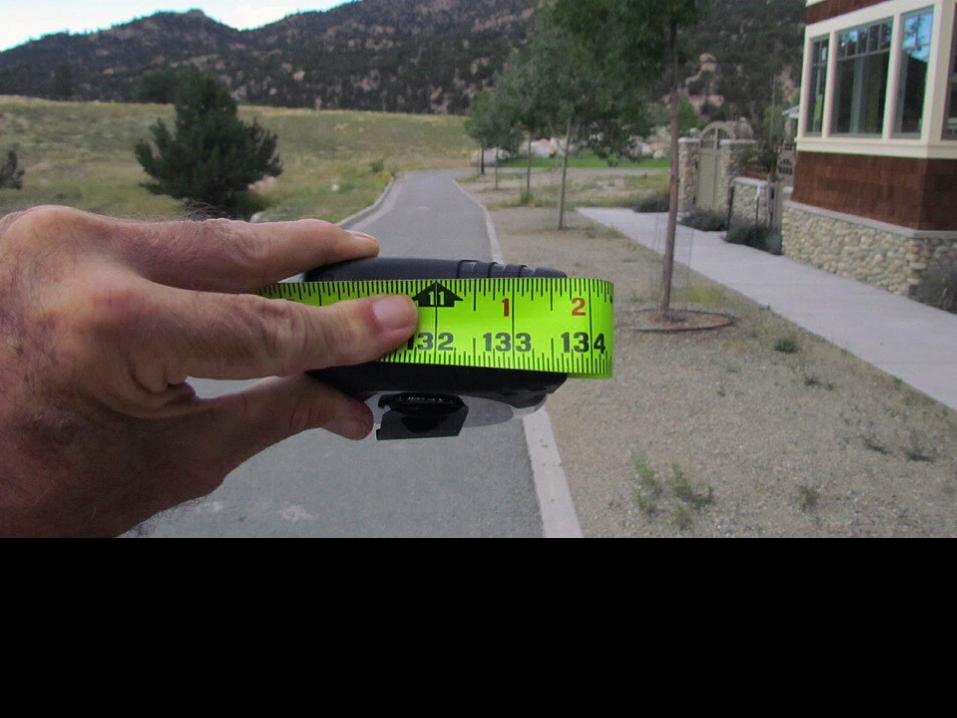
Action Question #1If driving more than 20 miles per day is not sustainable, how do we get back to 1985 levels.
Driving more miles each year (like obesity) is a visible symptom, an indicator of a disease that is running amuck in each of our towns and villages.

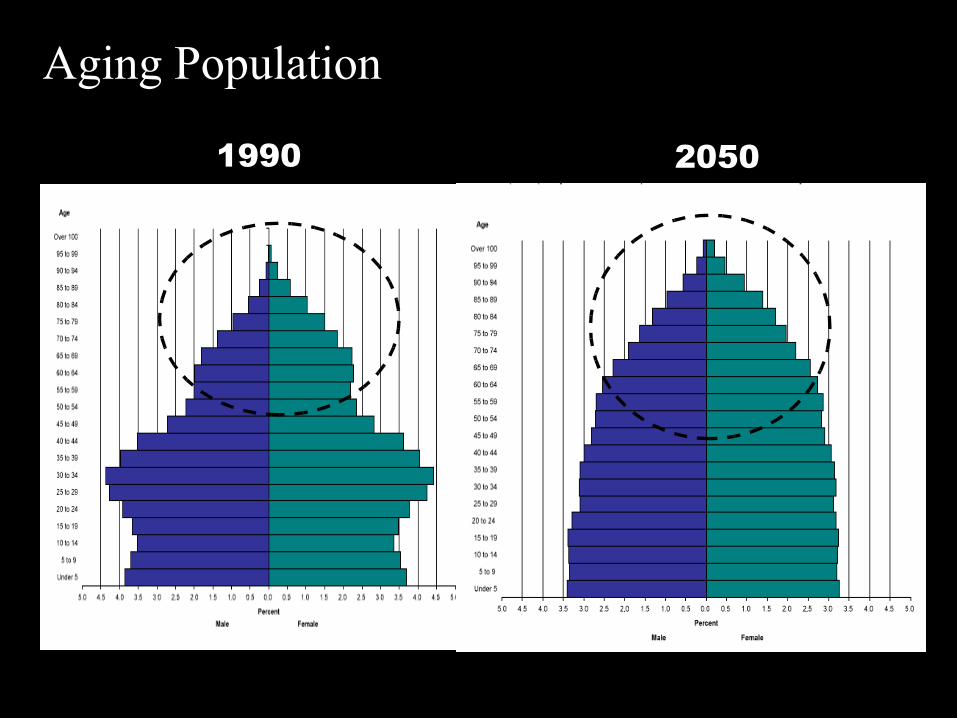
1990 2050
Aging Population
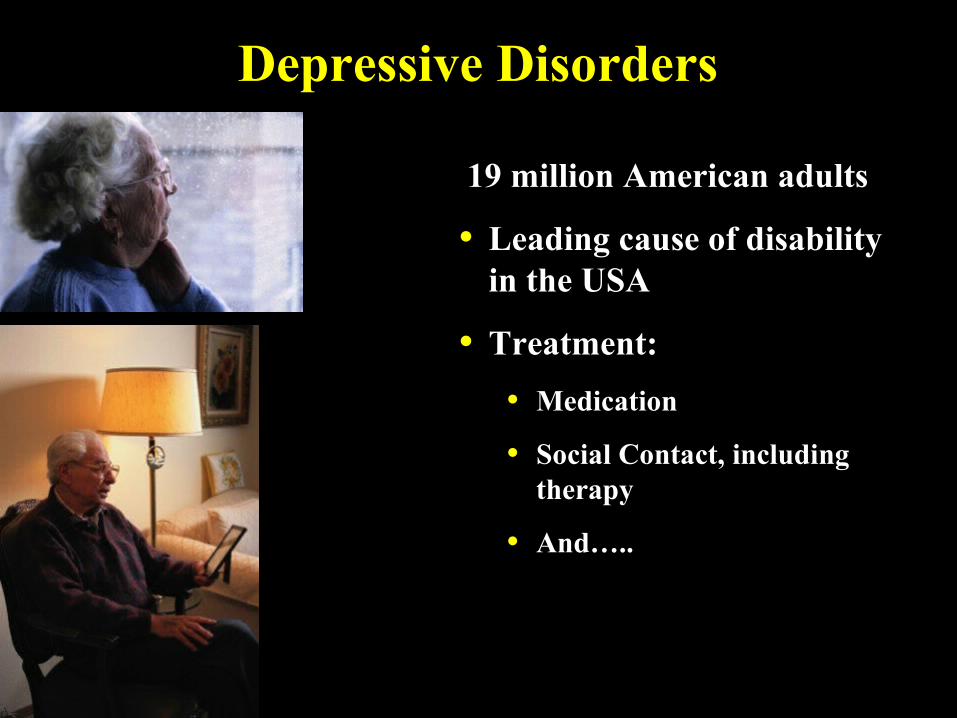
Depressive Disorders
19 million American adults
• Leading cause of disability in the USA
• Treatment:
• Medication
• Social Contact, including therapy
• And…..

“There is No There There”…Gertrude Stein
Fifty percent of all American cities are now under concrete and asphalt. (In Los Angeles it is now 66 percent.)
Houston, Texas


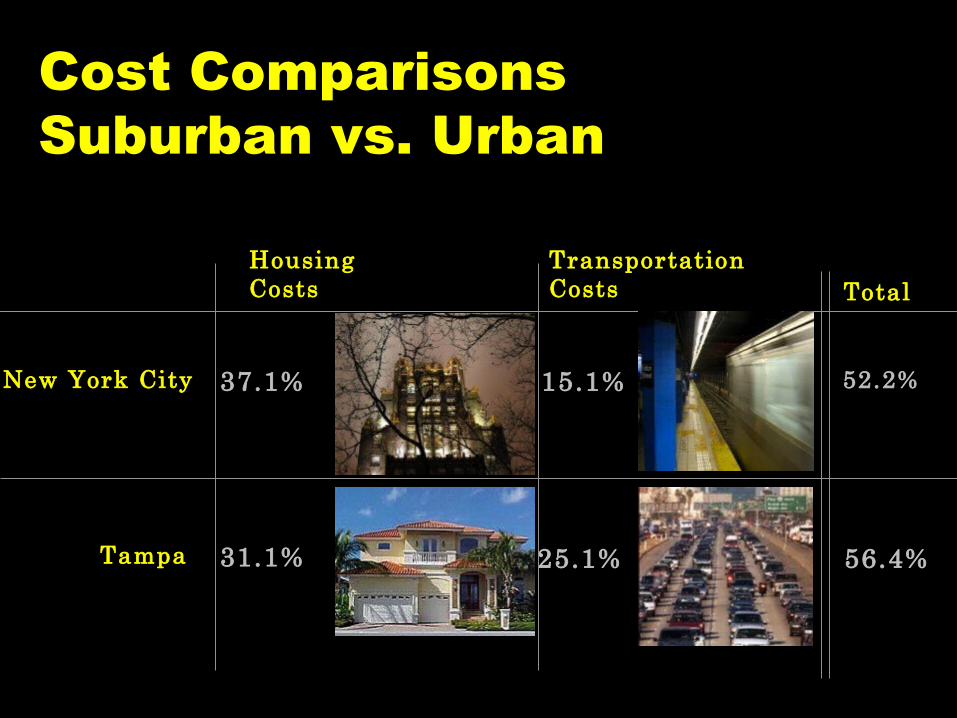
New York City
Tampa
Housing Costs
Transportation Costs
37.1% 15.1% 52.2%
31.1% 25.1% 56.4%
Total
Cost Comparisons Suburban vs. Urban

What got us into this mess?Many things -- No one is innocent
Bankers bundled and traded 500 shopping centers at a time, designed, not for “place” but to fit their definition of profitability.
Bankers bundled 5,000 homes at a time, all at set price points requiring 3 bedrooms and 2 baths. This was at a time when the average American family shrunk to 2.1.
As consumers we drove up house sizes to 2200 square feet
The highway guys built the roads to nowhere.
New York City
Tampa
Housing Costs
Transportation Costs
37.1% 15.1% 52.2%
31.1% 25.1% 56.4%
Total
Cost Comparisons Suburban vs. Urban

c. 1935 1980’s
Tyson's Corner, VA
Retail
Retail
Office
Residential
Residential

Retail
Office
Residential
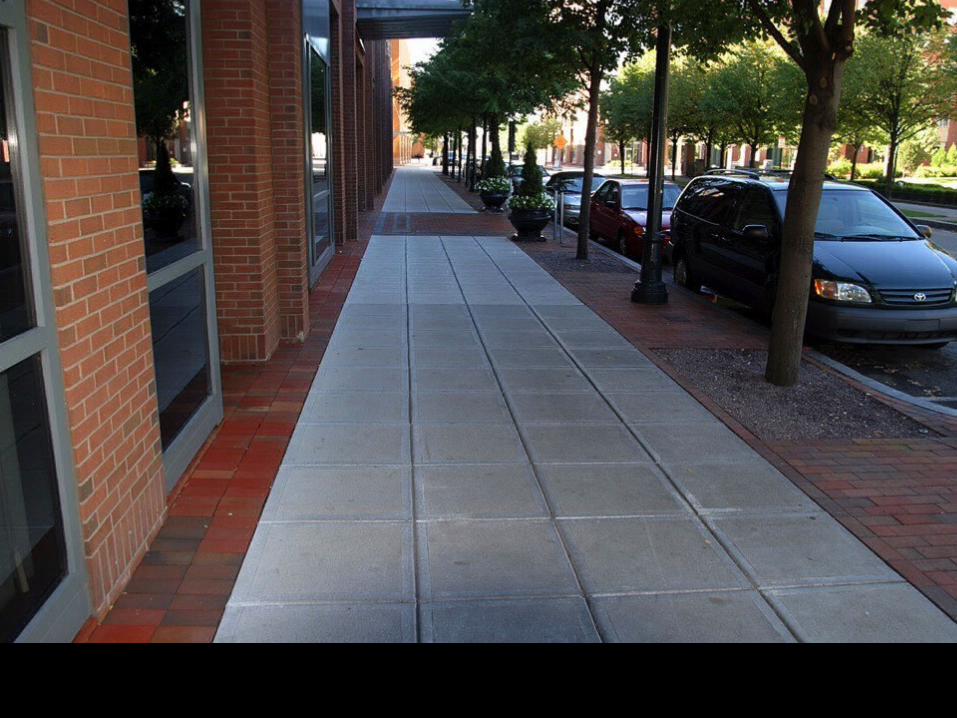
Washington, DCPublic Space
Trees
Sidewalks
Civic Statue
Historic Architecture

Fargo, North Dakota

Fargo, North Dakota


These are Cottages?

Such places do not sprout by happenstance. Driven by irresistible
economic forces and shaped by subtly shifting social patterns, they
are being created, down to the tiniest detail, by a handful of major
developers with a master plan for the new America. …. NY Times, August 15,
2005


Ten Steps To WalkabilityC o m p a c t , l iv e ly t o w n c e n t e r
L o w s p e e d s t r e e t s , d is t r ib u t e d v o lu m e s
N e ig h b o rh o o d s c h o o ls a n d p a r k s , w it h in o n e q u a r t e r m i le o r o n e e ig h t h m i le
P u b l ic p la c e s w it h in v i t in g f e a t u r e s : b e n c h e s , r e s t r o o m s , s h a d e , w a t e r a n d a r tC o n v e n ie n t , s a f e a n d e f f ic ie n t c r o s s in g s
A f f o r d a b le , in s p ir in g , w e l l m a in t a in e d s t r e e t s a n d h o m e s .
L a n d u s e a n d t r a n s p o r t a t io n p a r t n e r s h ips
C e le b r a t e d p u b l ic s p a c e a n d p u b l ic l i f e , p a r a d e s , m a r k e t s , f e s t iv a ls , a w a r d s
M a n y p e o p le o f a l l a g e s a n d a b i l i t ie s w a lk in g m a n y h o u r s
F in e g r a in e d s t r e e t s , m a n y t r a i l s , t r a n s i t l in k s

Future Growth Area - Salinas
General Plan
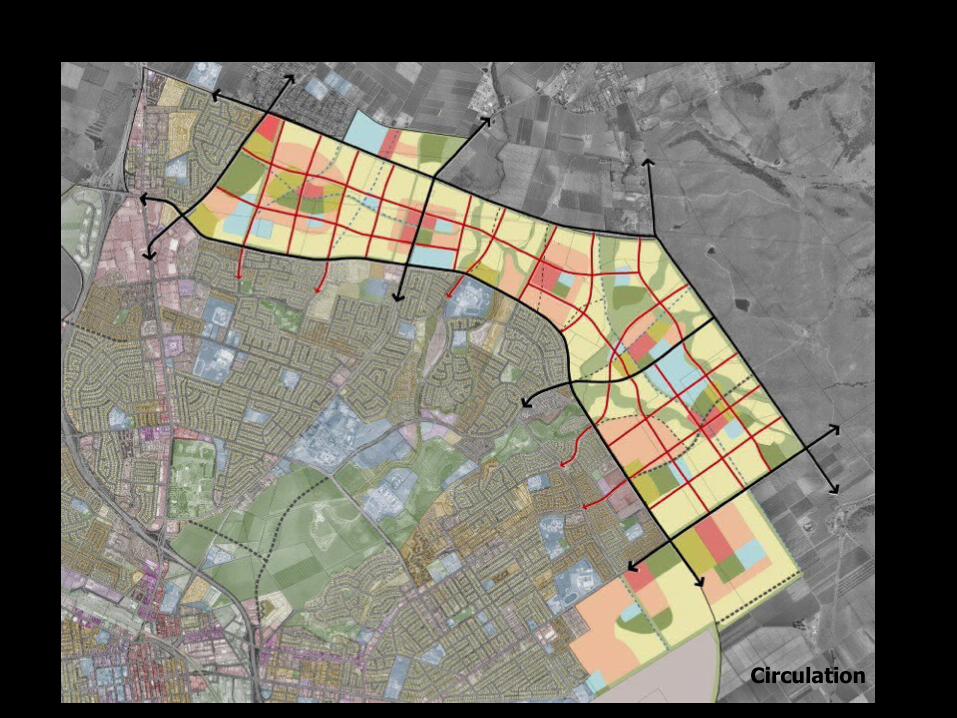
Circulation
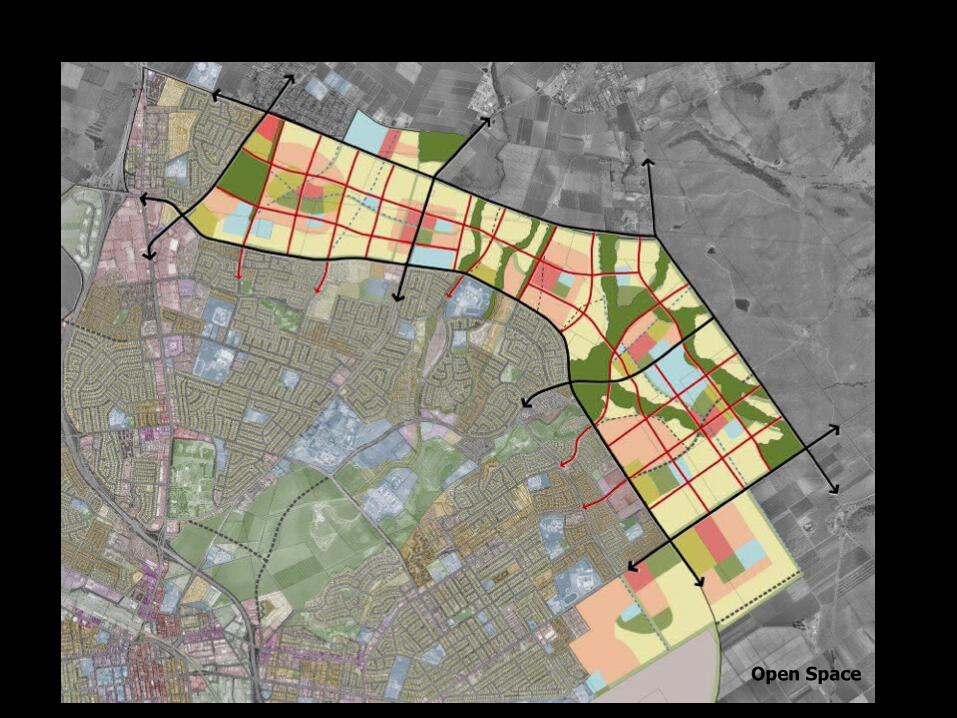
Open Space

Town Centers

Neighborhood Centers, Schools


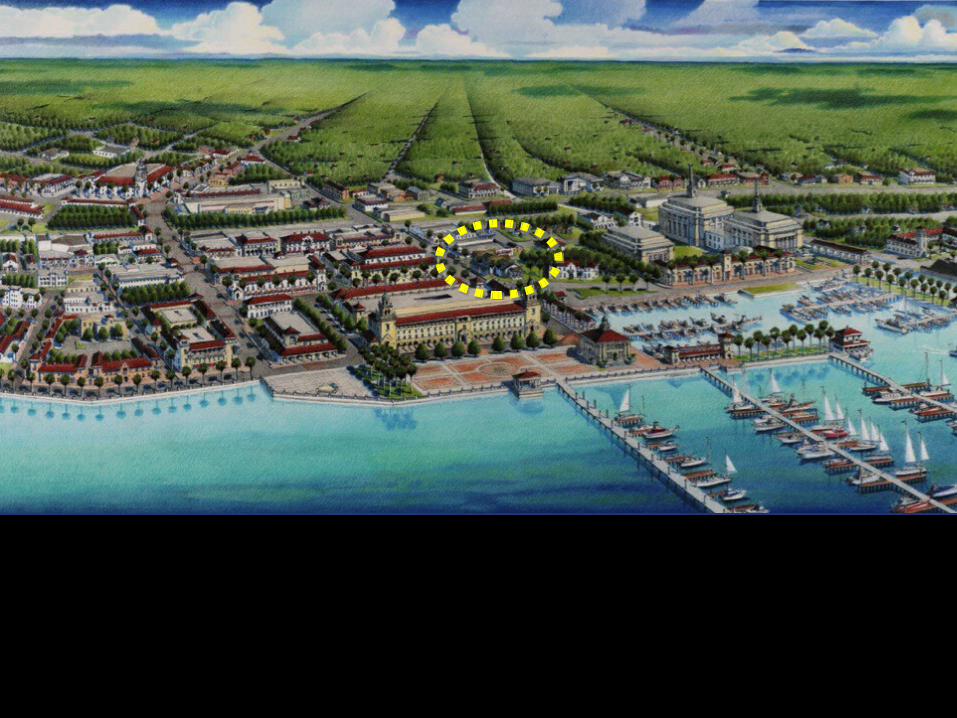
Based on the 1928 drawings by James Perry
The intensity of uses should gravitate away from the neighborhood center
Townhouses frame the square while open space provides an outdoor environment for nearby residents
The largest lots of the TND can be at the edge
In these cases where a TND is bordered by a principal street higher intensity uses such as medium density housing can be used in creating the edge
Civic buildingsShould be terminate street or open space vistas

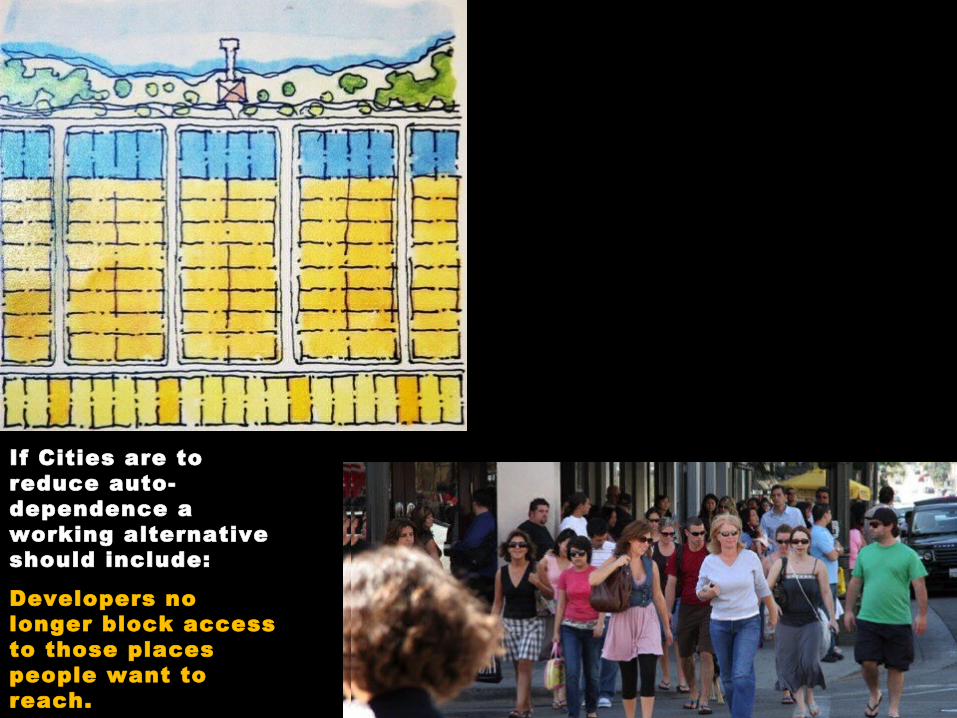
If Cities are to reduce auto-dependence a working alternative should include:
Developers no longer block access to those places people want to reach.

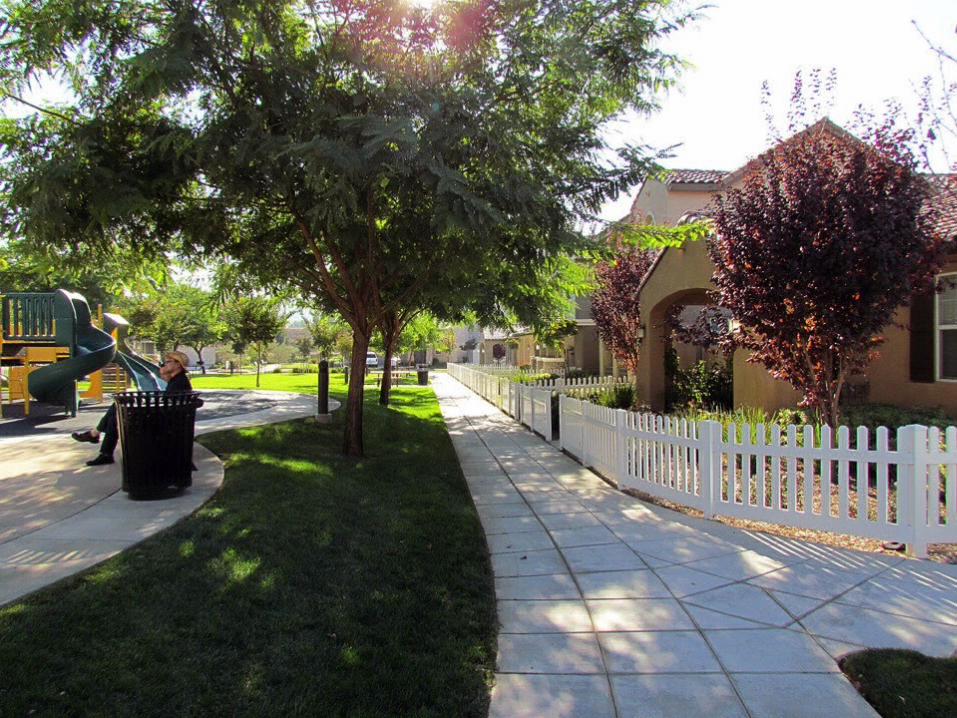
Meriam Park, Chico, California

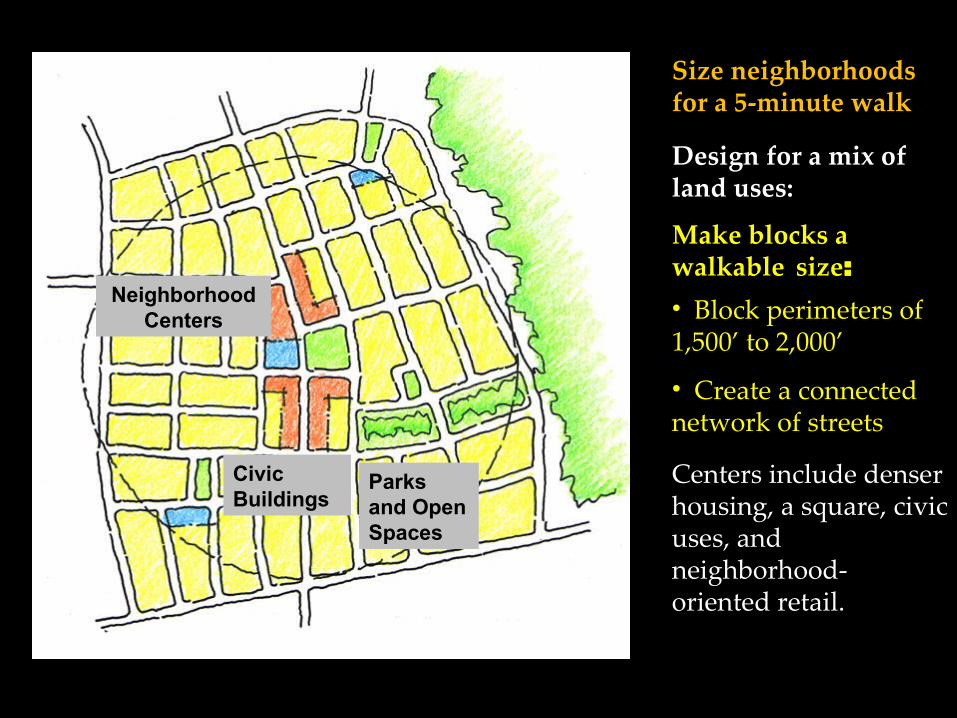
Size neighborhoods for a 5-minute walk
Make blocks a walkable size:• Block perimeters of 1,500’ to 2,000’
• Create a connected network of streets
Design for a mix of land uses:
Centers include denser housing, a square, civic uses, and neighborhood- oriented retail.
Civic Civic BuildingsBuildings
Neighborhood Neighborhood CentersCenters
Parks Parks and Open and Open SpacesSpaces

Internal Trips 100%
External Trips 95%
Internal Trips 60-90%
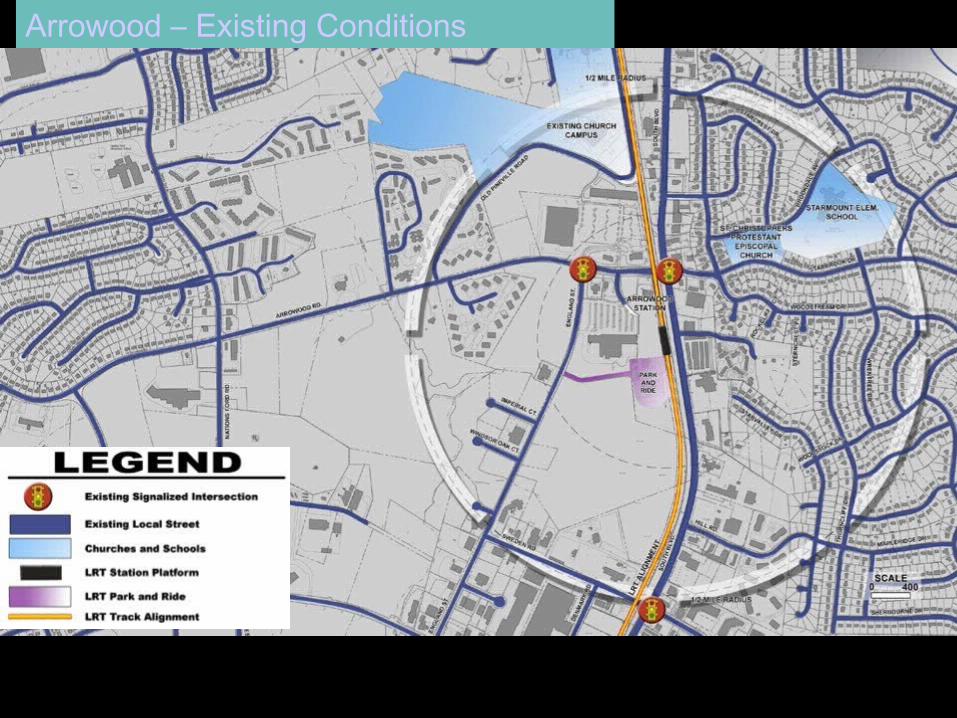
Arrowood – Existing Conditions

Arrowood Bicycle Vision
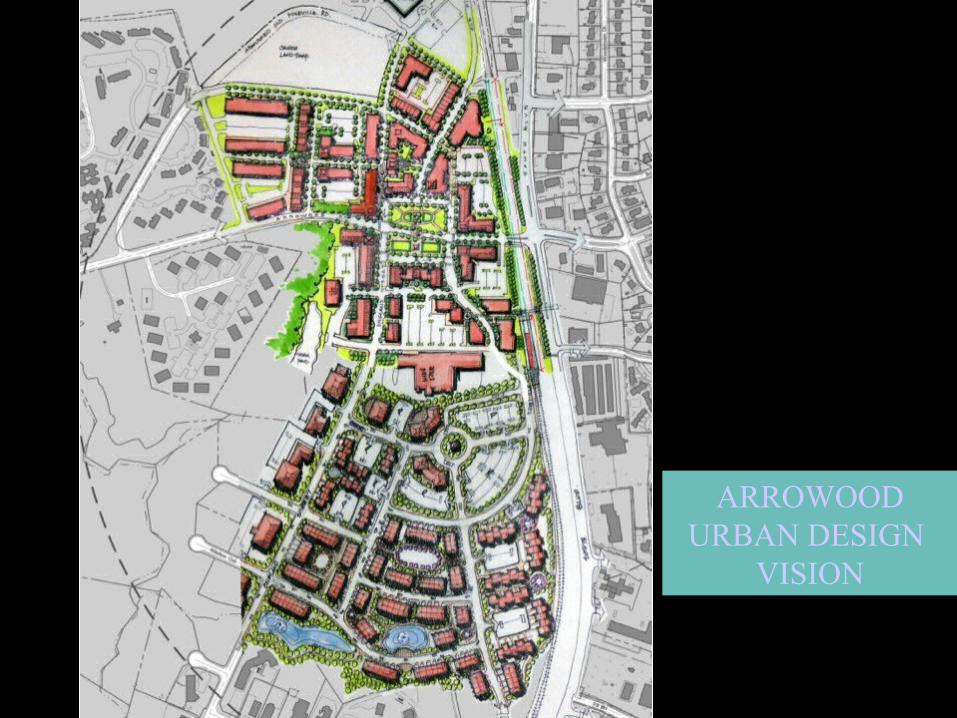
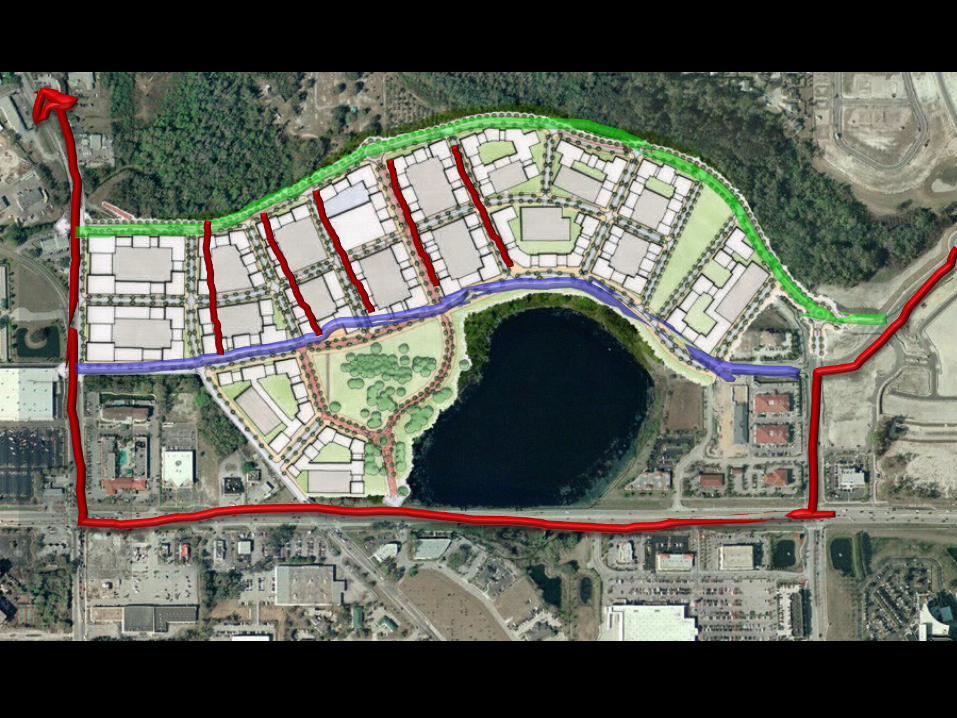
ARROWOOD URBAN DESIGN
VISION

Land Use Pattern Affects Travel Higher Density can reduce Vehicle Trips
0.0
2.0
4.0
6.0
8.0
0.0 20.0 40.0 60.0 80.0 100.0 120.0Density in Units/Acre
Trips
/ Ho
useh
old (A
DT)
Source: John Holtzclaw, PhD, Sierra Club
Vehicle Trips
Walking Trips
Significant reduction in VMT as we go from 3-4 units/acre to over 20 units/acre
6-7 du/a
7-10 du/a
11-18 du/a
2-3 du/a20 du/a


Connectivity Requirements - Examples
Link-node ratio of 1.44
Virginia DOT

Connectivity Requirements
Compact Area Type for Network Additions
• Link-Node Ratio of 1.6 or greater
• One external connection as well as an additional external connection and stub-out per 50 links or fraction thereof
Virginia DOT

Connectivity Requirements
Suburban Area Type for Network Additions
• Link-Node Ratio of 1.4 or greater
• One external connection as well as an additional external connection and stub-out per 50 links or fraction thereof
Virginia DOT
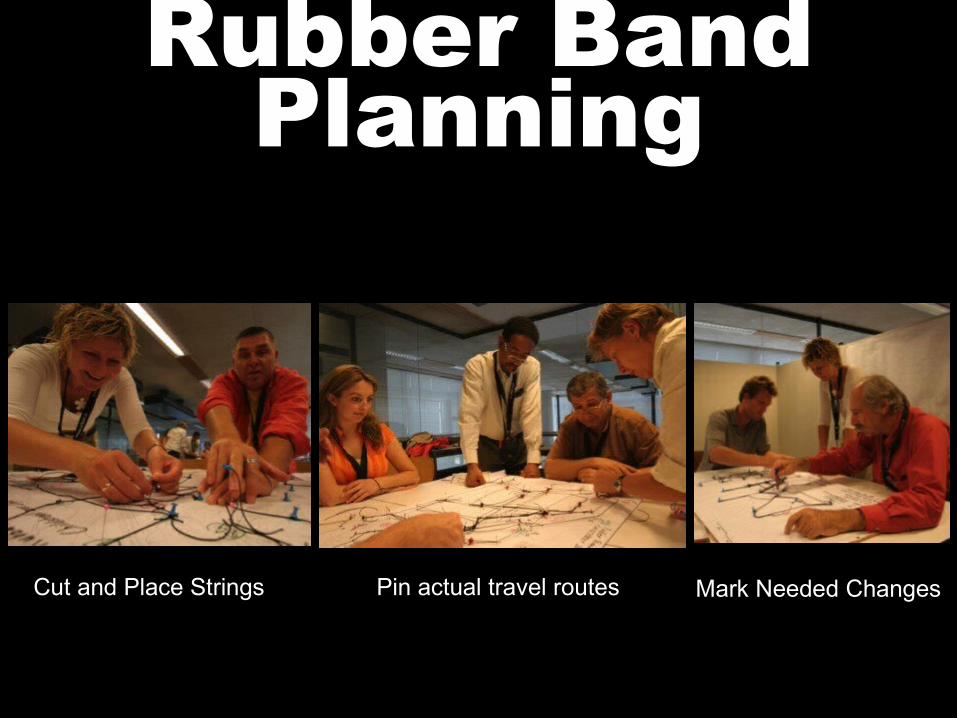
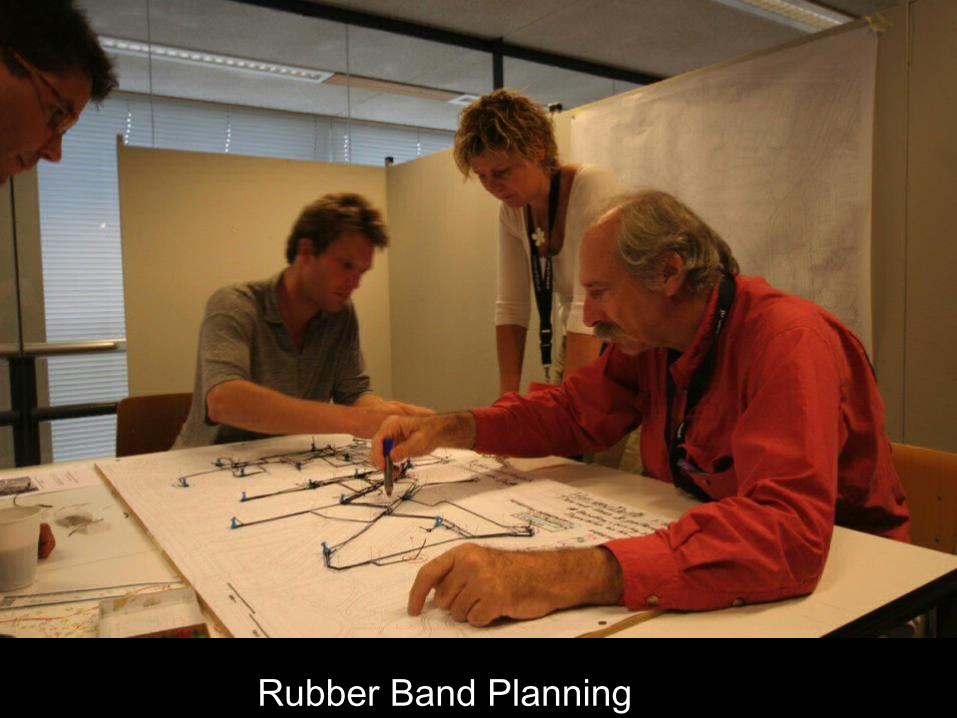
Rubber Band Planning
Cut and Place Strings Pin actual travel routes Mark Needed Changes

Rubber Band Planning

Rubber Band Planning
Rubber Band Planning
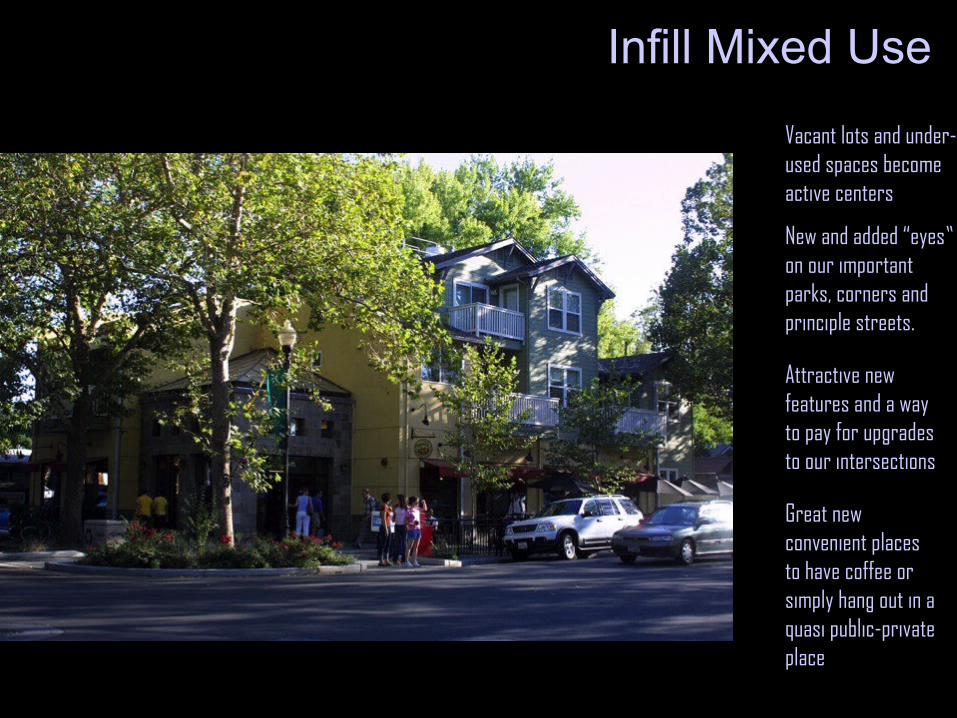
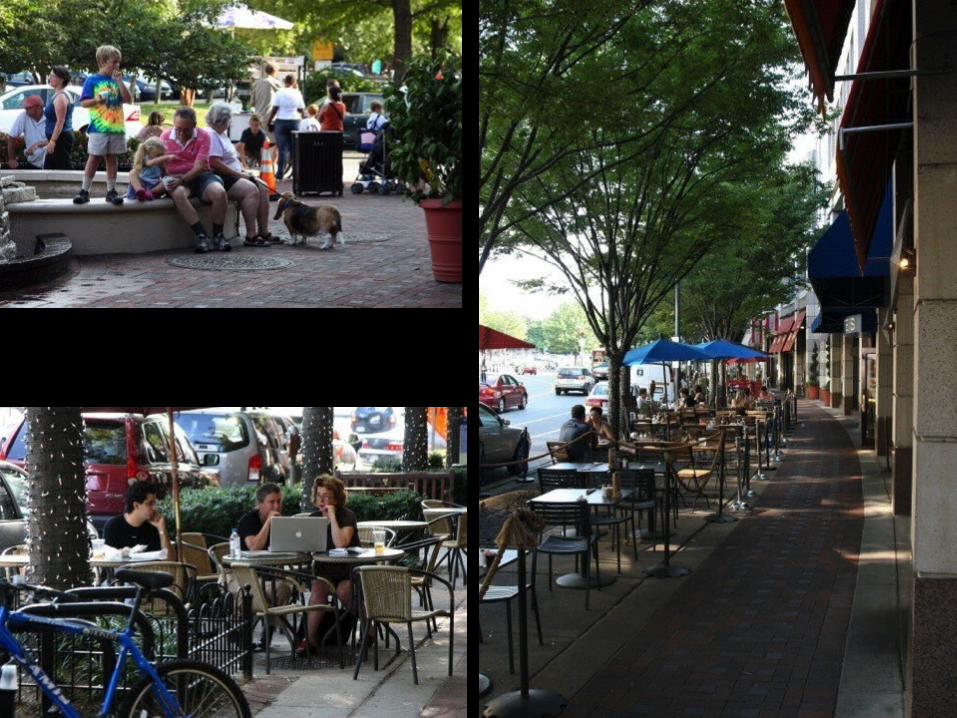
Infill Mixed Use Vacant lots and under-used spaces become active centers
New and added “eyes” on our important parks, corners and principle streets.
Attractive new features and a way to pay for upgrades to our intersections
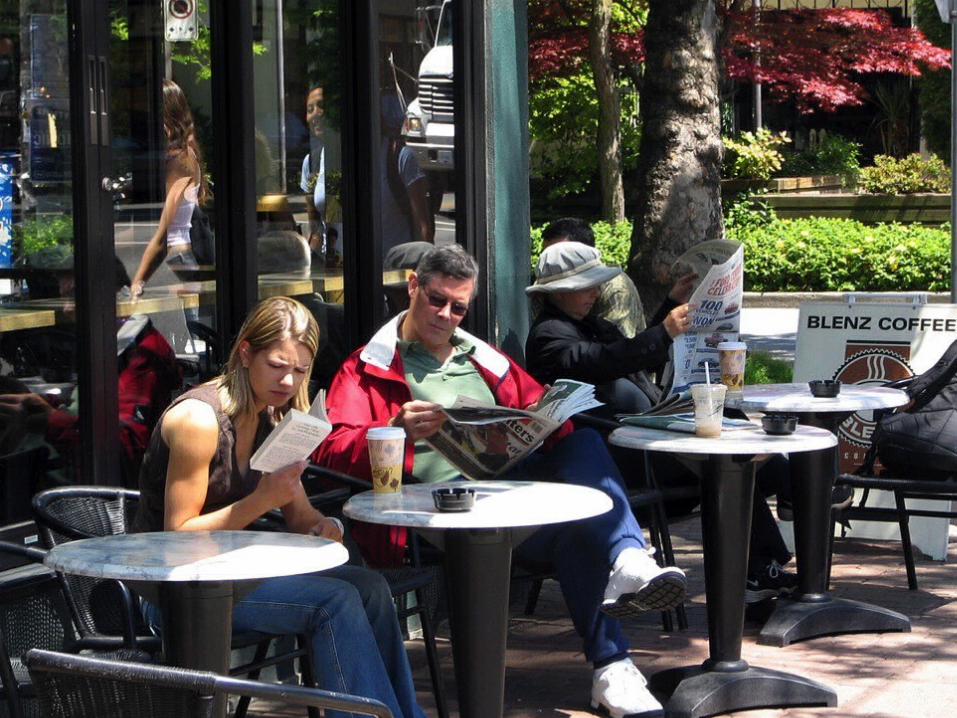
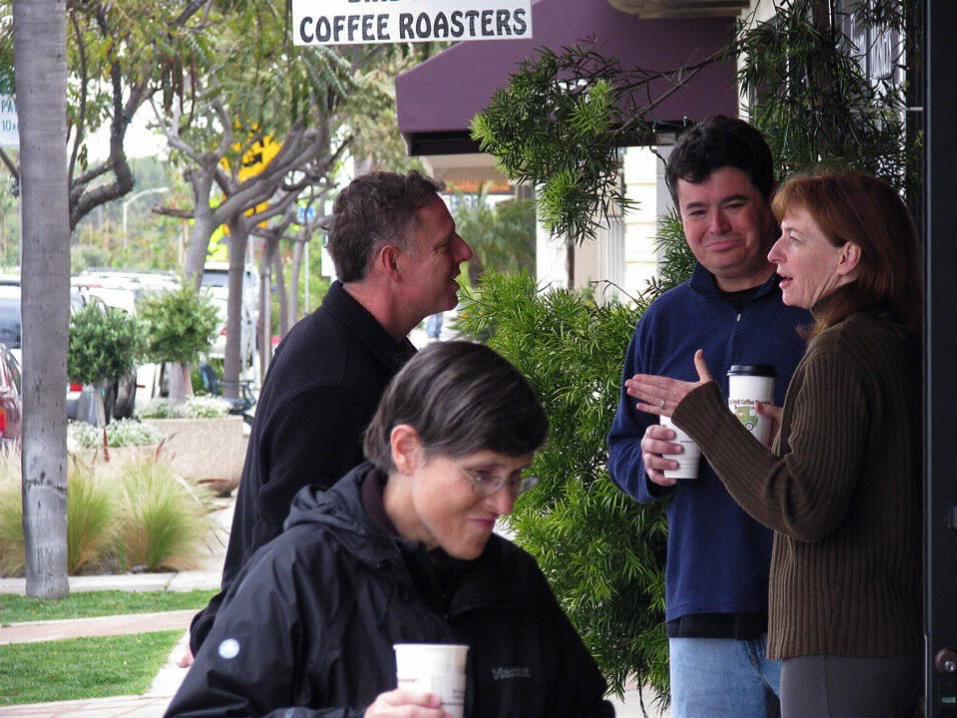
Great new convenient places to have coffee or simply hang out in a quasi public-private place

Davis, California


Well Designed Density
Urban-Advantage.com
What are the problems here?
Lack of SecurityLack of peopleLack of investment
Auto dependence
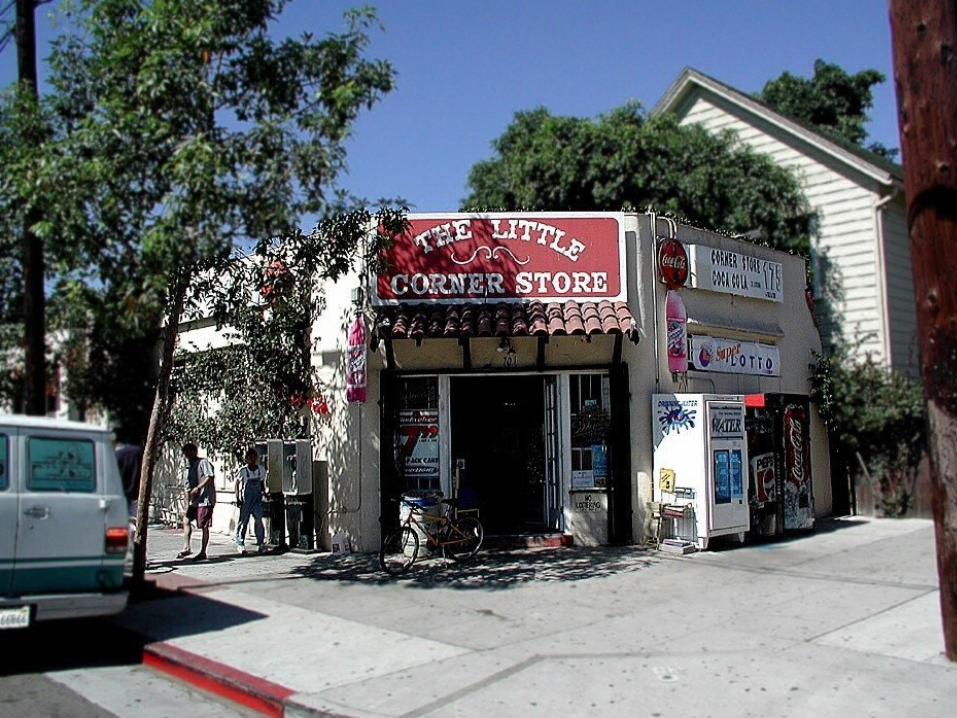
No place to buy a popsicle
Lack of diversityLack of activityLack of diversity


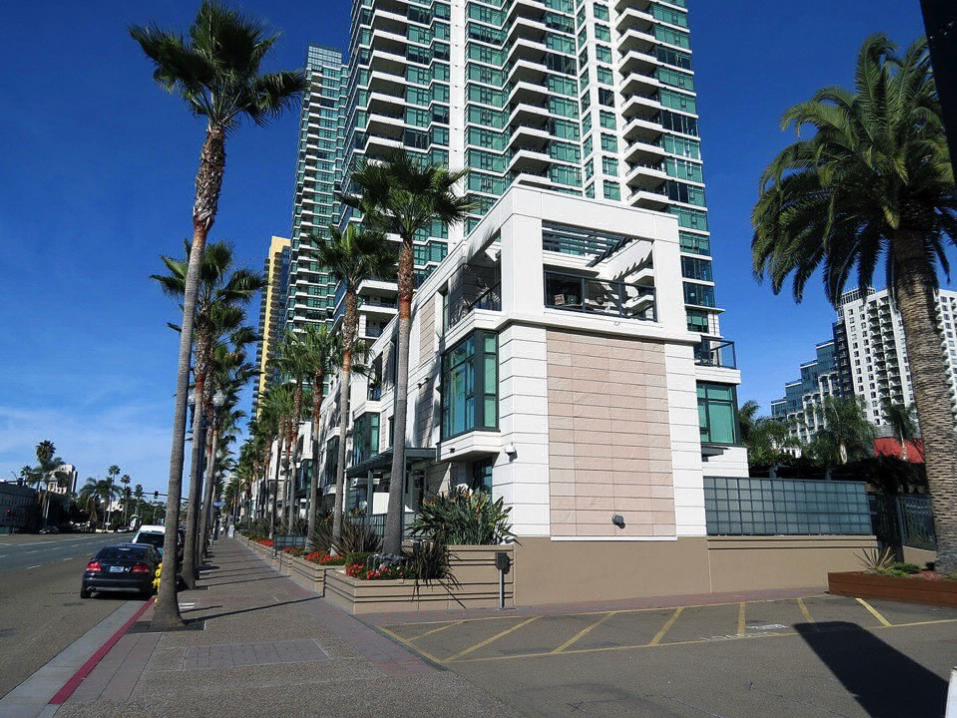
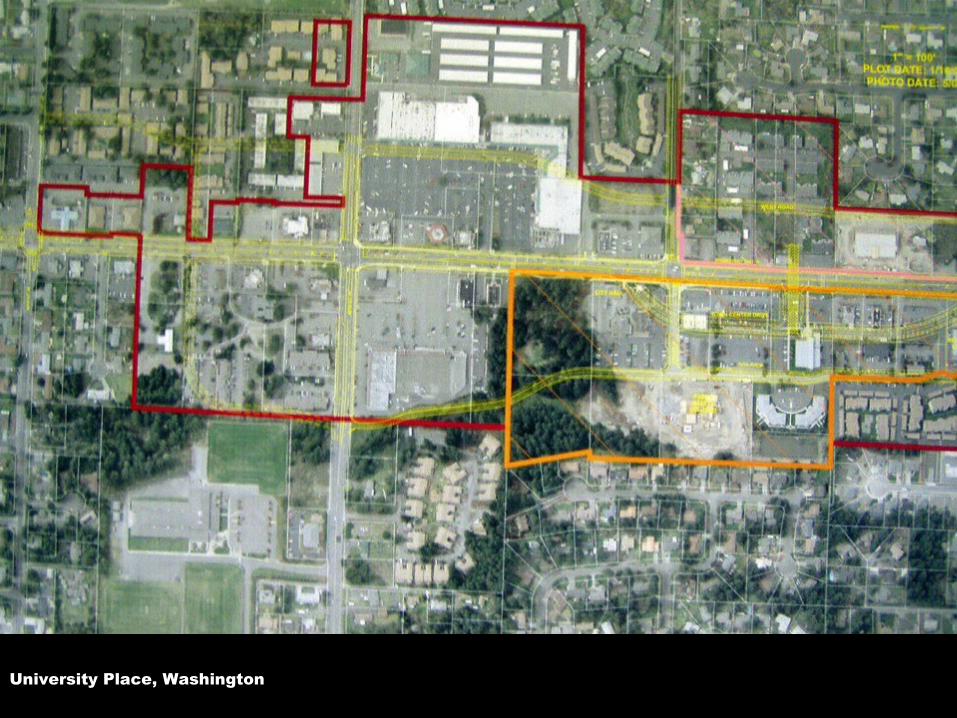
University Place, Washington


The B reakdown
Winter Park Village


O r la n d o A v e n u e
We b s t e r A v e .
L e e R d .
D e n n ing D
r .
So
lan
a A
v e.
W in t e r P a r k
V i l la g e
K M a r t
W in t e r P a r k
V o T e c h

O r la n d o A v e n u e
We b s t e r A v e .
L e e R d .
D e n n ing D
r .
W in t e r P a r k
V i l la g e
K M a r t
Residential Redevelopment
Mixed Use Redevelopment
Lee Road Extension
W.P.V. Development
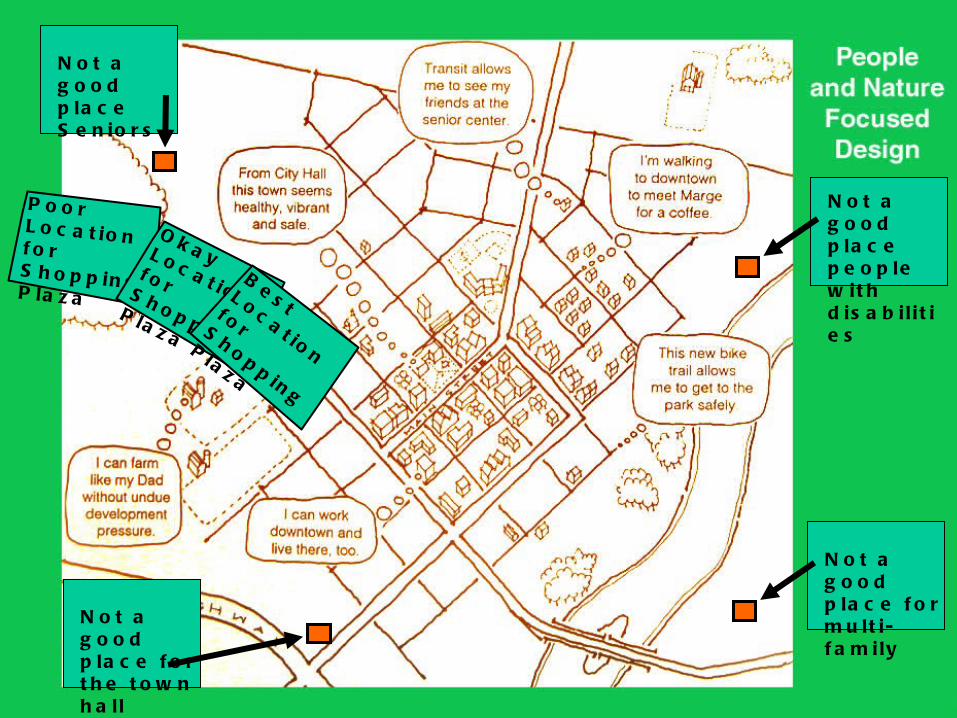
N o t a g o o d p la c e f o r m u lt i-f a m i ly
N o t a g o o d p la c e S e n io r s
N o t a g o o d p la c e p e o p le w it h d is a b i l i t ie s
N o t a g o o d p la c e f o r t h e t o w n h a l l
P o o r L o c a t io n f o r S h o p p in g P la z a
O k a y L o c a t io n
f o r S h o p p in g
P la z a
Be s t
L o c a t io n
f o r S h o p p in g
P la z a

An auto driven policy design for housing. This is ugly, wasteful of land, and it does not orient to transit

An transit driven policy design for housing. This is sociable, oriented to the transit stop, and the living space works for all.


If Cities are to reduce auto-dependence a working alternative should include:
Buildings no longer “moon” the street

Single-Use Commercial Buildings


New Port Village, Port Moody

New Port Village, Port Moody


Holcomb Bridge Rd.
Holcomb Bridge Rd.
Alp
har
ett
a H
wy.
Alp
har
ett
a H
wy.
Crossville Rd.
Crossville Rd.
Cra
ba
pp
le R
d.
Cra
ba
pp
le R
d.
Old Ala Rd.
Old Ala Rd.
Hembree Rd.Hembree Rd.
AzaleaAzalea
Pine Grove Rd.
Pine Grove Rd.
Marietta Hwy.
Marietta Hwy.
Woodstock R
d.
Woodstock R
d.
Riverside
Rd
.
Riverside
Rd
.
Hardscrabble Rd.
Hardscrabble Rd.
Houze R
d.
Houze R
d.
400400
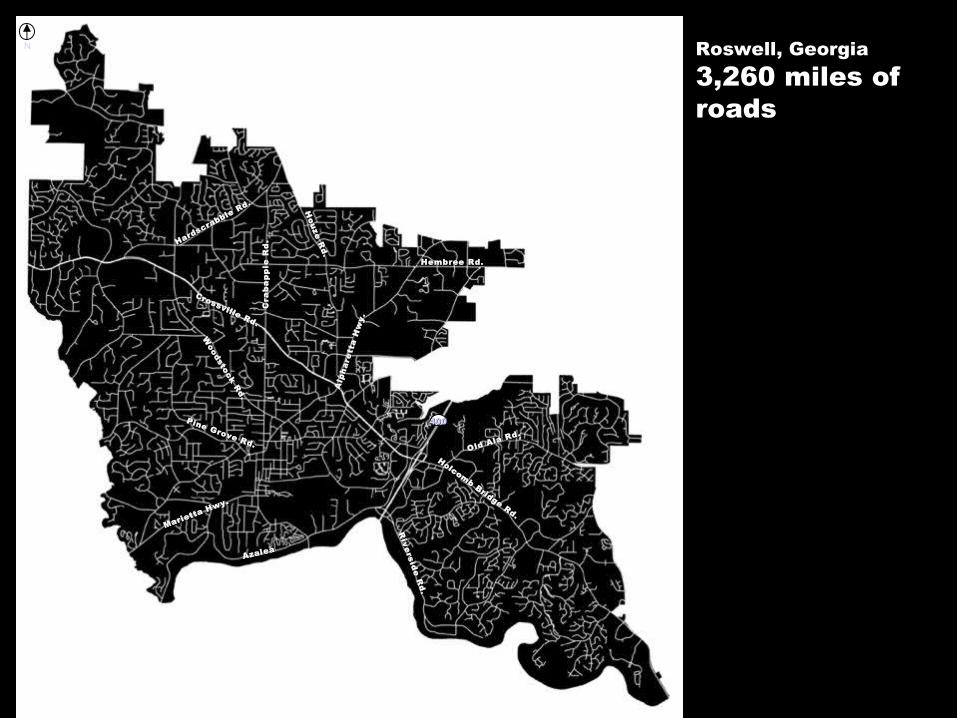
N Roswell, Georgia3,260 miles of roads

Holcomb Bridge Rd.
Holcomb Bridge Rd.
Alp
har
ett
a H
wy.
Alp
har
ett
a H
wy.
Crossville Rd.
Crossville Rd.
Cra
ba
pp
le R
d.
Cra
ba
pp
le R
d.
Old Ala Rd.
Old Ala Rd.
Hembree Rd.Hembree Rd.
AzaleaAzalea
Pine Grove Rd.
Pine Grove Rd.
Marietta Hwy.
Marietta Hwy.
Woodstock R
d.
Woodstock R
d.
Riverside
Rd
.
Riverside
Rd
.
Hardscrabble Rd.
Hardscrabble Rd.
Houze R
d.
Houze R
d.
400400
N Roswell, Georgia3,260 miles of roads760 miles connect
Only 22% of roads are doing the heavy lifting


32nd STREET BARRICADE

32nd STREET BARRICADE
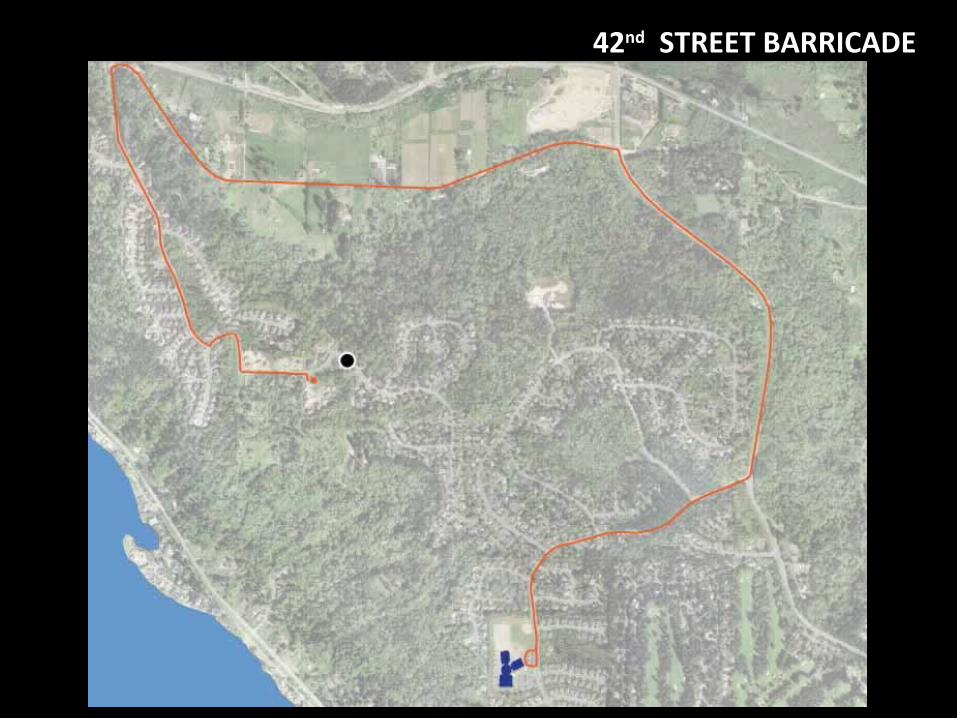
42nd STREET BARRICADE

42nd STREET BARRICADE

2006 VOLUMES

2030 VOLUMES
W/OUT CONNECTORS

2030 VOLUMES
WITH CONNECTORS
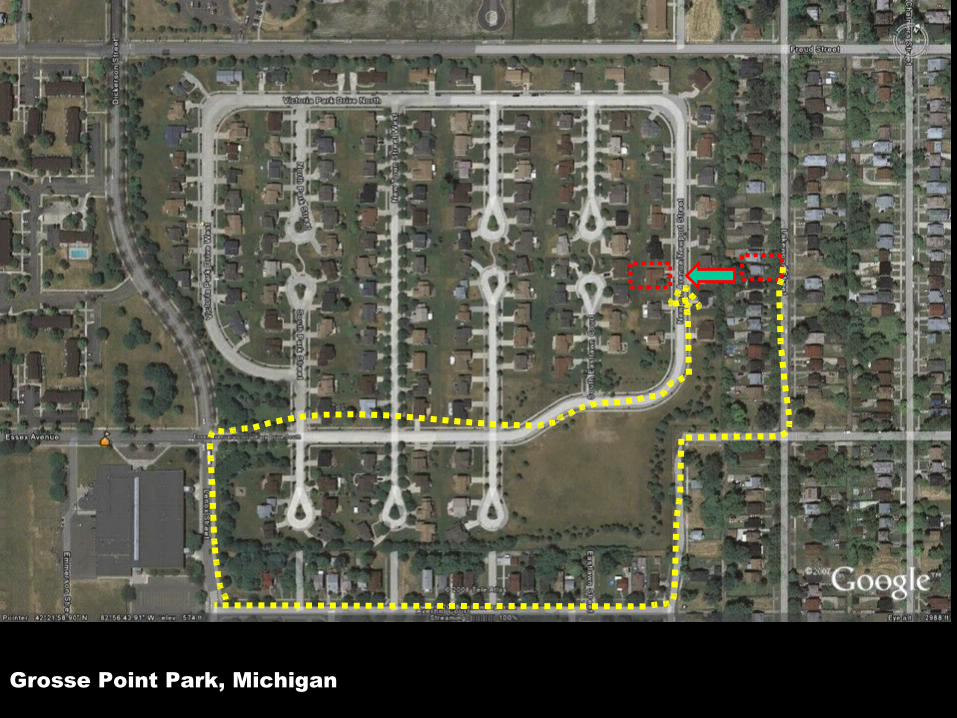
Grosse Point Park, Michigan

Connectivity Requirements - Examples
Link-node ratio of 1.44
Virginia DOT

Connectivity Requirements
Compact Area Type for Network Additions
• Link-Node Ratio of 1.6 or greater
• One external connection as well as an additional external connection and stub-out per 50 links or fraction thereof
Virginia DOT


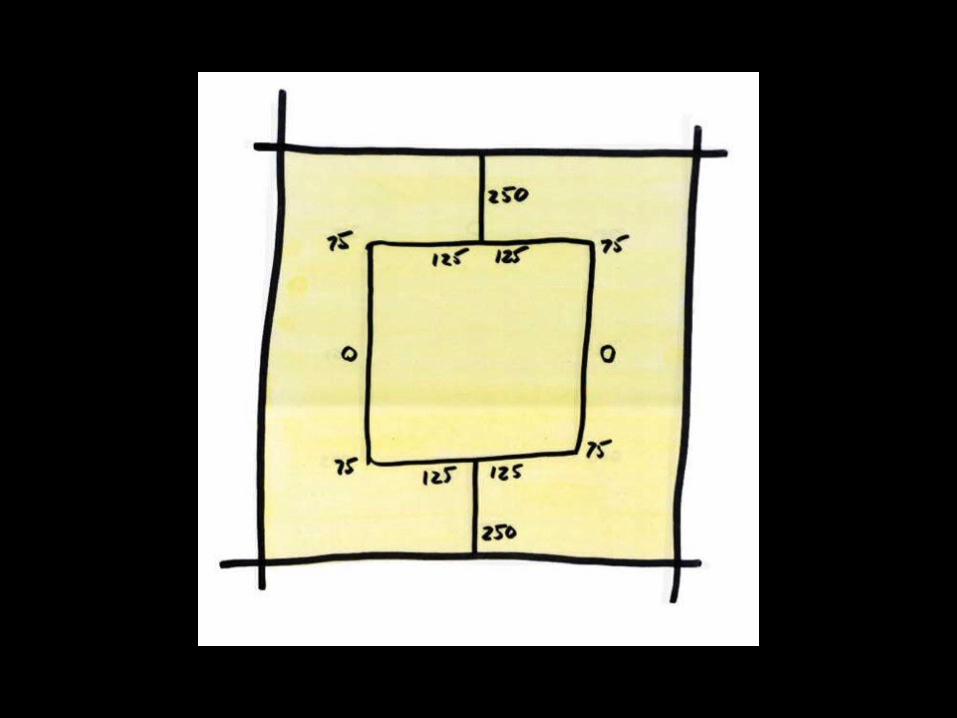
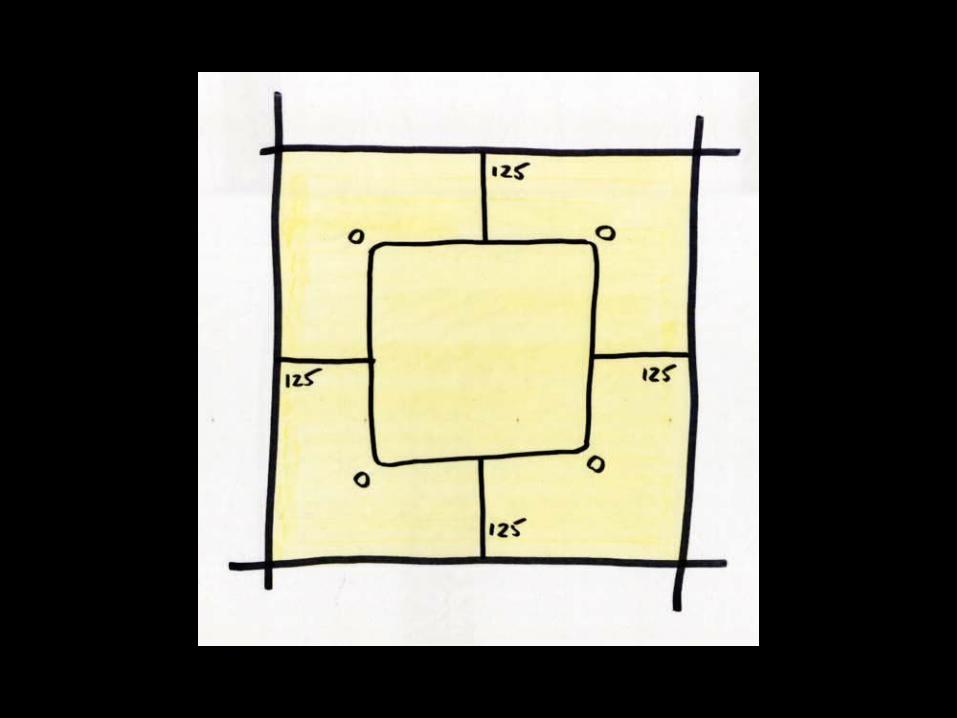
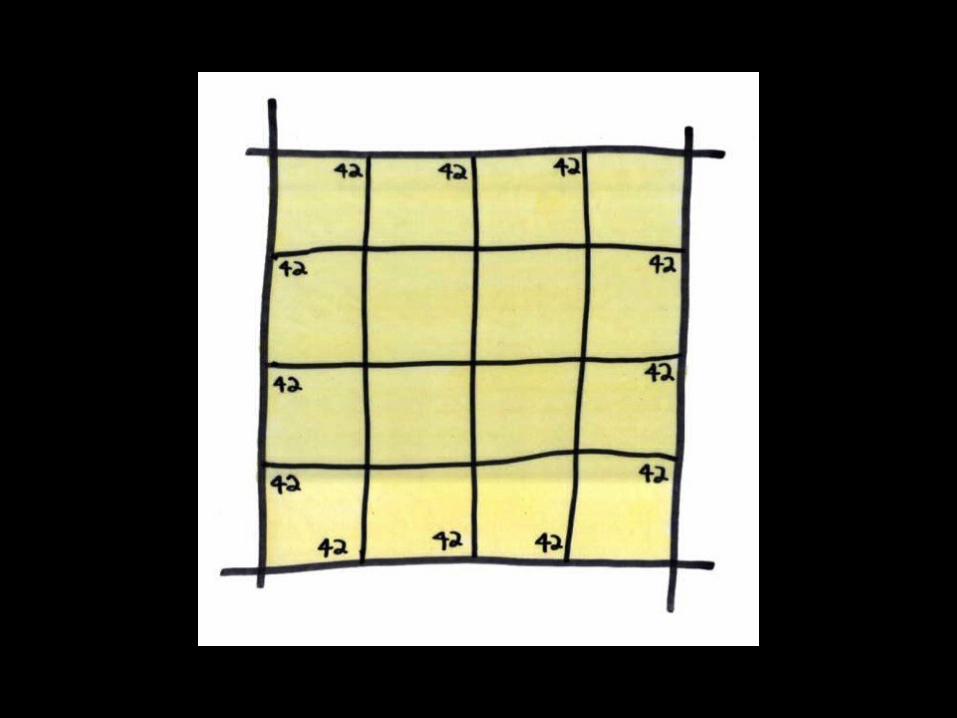
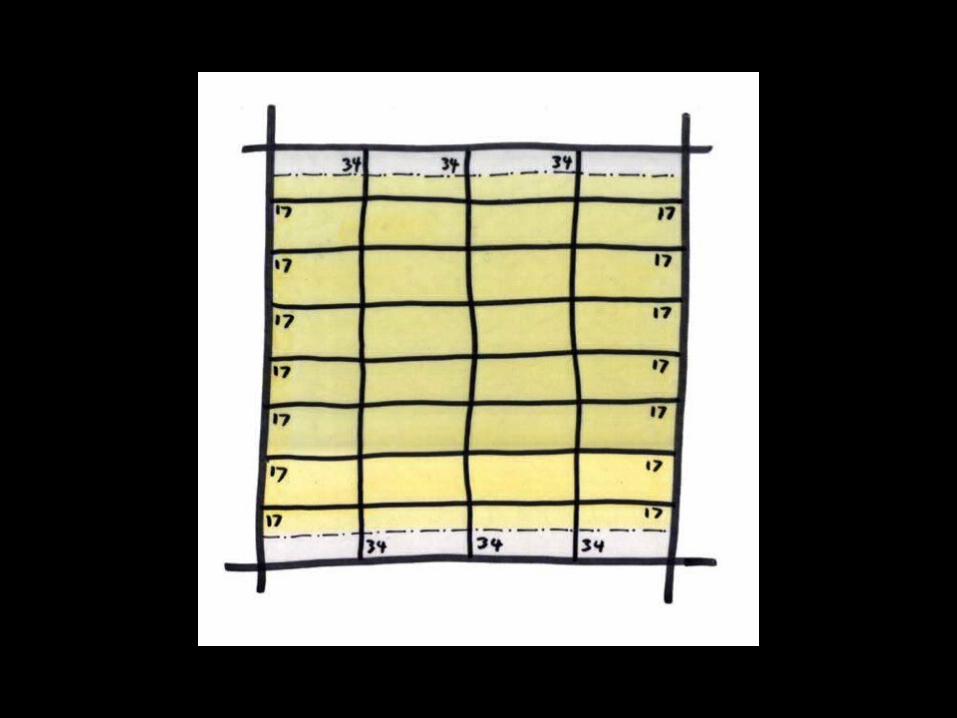
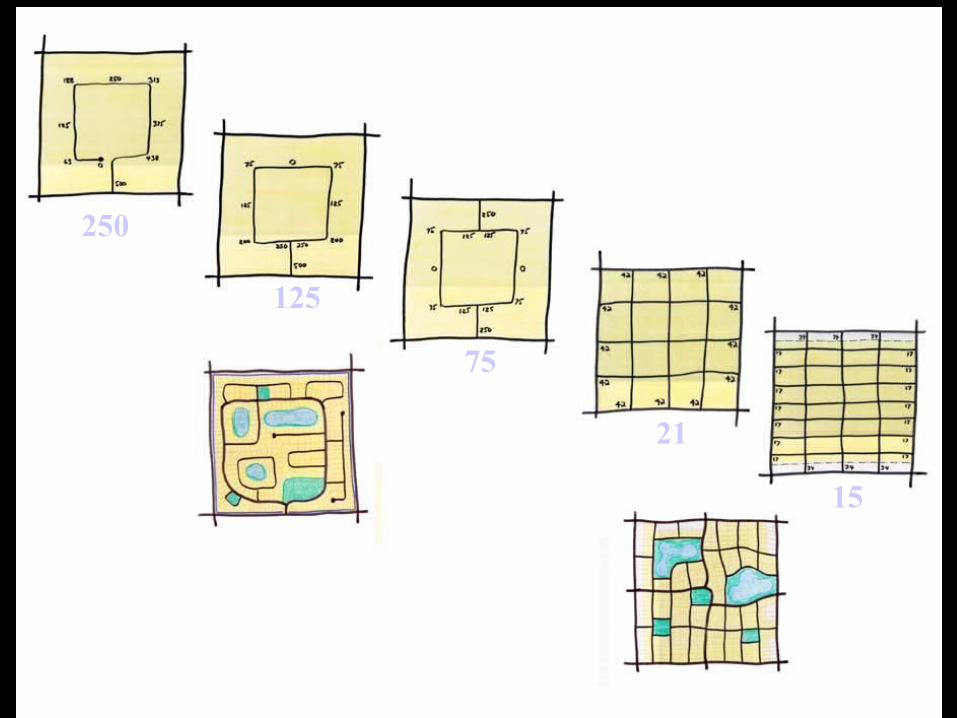
250
125
75
21
15

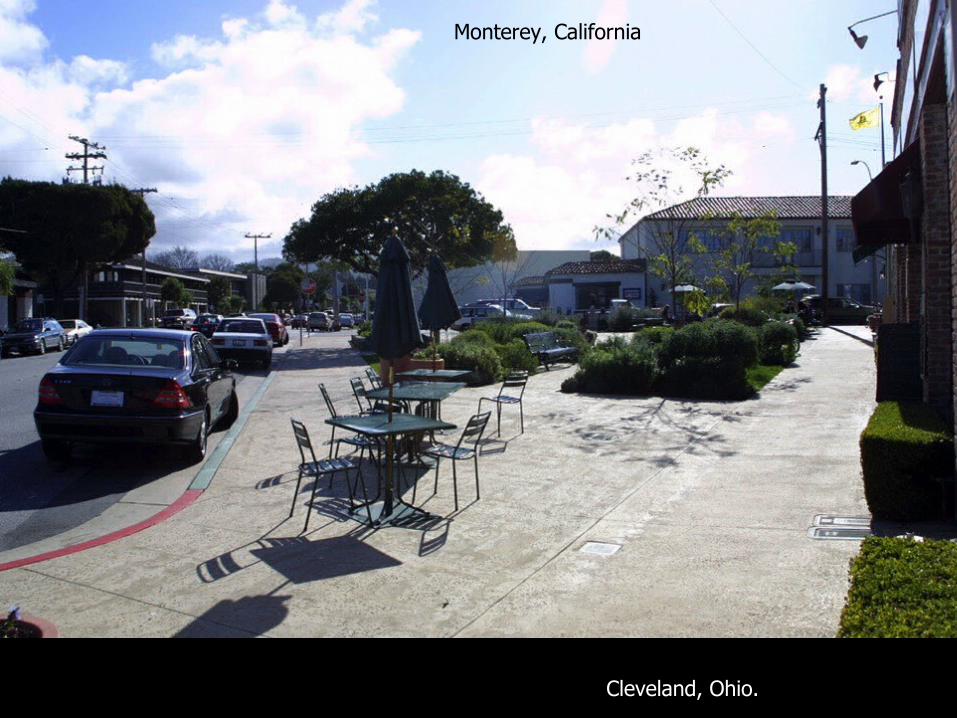
Cleveland, Ohio.
Monterey, California

Monterey, California


What is the Purpose of Cities?

How Do I get There (Wayfinding and Orientation)
Wayfinding and navigation Does the design of this station, equipment and layout get me there?


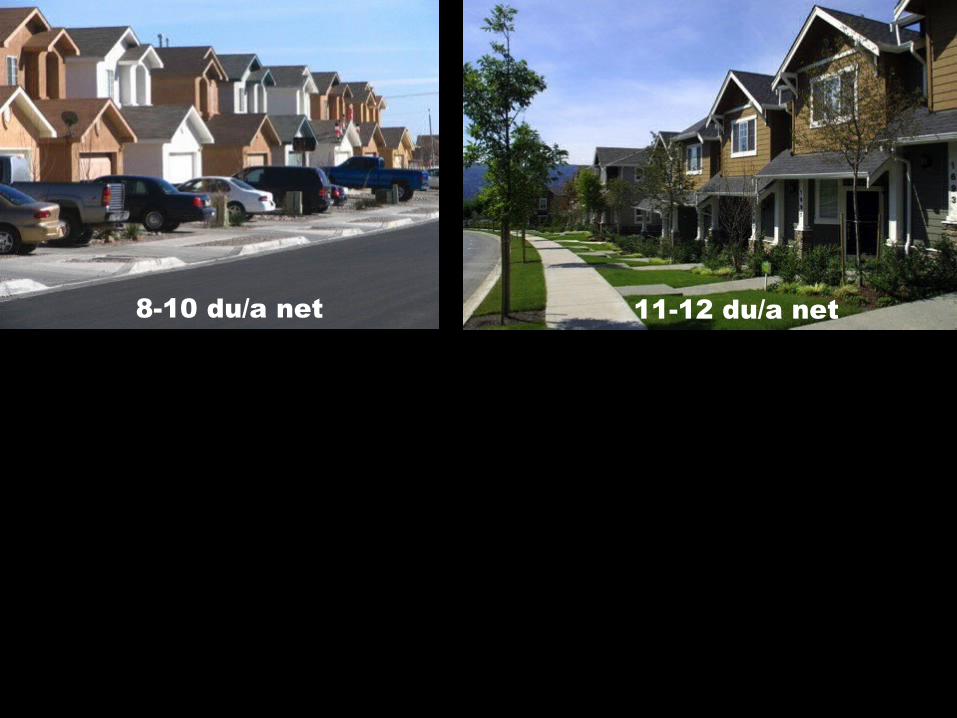
11-12 du/a net8-10 du/a net

Meriam Park, Chico, California

Complete Streets


Chico, CA
Nord Avenue
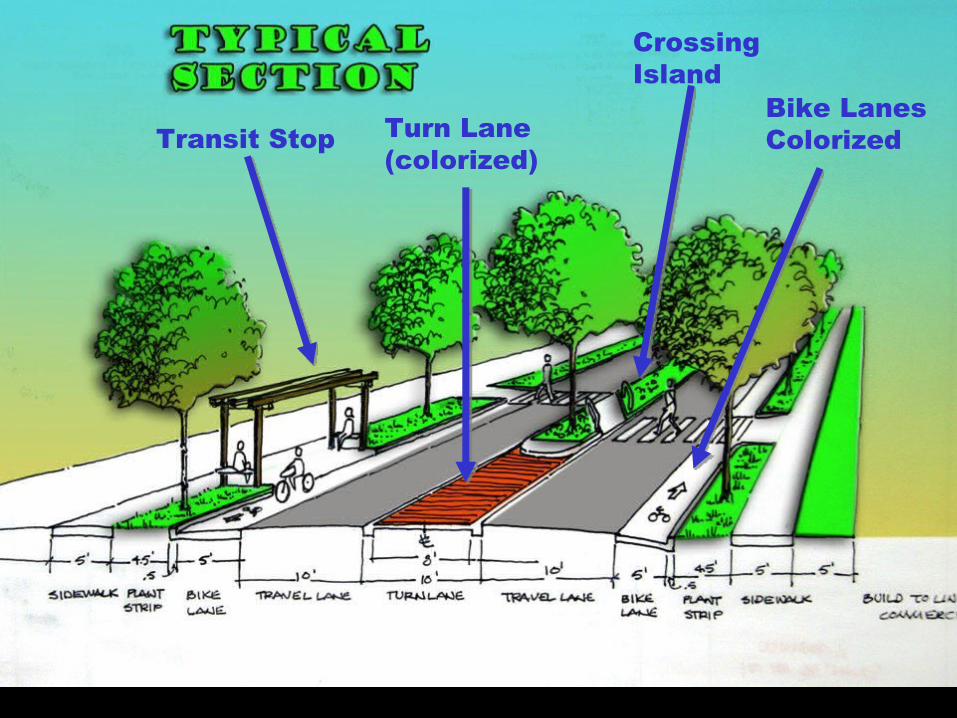
Crossing Island
Bike Lanes ColorizedTurn Lane
(colorized)Transit Stop


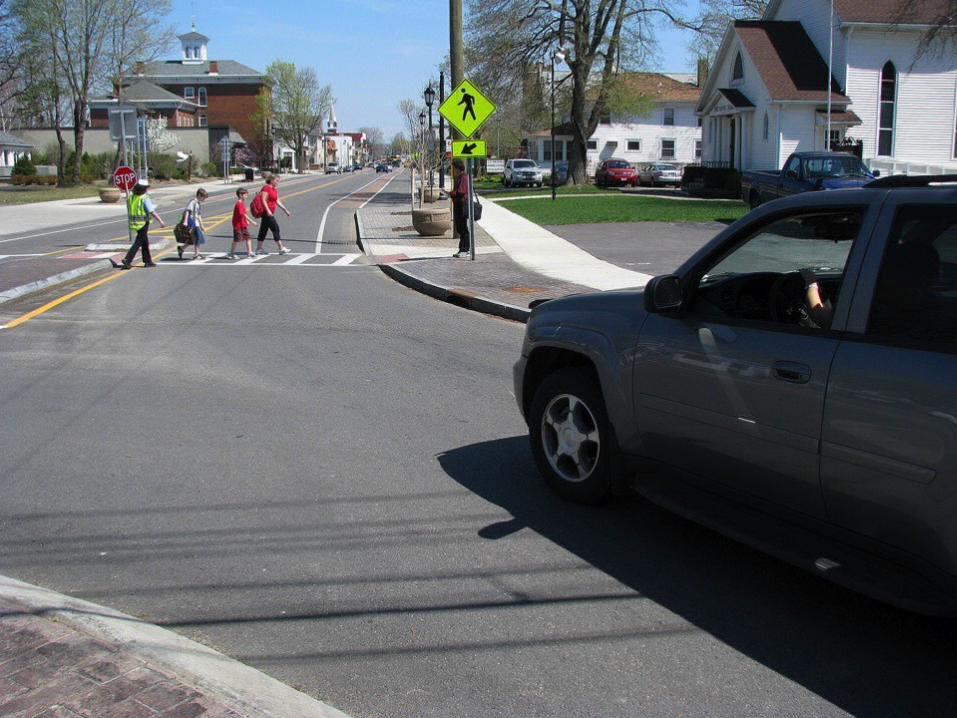


Washington’s First Roundabout was placed at a school

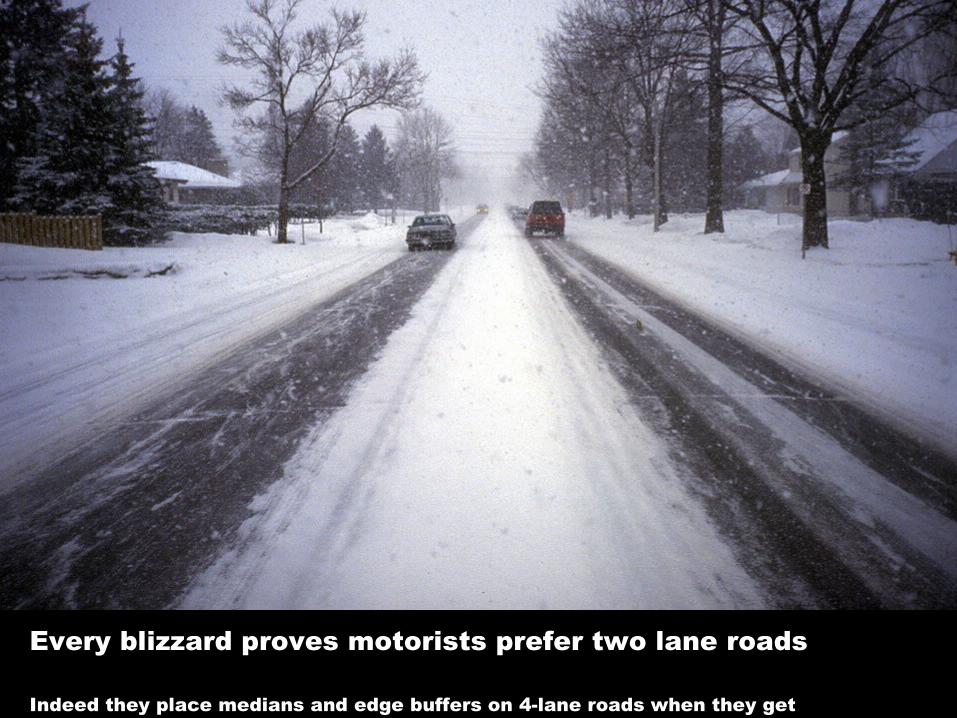
Every blizzard proves motorists prefer two lane roads Indeed they place medians and edge buffers on 4-lane roads when they get to design them (before snow plows arrive). So why not convert to 2-3 lanes, when conditions allow?
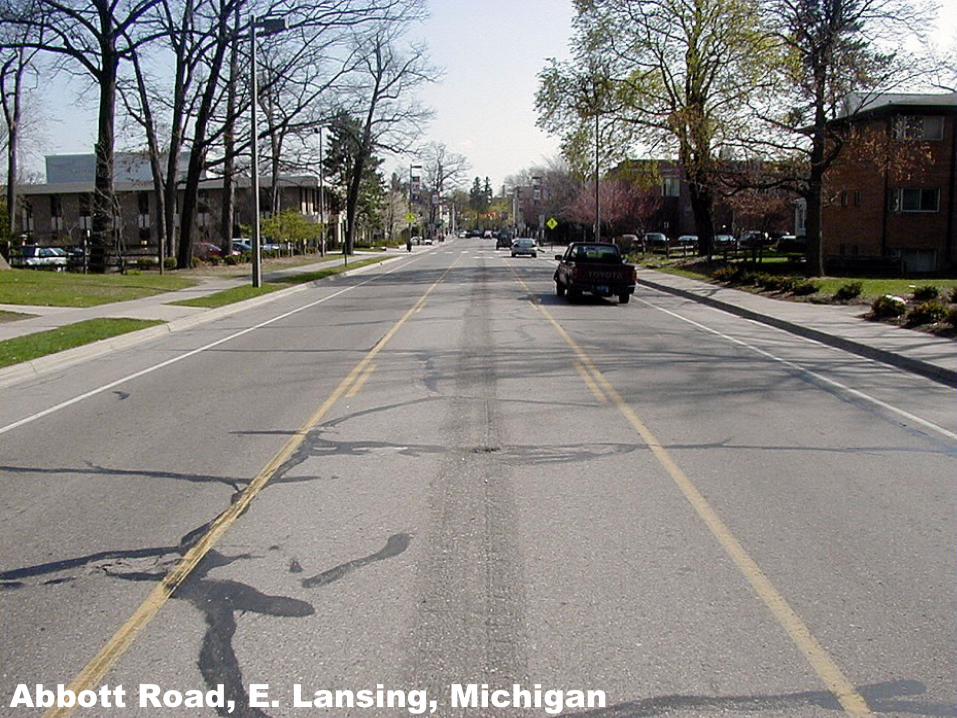
Abbott Road, E. Lansing, Michigan

California Street, Mountain View, California

Hartford, ConnecticutSpeed reductions of 3-7
mph are common

This 5-lane Main Street was converted to…This 5-lane Main Street was converted to…
Pottstown PAPottstown PA
This:This: One less travel lane; bike lanes; parallel to back-in One less travel lane; bike lanes; parallel to back-in diagonal parking on one side; new pavementdiagonal parking on one side; new pavement
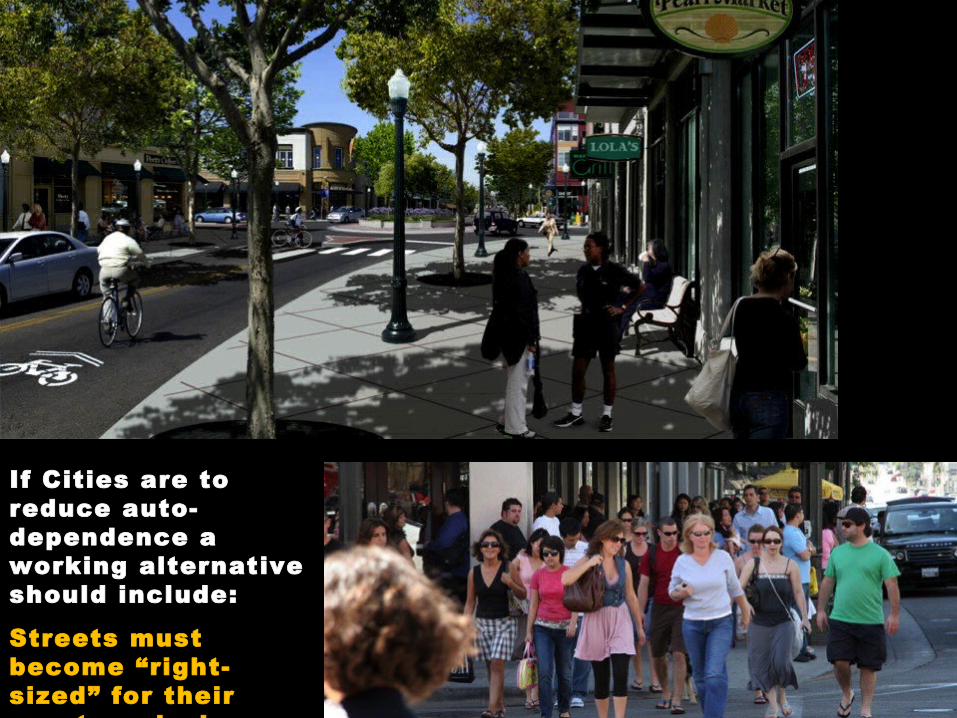
If Cities are to reduce auto-dependence a working alternative should include:
Streets must become “right-sized” for their greater mission.

LaJolla Boulevard, Birdrock, San Diego, CA

LaJolla Boulevard, Birdrock, San Diego, CA

LaJolla Boulevard, Birdrock, San Diego, CA

LaJolla Boulevard, Birdrock, San Diego, CA

LaJolla Boulevard, Birdrock, San Diego, CA
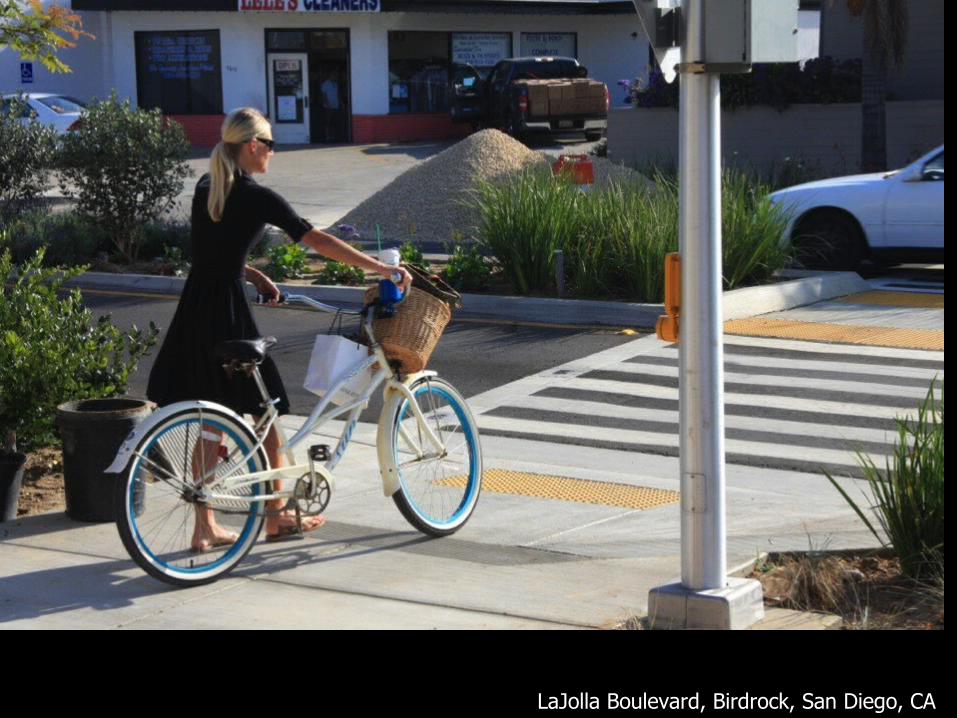
LaJolla Boulevard, Birdrock, San Diego, CA
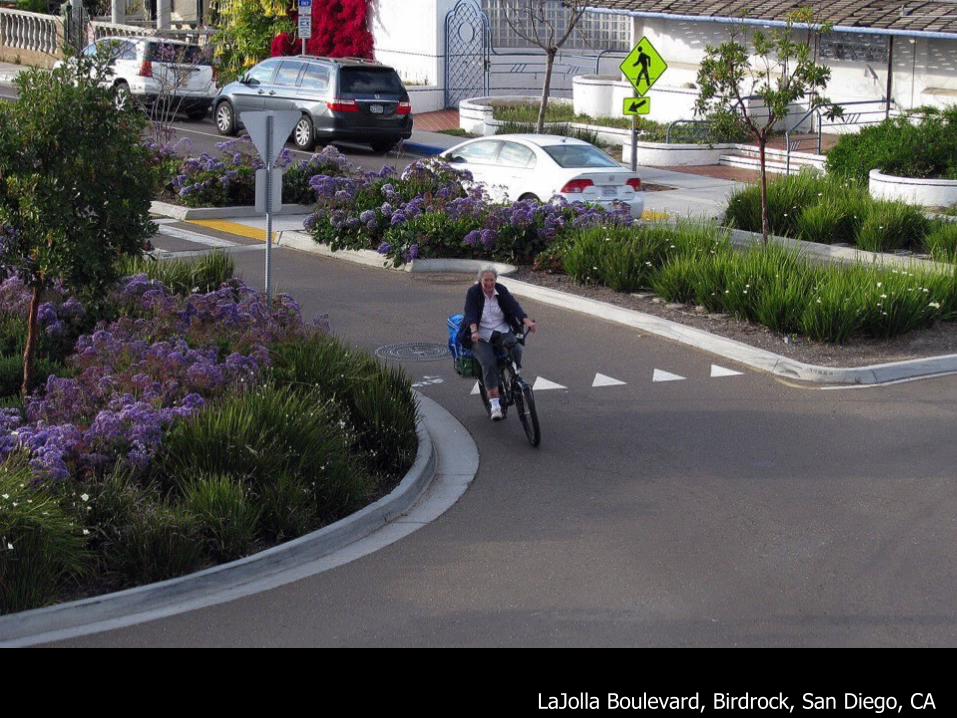
LaJolla Boulevard, Birdrock, San Diego, CA

2nd Avenue, South

The Institute team suggests the following goals for towns/cities:
Goal 1: A complete network of streets and public spaces to support active living
Goal 2: Safe, natural and enjoyable walking and biking conditions
Goal 3: Sustainable transportation choices
Goal 4: Healthier, happier people

To achieve these goals, we recommend:
1. Adopt Complete Streets policies and incorporate Complete Streets policy language into all planning documents
2. Create and adopt the Livable Street Design Guidelines
3. Develop a Regional Pedestrian Master Plan 4. Adopt the Regional Bicycle Master Plan
5. Increase enforcement for pedestrian safety

6. Increase education and awareness for all road users
7. Improve and enhance Safe Routes to School programs
8. Update General Plans and Municipal Codes to include livability and wellness principles
9. Transform regional corridors, local corridors and neighborhood streets to encourage active transportation
10. Apply best practices, lessons learned and available resources to improve livability throughout the region
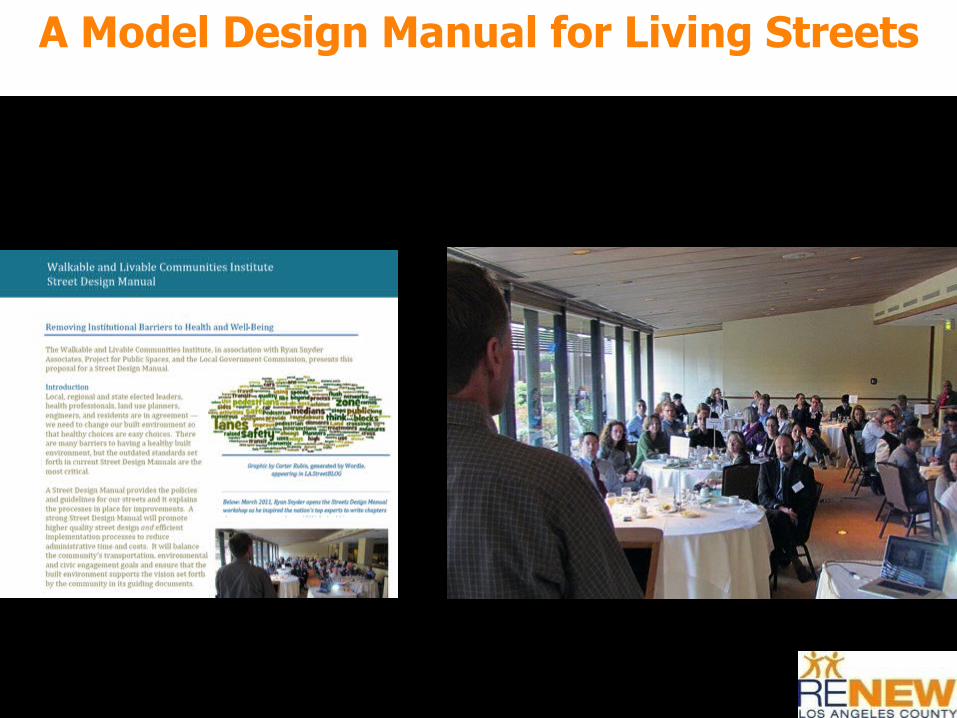
A Model Design Manual for Living Streets
Made possible by funding from the Department of Health and Human Services through the Los Angeles County Department of Public Health.


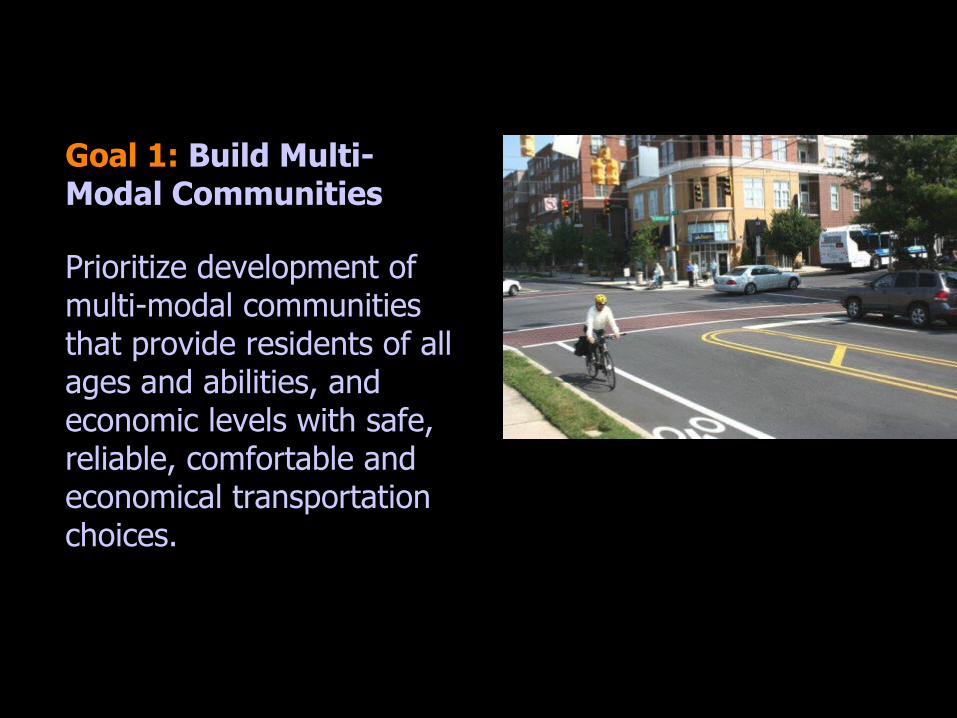
Goal 1: Build Multi-Modal Communities
Prioritize development of multi-modal communities that provide residents of all ages and abilities, and economic levels with safe, reliable, comfortable and economical transportation choices.
Made possible by funding from the Department of Health and Human Services through the Los Angeles County Department of Public Health.

Goal 2: Promote Safetytransportation system to reduce serious injuries, decreaseDesign, operate, and manage the crime and violence, ensure mobility for all ages, abilities and socio-economic levels.
Made possible by funding from the Department of Health and Human Services through the Los Angeles County Department of Public Health.
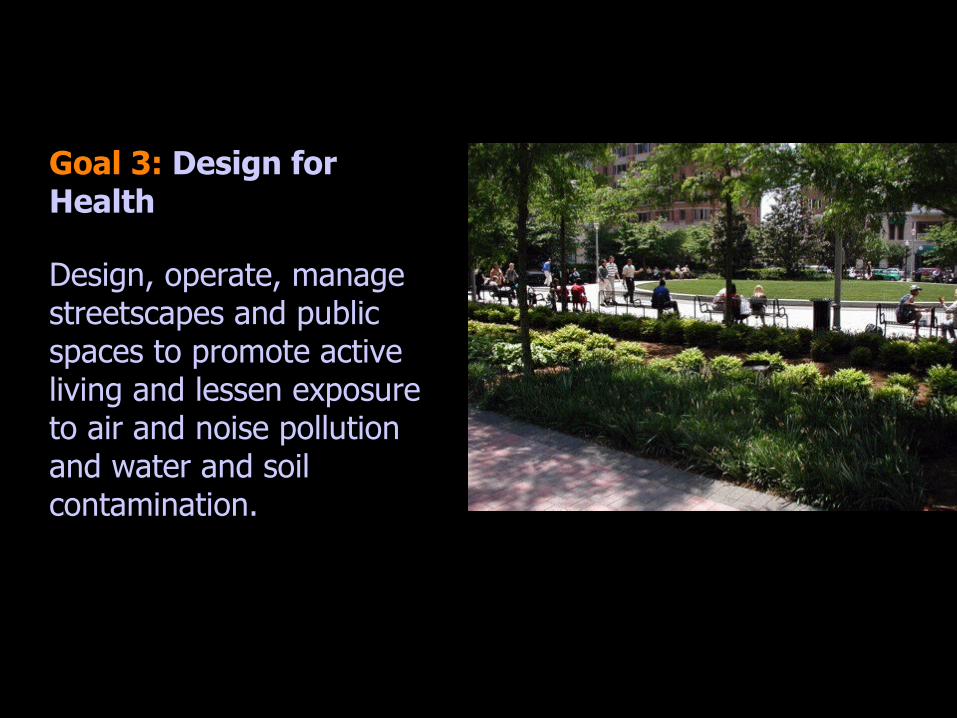
Goal 3: Design for Health
Design, operate, manage streetscapes and public spaces to promote active living and lessen exposure to air and noise pollution and water and soil contamination.
Made possible by funding from the Department of Health and Human Services through the Los Angeles County Department of Public Health.

Goal 4: Promote Transportation Investment as Economic Development Invest in transportation improvements-including operational improvements-that support the economic health and competiveness of city’s businesses, and the safety and general welfare of its residents.
Made possible by funding from the Department of Health and Human Services through the Los Angeles County Department of Public Health.

Goal 5: Integrate Transportation and Land Use
Cities and counties should coordinate transportation infrastructure with land use and development.
Made possible by funding from the Department of Health and Human Services through the Los Angeles County Department of Public Health.

Goal 6: Embrace Streets as Civic Space
City streets will be regarded as important spaces for civic engagement and will be developed to promote health, economic vitality, and well-being while reflecting a city’s unique character.
Made possible by funding from the Department of Health and Human Services through the Los Angeles County Department of Public Health.