waleamandwwication of the neigeborbnd unit formula
TRANSCRIPT
WALEAM AND WWICATION
OF
THE NEIGEBORBND UNIT FORMULA
THESIS FOR THE DEGREE OF M.U.P.
MICHIGAN STATE UNIVERSITY
IIIMAI. H. mama
1973

1
LIBRARY
Michigan State
University

ABSTRACT
EVALUATION AND MODIFICATION
OF
THE NEIGHBORHOOD UNIT FORMULA
BY
Kamal H. Sabbour
During the past few decades, society has been ex-
periencing the growing impact of technological achieve-
ments. Some of its effects have been felt in our percep-
tion of physical distance and increased awareness of the
value of time.
While the impact of these achievements has been
experienced in all aspects of our lives, the ”Neighborhood
Unit Formula," introduced almost half a century ago, is
still accepted _3 li- This formula was mostly applied to
building new communities while the need for its application
to older areas was more urgent.
The "Neighborhood Unit Formula” was introduced by
Clarence A. Perry as part of the Regional Plan of New York.
It defined the physical relationships between families and
the services and facilities they need. However, its basic
guidelines were heavily criticized because of its social
ramifications. Others contend that the formula is simply
a proposal for the arrangement of the physical environment
intended to provide measures of safety and convenience to
urban populations. As a result, it became fashionable to

Kamal H. Sabbour
draw circles stipulating that activity patterns would be
confined within these areas. This, however, can rarely be
the case, which underlines the need for a realistic ap-
praisal of the formula's principles and standards.
Accordingly, the primary purpose of this research
was directed toward evaluating the "Neighborhood Unit
Formula," and accomplished in two phases:
(1) Investigate the types of activity patterns which
occur within the residential environment. Once
this is accomplished, the various design princi-
ples, standards and spatial arrangements can be
evaluated.
(2) Based on this evaluation, problems Can be identi-
fied and modifications or alternative solutions
can be recommended.
The resulting analysis and evaluation indicate
various problems due to the limitations imposed on its
size, capacity and design arrangements. Also illustrated
are its non-conformity to household activity patterns as
well as its rigidity which prevents possible adaptation or
modification. Accordingly, an alternative solution is pre-
sented. The guidelines proposed for this alternative solu-
tion attempt to achieve two objectives. One is to avoid
the problems inherent in Perry's design. The other is to
allow for maximum flexibility if any changes or alterations
become necessary.

EVALUATION AND MODIFICATION
OF
THE NEIGHBORHOOD UNIT FORMULA
BY
Kamal H. Sabbour
A THESIS
Submitted to
Michigan State University
in partial fulfillment of the requirements
for the degree of
-MASTER IN URBAN PLANNING
School of Urban Planning and Landscape Architecture
1973

C)?
‘1)
\‘d
C35
ACKNOWLEDGMENTS
I would like to give special recognition to Profes-
sor Charles W. Barr for his guidance, and many hours spent
consulting on the research problem and data analysis. Sin-
cere thanks are also due to Professor Sanford Farness and
Mr. Effat Mansour for their constructive criticism during
the preparation of this thesis.
The instruction and seasoned advice I received from
my dear friend Dr. Mohamed Al-Awady were invaluable aids
in investigating the research problem.
Finally my gratitude is due to my brother Emad,
whose encouragement was a significant contribution to the
completion of this study.
ii

TABLE OF CONTENTS
ACKNOWLEDGMENTS . . . . . . . . . . . . . . . . . . . ii
LIST OF TABLES . . . . . . . . . . . . . . . . . . . V
Chapter
I. INTRODUCTION . . . . . . . . . . . . . . . . 1
Study Approach . . . . . . . . . . . . . . 3
II. HISTORICAL BACKGROUND . . . . . . . . . . . . 4
Examination of Basic Assumptions . . . . . 8
III. DESIGN CRITERIA . . . . . . . . . . . . . . . 14
Introduction . . . . . . . . . . . . . . . 14
Household Classification . . . . . . . . . 14
Description of Data . . . . . . . . . . . . 18
Income—Occupation Matrix . . . . . . . . . 18
Income Classification . . . . . . . . . . 18
Occupation Classification . . . . . . . . 20
Methodology . . . . . . . . . . . . . . . 21
Findings . . . . . . . . . . . . . . . . . 35
Library . . . . . . . . . . . . . . . . . 35
ShOpping Center . . . . . . . . . . . . . 36
Schools . . . . . . . . . . . . . . . . . 36
Church . . . . . . . . . . . . . . . . . 37
Park . . . . . . . . . . . . . . . . . . 38
Job . . . . . . . . . . . . . . . . . . . 39
Bus Service . . . . . . . . . . . . . . . 39
iii

IV. EVALUATION
Physical Proximity
Walking Distance Concept
Density Considerations
Design Arrangements .
Design Core
Implementation
V. ANALYSIS, MODIFICATIONS AND RECOMMENDATIONS
Analysis
Modifications . . .
Recommendations
Classification of Services
and Facilities
Primary and Secondary Services
and Facilities
Classification of Activity Patterns
Design Considerations
BIBLIOGRAPHY .
iv
41
51
S3
54
SS
55
S7
59
59
61
61
61
62
62
63
6S

Table
10.
11.
12.
13.
14.
15.
16.
17.
18.
19.
20.
21.
Income-Occupation Matrix
Median
Median
Median
Median
Median
Median
Median
Median
Median
Median
Median
Median
Median
Service Areas
5 vice Areas
Service Areas
Service Areas
Service Areas
Service Areas
Service Areas
Distance:
Distance:
Distance:
Distance:
Distance:
Distance:
Distance:
Distance:
Distance:
Distance:
Distance:
Distance:
Distance:
for
for
for
for
for
for
for
LIST OF TABLES
Page
. . . 19
Subgroup I-A . . 22
Subgroup I-B . 23
Subgroup I-C 24
Subgroup I-D . 25
Subgroup II-A 26
Subgroup II-B . 27
Subgroup II-C . 28
Subgroup II-D 29
Subgroup III-B . . 3O
Subgroup III-C . . 31
Subgroup III-D . . . 32
Subgroup IV-C . 33
Subgroup IV—D . . 34
Library 43
Shopping Center . 44
Elementary School 45
Junior High School . . . . . 46
High School . . 47
Church 48
Park . . . 49

22.
23.
Service Areas for Bus Service
Accessibility Standards
vi
SO
51
CHAPTER I
INTRODUCTION
During the past few decades, society has been ex-
periencing the growing impact of technological achievements.
The introduction and availability of the automobile, for
example, radically affected the concept of physical dis-
tance and increased people's awareness of the value of
time. Modern appliances and storage facilities changed
shopping habits, reduced the importance of the corner
grocery store and increased that of the supermarket. The
wide use of mass media and electronic equipment not only
changed the function, operation and sc0pe of services of
various facilities but also Opened up new avenues of com-
munication and understanding between the urban population.
While the impact of these technological achieve-
ments has been felt in all aspects of our lives, many
changes and alterations have been experienced in the urban
environment. Yet, the "Neighborhood Unit Formula" as an
urban design concept introduced almost half a century ago,
is still accepted as is.
The "Neighborhood Unit Formula" is a design concept
often proposed in general planning reviews as a method for

reorganizing the residential areas. The formula states
principles and standards for the spatial relationships of
dwellings, schools, shopping centers, churches, libraries
and similar elements of the physical environment.
Since its inception, the formula became widely ac-
cepted but variously and inconsistently used. At times,
it deals with areas having common physical, social or cul-
tural characteristics and at others, it refers to human
activities and relationships that may occur among the
residents of these areas. Because of these inconsistent
interpretations, planners were always reluctant to effec-
tively utilize its principles and standards to solve the
problems of physical disorder in well established urban
communities. As a result, the formula was mostly applied
to building new urban environments while the need for its
application to older areas was more urgent. Such limited
use did not afford planners the opportunity to examine its
principles and standards as a general planning tool
capable of organizing the urban form, new and old alike.
Although planners are always in need for planning
tools to help build a viable and organized urban environ-
ment, there is also a need for examining the capabilities
and limitations of these tools before shaping this environ-
ment for decades to come. This process of examination,
however, was difficult to perform due to the lack of
needed information which can adequately describe the

complex interaction between people and physical facilities
that takes place within the urban environment. Fortunately,
this information became available from surveys conducted by
Tri-County Regional Planning Commission in the Lansing-East
Lansing Metropolitan Area.1
Accordingly, the primary purpose of this research
will be directed toward evaluating the "Neighborhood Unit
Formula." This will be accomplished by testing its prin-
ciples and standards, thus developing a notion as to how
they actually work in real life.
Study Approach
The approach presented in this study will be as
follows:
(1) Examination of the basic assumptions stated by the
"Neighborhood Unit Formula."
(2) Testing its principles and standards. To accom-
plish this, a hypothetical model will be
deveIOped.
(3) Evaluation of the formula's principles and stan-
dards by comparison with the derived findings.
Based on this comparison, guidelines for modifica-
tions will be recommended.
1Tri-Cocnty Regional Planning Commission, Format and
DeScription of Data in Card or Tape Form (Lansing, MiCH.,
($67).

CHAPTER II
HISTORICAL BACKGROUND
The idea of people living together in a geographic
area has long intrigued man. Since early civilizations
communities were built in a sufficiently condensed form to
afford the needed facilities in a minimum space. The divi-
sion of large communities into small sections, or "neigh-
borhoods," goes back to ancient cities of the Middle East
and Europe. Distinct districts were evident in ancient
Rome where the temple, the public bath and the market place
were common features. The church was a profound influence
on European cities. Such an idea was recorded by Lewis
Mumford as follows:
The division of the town into quarters, each with its
church or churches, often with a local provision
market, always with its own local water supply, a well
or a fountain. Often as in Venice the neighborhood
unit would be identified with the parish and got its
name from the parish church: a division that remains
to this day.1
Along with the industrial revolution came the mass migra-
tion from rural areas to urban communities. Older sections
of cities turned into overcrowded slums unsuitable for
1Lewis Mumford, The City in History (New York: Har-
court, Brace and World,_Inc.,’196l), p.‘3IO.
4

5
human habitation. Such situations became the concern of a
new planning movement in an attempt to eliminate these un-
desirable conditions and improve the quality of urban life.
Among the leaders of this movement was Ebenezer Howard,
who introduced the "Garden City" concept.1 The concept
deals with totally new communities of 30,000 pe0ple. Each
community was divided into wards of 5,000 peOple. The ward
was bounded by radial boulevards and circular avenues
described as:
Six magnificent boulevards--each 120 feet wide--
traverse the city from center to circumference,
dividing it into six equal parts or wards.2
Each ward was served by a centrally located school, open
spaces, and other services alongside its boundaries.3
The implementation of Howard's idea took place in
two communities--Letchworth and Welwyn--built near London.
Shortly thereafter, its influence became evident in France,
Germany, Holland, Italy, Belgium, Poland, Czechoslovakia,
Spain, Russia and the United States.
The growing concern which followed has been wit-
nessed and documented.‘ Many theories have been introduced
and different approaches to account for the new challenge
have been implemented. These theories are evident not only
in the areas of transportation and housing, but also in
1Ebenezer Howard, Garden Cities of Tomorrow (London:
Faber and Faber Ltd., MLF‘Paperback Edition, I96ST.
21bid., pp. 51-52. 31bid., p. 53.

civic design and land use, to name a few.
Another pioneer that got involved in this planning
movement was Clarence A. Perry. As part of the Regional
Plan of New York, he introduced a new concept called the
"Neighborhood Unit Formula."1
The "Neighborhood Unit Formula" deals with the ar-
rangement of family life communities. As defined by Perry,
the unit was described as an area which embraces all public
facilities needed by its inhabitants. Each unit provides
housing for 5,000 people.
The area is bounded on all sides by arterial
streets, provided by a system of small parks and recreation
spaces, served by an elementary school, a library, local
assembly area and other institutions suitably grouped about
a central core with one or more shOpping districts laid out
in the circumference, preferably at traffic junctions, and
a special street system to facilitate internal circulation
and to discourage through traffic. Through these physical
arrangements, service; and facilities would be located
within convenient and safe walking distance of the area
residents. In addition to providing safety and convenience
measures to the area :esidents, the design concept intended
1Clarence A. Perry, Neighborhood and Community Plan-
ning, Vol. VII of the Regional Survey of New York andets
EnV1rons (New York: Regional Plan of New York and Its En-
virons, 1929). Also, Clarence A. Perry, Housing for the
Machine Age (New York: Russell Sage Foundation, 1839).
to recognize a fundamental limitation concerning the size
of an area and the number of people who could effectively
get together and actively participate in matters that
affect them individually or collectively. As a result,
civic interest and responsibility, particularly toward
maintaining a sound and wholesome urban environment, would
be achieved.
These premises were based on the assumption that
the proper arrangement of schools, retail stores, open
spaces, streets, and dwellings would provide a family with
better living conditions.1
In addition to introducing some design principles to
achieve physical order within the residential environment,
the concept attempted to achieve the following objectives:2
1. Create a safe and pleasant residential environment
where a child can easily and safely walk to school,
shepping facilities are within reach of housewives,
and playgrounds are available for children and
adults.
2. Reduce the residential environment to proportions
similar to the rural or semi-urban communities,
1Perry, Housinggfor the Machine Age, pp. 17-18.
2Arthur B. Gallion and Simon Eisner, The Urban Pat-
tern (Princeton, N.J.: Van Nostrand Company, Inc., 1963),
pp. 250-264; Peter H- Mann, An Approach to Urban Sociology
(London: Routledge and Kegan Paul,’1964), p. 17; Jehn
Tetlow et al., Towns and Traffic (London: Faber and Faber,
1965).

where people can find friendliness, relaxation,
convenience, and safety, as well as Opportunities
for self expression and citizenship on a manageable
scale.1
3. Encourage the association among neighbors by gener—
ating social relations through face-to-face inter-
action.
4. Stimulate local loyalties, attachment and feelings
of identity and community spirit. One of the most
pleasant memories old-timers have is of the friendly
community spirit that used to be strong years ago.
This plan aims to confirm and recreate that con-
genial feeling in modern garb, through the organization of
the town into "neighborhood units" of 1,500 families
(5,000 people) each. By living in a compact community en-
vironment, children will develop a sense of security and
belonging, while adults will feel themselves closely inte-
grated into a personal social unit.
Examination of Basic Assumptions
The ”neighborhood unit formula" was welcomed by
planners because it introduced a new method for rearranging
the residential environment according to new guidelines--
1James Dahir, The Neighborhood Unit Plan (New York.
Russell Sage Foundation, 194 ), p. .

different from the traditional gridiron pattern. It defined
the physical relationships between families and the services
and facilities they need. More important, it established a
manageable unit of urban design with which planners can
deal.
In brief, Perry‘s proposal can be described as an
urban design concept intended to introduce principles of
physical order to the residential environment. This objec-
tive has been clearly stated by Gallion and Eisner in The
Urban Pattern.
The neighborhood unit is not some sociological phenome-
non, it embraces no particular theories of social
sciences. It is simply a physical environment in which
a mother knows that her child will have no traffic
streets to cross on his way to school, a school which
is within easy walking distance from home. It is an
environment in which the housewife may have an easy
walk to a shopping center where she may obtain daily
household goods, and the man of the hosue may find
convenient transportation to and from his work. It is
an environment in which a well-equipped playground is
located near to home where the children may play in
safety with their friends.1
Simply stated, therefore, the concept refers to a
service area and population sharing shops, playgrounds, and
a centrally located school, a library and a local assembly
area, arranged within walking distance to individual house-
holds. It was assumed, however, that these principles and
standards will be enjoyed by the urban population. So it
was 1ssumed that a walking distance of one-fourth or
1Gallion and Eisner, op. cit., p. 251.

10
one-third of a mile from a school or shops would be conve-
nient for children and adults, and a particular arrangement
of services and facilities would confine local activities
within these service areas.
All these design arrangements emphasize the impor-
tance of the walking distance. As a result, it became
fashionable to draw circles at certain distances apart
stipulating that peOple within these areas have only these
distances to walk to their destinations. Furthermore, it
was assumed that the given services and facilities as well
as activity patterns are not subject to change. This,
however, can rarely be the case, which underlines the need
for a realistic and detailed appraisal of these principles
and standards.
These guidelines, however, were opposed by social
planners. They heavily criticized Perry's formula because
of its social ramifications.1 They submitted that:
1. It is a dogmatic and inadequate formula impediment
to the democratization of cities.
2. It tends to divide the city into social, physical
and political cells which have no basis in present
or future community life, discouraging and prevent-
ing the representation of small areas.
1Reginald R. Isaacs, "The Neighborhood Theory: An
Analysis of Its Adequacy,” Journal of the American Insti-
tute of Planners (Spring 1948), p. 15.
11
3. It would create isolated communities in which unde-
sirable social exclusiveness between urban residents
might lead to social snobbishness.
4. It discourages the imitation of better living condi-
tions which more intensive contact between the dif-
ferent sections would produce.
5. It would drain the leadership from one area to an-
other, thus denying the deprived areas the talents
of their influential and knowledgeable potential
leaders.
In addition, several studies have challenged Perry's
basic assumptions concerning the division of the city into
smaller units with better physical arrangements to estab-
lish more stable family life, enhance neighborly face-to-
face relations or stimulate the formation of social con-
1 These studies concluded that physi-tacts and friendship.
cal distances as such are no longer considered sufficient
to account for the formation and perpetuation of social
contacts, especially of the more enduring sort. This can
be observed in many instances of physically compact units
where residents, though physically close, do not establish
any relationships with one another. If these relations
exist, it must be rooted in shared ideas and beliefs.
1Leo Kuper, ed., Blue Print for Living Together
(London: Cresset, 1953), pp. 86-90. Also, Herbert J.
Gans, "Planning and Social Life," Journal of the American
Institute of Planners, XXVII (May 1961), 134-140.

12
Barring this, neighborly relations will either fail to be
established or, if established, they will be temporary, un-
reliable and ineffectual.
It was also argued that the "neighborhood unit
formula" has tried to affect social relations by reducing
the physical distance or the functional distance between
neighbors. The physical distance may be reduced by improv-
ing accessibility through better means of transportation
or by smaller geometric distances. Functional distances
may be reduced by better site planning and building ar-
rangements. Evidence of these distances on social rela-
tions, however, is inconclusive. Even under special condi-
tions where the physical or functional distances are
manipulated, their impact on face-to-face interaction or
social relations among neighbors is uncertain but rather
it may increase hostility and interpersonal friction.1
Accordingly, the reduction of distance, physical or func-
tional, to increase visual and personal contacts among
neighbors may not necessarily be followed by sociable con—
tacts among them.
Other studies also argued that the "neighborhood"
describes a community bound together by common social and
economic characteristics and cultural traits. The forma-
tion of these communities, therefore, does not evolve from
1Theodore Caplow, et al., The Urban Ambience (New
Jersey: Bedminster, 1964), pp. 166-170.
13
simple physical arrangements.
Additionally, social, economic or cultural character-
istics always overlap from one part of the city to the
other. Accordingly, these characteristics cannot be con-
fined within physical boundaries. These issues, in turn,
lead to a considerable concern about the undesirable effects
on the social fabric of urban p0pulation if the concept is
implemented.
These issues, however, were not but mere speculation
for two main reasons. One is the lack of testing grounds,
particularly in well established urban communities, to
justify these accusations. Second is the absence of con-
clusive evidence that can clearly describe the effect of
distances, physical or functiona, on the formation of
social interaction.

CHAPTER III
DESIGN CRITERIA
Introduction
As is the case with any urban design, evaluation of
Perry's proposal requires an analysis of the activity pat-
terns which occur within the residential environment.
These activities, however, are performed by households
with differing needs most suited to their particular social,
economic and cultural characteristics. These characteris-
tics initiate different values, each with its sets of sen-
sory inputs creating a series of different worlds. Accord-
ingly, an investigation into the types of activity patterns
which occur within the residential environment is not only
needed but is a necessity. Once accomplished, the various
design principles, standards and spatial arrangements can
be evaluated, and modifications can be recommended.
Household Classification
Home-related activities may be defined as those
movements performed by a family to fulfill its domestic
needs. These activities stem from the way a household
lives. Its way of life, however, is influenced by many
14

15
constraints.1 Some originate from its social, economic and
cultural characteristics. Households choose where to live
because their income allows them to do so. Age, sex, size
and other social characteristics of a family determine the
types of activities performed by its members and influence
its decision to locate near services or facilities. Race,
language, education, ethnicity and similar cultural charac-
teristics shape the family's habits, customs and values
determining its association with others in work or at home.
Among these constraints, the income level and occupa-
tion of the household head were selected as indices to
identify the various activity patterns. These were selected
for the following reasons:
1) Income and occupation can provide convenient bases
for comparison between households. They can serve
as major indices for evaluating the social role a
household head performs in society. Learning the
specific attributes of these two factors, this role
can be identified.
2) Income and occupation can provide observable cri-
teria for rating households. Both can be transformed
into consumptive units indicating certain behavior
or life style which can describe different interests
and values.
1Herbert J. Gans, People and Plans, Essays on Urban
Problems and Solutions (New York: Basic Books, Inc.,
I968), pp. 44-47.

3)
4)
5)
16
Income and occupation are highly correlated with the
education attained by the household head. Education,
in turn, suggests the type of associates he can come
in contact with. In addition, education can describe
the type of friends or neighbors the family would
like to have and the suitable playmates or classmates
for its children.
Income and occupation of the household head can de-
scribe the contribution he makes for the community
welfare and hints at the degree of his authority
over others. Such aspects confer prestige on peOple
and recognize more accurately their skills at work.
In addition, both factors illustrate his potential
and success which can describe his present and
future role he may perform in the society.
Income and education can clearly indicate the life
cycle stage of the household head. For example,
two persons belonging to the same occupation can
have different income levels due to additional ex-
perience. More experience, in turn, indicates addi-
tional years at work. Similarly, occupation repre-
sents the accumulation of knowledge during a certain
number of years spent in education. Accordingly,
income and education can indicate the life cycle
stage of the household head and, therefore, the
probable social composition of the family.

17
6) Income and occupation always refer to precise defi-
nitions and represent recognizable units easily per-
ceived by the majority of people.
7) Income and occupational data can be collected easily
and objectively without any bias due to personal
interest or value judgment.
8) Income and occupational data represent a relatively
stable information holding the same meaning for
longer periods of time. Therefore, any re-evaluation,
adjustment or additional information can be easily
pursued.
It should be noted, however, that a household classifica-
tion based on these two dimensions separately may lead to
questionable results. This is due to some misleading ex-
pressions about household characteristics. A particular
group of households, for example, may have similar norms or
values, yet economic constraints may limit their choice of
residential location. Similarly, some households may have
the same income level but their race, ethnicity or educa—
tional attainment may limit their endurance to continue
living in an area or establish neighborly relations with
other residents. Based on these considerations, 3 combina-
tion of income-occupation classification would help des-.lse
households that would live together voluntarily more accu-
rately. Therefore, classify urban households into groups
that can afford living together in a residential area as

18
well as establish more enduring neighborly relationships.
Description of Data
The data utilized in this study are part of the Home
Opinion Surveys performed by Tri-County Regional Planning
Commission in the Tri-County area. The data include the
following information:
‘1. The income level and occupation of the household
head.
2. The estimated distances from a given list of ser-
vices and facilities.
3. The expressed level of satisfaction from this dis-
tance given as very satisfied, fairly satisfied,
fairly dissatisfied or very dissatisfied.
Income-Occupation Matrix
a. Income Classification
The income levels included in the survey were di-
vided into nine categories ranging from incomeless house-
holds to those with $25,000 or more annual income. How-
ever, for the purpose of this study families were classi-
fied into four income levels shown in Table 1. These are:
1. Low Income (group A) under $5,000/yr.
II. Lower Middle (group B) $5,000 to $9,999/yr.
III. Upper Middle (group C) $10,000 to 14,999/yr.
IV. Upper Income (group D) $15,000/yr and over.

Table
l.
INCOME-OCCUPATION
MATRIX
Group
A
$0,000-$4,999
No.
of
Percent
Of—
Group
B
$5,000-$9,999
No.
of
Percent6f
Group
C
$10,000-$l4,999
No.
of
Percent
of
Group
D
$15,000
and
above
No.
of
Percent
of
respondents
pOpulation
respondents
population
respondents
population
respondents
population
Group
I
Group
II
Group
III
Group
IV
165
50 9 7
14.32
4.34
0.78
0.63
60
214
45
5.21
18.58
3.91
0.78
33
196
79
27
2.86
17.01
6.85
2.34
12
119
80
47
1.04
10.33
6.94
4.08
Total
sample,
1,152
respondents.
19

20
b. Occupation Classification
To classify the households into occupation groups,
. . . . . 1
each occupation was a551gned a soc1o-econom1c index.
Households were then classified as follows:
Occupation Group I Soc1o-Econom1c
Laborers, except farm 8 miners 7
Private household workers 8
Farm laborers and foremen 9
Occupation Group II
Farmers 5 farm managers 14
Service workers except household 17
Operatives 8 kindred workers 18
Not in labor force, unemployed, retired,
housewife, student, not applicable 19
Occupation Group III
Craftsmen, foremen, 8 kindred workers 31
Clerical and kindred workers 45
Sales workers 49
Occupation Group IV
Managers, officials 8 proprietors
except farm 57
Professionals, technical G kindred
workers 75
1Albert J. Reiss, Jr., Occupation and Social Status
(New York: The Free Press of Glencoe, Inc., 1961): p. 199}
21
Methodology
To develop the income-occupation matrix, the sample--
recorded on computer punched cards--was sorted into four
income groups. Each group was further sorted into four
occupation subgroups. A computer program was then devel-
oped to compute the following:
1. The number of households located within 0.20 mile
increments from the assigned list of services and
facilities (i.e., 0.20, 0.40, 0.60 miles, etc.).
2. The expressed levels of satisfaction corresponding
to these distances.
3. The average distances from services and facilities
were calculated by considering the number of obser-
vations as weights. Moments were calculated around
services and facilities as points of origin. The
resultants of these moments were considered as median
distances, each with a corresponding level of satis-
faction.
Median distances corresponding to each level of sat-
isfaaction are shown for the various income levels. These
median distances were computed for each service and
facility separately. The results of these computations are
shown in Tables 2 through 14.

Table
2.
MEDIAN
DISTANCE:
SUBGROUP
I-A
Degree
of
Very
Fairly
Fairly
Very
atisfaction
Satisfied
Satisfied
Dissatisfied
Dissatisfied
Other
Type
of
..
.Miles
Percent
Miles
Percent
Miles
Percent
Miles
Percent
Percent
SerV1ce
or
Fac111t
Library
1.89
54.9
2.28
19.1
1.52
3.1
1.05
1.2
21.7
Shopping
Center
1.49
64.6
2.22
22.0
1.02
6.7
1.45
2.4
4.3
Elementary
School
1.03
41.1
1.00
5.5
--
--
53.4
Junior
High
School
1.66
32.5
1.67
8.6
3.00
0.6
0.60
0.6
57.7
High
School
1.90
35.4
2.10
9.1
3.00
0.6
1.60
0.6
54.3
Church
1.25
69.4
1.48
14.3
1.60
1.9
3.32
3.1
11.3
Park
0.91
51.8
1.70
14.6
--
1.96
3.0
30.6
Job
0.97
12.9
1.90
2.5
1.50
1.2
--
83.4
Bus
Service
0.39
49.4
0.75
7.3
1.30
2.4
0.78
6.1
34.8
22
Occupation
Group:
1Income
Group:
A
Number
of
Respondents:
165
Percent
of
Total
Population:
14.32

Table
3.
MEDIAN
DISTANCE:
SUBGROUP
I-B
Degree
of
Very
Fairly
Fairly
Very
atisfaction
Satisfied
Satisfied
Dissatisfied
Dissatisfied
Other
Type
of
..
.Miles
Percent
Miles
Percent
Miles
Percent
Miles
Percent
Percent
SerV1ce
or
Fac111t
Library
1.62
60.0
2.54
16.7
4.00
3.3
2.00
1.7
18.3
Shepping
Center
1.54
74.6
2.25
20.3
6.00
3.4
0.60
1.7
-
Elementary
School
0.91
58.3
0.87
5.0
1.00
1.7
--—
35.0
JuniorHigh
School
1.84
53.3
1.50
3.3
2.60
3.3
--
40.1
High
School
2.05
50.0
2.00
6.7
3.30
5.0
--
38.3
Church
1.40
84.7
2.48
8.5
0.70
3.4
2.00
1.7
1.7
Park
1.20
68.3
1.40
6.7
0.80
5.0
0.40
3.3
16.7
Job
2.85
60.3
3.69
12.1
10.00
1.7
--
25.9
Bus
Service
0.59
48.3
0.40
3.4
1.73
5.2
0.60
12.1
31.0
Occupation
Group:
IIncome
Group:
B
NUmber
of
Respondents:
60
Percent
of
Total
Population:
5.21
23

Table
4.
MEDIAN
DISTANCE:
SUBGROUP
I-C
Degree
of
Satisfaction
Type
of
Service
or
Facility
Library
Shapping
Center
Elementary
School
Junior
High
School
High
School
Church
Park
Job
Bus
Service
Very
Satisfied
Fairly
Satisfied
Fairly
Dissatisfied
Very
Dissatisfied
Other Miles
2.26
1.28
0.73
1.09
0.91
1.30
1.08
3.47
0.70
66.7
78.1
45.5
42.4
42.4
69.7
53.1
70.0
59.4
Percent
Miles
3.34
4.90
1.73
1.17
2.57
2.49
1.17
1.73
0.20
Percent
21.2
6.3
15.2
21.2
18.2
21.2
18.8
10.0
3.1
Miles
Percent
Miles
4.00
3.00
2.40
2.60
4.00
5.80
6.00
4.00
Percent
3.0
9.4
6.1
3.0
3.0
6.3
3.3
9.4
Percent
9.1
33.2
36.4
36.4
6.1
21.8
13.4
25.0
Occupation
Group:
I
Number
of
Respondents:
33
Income
Group:
C
Percent
of
Total
POpulation:
2.86
24

Table
5.
MEDIAN
DISTANCE:
SUBGROUP
I-D
Degreeof
Satisfaction
Very
Fairly
Fairly
Very
Satisfied
Satisfied
Dissatisfied
Dissatisfied
Other
Type
of
Service
or
Facility
Miles
Percent
Miles
Percent
Miles
Percent
Miles
Percent
Percent
Library
1.80
66.7
1.07
25.0
1.00
8.3
--
-
Shopping
Center
2.63
58.3
--
1.87
25.0
1.00
16.7
-
Elementary
School
0.93
50.0
0.40
25.0
1.50
16.7
--
8.3
Junior
High
School
1.20
50.0
1.13
16.7
9.00
8.3
--
25.0
High
School
2.04
41.7
1.50
16.7
9.00
8.3
--
33.3
Church
1.43
50.0
1.80
16.7
2.00
8.3
--
25.0
Park
1.10
66.7
1.20
16.7
2.00
8.3
-—
-8.3
Job
1.50
83.4
4.00
8.3
4.00
8.3
--
-
Bus
Service
0.40
33.3
--
--
2.50
33.3
33.4
25
Occupation
Group:
1Income
Group:
D
Number
of
Respondents:
12
Percent
of
Total
Population:
1.04

Table
6.
MEDIAN
DISTANCE:
SUBGROUP
II-A
Degree
of
Satisfaction
Very
Fairly
Fairly
Very
Satisfied
Satisfied
Dissatisfied
Dissatisfied
Other
Type
of
..
.;
Miles
Percent
Miles
Percent
Miles
Percent
Miles
Percent
Percent
Serv1ce
or
FaC111ry
Library
1.00
68.0
1.85
24.0
3.93
6.0
--
2.0
Shopping
Center
0.86
72.0
2.06
26.0
3.00
2.0
-;-
—-
Elementary
School
0.78
42.0
1.58
16.0
--
--
42.0
Junior
High
School
1.87
28.0
3.00
14.0
3.00
2.0
2.00
2.0
54.0
High
School
2.05
30.0
2.17
14.0
3.00
2.0
3.00
2.0
52.0
Church
1.32
54.0
2.28
32.0
1.80
4.0
10.00
2.0
8.0
Park
0.82
56.0
1.73
22.0
1.00
4.0
--
‘18.0
Job
1.11
26.5
2.50
4.1
6.00
4.1
--
65.0
Bus
Service
0.36
38.0
0.60
8.0
0.20
2.0
0.48
10.0
42.0
26
Occupation
Group:
11
Income
Group:
A
Number
of
Respondents:
50
Percent
of
Total
Population:
4.34

Table
7.
MEDIAN
DISTANCE:
SUBGROUP
II-B
Degree
off
Satisfaction
Type
of
Service
or
Facility
Library
Shopping
Center
Elementary
School
Junior
High
School
High
School
Church
Park
Job
Bus
Service
Very
Satisfied
Miles
2.57
2.14
1.22
2.05
1.97
1.42
1.50
2.73
0.80
62.9
76.3
67.3
54.0
55.2
76.3
70.3
70.6
44.1
Fairly
Satisfied
Percent
Miles
3.07
3.05
2.81
3.90
4.63
2.54
2.70
4.29
1.39
18.1
17.4
12.1
16.1
14.6
13.3
12.3
18.2
8.0
Fairly
Dissatisfied
4.52
5.94
3.45
2.70
2.56
4.80
6.57
3.17
1.09
4.8
3.4
1.9
2.8
5.2
2.4
3.3
3.2
3.8
Very
Dissatisfied
Percent
Miles
Percent
Miles
4.90
2.64
4.00
2.59
4.00
2.44
5.00
1.40
Percent
2.4
2.4
0.5
3.8
2.8
5.7
2.1
8.5
Other
Percent
11.8
0.5
18.2
23.3
22.2
8.0
8.4
5.9
35.6
Occupation
Group:
11
Number
of
Respondents:
214
Income
Group:
8
Percent
of
Total
Population:
18.58
27
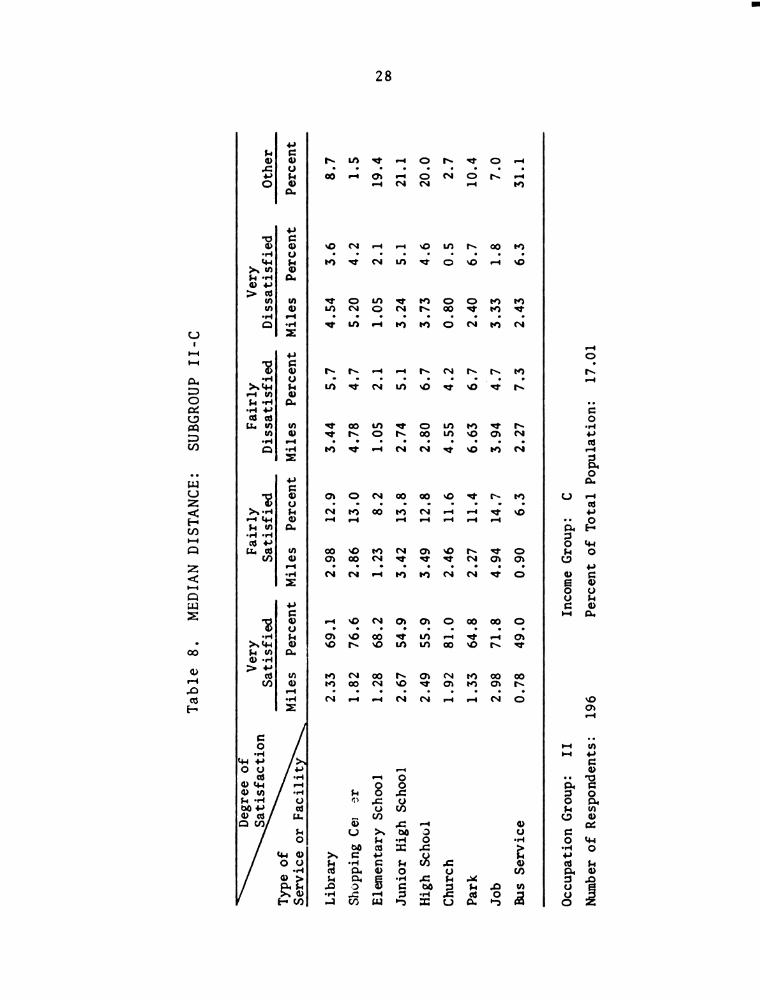
Table
8.
MEDIAN
DISTANCE:
SUBGROUP
II-C
Degree
of
Satisfaction
Type
of
Service
or
Facility
Library
Shopping
Ce]
er
Elementary
School
Junior
High
School
High
School
Church
Park
Job
Bus
Service
Very
Satisfied
Fairly
Satisfied
Fairly
Dissatisfied
Very
Dissatisfied Miles
2.33
1.82
1.28
2.67
2.49
1.92
1.33
2.98
0.78
69.1
76.6
68.2
54.9
55.9
81.0
64.8
71.8
49.0
Percent
Miles
2.98
2.86
1.23
3.42
3.49
2.46
2.27
4.94
0.90
12.9
13.0
8.2
13.8
12.8
11.6
11.4
14.7
6.3
Percent
Miles
3.44
4.78
1.05
2.74
2.80
4.55
6.63
3.94
2.27
5.7
4.7
2.1
5.1
6.7
4.2
6.7
4.7
7.3
Percent
Miles
4.54
5.20
1.05
3.24
3.73
0.80
2.40
3.33
2.43
Percent
3.6
4.2
2.1
5.1
4.6
0.5
6.7
1.8
6.3
Other
Percent
8.7
1.5
19.4
21.1
20.0
2.7
10.4
7.0
31.1
Occupation
Group:
11
Number
of
Respondents:
196
Income
Group:
C
Percent
of
Total
Population:
17.01
28
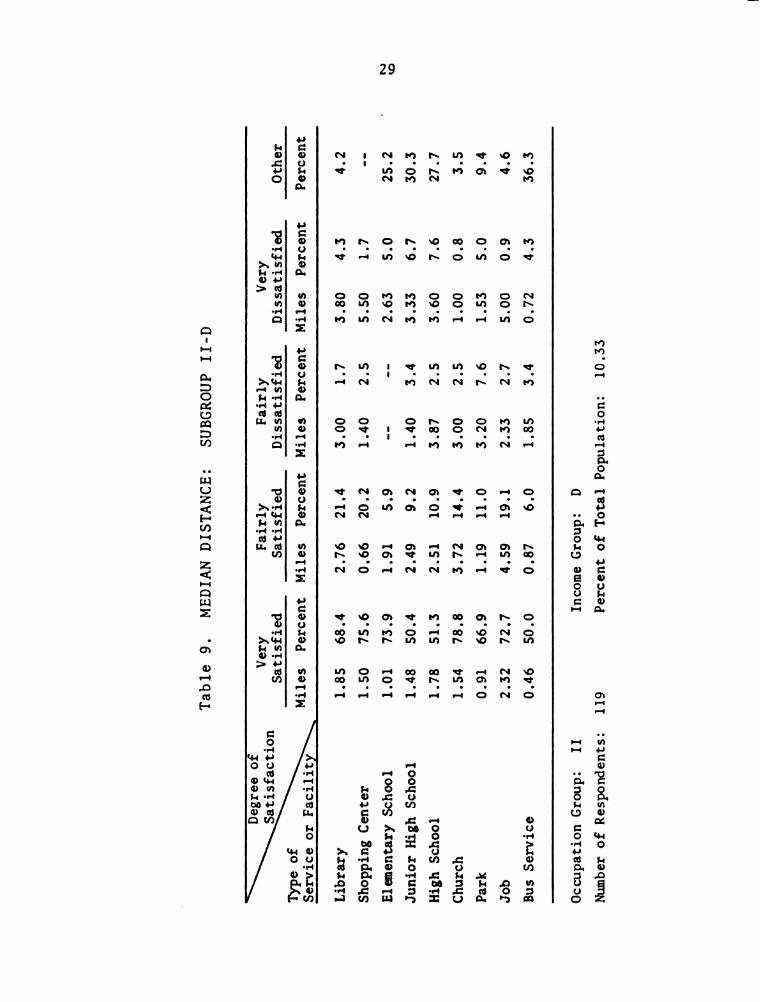
Table
9.
MEDIAN
DISTANCE:
SUBGROUP
II-D
Degreeof
Satisfaction
Type
of
Service
or
Facility
Library
ShoppingCenter
Elementary
School
Junior
High
School
High
School
Church
Park
Job
Bus
Service
Very
Satisfied
Miles
1.85
1.50
1.01
1.48
1.78
1.54
0.91
2.32
0.46
68.4
75.6
73.9
50.4
51.3
78.8
66.9
72.7
50.0
Fairly
Satisfied
Percent
Miles
2.76
0.66
1.91
2.49
2.51
3.72
1.19
4.59
0.87
21.4
20.2
5.9
9.2
10.9
14.4
11.0
19.1
6.0
Fairly
Dissatisfied
3.00
1.40
1.40
3.87
3.00
3.20
2.33
1.85
1.7
2.5
3.4
2.5
2.5
7.6
2.7
3.4
Very
Dissatisfied
3.80
5.50
2.63
3.33
3.60
1.00
1.53
5.00
0.72
Percent
Miles
Percent
Miles
Percent
4.3
1.7
5.0
6.7
7.6
0.8
5.0
0.9
4.3
Other
Percent
4.2
25.2
30.3
27.7
3.5
9.4
4.6
36.3
Occupation
Group:
11
Number
of
Respondents:
119
Income
Group:
D
Percent
of
Total
Population:
10.33
29

Table
10.
MEDIAN
DISTANCE:
SUBGROUP
III-B
Degree
6f—'
Satisfaction
Service
or
Facility
Library
Shopping
Center
Elementary
School
Junior
High
School
High
School
Church
Park
Job
Bus
Service
Very
Satisfied
2.76
2.33
1.53
2.27
2.65
2.01
1.87
3.27
1.06
75.6
81.8
66.7
60.0
68.2
84.4
73.3
76.7
58.8
Fairly
Satisfied
3.80
3.20
4.30
5.53
4.73
3.00
3.53
5.40
2.60
11.1
11.4
8.9
6.7
6.8
6.7
6.7
7.0
4.5
Fairly
3.67
5.00
1.50
1.30
6.00
3.90
9.60
7.00
Dissatisfied
Miles
Percent
Miles
Percent
Miles
6.7
4.5
4.4
4.5
4.4
4.4
4.7
2.3
Percent
Miles
4.00
Dissatisifed
Percent
2.2
2.2
2.3
Other
Percent
4.4
2.3
24.4
24.5
20.5
4.5
13.4
9.3
36.4
Occupation
Group:
111
Number
of
Respondants:
45
Income
Group:
B
Percent
of
Total
Population:
3.91
30
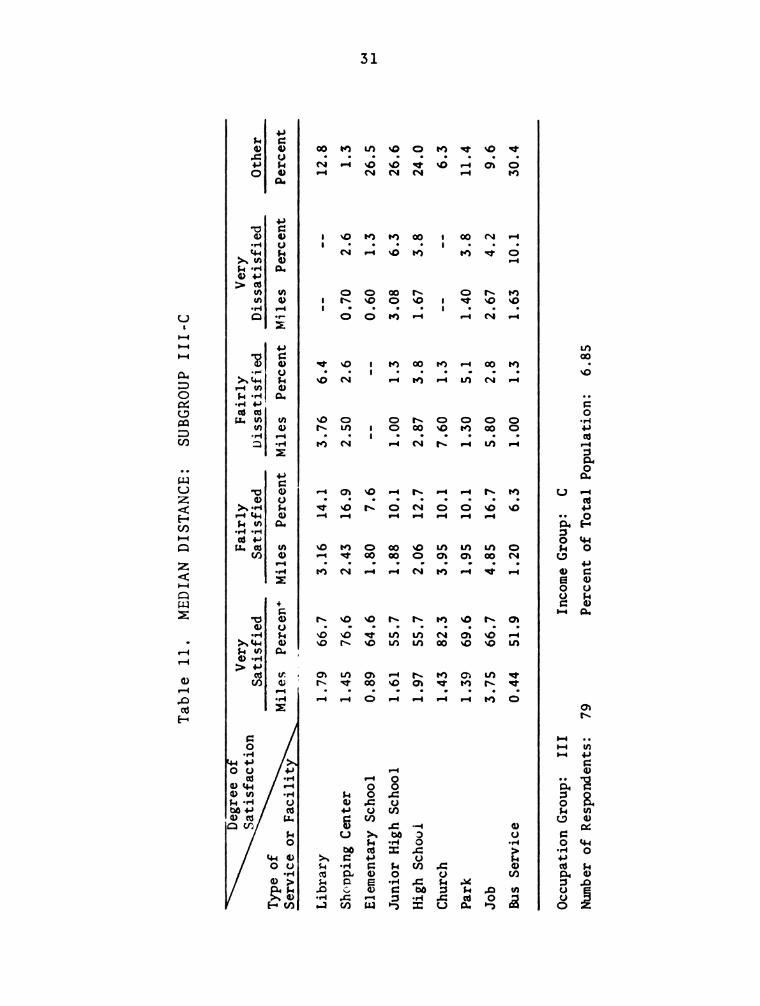
Table
11.
MEDIAN
DISTANCE:
SUBGROUP
III-C
Degree
of
Satisfaction
Very
Fairly
Fairly
Very
Satisfied
Satisfied
Dissatisfied
Dissatisfied
Other
Type
of
..
.Miles
Percen+
Miles
Percent
Miles
Percent
Miles
Percent
Percent
Serv1ce
or
Fac111ty
__
Library
1.79
66.7
3.16
14.1
3.76
6.4
--
12.8
Shopping
Center
1.45
76.6
2.43
16.9
2.50
2.6
0.70
2.6
1.3
Elementary
School
0.89
64.6
1.80
7.6
--
0.60
1.3
26.5
Junior
High
School
1.61
55.7
1.88
10.1
1.00
1.3
3.08
6.3
26.6
High
School
1.97
55.7
2.06
12.7
2.87
3.8
1.67
3.8
24.0
Church
1.43
82.3
3.95
10.1
7.60
1.3
--
6.3
Park
1.39
69.6
1.95
10.1
1.30
5.1
1.40
3.8
11.4
Job
3.75
66.7
4.85
16.7
5.80
2.8
2.67
4.2
9.6
Bus
Service
0.44
51.9
1.20
6.3
1.00
1.3
1.63
10.1
30.4
31
Occupation
Group:
111
Income
Group:
C
Number
of
Respondents:
79
Percent
of
Total
Population:
6.85
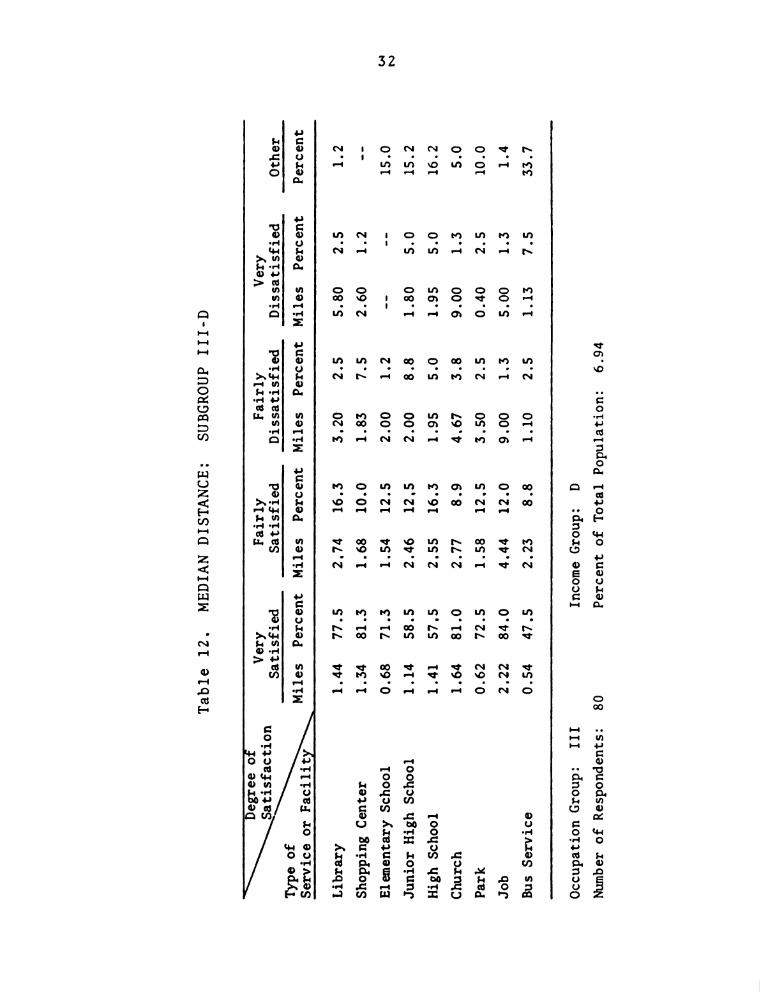
Table
12.
MEDIAN
DISTANCE:
SUBGROUP
III-D
Degree
of
Satisfaction
Very
Fairly
Fairly
Very
Satisfied
Satisfied
Dissatisfied
Dissatisfied
Other
Type
of
Service
or
Facility
Miles
Percent
Miles
Percent
Miles
Percent
Miles
Percent
Percent
Library
1.44
77.5
2.74
16.3
3.20
2.5
5.80
2.5
1.2
Shopping
Center
1.34
81.3
1.68
10.0
1.83
7.5
2.60
1.2
-
Elementary
School
0.68
71.3
1.54
12.5
2.00
1.2
-—
-15.0
Junior
High
School
1.14
58.5
2.46
12.5
2.00
8.8
1.80
5.0
15.2
High
School
1.41
57.5
2.55
16.3
1.95
5.0
1.95
5.0
16.2
Church
1.64
81.0
2.77
8.9
4.67
3.8
9.00
1.3
5.0
Park
0.62
72.5
1.58
12.5
3.50
2.5
0.40
2.5
10.0
Job
2.22
84.0
4.44
12.0
9.00
1.3
5.00
1.3
1.4
Bus
Service
0.54
47.5
2.23
8.8
1.10
2.5
1.13
7.5
33.7
32
Occupation
Group:
111
Income
Group:
D
Number
of
Respondents:
80
Percent
of
Total
Population:
6.94

Table
13.
MEDIAN
DISTANCE:
SUBGROUP
IV-C
Degree
of,
Satisfaction
Very
Fairly
Fairly
Very
Satisfied
Satisfied
Dissatisfied
Dissatisfied
Other
Type
of
_.
..
.Service
orFacilify“\5p
Miles
Percent
Miles
Percent
Miles
Percent
Miles
Percent
Percent
Library
2.53
74.1
1.87
22.2
1.00
3.7
--
-
Shopping
Center
1.15
81.5
4.75
14.8
5.00
3.7
-;-
-
Elementary
School
0.91
74.1
4.00
3.7
--
-—
-22.2
Junior
High
School
2.00
63.0
2.15
14.8
--
--
22.2
High
School
2.07
63.0
2.00
14.8
2.20
3.7
--
18.5
Church
1.14
81.5
3.33
11.1
1.20
3.7
--
3.7
Park
1.18
63.0
0.40
3.7
--
0.40
3.7
29.6
Job
3.50
73.1
7.33
11.5
--
--
15.4
Bus
Service
0.48
59.3
1.00
3.7
--
1.00
3.7
33.3
33
Occupation
Group:
IV
Income
Group:
C
Number
of
Respondents:
27
Percent
of
Total
Pepulation:
2.34
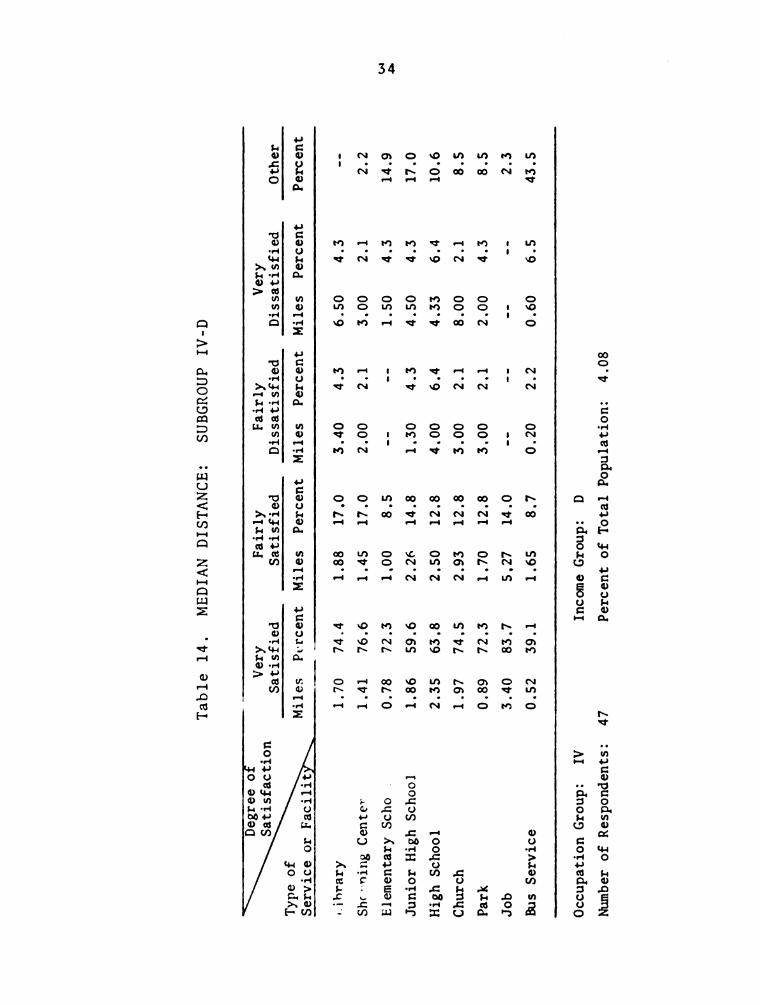
Table
14.
MEDIAN
DISTANCE:
SUBGROUP
IV-D
Degree
of
Satisfaction
Very
Fairly
Fairly
Very
Satisfied
Satisfied
Dissatisfied
Dissatisfied
Other
Type
of
..
.Miles
Percent
Miles
Percent
Miles
Percent
Miles
Percent
Percent
SerV1ce
or
Facilit
Library
1.70
74.4
1.88
17.0
3.40
4.3
6.50
4.3
-
Sh(~ning
Center
1.41
76.6
1.45
17.0
2.00
2.1
3.00
2.1
2.2
Elementary
Scho
.0.78
72.3
1.00
8.5
--
1.50
4.3
14.9
Junior
High
School
1.86
59.6
2.26
14.8
1.30
4.3
4.50
4.3
17.0
High
School
2.35
63.8
2.50
12.8
4.00
6.4
4.33
6.4
10.6
Church
1.97
74.5
2.93
12.8
3.00
2.1
8.00
2.1
8.5
Park
0.89
72.3
1.70
12.8
3.00
2.1
2.00
4.3
8.5
Job
3.40
83.7
5.27
14.0
--
-—
-2.3
Bus
Service
0.52
39.1
1.65
8.7
0.20
2.2
0.60
6.5
43.5
34
Occupation
Group:
IV
Income
Group:
D
Number
of
Respondents:
47
Percent
of
Total
POpulation:
4.08
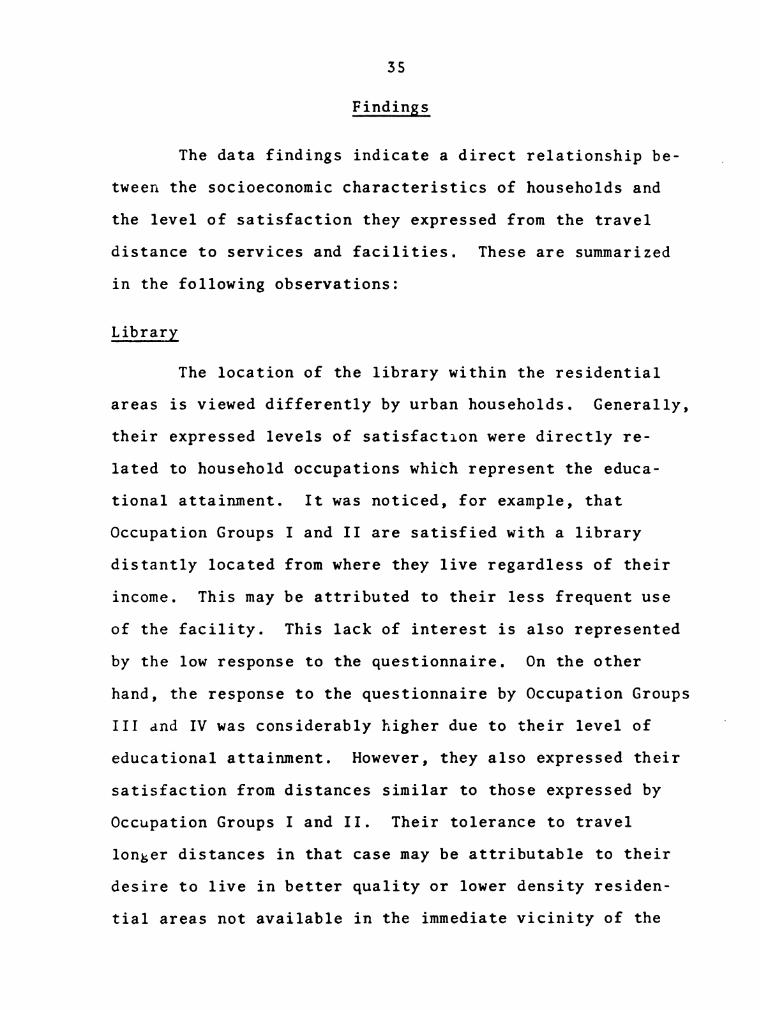
35
Findings
The data findings indicate a direct relationship be-
tween the socioeconomic characteristics of households and
the level of satisfaction they expressed from the travel
distance to services and facilities. These are summarized
in the following observations:
Library
The location of the library within the residential
areas is viewed differently by urban households. Generally,
their expressed levels of satisfaction were directly re-
lated to household occupations whiCh represent the educa-
tional attainment. It was noticed, for example, that
Occupation Groups I and II are satisfied with a library
distantly located from where they live regardless of their
income. This may be attributed to their less frequent use
of the facility. This lack of interest is also represented
by the low response to the questionnaire. On the other
hand, the response to the questionnaire by Occupation Groups
111 and IV was considerably higher due to their level of
educational attainment. However, they also expressed their
satisfaction from distances similar to those expressed by
Occupation Groups I and 11. Their tolerance to travel
longer distances in that case may be attributable to their
desire to live in better quality or lower density residen-
tial areas not available in the immediate vicinity of the

36
library. In all cases, however, the median satisfactory
distance expressed by the households, regardless of income
or occupation, was considerably longer than that recom-
mended by Perry's pr0posa1.
Shopping Center
Unlike the library, the data findings indicate no
relationship between the socioeconomic indices of house-
holds and the travelled distances to shOpping centers. It
was observed, for example, that households of Occupation
Groups I and III have expressed their satisfaction from
similar distances despite the differences in their socio-
economic characteristics. Meanwhile, those of Occupation
Groups II and IV have indicated limited tolerance to travel
longer distances. In general, the median satisfactory dis-
tances to shopping centers were significantly higher than
the maximum distance recommended by Perry's design concept.
This may be attribut‘d to less frequent use or availability
of storage space. Nevertheless, the location of the fa-
cility was of considerable concern to urban households.
This is illustrated by the high response to the question-
naire, ranging from 89 to 98 percent.
Schools
The data findings illustrate that households are
more aware of school locations regardless of their social
or economic characteristics. This can be observed from

37
the increased response to the questionnaire by the majority
of households detected from the smaller percentages of
"don't know" or "other." However, the calculated median
distance to elementary schools were more consistent than
those to junior high or high schools. Such consistency
can be observed from the differences between the shortest
and longest distance expressed by the four occupation
groups. In the case of elementary schools, for example,
the median distances ranged from 0.68 to 0.78 mile for a
difference of 0.1 mile. These ranges were considerably
higher for junior high or high schools where these differ-
ences were 0.77 and 1.16 miles respectively.
The data findings also indicate that the calculated
median distances to school facilities are affected by the
family composition rather than its income level or occupa-
tion. These relationships are obvious in cases of child-
less or retired families belonging to high income house-
holds of all occupation groups. On the other hand, the
awareness to elementary school locations is well repre-
sented by a limited tolerance to travel and high response
to the questionnaire of middle and upper-middle income
households.
Church
The data findings indicate that households are aware
of the church locations. This can be detected from the
frequency of response to all levels of satisfaction and the

38
small percentage given as "don't know” or "other." At the
same time household tolerance continuously increased for
Occupation Groups I, II and 111 but decreased for Occupa-
tion Group IV.
It was also observed that the response to this fa-
cility is similar to that of the elementary school. How-
ever, the tolerance to travel increased considerably. This
is indicated by the calculated median distances for both
facilities. Such increase is attributed to the type of
serVice and frequency of use each facility offers.
Park
The data findings clearly illustrate that households
prefer to live in residential areas in close proximity to
park locations. This is illustrated by the limited toler-
ance to travel observed from the calculated median distances
to the facility regardless of income or occupation.
The awareness to park locations was also expressed
by the household survey. This is reflected by the high
frequency of response to all levels of satisfaction rather
than to "other" or "don't know."
It was also observed that the calculated median dis-
tance ranged from 0.91 to 0.62 mile for Occupation Groups I
and 111, respectively. These slight differences may be at-
tributed to density considerations or the existing types of
park facilities available to the various occupation groups.

39
Job
The data findings indicate a considerable change in
households' tolerance to travel to their place of work.
This can be observed from the calculated median distances
for the various occupation groups. It was observed, for
example, that households belonging to Occupation Groups I
and 11 do not tolerate travelling longer distances. Their
calculated median distances were 0.97 and 1.11 miles re-
spectively. On the other hand, the calculated median dis-
tances for Occupation Groups 111 and IV were 2.22 and 3.40
miles. These differences may be attributed to the social
and economic constraints influencing their decisions to
select their residential areas. While Occupation Groups I
and 11 would prefer to live near work where low cost hous-
ing is available, they also attempt to eliminate transpor-
tation cost or reduce it to a minimum. On the other hand,
Occupation Groups 111 and IV would substitute high trans-
portation cost for better quality residential areas not
available near their place of work.
Bus Service
The data findings show that the calculated median
distances to bus service were the shortest for all given
services and facilities. These ranged from 0.36 to 0.48
mile for Occupation Groups II and IV respectively. It was
also observed that households are aware to the location of

40
public transit routes regardless of their socioeconomic
indices. This is represented by the high frequency of
response to the questionnaire. These observations clearly
indicate that urban households rely on vehicular transpor-
tation to perform their daily activities.

CHAPTER IV
EVALUATION
The previous approach represents an empirical
method used to derive the median distances to services and
facilities from household surveys. These median distances
establish two important guidelines:
1. They illustrate how the different services and
facilities are distributed over the study area.
2. They establish pertinent information indicating
where urban households would choose to locate if a
satisfactory distance from a service or facility is
desired.
These important considerations will be utilized to evaluate
Perry's design proposal. To accomplish this, the previous
observations for household subgroups were combined into
three categories representing low, middle, and high income
households. These are:
tow—Income Households
Annual income: $0,000 to $4,999
Subgroups: I-A and II-A
41
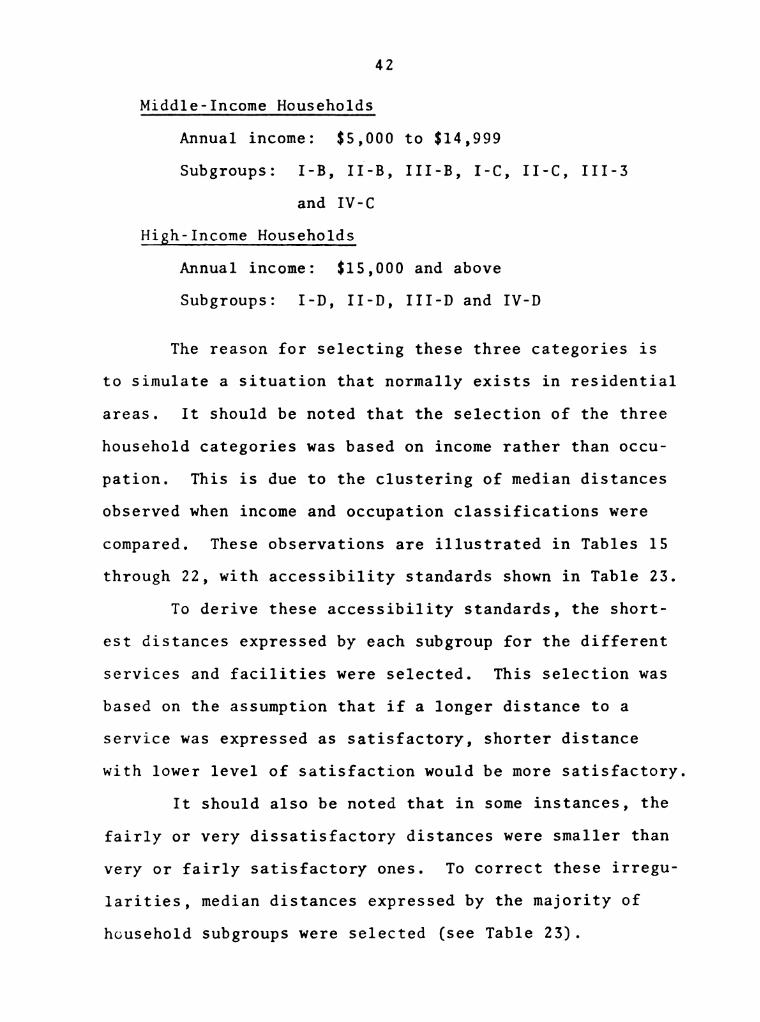
42
Middle-Income Households
Annual income: $5,000 to $14,999
Subgroups: I-B, II-B, III-B, I-C, II-C, III-3
and IV-C
High-Income Households
Annual income: $15,000 and above
Subgroups: I-D, II-D, III-D and IV-D
The reason for selecting these three categories is
to simulate a situation that normally exists in residential
areas. It should be noted that the selection of the three
household categories was based on income rather than occu-
pation. This is due to the clustering of median distances
observed when income and occupation classifications were
compared. These observations are illustrated in Tables 15
through 22, with accessibility standards shown in Table 23.
To derive these accessibility standards, the short-
est distances expressed by each subgroup for the different
services and facilities were selected. This selection was
based on the assumption that if a longer distance to a
service was expressed as satisfactory, shorter distance
with lower level of satisfaction would be more satisfactory.
It should also be noted that in some instances, the
fairly or very dissatisfactory distances were smaller than
very or fairly satisfactory ones. To correct these irregu-
larities, median distances expressed by the majority of
household subgroups were selected (see Table 23).

Table
15.
SERVICE
AREAS
FOR
LIBRARY
Socio-
economic
%of
P0P-
Service
distancemeiles)
0.50
1.00
1.50
2.00
2.50
3.00
3.50
4.00
4.50
5.00
5.50
6.00
Middle
group
I-A
II-A
I-B
II-B
III-B
I-C
II-C
III-C
IV-C
I-D
II-D
III-D
IV-D
14.32
4.34
5.21
18.58
3.91
3.8
17.01
6.85
2.34
1.04
10.33
6.94
4.08
X
43
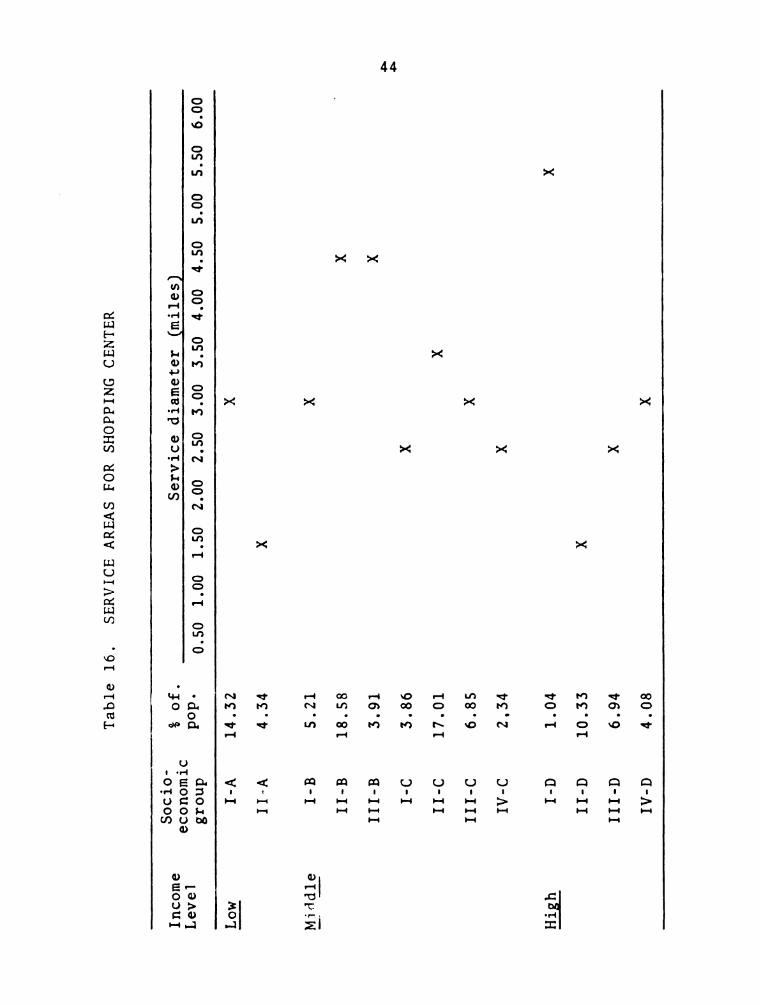
Table
16.
SERVICE
AREAS
FOR
SHOPPING
CENTER
Income
Level
Socio-
economic
group
%of.
P0P-
Service
diameter
(miles)
0.50
1.00
1.50
2.00
2.50
3.00
3.50
4.00
4.50
5.00
5.50
6.00
Low
I-A
II-A
I-B
II-B
III-B
I-C
II-C
III-C
IV-C
I-D
II-D
III-D
IV-D
14.32
4.34
5.21
18.58
3.91
3.86
17.01
6.85
2.34
1.04
10.33
6.94
4.08
X
44

Table
17.
Income
Level
Socio-
economic
group
%of
P0P-
SERVICE
AREAS
FOR
ELEMENTARY
SCHOOL
Service
diameter
(miles)
0.50
1.00
1.50
2.00
2.50
3.00
3.50
4.00
4.50
5.00
5.50
6.00
Low
Middle
I-A
II-A
I-B
II-B
III-B
I-C
II-C
III-C
IV-C
I-D
II-D
III-D
IV-D
14.32
4.34
5.21
18.58
3.91
3.86
17.01
6.85
2.34
1.04
10.33
6.94
4.08
X
45

Table
18.
SERVICE
AREAS
FOR
JUNIOR
HIGH
SCHOOL
oi
-S
co
9of
Income
Service
diameter
(miles)
Level
economic
pop
grOLq1
'0.50
1.00
1.50
2.00
2.50
3.00
3.50
4.00
4.50
5.00
5.50
6.00
Low
I-A
14.32
X ><
II-A
4.34
Middle
I-B
5.21
X
II-B
18.58
X
III-B
3.91
X
I-C
3.86
X
II-C
17.01
X
III-C
6.85
X
IV-C
2.34
X
High
I-D
1.04
X
II-D
10.33
X
III-D
6.94
X
IV-D
4.08
X
46

Table
19.
SERVICE
AREAS
FOR
HIGH
SCHOOL
Income
Level
Socio-
economic
group
Service
diameter
(miles)
0.50
1.00
1.50
2.00
2.50
3.00
3.50
4.00
4.50
5.00
5.50
6.00
Low
Middle
I-A
II-A
I-B
II-B
III-B
I-C
II-C
III-C
IV-C
I-D
II-D
III-D
IV-D
X X
47

Table
20.
SERVICE
AREAS
FOR
CHURCH
Income
Level
Socio
economic
grOUp
Service
diameter
(miles)
0.50
1.00
1.50
2.00
2.50
3.00
3.50
4.00
4.50
5.00
5.50
6.00
Low
Middle
I-A
II-A
I-B
II-B
III-B
I-C
II-C
III-C
IV-C
I-D
II-D
III-D
IV-D
14.32
4.34
1.04
10.33
6.94
4.08
X
.
X A
48

Table
21.
SERVICE
AREAS
FOR
PARK
Socio-
Income
of
Service
diameter
(miles)
economic
group
°\° Du
1L9V€1~
Op'
0.50
1.00
1.50
2.00
2.50
3.00
3.50
4.00
4.50
5.00
5.50
6.00
Low
I-A
14.32
X
II-A
4.34
X
Middle
I-B
5.21
X
II-B
18.58
X
III-B
3.91
X
I-C
3.86
X
II-C
17.01
X
III-C
6.85
X
IV-C
2.34
X
High
1-0
1.04
x
II-D
10.33
x
III-D
6.94
x
IV-D
4.08
x
49

Table
22.
SERVICE
AREAS
FOR
BUS
SERVICE
Income
Level
Socio-
economic
group
Service
diameter
(miles)
0.50
1.00
1.50
2.00
2.50
3.00
3.50
4.00
4.50
5.00
5.50
6.00
Low
Middle
I-A
II-A
I-B
II-B
III-B
I-C
II-C
III-C
IV-C
I-D
II-D
III-D
IV-D
5.21
18.58
3.91
2.86
17.01
6.85
2.34
1.04
10.33
6.94
4.08
X >< ><><><><
SO
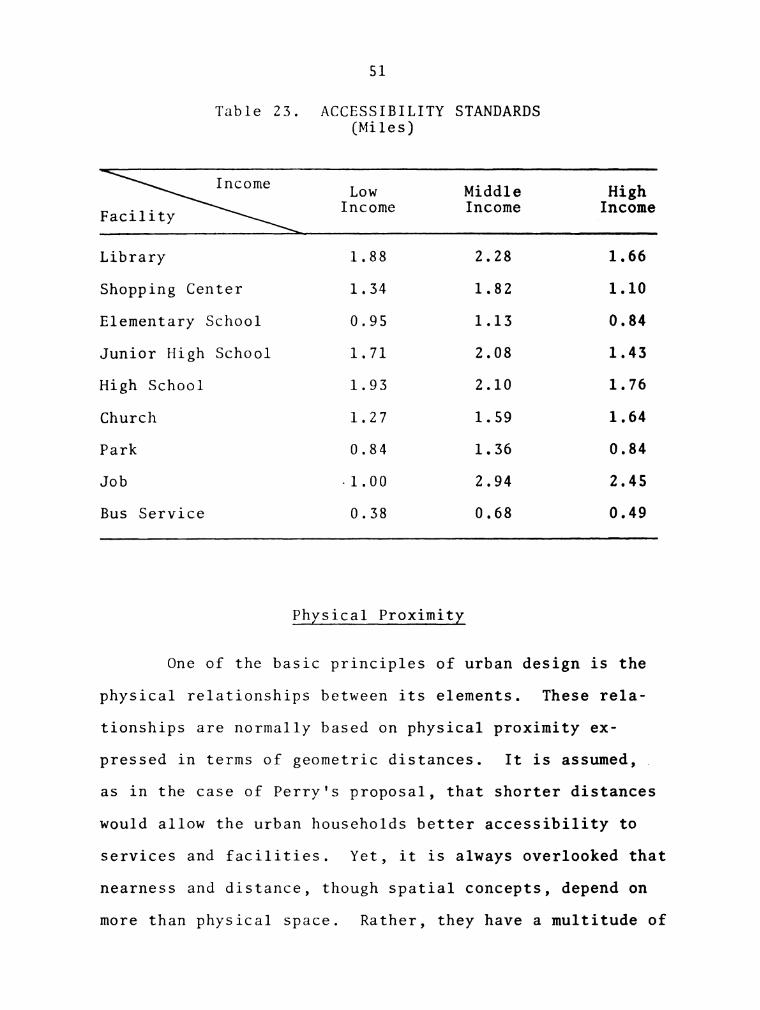
51
Table 23. ACCESSIBILITY STANDARDS
(Miles)
Income Low Middle High
Facility Income Income Income
Library 1.88 2.28 1.66
Shopping Center 1.34 1.82 1.10
Elementary School 0.95 1.13 0.84
Junior High School 1.71 2.08 1.43
High School 1.93 2.10 1.76
Church 1.27 1.59 1.64
Park 0.84 1.36 0.84
Job 1.00 2.94 2.45
Bus Service 0.38 0.68 0.49
Physical Proximity
One of the basic principles of urban design is the
physical relationships between its elements. These rela-
tionships are normally based on physical proximity ex-
pressed in terms of geometric distances. It is assumed, .
as in the case of Perry's proposal, that shorter distances
would allow the urban households better accessibility to
services and facilities. Yet, it is always overlooked that
nearness and distance, though spatial concepts, depend on
more than physical space. Rather, they have a multitude of

52
social, economic and cultural dimensions as well.
These aspects have been illustrated by the derived
accessibility standards where a change in income level was
always accompanied by a change in the median distance to
the same service or facility.
These significant changes may be attributable to
many reasons. In the case of low-income households, for
example, the tolerance to travel was limited. This is due
to their economic constraints which prevent them from af-
fording desirable means of tranSportation or limiting their
choice to locate in close proximity to the needed services
or facilities or both.
Such limited tolerance to travel was also expressed
by high-income households despite the absence of the eco-
nomic constraints to limit their locational choice or pre-
vent them from affording convenient means of transportation.
Their dissatisfaction at travelling longer distances,
therefore, originates from their desire to spend less time
on essential daily activities in order to allocate more
time to other conveniences and enjoyments they can easily
afford.
As for the accessibility standards expressed by
middle-income households, the travel tolerance was con-
siderably higher than that expressed by low or high-income
households. This may be attributable to the high mobility
rates which characterize this income level. Their

53
endurance to travel longer distances, therefore, is a
product of their particular life style and their desire to
obtain better quality services.
sions:
The above discussion leads to the following conclu-
That design considerations should not be based on
shorter geometric distances if a meaningful physical
arrangement of services and facilities is to be
accomplished. Rather, the social and cultural di-
mensions should be equally considered.
That the socioeconomic characteristics of households
have a considerable impact on the design arrange-
ments and the physical relationships of its elements.
Accordingly, one particular design proposal should
not be recommended for urban communities. Rather,
there are at least three alternative proposals most
suited for the three income levels.
Walking Distance Concept
One of Perry's principles is to arrange services and
facilities within small units of 0.25 mile radius. Such
arrangement was meant to achieve two purposes. First, to
locate services and facilities within a walking distance
from area residents. Second, to eliminate unnecessary
traffic movements, thereby introducing measures of safety
to the residential environment.

54
However, the derived accessibility standards clearly
indicate a considerable increase in household tolerance to
travel. In all cases surveyed, these accessibility stan-
dards were three to five times those recommended by Perry's
proposal.
These observations lead us to believe that our ac-
tivity patterns are no longer based on the walking distance
idea. This is due to the availability of the car, afford-
ing'duaurban pOpulation with more mobility, convenience and
better accessibility which conforms with our ways of life.
One may conclude, therefore, that Perry's design
configurations do not coincide with the activity patterns
expressed by the urban households. Neither is there any
assurance that the car will be ignored if services and
facilities are placed within a walking distance from these
households.
Density Considerations
One of the basic principles of land use planning
involves the proper balance between residential density and
the services and facilities needed to serve urban house-
holds. This is evident in high density residential areas
where closely Spaced services and facilities would be re-
quired to serve more households. Similarly, low density
residential areas are served by widely spaced services for
the same number of households.

55
This rule of thumb does not coincide with Perry's
recommended standards due to the difficulty involved in
implementing them in large urban areas. This difficulty
originates from density variations ranging from less than
five to more than thirty dwelling units per acre. In such
a case, the implementation of Perry's standards would be
either inefficient and more expensive to operate or would
impose financial burdens on local authorities.
Design Arrangements
The derived accessibility standards also illustrate
that the distribution of services and facilities does not
follow the same pattern recommended by Perry's proposal.
Service areas of elementary schools, for example, do not
coincide with library or church locations. This is due to
the differences of activity patterns involved in each
situation and the nature of service offered by each fa-
cility. Grouping of these facilities in that case would
generate unrelated and conflicting activities.
Design Core
Perhaps the most important element of Perry's design
proposal is the elementary school. Its capacity determines
the number of families that can live in a particular area.
Boundaries are fixed so that a particular physical distance
of 0.25 mile may not be exceeded. Its location was

56
selected as the focal point of other facilities such as a
community center, library and churches. Such accumulated
assumptions tend to over-emphasize the importance of the
elementary school. Yet, it only affects a small segment of
the urban pOpulation. These views were clearly stated by
Gans as:
The elementary school which is the center of the plan-
ner's neighborhood actually impinges on only a minority
of the residents. Its activities only affect the com-
pulsory clientele, the parents of those students who
take an interest in the school and other adults who
participate in the organizational activities that are
centered in the school. Residents without school-age
children,and those without interest in their children's
schooling or in the organizational participation are
little touched by it.1
Not only does this over-emphasis favor young families
with young children, but it also disregards the needs of
other households in various life cycles such as the unmar-
ried, the childless and parents with older children. One
may expect, therefore, that any changes in the social
characteristics of area residents--and this more than
likely will occur in the long run--will alter the basic
principles of the urban design concept.
It has also been known that educational institutions
are vulnerable to technical and political changes. Techni-
cal changes have been felt through the introduction of mass
media, visual aids, group teaching and other educational
techniques. Such changes have been experienced in other
1Gans, People and Plans, p. 23.

57
parts of the world such as Sweden and the Soviet Union
where a complete reorganization of the physical configura-
tions of the design scheme became necessary.1
Political changes are evident from the recent Su-
preme Court decisions on school busing in order to achieve
social and cultural integration among urban populations.
If these decisions became strictly enforced, the close
proximity of the elementary school would not serve the
purpose intended by Perry's proposal.
Implementation
Although there was a considerable emphasis involving
the types and locations of services and facilities recom-
mended by Perry's design proposal, there was no indication
of how these specific arrangements would be implemented.
The services and facilities in question can be classified
into three categories. Some like shopping centers are owned
and Operated by private enterprise; others such as schools
and libraries are owned and operated by public institu-
tions; still others, such as churches, belong to semi-
public organizations.
The decisions to provide these services and facili-
ties vary considerably. Public facilities, for example,
are Sponsored by public institutions for non-profit
1”Draft Report, Theme 2: Planning and Construction
of New Towns," Ekistics, XVIII (1964), 283-288.

58
purposes. The provision of such facilities is undertaken
by governing bodies on a community-wide basis. Provisions
of privately owned facilities, on the other hand, are based
on independent decisions motivated by profit making initia-
tives to minimize economic risk and insure the continuation
of Operation. These decisions are undertaken independently
from one another. This issue raises the question of how
the priorities are determined. They also involve coordi-
nating Unitiming of deveIOpments unrelated in terms of
need, function and allocation of financial resources.
It should also be noted that decisions to provide
services and facilities, public or private, are determined
according to the existing and expected demands for resi-
dential expansions. These, in turn, vary from one situa-
tion to another. In the case of new towns, for example,
decisions are undertaken on a macro scale. These, however,
are rare exceptions which cannot be applied in well estab-
lished urban communities. On the other hand, the provision
of services and facilities in older communities or residen-
tial expansions would be difficult to accomplish because
they have to be coordinated with the existing pattern.

CHAPTER V
ANALYSIS, MODIFICATIONS AND RECOMMENDATIONS
Analysis
It is obvious that most of the problems associated
with Perry's design proposal originate from its rigidity.
This rigidity is created by the limitations imposed on
size, boundaries design arrangements and standards. Other
problems stem from the over-emphasis allocated to the ele-
mentary school by giving it the role of controlling the
locations of other facilities. This over-emphasis repre-
sents the risk involved when a change in its function or
operation becomes necessary. Changes of this nature re-
quire a total reassessment of the design standards, and
also a complete rearrangement of its spatial relationships.
It was also assumed that the life styles, norms and
activity patterns of urban households are similar. Accord-
ingly, a single design was proposed. However, the derived
accessibility standards expressed by the urban population
suggest the need for different design arrangements due to
the variations in their socioeconomic characteristics.
In addition, other issues relating to density con-
siderations and the flexibility required to accommodate for
59

60
possible social, political or technological changes were
also ignored.
Such problems should be avoided whenever attempts at
modifications or alternative proposals are sought. These
may be arranged according to the following guidelines:
1. Maintain maximum flexibility to allow for future
changes. This can be achieved by eliminating the
constraints imposed on size and boundaries.
Provide services and facilities as needed by each
group of households according to their socioeconomic
characteristics.
Establish accessibility standards for the location
of services and facilities. These should be based
on extensive household surveys. Incorporating
these accessibility standards would prOvide meaning-
ful design guidelines for alternative prOposals.
Provide for alternative means of accessibility not
limited to the ”walking distance” concept.
Avoid the centralization of unrelated services and
facilities. This can be achieved by investigating
the various activity patterns performed elsewhere by
urban households. Based on this investigation, the
location (fl? services and facilities can be easily
determined.

61
Modifications
Possible modifications should maintain the proper-
ties discussed earlier. Such modifications cannot be
achieved without changing the design arrangements of ser-
vices and facilities. Modifying the design standards in
order to coincide with those derived would mean that three
different solutions would be required for the three income
groups. Also, necessary adaptation of services and facili-
ties locations means the elimination of the design core.
Such modifications are difficult to achieve without dis-
rupting Perry's design principles and arrangements. Ac-
cordingly, an alternative proposal for the design arrange-
ments of residential units will be presented.
Recommendations
These residential units should include services and
facilities selected according to the following:
Classification of Services
and Facilities
Services and facilities fall into two different
categories: local and non-local. Local facilities may be
defined as those which provide services for a group of
households sharing a small geographic area and seldom used
by others. Non-local facilities, on the other hand, are
those shared by various residential units. These are:

62
Local Facilities--Elementary school and recreational
facilities.
Non-Local Facilities--Shopping center, junior high and
high schools, churches and libraries.
Primary and Secondary
Services and Facilities
Each category of services and facilities includes
primary and secondary ones. Primary facilities are those
which provide households with basic needs. Secondary
facilities are those not directly related to basic needs.
Primary Facilities-~Shopping center, schools and open
space.
Secondary Facilities—-Library and church.
Classification of Activity Patterns
Activity patterns can be classified according to the
intensity, duration and frequency that a service or fa-
cility is used by urban households. Intensive activities
are determined by the number of people using the facility.
Duration of activities are measured by the length of time
a facility is being used. The frequency of activities can
be determined by the number of times a facility is used in
a given period.
Based on these considerations, services and facili-
ties are classified according to various characteristics
of activity patterns. These are:

63
a. Classification by Intensity
High Intensity--Schools and open space.
Low Intensity--Shopping center, library and church.
b. Classification by Duration
Long Duration--Schools and open space.
Short Duration-~Shopping center, library and church.
c. Classification by Frequency
High Frequency--Schools and open space.
Low Frequency--Shopping center, library and church.
Design Considerations
The proposed design aims to incorporate several resi-
dential units into a district. Services and facilities
needed for each residential unit are selected from those
which do not impose size, capacity or boundary constraints.
They are also selected from those which provide basic needs,
and which are more intensely and frequently used for long
durations.
Accordingly, open space is the only service or fa-
cility which meets these requirements. In addition, its
flexibility permits various possibilities for easy adapta-
tion to future changes. Also, it facilitates the provision
of different design arrangements, upgrades the physical
appearance and contributes to the aesthetic quality of the
residential environment. Furthermore, it provides for
space needs to solve unforeseeable problems and help

64
integrate the circulation system more efficiently.
Other facilities such as schools, shopping centers,
libraries and churches were intentionally excluded from the
local units due to the different constraints they impose on
the design. However, these facilities should be included
on the district level. Their locations should be selected
according to the derived accessibility standards expressed
by the urban population.
This guideline proposed for the arrangement of
residential areas can help provide different physical forms
and design arrangements that coincide with the various
socioeconomic characteristics of households. It can also
help distribute services and facilities according to their
specific needs. It can allow various densities and housing
qualities for all income levels as well as provide desir-
able and continuous development patterns unrestricted by
size or boundary limitations.
However, it is evident that these guidelines are
based on surveys for a particular metropolitan area. Ac-
cordingly, they should not be considered for other urban
areas unless preceded by similar household surveys. Such
information can also provide valuable knowledge about the
causes and effects of changes which take place in our en-
vironment, and avoid the problems that may arise in the
future.

BIBLIOGRAPHY

BIBLIOGRAPHY
Books
Caplow, Theodore, et al. The Urban Ambience. New Jersey:
Bedminster, 1964.
Dahir, James. The Neighborhood Unit Plan. New York:
Russell sage Foundation, 1947.
Gallion, Arthur B., and Eisner, Simon. The Urban Pattern.
Princeton, N.J.: Van Nostrand Company, Inc., 1963.
Sans, Herbert J. People and Plans, Essays on Urban Prob-
lems and Solhtions. New York: Basic Books, Inc.,
1968.
Howard, Ebenezer. Garden Cities of Tomorrow. London:
Faber and Faber Ltd}, MLF Paperback Edition, 1965.
Kuper, Leo (ed.). Blue Print for LivingTogether. London:
Cresset, 1953T’
Mann, Peter H. An Approach to Urban Sociology. London:
Routledge and Kegan Paul, 1964.
Mumford, Lewis. The City in History. New York: Harcourt,
Brace and World, Inc., 1961.
Perry, Clarence A. Neighborhood and Community Planning.
Vol. VII of The Regional Survey of New York and Its
Environs. New York: Regional Plan of New Yorkiand
Its EnVirons, 1929.
. Housing for the Machine Age. New York: Russell
Sage Foun ation,‘l939.
Reiss, Albert J., Jr. Occupation and Social Status. New
York: The Free Press ofTClencoe, Inc., 1961.
Tetlow, John, et a1. Towns and Traffic. London: Faber
and Faber, 1965.
65

66
Articles and Periodicals
Gans, Herbert J. "Planning and Social Life," Journal of
the American Institute of Planners, XXVII'(May
1961).
Draft Report, Theme 2: ”Planning and Construction of New
Towns," Ekistics, XVIII (1964).
Reports
Tri-County Regional Planning Commission. Format and De-
scription of Data in Card or Tape Form. Eansing,
Mich.: Tri-County Regional Planning Commission,
1967.

"7111117!171191111Illlflflilllllllllll'Es