wait-time based oracle performance management prepared for unyoug presented by matt larson cto,...
TRANSCRIPT
Wait-Time Based Oracle Performance Management
Prepared for UNYOUG
Presented by Matt Larson CTO, Confio Software
2
Who am I?
Founder and CTO of database performance software company
Former DBA consultant specializing in Oracle performance tuning
Co-author of three Oracle books (Oracle Development Unleashed, Oracle Unleashed 2nd Edition, Oracle8 Server Unleashed)
Co-author of two other database related books
3
Agenda
Foundation Case Study One: PL/SQL Issue Case Study Two: Full Table Scans Case Study Three: Inefficient Indexes Case Study Four: Locking Problems Q&A

4
Working the Wrong Problems
After spending an agonizing week tuning Oracle buffers to minimize I/O operations, management typically rewards you with:
• A. An all expense paid vacation• B. A free lunch • C. A stale donut• D. Reward? Nobody even noticed!

5
Tuning Success (or lack thereof)
Your role in the rollout of a new customer facing application results in:
• A. Keys to drive the CEO’s Porsche• B. Keys to use the executive restroom• C. A mop to use in the executive restroom• D. Your office has been moved to the
restroom
6
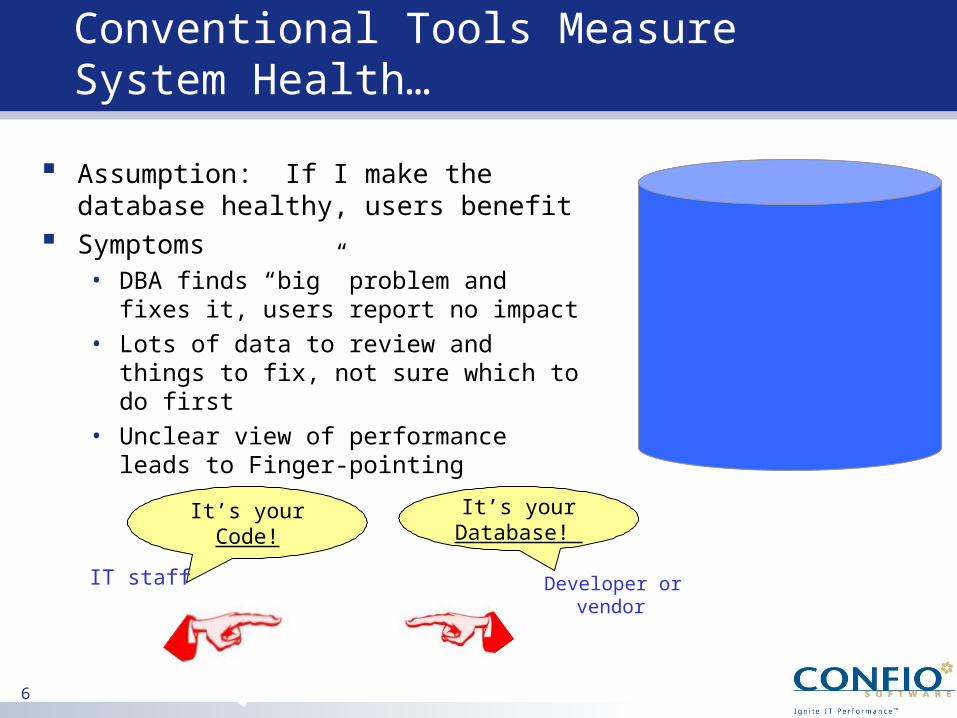
Conventional Tools Measure System Health…
Assumption: If I make the database healthy, users benefit
Symptoms • DBA finds “big” problem and fixes it,
users report no impact• Lots of data to review and things to
fix, not sure which to do first• Unclear view of performance leads to
Finger-pointing
Developer or vendor
It’s your Code!
It’s your Database!
IT staff

7
…RMM Focuses on User Wait-Time
Identify each bottleneck affecting the user Rank bottlenecks by user impact Implement proven suggestions Set correct expectations on impact of fix Show proof the fix helped users
SQLRequest
SQLResponse
8
RMM: Confio’s Underlying Methodology
Resource Mapping Methodology: Industry best-practice optimizing performance tuning for maximum business impact
Three Key Principles of RMM
1. SQL View: All statistics at SQL statement level
2. Time View: Measure Time, not number of times a resource is utilized
3. Full View: Separately measure every resource to isolate source of problems
9
Illustrating example: SQL View Principle
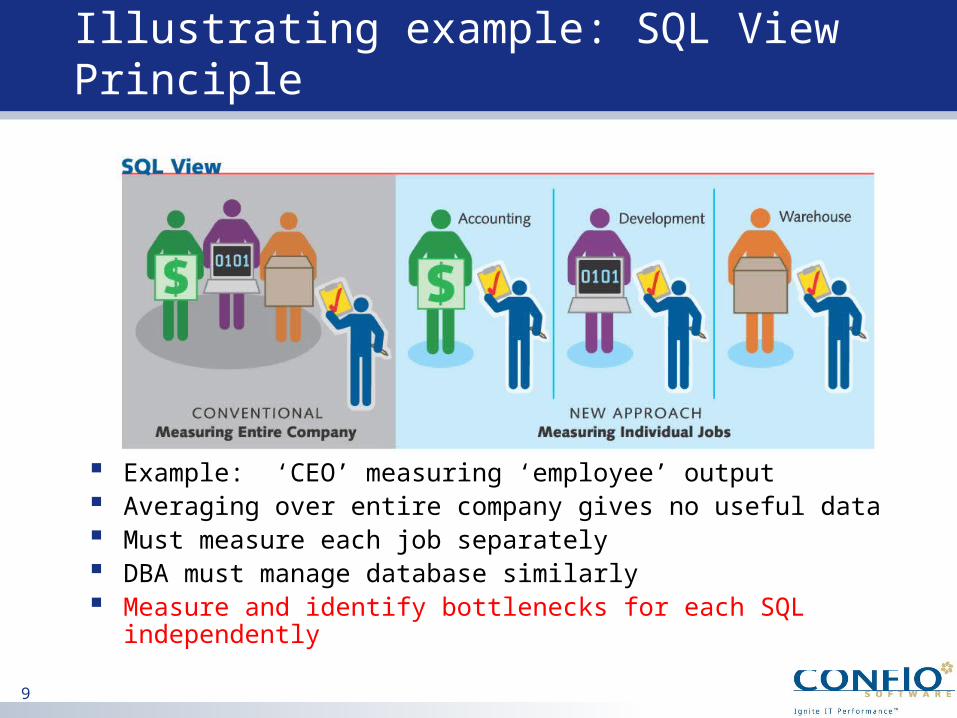
Example: ‘CEO’ measuring ‘employee’ output Averaging over entire company gives no useful data Must measure each job separately DBA must manage database similarly Measure and identify bottlenecks for each SQL
independently
10
Illustrating example: Time View Principle
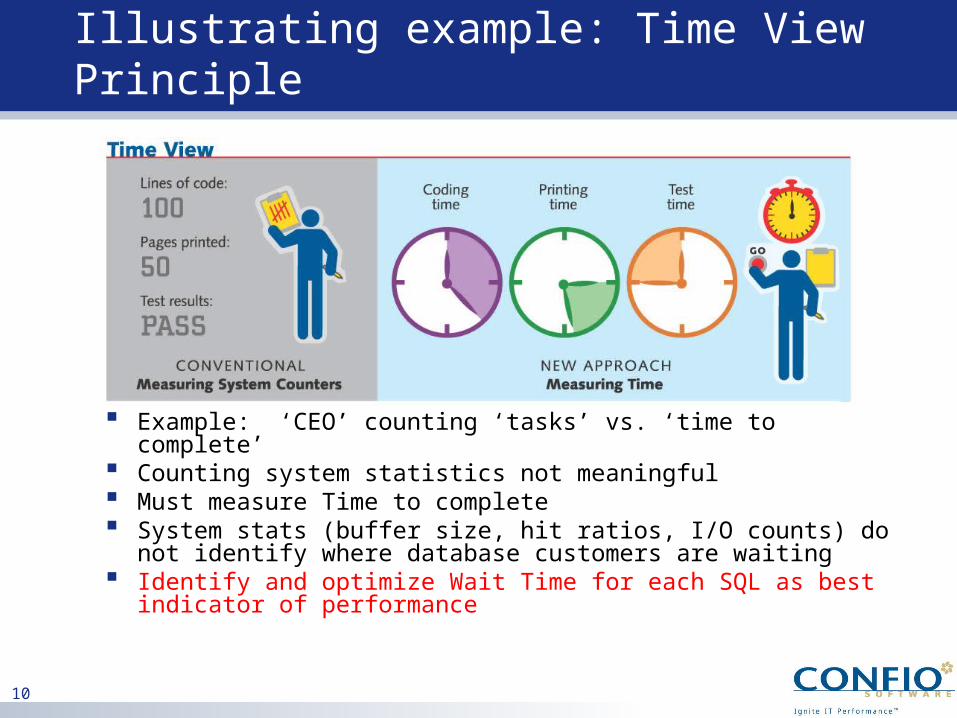
Example: ‘CEO’ counting ‘tasks’ vs. ‘time to complete’ Counting system statistics not meaningful Must measure Time to complete System stats (buffer size, hit ratios, I/O counts) do not
identify where database customers are waiting Identify and optimize Wait Time for each SQL as best
indicator of performance
11
Illustrating example: Full View Principle
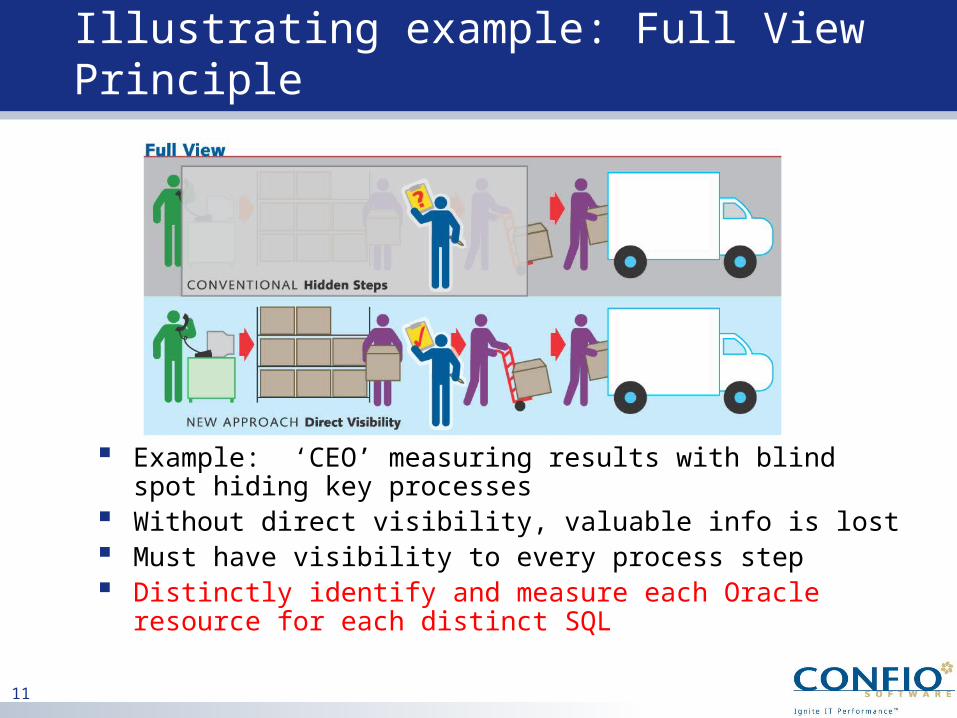
Example: ‘CEO’ measuring results with blind spot hiding key processes
Without direct visibility, valuable info is lost Must have visibility to every process step Distinctly identify and measure each Oracle resource for
each distinct SQL
12
RMM-compliant Performance Tool Types
Two Primary Types of Tools
Session Specific Tools• Tools that focus on one session at a time often by
tracing the process• Examples: tkprof (Oracle), OraSRP Profiler (open
source)
Continuous DB Wide Monitoring Tools• Tools that focus on all sessions by sampling Oracle• Example: Confio Ignite
Both tools have a place in the organization
13
Tracing
Tracing with wait events complies with RMM Should be used cautiously in non-batch
environments due to session statistics skew• 80 out of 100 sessions have no locking contention
issues• 20 out of 100 have spent 99% of time waiting for
locked rows• If you trace one of the “80” sessions, it appears as if
you have no locking issues (and spend time trying to tune other items that may not be important)
• If you trace one of the “20” sessions, it appears as if you could fix the locking problems and reduce your wait time by 99%
14
Tracing (cont)
Very precise statistics, may be only way to get certain statistics
Bind variable information is available Different types of tracing available
providing detail analysis even deeper than wait events
Ideal if a known problem is going to occur in the future (and known session)
Difficult to see trends over time Primary audience is technical user
15
Continuous DB Wide Monitoring Tools
24/7 sampling provides real-time and historical perspective
Allows DBA to go back in time and retrieve information even if problem was not expected
Not the level of detail provided by tracing Most of these tools have trend reports
that allow communication with others outside of the group• What is starting to perform poorly?• What progress have we made while tuning?

16
Case Study OnePL/SQL Issue
18
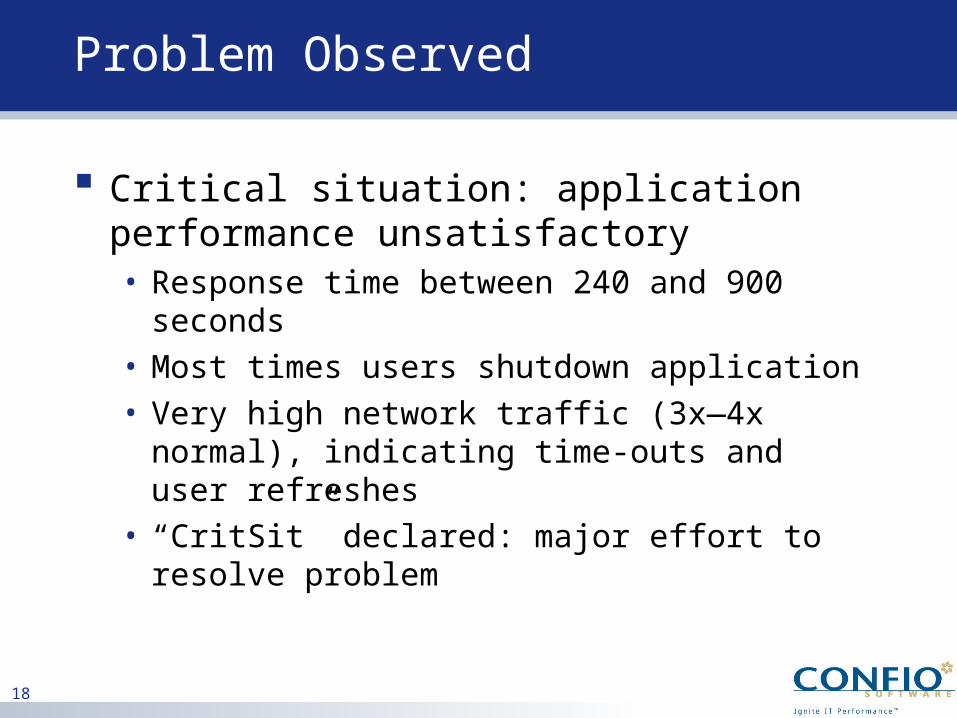
Problem Observed
Critical situation: application performance unsatisfactory• Response time between 240 and 900
seconds• Most times users shutdown application• Very high network traffic (3x—4x normal),
indicating time-outs and user refreshes• “CritSit” declared: major effort to resolve
problem
19
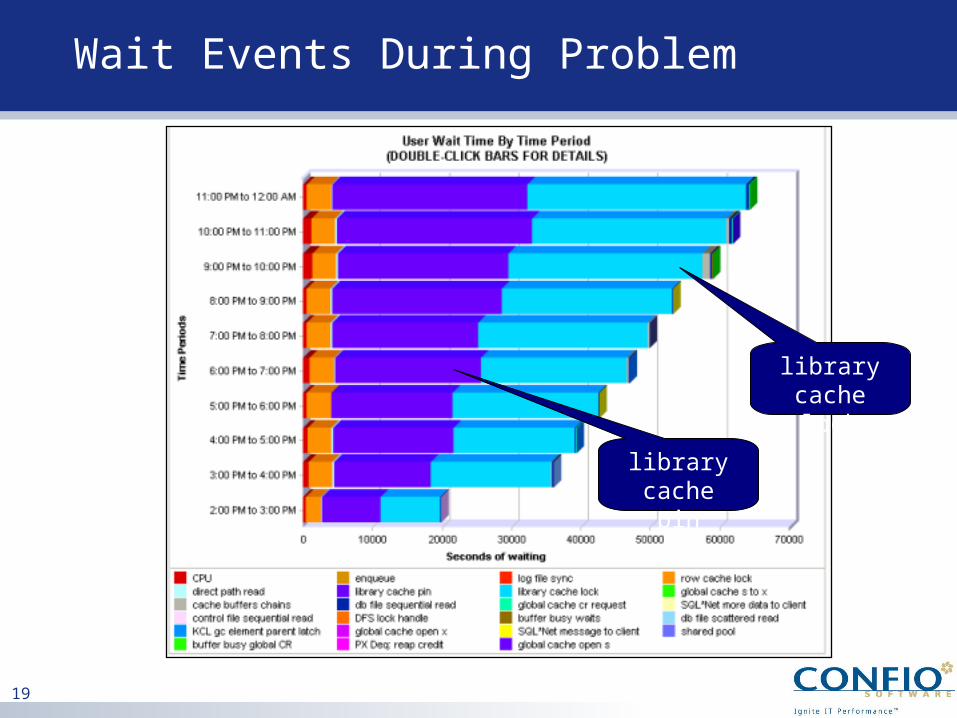
Wait Events During Problem
library cache lock
library cache pin
20
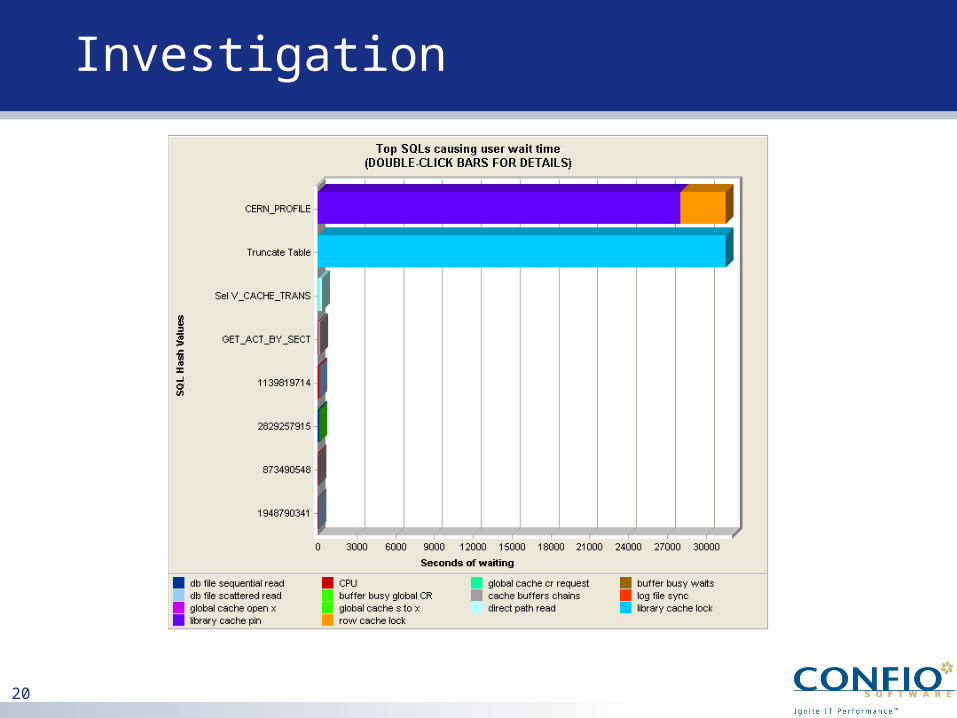
Investigation
21
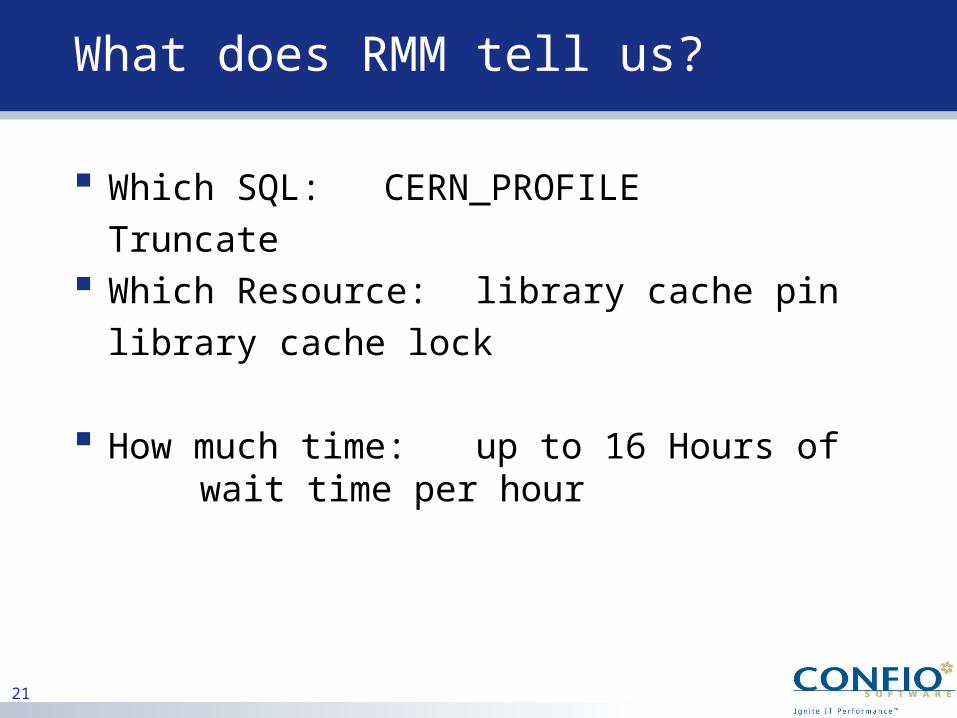
What does RMM tell us?
Which SQL: CERN_PROFILETruncate
Which Resource: library cache pinlibrary cache
lock
How much time: up to 16 Hours of wait time per hour
22
Results
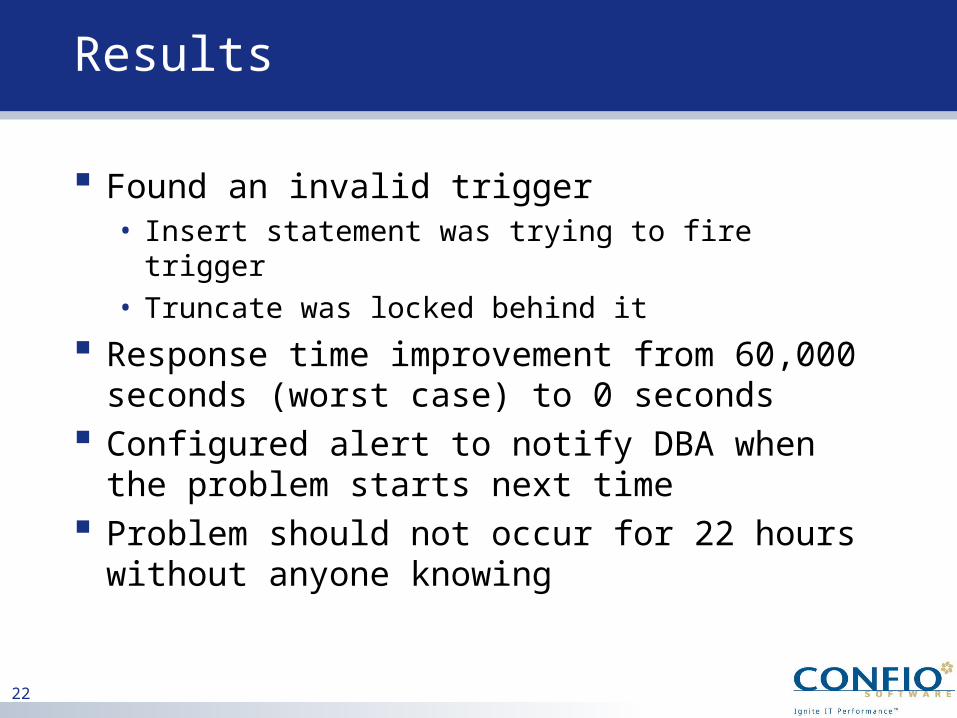
Found an invalid trigger• Insert statement was trying to fire trigger• Truncate was locked behind it
Response time improvement from 60,000 seconds (worst case) to 0 seconds
Configured alert to notify DBA when the problem starts next time
Problem should not occur for 22 hours without anyone knowing
Case Study Two DB File Scattered Reads
24
Problem Observed
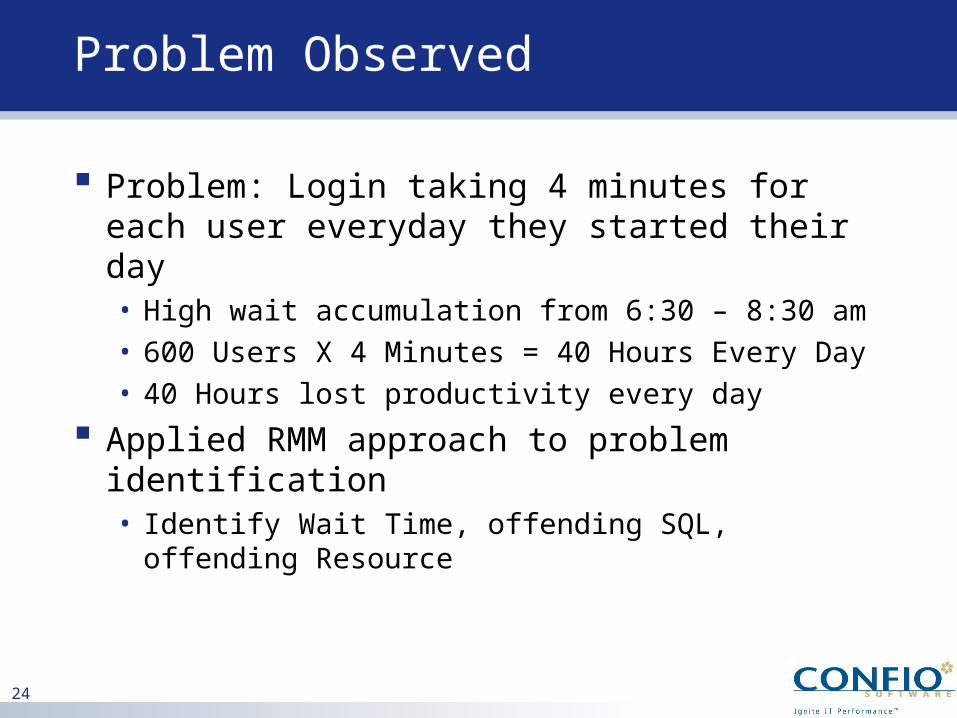
Problem: Login taking 4 minutes for each user everyday they started their day• High wait accumulation from 6:30 – 8:30 am• 600 Users X 4 Minutes = 40 Hours Every Day• 40 Hours lost productivity every day
Applied RMM approach to problem identification• Identify Wait Time, offending SQL, offending
Resource
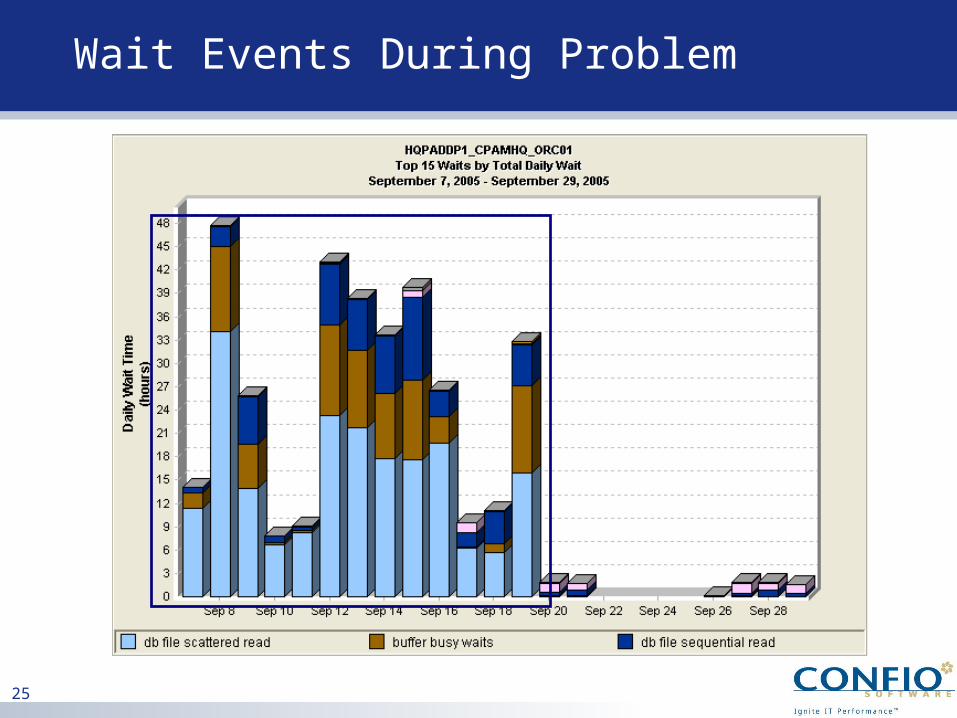
25
Wait Events During Problem
26
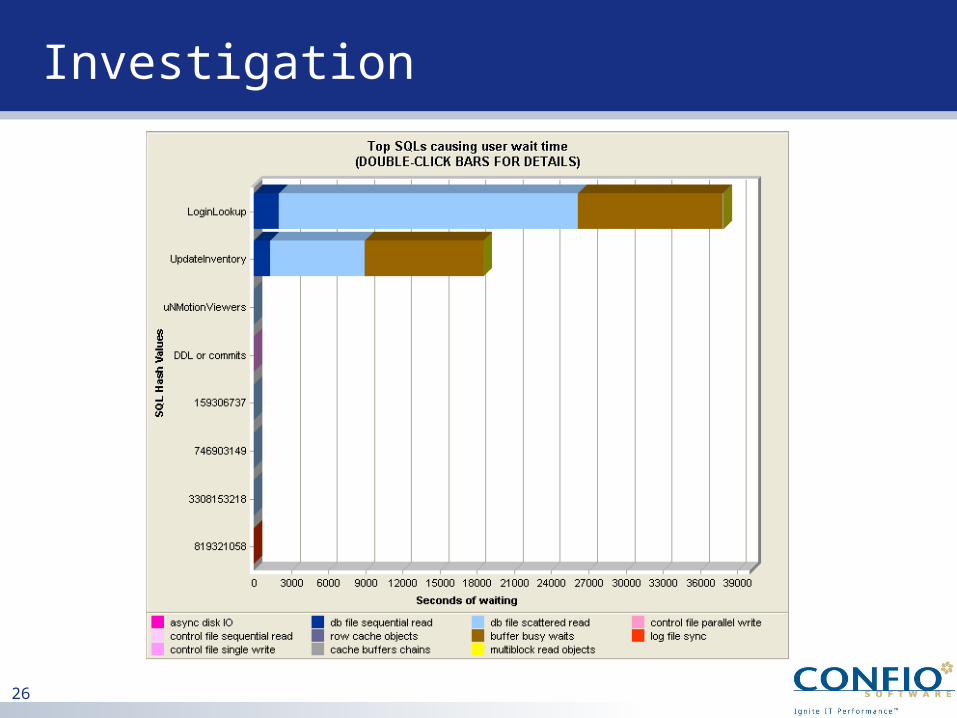
Investigation
27
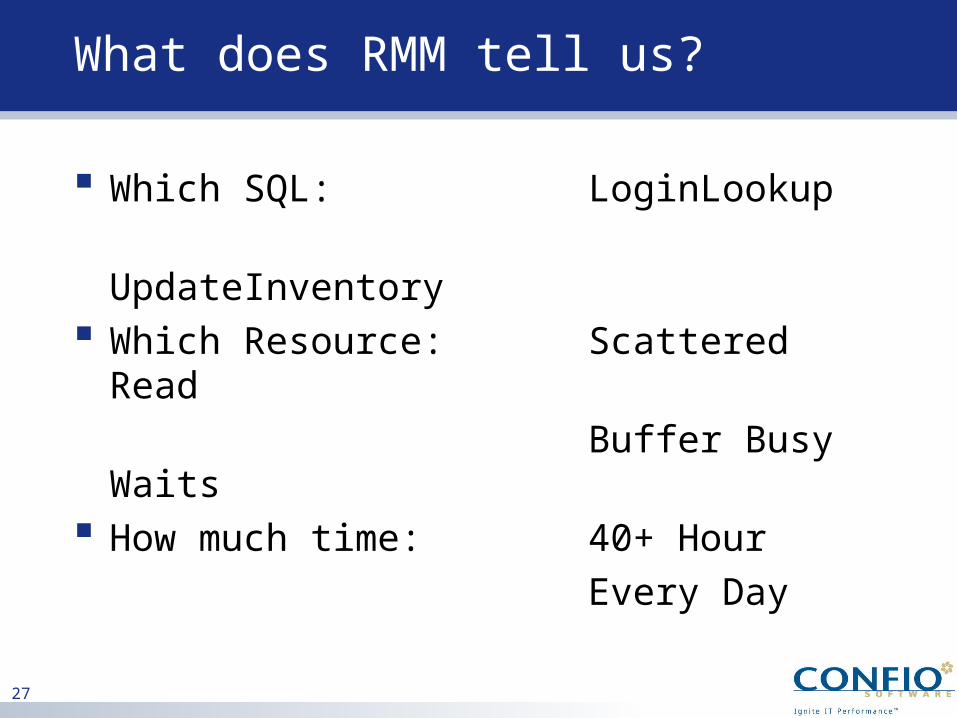
What does RMM tell us?
Which SQL: LoginLookup
UpdateInventory Which Resource: Scattered Read
Buffer Busy Waits
How much time: 40+ HourEvery Day
28
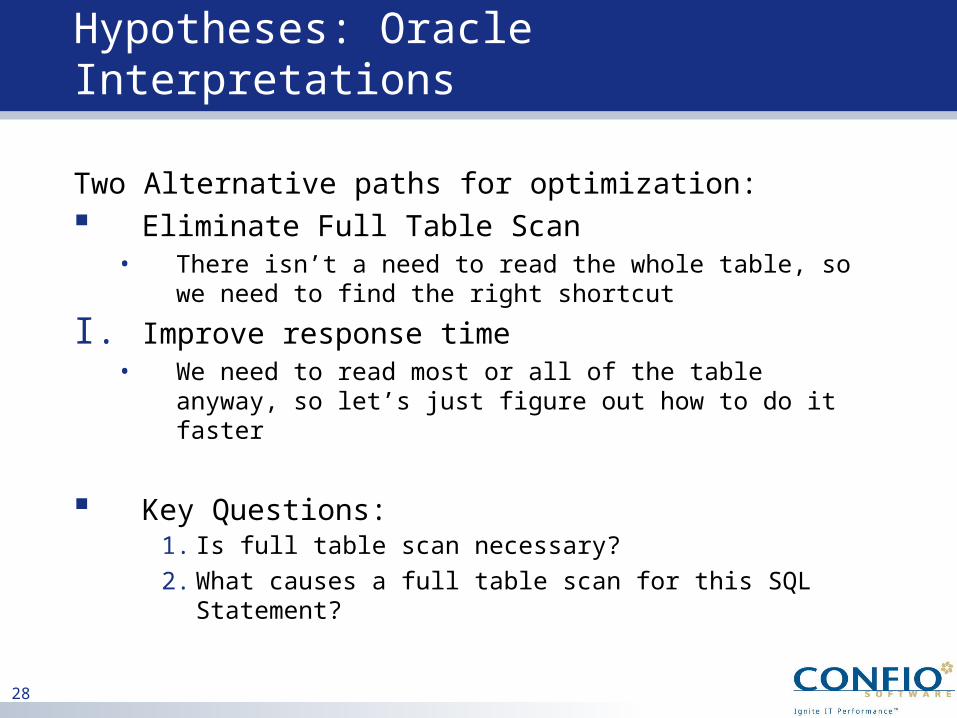
Hypotheses: Oracle Interpretations
Two Alternative paths for optimization: Eliminate Full Table Scan
• There isn’t a need to read the whole table, so we need to find the right shortcut
I. Improve response time• We need to read most or all of the table anyway,
so let’s just figure out how to do it faster
Key Questions: 1. Is full table scan necessary?
2. What causes a full table scan for this SQL Statement?
29
I. Unnecessary Full Table Scan?
Solutions:
• Add / Modify index(es) on the table
• Update table and/or index statistics if proper index not being used
• Add hint to use existing index
• Optimize the application
30
Full Table Scan is Needed
Two alternative paths for optimization:
I. Eliminate Full Table Scan• There isn’t a need to read the whole table,
so we need to find the right shortcut
II. Improve response time• We need to read most or all of the table
anyway, so let’s just figure out how to do it faster
31
Solutions:
• Use Parallel Reads
• Set Database Parameters
• Improve I/O Speed
• Optimize the application
• Larger Database Caches (64-bit)
II. Improve Response Time for Db File Scattered Reads
32
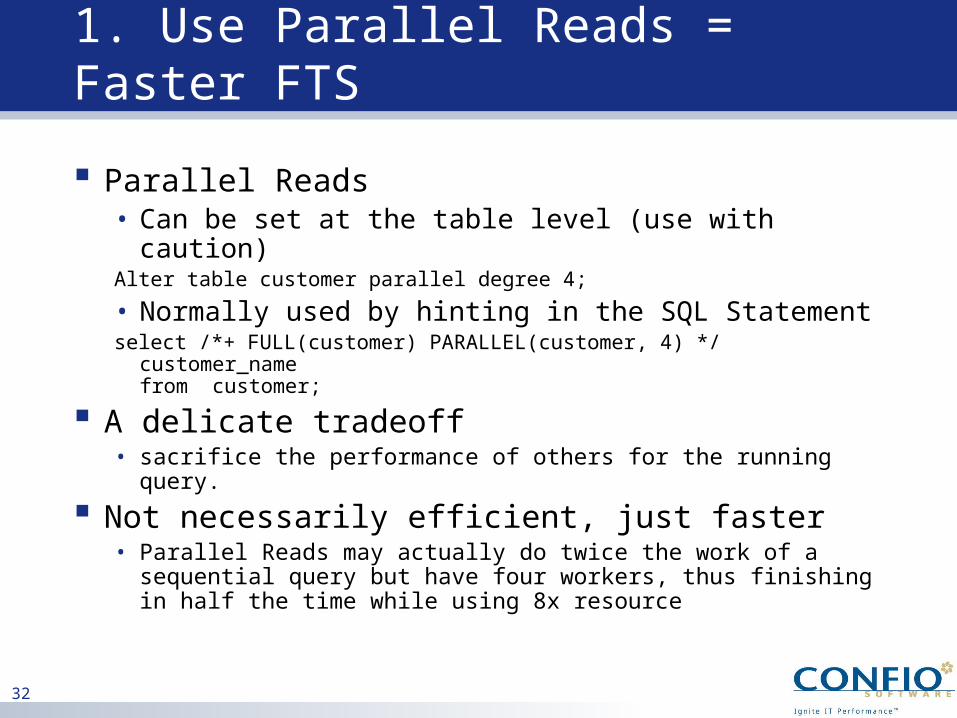
1. Use Parallel Reads = Faster FTS
Parallel Reads• Can be set at the table level (use with caution)Alter table customer parallel degree 4;
• Normally used by hinting in the SQL Statementselect /*+ FULL(customer) PARALLEL(customer, 4) */
customer_namefrom customer;
A delicate tradeoff • sacrifice the performance of others for the running
query.
Not necessarily efficient, just faster • Parallel Reads may actually do twice the work of a
sequential query but have four workers, thus finishing in half the time while using 8x resource
33
2. Set database parameters
DB_FILE_MULTIBLOCK_READ_COUNT• specifies the maximum number of blocks read in one I/O
operation during a sequential scan• Impacts the optimizer• Reduces number of I/Os required• For OLTP, typically between 4 to 16• Optimizer will more likely to FTS if set too high
Ensure that the database read requests are synced up with the O/S.
This gets tricky if different block sizes are used in different tablespaces
34
3. Improve I/O speed
Get your SA involved Investigate I/O sub-system
• Iostat, vmstat, sar, … for potential problems• Monitor during high activity
Investigate contention at the disk/controller level. • Learn which disks share common resources• Use more disks to spread I/O and reduce hot spots
Investigate caching on disk sub-system and current memory usage
35
4. Optimizing the Application
Review application – do you have access to code for changes?
Understand the code around the problem SQL
Techniques to Optimize a statement: • Reduce the number of calls for a SQL
– Caching the data in the application– Creating a summary table (perhaps via a materialized view) – Eliminating the need for the data
• Retrieve Less Data with each statement– Add fields to the WHERE clause
• Combine SQLs for fewer calls– Combine several SQLs with different bind variables into one large
statement that retrieves all the data in one shot
36
5. Larger Database Caches (64-bit)
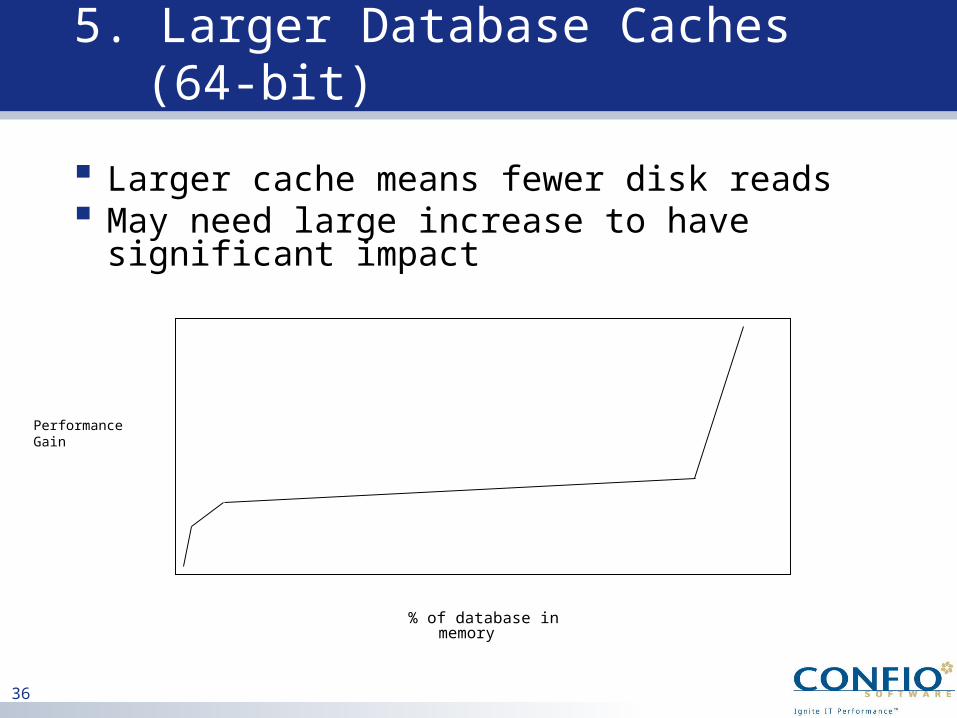
Larger cache means fewer disk reads May need large increase to have
significant impact
Performance Gain
% of database in memory
37
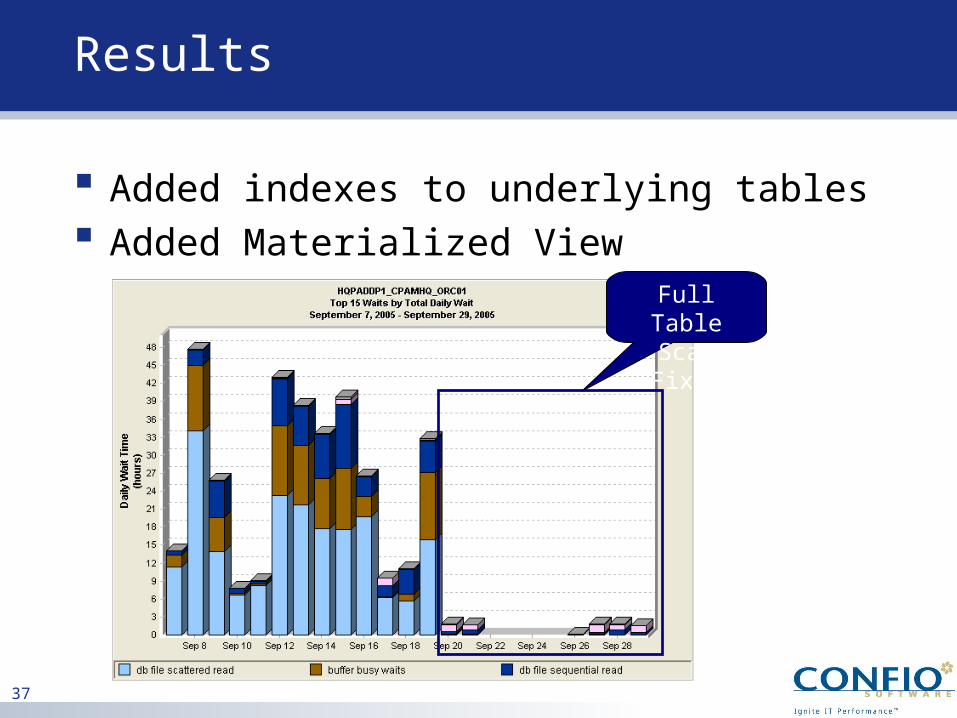
Results
Added indexes to underlying tables Added Materialized View
Full Table Scan Fixed
Case Study Three DB File Sequential Reads
39
Problem Observed
Data Warehouse loads were taking too long
Noticed high wait times on db file sequential read wait event
DBAs were confused – why are data load inserts “reading” data
Applied RMM approach to problem identification• Identify Wait Time, offending SQL, offending
Resource
40
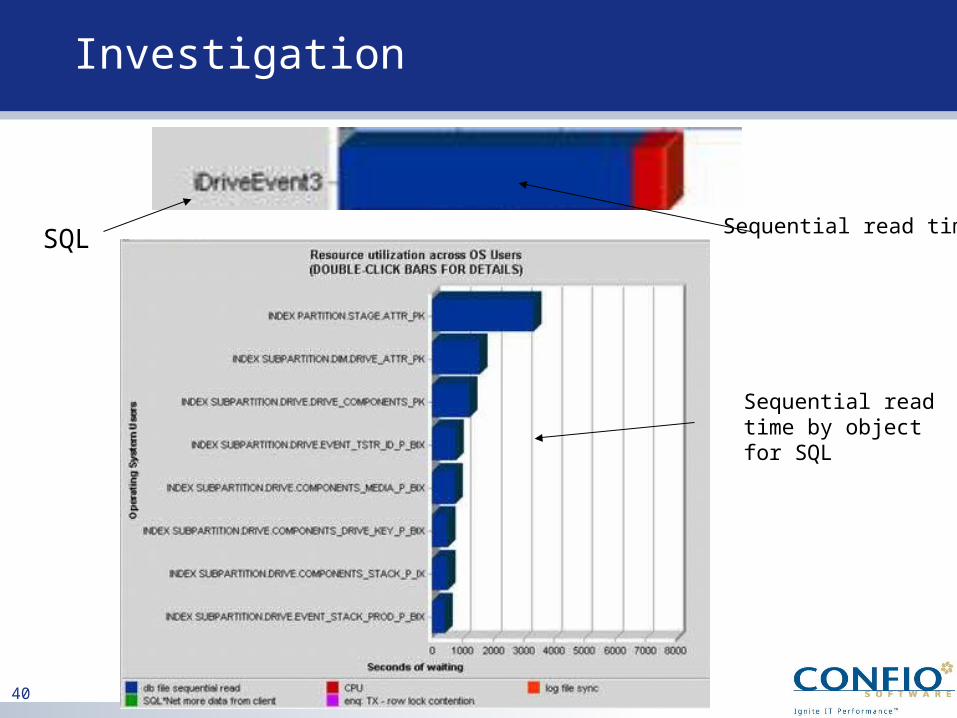
Investigation
SQL Sequential read time
Sequential read time by object for SQL
41
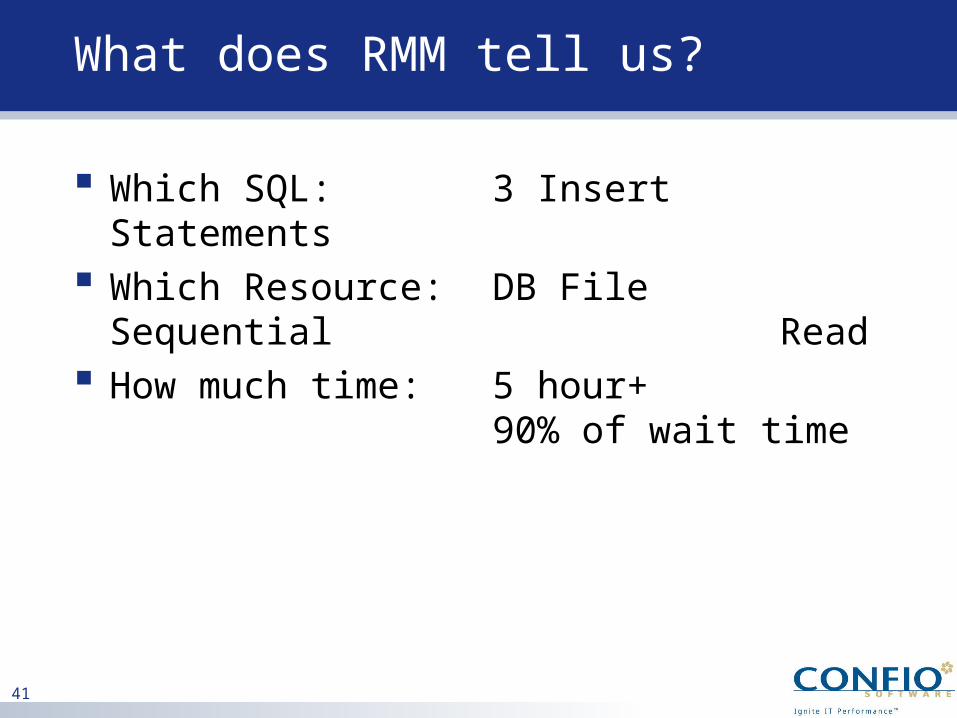
What does RMM tell us?
Which SQL: 3 Insert Statements Which Resource: DB File Sequential
Read How much time: 5 hour+
90% of wait time

42
Investigating db file sequential reads
Often considered a “good” read DB file sequential reads normally occur
during index lookups Often a single-block read although it
may retrieve more than one block. Sequential Read may also be seen for
reads from: • datafile headers• rebuilding the control file • dumping datafile headers
43
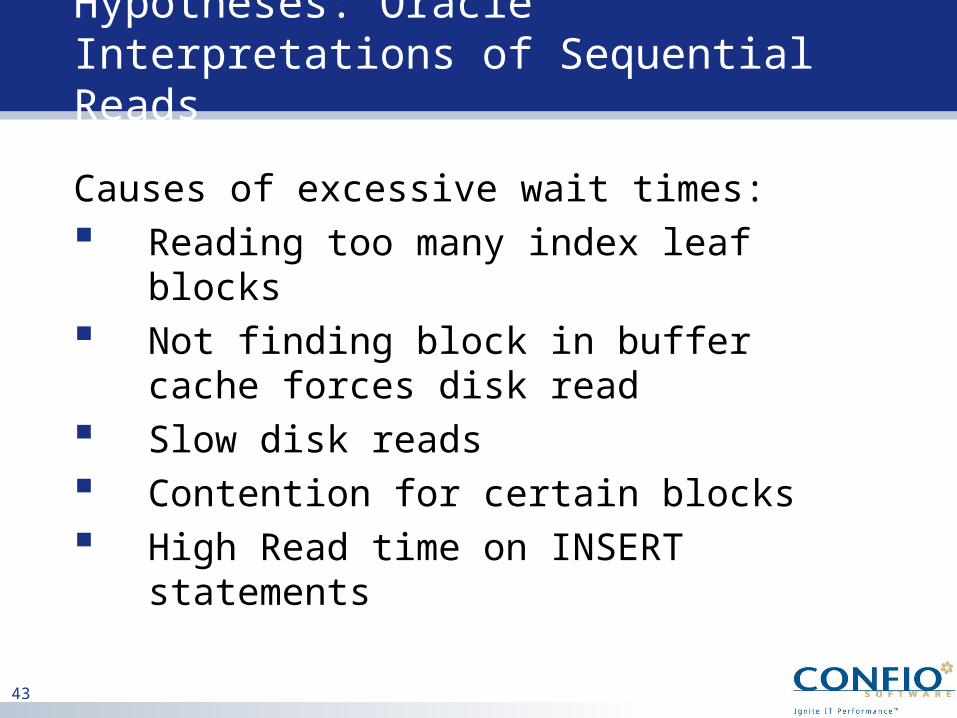
Hypotheses: Oracle Interpretations of Sequential Reads
Causes of excessive wait times: Reading too many index leaf blocks Not finding block in buffer cache
forces disk read Slow disk reads Contention for certain blocks High Read time on INSERT statements
44
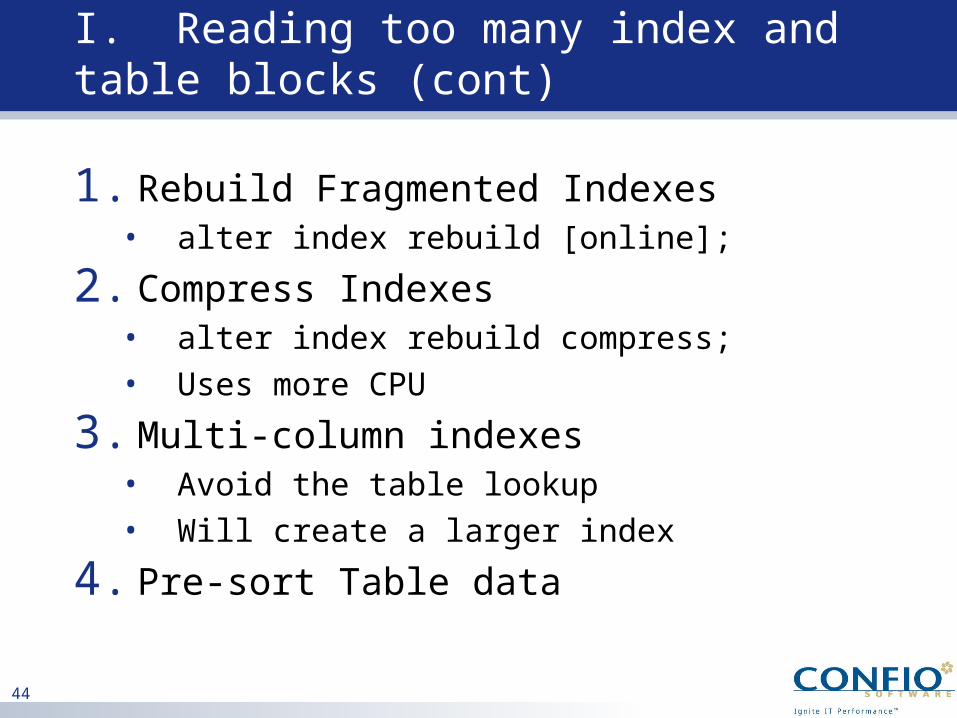
I. Reading too many index and table blocks (cont)
1. Rebuild Fragmented Indexes• alter index rebuild [online];
2. Compress Indexes• alter index rebuild compress;• Uses more CPU
3. Multi-column indexes• Avoid the table lookup• Will create a larger index
4. Pre-sort Table data
45
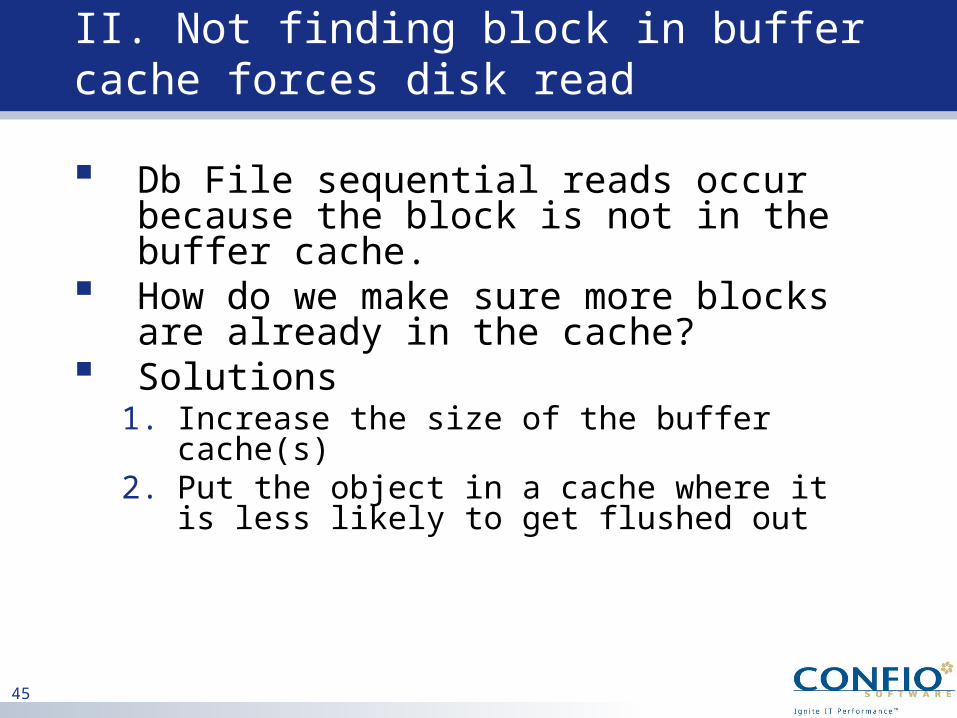
II. Not finding block in buffer cache forces disk read
Db File sequential reads occur because the block is not in the buffer cache.
How do we make sure more blocks are already in the cache?
Solutions1. Increase the size of the buffer cache(s)2. Put the object in a cache where it is less
likely to get flushed out
46
III. Slow disk reads
With databases, it often comes down to this – the disk just needs to be faster
Put certain objects on the fastest disk O/S file caching using special software
that makes normal files perform like raw files
Increase Storage System Caching – such as an EMC cache
47
Results
Inserts were updating indexes that had low cardinality leading columns
Reordered columns in the index and got a 50% performance improvement
Log file sync wait event was then the largest wait event
Data was being committed too often Tuning is an iterative process
Case Study Four Enqueue
49
Problem Observed
Problem: High Wait on CPPFPROD• Accumulated wait 9.5 hours (34,000 sec)
during 3.00-4.00am hour• End users were complaining loudly
Applied RMM approach to problem identification: • Identify Wait Time, offending SQL, offending
Resource
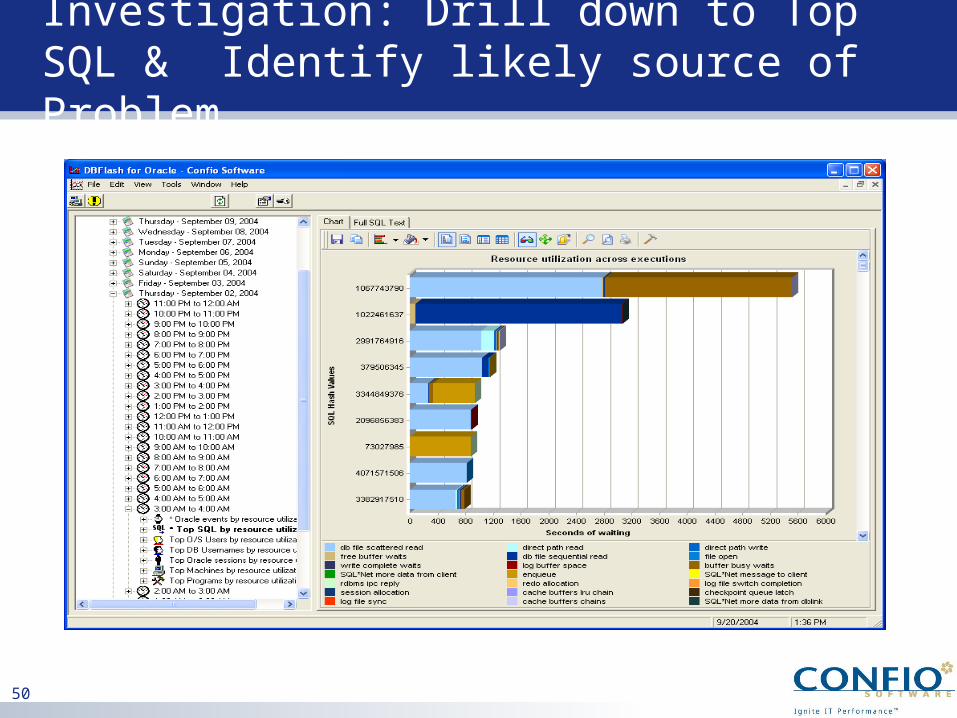
50
Investigation: Drill down to Top SQL & Identify likely source of Problem
51
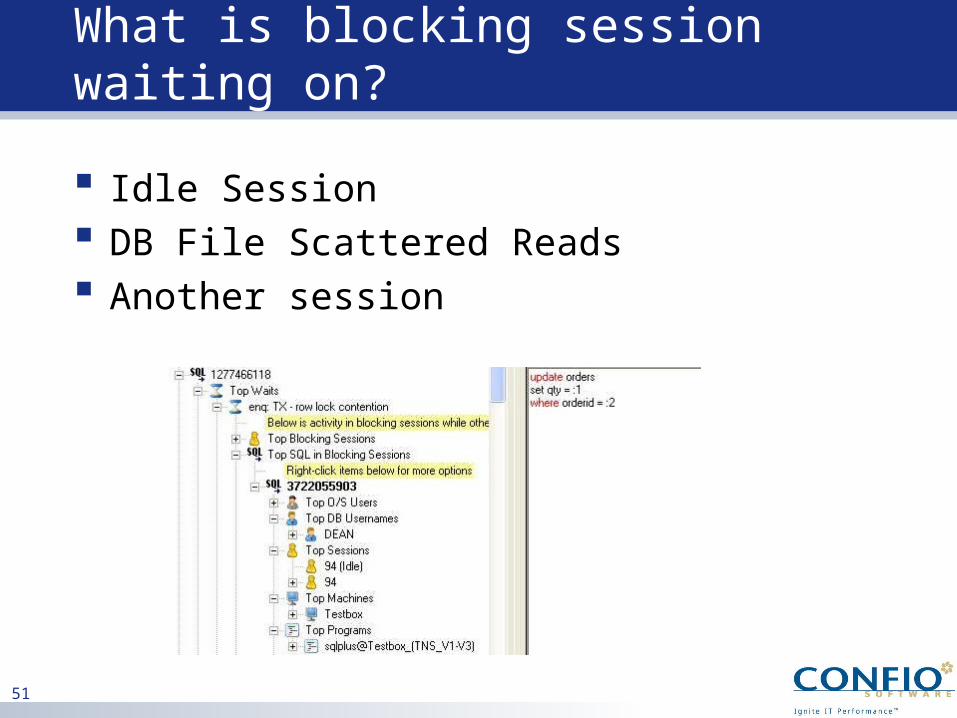
What is blocking session waiting on?
Idle Session DB File Scattered Reads Another session
52
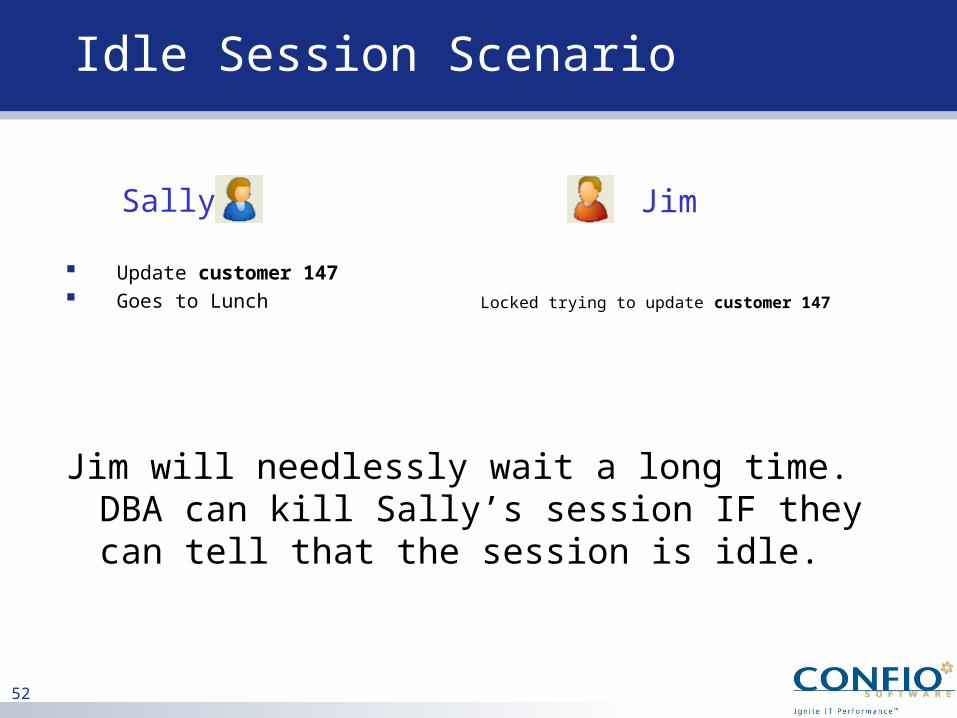
Idle Session Scenario
JimSally
Update customer 147 Goes to Lunch Locked trying to update customer 147
Jim will needlessly wait a long time. DBA can kill Sally’s session IF they can tell that the session is idle.
53
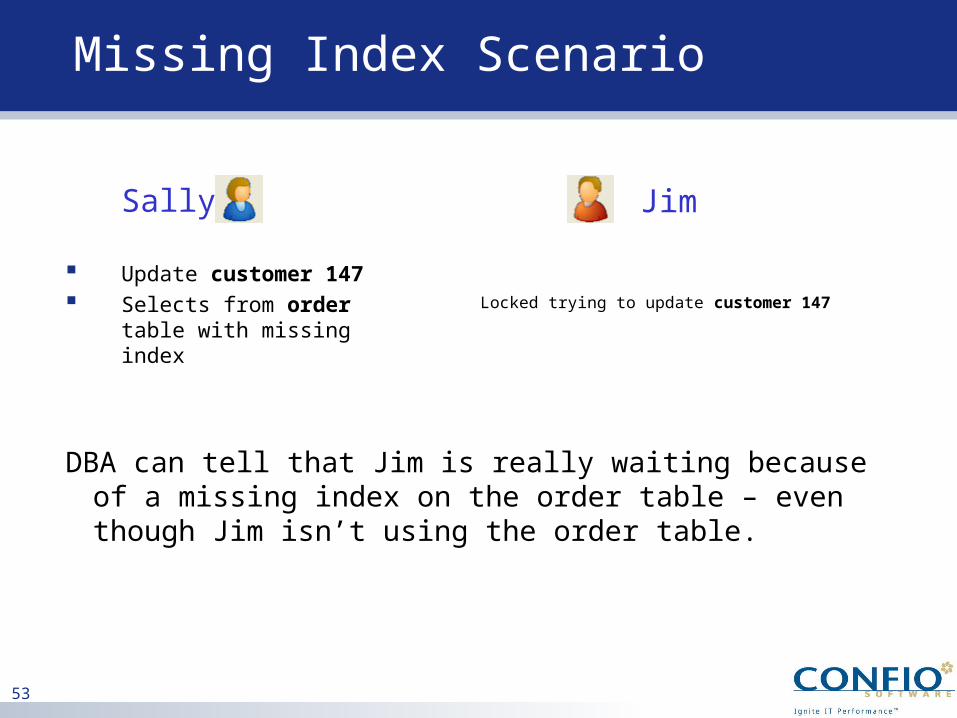
Missing Index Scenario
JimSally
Update customer 147 Selects from order
table with missing indexLocked trying to update customer 147
DBA can tell that Jim is really waiting because of a missing index on the order table – even though Jim isn’t using the order table.
54
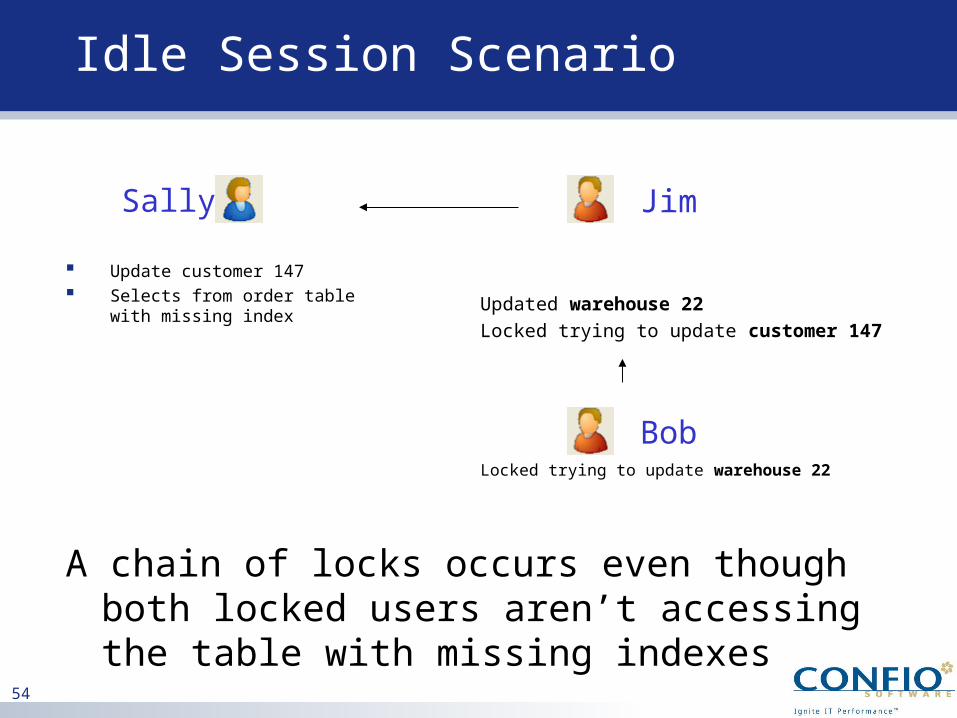
Idle Session Scenario
JimSally
Update customer 147 Selects from order table
with missing indexUpdated warehouse 22Locked trying to update customer 147
A chain of locks occurs even though both locked users aren’t accessing the table with missing indexes
BobLocked trying to update warehouse 22
55
Wait Events for Development
Tuning SQL for optimal performance Debug/test/integrate/pilot process Understand impact on existing database Understand Oracle impact on application
performance View into production for better
development prioritization and feedback Reduce finger-pointing
56
Conclusion
Conventional Tuning focus on “system health” and lead to finger-pointing and confusion
Wait event tuning implemented according to RMM is the new way to tune
Two RMM-compliant tools types• Tracing tools• Continuous DB-wide monitoring tools
Questions & Answers
57
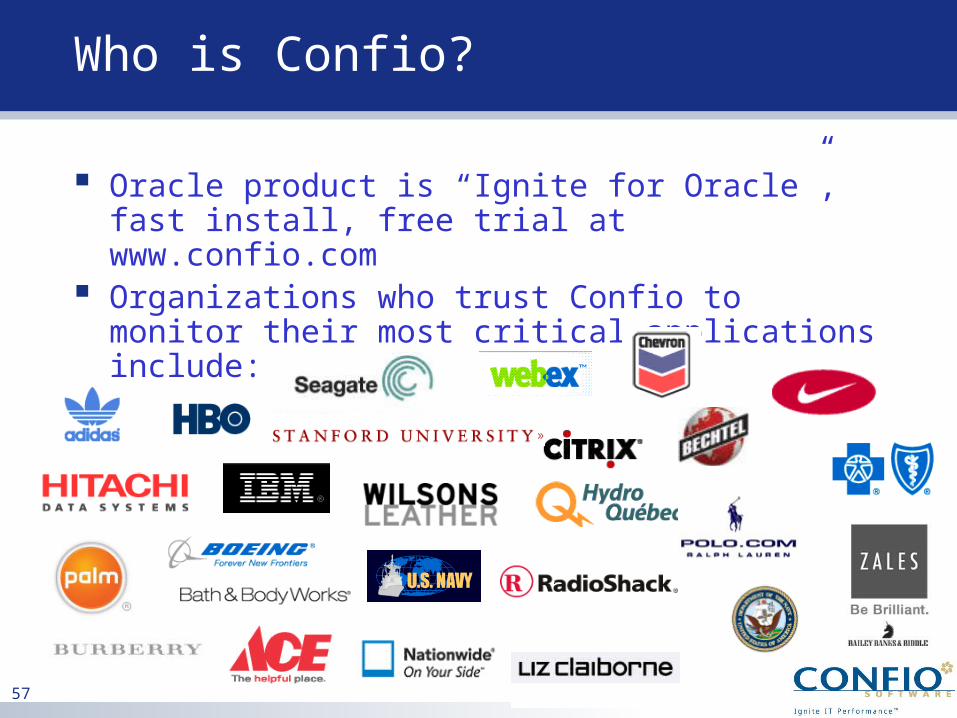
Who is Confio?
Oracle product is “Ignite for Oracle”, fast install, free trial at www.confio.com
Organizations who trust Confio to monitor their most critical applications include:
58
Thank you for coming
Matt LarsonFounder/Chief Technology Officer
Contact Information• [email protected]• 303-938-8282 ext. 110• Company website
www.confio.com

59