waikato stormwater management guideline · people attended this workshop: andrea phillips, fraser...
TRANSCRIPT

Waikato Regional Council Technical Report 2018/01
Waikato stormwater management guideline www.waikatoregion.govt.nz ISSN 2230-4355 (Print) ISSN 2230-4363 (Online)

Prepared by: Earl Shaver (Aqua Terra International Limited) For: Waikato Regional Council Private Bag 3038 Waikato Mail Centre HAMILTON 3240 29 June 2018 Document #: 11854602

Doc # 11854602
Peer reviewed by:
Megan Wood (Wainui Consulting Limited)
Judy Ansen (Coast and Catchment Limited)
Brian Richmond, Hugh Keane, Sung Soo Koh, Matthew Taylor, Duncan Grant (Waikato Regional Council)
Date June 2018
Approved for release by:
Matthew Davis (Waikato Regional Council )
Date June 2018
Disclaimer
This technical report has been prepared for the use of Waikato Regional Council as a reference document and as such does not constitute Council’s policy. Council requests that if excerpts or inferences are drawn from this document for further use by individuals or organisations, due care should be taken to ensure that the appropriate context has been preserved, and is accurately reflected and referenced in any subsequent spoken or written communication. While Waikato Regional Council has exercised all reasonable skill and care in controlling the contents of this report, Council accepts no liability in contract, tort or otherwise, for any loss, damage, injury or expense (whether direct, indirect or consequential) arising out of the provision of this information or its use by you or any other party.

Doc # 11854602

Doc # 11854602 Page i
Preface Waikato Regional Council is pleased to release two new guidelines to address stormwater management: Waikato stormwater management guideline (TR2018/01) and Waikato stormwater runoff modelling guideline (TR2018/02).
Hamilton is the fourth largest city in New Zealand and while not equivalent in size to the large metropolitans, the population is forecast to grow up 32 per cent between 2006 and 20311. The population in the Waikato Region grew faster than the national average between 2006 and 2013, with fastest growth experienced in the Waikato District (10.1%), Waipa District (9.8%) and Hamilton City (9.3%)2.
The region supports over 35,000 km of streams and rivers, many of which are impacted by both rural and urban land use. The level of forecasted population growth in the region makes it imperative to ensure appropriate management of urban stormwater to help to protect our region’s waterways from further degradation and to restore and enhance them.
The Waikato Regional Council has a number of statutory plans and policies that provide the framework to manage the region’s natural resources and that support the formation of the Waikato Stormwater Management Guideline. The Te Ture Whaimana o Te Awa o Waikato – the Vision and Strategy is the prevailing document and is embedded within the Waikato Regional Policy Statement. Te Ture Whaimana o Te Awa o Waikato covers the Waikato and Waipa Rivers and their catchments. The entire Waikato Region and the remainder of the catchments not captured under the Te Ture Whaimana o Te Awa o Waikato are covered by the Waikato Regional Plan which must give effect to the Waikato Regional Policy Statement, which in turn must give effect to the National Policy Statement for Freshwater Management.
In producing these documents, the Waikato Regional Council would like to acknowledge the history of stormwater management and the many individuals who have contributed to progressing stormwater practice in New Zealand and overseas.
History of development and effort
Stormwater management best practice guidelines in use within the country largely have their origins with the Auckland Regional Council’s (ARC’s) documents: Guidelines for stormwater runoff modelling in the Auckland region (“TP108” in 1999), Stormwater treatment devices design guideline manual (“TP10” in 1992 and an update in 2003) and Low impact design manual for the Auckland region (“TP124” manual” in 2000). Research and promulgation emanated from monitoring of streams, estuaries and harbours that revealed issues around sediment and chemical contaminants, and the alteration of the timing and quantity of rainfall-runoff that comes with development. ARC’s guidelines reflected overseas knowledge and practice, and research and characteristics of the Auckland region undertaken in the 1990s. In the 2000s Wellington Regional Council, Auckland City/Metrowater, North Shore City, Waikatere City, Christchurch City Council, Kapati District Council and other cities and councils also progressed some of its own targeted research, while developing guidance or rules for stormwater management in its jurisdiction.
ARC continued to investigate stormwater under the Stormwater Action Plan that commenced in 2004, while Crown Research Institutes Landcare Research (e.g., Low Impact Design and Development research programme) and the National Institute for Water and Atmospheric Research (several stormwater and estuarine research programmes) progressed understanding and new tools. The University of Auckland and other universities undertook additional stormwater research. Guidelines produced in the 2010s incorporated the findings of the New Zealand and overseas research, including the Hawkes Bay of Plenty stormwater guidelines and the New Zealand Transport Agency stormwater guideline.
1 Waikato Regional Land Transport Programme 2012/13 – 2014-15 2 https://www.waikatoregion.govt.nz/Environment/Environmental-information/Environmental-indicators/Community-and-
economy/p1a-report/p1a-data/ Viewed June 2018.

Page ii Doc # 11854602
Overseas work drawn upon by the Waikato Regional Council and other agencies in New Zealand include research and practice that are embodied in technical reports and best practice guidelines from the United States Department of Agriculture National Resource Conservation Service (NRCS), United States Environmental Protection Agency, United Stated Federal Highway Agency, United States Corps of Engineers and proactive stormwater management localities including but not limited to the states of Delaware, Florida, Maryland, Washington and local or regional agencies such as the Denver Urban Drainage and Flood Control District, the city of Washington DC, the city of Portland Oregon and the City of Austin Texas. Research progressed by the American Society of Civil Engineers Environment and Water Resource Institute (ASCE EWRI) also has been utilised. Information was gleaned from several Australian Crown Research Centres (CRC) and university research, including the latest incarnation that addresses stormwater in a more holistic manner – the CRC for Water Sensitive Cities.
Content and differences
The Waikato Stormwater Management Guideline is based on Auckland Council’s Technical Publication 10 (TP10) ‘Stormwater Management Devices Design Guidelines Manual’ (Auckland Regional Council, 1992 and 2003) and replaces use of this guideline in the Waikato Region.
This guideline also builds on other guidance including the New Zealand Transport Agency’s ‘Stormwater Treatment Standards’, Bay of Plenty Regional Council’s ‘Stormwater Management Guidelines for the Bay of Plenty Region’, Hawkes Bay Regional Council’s ‘Waterway Guidelines Stormwater Management’ and Tauranga City Council’s ‘Stormwater Management Guidelines’.
The two new guidelines importantly reflect the local characteristics of the Waikato region. Previously stormwater design was based on ARC’s documents, which incorporated a number of assumptions relevant to Auckland and which facilitated its implementation at the time. The Waikato guidelines return to the roots of TR-55 for its runoff calculations, while incorporating recommendations from the ASCE EWRI’s recommendations to adjust the storage computation. The Waikato guideline further returned to the basis of the TR-55 method and adopts different soil groups than the assumptions in TP108, while requiring use of site specific soil information. As a result, the application is more scientifically valid for use in the Waikato than the Auckland guidance that they replace.
The consequence is that generally more runoff volume must be addressed to manage stormwater from what has been historically occurring in the region. Due to differences between catchments and soils in Auckland and the Waikato, the Auckland runoff modelling method results in devices that often are under-sized for Waikato conditions, and hence are not meeting expected performance, which leads to potential adverse effects. The Waikato guidelines will provide for devices and stormwater management that are designed for the Waikato region conditions.
Another important aspect of the guidelines is the ongoing effort to address stormwater as part of urban development (i.e. low impact design, water sensitive cities) and at source rather than incorporating stormwater after the urban landscape has been designed or something appended at the bottom of the cliff. A low impact design scoring matrix is included in the guideline that enables quantification of how much low impact design has been incorporated into an urban development.
A new volume control criteria is included (in addition to existing peak flow control and water quality treatment criteria); developments will need to be designed to retain (reuse or soak) the initial abstraction volume of runoff. This criteria is to help offset the effects of impervious areas. Also, sections have been included on managing stormwater runoff from industrial areas, rural residential areas, and on managing the effects of urban stormwater runoff on Waikato Regional Council administered drainage districts. A specific section has been included on retrofitting stormwater management devices into existing built up areas.

Doc # 11854602 Page iii
Consultation
Consultation was undertaken in the development of this guideline, including:
Internal consultation with Waikato Regional Council staff.
Targeted workshops with territorial authorities.
External workshops with key stakeholders including Iwi, territorial authorities, New Zealand Transport Agency, consultants, major industry representatives, surveyors, developers and Engineering New Zealand (Waikato Branch).
Feedback and companion guidance
Waikato Regional Council welcomes feedback on these guidelines as they are used in practice. As any guideline, amendments will be made to designs as new research and practice observation emerges that merit revisiting aspects within these guidelines.
Hard copies will not be sold or officially issued. It is the responsibility of the user of this guideline to ensure they download the most up-to-date version of the Waikato Stormwater Management Guideline.
The two new guidelines are among a series of best practice that Waikato Regional Council has published:
Principal Waikato Regional Council stormwater and related companion guidelines and documents:
Waikato stormwater management guideline (TR2018/01).
Waikato stormwater runoff modelling guideline (TR2018/02).
Erosion and sediment control guidelines for soil disturbing activities (TR2009/02).
Managing land use change and Council’s administered drainage areas (TR2014/13).
Environment Waikato best practice guidelines for waterway crossings (TR06/25R).

Page iv Doc # 11854602
Acknowledgements Waikato Regional Council would like to thank Judy Ansen from Coast and Catchment Limited for review comments that were received and that have been incorporated into this guideline.
Useful comments have also been received from Matthew Lillis (Hamilton City Council), Scott King (AECOM), Britta Jensen (Opus) and Iain Smith (Beca).
Waikato Regional Council would like to thank all of those who attended the first stakeholder workshop held on 28 February 2017 and who provided input to both guidelines. Representatives attended from Hamilton City Council, Hauraki District Council, Matamata-Piako District Council, South Waikato District Council, Taupo District Council, NZTA, Fonterra, AECOM, Beca, BBO, Civil Plan, CKL, MWH Global, Opus, Tonkin & Taylor, Wainui Environmental and Stormwater 360.
Waikato Regional Council would like to thank the following for their attendance at a meeting in Taupo on 1 November 2017 to discuss items relating to the stormwater management guidelines: Brent Aitken (Taupo District Council), Roger Stokes (Taupo District Council), Joanne Lewis (Lewis Consultancy Ltd), Mike Keys (Key Solutions Ltd) and Chris Todd (Todd Land Development Consultants Ltd).
Waikato Regional Council would like to thank the attendees at a targeted territorial authority workshop on 22 February 2018 to discuss the key changes in the approach from previous Auckland Council guidance that has been used in the Waikato. The following people attended this workshop: Andrea Phillips (Hamilton City Council), Matthew Lillis (Hamilton City Council), Mark Marr (Hamilton City Council), Sarah Pitches (Waipa District Council), Richard Pullar (Waikato District Council) and Scott Wilson (Opus – on behalf of Waikato District Council).
Waikato Regional Council would like to thank the attendees at a second targeted territorial authority workshop that was held on 12 March 2018. This workshop was held to discuss the low impact design scoring matrix and to score some existing development proposals. The following people attended this workshop: Andrea Phillips, Fraser McNutt, Jonathan Brooke, Martyn Smith and Mark Marr (all from Hamilton City Council), Mark Walmsley and Murray James (from Waipa District Council) and Britta Jensen (on behalf of Waikato District Council).
Waikato Regional Council would also like to thank those who attended the two further workshops held on 2 May and 10 May 2018 and for the feedback provided at both workshops. These two workshops were attended by representatives from Hamilton City Council, Hauraki District Council, Matamata Piako District Council, South Waikato District Council, Taupo District Council, Thames Coromandel District Council, Waikato District Council, Waipa District Council, New Zealand Transport Agency, Engineering New Zealand Waikato Branch, Fonterra, AECOM, Beca, Bloxam Burnett & Olliver, Blue Wallace, BTW Company, Cheal Consultants, CKL, Gray Consulting, Harrison Grierson, Hartland Environmental, Key Solutions Ltd, Lewis Consulting Ltd, Opus, PF Olsen NZ, Stantec, Stormwater 360, Tonkin and Taylor, Civil Plan, Wainui Environmental and Waikato Regional Council.

Doc # 11854602 Page v
Table of Contents Acknowledgements iv
Part I: Stormwater management overview and orientation 1
1 Introduction 2
Overview 2
Principles of stormwater management 2
Best practicable option 4
How to use this guideline 4
2 Impacts associated with stormwater runoff 7
Hydrological cycle 7
Stormwater quantity 8
2.2.1 Flood effects 9 2.2.2 Case study – water quantity effects 10
Stormwater quality 11
2.3.1 Contaminant types 12 2.3.2 Contaminant sources 13 2.3.3 First flush 15
Stream morphology and aquatic resource 16
2.4.1 Bankfull discharge 17 2.4.2 Stream channel dimensions 17 2.4.3 Stream channel patterns 17 2.4.4 Stream channel profile 18 2.4.5 Stream ecology 18 2.4.6 Physical habitat 20 2.4.7 Ecological stress factors 21 2.4.8 Importance of first and second order streams 22
Cumulative effects 24
3 Waikato context 25
The Waikato Region 25
Regulatory framework 26
3.2.1 The Vision and Strategy 26 3.2.2 Waikato Regional Policy Statement 26 3.2.3 Relevant WRPS Policy Provisions 27 3.2.4 Waikato Regional Plan 28 3.2.5 Healthy Rivers Wai Ora: Plan for Change He Rautaki Whakapaipai 28
4 Receiving environments 30
Streams and rivers 30
4.1.1 Examples of impacted aquatic resources 32 Floodplains 32
4.2.1 Catchment size and slope 33 4.2.2 Surface conditions and land use 33 4.2.3 Floodplain topography 34 4.2.4 Floodplain values 34
Wetlands 35
Ground 37
4.4.1 Soil compaction 37 4.4.2 Contamination of soils 37 4.4.3 Migration of contaminants to groundwater 38

Page vi Doc # 11854602
Karst geology 39
Estuaries 40
Harbours 41
Open coasts 42
Lakes 42
Geothermal areas 43
Stormwater management and receiving environments 45
5 Stormwater management concepts 46
Avoid, remedy or mitigate 46
5.1.1 Avoid 46 5.1.2 Remedy 47 5.1.3 Mitigate 48
Low impact design 48
5.2.1 Achieve multiple objectives 49 5.2.2 Integrate stormwater design early in the process 49 5.2.3 Avoid rather than mitigate 49 5.2.4 Manage stormwater at-source 49 5.2.5 Rely on natural soil and plant processes 50
Approaches and techniques 50
5.3.1 Low impact design approaches 50 5.3.2 Low impact design devices 50 5.3.3 Clustering and alternative lot configuration 50 5.3.4 Reduce imperviousness 53 5.3.5 Minimise site disturbance 58
Cost of low impact design approach 60
Stormwater treatment processes 61
5.5.1 Sedimentation 61 5.5.2 Aerobic and anaerobic decomposition 64 5.5.3 Filtration and adsorption to filter material 65 5.5.4 Biological uptake 65 5.5.5 Biofiltration 66 5.5.6 Flocculation 67
Summary 67
Part II: Stormwater design approach, device design and sample design calculations 68
6 Choosing a stormwater management approach 69
Regulatory and design requirements 69
6.1.1 Design responsibility 69 6.1.2 Information requirements 69 6.1.3 Low impact design scoring approach 71
Individual device suitability 76
6.2.1 Site considerations 76 6.2.2 General constraints 79 6.2.3 Contaminant generation 83 6.2.4 Contaminant removal processes 84 6.2.5 Device selection 86 6.2.6 Treatment train approach 86
7 Design criteria 90
Water quantity design 90
7.1.1 Preventing existing flooding problems from getting worse 90

Doc # 11854602 Page vii
7.1.2 Controlling intermediate storms 91 7.1.3 Catchment location 93 7.1.4 Design rainfall 93 7.1.5 Hydrologic design method 93 7.1.6 Effects of climate change 94 7.1.7 Peak flow control criteria 96
Stream channel erosion 96
7.2.1 Runoff volume control 97 7.2.2 Detention time control 98 7.2.3 General discussion 99 7.2.4 What criteria should be established? 99 7.2.5 Where the criteria should be applied 100 7.2.6 Water quality credit for extended detention 100 7.2.7 Erosion control criteria 100 7.2.8 Lands within and draining into Hamilton City Council jurisdiction 102
Water quality design 103
7.3.1 General sizing requirements 103 7.3.2 Effluent limits versus best practicable option 105 7.3.3 Water quality treatment criteria 105
Summary of recommendations 105
7.4.1 Peak flow control 105 7.4.2 Stream erosion control 106 7.4.3 Water quality treatment 107
8 Stormwater management device design 109
Introduction 109
Source control 109
Designing for ease of operation and maintenance 109
8.3.1 Spend a year at the practice 109 8.3.2 Maintenance questions 110 8.3.3 Uniform materials or components 110
Designing for safety 111
Specific design guidance for stormwater management devices 112
8.5.1 Swales 113 8.5.2 Filter strips 121 8.5.3 Sand filters 126 8.5.4 Bioretention 133 8.5.5 Infiltration 145 8.5.6 Stormwater pond 155 8.5.7 Wetlands 173 8.5.8 Green roofs 187 8.5.9 Bush revegetation 192 8.5.10 Water tanks 196 8.5.11 Compacted soil remediation 205 8.5.12 Oil/water separators 209
9 Outlet design 211
Introduction 211
Objective 211
Design approach 212
9.3.1 Pipe or channel grade 212 9.3.2 Inlet and outlet velocities 212 9.3.3 Riprap aprons 213 9.3.4 Engineered energy dissipators 214

Page viii Doc # 11854602
9.3.5 Outfalls to freshwater receiving environments 214 9.3.6 Outfalls in coastal receiving environments 215
Detailed design 216
Construction 217
Operation and maintenance 218
10 Landscaping 219
Introduction 219
Objective 219
10.2.1 Aesthetic appeal of stormwater devices 219 10.2.2 Water quality and ecological function 220 10.2.3 Economic value of the site 220
Native vegetation 220
General landscape guidance 221
10.4.1 Stormwater device area 221 10.4.2 Landscape screening 221 10.4.3 Soils 221 10.4.4 Site preparation 221 10.4.5 Planting 222 10.4.6 General guidance 222
Specific landscape provisions for individual devices 223
10.5.1 Ponds and wetlands 223 10.5.2 Infiltration and filter devices 224 10.5.3 Swales and filter strips 225 10.5.4 Green roofs 226
11 Proprietary devices and innovative products 227
Introduction 227
Approval options 227
11.2.1 Approval through another certification process 227 11.2.2 Information submission to Waikato Regional Council 229
Information requirements 230
Information required to determine adequacy of monitoring data 231
11.4.1 Catchment parameters 231 11.4.2 Device design parameters 231 11.4.3 Water quality analysis 232
Discussion 232
12 Contaminant loads 234
Introduction 234
Determining water quality loads 234
12.2.1 Auckland Council’s contaminant load model 234 12.2.2 Tweed Catchment, New South Wales 235 12.2.3 Nutrient export coefficient model 236 12.2.4 Unit loadings for nutrients based on MfE guidance 237
Recommended approach 238
12.3.1 Rainfall differences 238 12.3.2 Local soils 240 12.3.3 Case study – Contaminant load model 240
13 Bringing the elements together 242
Introduction 242
Criteria detailed for the various elements 242
13.2.1 Receiving environments and stormwater issues 242

Doc # 11854602 Page ix
13.2.2 Low impact design scoring matrix 243 13.2.3 Peak flow management and erosion potential 244
The overall process 246
Part III: Different site applications for stormwater management 249
14 Industrial site management 250
Introduction 250
Source control and housekeeping 250
14.2.1 Importance of having site plans 250 14.2.2 Stormwater pipes, their inlets and outlets 251 14.2.3 Outdoor areas 252 14.2.4 Stormwater and wastewater systems 252 14.2.5 Housekeeping 252
Industries, contaminants and treatment devices 255
Stormwater management devices 262
14.4.1 Stormwater management ponds 263 14.4.2 Constructed wetlands 264 14.4.3 Sand and sand/peat filters 264 14.4.4 Bioretention 265 14.4.5 Infiltration devices 266 14.4.6 Swales and filter strips 267 14.4.7 Oil and water separators 268 14.4.8 Oxidation 268
Conclusion 269
15 Rural residential development 271
Introduction 271
Key objectives 271
General principles 271
Source, flowpaths and receiving environments 272
15.4.1 Source 272 15.4.2 Pathway 272 15.4.3 Receiving environment 275
Hydrology 276
15.5.1 An individual residence 276 15.5.2 Rural residential subdivision 276 15.5.3 Device capability to detain flows 276
Stormwater management device design 278
16 Waikato Regional Council administered drainage areas 279
Introduction 279
Drainage standards 280
Problem identification 281
Urban development issues 282
Land use change and drainage areas 282
16.5.1 Introduction 282 16.5.2 Site specific criteria 282 16.5.3 Information requirements 283 16.5.4 Information requirements for small scale subdivision 283 16.5.5 Information requirements for larger scale development 284 16.5.6 Funding 285 16.5.7 Land ownership 285
Conclusion 286

Page x Doc # 11854602
17 Retrofitting stormwater management 287
Introduction 287
Retrofit process 287
Prioritisation of projects 288
Magnitude of impact 289
17.4.1 Public safety 289 17.4.2 Collaborative projects 289 17.4.3 Water quality retrofits 289 17.4.4 Stream erosion reduction 290
Device availability 291
17.5.1 Downstream flooding impacts 291 17.5.2 Downstream channel erosion effects 291 17.5.3 Stormwater quality 292
Space availability 293
Positive drainage 293
Magnitude of benefit 293
Cost 293
17.9.1 Cost benefit analysis 294 17.9.2 Total cost 294 17.9.3 Total cost for the maintenance programme 294
Taking advantage of opportunities 295
17.10.1 Retrofitting existing stormwater quantity control structures 296 17.10.2 Using existing road crossings to impound stormwater 296 17.10.3 Demonstration projects 296 17.10.4 Use of new consenting to exceed individual project benefits 297 17.10.5 Retrofitting through education 297
Part IV: Construction, operations and maintenance 299
18 Construction related issues 300
Introduction 300
Responsibility for construction 300
Pre-construction activities 302
Device construction 302
18.4.1 Swale and filter strip construction 302 18.4.2 Sand filters 305 18.4.3 Bioretention devices 306 18.4.4 Infiltration 307 18.4.5 Ponds and wetlands 309 18.4.6 Green roofs 312 18.4.7 Water tanks 313 18.4.8 Bush revegetation 314 18.4.9 Oil/water separators 314
Final acceptance 315
Inspection reports and construction notes 315
Construction inspection checklists 315
19 Operation and maintenance 316
Introduction 316
Inspection and maintenance 317
19.2.1 Device inspection frequencies 317 19.2.2 Timing of device maintenance 320
Documenting inspection and maintenance 325

Doc # 11854602 Page xi
Prioritising maintenance tasks 325
19.4.1 Corrective maintenance 326 19.4.2 Preventive maintenance 326 19.4.3 Aesthetic maintenance 326
Disposal of removed contaminants 327
Safety issues 328
Inspection reports and operational notes 328
As-built certification 328
References 330
Appendix A: Glossary of terms 338
Appendix B: Low impact design scoring matrix 343
Appendix C: Forms for construction and operation 346
Figures Figure 2-1: Hydrological cycle 7 Figure 2-2: Changes in the hydrological cycle as a result of urbanisation 8 Figure 2-3: Stormwater hydrographs – pre-and post-development 9 Figure 2-4: Hydrograph comparison for pre and post development scenarios 11 Figure 2-5: Effects of urbanisation on stream cross section 16 Figure 2-6: Stream cross section showing velocity distributions 17 Figure 2-7: Stream channel geometry 18 Figure 2-8: Sensitive aquatic organisms versus impervious surface percentages 22 Figure 2-9: Conceptualisation of a stream hierarchy 22 Figure 4-1: Groundwater movement 38 Figure 5-1: Conventional site development versus an LID approach 52 Figure 5-2: Turnaround options 56 Figure 5-3: Parking area dimensions 57 Figure 5-4: Comparison of individual and combined driveways 59 Figure 5-5: Particle size and general classification 63 Figure 5-6: Wetland process for denitrification 64 Figure 6-1: Pre-development site showing land use 74 Figure 6-2: Conventional site development 74 Figure 6-3: Low impact design approach 75 Figure 6-4: Slope versus available storage 78 Figure 6-5: Groundwater schematic 79 Figure 6-6: Groundwater mounding under an infiltration practice55 80 Figure 6-7: Slope and seepage from an infiltration trench 80 Figure 7-1: Pre and post-development 100-year ARI peak flow rates in a catchment 91 Figure 7-2: Comparison of flood frequency curves for various stormwater policies68 92 Figure 7-3: Average days between rains per month 98 Figure 7-4: Discharge versus flow duration for pre and post development scenarios 99 Figure 7-5: Frequency distribution of runoff events82 103 Figure 7-6: 90th percentile storm at different locations within the Waikato Region 104 Figure 8-1: Swale with check dams and diversion of lateral inflow 115 Figure 8-2: Swale channel geometry 116 Figure 8-3: Swale schematic showing soils and underdrain 117 Figure 8-4: Schematic of a filter strip 123 Figure 8-5: Sand filter basin 127 Figure 8-6: Vault sand filter95 127 Figure 8-7: Linear sand filter95 128

Page xii Doc # 11854602
Figure 8-8: Diversion weir95 129 Figure 8-9: Large flow bypass schematic95 130 Figure 8-10: Schematic of bioretention device key elements and flow paths 134 Figure 8-11: Planter box cross-section 135 Figure 8-12: Planter box cross-section99 135 Figure 8-13: Bioretention swale cross-section99 136 Figure 8-14: Bioretention device with a submerged zone 137 Figure 8-15: Schematic of bioretention device 140 Figure 8-16: Schematic of an infiltration basin 146 Figure 8-17: Schematic of an infiltration trench107 146 Figure 8-18: Schematic of a soakage pit 147 Figure 8-19: Schematic of a permeable pavement108 147 Figure 8-20: Soil textural triangle 152 Figure 8-21: Schematic of a stormwater management pond 158 Figure 8-22: Pond cross-sections111 159 Figure 8-23: Design detail for a filter collar 159 Figure 8-24: Schematic of safety benches and slopes 162 Figure 8-25: Schematic of pond outlet components 164 Figure 8-26: Example of an orifice cover plate to prevent clogging 164 Figure 8-27: Schematic of extended detention outlet structures114 166 Figure 8-28: Banded bathymetric wetland schematic 176 Figure 8-29: Cross-section of a wetland swale 180 Figure 8-30: Longitudinal slope on a wetland swale 180 Figure 8-31: Channel geometry124 182 Figure 8-32: Wetland case study – percentage areas 186 Figure 8-33: Green roof cross-section showing components 188 Figure 8-34: Case study parameters for a green roof126 191 Figure 8-35: Bush revegetation for runoff control 195 Figure 8-36: Annual rainfall throughout the region 198 Figure 8-37: Calculation of roof surface areas 199 Figure 8-38: Combination attenuation and water use tank 200 Figure 8-39: Water tank detention storage volumes 201 Figure 8-40: Water tank schematic showing case study elevations and volumes 203 Figure 8-41: Orifice and exterior pipe details 204 Figure 8-42: Infiltration rates for sandy soil conditions 206 Figure 8-43: Infiltration rates for clayey soil conditions135 206 Figure 9-1: Engineered stilling basin 214 Figure 9-2: Angled entry of outfall into a stream142 215 Figure 9-3: Schematic of riprap outfall protection142 216 Figure 13-1: Flow diagram of design steps 248 Figure 14-1: Typical industrial site showing various site elements 251 Figure 15-1: Example of a small rural residential development 275 Figure 16-1: Waikato Regional Council and territorial authority drainage areas 280 Figure 17-1: Retrofit process 288 Figure 17-2: Auckland Council stormwater demonstration area 297

Doc # 11854602 Page xiii
Tables Table 2-1: Typical urban stormwater contaminants 12 Table 2-2: Sources of urban stormwater contaminants 13 Table 2-3: Impacts of urbanisation on aquatic ecosystems 19 Table 2-4: Order of streams and rivers in the Waikato Region 23 Table 4-1: Values of the Mannings roughness coefficient ‘n’ in floodplains 33 Table 4-2: Summary of wetland functions and values 36 Table 4-3: Receiving environments and stormwater issues 45 Table 5-1: Comparison of capital costs between conventional and LID site
development 60 Table 5-2: Particle characteristics 62 Table 5-3: Metals distribution and particle sizes 62 Table 5-4: Particle size versus settling velocity 63 Table 5-5: Ability of biota to uptake contaminants 66 Table 6-1: Low impact design scoring matrix 71 Table 6-2: Infiltration rate for various soil textural classes 77 Table 6-3: Soil and suitability of various stormwater management devices 77 Table 6-4: Slope limitations of various stormwater management devices 78 Table 6-5: Stormwater management devices related to catchment areas 79 Table 6-6: Contaminant loads for various daily traffic counts 84 Table 6-7: Summary of contaminant removal mechanisms 84 Table 6-8: Stormwater management device capabilities 86 Table 6-9: Treatment train examples 87 Table 6-10: Removal rates for various stormwater devices for TSS and nutrients 88 Table 6-11: Removal rates for various stormwater devices for metals 89 Table 7-1: Climate change percentage adjustments per 1°C temperature increase 95 Table 7-2: Climate change percentage adjustments based on predicted 2.1°C
temperature increase 95 Table 7-3: Maximum permissible velocities 97 Table 8-1: Swale design elements 114 Table 8-2: Flow depth vs. Manning’s n versus discharge 120 Table 8-3: Filter strip design elements 122 Table 8-4: Sand specification 131 Table 8-5: Composition range of filter media using FAWB recommendations 139 Table 8-6: Recommendations for trees and shrubs 141 Table 8-7: Grasses, ground covers and other plants 142 Table 8-8: Infiltration rate for various soil textural classes 148 Table 8-9: Case study – stormwater pond summary table 170 Table 8-10: Stage-storage relationships 170 Table 8-11: Stormwater contaminant removal mechanisms of constructed
wetlands 174 Table 8-12: Preferred vegetation for optimised vegetated wetlands 179 Table 8-13: Wetland case study - summary table 185 Table 8-14: Bush planting requirements 194 Table 8-15: Estimated residential water demand for a 3 member household 199 Table 8-16: Building occupancy ratios for different activities 199 Table 9-1: Maximum permissible velocities for unlined channels 213 Table 11-1: Evaluation criteria for water quality treatment devices in Switzerland 228 Table 12-1: EMCs used for nutrient load simulation 236 Table 12-2: Weighting factors (X) used for different Hydrologic Soil Groups 237 Table 12-3: Total nitrogen export coefficients for various soil and land use types 237 Table 12-4: Export coefficients (kg/ha/year) for a variety of land uses 237 Table 12-5: Urban contaminant yields for use in the Waikato Region 239

Page xiv Doc # 11854602
Table 12-6: Rural contaminant yields for use in the Waikato Region 239 Table 12-7: Case study: contaminant load model 241 Table 13-1: Receiving environments and stormwater issues (Table 4-3 repeated) 242 Table 13-2: Scoring matrix for site stormwater management approach (Table 6-1
repeated) 243 Table 14-1: Industrial activities contaminants and treatment processes 256 Table 14-2: Summary of contaminant removal mechanisms 262 Table 15-1: Recommended design values of Manning’s roughness coefficients 273 Table 15-2: Maximum permissible velocities for unlined channels 274 Table 16-1: Information requirements 283 Table 17-1: Zinc and copper contaminant levels in runoff165 292 Table 19-1: Physical function impairment criteria 321 Table 19-2: Initial monitoring timeframes for stormwater devices 324 Table 19-3: Heavy metal concentrations in sediments from stormwater devices 327 Table 19-4: Heavy metal concentrations from stormwater devices serving various land
uses168 327
Doc # 11854602 Page 1
Part I: Stormwater management overview and orientation
Page 2 Doc # 11854602
1 Introduction Overview
The Waikato Region is increasingly facing natural resource constraints from a growing population. There are pressures on our soil, water, air, coastal areas, biodiversity and other natural resources and existing infrastructure. Sustainable growth – developing our economy without harming the environment upon which it depends – is important for our future. An important aspect of sustainable growth is ensuring a low impact design or water sensitive design approach is taken to reduce the impact of stormwater from urban areas. This document provides guidance for engineers, planners, landscape architects, developers, and contractors in selecting, designing, constructing and maintaining stormwater management systems for urban areas, with a focus on encouraging a low impact design approach. Additional insight on the topics presented in this guideline may be found by studying the papers and documents listed in the references section. The guideline provides design criteria and standards recommended by Waikato Regional Council. Designing stormwater management systems that go beyond minimum design criteria is encouraged. In addition, there may be other requirements by local authorities or the New Zealand Transport Agency that need to be met in addition to the minimum design criteria provided in this guideline.
Principles of stormwater management Adequate stormwater management for urban and rural areas is necessary to preserve and promote the general health, welfare, enhancement of ecological values and economic wellbeing of the Waikato Region. Stormwater management is a catchment issue that affects all parcels of land in some way or form. This characteristic of stormwater management makes it necessary to formulate a programme that considers the whole of catchment where practicable. Overall, the local authorities most directly involved must provide coordination and master planning, but drainage planning must also be integrated on a catchment level. The general principles outlined in the section below provide direction for planning stormwater management systems. When considered in a comprehensive manner, at a catchment level, stormwater management devices can enhance general health and wellbeing of the region and assure optimum economic and social relationships while avoiding uneconomic flood losses and disruption and environmental degradation. Council’s general principles and policies for stormwater management and floodplain management are briefly summarised below:
1. Stormwater management is a catchment-based issue that crosses territorial boundaries. This makes it necessary to develop programmes at a catchment level. Overall, the territorial authorities most directly involved must provide coordination and catchment management planning or master planning, but stormwater catchment planning must be integrated at a catchment level if optimum results are to be achieved.
2. A stormwater system is a subsystem of the total water resource system. Stormwater system planning and design for any site must be compatible with comprehensive catchment plans and should be coordinated with planning for land use, open space and transportation. Erosion and sediment control, flood control, water quality and ecological values all closely interrelate with stormwater management. Any catchment management plan or site specific stormwater management plan should address all of these considerations.
3. Every urban area has a primary and secondary stormwater system, whether or not they are planned and designed. The primary system is designed to provide
Doc # 11854602 Page 3
public convenience and to accommodate moderate, frequently occurring flows. The secondary system carries more water and operates when the rate or volume of runoff exceeds the capacity of the primary system. Both systems should be carefully considered.
4. Stormwater runoff routing is primarily a space allocation problem. The volume of water present at a given point in time cannot be compressed or diminished. Channels and stormwater systems serve both conveyance and storage functions. If provision is not made for adequate space for stormwater, runoff will conflict with other land uses, result in damages, and impair and disrupt the functioning of other urban systems.
5. Planning and design of stormwater systems should not be based on the premise that problems can be transferred from one location to another, i.e. downstream.
6. A stormwater management system should address multi objectives and values. The many competing demands placed upon space and resources within an urban area mean that stormwater management should meet a number of objectives, including water quality treatment, groundwater recharge, ecological habitat, protection of landmarks/amenities, erosion and sediment control, and creation of open spaces/recreation areas.
7. Design of stormwater management systems should consider the values of the existing site features. Every site contains natural features that contribute to stormwater management without significant modification. Such as natural streams, depressions, wetlands, gullies, floodplains, permeable soils and vegetation provide for infiltration, help reduce runoff velocities, extend the time of concentration, filter sediments and other contaminants and recycle nutrients. Each development proposal should consider how to incorporate, protect and enhance existing natural site features.
8. In conjunction with new development and re-development, efforts should be made to minimise increases in, and reduce where possible, stormwater runoff volumes, flow rates, and contaminant loads to the maximum extent practicable. Key practices include:
Retaining site perviousness and natural drainage paths.
The rate of runoff should be slowed with preference given to stormwater management systems that maximise vegetative and pervious land cover. Existing best practice normally requires control of peak flows to predevelopment levels to the maximum extent practicable, and control of runoff volumes for smaller, frequently occurring events and volume reduction.
Water quality treatment is best accomplished by implementing a series of measures, which can include source control, minimising directly connected impervious areas, and construction of on-site and subdivision/growth cell facilities to manage stormwater quality and quantity effects. Implementing measures that reduce the volume of runoff through infiltration and disconnection of impervious areas is one of the most effective means for reducing the pollutant load delivered to receiving waters.
9. The stormwater management system should be designed beginning with the discharge point for the site, giving full consideration to downstream effects. The downstream system should be evaluated to ensure that it has sufficient capacity to accept design discharges without adverse upstream or downstream effects such as flooding, stream bank erosion and sediment deposition.
10. Stormwater management systems require regular maintenance. Failure to provide proper maintenance reduces the hydraulic capacity and contaminant removal efficiency of the system. Local maintenance capabilities should be considered when designing a stormwater management system.

Page 4 Doc # 11854602
11. Floodplains should be preserved. Floodplain encroachment must not be allowed unless competent engineering and planning have proven that flow capacity is maintained, risks of flooding are defined and risks to life and property are strictly minimised. Council recommends that floodplains be preserved to manage flood hazards, preserve habitat and open space, create a more liveable urban environment and protect public health, safety and welfare.
Best practicable option A common approach to determining the appropriate standards to be achieved in a consent application process is by consideration of the best practicable option (BPO). Section 108(2)(e) of the Resource Management Act 1991 states that:
“A resource consent may include…a condition requiring the holder to adopt the best practicable option to prevent or minimise any actual or likely adverse effect on the environment of the discharge and other discharges (if any) made by the person from the same site or source”
Generally a BPO approach is considered acceptable when determining a stormwater management system for a proposed development. However there are situations where the sensitivity of the downstream receiving environment or the scale of proposed development necessitates a more determinative approach, i.e. a science based assessment of potential effects and development of a stormwater management system that ensures effects are mitigated accordingly. Using a BPO approach that is in accordance with design guidance provided in this guideline is recommended. An applicant can propose an alternative approach to site development, however the applicant will be required to demonstrate that a comparable outcome is achieved, relative to the approach recommended in this guideline, in terms of mitigating and avoiding potential adverse effects to the receiving environment.
How to use this guideline It is not intended that this guideline be read from cover to cover. It is intended that this guideline is used as a reference document to gain insight and understanding on how to manage stormwater runoff from existing and proposed development. Part I provides an overview of stormwater management and includes the following sections:
Section 1 provides an introduction.
Section 2 discusses the impacts of stormwater runoff from urban developments. Refer to this section to understand why stormwater management is necessary.
Section 3 provides the Waikato context and outlines the regulatory framework in place in the Waikato Region. Refer to this section to find out what the regulatory documents require in terms of managing stormwater effects.
Section 4 outlines the receiving environments in the Waikato Region and summarises the constraints that need to be considered when designing stormwater management systems depending on the receiving environment.
Section 5 discusses stormwater management concepts including low impact design and stormwater treatment processes. Refer to this section for insight on approaches to progress development of your site that result in better overall outcomes than more conventional development approaches.
Part II of the guideline covers stormwater design approaches, device design and provides sample design calculations. This part of the guideline includes the following sections:
Section 6 discusses factors to be considered when choosing a stormwater management approach.

Doc # 11854602 Page 5
Section 7 presents key design criteria for peak flow control, stormwater quality treatment and stream channel erosion control. This section also discusses how to address climate change predictions in your assessment.
Section 8 discusses the individual stormwater management devices and provides methodology on how to design these devices. Case studies are provided.
Section 9 discusses outlet design to ensure effective mitigation of potential adverse erosion and scour effects associated with stormwater discharges.
Section 10 provides general information on landscaping of stormwater management devices and also provides specific landscape advice for individual devices.
Section 11 discusses innovative products and Waikato Regional Council’s approach to acceptance of them.
Section 12 provides details on how to prepare a contaminant load model for your site to inform the selection of a stormwater management system and to support your consent application.
Section 13 brings all the elements of the design steps together and summarises the requirements of this stormwater management guideline. Go to this section for an overview of the overall process.
Part III of the guideline provides discussion about the different site application for stormwater management. This part of the guideline includes the following sections:
Section 14 focusses on industrial land use and provides guidance on how to manage stormwater effects from this land use type.
Section 15 considers rural residential development and discusses items to be considered when designing stormwater management systems to mitigate potential effects from this land use type.
Section 16 discusses Waikato Regional Council’s administered drainage areas and constraints to consider when your development interacts with a drainage area.
Section 17 discusses retrofitting stormwater management into existing built up areas. This section outlines a possible method that can be followed to consider, prioritise, assess and eventually implement retrofit projects.
Part IV of the guideline discusses construction, operations and maintenance for stormwater management systems, and includes the following:
Section 18 discusses construction related issues for stormwater management devices. This section is essential reading for designers (to ensure potential construction issues are addressed as effectively as possible in the design), contractors (to know what to look out for when constructing stormwater management devices), and agencies who the stormwater management assets will vest in (to assist with construction inspections and pre-transfer considerations).
Section 19 outlines operation and maintenance requirements for the various stormwater management devices discussed in this guideline. This section will be useful when considering what devices to use in a stormwater management system, or when preparing an operation and maintenance plan for your site. This section will also be useful for those agencies with ongoing responsibility to operate and maintain stormwater management devices.
The Appendix contains a glossary of stormwater management terms used in this guideline in Appendix A. The low impact design scoring matrix is provided in Appendix B. Useful documents relating to the construction and ongoing operation and maintenance of stormwater management devices are included in Appendix C. This appendix includes

Page 6 Doc # 11854602
a pre-construction meeting form, device construction forms, as-built document forms and operation and maintenance forms. These forms will be useful for designers, contractors and for agencies with whom the assets will vest.

Doc # 11854602 Page 7
2 Impacts associated with stormwater runoff Urban development in the Waikato Region has had significant impacts on the natural water cycle. Historically the drainage of urban areas focussed on conveying stormwater into receiving waters as quickly as possible. This approach reduced flooding and enabled urban areas to be established and to grow, however it has led to the degradation of natural waterways in our region. Urbanisation results in the establishment of significant impervious surfaces such as roofs, roads and other hard surfaces that cover the land. These surfaces prevent rainfall from soaking into the ground and cause impacts related to the increased stormwater runoff from those surfaces. Impervious surfaces also convey contaminants efficiently into drainage systems where they are transported to receiving environments. This section presents the key issues of stormwater quantity, stormwater quality and stream channel stability.
Hydrological cycle To better understand the effects associated with stormwater runoff we must first consider the hydrological cycle. The hydrological cycle describes the movement of water in the environment. Catchments are part of a gigantic water circulation network. Powered by the sun, the water cycle moves water between the earth’s surface and atmosphere in a continual circuit. The following figure demonstrates the hydrological cycle.
Figure 2-1: Hydrological cycle3
The rate of movement of water through the cycle can be altered dramatically through changes that are made to the land surface. Vegetation and wetlands act like sponges to slow and absorb water during wet times of the year. When vegetation and wetlands are replaced with impervious surfaces (roofs, roading, paving, etc.) less water infiltrates into the ground and more water flows directly into streams through drainage ditches and
3 https://www.waikatoregion.govt.nz/assets/PageFiles/5949/04understanding.pdf

Page 8 Doc # 11854602
stormwater drainage pipes. The increased runoff may cause a variety of problems, including flooding, streambank erosion, sedimentation and pollution.
Stormwater quantity Urban development results in the establishment of impervious surfaces that cover the land. These surfaces prevent rainfall from soaking into the ground hence changes the natural hydrological cycle. Urban development can also remove significant amounts of vegetation resulting in reduced plant moisture uptake, evapotranspiration and interception (where a plant’s leaves will intercept rainfall and reduce contact with the ground). These processes cause impacts related to the increased stormwater runoff from those surfaces, including:
Reduced base flow to streams
Increased flow rates, velocities and volumes of stormwater runoff, which can cause flood effects and can increase erosion of waterways and coastal environments
Degradation of stream channel physical structure (increases in bank instability, structural constraints (stream crossings, channel reinforcement), incised channels and reduced connectivity with the floodplain). This is discussed further in Section 2.4 below.
Figure 2-2 below illustrates two landscapes; one natural and one with urban development, and shows the natural hydrological cycle for both. In this figure, indicative percentages are provided for the components of the hydrological cycle to enable comparison.
Figure 2-2: Changes in the hydrological cycle as a result of urbanisation4
As can be seen from Figure 2-2, when an area is urbanised, surface runoff (stormwater runoff) can more than double, while soakage of stormwater to ground (soil infiltration and groundwater recharge) is reduced. This results in a change in stormwater runoff being released to the receiving environment with potential associated adverse effects. Figure 2-3 below shows another representation of stormwater quantity impacts associated with urban development. This figure provides stormwater hydrographs for a site before and after development, with the site changing from vegetated land to urban land use.
4 Shaver, Low Impact Design Guideline for the Auckland Region, 2000

Doc # 11854602 Page 9
Figure 2-3: Stormwater hydrographs – pre-and post-development
Comparison of the hydrographs demonstrates the following:
The peak rate of discharge from the site increases post development.
The total volume of stormwater exiting the site increases post development, and
The peak rate of discharge of the developed site occurs prior to the discharge from the pre-development site.
All of these items combine to increase the magnitude and frequency of downstream flooding and increasing downstream channel erosion potential.
2.2.1 Flood effects
Generally, stormwater drainage systems are designed for a moderate level of performance and territorial authorities may adopt up to a 10-year Average Recurrence Interval (ARI) event for pipe sizing. However, the importance of more severe, less frequent events is acknowledged and allowance is made for overland flow paths for events up to the 100-year ARI event. These two systems are termed the primary and secondary drainage systems. To protect the public and their property, the Building Act requires that habitable building floor levels have a contingency freeboard above the 50-year ARI flood level.
Flooded house for sale
Flooding adjacent to waterways occurs naturally but urbanisation can increase flood potential due to either a gradual increase in peak flows, or where a constriction in the drainage channel (culvert, pipe drainage system) or stream channel reduces the flow capacity.

Page 10 Doc # 11854602
Ngarimu Bay, Coromandel flood
The safe passage of flood flows is not always a case of “making the pipes big enough”. Water flow can change with its location along the channel due to changes in topography, channel dimensions, roughness, pools and other factors. The flood level at a given point is therefore determined by how quickly upstream catchments deliver water and how quickly downstream channel and floodplain capacities allow it to get away. The equilibrium sets the flood level. The flow rate also changes with time, as the flood passes down a catchment. The flood level will therefore constantly change as both the physical-spatial factors change and the variation of flow with time balance varies. The case study below considers the effects of increasing urban land cover on peak flows.
2.2.2 Case study – water quantity effects
Consider a 27.7 hectare site that was previously pasture with two existing houses on it. The site has been developed into 297 lots with average lot size of 600m2. For average sized houses, garages, driveways and subdivision roading, the imperviousness increases from less than 1% for the pre-developed scenario to 54% for the developed scenario. Figure 2-4 shows the pre-development and post-development 2-year and 10-year ARI hydrographs the site. The hydrographs show that the peak flow rate for the 2-year ARI event increases from 1.51 m3/s to 2.80 m3/s and for the 10-year ARI event increases from 2.7 m3/s to 4.37 m3/s. The volume of stormwater runoff for the 2-year ARI event increases from 10,200 m3 to 16,800 m3. Stormwater from the development discharges to a stream. The extra peak flow in the watercourse raises the flood level in the stream. The flood level equivalent to the pre-development 2-year ARI event now occurs more frequently, resulting in more frequent bankfull flows. This results in more stream bank erosion. Urbanisation of catchments can result in major flooding and sedimentation problems.

Doc # 11854602 Page 11
Figure 2-4: Hydrograph comparison for pre and post development scenarios
The more important stormwater quantity effects of urbanisation include the following:
Complete reticulation of a catchment when urbanised will almost double the mean annual flood return period.
A fully urbanised catchment, completely reticulated and with approximately 50% impervious cover, will increase the peak discharge of a 2-year ARI event by approximately four times.
Large floods of low frequency, such as 50-year or 100-year ARI events, show a relatively lesser effect from urbanisation, with their peak flows increasing about 2.5 times.
The number of bank overflows increases, perhaps doubling where the catchment is 20% storm reticulated and 20% impervious.
Floods rise to a higher peak more quickly than under previous rural conditions, and also runoff occurs more rapidly.
Natural baseflow may decrease as a result of reduced groundwater recharge.
Where channel materials are erodible, the stream channel will tend to enlarge as part of the process of larger and more frequent floods.
Stormwater quality When rain contacts the ground and drains downhill, a range of contaminants are entrained in the stormwater depending on the land use type. Urban activities typically

Page 12 Doc # 11854602
increase and introduce new contaminants when compared to runoff from natural areas, which can cause adverse effects in the receiving environment. Some of the key pollutants associated with urban stormwater include: sediments, pathogens, total and dissolved metals, hydrocarbons and oil, organics and pesticides, nutrients and gross pollutants. An additional impact of urbanisation is an increase in water temperature of stormwater runoff from contact with hard stand areas heated by the sun. Thermal effects of stormwater can have a significant adverse effect on aquatic species in downstream receiving environments. A very simple way to note stormwater effects is to walk along an urban stream and note the changes as the land use changes. Areas with greater levels of imperviousness discharge higher quantities of contaminants and water volumes that quickly change the physical structure and quality of the stream. Effects are particularly evident where the upper reaches of a catchment are undeveloped. A visual survey can document comparative downstream changes, such as channel erosion locations, fish pass blockages and areas of sedimentation. Measuring contaminant levels in water or sediment and comparing results against accepted threshold values can also indicate effects on organisms. A number of urban runoff studies have been carried out in New Zealand and internationally to monitor water quality effects. There is national and international evidence that catchment development can have dramatic adverse effects on aquatic habitat, diversity and abundance.
2.3.1 Contaminant types
Urban stormwater carries with it a wide variety of contaminants from multiple sources. Representing the majority of recognised classes of water contaminants, these originate not only from land activities in the catchment but can also occur due to atmospheric deposition. In addition, surface and groundwater can exchange. Streams flowing during times with no rain are an indication of the surface groundwater interaction. Contaminants commonly found in urban stormwater that can harm receiving waters are listed in Table 2-1 below. Table 2-1: Typical urban stormwater contaminants
Parameter Description Suspended sediments Soil and organic particles entrained in stormwater flows Oxygen demanding substances
Soil organic matter and plant detritus which reduce the oxygen content of water when they are consumed by bacteria
Pathogens Pathogens are disease-causing bacteria and viruses, usually derived from sanitary sewers. Faecal coliform and enterococci are often used as indicators of the presence of pathogens
Metals Can be in particulate or soluble form. Most commonly measured metals of concern are zinc, lead, copper and chromium. Metals are persistent and do not decompose
Hydrocarbons and oils Generally associated with vehicle or industrial use Toxic trace organics and organic pesticides
Compounds found in New Zealand waters including polycyclic aromatic hydrocarbons (PAHs) and organo-chlorine pesticides
Nutrients Usually considered for nitrogen and phosphorus Gross pollutants Litter. Has a high visual and amenity impact
Contaminants other than solids and pathogens are associated with being in a solid or in a dissolved state. In stormwater, many contaminants are associated with solids or soil or other natural particulates. This condition differs among the specific contaminants. For example, depending on overall chemical conditions, each metal differs in solubility. For instance, lead is relatively insoluble and will generally be in a particulate form, while zinc may be found in either a particulate or dissolved form. Nutrients phosphorus and nitrogen
Doc # 11854602 Page 13
typically differ substantially in that phosphorus can be found either in particulate or soluble form while nitrogen is generally found in soluble form only. Besides these contaminants, other water quality characteristics affect the behaviour and fate of materials in water. These characteristics include:
Temperature
pH - an expression of the relative hydrogen ion concentration
Dissolved oxygen
Alkalinity - the capacity of a solution to neutralise acid
Hardness - an expression of the relative concentration of divalent cations, principally calcium and magnesium
Conductivity - a measure of a water’s ability to conduct an electrical current as a result of its total content of dissolved substances (often expressed as salinity in estuarine and marine waters or total dissolved solids).
These characteristics affect contaminant behaviour in several ways. Metals generally become more soluble as pH drops below neutral and hence become more available to harm organisms. In addition, pH also affects the toxicity of some metals and ammonia. Depleted dissolved oxygen can also increase metals solubility. Anaerobic conditions in the bottom of lakes release phosphorus from sediments, as iron changes from the ferric to the ferrous form. Elements creating hardness reduce toxicity of many heavy metals. Water quality analyses account for this by varying the allowable level as a function of hardness.
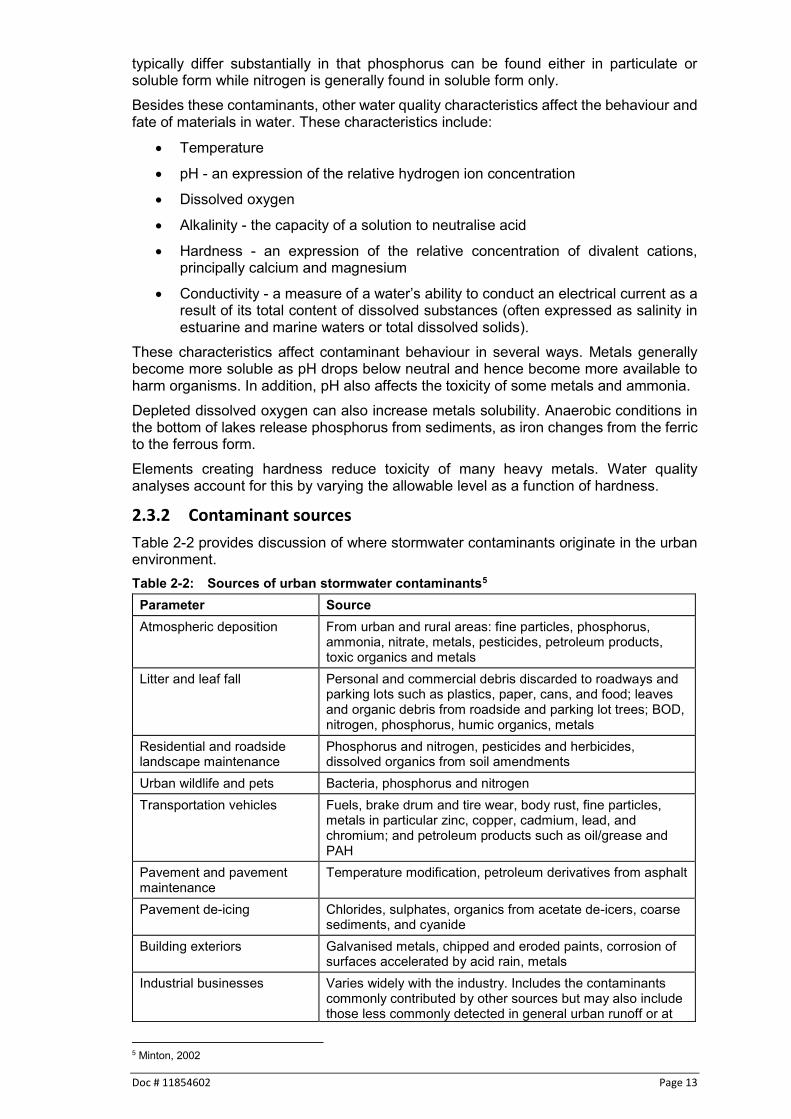
2.3.2 Contaminant sources
Table 2-2 provides discussion of where stormwater contaminants originate in the urban environment. Table 2-2: Sources of urban stormwater contaminants5
Parameter Source Atmospheric deposition From urban and rural areas: fine particles, phosphorus,
ammonia, nitrate, metals, pesticides, petroleum products, toxic organics and metals
Litter and leaf fall Personal and commercial debris discarded to roadways and parking lots such as plastics, paper, cans, and food; leaves and organic debris from roadside and parking lot trees; BOD, nitrogen, phosphorus, humic organics, metals
Residential and roadside landscape maintenance
Phosphorus and nitrogen, pesticides and herbicides, dissolved organics from soil amendments
Urban wildlife and pets Bacteria, phosphorus and nitrogen Transportation vehicles Fuels, brake drum and tire wear, body rust, fine particles,
metals in particular zinc, copper, cadmium, lead, and chromium; and petroleum products such as oil/grease and PAH
Pavement and pavement maintenance
Temperature modification, petroleum derivatives from asphalt
Pavement de-icing Chlorides, sulphates, organics from acetate de-icers, coarse sediments, and cyanide
Building exteriors Galvanised metals, chipped and eroded paints, corrosion of surfaces accelerated by acid rain, metals
Industrial businesses Varies widely with the industry. Includes the contaminants commonly contributed by other sources but may also include those less commonly detected in general urban runoff or at
5 Minton, 2002

Page 14 Doc # 11854602
Parameter Source concentrations greater than normally found in contaminants from inappropriate connections, petroleum products, phenols, solvents, metals.
Commercial businesses Parked vehicles, improperly disposed refuse such as discarded food, used cooking oil and grease, and packaging materials, internal drains improperly connected to the stormwater system, metals, BOD, bacteria, phosphorus, nitrogen, oil and grease
Residential activities Landscaping, pest control, moss control, vehicle maintenance, painting, wood preservation, pesticides and herbicides, phosphorus, nitrogen, petroleum products, zinc and bacteria
Site development High pH from fresh concrete surfaces, petroleum products from fresh asphalt and spills, organics and particles from landscaping materials, eroded sediment and associated constituents such as phosphorus, contaminants associated with improperly disposed construction materials like fresh concrete and paints, cement from preparation of exposed aggregate concrete
Public infrastructure Metals from galvanised stormwater drain systems, metals and petroleum products from maintenance shops, bacteria, nitrogen, phosphorus and organics from exfiltration or overflowing sanitary sewer
There are a number of statements that can be made regarding water quality:
The impact of stormwater on the aquatic environment is due to three factors: a large increase in the volume of water that runs off impervious surfaces compared with more absorbent vegetated surface land uses; the greatly accelerated rate of runoff; and contamination of stormwater with a wide range of substances.
Contaminants are collected by runoff from a variety of diffuse and point sources within a wide catchment area but are often concentrated by reticulated collection system at outfalls into aquatic receiving environments.
The contaminants of most concern are suspended solids, a range of heavy metals, organochlorines, polycyclic aromatic hydrocarbons (PAHs), nutrients and human pathogens. Sources typically are widespread throughout the urban catchment and are classified as diffuse sources.
Many sources of stormwater contamination are difficult to control because of their diffuse distribution catchment-wide.
Discrete sources of stormwater contaminants increase in industrial areas through yard and equipment washing and accidental or deliberate discharge of products and wastes from industrial processes that allow contaminants to enter the stormwater system.
Depending on the contaminant, many contaminants are bound to particulate matter in stormwater. A high proportion of these suspended solids pass through the drainage channels and eventually reach the marine receiving environment. In the marine receiving environment, suspended solids are then incorporated into marine sediments.
Stormwater discharge into a stream

Doc # 11854602 Page 15
Other settling processes also occur when contaminants move from freshwater to estuarine or saline waters.
Settling occurs least along open coasts and harbour entrances due to their being high energy environments. Most sedimentation occurs in upper estuaries where flow velocities are reduced and salt tends to flocculate finer particles. The headwaters of most estuaries are poorly flushed because much of the water draining on the ebb tide returns on the following flood tide. In contrast, open coastal regions are well flushed by tides and contaminants can be re-mobilised into the water column by wave, current and tidal action and are widely dispersed.
Upper estuaries are therefore regarded as highly sensitive to stormwater contamination, because they act as retention zones where suspended solids are deposited, and where contaminants continually accumulate. There is a higher rate of build-up of contaminants near stormwater outfalls. Concentrations then decrease with increasing distance from individual stormwater outfalls.
Urban stormwater in New Zealand has similar concentrations and types of contaminants to those found in other developed countries.
In urban streams, acute and chronic toxicity water quality criteria for the protection of sensitive biological species are regularly exceeded for heavy metal contaminants. Organic contaminant levels in stormwater may sometimes exceed the relevant chronic water quality criteria but the New Zealand information base is sparse. Further downstream where urban streams discharge into larger water bodies, water quality criteria are predicted to be rarely exceeded because of dilution and settling of particulates, which carry most of the contaminants.
The impacts of land development on small urban streams have been severe. Many impacts are caused by modifications to channel and riparian areas, as well as by the hydrological changes accompanying urbanisation.
In sheltered coastal sediments, there is a clear link between urban stormwater contamination and build-up of contaminants. There is strong evidence that this build-up is detrimental to species living in the sediment and which provide the basis of the estuarine ecosystem. Sediment contaminant concentrations in some urban estuaries and harbours exceed North American sediment quality criteria, and there is evidence of chronic toxic effects to species in urban waters.
In streams and near stormwater outfalls, many contaminants regularly exceed sediment quality criteria for the protection of sediment-dwelling species. Many of the retention zones of estuaries with significantly urbanised catchments exceed the criteria for lead, zinc, copper and organochlorines.
If contaminant generation continues at present day rates, the rate of sediment contamination will accelerate with urban expansion, and the extent of the affected areas will increase.
2.3.3 First flush
Managing water quality also requires an understanding of the “first flush” event where the initial runoff from a surface contains (by volume) the highest proportion of contaminant load compared to runoff in the remainder of the storm. The first flush is generally characterised by a peak in some pollutant loads (such as sediments and metals) immediately prior to the peak in flow volumes. Best practice for water quality improvement promotes the capture and treatment of at least the first flush event, as this is often more practical and cost effective than treating flow volumes from the entire storm event.
Page 16 Doc # 11854602
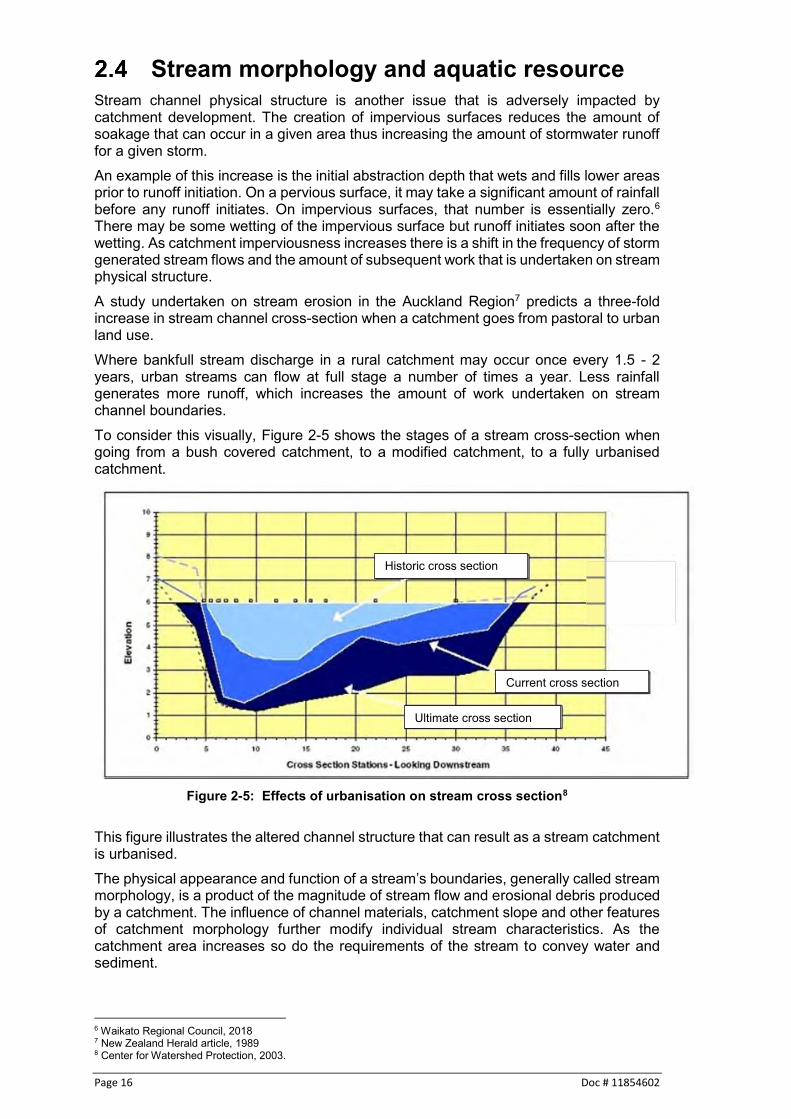
Stream morphology and aquatic resource Stream channel physical structure is another issue that is adversely impacted by catchment development. The creation of impervious surfaces reduces the amount of soakage that can occur in a given area thus increasing the amount of stormwater runoff for a given storm. An example of this increase is the initial abstraction depth that wets and fills lower areas prior to runoff initiation. On a pervious surface, it may take a significant amount of rainfall before any runoff initiates. On impervious surfaces, that number is essentially zero.6 There may be some wetting of the impervious surface but runoff initiates soon after the wetting. As catchment imperviousness increases there is a shift in the frequency of storm generated stream flows and the amount of subsequent work that is undertaken on stream physical structure. A study undertaken on stream erosion in the Auckland Region7 predicts a three-fold increase in stream channel cross-section when a catchment goes from pastoral to urban land use. Where bankfull stream discharge in a rural catchment may occur once every 1.5 - 2 years, urban streams can flow at full stage a number of times a year. Less rainfall generates more runoff, which increases the amount of work undertaken on stream channel boundaries. To consider this visually, Figure 2-5 shows the stages of a stream cross-section when going from a bush covered catchment, to a modified catchment, to a fully urbanised catchment.
Figure 2-5: Effects of urbanisation on stream cross section8
This figure illustrates the altered channel structure that can result as a stream catchment is urbanised. The physical appearance and function of a stream’s boundaries, generally called stream morphology, is a product of the magnitude of stream flow and erosional debris produced by a catchment. The influence of channel materials, catchment slope and other features of catchment morphology further modify individual stream characteristics. As the catchment area increases so do the requirements of the stream to convey water and sediment.
6 Waikato Regional Council, 2018 7 New Zealand Herald article, 1989 8 Center for Watershed Protection, 2003.
Historic cross section
Current cross section
Ultimate cross section

Doc # 11854602 Page 17
2.4.1 Bankfull discharge
A common term used in stream morphology is “bankfull” flow. This is a term that is used to denote channel capacity. When bankfull flow is exceeded, floodplain flow initiates. Stream dimensions, patterns and bed features are a function of channel width measures at bankfull stage. The bankfull stage corresponds to the discharge at which channel maintenance is most effective, i.e. the discharge at which moving sediment, forming or removing bars, forming or changing bends and meanders and generally doing work that results in the average morphologic characteristics of channels. Typical velocity distributions are shown in Figure 2-6 below. It is this discharge in combination with the range of flows that make up an annual hydrograph which govern the shape and size of the channel. Bankfull discharge is associated with a momentary maximum flow that on the average has a recurrence interval of 1.5 - 2 years as determined using a flood frequency analysis.
Figure 2-6: Stream cross section showing velocity distributions9
2.4.2 Stream channel dimensions
Stream width is a function of stream flow occurrence and magnitude, size and type of transported sediment and the bed and bank materials of the channel. Channel width is influenced by the following:
Direct channel disturbance such as channelization
Changes in riparian vegetation that may alter boundary resistance and increase channel erosion potential, and
Changes in streamflow regime due to catchment changes such as increased impervious surfaces or increased sediment delivery resulting from construction.
2.4.3 Stream channel patterns
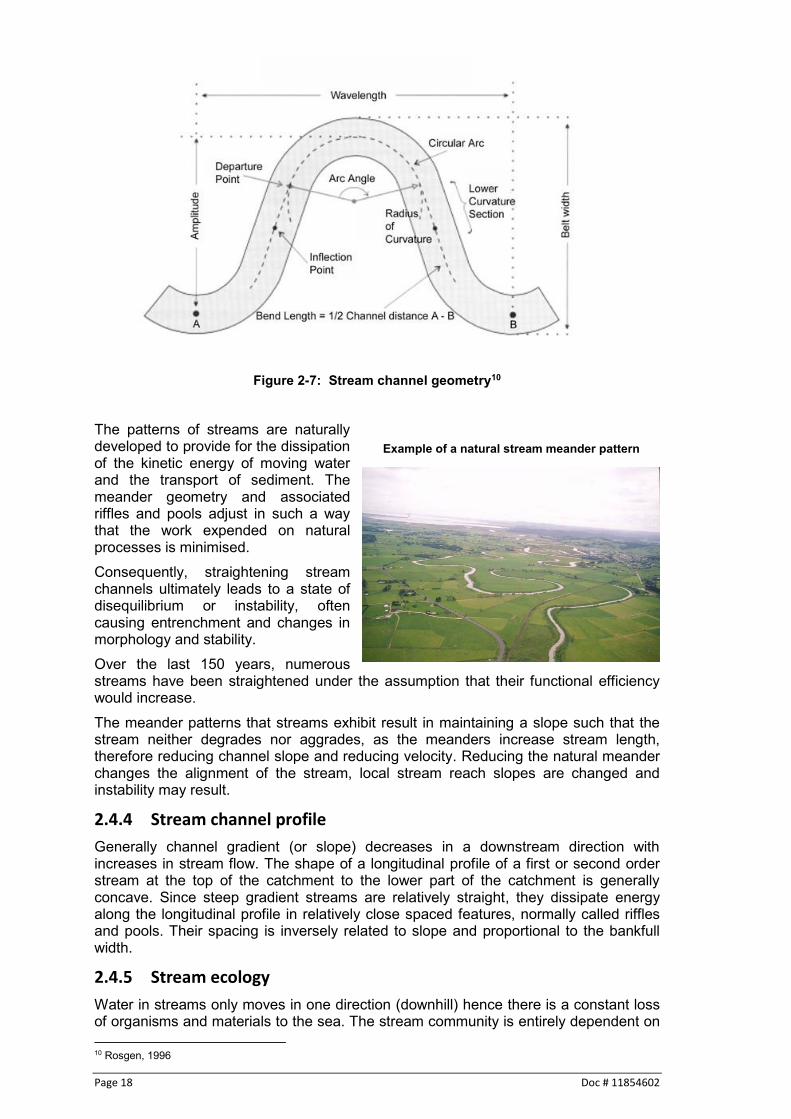
Un-modified streams are rarely straight for any substantial distance rather they tend to follow a sinuous course. Meander geometry is most often expressed as a function of bankfull width. An example of the relationships that exist and the various components of a meander pattern are shown in Figure 2-7. The parameters include bankfull width, meander wavelength and radius of curvature. Stream flow regimes not only include bankfull channel widths but can also change stream patterns, depending on the magnitude and duration of flows. As catchments are urbanised, widening of streams and changes in channel patterns can be observed. These channel adjustments are brought on by an acceleration of streambank and bed erosion.
9 Chow, 1959
Page 18 Doc # 11854602
Figure 2-7: Stream channel geometry10
The patterns of streams are naturally developed to provide for the dissipation of the kinetic energy of moving water and the transport of sediment. The meander geometry and associated riffles and pools adjust in such a way that the work expended on natural processes is minimised. Consequently, straightening stream channels ultimately leads to a state of disequilibrium or instability, often causing entrenchment and changes in morphology and stability. Over the last 150 years, numerous streams have been straightened under the assumption that their functional efficiency would increase. The meander patterns that streams exhibit result in maintaining a slope such that the stream neither degrades nor aggrades, as the meanders increase stream length, therefore reducing channel slope and reducing velocity. Reducing the natural meander changes the alignment of the stream, local stream reach slopes are changed and instability may result.
2.4.4 Stream channel profile
Generally channel gradient (or slope) decreases in a downstream direction with increases in stream flow. The shape of a longitudinal profile of a first or second order stream at the top of the catchment to the lower part of the catchment is generally concave. Since steep gradient streams are relatively straight, they dissipate energy along the longitudinal profile in relatively close spaced features, normally called riffles and pools. Their spacing is inversely related to slope and proportional to the bankfull width.
2.4.5 Stream ecology
Water in streams only moves in one direction (downhill) hence there is a constant loss of organisms and materials to the sea. The stream community is entirely dependent on 10 Rosgen, 1996
Example of a natural stream meander pattern

Doc # 11854602 Page 19
materials entering the system from mostly terrestrial ecosystems, typically as particulate matter (leaves, organic and inorganic matter). As a result, different streams and reaches of streams have different aquatic communities. Upland fast-flowing streams with stony beds differ in community structure from slow-flowing lowland rivers with muddy bottoms. Looking at what lives in a stream in an undisturbed forested condition and relating that to what commonly exists in a stream that is impacted by urban development can provide a barometer of what we can expect if development was to occur in a traditional manner. A discussion of ecological issues also can provide guidance of what site resources are important to maintain if aquatic ecosystem protection is a goal. The dynamic nature of wet-weather flow regimes and water quality make it difficult to assess the impact of urbanisation and stormwater on aquatic ecosystems. Physical habitat and biological measures reflect aquatic ecosystem conditions over months and years and thus integrate these variable conditions into a more easily understood set of measures. Physical habitat is a principal element of ecological analysis. Without the proper channel and riparian characteristics (floodplain, shade, stable channel, riffles, pools, etc.) improvements in hydrology and water quality will demonstrate little change in ecosystem function or value. Most importantly, the aquatic community (plants, invertebrates, fish) provides a direct measure of ecosystem quality and sustainability. Table 2-3 provides a summary of the impacts of urbanisation on aquatic ecosystems. Table 2-3: Impacts of urbanisation on aquatic ecosystems11
Environmental concern Potential impact Cause-source Increase in runoff driven peak or bankfull stream flows
Degradation of aquatic habitat and/or loss of sensitive species
Increased stormwater runoff volume due to an increase in catchment imperviousness
Increase in runoff –driven flooding frequency and duration
Degradation of aquatic habitat and/or loss of sensitive species
Increased stormwater runoff volume due to an increase in catchment imperviousness
Increase in wetland water level fluctuations
Degradation of aquatic habitat and/or loss of sensitive species
Increased stormwater runoff due to an increase in catchment imperviousness
Decrease in dry season baseflows
Reduced aquatic habitat and less water for human consumption, irrigation or recreational use
Water withdrawals and/or less natural infiltration due to an increase in catchment imperviousness
Streambank erosion and stream channel enlargement
Degradation of aquatic habitat and increased fine sediment production
Increase in stormwater runoff driven stream flow due to an increase in catchment imperviousness
Stream channel modification due to hydrologic changes and human alteration
Degradation of aquatic habitat and increased fine sediment production
Increase in stormwater runoff driven stream flow and/or channel alterations such as stopbanks
Streambed scour and incision Degradation of aquatic habitat and loss of benthic organisms due to washout
Increase in stormwater runoff driven stream flow due to an increase in catchment imperviousness
Excessive turbidity Degradation of aquatic habitat and/or loss of sensitive species due to physiological and/or behavioural interference
Increase in stormwater runoff driven stream flow and subsequent streambank erosion due to an increase in catchment imperviousness
Fine sediment deposition Degradation of aquatic habitat and loss of benthic organisms due to fine sediment smothering
Increase in stormwater runoff driven stream flow and subsequent streambank
11 Shaver et al, 2007

Page 20 Doc # 11854602
Environmental concern Potential impact Cause-source erosion due to an increase in catchment imperviousness
Sediment contamination Degradation of aquatic habitat and/or loss of sensitive benthic species
Stormwater runoff contaminants
Loss of riparian integrity Degradation of riparian habitat quality and quantity, as well as riparian corridor fragmentation
Human development encroachment and stream road crossings
Proliferation of exotic and invasive species
Displacement of natural species and degradation of aquatic habitat
Encroachment of urban development
Elevated water temperature Lethal and non-lethal stress to aquatic organisms – reduced DO levels
Loss of riparian forest shade and direct runoff of high temperature stormwater from impervious surfaces
Low dissolved oxygen (DO) levels
Lethal and non-lethal stress on aquatic organisms
Stormwater runoff containing fertilisers and wastewater treatment system effluent
Lake and estuary nutrient eutrophication
Degradation of aquatic habitat and low DO levels
Stormwater runoff containing fertilisers and wastewater treatment system effluent
Bacterial contamination Human health (contact recreation and drinking water) concerns, increases in diseases to aquatic organisms and degradation of shellfish harvest beds
Stormwater runoff containing livestock manure, pet waste and wastewater treatment effluent
Toxic chemical water contamination
Human health (contact recreation and drinking water) concerns, as well as bioaccumulation and toxicity to aquatic organisms
Stormwater runoff containing toxic metals, pesticides, herbicides and industrial chemical contaminants
Reduced organic matter and large woody debris
Degradation of aquatic habitat and loss of sensitive species
Loss or degradation of riparian forest and floodplain due to development encroachment
Decline in aquatic plant diversity
Alteration of natural food web structure and function
Cumulative impacts of urbanisation
Decline in aquatic invertebrate diversity
Alteration of natural food web structure and function
Cumulative impacts of urbanisation
Decline in amphibian diversity Loss of ecologically important species
Cumulative impacts of urbanisation
Decline in fish diversity and abundance
Loss of ecologically important species
Cumulative impacts of urbanisation
2.4.6 Physical habitat
The increased frequency and magnitude of peak flows destabilises stream banks and increases sedimentation. Sedimentation can smother stable and productive aquatic habitats such as rocks, logs and aquatic plants. The roots of large trees are undercut and trees fall into the stream while new growth has less opportunity to become established. Bare soil stream banks also result from deliberate removal of vegetation and are a common feature of urban streams.

Doc # 11854602 Page 21
Stream erosion with bank being undercut
The direct removal of trees and shrubs as part of urban development accelerates the loss of stable riparian vegetation. The resulting stream ecosystem is in a constant state of instability with little opportunity to become stable and more complex. Ecosystem function and quality increases with increased complexity, and the more complex the habitat, the more complex the ecosystem functions. Forests are more complex ecosystems than pastures.
2.4.7 Ecological stress factors
The main factors influencing plants and animals in streams include the following:
Physical habitat
Temperature
Dissolved oxygen
Contaminants (including suspended solids, nutrients, metals, hydrocarbons and oils and pesticides)
Stream flow
Light
Instream barriers, and
Clearance of riparian vegetation. Urbanisation results in impacts related to all of the above items. No one single item is of primary importance. If impacts to aquatic ecosystems are to be minimised, approaches must address all of the above items. Thus, the council’s recommended approach to stormwater management attempts to reduce the impacts associated with each item. Figure 2-8 below relates imperviousness of a catchment to stream health. In this figure stream health is represented by presence of sensitive aquatic macroinvertebrate (Ephemeroptera Plecoptera Trichoptera or EPT) and the horizontal axis relates to percentages of impervious surface in a given catchment. Imperviousness is an imperfect surrogate but it does incorporate many of the factors listed above. Figure 2-8 shows that increased levels of imperviousness adversely affect the survivability of sensitive aquatic species as imperviousness increases. Once urbanisation is completed, the macroinvertebrate community generally consists of worms and midges, which indicates a degraded stream condition.
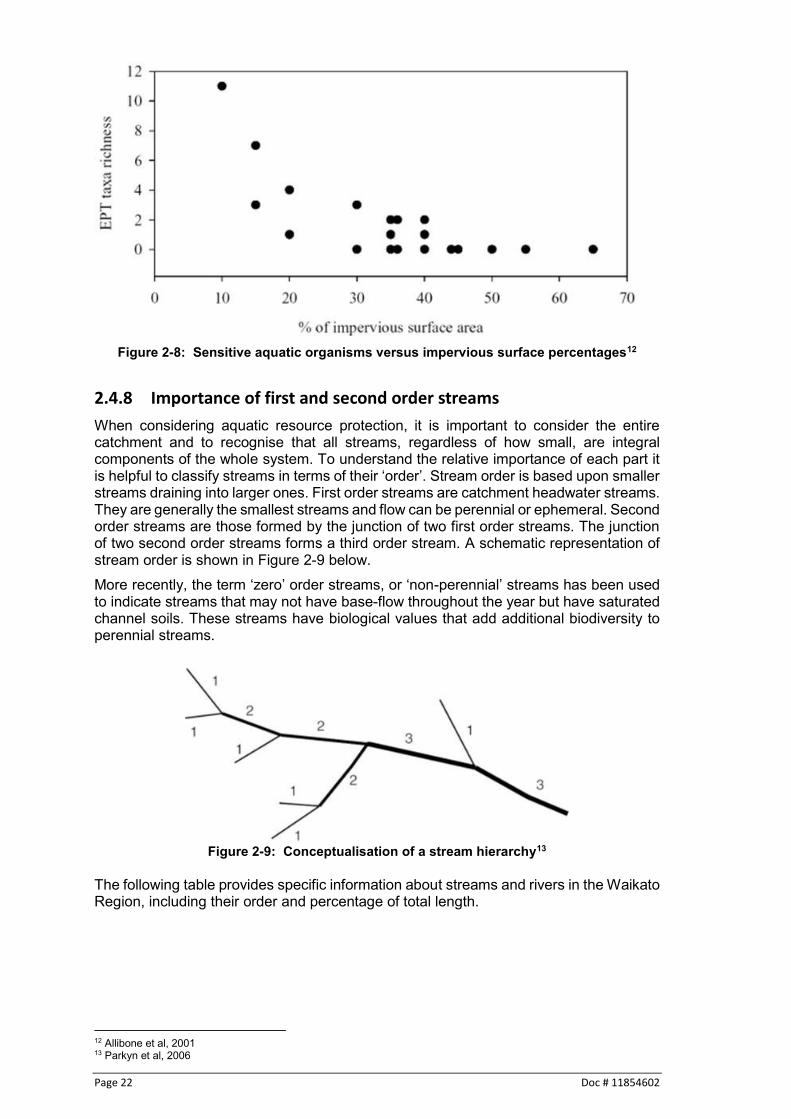
Page 22 Doc # 11854602
Figure 2-8: Sensitive aquatic organisms versus impervious surface percentages12
2.4.8 Importance of first and second order streams
When considering aquatic resource protection, it is important to consider the entire catchment and to recognise that all streams, regardless of how small, are integral components of the whole system. To understand the relative importance of each part it is helpful to classify streams in terms of their ‘order’. Stream order is based upon smaller streams draining into larger ones. First order streams are catchment headwater streams. They are generally the smallest streams and flow can be perennial or ephemeral. Second order streams are those formed by the junction of two first order streams. The junction of two second order streams forms a third order stream. A schematic representation of stream order is shown in Figure 2-9 below. More recently, the term ‘zero’ order streams, or ‘non-perennial’ streams has been used to indicate streams that may not have base-flow throughout the year but have saturated channel soils. These streams have biological values that add additional biodiversity to perennial streams.
Figure 2-9: Conceptualisation of a stream hierarchy13
The following table provides specific information about streams and rivers in the Waikato Region, including their order and percentage of total length.
12 Allibone et al, 2001 13 Parkyn et al, 2006

Doc # 11854602 Page 23
Table 2-4: Order of streams and rivers in the Waikato Region14 Stream Order Length (m) Length in % of total length
1 26,718,000 62 2 7,879,637 18 3 4,486,129 10 4 2,336,487 5 5 1,181,286 3 6 522,597 1 7 435,126 1
Total 43,559,262 100 It is important to recognise that over 60% of the streams in the Waikato Region are first order streams (in terms of total length). When combined with second order streams, that total increases to 80% of all streams. A similar review of streams in the United States indicates that approximately 70% of all streams are first and second order streams. If it is a programme goal to protect third order or larger streams, that goal cannot be attained if first and second order streams are destroyed by mass earthworks or enclosed in pipes. A study15 assessed the effectiveness of structural devices for protection of stream aquatic resources from a catchment-wide perspective and made the following key findings:
Until catchment total impervious area exceeds 40% biological decline was more strongly associated with hydrologic fluctuation than with chemical water and sediment quality decreases.
Structural stormwater management devices at current densities of implementation demonstrated less potential than the non-structural methods (riparian buffers, vegetation preservation) to forestall resource decline as urbanisation starts and progresses. Analysis showed that none of the stormwater management options are without limitations and widespread landscape preservation must be incorporated to retain the most biologically productive aquatic resources.
Structural stormwater management devices can make a substantial contribution to keeping stream ecosystem health from falling to the lowest levels at moderately high urbanisation and, with extensive landscape preservation, to maintaining relatively high biotic integrity at light urbanisation.
A major reason this guideline stresses the importance of combining conventional stormwater management with low impact design is that the volume of stormwater generated must be reduced if aquatic resource protection is to be provided. Just providing mitigation for urban development will only reduce the rate of decline. The combination of low impact design in conjunction with conventional stormwater management provides the best opportunity to ensure receiving environments in the Waikato are protected and restored and enhanced in accordance with the Regional Policy Statement. This guideline recommends the protection of first and second order streams. Piping natural water courses is not supported.
14 Waikato Regional Council, LINZ 1:50,000 topographic scale 15 Horner, 1999

Page 24 Doc # 11854602
Cumulative effects From a catchment perspective, the water quality and quantity effects of stormwater runoff from an individual site may be relatively minor. If we consider a 10% increase in peak flow from one individual site, downstream flood levels may only increase 10mm. However, a 10mm increase in flood level for many sites across a catchment combined is likely to cause a significant increase in flood level that could result in flood damage to properties. Therefore, in addition to any site-specific effects, cumulative effects must also be considered for the maximum probable development scenario within the catchment.

Doc # 11854602 Page 25
3 Waikato context The Waikato Region
The Waikato is the fourth largest region in New Zealand, covering 25,000 square kilometres (land and water). It stretches from the Bombay Hills and Port Waikato in the north to the Kaimai Ranges and Mt Ruapehu in the south, and from Mokau on the West Coast to the Coromandel Peninsula in the east. The Waikato Region has one city (Hamilton) and ten districts. At the time of the last census in 2013, 403,638 people lived in the Waikato Region, about three quarters of them in urban areas. The Waikato Region has about 9.5% of New Zealand’s population. The Waikato Region contains:
The longest river in New Zealand (the Waikato River)
The largest lake (Lake Taupo)
Internationally significant wetlands
The country’s most important geothermal systems
Extensive native and exotic forests, and
Tongariro National Park. The Waikato Region has a mean annual rainfall of 1,342 mm, which puts it in the temperate rainforest category. The region supports over 35,000 km of streams and rivers16. Rivers in the Waikato Region are mainly alluvial, which means they flow through flood plains they have created by depositing sediment. The Waikato River is 425 km long and begins on Mount Ruapehu, flowing from Lake Taupō across the Volcanic Plateau, into the Waikato basin and out to the Tasman Sea. Its major tributary, the Waipā River, rises in the Rangitoto Range in the King Country. The two rivers converge at Ngāruawāhia. The Thames Valley and Hauraki Plains areas are drained by the Waihou River, which flows from the Mamaku and Pātetere plateaus; the Piako River, which rises near Maungakawa; and the Waitoa River, which has its source in hill country near Piarere.17 Wetlands, peat lakes and peat bogs abound in the Waikato lowlands, particularly in the central Thames Valley, north of Taupiri and south of Hamilton. Drainage works to lower the groundwater levels and create farmland have destroyed some wetlands and split others into fragments. However, in the early 2000s the Waikato Region still contained around 30% of New Zealand’s wetlands, including the Whangamarino Wetland and Kopuatai Peat Dome.2 Waikato Regional Council monitors changes in the amount of freshwater wetland vegetation using information from satellite data and also has a Regional Indigenous Vegetation Inventory that provides an estimate of historic wetland vegetation (1840). This information shows that:
Before European settlement freshwater wetlands covered approximately 1,100 km2 or 5% of the region, and
Today approximately 280 km2 or 1% of the region is in wetland vegetation. There are approximately 103 natural ‘named’ lakes in the Waikato Region plus five hydro-power lakes.18 The region has abundant aquatic resources that are vulnerable to degradation from both rural and urban land uses unless appropriately managed.
16 Collier et al, 2010. 17 Te Ara The Encyclopedia of New Zealand. (Online version https://teara.govt.nz/en 2017) 18 Wildlands Consultants, 2009

Page 26 Doc # 11854602
Regulatory framework The Waikato Regional Council has a number of statutory plans and policies that provide the framework to manage the region’s natural resources and that support the formation of the Waikato Stormwater Management Guideline. The Te Ture Whaimana o Te Awa o Waikato – the Vision and Strategy is the prevailing document and is embedded within the Waikato Regional Policy Statement (WRPS). The Te Ture Whaimana o Te Awa o Waikato covers the Waikato and Waipa Rivers and their catchments. The entire Waikato Region and the remainder of the catchments not captured under the Te Ture Whaimana o Te Awa o Waikato are covered by the Waikato Regional Plan (WRP) which must give effect to the WRPS, which in turn must give effect to the National Policy Statement for Freshwater Management (NPS-FM).
3.2.1 The Vision and Strategy
Te Ture Whaimana o Te Awa o Waikato – the Vision and Strategy for the Waikato River (the Vision and Strategy) is the primary direction-setting document for the Waikato River and its catchments. There are three River Acts which establish co-governance arrangements for the Waikato and Waipa Rivers, including the Vision and Strategy. These are Waikato-Tainui Raupatu Claims (Waikato River) Settlement Act 2001, Ngati Tuwharetoa, Raukawa, and Te Arawa River Iwi Waikato River Act 2010 and Nga Wai o Maniapoto (Waipa River) Act 2012. As stated previously, the Vision and Strategy prevails in the case of any inconsistencies in a national policy statement or New Zealand coastal policy statement, and is deemed to be part of the Waikato Regional Policy Statement (WRPS). Although the Waikato and Waipā Rivers do not represent the whole catchment within the Waikato Region, they do represent a significant proportion of it. The approach contained in Te Ture Whaimana includes the following objectives that support the purpose of the Waikato Stormwater Management Guideline:
The restoration and protection of the health and wellbeing of the Waikato River.
The adoption of a precautionary approach towards decisions that may result in significant adverse effects on the Waikato River.
The recognition and avoidance of adverse cumulative effects, and potential cumulative effects, of activities undertaken both on the Waikato River and within its catchments on the health and wellbeing of the Waikato River.
The recognition that the Waikato River is degraded and should not be required to absorb further degradation as a result of human activities.
The restoration of water quality within the Waikato River so that it is safe for people to swim in and take food from over its entire length.
The Waikato Stormwater Management Guidelines represent the latest expertise in the management of stormwater and is a significant step towards achieving Te Ture Whaimana. The document’s strategies reference the need to:
Develop and share local, national and international expertise, including indigenous expertise, on rivers and activities within their catchments that may be applied to the restoration and protection of the health and wellbeing of the Waikato River.
3.2.2 Waikato Regional Policy Statement19
The purpose of the WRPS is to achieve the purpose of the RMA by providing an overview of the resource management issues of the region, and policies and methods to achieve integrated management of the natural and physical resources. The Vision and Strategy,
19 http://www.waikatoregion.govt.nz/PageFiles/6777/2016/WaikatoRegionalPolicyStatement2016.pdf
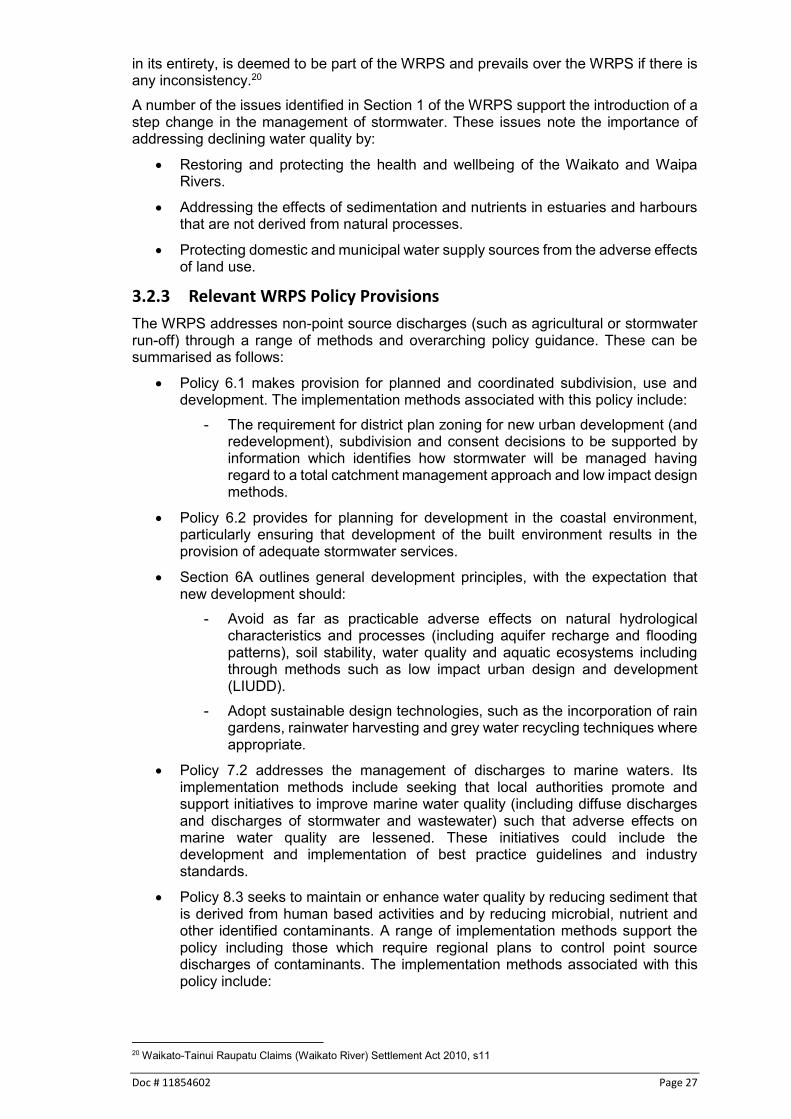
Doc # 11854602 Page 27
in its entirety, is deemed to be part of the WRPS and prevails over the WRPS if there is any inconsistency.20 A number of the issues identified in Section 1 of the WRPS support the introduction of a step change in the management of stormwater. These issues note the importance of addressing declining water quality by:
Restoring and protecting the health and wellbeing of the Waikato and Waipa Rivers.
Addressing the effects of sedimentation and nutrients in estuaries and harbours that are not derived from natural processes.
Protecting domestic and municipal water supply sources from the adverse effects of land use.
3.2.3 Relevant WRPS Policy Provisions
The WRPS addresses non-point source discharges (such as agricultural or stormwater run-off) through a range of methods and overarching policy guidance. These can be summarised as follows:
Policy 6.1 makes provision for planned and coordinated subdivision, use and development. The implementation methods associated with this policy include:
- The requirement for district plan zoning for new urban development (and redevelopment), subdivision and consent decisions to be supported by information which identifies how stormwater will be managed having regard to a total catchment management approach and low impact design methods.
Policy 6.2 provides for planning for development in the coastal environment, particularly ensuring that development of the built environment results in the provision of adequate stormwater services.
Section 6A outlines general development principles, with the expectation that new development should:
- Avoid as far as practicable adverse effects on natural hydrological characteristics and processes (including aquifer recharge and flooding patterns), soil stability, water quality and aquatic ecosystems including through methods such as low impact urban design and development (LIUDD).
- Adopt sustainable design technologies, such as the incorporation of rain gardens, rainwater harvesting and grey water recycling techniques where appropriate.
Policy 7.2 addresses the management of discharges to marine waters. Its implementation methods include seeking that local authorities promote and support initiatives to improve marine water quality (including diffuse discharges and discharges of stormwater and wastewater) such that adverse effects on marine water quality are lessened. These initiatives could include the development and implementation of best practice guidelines and industry standards.
Policy 8.3 seeks to maintain or enhance water quality by reducing sediment that is derived from human based activities and by reducing microbial, nutrient and other identified contaminants. A range of implementation methods support the policy including those which require regional plans to control point source discharges of contaminants. The implementation methods associated with this policy include:
20 Waikato-Tainui Raupatu Claims (Waikato River) Settlement Act 2010, s11

Page 28 Doc # 11854602
- The requirement for the regional plan to manage the adverse effects of activities in riparian areas, including ensuring reduced sedimentation of fresh water bodies.
- Management of the adverse effects of land use and activities on fresh water bodies from non-point source discharges of nutrients and other contaminants.
- Promotion of land-based mitigation of stormwater, including the use of wetlands and low-impact options.
- The requirement for territorial authorities to manage the effects of subdivision, use and development either by promoting best practice stormwater management for urban areas, including the need for stormwater catchment plans for greenfield development, and managing contaminant loadings (including sediment) entering stormwater networks.
3.2.4 Waikato Regional Plan
Section 63(1) of the RMA directs a regional council to prepare a regional plan to assist a regional council to carry out any of its functions in order to achieve the purpose of this Act. The Waikato Regional Plan (April 2012) recognises the importance of effectively managing discharges to land and water. Stormwater discharges are addressed in Section 3.5 of the Plan. Section 3.5.3 contains the key policies:
Policy 1 enables discharges that have only minor adverse effects and outlines the parameters for this.
Policy 2 addresses the management of discharges to water with more than minor effects, among other matters, ensuring that there are no significant adverse effects from downstream siltation.
Policy 3 considers the alternatives to direct discharge to water.
Policy 7 encourages at-source management and treatment of stormwater discharges to reduce adverse water quality and water quantity effects of discharges on receiving waters. The associated explanation refers to statutory and non-statutory means to encourage stormwater management prior to its discharge to receiving waters.
Section 3.5.11 outlines implementation methods associated with stormwater discharges. Among other matters, it states that Waikato Regional Council will work with resource users to:
- Find ways to mitigate adverse effects of existing stormwater discharges. - Promote the development of stormwater management plans which record
the way in which the stormwater network is operated, including methods to avoid, remedy or mitigate the adverse effects of stormwater discharge.
- Promote alternative methods for the treatment and disposal of stormwater from existing and new subdivisions and development.
3.2.5 Healthy Rivers Wai Ora: Plan for Change He Rautaki Whakapaipai
The Waikato community has consistently identified water quality as the top issue for the Waikato Region for the past two decades. Healthy Rivers/Wai Ora Proposed Waikato Regional Plan Change 1 is the bold response to addressing the complex problem of water quality facing our Waipa and Waikato Rivers. The proposed plan change gives effect to Government legislation on the management of fresh water (passed in 2014) and the Vision and Strategy for the Waikato and Waipa Rivers which was adopted by Government as part of Treaty Settlement legislation. Through a collaborative plan making process, Plan Change One: Heathy Rivers Wai Ora: Plan for Change He Rautaki Whakapaipai has been developed and was publically notified on 22 October 2016. The plan change is a change to the Operative Waikato Regional Plan (WRP) to restore and protect water quality in the Waikato and Waipa

Doc # 11854602 Page 29
Rivers by managing discharges of nitrogen, phosphorous, sediment and microbial pathogens to land in the catchment, where it may enter surface water or groundwater and subsequently enter the rivers, or directly into a water body. The regional council has a legal requirement to give effect to both of these. The proposed plan has been developed using a collaborative process involving community and sector representation which has ensured that those who are most affected by the changes have been at the table developing the policy and providing input and feedback from their communities and sectors over a period of 2 – 3 years. New rules will complement existing rules in the Waikato Regional Plan. Existing rules in the Waikato Regional Plan will continue to apply, e.g. farm dairy effluent rules, earthwork rules and point-source discharge rules.

Page 30 Doc # 11854602
4 Receiving environments Understanding where stormwater goes and the sensitivity of the receiving environment will determine the requirements for stormwater management. Having a greater understanding of where water drains to and the recognition that those receiving systems have value, are threatened and require a greater level of protection will improve awareness and action. Receiving environments in the Waikato Region are varied, and include the following:
Streams and rivers
Floodplains
Wetlands
Ground
Karst geology
Estuaries
Harbours
Open coasts
Lakes, and
Geothermal areas. Each of these receiving environments is discussed below.
Streams and rivers Streams and rivers provide a means of conveyance of stormwater from the tops of catchments to lakes, estuaries, harbours and open coast areas. As water in streams and rivers only moves in one direction (downhill) there is a constant loss of organisms and materials to the sea. The stream and river community is dependent on materials entering the system from mostly terrestrial ecosystems, typically as particulate matter (leaves, organic and inorganic matter). As a result, different streams and reaches of streams have different aquatic communities. Upland, fast-flowing streams with stony beds differ from slow-moving lowland rivers with muddy bottoms. The dynamic nature of wet-weather flow regimes and water quality make it difficult to assess the impact of urbanisation and stormwater on aquatic ecosystems. The best way to determine whether a given stream or river is healthy is to consider two main components of stream systems: habitat and biology. Urbanisation destabilises stream and riverbanks, increases sedimentation and transports urban contaminants into them. Sedimentation can smother bottom dwelling organisms and increased sunlight increases stream temperatures. Ecosystem function and quality increases with increased complexity, and the more complex the habitat, the more complex the ecosystem functions.

Doc # 11854602 Page 31
Silt laden Karapiro stream discharging into the Waikato River
Biology in streams and rivers includes the following:
Periphyton – algae, bacteria and fungi that covers the bottom of slow moving streams and blue-green and filamentous green algae that flourish in hard rocky substrates that provide firm footing.
Macrophytes – plants that are usually rooted and mostly submerged or floating. Macrophytes act as a physical surface for periphyton and insects.
Benthic macroinvertebrates – bugs that process and utilise the energy entering streams from either organic materials or waste from human or animal sources. Macroinvertebrates are an excellent means to assess stream health, as certain species only exist where there is good water quality.
Freshwater fish – Absence or presence of fish may provide a picture of overall health of a stream or river. Absence of fish from a stream or river could be related to barriers to fish passage downstream, habitat loss or water quality issues.
The main factors influencing stream and river biology include:
Physical habitat
Temperature
Dissolved oxygen
Suspended sediments
Stream flow
Nutrients
Light
Contaminants
Instream barriers, and
Loss of riparian vegetation. In urban streams and rivers it is generally hard to ascribe a specific reason for poor biology, as it is often a combination of most of the factors contained in the above list. For projects that drain to them, the main issues of concern relate to both water quantity and water quality. Depending on the location of the project in a catchment, peak flow control may be an issue. In addition, stream channel physical structure may be a concern and consideration given to either extended detention or reducing total volume of stormwater flows by either infiltration or evapotranspiration.

Page 32 Doc # 11854602
Water quality is a concern for urban stormwater discharges to streams and rivers, as discussed in Section 2.3, mechanisms to address water quality issues are provided in the Waikato Regional Plan and Waikato Regional Policy Statement. A study of contaminants in urban stream sediments in Hamilton21 indicates that zinc, lead or arsenic have the highest contaminant levels in sediments and copper is recommended for monitoring in future studies. The study did not consider dissolved or waterborne contaminant concentrations, which may make up a considerable component of the stormwater runoff quality. Where urban development drains to a river or stream, consideration has to be given to water quantity, quality and stream or river instability.
4.1.1 Examples of impacted aquatic resources
The following summarises the findings of several studies that assessed the condition of existing aquatic resources in the Waikato Region:
The Waikato River is one of the most impacted in New Zealand in terms of fish habitat. Loss of bush catchments due to farm and forestry development, heavy industry discharges, floodplain and wetlands loss, heavy recreational and commercial harvest and flood protection have all combined to significantly reduce the fishery of the river.22
Macroinvertebrate sampling has been undertaken in streams and rivers for a number of years and trends up to 2005 indicate that lower values exist for sites with adjacent reaches and upstream catchments dominated by pasture compared to indigenous vegetation.23
Other monitoring of invertebrate populations in the Waikato, Waihou and Waipa Rivers was undertaken in 200124. Decreasing scores on the Waikato River were attributed to the decline of water quality moving downstream.
Floodplains Floodplains occupy those areas adjacent to stream channels that become inundated with stormwater during large rainfall/runoff events. In general rainfall (in conjunction with inadequate drainage capacity) is the main cause of flooding, although surges by wind driven currents can exacerbate the problem, or in unique situations, cause the flooding problem. Flooding problems result from two main components of precipitation: the intensity and duration of rainfall, and its areal extent and distribution.
21 Clearwater, 2012 22 Speirs, 2001 23 Collier et al, 2006 24 Taylor A., 2001

Doc # 11854602 Page 33
Flooding has been the most common reason for declarations of civil defence emergency in New Zealand. Despite extensive river and catchment control schemes, damage from flooding nationwide is estimated to cost at least $125 million a year. Many studies have shown that paving and drainage systems in urban areas increase flooding, particularly as many urban areas are located along floodplains and former wetlands. Flooding in and of itself is not a problem. Floods have been occurring since the beginning of time and are a natural part of the water cycle. Problems are caused when man interacts with the floodplain. Thus, flood hazard potential relating to human health, property damage, and social disruption are strongly influenced by human activity within the floodplain. There are several key catchment characteristics which impact flood frequency and depths, these are discussed further below:
Catchment size and slope
Surface conditions and land use
Floodplain topography.
4.2.1 Catchment size and slope
The abundance of rainfall in the region feeds small first and second order streams. These streams and their associated floodplains are the conveyance means of getting water downstream, through the catchment and to the sea. Smaller catchments have a rapid response time to storm flows where larger catchments have a longer response time as storm flows take time to travel through the drainage system.
4.2.2 Surface conditions and land use
Until the nineteenth century, 75% of the country was covered in temperate rainforest. Replacing two-thirds of it with exotic grasses has dramatically increased the rate at which rain reaches the ground surface and flows overland into the stream system. Urbanisation, with its impervious surfaces has an even more profound effect on flood flows. Not only do floods increase in size and frequency, but also their speed of onset is increased, particularly with the first 20% of change from pervious to impervious cover. This makes intensive, short-duration rainfall events more problematic in terms of flooding. In addition, the time of year can impact on flood levels via the intensity of rainfall and the saturated condition of soils. Table 4-1 provides typical values of roughness coefficients for floodplain areas for the purposes of hydraulic calculations to determine flow velocities and elevations. They indicate the value that vegetation has on the movement of flood flow and can be considered in the context of retardance factors. The higher the roughness value is, the greater the retardance to flow movement through it.
Table 4-1: Values of the Mannings roughness coefficient ‘n’ in floodplains25
25 Delaware Department of Natural Resources and Environmental Control, 1997

Page 34 Doc # 11854602
As can clearly be seen, the denser and taller the vegetation, the greater the frictional resistance to stream flow.
4.2.3 Floodplain topography
The channel form and associated floodplain in part determine the size of flood, particularly its depth and areal extent. A small catchment and wide floodplain will result in a shallow widespread flood. Whereas a deep channel and steep slopes will result in deeper flooding with a small areal extent. The many benefits that floodplains provide are partly a function of their size and lack of disturbance. However what makes floodplain particularly valuable ecologically is their connection to water and the natural drainage systems of wetlands, streams and estuaries. The water quality and water quantity functions provided by the floodplain overlap with the landscape functions of tract size and ecosystem complexity to make them exceptionally valuable natural resources.
4.2.4 Floodplain values
Floodplains provide a wide range of benefits to both human and natural systems. These functions and values can be broadly placed in three categories; water resources, living resources and societal resources, these are discussed further below.
Water resources
Floodplains provide for flood storage and conveyance during periods when flow exceeds channel boundaries. In their natural state they reduce flood velocities and peak flow rates by out of stream bank passage of stormwater through dense vegetation. They also promote sedimentation and filter contaminants from runoff. In addition, having a good shade cover for streams provides temperature moderation of stream flow. Maintaining natural floodplains will also promote infiltration and groundwater recharge, while increasing or maintaining the duration of stream base flow. Floodplains provide for the temporary storage of floodwaters. If floodplains are not protected, development will, through placement of structures and fill material in the floodplain, reduce the floodplain’s ability to store and convey stormwater when the need for floodplain storage occurs. This, in turn, increases flood elevations upstream of the filled area and increases the velocity of water travelling past the reduced flow area. Either of these conditions can cause safety problems or cause significant damage to private property.
Living resources
Natural floodplains are fertile and support a high rate of plant growth, which supports and maintains biological diversity. They provide breeding and feeding grounds for fish and wildlife. In addition, they provide habitat for rare and endangered species. Ground cover in natural wetlands tends to be composed of leaf and dense organic matter. Organic soils have a lower density and higher water holding capacity than do mineral soils. This is due to the high porosity of organic soils or the percentage of pore spaces. This porosity allows floodplain soils generally to store more water than mineral soils would in upland areas.
Societal resources
Floodplains provide areas for active and passive recreational use. They increase open space areas and provide aesthetic values. They also contain cultural and archaeological resources and provide opportunities for environmental and other studies. Human development historically has occurred around waterways for food and transportation. Many walkways exist in reserves and those walkways tend to be adjacent to stream channels. Where development drains into streams or rivers that have floodplains, the quantity of stormwater needs to be considered in the context of increasing peak flows.

Doc # 11854602 Page 35
Wetlands Wetlands, as defined in the Resource Management Act, include permanently or intermittently wet areas, shallow water and land water margins that support a natural ecosystem of plants and animals that are adapted to wet conditions. They occur on land-water margins, or on land that is temporarily or permanently wet. Wetlands are a major habitat for at least eight species of indigenous freshwater fish as well as frogs, birds and invertebrates. Wetlands have unique hydrological characteristics that can be irreversibly modified by activities such as drainage. There can be few other natural areas that have suffered so severely during human times than have wetlands. The reasons for this are many, however can be attributed largely to their position on flat land, suited to agriculture and to the generally low value that was given to such natural areas. These changes have occurred despite the value of wetlands as wildlife habitats, as regulators of flooding, their intrinsic values, for recreation and for scientific research. A far larger area of wetland than remains today has been lost through drainage, fire, top-dressing and flooding. Nationwide, freshwater wetlands covered at least 670,000 hectares before European settlement but have now been reduced by drainage for pasture to around 100,000 hectares. Although several thousand wetlands still survive, most are very small and have been modified by human activities and invasive species. It is likely that some characteristic wetland types have been lost completely, while very few examples are left of others, such as kahikatea swamp forest and some kinds of flax swamp.
Whangamarino Wetland (lower end)
New Zealand’s wetlands are as varied as the terrain that shapes them. It is important to recognise that even without the presence of humans, wetlands systems are modified and eliminated by a natural ecological ageing process referred to as succession. The filling and conversion of wetlands into more terrestrial type ecosystems occurs naturally at a relatively slow rate. The intervention of man into the process vastly accelerates this conversion process. In their natural condition, wetlands provide many important functions to man and the environment. Table 4-2 summarises the major functions and values of wetlands.

Page 36 Doc # 11854602
Table 4-2: Summary of wetland functions and values
Function/value Description Flood control Attenuation of peak flows
Storage of water Absorption by organic soils Infiltration to groundwater
Flow attenuation Maintenance of stream flow during droughts Erosion control Increased channel friction
Reduction in stream velocity Reduction in stream scour Channel stability by vegetative roots Dissipation of stream energy
Water quality maintenance Sedimentation Burial of contaminants in sediments Adsorption of contaminants to solids Uptake by plants Aerobic decomposition by bacteria Anaerobic decomposition by bacteria
Habitat for wildlife Food Shelter/protection from weather and predators Nursery area for early life stages
Fisheries habitat Galaxids, eels, freshwater mussels, crayfish Food chain support Food production from sun (primary production) Recreation/aesthetics Enjoyment of nature
Hiking, boating, bird watching Education Teaching, research
In addition to the listed beneficial values, the water quality benefits of wetlands can be expanded. Natural wetland systems have complex mechanisms and the following listing of benefits describes the major processes occurring in wetlands that allow them to provide water quality enhancement functions. These functions include:
Settling/burial in sediments
Uptake of contaminants in plant biomass
Filtration through vegetation
Adsorption onto organic material
Bacterial decomposition
Temperature benefits, and
Volatilisation. Before European settlement, freshwater wetlands covered 5% of the Waikato Region. Today the extent is only 1% coverage or an 80% reduction in the extent of wetlands in the region. Stormwater management systems that drain into wetlands should be designed for water quantity, quality and stream or river instability.

Doc # 11854602 Page 37
Ground There are three issues related to site development and associated stormwater management and interaction with ground:
Soil compaction
Contamination of soils, and
Migration of contaminants to groundwater.
4.4.1 Soil compaction
In rural areas, moderate soil compaction under pasture is widespread across the region. This decreases soil productivity and increases surface runoff. Excess stocking rates and/or mismanagement leads to trampling of soil, breaking up the soil structure and compressing spaces in the soil.26 Soil disturbance/compaction in urban areas occurs during construction cutting and filling operations, general grading operations and other processes of running heavy equipment over the soil. After construction, continued compaction can occur with site activities such as walking, sports and even parking heavy vehicles on grassed areas. Slow improvements in soil compaction may occur with time in relatively undisturbed areas by deep-rooted plants or by soil insects or other boring animals. Soil infiltration performance is normally significantly degraded compared to natural soil conditions and is commonly overlooked during hydrologic analyses and design. Knowing the likely effects of this soil compaction on urban hydrological conditions is critical for designing safe drainage systems. Soil compaction in the Waikato Region is an increasing problem.
4.4.2 Contamination of soils
Contamination of soils can occur as a result of past or present land use of a given site that could include:
Use of agricultural chemicals (particularly glasshouses, orchards, vineyards, market gardens)
Disposal of wastes
Accidental spillage or leakage of chemicals
Storage or transportation of raw materials, finished products or wastes, and
Migration of contaminants into a site from neighbouring land, either as vapour, leachate or movement of liquids through the soil.
Migration of contaminants to ground
26 Environment Waikato, 2008

Page 38 Doc # 11854602
Land where contaminants are present in the soil, sediment, groundwater or surface water could indicate a short or long-term risk to human health and the environment. Impacts on human health from contaminated soil can arise from ingestion of soils, consumption of vegetables from the site, uptake and subsequent bioaccumulation by plants and animals. Impacts on the environment can occur from a number of routes including direct uptake of contaminants by plants and animals, or migration of contaminants to ground or surface waters. Some contaminants such as copper or zinc are far more toxic to aquatic plants and animals than to humans.
4.4.3 Migration of contaminants to groundwater
Passage of water through the ground is part of the water cycle where water soaks into the ground and flows through it to an aquifer. It is mainly derived from rainfall that has soaked into the ground rather than runoff that travels over the ground surface. It can also be derived from water soaking into the ground from streams or lakebeds. Water that soaks into the ground moves down through soil pores or rock fractures until it hits the water table. The zone above the water table is known as the unsaturated zone. Below the water table, soil pores or rock fractures are fully saturated and the groundwater mainly moves laterally through these pores and fractures. A representation of groundwater movement is shown in Figure 4-1. Groundwater underlies most of New Zealand. Differences in geology, hydraulic properties of the soil or rock, topography, recharge rates and relationships with surface waters mean that groundwater flow and bore yields are greater in some areas than others.
Figure 4-1: Groundwater movement27
Principal concerns relating to groundwater are water quality and groundwater recharge. Poor stormwater runoff quality can contaminate groundwater and increased impervious surfaces can reduce groundwater recharge. While recharge of groundwater can be important, it is not recommended that infiltration devices accept untreated stormwater runoff for three reasons:
Potential clogging of the infiltration system
Potential migration of contaminants to groundwater, especially during accidental spills, and
27 Shaver et.al, 2007

Doc # 11854602 Page 39
The ground itself is a receiving system and contamination of soils needs to be prevented.
The Institute of Geological and Nuclear Sciences reported on groundwater quality in New Zealand and identified two major national-scale groundwater quality issues28:
Contamination with nitrate and/or microbial pathogens, especially in shallow wells in unconfined aquifers, and
Naturally elevated concentrations of iron, manganese, arsenic and/or ammonia, especially in deeper wells in confined aquifers.
The health-related guideline values for nitrate and indicator bacteria are exceeded at 5% and 20% of the monitoring sites for which indicator data were available, respectively. The primary concern when ground is the receiving environment is stormwater quality. Water quantity issues are only indirectly related in that storage of excess runoff needs to be provided if the runoff rate exceeds the rate of infiltration.
Karst geology The karst landscape of south-western Waikato (Maniapoto Karst) created through limestone dissolution, is one of the region’s iconic landforms. The caves, springs and other features associated with this landform are valued for their association with Ngati Maniapoto culture, unique natural heritage attributes, utility for recreation and tourism, and their role in supply of water. Despite their regional significance, our knowledge of the structure and functioning of karst aquatic ecosystems is limited and this may constrain effective management of aquatic ecosystems in karst landscape.29 Karst topography is characterised by subterranean limestone caves carved by groundwater. Karst landforms are generally the result of mildly acidic water acting on weakly soluble limestone bedrock. The mild acidic water begins to dissolve the surface along fractures or bedding planes in the limestone bedrock. Over time these fractures enlarge as the bedrock continues to dissolve. Openings in the rock increase in size and an underground drainage system develops, which allows more water to pass through the area and accelerating the formation of underground karst features. The mildly acidic water results from rain passing through the atmosphere picking up carbon dioxide, which dissolves in the water. Once the rain strikes the ground it may pass through soil having more carbon dioxide and forming a weak carbonic acid which dissolves calcium carbonate. Within karst landscapes there is clear evidence that alteration of vegetative communities of any sort can lead to substantial and potentially irreversible impacts on the karst processes operating in that area.30 Most dissolving of limestone happens just beneath the soil. This is where carbon dioxide is generated by soil microbes, so percolating water has its highest level of carbon dioxide. Some 90% of dissolving can occur in the top ten metres of the limestone outcrop. Environmental issues related to land alteration in karst terrains include:
Soils in karst terrains are moderately to poorly permeable, yet there is little surface runoff. Thus rainwater is diverted underground through sinkholes and/or by diffuse recharge through the overburden into numerous small fractures in the limestone.
Contaminants can pass rapidly through the subsurface system with little or no modification other than advective dissipation.
Long residence times, confined aquifers and lack of natural filtration create special needs regarding groundwater protection in karst.
28 Institute of Geological and Nuclear Sciences, 2007 29 Scarsbrook et al, 2008 30 Urich, 2002

Page 40 Doc # 11854602
Key elements to consider when planning to undertake development on karst terrains include:
Minimise site disturbance and changes to soil profile including cuts, fills, excavation and drainage alteration.
Retention ponds should only be used as a last resort after all other control options have been considered and rejected. In the rare instance they are employed they should serve small catchment areas (< 2 ha) and be located away from known karst features. If detention of water is a design requirement then the bottom and sides of the detention device must be impermeable so there is no soakage into the ground.
Where possible, runoff should be maintained as sheet flow to avoid it becoming concentrated with flows dispersed over the broadest area possible to avoid ponding, concentration or soil saturation.
Estuaries Estuaries are low energy, depositional zones where the sea meets streams and rivers. They tend to be semi-enclosed coastal bodies of water with one or more rivers or streams flowing into them and with a free connection to the sea. Estuaries are often associated with high rates of biological productivity.
From a New Zealand perspective, estuaries seethe with bacteria, mud worms, crabs, migrating fish, mangroves and oystercatchers. This system has evolved in the mud flats and is vulnerable to tide, erosion, contamination and other effects of human activity. An estuary is typically the tidal mouth of a river and they are often characterised by sedimentation from silts carried from terrestrial runoff. The water in estuaries is generally brackish. Estuaries are marine environments, where pH, salinity, and water level are varying, depending on the tributaries that feed them and the ocean that provides the salinity. There are various types of estuaries:
Salt wedge – in this situation the river output greatly exceeds the marine input and there is little mixing.
Highly stratified – river outputs and marine input are more even, with river flow still dominant. Turbulence induces more mixing of salt water upward.
Slightly stratified – river input is less than the marine input. Turbulence causes mixing of the whole water column.
Vertically mixed – river input is much less than marine input, such that the freshwater contribution is negligible.
Inverse estuary – these are located in areas with high evaporation and where there is no freshwater input.

Doc # 11854602 Page 41
Intermittent estuary – this type of estuary varies dramatically depending on freshwater input, and is capable of changing from a wholly marine embayment to another estuary type.
Due to estuaries being low energy environments and having a high salinity, they are depositional zones where sediments and contaminants become deposited. Estuaries are sinks where contaminants accumulate and concentration levels can be expected to increase. The Waikato Region has about 35 estuaries, making up over half of the region’s 1,150 km of coastal shoreline31. There are settlements near all of the major estuaries in the region. The region’s estuaries are important places, and have the following uses:
They are used for swimming, boating, fishing and shellfish gathering.
They provide locations for marinas and marine farms.
There are the feeding, spawning and nursery habitats for many fish, shellfish and birds.
One way of measuring the importance of estuaries is by estimating the value of the ecosystem services they provide, such as food production, recreation and habitat for plants and animals. Preliminary estimates indicate that the total value of ecosystem services provided by the region’s estuaries is about 20 times higher than forests and about 50 times higher than land used for farming or horticulture.32 In terms of stormwater management, neither peak flow nor stream erosion are considered concerns and the main issue is water quality. In addition, water quality may relate to a wide range of contaminants.
Harbours Harbours are primarily natural landforms where a body of water is protected and deep enough to furnish anchorage for ships. They differ from estuaries in that tidal action is greater and rates of deposition of sediments are less. Sedimentation does still occur and most harbours of the world require dredging to maintain shipping channels. The Region has a number of harbours including:
West Coast harbours – Whaingaroa (Raglan), Aotea and Kawhia and the mouths of the Mokau, Awakino, Marakopa and Waikato Rivers.
Coromandel Peninsula east coast harbours – such as Whangamata, Tairua, Whitianga and Whangapoua.
Coromandel Peninsula West Coast harbours – including Manaia, Te Kouma and Coromandel.
The Firth of Thames. From a stormwater management perspective, neither water quantity peak flows nor stream channel erosion are considered as issues needing to be addressed if harbours are the receiving system of concern. From a water quality perspective, harbours are not as sensitive as estuaries and streams from a contamination standpoint and implementation of stormwater management will probably relate to the magnitude of the project being proposed and the council requirements.
31 https://www.waikatoregion.govt.nz/Environment/Natural-resources/coast/Coastal-ecosystems/Estuaries/ 32 Patterson et al, 1998
Whangamata Harbour

Page 42 Doc # 11854602
Open coasts Open coasts are the line of demarcation between the land and the ocean. They are dynamic environments and go through constant change. Natural processes, particularly sea level rise, waves and various weather conditions have resulted in erosion, accretion and reshaping of coasts as well as flooding and creation of continental shelves and drowned river valleys. Coasts face many environmental challenges relating to human-induced impacts. The human influence on climate change is considered to be a major factor contributing to the accelerated trend in sea level rise. In addition, urban development of coastal land contributes to aesthetic problems and reduced natural coastal habitat. The region has approximately 1,150 km of open coast and shoreline including estuaries. Overall the quality of coastal water in the region is high. The open coasts are well-flushed and the permanent population of coastal towns is relatively small. Runoff from the land through rivers and catchments is the main source of contaminants flowing into coastal waters. Depending on littoral drift, the major concern on urban land use adjacent to open coasts would be litter control. When looking at impacts related to open coasts, a primary concern has been sewage contamination of beaches, which is not necessarily a stormwater related issue. Litter is a visible contaminant and can be addressed through a number of actions including routine clean up or maintenance.
Lakes A lake is a body of water that is contained in a body of land and, in the context used here, contains fresh water. Most lakes have an outfall but some do not. Lakes can be manmade or natural. Contamination of lakes can occur through a number of factors. The amount of nutrients entering a lake can cause eutrophication. This is caused by nutrient loadings stimulating excessive plant growth, which in turn decreases the amount of oxygen in the water and eventually causes fish and animal kills. Ecology of lakes is very different from that of streams due to standing water, temperature effects, and contaminant accumulation. The region has over 100 lakes that range in size from small ponds to the largest lake in New Zealand: Lake Taupo. Lake Taupo’s water quality is excellent but increasing nitrate levels in the bottom waters could lead to increases in algae, which can reduce water clarity. A study of shallow lakes in the region33 expresses concern regarding a trend of declining water quality in many of the shallow lakes. A key cause of decline in water quality is the increase in nutrients entering the lakes due to land use practices. This decline in water quality has been accompanied in many cases by a loss of indigenous biodiversity.
33 Jenkins et al, 2007
Whiritoa
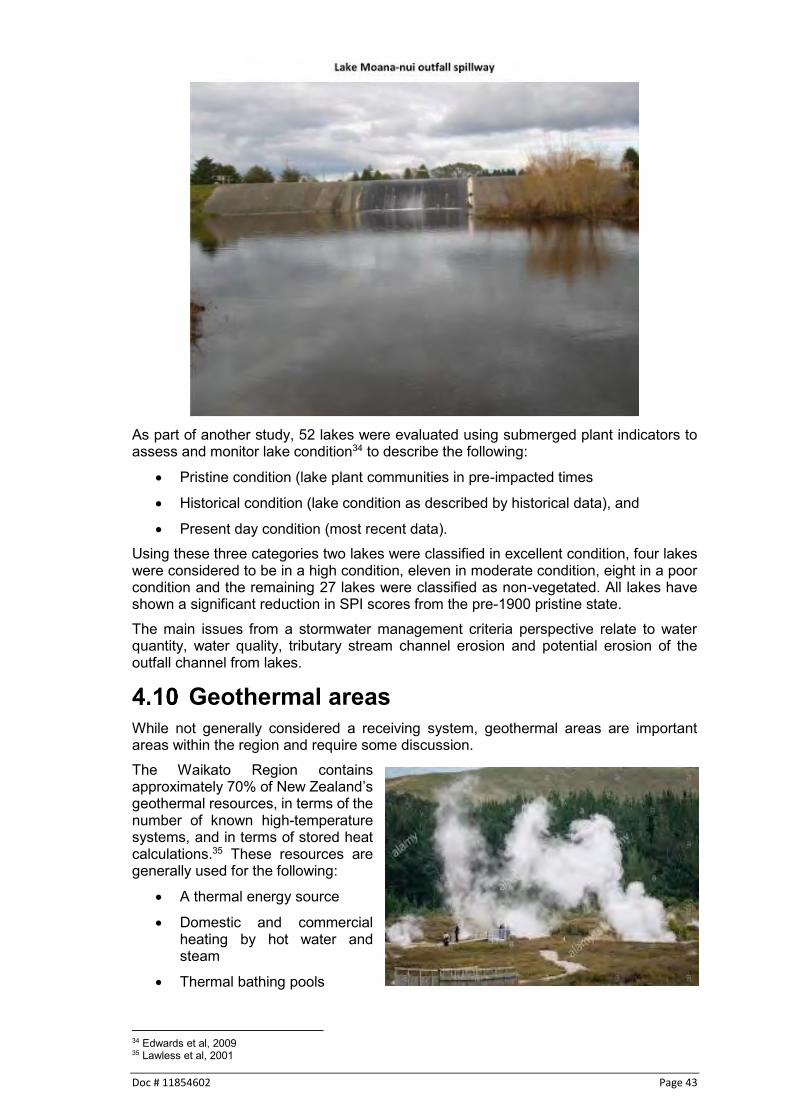
Doc # 11854602 Page 43
As part of another study, 52 lakes were evaluated using submerged plant indicators to assess and monitor lake condition34 to describe the following:
Pristine condition (lake plant communities in pre-impacted times
Historical condition (lake condition as described by historical data), and
Present day condition (most recent data). Using these three categories two lakes were classified in excellent condition, four lakes were considered to be in a high condition, eleven in moderate condition, eight in a poor condition and the remaining 27 lakes were classified as non-vegetated. All lakes have shown a significant reduction in SPI scores from the pre-1900 pristine state. The main issues from a stormwater management criteria perspective relate to water quantity, water quality, tributary stream channel erosion and potential erosion of the outfall channel from lakes.
Geothermal areas While not generally considered a receiving system, geothermal areas are important areas within the region and require some discussion. The Waikato Region contains approximately 70% of New Zealand’s geothermal resources, in terms of the number of known high-temperature systems, and in terms of stored heat calculations.35 These resources are generally used for the following:
A thermal energy source
Domestic and commercial heating by hot water and steam
Thermal bathing pools
34 Edwards et al, 2009 35 Lawless et al, 2001

Page 44 Doc # 11854602
Commercial hot water operations such as prawn farming, tourism, glasshouses and timber drying
The scientific study of geothermal features, processes and ecosystems
Tourist attractions, and
A source of micro-organisms for industrial processes. The primary adverse impact that has occurred on geothermal features is large-scale extraction of energy and fluid leading to the demise of geysers, and to large-scale increases in heat flow. There is no local documentation of urban stormwater as a contaminant of concern for geothermal areas but there is considerable documentation of the unique vegetation that occurs in geothermal areas and inappropriate urban development could have a significant adverse impact on the existing vegetation. A survey of existing geothermal areas36 has identified current threats, modification and vulnerability were evaluated. One threat is human disturbance and associated threats. These include:
Exploitation of geothermal fields for energy production,
Tourism and recreation – considerable damage can result from the construction of facilities such as tracks, roads and buildings.
Dumping of rubbish,
Pest plants,
Domestic livestock damage,
Plantation forestry and shelter belts,
Introduced pest animals,
Fire,
Genetic pollution,
Wetland infilling and drainage, and
Industrial/residential/roading development. The report recommends that thermal areas be protected from all of the threats listed above.
36 Wildland Consultants, 2011

Doc # 11854602 Page 45
Stormwater management and receiving environments To provide stormwater management context when considering receiving environments, Table 4-3 below summarises receiving environments and their respective stormwater issues. This table is meant as a general guide and does not substitute for regulatory requirements required by consenting authorities. Contact should be made with the appropriate territorial authority to ensure that any local requirements are complied with. Table 4-3: Receiving environments and stormwater issues
Receiving system Flooding issues Stream erosion issues
Water quality
Streams May be a priority depending on location within a catchment
High priority if the receiving stream is a natural, earth channel
High priority
Rivers Generally not an issue
Generally not an issue
High priority
Floodplains Peak flows need to be considered downstream of development
Channel stability needs to be considered
Not an issue
Wetlands High priority High priority High priority Ground Not an issue
depending on overflow
Not an issue High priority
Karst areas High priority Not an issue High priority Estuaries Not an issue Not an issue High priority Harbours Not an issue Not an issue Moderate priority Open coast Not an issue Not an issue Moderate priority Lakes Could be an issue if
increased stormwater runoff increases lake water levels, even temporarily.
Tributary and outlet channel stability needs to be considered
High priority
Geothermal areas Not an issue Not an issue Protecting existing land cover in areas adjacent to geothermal areas needs to be considered

Page 46 Doc # 11854602
5 Stormwater management concepts This guideline provides a framework for implementation of stormwater management strategies to manage the effects of stormwater runoff from urban land use in accordance with Waikato Regional Council’s regulatory framework. The objectives in the regulatory documents discussed in the previous section clearly require effective management of stormwater quantity and quality from developed areas (including industrial areas) to mitigate downstream adverse effects and stress the need to protect streams from erosion while promoting alternative methods for the treatment and disposal of stormwater. The Vision and Strategy requires the restoration and protection of the health and wellbeing of the Waikato River and the adoption of a precautionary approach to management of the natural, physical, cultural and historic resources of the Waikato River. The Vision and Strategy also requires the recognition and avoidance of adverse cumulative effects and potential cumulative effects, of activities undertaken both on the Waikato River and within its catchments on the health and wellbeing of the Waikato River. The Vision and Strategy requires a step change in how stormwater runoff is managed, and requires that development is undertaken in such a way as to restore and enhance the Waikato River and its tributaries. It is expected that similar requirements will be outlined for other major river catchments in the Waikato Region, including the Waihou and Piako River catchments. This guideline provides information on the selection and design of stormwater management devices to achieve these objectives. However, prevention is better than cure. To best achieve required stormwater management objectives, stormwater management systems will need to be integrated with the development and the natural landforms within the site and catchment to reduce the potential stormwater related effects. Existing gullies, streams and wetlands are to be protected and restored. Development proposals will need to demonstrate that all opportunities have been taken to avoid, remedy and mitigate potential adverse stormwater effects, and that all opportunities have been taken to protect and enhance the water bodies in the catchment. A low impact design approach is considered necessary to meet these requirements for site design and for catchment management planning.
Avoid, remedy or mitigate When considering the RMA, every person has a duty to avoid, remedy or mitigate any adverse effect on the environment arising from an activity. It is recognised that to avoid or remedy effects is much more cost-effective than to mitigate effects. Those three duties in relation to stormwater management can be defined as the following:
5.1.1 Avoid
This includes approaches and practices that prevent stormwater becoming contaminated in the first place. Examples include the following:
Use of building or safety materials or paints that do not leach contaminants
Picking an approach to development that has fewer adverse environmental effects
Reducing the amount of impervious surface that is constructed
Using new products that do not contain materials that, when wearing down, discharge contaminants, and
Maintaining, to the degree possible, natural systems to reduce stormwater runoff or to provide stormwater quantity and quality control through flow retardance.
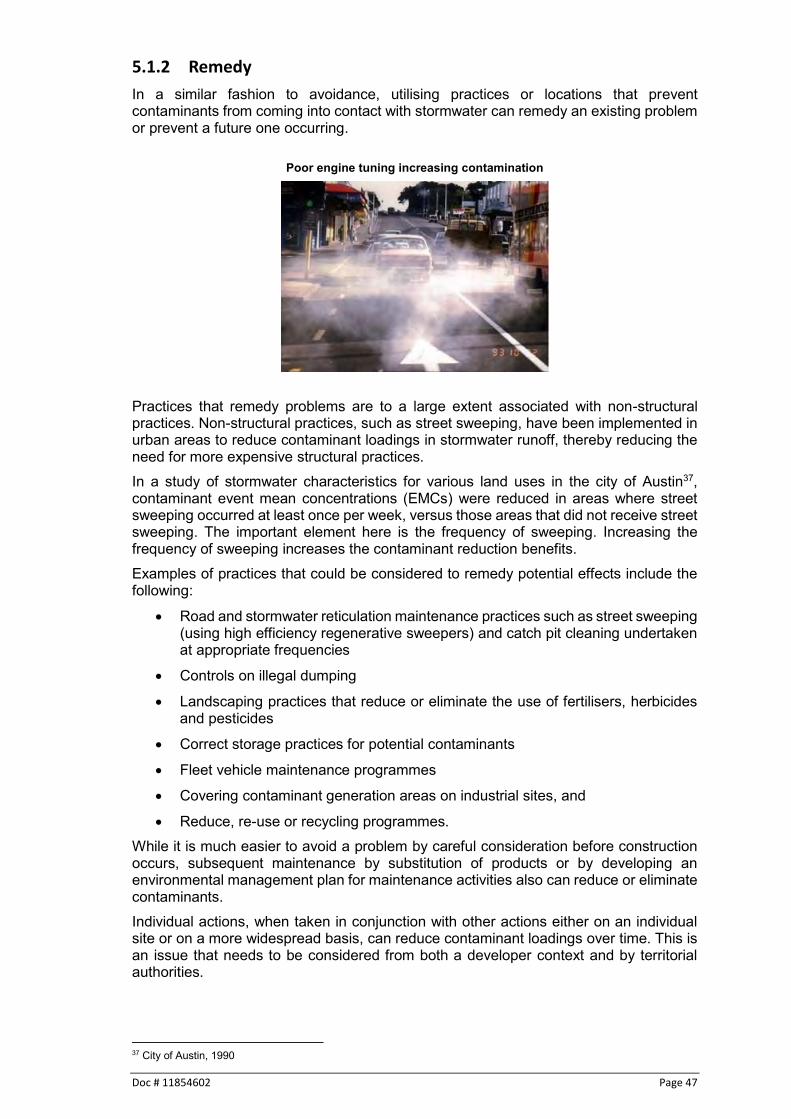
Doc # 11854602 Page 47
5.1.2 Remedy
In a similar fashion to avoidance, utilising practices or locations that prevent contaminants from coming into contact with stormwater can remedy an existing problem or prevent a future one occurring.
Poor engine tuning increasing contamination
Practices that remedy problems are to a large extent associated with non-structural practices. Non-structural practices, such as street sweeping, have been implemented in urban areas to reduce contaminant loadings in stormwater runoff, thereby reducing the need for more expensive structural practices. In a study of stormwater characteristics for various land uses in the city of Austin37, contaminant event mean concentrations (EMCs) were reduced in areas where street sweeping occurred at least once per week, versus those areas that did not receive street sweeping. The important element here is the frequency of sweeping. Increasing the frequency of sweeping increases the contaminant reduction benefits. Examples of practices that could be considered to remedy potential effects include the following:
Road and stormwater reticulation maintenance practices such as street sweeping (using high efficiency regenerative sweepers) and catch pit cleaning undertaken at appropriate frequencies
Controls on illegal dumping
Landscaping practices that reduce or eliminate the use of fertilisers, herbicides and pesticides
Correct storage practices for potential contaminants
Fleet vehicle maintenance programmes
Covering contaminant generation areas on industrial sites, and
Reduce, re-use or recycling programmes. While it is much easier to avoid a problem by careful consideration before construction occurs, subsequent maintenance by substitution of products or by developing an environmental management plan for maintenance activities also can reduce or eliminate contaminants. Individual actions, when taken in conjunction with other actions either on an individual site or on a more widespread basis, can reduce contaminant loadings over time. This is an issue that needs to be considered from both a developer context and by territorial authorities.
37 City of Austin, 1990

Page 48 Doc # 11854602
5.1.3 Mitigate
Mitigation has been the historical approach to reducing stormwater contaminants downstream. Mitigation involves the construction of stormwater treatment devices to reduce the quantity of stormwater and the level of contaminants in stormwater runoff. One purpose of this guideline is to provide design guidance for stormwater management approaches to mitigate potential stormwater effects. Any one approach, on its own, is unlikely to achieve the stormwater management objectives for a given project. For this reason, it is necessary to consider the objectives early in the design process when competing demands can be balanced and an integrated solution achieved. The need for, and size of, treatment devices is then minimised, as is their installation and maintenance costs. The combination of a number of different approaches or devices to achieve an overall stormwater objective is normally referred to as a “treatment train”, this is discussed further in Section 6.2.6. Stormwater management has traditionally been undertaken using mitigation approaches only, using stormwater devices at the bottom of the hill to mitigate effects. More recently low impact design principals are being adopted, with stormwater managed at at-source with stormwater practices incorporated into the built form, hence leading to smaller stormwater management devices being required as a final step to reduce potential downstream effects. Low impact design is discussed further below.
Low impact design Low impact design (LID) is based on the notion that environmental values can be less adversely impacted as new areas are developed throughout catchments if basic principles are followed. LID means understanding natural systems and making the commitment to work within the limits of these systems whenever and wherever possible. LID is based on the recognition that stormwater is ultimately a precious resource to be carefully managed, rather than a waste product in need of disposal. LID is one name that is used to refer to this approach to stormwater management. It is also referred to as Sustainable Urban Design Systems (SUDS), Water Sensitive Urban Design (WSUD), Low Impact Urban Design and Development (LIUDD) or Water Sensitive Design (WSD). The philosophical approach is the same for all of these concepts and the terms can almost be considered interchangeable. In this guideline the term LID is used. LID can be thought of in different ways. In this guideline, a broad distinction is made between those approaches that tend to manage stormwater largely through avoidance strategies versus those that are mitigative. An example of an avoidance approach would be reduction in impervious areas. In such cases, the generation of stormwater itself is avoided or minimised. This reduction in stormwater quantity generally translates into a reduction in stormwater related contaminant loading. It is not usually possible to avoid any increase in stormwater runoff from a proposed development, however the development and the associated stormwater management system should be designed to minimise runoff increases as much as possible. This would achieve both quantity and quality related management objectives more cost-effectively than other approaches to site development. Mitigative devices, on the other hand, are designed to manage stormwater after it has been generated. As such, mitigative devices generally have to collect and control stormwater, typically with some type of structure or even a series of structures. Mitigative devices are difficult to design to control both peak rates of discharge and volume increases, as well as to remove as many contaminants as possible. There are five basic principles associated with LID that are discussed below.

Doc # 11854602 Page 49
5.2.1 Achieve multiple objectives
Stormwater management should be comprehensive in scope, with management techniques designed to achieve multiple objectives, including peak flow and volume control, water quality treatment, temperature maintenance and enhancement of ecological and amenity values. Comprehensive stormwater management involves addressing all of these aspects of stormwater. Complicated site configurations with multiple structural techniques may be required in some situations but the design objective is to provide simple, cost effective solutions to complex problems.
5.2.2 Integrate stormwater design early in the process
Stormwater management, when it is provided, is often only considered at the end of the site design process. Because of this poor planning approach, site design almost always provides less than desirable outcomes. For stormwater management objectives to be achieved, stormwater must be incorporated into site design from the outset and integrated into conceptual site planning, just as traffic considerations are. Stormwater impacts may, in some situations, even be a factor in determining the type and extent of land use that is intended at a site. Site developers and designers need to consider incorporation of LID practices into the overall site design process and not engineer them after the site layout is fixed.
5.2.3 Avoid rather than mitigate
Approaches to site design, which can reduce stormwater generation from the outset, are the most effective approaches to stormwater management. For example, clustering houses significantly reduces lengths of roads when compared to a traditional low-density similar sized lot approach. Arrangement of units with minimal setbacks reduces driveway length. Reduction in street width and other street modifications can further subtract from total impervious cover. These important elements of site design are rarely thought of as a component of conventional stormwater systems, yet they achieve significant stormwater quantity and quality benefits. In the same regard, reducing total site disturbance reduces the total amount of work required by erosion and sediment control devices during site development. Less site disturbance means less generation of sediments, which results in a lower potential for downstream sedimentation in streams and estuaries. Allowing existing vegetation to remain on sensitive areas such as steep slopes, or upstream of wetlands will reduce adverse impacts to downstream resources. As recognition of downstream receiving water impacts has increased, the potential for mitigation requirements to address the sediment impacts becomes more likely. Reducing the potential for sediment delivery would correspondingly reduce mitigation requirements and associated costs. Mitigation devices will still be integral to site development in most cases. However avoiding stormwater impacts by careful site design to the extent possible will lessen the reliance on mitigation devices to reduce or eliminate adverse effects.
5.2.4 Manage stormwater at-source
From both an environmental and economic perspective, minimising the concentration of stormwater and its conveyance in pipes costs less money (by reducing pipe diameter or elimination of pipes) and helps to maintain natural hydrology. Pipes, culverts, and elaborate systems of inlets to collect and convey stormwater work against these management objectives and generally make stormwater management more difficult as such systems concentrate flows and increase flow rates, with a result of exacerbating erosive potential. A LID approach promotes the management of stormwater at-source as much as possible to lessen the quantity of stormwater to be managed and potential contamination effects.

Page 50 Doc # 11854602
This approach helps to reduce the reliance on mitigation devices to reduce or eliminate adverse effects downstream.
5.2.5 Rely on natural soil and plant processes
A LID approach incorporates the use of natural soil and plant processes to assist with managing the effects of stormwater. The soil mantle offers critical contaminant removal functions through physical processing (filtration), biological processing (microbial action), and chemical processing (cation exchange capacity and other chemical reactions). Plants similarly provide substantial contaminant uptake/removal potential, through physical filtering, biological uptake of nutrients and even various types of chemical interactions.
Approaches and techniques The items identified in the following sections should be considered on every site where development is intended. A narrative in a design report should reflect the consideration given and the reasons for acceptance or rejection of the item.
5.3.1 Low impact design approaches
LID approaches tend to be broader in scope than traditional stormwater management approaches as they involve the entire site. Site design/clustering is one broad approach. Reduction in imperviousness also transcends the more focused stormwater management device concept. The list of approaches includes:
Planning/zoning (building)
Clustering/lot configuration
Reduced imperviousness
Minimum site disturbance LID avoids the basic issue of how much of what type of land use is to occur at any particular site but rather considers what level of development is appropriate when considering land sensitivities (slope, floodplain, wetlands, bush, etc.). The emphasis is to define what we can do to improve stormwater management primarily on a site-by-site basis, assuming that development continues to occur. In those cases where conventional development programmes cannot use low impact design, density reduction is an option. Although development at the maximum allowable density has come to be the assumed norm in many cases, development at reduced densities may provide the economic use while balancing water and other ecological needs.
5.3.2 Low impact design devices
LID approaches tend, for the most part, to be preventive but this is not always true. Low impact approaches may include mitigative devices which are less damaging to receiving systems than traditional stormwater management devices. LID devices include an array of bioretention devices as well as vegetated filter strips and vegetated swales. Low impact mitigative devices can and should be used with the approaches detailed above and with one another. It is important to be aware that there are far greater options available, and yet to be developed, than have been used to date.
5.3.3 Clustering and alternative lot configuration
Stormwater management is optimised when stormwater objectives are integrated into site planning from the earliest stage. The process translates into concentrating or clustering development so that the most environmentally sensitive areas of the site are left undisturbed or are subject to minimal disturbance.

Doc # 11854602 Page 51
Example of clustering on a residential development
Clustering offers tremendous potential in terms of stormwater benefits and overall resource protection. While clustering is an important approach to site development it can also have greater benefits when considered at a catchment level. Although some density bonuses may be offered which increase density, clustering in a strict sense usually begins after the basic determination of how much of what type of land use (a certain number of single-family residences for example) is to be provided. In some cases, parcels may be combined to produce a broader development pattern, but a typical clustering design should reflect the existing pattern of ownership if it is to function properly. In some cases, the clustering concept may be structured to include different types of development, including single family and apartment concepts. As an LID approach, clustering is important. From a stormwater management perspective, clustering minimises stormwater runoff and contaminant loading generation from the outset and therefore is preventive in nature. To maximise positive stormwater effects, clustering works well when used in conjunction with other low impact design approaches and practices. In many cases, a tight clustering approach to site design facilitates the use of other approaches and practices. In order to achieve maximum benefit such as shown in Figure 5-1, substantial design flexibility must be maintained. In this figure the blue areas denote stormwater management areas. Clustering can be made to work effectively on a small site or a large one, but clearly the standards imposed on a 40-hectare site need to be different, possibly significantly different, than the standards imposed on a 4-hectare site. Clustering may involve lot design and arrangement only. Or clustering may transcend lot design and even involve changing types of residences. The challenge is to create a clustering system, which maximises clustering benefits such as open space preservation even as developer incentives are maximised as well.

Page 52 Doc # 11854602
Figure 5-1: Conventional site development versus an LID approach38 If clustering is not mandated, incentives may be provided to encourage its use. Many developers perceive clustered units on smaller lots as less valuable, so a density bonus provision is needed if the option is to be used (such as an increased number of lots). The clustering option may require additional consent processing requirements, which invariably requires more time, energy, and resources on the part of the developer. But this additional effort could result in significant cost savings during construction. In addition, clustering may well require that a variety of provisions elsewhere in development requirements be modified. Setback provisions may have to be amended, as can be the case for any number of other dimensional requirements predicated on conventional subdivision design. Required street frontage, setback of the structure from the street, side and even rear yard setbacks become very different for cluster development then for conventional development. Other important issues to keep in mind when considering clustering include:
Are meaningful open space requirements established? Do these open space requirements vary with site size, type of use allowed, etc.?
How is open space controlled and managed over the long term?
Have water supply and wastewater provisions been incorporated?
Have private property management systems been incorporated to the maximum extent feasible? Does the need for a private property management association discourage use of a clustering option?
Benefits achieved from clustering can be considerable and include the following:
Reduction in imperviousness
Reduction in contaminant loadings
Preservation of special values and sensitive features
38 Delaware Department of Natural Resources and Environmental Control, 1997

Doc # 11854602 Page 53
Habitat protection and associated wildlife benefits
Protection of aesthetic values
Passive recreation and open space maintenance, and
Reduction in costs, both development and operational. Although reduced imperviousness is dealt with separately, it is such an important benefit from clustering that it deserves special mention. Holding all other aspects of the development constant (number of units, types of units), clustering significantly reduces impervious coverage. Impervious reduction is achieved mostly through reduced road construction and reduced driveway lengths. Given the direct relationship between imperviousness and stormwater generation, impervious area reduction can be expected to result in a comparable reduction in stormwater generation, both total volume and rate. In addition to reducing site imperviousness, clustering also increases the potential to plant open spaces with native plants that may reduce future maintenance costs of grassed open spaces. Similarly increased open space may create recreation and amenity space.
Costs
Clustering significantly reduces costs through reduced land clearance, reduced road construction (including kerbing), reduced pathway construction, fewer street lights, less street tree planting, less landscaping, reduced sanitary sewer line and water line footage, reduced storm sewers, reduced sizing or need for stormwater management ponds, and other related infrastructure reductions. The costs of low impact design approaches is further discussed in Section 4.4 below.
Reduction in setbacks
The issue of minimum setbacks relates to low impact design in important ways. Standard building setbacks from roads are found in most territorial housing codes, and these requirements must undergo some change if clustering is advocated. While councils specify yard setbacks there are generally opportunities for these to be relaxed. Councils are required to take account of the New Zealand Building Code provisions for fire and other safety purposes. In residential areas, side yards may be one metre in circumstances where sufficient vehicle access is provided to beyond the rear point of each dwelling or where a garage or carport is provided for. The Code allows for some discretion for further encroachments if the building has achieved a satisfactory fire rating. Minimum separation distances of 1340 mm are required between buildings except where there is a common wall. Again, flexibility may exist and further encroachments may be allowed if Fire and Egress Officers are satisfied and the appropriate consent is obtained.
5.3.4 Reduce imperviousness
Imperviousness is an essential factor to consider in stormwater management, both from a quality and quantity standpoint. Site-by-site and catchment-by-catchment, increased impervious cover means increased stormwater generation with increased contaminant loadings as well. Consequently, actions that can be taken that reduce impervious cover become important stormwater management strategies. A variety of specific strategies to reduce imperviousness are described here. In many cases, planning for new street systems is often based on a hierarchical system where the function and use of the particular road can be linked to width and other characteristics relating to imperviousness. These low impact design approaches, in many cases, can stand-alone and be used development-by-development, although reduction in imperviousness also can be used with other approaches and practices. Many councils have limitations on levels of imperviousness that can occur on residential developments but some see practical difficulties in monitoring/enforcement of such limits as individual property owners add impermeable structures after the building consent was issued.

Page 54 Doc # 11854602
A major variable in considering imperviousness is the consideration of transportation, which includes roads, kerbing, parking and footpaths.
Roads
Numerous demands are made on the road/road reserve resource. District Plan roading provisions have to reflect public demands for safe and efficient movement of pedestrians, cyclists, motor vehicles and for on street parking opportunities. Other utility services such as water, electric, sewage and stormwater disposal and telephone have traditionally been placed within the road reserve. In all territorial authority areas, minimum street widths have been established which may be excessive and which may not reflect functional needs now or in the future. As an example, having a minimum road paving width of 7.5 metres for “first order streets” may be excessive since these streets may serve low numbers of residences. This width is costly to construct, requires expensive real estate, and creates far more stormwater than otherwise would be necessary. Because of the way in which so much development is configured, these streets are often just networks of cul-de-sacs specifically designed to exclude through traffic. In most cases such streets will not receive significantly increased traffic as an area develops. Consequently, traffic levels will never increase much beyond the traffic generated by the 15 or 20 houses lining the street.
Street width reduction offers considerable potential benefit in terms of stormwater reduction. For the very smallest access street or lane with fewer than 100 vehicle trips per day, decrease street width to five metres and gradually increase road width correspondingly with traffic increases. In conventional developments with conventional lots and house design, there is no need to provide on street parking, although if tightly clustered configurations are used, on street parking may be a desirable option and included in the design. Road lengths are also an important issue. Road length should first be addressed at the District Plan, Structure Plan, Neighbourhood Unit Plan level. Obviously overall dense patterns of development result in less road construction than do low density patterns, holding the number of units constant. High-density development and vertical development contrast sharply with the low density sprawl which has proliferated in recent years and which has required vast new highway systems in the urban fringe areas. Furthermore, the issue of concentration of development through increased density, while holding total amount of development constant, plays itself out at less macro levels of planning as well. As mentioned in the clustering discussion, road length is significantly reduced as tighter clustering occurs site-by-site. It is important to downsize streets, both their length and width, wherever possible. Reasons for not encouraging reduction in road widths include: insufficient parking, insufficient room for passing parked cars, people drive on road verges, people try to drive both ways down one-way streets and the need for emergency or refuse vehicle access.

Doc # 11854602 Page 55
Developments with narrower streets are perceived to be inferior if they reflect less than the minimum requirements. All of these possible reasons can be addressed through the development process to minimise any potential future problems.
Kerbing
The requirement for kerbing has a significant impact on stormwater flows. Kerbing immediately concentrates stormwater flows along the kerb and necessitates enclosed reticulation systems to convey the concentrated flow downstream. The end destination for these conveyance systems is either a stormwater device or a discharge directly into a receiving system. Kerbing is routinely required as a component of site development with little flexibility provided. The provision of road drainage is generally engineering driven. Codes of practice tend to automatically assume the need for an enclosed system requiring road stormwater discharge to be managed.
It is not the intention here to advocate elimination of kerbing in all cases but rather to allow flexibility for where that option may be viable. There are other alternatives if kerbing is considered as essential in a development, such as using kerb cuts to maintain dispersed flow, which would then travel into a vegetated swale or across a buffer strip or into heavily vegetated areas. The key point is that flexibility is necessary to allow for stormwater management options.
Turnarounds
Imperviousness can be limited in turnarounds as well. Large diameter circles at the ends of low-density cul-de-sacs simply make no sense and create much more impervious area than is necessary. Figure 5-2 indicates turnaround options, culminating in the “T” turnaround, which has the least level of imperviousness and is appropriate for low-density cul-de-sacs where traffic flows are low. Individual levels of imperviousness are shown in the turnaround options having the dimensions shown in the figure. As can be seen the “T” turnaround option has imperviousness less than 50% of the next smallest option.

Page 56 Doc # 11854602
Figure 5-2: Turnaround options 39
Parking
Many different aspects of parking relate to stormwater problems, including parking ratio requirements as well as the design of parking spaces and their dimensions. A discussion of parking as related to stormwater management links into larger planning issues quite quickly. But there are also low impact approaches to parking requirements that can minimise parking related imperviousness even where more conventional development modes are utilised. The trend in parking ratios in recent years has been to increase these ratios, perhaps reflective of the general increase in land development and traffic associated congestion and the concern of councils to err on the conservative side. In some cases (primarily in commercial areas) minimum parking ratios are even exceeded by developers. Councils typically establish minimum parking ratios, but rarely specify maximum parking ratios. It should be noted that adjustment of ratios must be undertaken with care. Office parks, for example, are experiencing increasing employment intensities. As companies grow, more employees are hired; ratios of employees per square metre increase; cars increase and so does the need for increased parking spaces. In terms of parking space design standards, this can be a significant contributor of overall site imperviousness. A standard dimension parking space can be 2.6-by-5 metres having a typical kerb overhang. When including the appropriate share of the parking aisle and the share of the common parking area, that impervious space can total over 30 square metres which is over twice as much as the actual parking area itself, as illustrated in Figure 5-3 below. Reduction in the 25% shared area or reducing the number of parking spaces can provide a significant reduction in overall site imperviousness. Larger cars having a reduced turning radius are increasing the problem of parking lot sizing increases.
39 Shaver, 2000
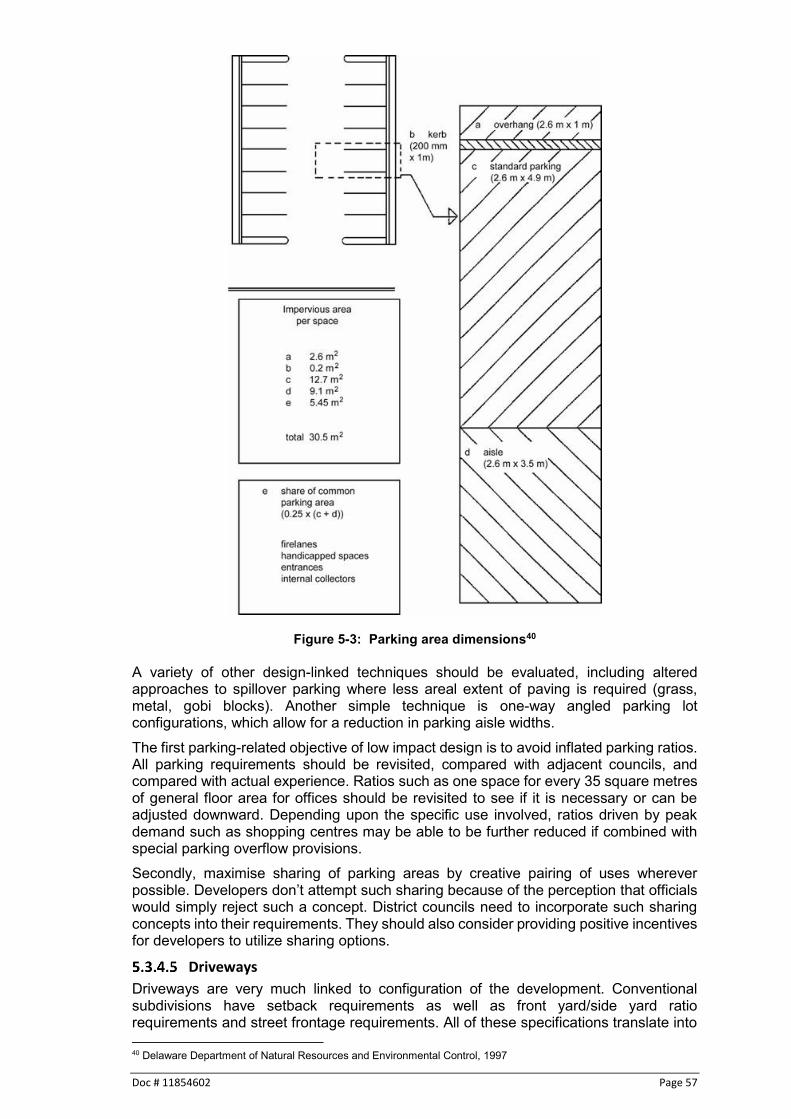
Doc # 11854602 Page 57
Figure 5-3: Parking area dimensions40
A variety of other design-linked techniques should be evaluated, including altered approaches to spillover parking where less areal extent of paving is required (grass, metal, gobi blocks). Another simple technique is one-way angled parking lot configurations, which allow for a reduction in parking aisle widths. The first parking-related objective of low impact design is to avoid inflated parking ratios. All parking requirements should be revisited, compared with adjacent councils, and compared with actual experience. Ratios such as one space for every 35 square metres of general floor area for offices should be revisited to see if it is necessary or can be adjusted downward. Depending upon the specific use involved, ratios driven by peak demand such as shopping centres may be able to be further reduced if combined with special parking overflow provisions. Secondly, maximise sharing of parking areas by creative pairing of uses wherever possible. Developers don’t attempt such sharing because of the perception that officials would simply reject such a concept. District councils need to incorporate such sharing concepts into their requirements. They should also consider providing positive incentives for developers to utilize sharing options.
Driveways
Driveways are very much linked to configuration of the development. Conventional subdivisions have setback requirements as well as front yard/side yard ratio requirements and street frontage requirements. All of these specifications translate into 40 Delaware Department of Natural Resources and Environmental Control, 1997

Page 58 Doc # 11854602
a development mode, which is very familiar and commonplace. Driveway length clearly must be at least equal to the house setback, plus required right-of-way. In addition, as lot sizes become large, setback requirements tend to be well exceeded. Houses often sit considerable distances from the street and driveways become long. As houses have grown larger, car per house ratios have increased with larger and wider driveways again required. A standard four metre wide driveway will fan out into a two or three car garage. There may be additional paving required for out of garage parking. Although reduced density of development on any one site may give the appearance of some improved environmental benefit, the larger site imperviousness expands quickly and any benefit is impacted negatively resulting in more stormwater problems. Solutions to driveway imperviousness would include reducing their length by locating the house closer to the road; using concrete strips rather than a continuous slab of concrete, or using metal strips as a substitute for concrete entirely. The metal will have a degree of compaction and still have surface runoff but the rougher surface will reduce flow velocities and will require a larger storm to initiate surface runoff than would a concrete driveway.
Twin concrete strip driveway reducing driveway imperviousness
Footpaths
Footpaths are an important element in community design and can also be a significant contributor of imperviousness generally being approximately 1.4 metres wide. Although many low-density developments may not need footpaths, they are generally required. Where they are required it is possible to use more permeable materials or reduce the footpath width and provide less imperviousness to reduce the onset of stormwater runoff.
Dual pathway on one side of a street (in Auckland), increasing site imperviousness
5.3.5 Minimise site disturbance
Minimum site disturbance is an approach to site development where clearing of vegetation and disturbance of soil is carefully limited to a prescribed distance from
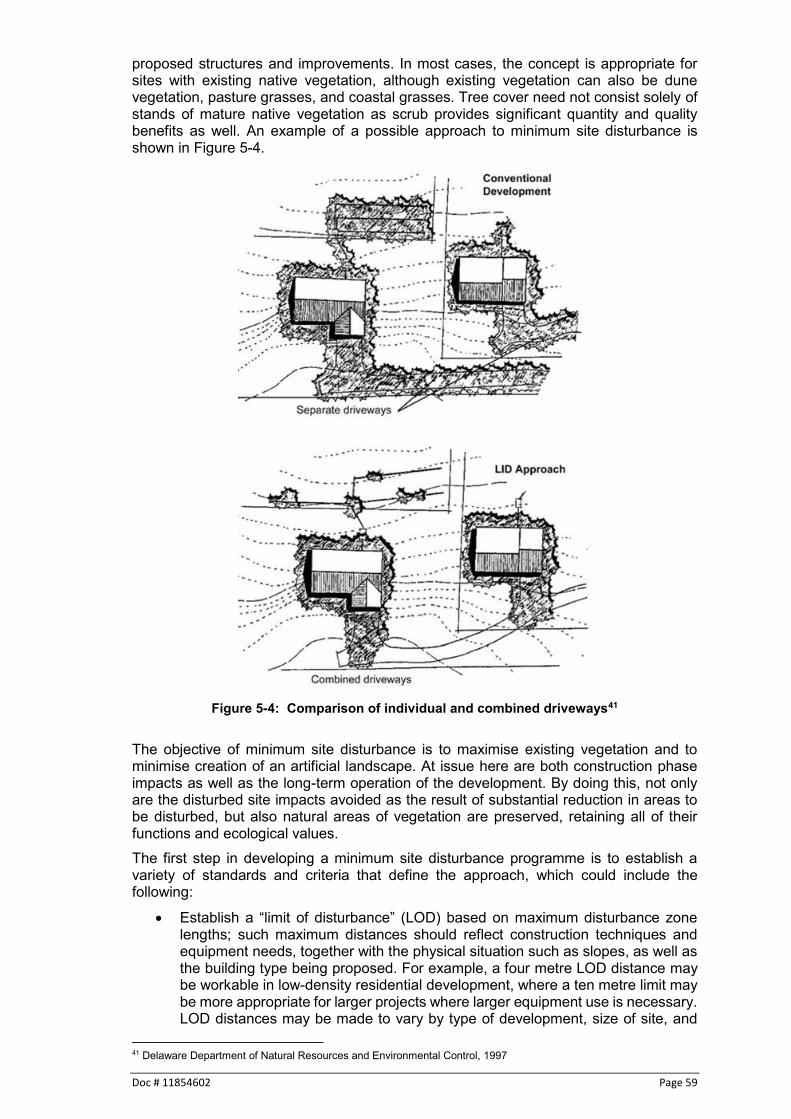
Doc # 11854602 Page 59
proposed structures and improvements. In most cases, the concept is appropriate for sites with existing native vegetation, although existing vegetation can also be dune vegetation, pasture grasses, and coastal grasses. Tree cover need not consist solely of stands of mature native vegetation as scrub provides significant quantity and quality benefits as well. An example of a possible approach to minimum site disturbance is shown in Figure 5-4.
Figure 5-4: Comparison of individual and combined driveways41
The objective of minimum site disturbance is to maximise existing vegetation and to minimise creation of an artificial landscape. At issue here are both construction phase impacts as well as the long-term operation of the development. By doing this, not only are the disturbed site impacts avoided as the result of substantial reduction in areas to be disturbed, but also natural areas of vegetation are preserved, retaining all of their functions and ecological values. The first step in developing a minimum site disturbance programme is to establish a variety of standards and criteria that define the approach, which could include the following:
Establish a “limit of disturbance” (LOD) based on maximum disturbance zone lengths; such maximum distances should reflect construction techniques and equipment needs, together with the physical situation such as slopes, as well as the building type being proposed. For example, a four metre LOD distance may be workable in low-density residential development, where a ten metre limit may be more appropriate for larger projects where larger equipment use is necessary. LOD distances may be made to vary by type of development, size of site, and
41 Delaware Department of Natural Resources and Environmental Control, 1997

Page 60 Doc # 11854602
specific development features involved. A special exception procedure should be provided to allow for those circumstances with unusual constraints.
Integrate minimum site disturbance requirements fully into the project review process. Procedurally, the LOD should be established early on in the reviewing process.
Require the LOD to be staked out in the field for contractor recognition. In addition, site disturbance can be minimised by locating buildings and roads along existing contours, orienting the major axis of buildings parallel to existing contours, staggering floor levels to adjust to grade changes, allowing for steeper cuts and grades provided that proper stabilisation and erosion and sediment controls are in place, and designing structures including garages to fit into the terrain, lot by lot.
Cost of low impact design approach In 2009, the former Auckland Regional Council commissioned a literature review to consider the capital costs of low impact design development versus conventional development. A number of developments in New Zealand and internationally were used to compare relative costs between conventional development and LID approaches to site development. The findings of this review are provided in the Auckland Council Technical Report 12009/04542. The costs of a development depend on an effective, thoughtful design approach but a key outcome is that LID can provide for a more desirable community that incorporates additional amenities and open space, and one that reduces impacts to natural systems generally with no additional construction costs. Table 5-1 is an excerpt from the Auckland Council study and provides calculated capital costs for a variety of LID development in New Zealand and the United States. Table 5-1: Comparison of capital costs between conventional and LID site development
Project Country where
Implemented
Conventional Development
Costs ($)
LID Cost ($) Cost Differential
($)
Percent Difference
(%) Heron Point New Zealand 1,844,000 1,590,000 254,000 14 Palm Heights New Zealand 7,218,000 5,936,000 1,282,000 18 Wainoni Downs
New Zealand 5,963,000 4,478,000 1,485,000 25
Chapel Run U.S.A. 2,460,200 888,735 1,571,465 64 Buckingham Green
U.S.A. 541,400 199,692 341,708 63
Tharp Knoll U.S.A. 561,650 339,715 221,935 39 Pleasant Hill Farm
U.S.A. 1,284,100 728,035 556,085 43
Gap Creek U.S.A. 4,620,600 3,942,100 678,500 15 Auburn Hills U.S.A. 2,360,385 1,598,989 761,396 32
The percent difference column shows that for all case studies, the LID approach was less costly in terms of capital costs. The primary reason for the reduced cost is the effect that clustering has on reducing impervious surfaces and reducing the amount of earth working that needs to be undertaken during site development. There are a number of research papers and studies that compare the lifecycle costs of LID stormwater devices to traditional end of pipe stormwater management devices. The Water New Zealand Stormwater Conference paper entitled ‘Understanding and determining the cost of long term maintenance and resilience of WSD’43 provides a good
42 Shaver, 2009 43 Ira et al, 2016

Doc # 11854602 Page 61
summary. This paper states that in general, it has been found that LID devices incur greater costs over their life cycle than traditional end of pipe devices, however the following observations are made:
Many studies from the UK and USA, as well as some New Zealand theoretical case studies44 show a clear saving of total acquisition costs for LID developments over traditional developments when considering the whole development cost, rather than focusing only on the costs of stormwater management devices.
The savings in total acquisition costs generally relates to the “avoided costs” of reduced site earthworking, preparation, concreting, and reduced piping rather than the costs of the stormwater management devices themselves.
There is little on the ground data available regarding maintenance costs in New Zealand for stormwater management devices, this needs to be the focus of further research.
LID systems are generally more resilient as the risk of device failure is spread across multiple devices rather than one device at the end of the pipe.
LID approaches are multifunctional (practices provide for more than one function and are intertwined or combined. For example, a park providing stormwater management, amenity values and sport and recreation function).
Overall it is considered that a low impact design approach achieves improved multi-benefit outcomes for a reduced overall capital cost and similar life cycle costs when compared to conventional development approaches.
Stormwater treatment processes Stormwater treatment devices attempt a difficult task; the removal of contaminants entrained in stormwater flows. Significant proportions of contaminants dissolve in stormwater and many others are attached to fine particles of silt and clay, which do not easily settle. Processes that reduce contaminant levels include the following:
Sedimentation
Aerobic and anaerobic decomposition
Filtration and adsorption to filter material
Biological uptake
Biofiltration
Flocculation These processes are discussed individually in the following subsections.
5.5.1 Sedimentation
Most stormwater management programmes in New Zealand and internationally started initially with an intention to mitigate the effects of excess sedimentation into streams and estuaries. The logic was that capture of sediment, while being beneficial, would also provide capture of other contaminants attached to the sediments. The following tables and figure provide discussion of sediment particle size, contaminants associated with various sized particles, fall velocities for various sediment particle sizes and lastly a representation of how particle size determines whether they can be removed by sedimentation. The first table, Table 5-2 provides a listing of various particle classes and their sizes.
44 Auckland Regional Council, 2000

Page 62 Doc # 11854602
Table 5-2: Particle characteristics45 Size Class
Millimetres Microns 64 - 32 Very coarse gravel 32 - 16 Coarse gravel 16 - 8 Medium gravel 8 - 4 Fine gravel 4 - 2 Very fine gravel
2 -1 2,000 - 1000 Very coarse sand
1 - 0.5 1,000 - 500 Coarse sand 0.5 - 0.25 500 - 250 Medium sand
0.25 - 0.125 250 - 125 Fine sand 0.125 - 0.062 125 - 62 Very fine sand
62 - 31 Coarse silt 31 - 16 Medium silt 16 - 8 Fine silt 8 - 4 Very fine silt 4 - 2 Coarse clay 2 - 1 Medium clay 1 - 0.5 Fine clay 0.5 - 0.24 Very fine clay
Sediment coarser than medium silt settles rapidly, but much longer settling times are required for finer particles to settle. Particles less than 10 µm tend not to settle discretely according to Stokes Law, but exhibit flocculent settling characteristics. Particle shape, density, water viscosity, electrostatic forces, and flow characteristics affect settling rates. Stokes Law Vs = 2/9(r2g(pp – pf)/ή) Where: Vs = settling velocity (m/s) R = particle radius (m) G = standard gravity (m/s) pp = particle density (kg/m3) pf = fluid density (kg/m3) ή = fluid viscosity (pascal-second (pa-s)) Table 5-3 discusses particle size and contaminants associated with them in general stormwater runoff.
Table 5-3: Metals distribution and particle sizes46 Particle Size (µm)
Metals Distribution (%) Cd Co Cr Cu Mn Ni Pb Zn
<10 46 60 71 63 71 63 73 60 10 – 100 36 31 24 30 21 29 23 35 >100 18 9 5 7 8 8 4 5
As can be seen, significant portions of the contaminant loads attach to finer sediments. There is variation of the above table by various researchers and better information should
45 Chow, 1964 46 Ding et al, 1999

Doc # 11854602 Page 63
be obtained before definitive statements are made. The important point is the trend, which indicates that metals tend to be associated with fine sediments. Table 5-4 shows particle settling velocities based on Auckland data and includes the proportion of particles in each size category.
Table 5-4: Particle size versus settling velocity47 Particle
Diameter (µm) Proportion of Particles (%)
Cumulative Proportion (%)
Particle Density (kg/m3)
Settling Velocity
(m/h) 3 5 5 1100 0.002 6 8 13 1300 0.021
10 5 18 1600 0.118 15 6 24 1900 0.397 20 5 29 1900 0.706 25 4 33 1900 1.102 30 3 36 2150 2.028 50 12 48 2300 6.366 75 19 67 2500 16.524 100 12 79 2650 32.31 150 15 94 2650 67.732 200 5 99 2650 94.086 300 1 100 2650 149.517
Actual settling velocities in the field are often significantly lower than the theoretical values, especially for finer particles. This can be due to turbulence but can also be due to a reduction in settling velocities that occurs the more particles are present. The greater the concentration of suspended sediments, the less the settling velocity can be. Measurements of reductions in settling velocities of 50% and greater have been recorded in high sediment laden water when compared to the same soil particle sizes in clear water. This is not a major factor in permanent stormwater devices but would be a consideration for sediment control ponds. Figure 5-5 shows sediment particle diameter with the ability to remove various particle sizes with sedimentation.
Figure 5-5: Particle size and general classification48 As can be seen from the above tables and figure, the ability to use sedimentation as a means of contaminant reduction is limited to larger particle sizes. Depending on the
47 Semadeni-Davis, 2006 48 Minton. 2002

Page 64 Doc # 11854602
contaminants of concern, removal of suspended solids by sedimentation alone may not remove the contaminants of greatest concern. It is important to identify the contaminants of greatest concern in order to determine what processes can remove a given contaminant.
Removal of nutrients by sedimentation is not very effective as nitrogen tends to be in a soluble form while phosphorus may be dissolved or attached to sediments. Sedimentation can remove moderate levels of phosphorus but have negligible effect on nitrogen.
5.5.2 Aerobic and anaerobic decomposition
Another process by which contaminants are removed is by microorganisms reducing soluble biological oxygen demand (BOD) and breaking down nutrients and organic compounds by aerobic and anaerobic decomposition. The primary device that uses aerobic and anaerobic decomposition is wetlands. Once the aerobic microorganisms have taken up contaminants they die and settle to the bottom of ponds where further anaerobic oxidation may take place. In anaerobic conditions, microorganisms can remove nitrogen by de-nitrification. This is an important process in constructed wetland function. Figure 5-6 below shows a simplified wetland nitrogen cycle.
Figure 5-6: Wetland process for denitrification49 This process is important when considering areas where nutrient enrichment of receiving systems (primarily lakes) is a problem. Denitrification is a reduction process where electrons are added to nitrate or nitrite nitrogen, resulting in the production of nitrogen gas, nitrous oxide (N2O) or nitric oxide (NO). This can only occur when dissolved or free nitrogen is absent. In other words there has to be an anaerobic layer at the bottom of the wetland for denitrification to occur. Anaerobic processes are an important mechanism for nitrogen removal. Nutrient removal in wetlands is not only due to uptake by flourishing plant growth, but also to physical processes such as the adsorption of nutrients to sediments, precipitation and sedimentation. Plants and sediments are the major accumulators of nutrients in wetlands. Some nutrients such as nitrogen compounds may be converted to nitrogen gas and return to the atmosphere due to the creation of an anaerobic environment. Periodic harvesting of 49 Kadlac et al, 1996
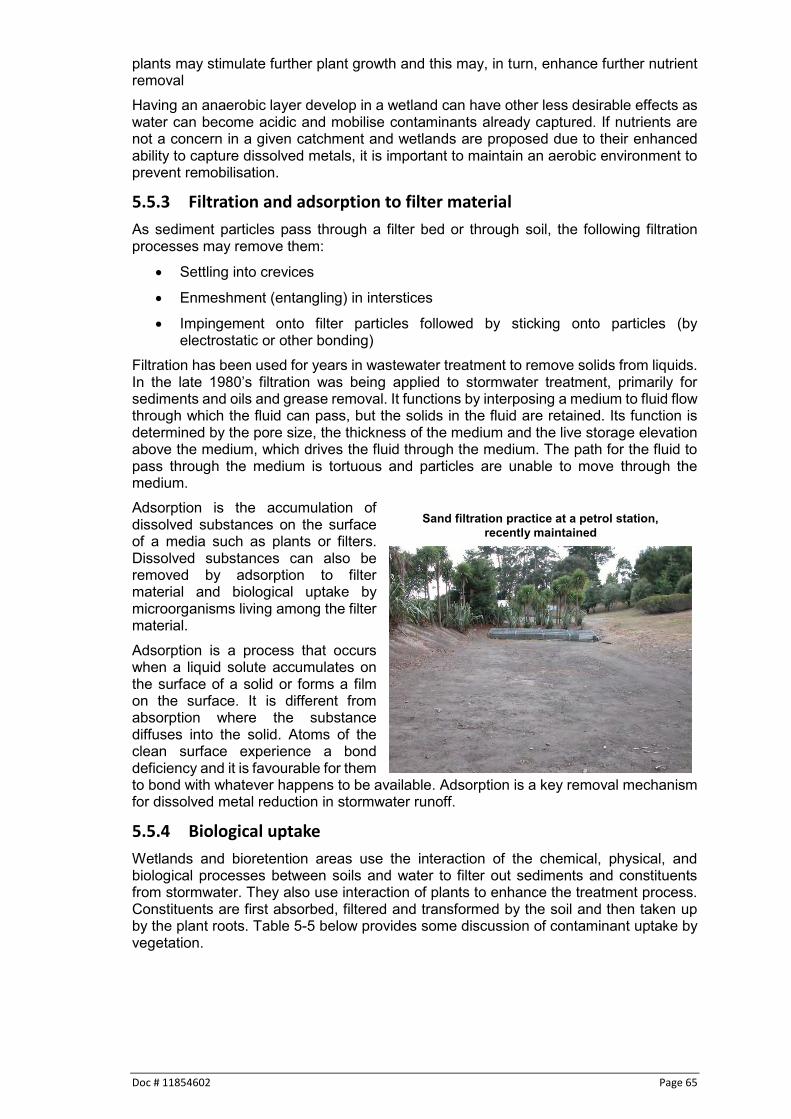
Doc # 11854602 Page 65
plants may stimulate further plant growth and this may, in turn, enhance further nutrient removal Having an anaerobic layer develop in a wetland can have other less desirable effects as water can become acidic and mobilise contaminants already captured. If nutrients are not a concern in a given catchment and wetlands are proposed due to their enhanced ability to capture dissolved metals, it is important to maintain an aerobic environment to prevent remobilisation.
5.5.3 Filtration and adsorption to filter material
As sediment particles pass through a filter bed or through soil, the following filtration processes may remove them:
Settling into crevices
Enmeshment (entangling) in interstices
Impingement onto filter particles followed by sticking onto particles (by electrostatic or other bonding)
Filtration has been used for years in wastewater treatment to remove solids from liquids. In the late 1980’s filtration was being applied to stormwater treatment, primarily for sediments and oils and grease removal. It functions by interposing a medium to fluid flow through which the fluid can pass, but the solids in the fluid are retained. Its function is determined by the pore size, the thickness of the medium and the live storage elevation above the medium, which drives the fluid through the medium. The path for the fluid to pass through the medium is tortuous and particles are unable to move through the medium. Adsorption is the accumulation of dissolved substances on the surface of a media such as plants or filters. Dissolved substances can also be removed by adsorption to filter material and biological uptake by microorganisms living among the filter material. Adsorption is a process that occurs when a liquid solute accumulates on the surface of a solid or forms a film on the surface. It is different from absorption where the substance diffuses into the solid. Atoms of the clean surface experience a bond deficiency and it is favourable for them to bond with whatever happens to be available. Adsorption is a key removal mechanism for dissolved metal reduction in stormwater runoff.
5.5.4 Biological uptake
Wetlands and bioretention areas use the interaction of the chemical, physical, and biological processes between soils and water to filter out sediments and constituents from stormwater. They also use interaction of plants to enhance the treatment process. Constituents are first absorbed, filtered and transformed by the soil and then taken up by the plant roots. Table 5-5 below provides some discussion of contaminant uptake by vegetation.
Sand filtration practice at a petrol station, recently maintained

Page 66 Doc # 11854602
Table 5-5: Ability of biota to uptake contaminants50 Nitrogen Nitrogen reduction by plants is extremely complicated and depends on the
form of nitrogen, pH, growing season, climate, etc. Most of the information available relates to performance of wetland plants with little information on nitrogen uptake by biofiltration systems. Organic nitrogen compounds are a significant fraction of the dry weight of plants.
Phosphorus Plants require phosphorus for growth and incorporate it in their tissue. The most rapid uptake is by microbiota (bacteria, fungi, algae, etc.) because they grow and multiply at high rates. Phosphorus is a nutrient and its addition stimulates growth.
Metals Metals reach plants via their fine root structure, and most are intercepted there. Some small amounts may find their way to stems, leaves and rhizomes. Upon root death, some fraction of the metal content may be permanently buried, but there is no data on metal release during root decomposition.
Plants do take up nutrients or metals from stormwater via absorption processes. However they may also re-release them to the water column when they die and decay. An example of this is a swale that is periodically mowed. Unless the grass cuttings are physically removed from the catchment, they will eventually decompose and the contaminants (primarily nutrients) will again be available for transport downstream. Biological uptake is a less important process in swales, filter strips and rain gardens than it is in wetlands where, for nutrients, it can be an important process as discussed in Section 4.4.2 above.
5.5.5 Biofiltration
A variation to the filtration mechanism is to use plants as the filter media. Biofiltration is a contaminant control technique using living material to capture and biologically degrade and process contaminants. Contaminants adhere to plant surfaces or are absorbed into vegetation. This mechanism is a combination of filtering, reduced settling time and adhesion. An example of biofiltration is a swale or rain garden where the combination of soils and vegetation provide natural biofiltration. Rain gardens operate by filtering runoff through a soil media prior to discharge into a drainage system. The major contaminant removal pathways are51:
Event processes - Sedimentation in the
extended detention storage, primary sediments and metals,
- Filtration by the filter media, fine sediments and colloidal particles, and - Nutrient uptake by biofilms.
Inter-event processes - Nutrient adsorption and contaminant decomposition by soil bacteria, and - Adsorption of metals and nutrients by filter particles.
50 Kadlac et al, 1996 51 Somes et al, 2007
Rain garden servicing a bus depot

Doc # 11854602 Page 67
The major issues with performance of bioretention as a contaminant reduction device is maintenance of low flow velocities and hydraulic loading during storms too large to permit sedimentation of silts and clays, even with dense vegetation.52
5.5.6 Flocculation
Flocculation is a process whereby particles join together following the addition of a reagent to form ‘flocs’, which join together forming larger, heavier particles that settle more rapidly. Flocculation has been in use in New Zealand for a number of years for erosion and sediment control ponds to improve performance at removal of clay particles. Potential reagents that can be used to encourage flocculation include polyacrylamide, alum and polyaluminium chloride (PAC).
Summary This section has discussed an alternative approach to site development that has significant stormwater benefits to the conventional site development approach. Throughout this guideline there will be emphasis on taking a low impact design approach to site development that incorporates:
1. The use of building materials that do not increase contaminant discharge downstream.
2. Source control via alternative approaches to site development that reduce the generation of stormwater runoff at-source.
3. Use of natural drainage systems such as swales or filter strips to the degree that they can be incorporated.
4. The use of stormwater devices to provide an overlay to the first three items, as needed.
In addition, the various processes that provide stormwater treatment options have been presented so that a variety of approaches can be considered on a site-by-site basis depending on stormwater related issues. It is expected that stormwater designers will consider the various approaches to design and not just go with the approach that maximises site development potential. More detail will be provided in later sections on specific criteria that enable the implementation of the approaches listed above.
52 Mazer et a, 2001

Page 68 Doc # 11854602
Part II: Stormwater design approach, device design and sample design calculations

Doc # 11854602 Page 69
6 Choosing a stormwater management approach There are two aspects to selection of a stormwater management approach for a given site:
Regulatory and design requirements, and
Individual device suitability. Both of these aspects are discussed in the following sections.
Regulatory and design requirements The Regional Policy Statement states that the regional council promotes low impact options while the Regional Plan provides flexibility for the pursuit of low impact design as a component of an urban stormwater discharge strategy. As such, the key element of these guidelines is to provide a framework that facilitates the transition of traditional development to one that provides greater protection of aquatic resources whilst still facilitating development.
6.1.1 Design responsibility
Design for stormwater management shall be undertaken by individuals with the appropriate technical background and experience in stormwater management to undertake the design. This will generally be a stormwater engineer with more than five years of experience.
6.1.2 Information requirements
The following information must be investigated and incorporated into development design to the degree possible in a design report that accompanies the consent application.
1. General context information: a) The surrounding land context (rural, urban, vegetation, etc.) b) The site location within a catchment c) Site size d) Structure plan, district plan, catchment consent requirements
2. Ancillary benefits considered: a) Urban design elements b) Crime prevention through environmental design c) Energy efficiency d) Ecology e) Landscape amenity
3. Site natural features: a) Wetlands b) Streams (including ephemeral streams) c) Floodplains d) Gullies e) Riparian buffers f) Existing site vegetative cover g) Soils h) Depth to groundwater i) Slopes - highlighting steep ones (greater than 33%) j) Other natural site features k) Cultural or archaeological features
4. Receiving environment factors considered: a) Tidewater or coastal discharge points? b) Downstream flooding problems

Page 70 Doc # 11854602
c) Recognised downstream sensitive areas d) Site streams including ephemeral streams e) Ground conditions if site is to drain to ground
5. Hydrological factors: a) Route taken by stormwater runoff from the source to the receiving
environment b) Erosion potential of drainage path c) Potential steps to reduce overall stormwater runoff volume d) Revegetation potential to reduce stormwater runoff e) Connection of impervious surfaces to receiving systems
6. Stormwater issues related to the receiving environments from Table 4-3. 7. Building programme considerations:
a) Public sewer availability b) Public water availability c) Total number of site units – can the areal extent be reduced d) Type of units e) Lot density flexibility f) Individual lot flexibility
8. Lot configuration consideration: a) Potential for lot size reduction b) Potential for clustering c) Natural features protection potential
9. Impervious surface reduction considerations: a) Potential for road lengths and widths to be reduced b) Potential for driveway lengths and widths to be reduced c) Potential for shared driveways or parking spaces d) Potential for parking ratios and parking sizes to be reduced e) Potential for cul-de-sacs and roundabouts to reduce imperviousness f) Potential to reduce kerbing or provide kerb cuts
10. Site disturbance minimisation: a) Site disturbance footprint and potential to reduce disturbed area b) Important natural, cultural or archaeological features to be protected c) Potential to maximise open space d) Structure design compatibility with site features e) Revegetation potential
11. Design calculations: a) Have curve numbers or ‘c’ factors been reduced as much as possible? b) Has runoff volume been reduced as much as possible? c) Has pre-development time of concentration been maintained?
12. Mitigation alternatives: a) Integration of stormwater management into overall site plan b) Prevention minimisation prior to mitigation c) Have vegetative stormwater management practices been used to the
degree possible? d) Can unpreventable impacts be mitigated through conventional
stormwater management practices? 13. Long term operational considerations:
a) Has responsibility for maintenance been assigned and accepted? b) Have whole of life costs been incorporated into stormwater management
approach?

Doc # 11854602 Page 71
6.1.3 Low impact design scoring approach
Information contained in the report shall also include a low impact design scoring matrix for which the summation provides an overall score of the design. The scoring is based on Table 6-1 below. Table 6-1: Low impact design scoring matrix
Implementation elements
Typical components Maximum Individual score
Total score for each item
Source control maximised
Water re-use 0-4 depending on % of runoff capture
Site disturbance reduced from a conventional development approach
0-3 depending on % of runoff capture
Impervious surfaces reduced from a traditional approach
0-3 depending on % of runoff capture
Use of building or site materials that do not contaminate
0 or 1 for residential 0-3 for commercial or industrial
Existing streams and gullies located on site (including ephemeral) are protected and enhanced. The entire stream other than possible crossings shall be protected to qualify for points.
0 or 3
Riparian corridors are protected, enhanced or created
0-3
Protection and future preservation of existing native bush areas
0-2 depending on percentage of site area
LID stormwater device/practice used
Infiltration devices to reduce runoff volume
0-6 depending on % of runoff capture
Revegetation of open space areas as bush
0-3 depending on % of site covered
Bioretention 0-6 depending on % of runoff capture
Swales and filter strips 0-3 depending on % of runoff capture
Tree pits 0-6 depending on % of runoff capture
Traditional mitigation Constructed wetlands 0-4 depending on % of
runoff capture
Wet ponds 0-1 depending on % of runoff capture
Innovative devices 0-1 depending on % of runoff capture
Detention ponds (normally dry)
0
Urban design Stormwater management is designed to be an integral and well considered part of the urban design.
0–2
Total score

Page 72 Doc # 11854602
The scoring matrix outlined above relates to stormwater management and focusses on encouraging LID in particular. This doesn't replace the need to consider other values including cultural, social, environmental and economic. It is noted that Items such as streams or riparian corridors that do not exist on site would score 0. Once the total score is calculated, the minimum score in terms of acceptability is 15. Scores lower than that will have to justify rejection for those items not incorporated. At least 6 points are required for source control and 6 points required for LID devices individually. If a specific site does not have existing streams or gullies, riparian corridors or existing native bush the total acceptable score for source control can be reduced to 4 points, which would reduce the acceptable total for site development to 13 points. As stated in Section 1 the Waikato Regional Council uses a Best Practicable Option (BPO) approach for assessing the adequacy of technical design for discharge consents. As such, being unable or unwilling to meet the thresholds indicated above does not automatically mean the consent application will be declined. If an applicant chooses to use another approach to site development then an analysis should accompany the application to demonstrate that similar outcomes are achieved when compared to if a low impact design approach was taken. Highway projects are different from normal development projects and the ability to provide source control is limited. As a result highway projects must still consider LID and traditional mitigation devices and must achieve a total score of at least 8.
Scoring matrix values
It is important to provide a consistent approach to selecting values for each category component. The following subsections provide scoring values for each component so that the values selected are not arbitrary. Source control
1. Water re-use Flow detention only is 1 point. Site use for garden watering is 2 points. Site use for garden watering and for non-potable inside waters uses
including laundry and toilets is 3 points. Site use for full water supply is 4 points
2. Site disturbance reduced from a conventional development approach 10 % reduction from a conventional development is 2 points. 20% and greater reduction from conventional development is 3 points
3. Impervious surfaces reduced from a conventional development approach 5% reduction is 2 points. 10% reduction is 3 points.
4. Use of building or site materials that do not contaminate Residential roofs, gutters, down spouts made of non-contaminant
leaching materials is 1 point. Commercial roof, gutters, down spouts made of non-contaminant
leaching materials is 3 points. 5. Existing streams and gullies (including ephemeral streams) are protected and
enhanced Preservation and protection of natural streams and gullies is 3 points.
6. Riparian corridors are protected, enhanced or created Riparian corridor protection scores depend on the width of corridor
provided. 5 metres on either side of the stream is 1 point, 10 metres is 2 points and greater than 10 metres is 3 points.
7. Protection and future preservation of existing native bush areas Protection, preservation and, if needed, enhancement of native bush
areas that exceed 10% of the site is given 2 points.
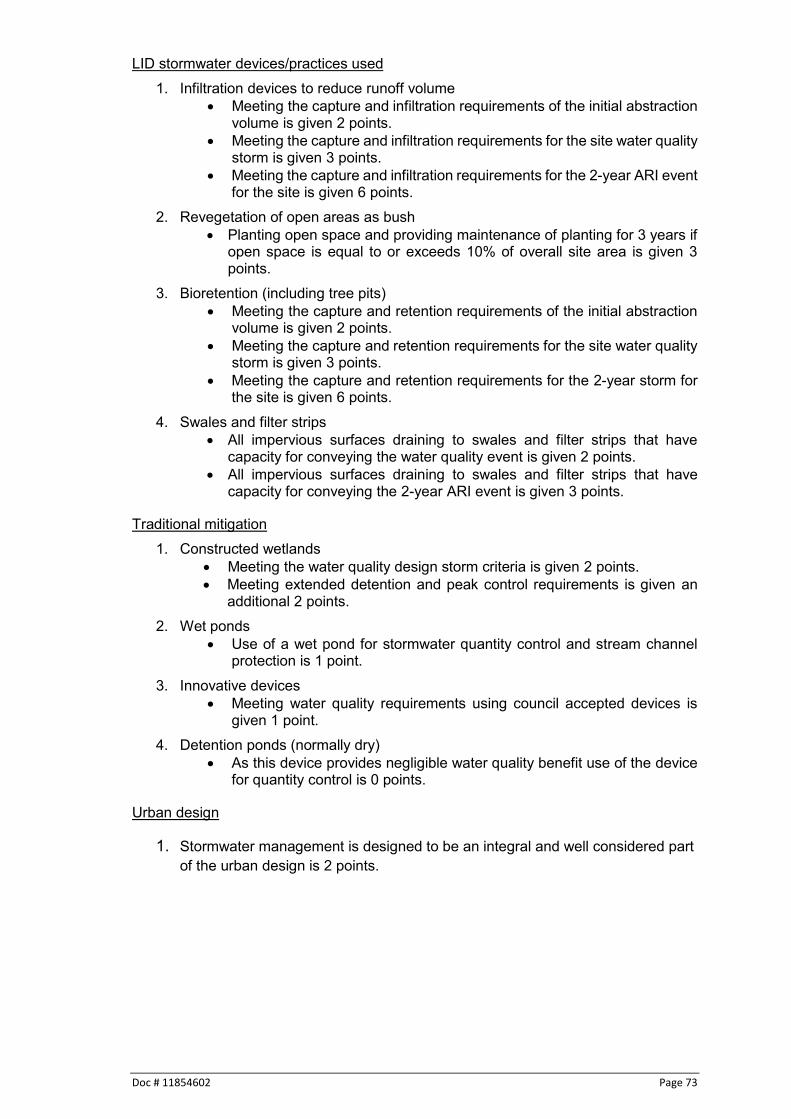
Doc # 11854602 Page 73
LID stormwater devices/practices used 1. Infiltration devices to reduce runoff volume
Meeting the capture and infiltration requirements of the initial abstraction volume is given 2 points.
Meeting the capture and infiltration requirements for the site water quality storm is given 3 points.
Meeting the capture and infiltration requirements for the 2-year ARI event for the site is given 6 points.
2. Revegetation of open areas as bush Planting open space and providing maintenance of planting for 3 years if
open space is equal to or exceeds 10% of overall site area is given 3 points.
3. Bioretention (including tree pits) Meeting the capture and retention requirements of the initial abstraction
volume is given 2 points. Meeting the capture and retention requirements for the site water quality
storm is given 3 points. Meeting the capture and retention requirements for the 2-year storm for
the site is given 6 points. 4. Swales and filter strips
All impervious surfaces draining to swales and filter strips that have capacity for conveying the water quality event is given 2 points.
All impervious surfaces draining to swales and filter strips that have capacity for conveying the 2-year ARI event is given 3 points.
Traditional mitigation 1. Constructed wetlands
Meeting the water quality design storm criteria is given 2 points. Meeting extended detention and peak control requirements is given an
additional 2 points. 2. Wet ponds
Use of a wet pond for stormwater quantity control and stream channel protection is 1 point.
3. Innovative devices Meeting water quality requirements using council accepted devices is
given 1 point. 4. Detention ponds (normally dry)
As this device provides negligible water quality benefit use of the device for quantity control is 0 points.
Urban design
1. Stormwater management is designed to be an integral and well considered part of the urban design is 2 points.
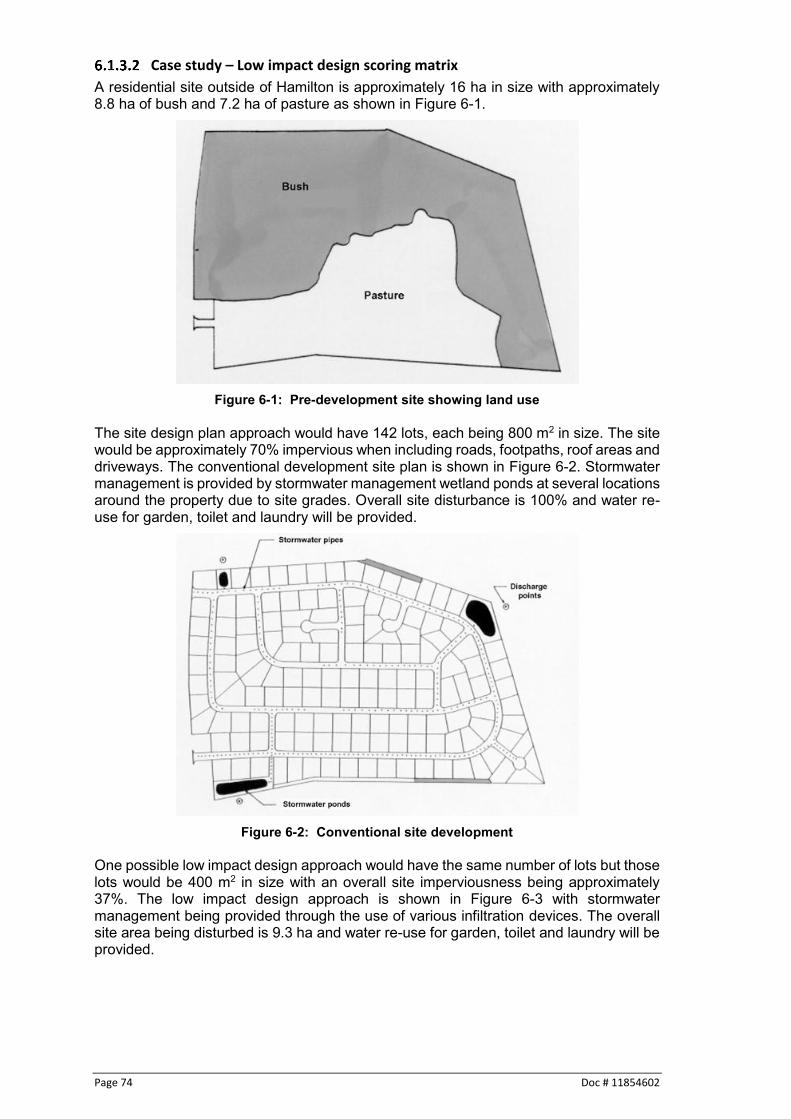
Page 74 Doc # 11854602
Case study – Low impact design scoring matrix
A residential site outside of Hamilton is approximately 16 ha in size with approximately 8.8 ha of bush and 7.2 ha of pasture as shown in Figure 6-1.
Figure 6-1: Pre-development site showing land use
The site design plan approach would have 142 lots, each being 800 m2 in size. The site would be approximately 70% impervious when including roads, footpaths, roof areas and driveways. The conventional development site plan is shown in Figure 6-2. Stormwater management is provided by stormwater management wetland ponds at several locations around the property due to site grades. Overall site disturbance is 100% and water re-use for garden, toilet and laundry will be provided.
Figure 6-2: Conventional site development
One possible low impact design approach would have the same number of lots but those lots would be 400 m2 in size with an overall site imperviousness being approximately 37%. The low impact design approach is shown in Figure 6-3 with stormwater management being provided through the use of various infiltration devices. The overall site area being disturbed is 9.3 ha and water re-use for garden, toilet and laundry will be provided.

Doc # 11854602 Page 75
Figure 6-3: Low impact design approach
Using the scoring matrix to determine the number of points that the redesign receives gives the following:
1. Water re-use – conventional receives 2 points and LID approach also receives 2 points.
2. Site disturbance reduced from a conventional approach – conventional receives 0 points and LID approach receives 3 points for over 40% reduction in site disturbance.
3. Impervious surface reduction – conventional approach has 11.2 ha of impervious surface while LID approach has 5.92 ha of impervious surface or almost a 50% reduction so the LID approach receives 3 points.
4. Building or site materials – both sites would probably receive 1 point. 5. Existing streams or gully protection – there are no streams or gullies so no points
can be obtained. 6. Protection of native bush – approximately 8 ha of native bush is preserved, which
is roughly 50% of the site so the LID approach receives 2 points. 7. Infiltration devices to reduce runoff volume – conventional development relies on
reticulation while LID approach controls storms up to and including the 2-year storm and the LID approach receives 6 points.
8. Revegetation – neither site uses revegetation. 9. Bioretention – neither site uses bioretention. 10. Swales and filter strips – the LID approach uses swales and filter strips to
transport runoff to the infiltration devices so the LID approach is given 3 points. 11. Constructed wetlands – conventional approach may use wetlands for their three
ponds so it would receive 4 points for peak flow control and water quality design. LID approach does not need to use ponds so no points are earned.
12. Wet ponds – since wetlands are the preferred approach for the conventional approach no points are earned for using wet ponds.
13. Innovative devices – none used for either approach so no points given. 14. Detention ponds – none used for either approach.
Total points given:
Conventional approach is given 7 points.
LID approach is given 20 points

Page 76 Doc # 11854602
The LID approach exceeds the minimum required points (15) by having 20 points. The conventional approach only receives 7 points so modifying the design should be undertaken to increase the number of points that can be given. While the actual example may be considered extreme from an LID perspective, it shows that development can be accomplished while using LID approaches. The LID example exceeded the minimum requirements fairly easily and also exceeded the percentage minimums in every situation. Projects could have less drastic redesign and still meet the required minimum score. The major point is that the approach to development must evolve if aquatic and terrestrial resources are to be protected and enhanced.
Individual device suitability Stormwater management devices normally provide water quantity control, water quality control or sometimes both. It is important to recognise that stormwater management devices do not perform equally in all situations. A device using infiltration of runoff as the method of choice is not going to function in soils with limited permeability rates. In the same regard, a device such as a stormwater management pond may be good at removal of suspended solids but provide little benefit for dissolved metals reduction. It is important to recognise the potential effectiveness of different stormwater devices on the contaminants generated at a specific site and for a given receiving environment. Consideration must be given to contaminants of concern and stormwater management devices appropriate to remove those contaminants.
6.2.1 Site considerations
The success of any management approach depends on selecting the appropriate options for the sites control objectives and conditions at an early stage. The objectives must be defined at the outset and site conditions investigated in enough detail to match the approach to the site to meet the objectives. Decisions need to be made as to whether quantity control, quality control or ecosystem protection or enhancement are required and which contaminants need to be treated and how. Deciding whether a stormwater management device is relevant means looking at the following issues:
Soils in the location of the intended stormwater management device
Slopes
Catchment area draining to individual devices, and
General constraints. The following sections discuss each of these items in more detail.
Soils
Underlying soils are very important to determine whether a given stormwater management device will function as intended. More permeable soils can enhance the operation of some devices, but adversely affect the performance of others. As an example, a constructed wetland may not retain water if the underlying soils are highly permeable, and hence would need to be lined to maintain minimum water levels and the heath of wetland plants in this circumstance. On the other hand infiltration devices rely on passage of water through the soil profile, and more permeable soils transmit greater volumes of water. Having poor permeability in subsoils would preclude the use of infiltration for a given area. From a general context, the following Table 6-2 provides a discussion of various soils and their approximate infiltration rate and the red line indicates the minimum rate for using infiltration.

Doc # 11854602 Page 77
Table 6-2: Infiltration rate for various soil textural classes Texture Class Approximate Infiltration
Rate in mm/hour Sand 210 Loamy sand 61 Sandy loam 26 Loam 13 Silt loam 7 Sandy clay loam 4.5 Clay loam 2.5 Silty clay loam 1.5 Sandy clay 1.3 Silty clay 1.0 Clay 0.5
The location of the red line in the table indicates a normal minimum permeability limit for when infiltration devices are suitable for a given site. If the infiltration tests indicate an infiltration rate of less than 7 mm/hour then infiltration is not normally considered appropriate due to the silty nature of the soils. Table 6-3 provides a view of devices and their suitability for various soil textures.
Table 6-3: Soil and suitability of various stormwater management devices Ponds/ Wetlands
Sand Filters Rain Gardens Infiltration Swales/Filter strips
Sand Loam Silty Clay Clay Blue colour denotes acceptable device range related to soil types
There may be confusion over what a loam soil is. Loam is soil that is composed of sand, silt and clay in relatively even concentration (approximately 40-40-20% respectively). Loam soil contains the right amount of sand, silt, clay and organic material. It is known as a “garden soil” that is good for plants. They generally contain more nutrients than do sandy soils. Silty loam is generally considered as the soil having the minimum permeability rates for use of infiltration. Loamy soil is also commonly recommended for use in rain gardens.
Slopes
Slope is important when selecting a stormwater management device. Steeper slopes may:
Eliminate some devices from consideration, or
Require devices to be modified from a more desired approach. Stormwater management devices that rely on storage of water have slope limitations as adequate storage may necessitate significant cut and fill to meet storage requirements. Figure 6-4 below shows how slope steepness impacts storage ability of a pond. The same analogy applies to filter systems that have a live storage requirement.

Page 78 Doc # 11854602
Figure 6-4: Slope versus available storage53
Other devices, such as vegetated swales may be adapted for steeper slopes if the swales are placed along the contours, rather than up or down slopes. The ability to manipulate direction of swales is limited and slope may well determine whether swales or filter strips can be used on a given project. Swales and filter strips are normally limited to approximately a 5% slope to ensure that adequate residence time is provided for significant contaminant reduction and to ensure that flow velocities do not cause erosion. The following Table 6-4 provides some discussion of stormwater management device and their limitations related to slope.
Table 6-4: Slope limitations of various stormwater management devices Practice Slope Limitation
Ponds/ Wetlands
As the slope increases the amount of cuts and/or fills increases. Ponds generally are not suitable on slopes > 10%.
Sand Filters Sand filters can either be pre-fabricated units or constructed in place. For prefabricated units, generally live storage can be provided within the unit so slope is not a critical issue. For open systems, the slope problems are similar to ponds or rain gardens.
Rain Gardens Similarly to ponds, live storage is a problem on steeper slopes. The surface of the rain garden has to be level to ensure an even flow through the media.
Infiltration Infiltration devices are not recommended on steeper slopes or on fill slopes. There is a potential for slope instability with seepage coming out on the slope below the device or for lateral flow to occur at the natural ground/fill interface. Infiltration should only be used when a geotechnical engineer certifies it as an appropriate use.
Swales/Filter strips
Not suitable for slopes > 5% unless check dams flatten overall slope
Catchment area
Catchment area is another key element that determines the suitability of a stormwater management device at a specific site. Some devices, due to treatment or hydrological factors are more appropriate to smaller or larger catchment areas. Devices that rely on vegetative or filter media filtering of runoff are more appropriate for smaller catchment areas, as large flows may overwhelm their ability to filter the runoff. Ponds, on the other hand, are more appropriate for larger catchment areas.54 The following Table 6-5 provides guidance for stormwater management devices and associated catchment areas.
53 Auckland Regional Council, 2003 54 ARC, 2003
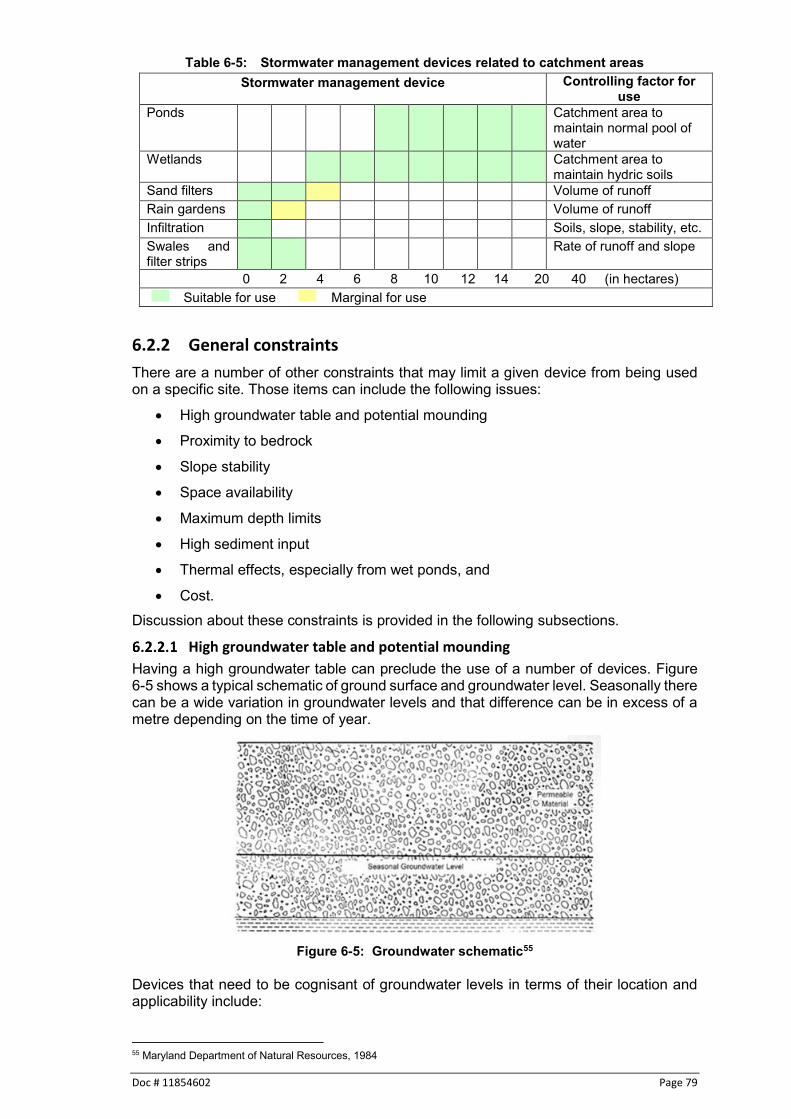
Doc # 11854602 Page 79
Table 6-5: Stormwater management devices related to catchment areas Stormwater management device Controlling factor for
use Ponds Catchment area to
maintain normal pool of water
Wetlands Catchment area to maintain hydric soils
Sand filters Volume of runoff Rain gardens Volume of runoff Infiltration Soils, slope, stability, etc. Swales and filter strips
Rate of runoff and slope
0 2 4 6 8 10 12 14 20 40 (in hectares) Suitable for use Marginal for use
6.2.2 General constraints
There are a number of other constraints that may limit a given device from being used on a specific site. Those items can include the following issues:
High groundwater table and potential mounding
Proximity to bedrock
Slope stability
Space availability
Maximum depth limits
High sediment input
Thermal effects, especially from wet ponds, and
Cost. Discussion about these constraints is provided in the following subsections.
High groundwater table and potential mounding
Having a high groundwater table can preclude the use of a number of devices. Figure 6-5 shows a typical schematic of ground surface and groundwater level. Seasonally there can be a wide variation in groundwater levels and that difference can be in excess of a metre depending on the time of year.
Figure 6-5: Groundwater schematic55
Devices that need to be cognisant of groundwater levels in terms of their location and applicability include:
55 Maryland Department of Natural Resources, 1984

Page 80 Doc # 11854602
Ponds and wetlands
Infiltration devices, and
Swales. Filter systems can generally be designed around site conditions as long as there is a positive outfall. Groundwater mounding can also be a concern. This is particularly relevant for infiltration devices, where significant surface runoff soaks to ground in one location and then elevates local groundwater levels. This concept is shown in Figure 6-6 below.
Figure 6-6: Groundwater mounding under an infiltration practice55
Even though pre-development groundwater levels may be low enough that site development concerns shouldn’t result, the artificial raising of local groundwater levels could cause performance problems.
Proximity to bedrock
Proximity to bedrock has two major issues: drainage in a similar fashion that infiltration devices have with groundwater levels, and cost to construct a device if the invert requires excavation into bedrock. Either of these two issues could adversely impact the use of a given device and it could apply to any device depending on the depth to bedrock.
Slope stability
The use of a stormwater device on a slope can increase slope stability issues. If incorrectly designed, the stormwater discharge from the device can exit the slope above the toe of the slope, as shown in Figure 6-7 below.
Figure 6-7: Slope and seepage from an infiltration trench
This discharge above the toe can increase the saturation of the slope or cause overland flow across the slope to occur where it previously didn’t, hence potentially causing adverse stability effects. This applies to infiltration primarily but could also apply to rain gardens and swales if they discharge to the top of a steep slope. Using a device on a slope that may not have existing stability issues and then artificially putting water in the soil could cause stability concerns. Geotechnical reports are essential if there is an intention to place stormwater flows in the ground on slopes.

Doc # 11854602 Page 81
Space availability
In general, space allocated for stormwater management is always going to be limited as development potential is maximised. There may be situations where regulatory requirements and downstream impacts may necessitate acquiring additional land however, for the most part, devices will have to fit within a given limited site area that is available for stormwater management. From a water quantity perspective there may be opportunities to be creative, such as under sizing pipes conveying catchment drainage and using road embankments to control water quantity discharges downstream. Water quality will still be necessary, as larger catchment flows would necessitate larger treatment devices. Those devices having the greatest area requirements are wetlands and ponds. These devices are generally more appropriate for larger catchments and larger footprints.
Maximum depth limits
There will be situations, especially where there are reticulation systems, when the invert of the receiving system pipe will determine the invert of the stormwater management device. If the invert of the receiving pipe is above the invert of the stormwater management device then the device will not drain and could cause localised flooding or system bypass. There has to be a positive outfall from stormwater management devices if they are to function for peak control or water quality treatment.
High sediment inputs
A number of stormwater management devices are sensitive to excess sediment loadings and will incur maintenance problems if catchment sediment loads draining to the individual device are high. Examples of this situation would be areas adjacent to a treatment device undergoing earthworks and having high sediment loads entering the treatment system. Another situation could involve horticultural activities where seasonal land clearing and planting could increase sediment runoff to treatment devices. Device that are sensitive to high sediment loadings that will have a fairly rapid decline in water quality treatment performance include the following:
Infiltration devices
Sand filters
Rain gardens
Swales, and
Filter strips. Ponds and wetlands, having sediment forebays, have the ability to store larger sediment loads than the other devices, although they still would require more frequent maintenance to maintain performance.
Thermal effects
Water temperature affects water chemistry and quality, and has a pervasive, over-riding influence on the receiving system biota through its control of enzyme systems and the physiology of cold-blooded animals. Water temperature is therefore a key factor influencing the ecological performance of streams. Summer is the main time of year when thermal enrichment issues occur.
Prematurely clogged rain garden from un-stabilised adjacent areas

Page 82 Doc # 11854602
Pavement modifies stormwater temperatures, raising it during the summer, but cooling it in cold winter months. A study undertaken in the U.S.56 observed during one summer storm that the temperature of the stormwater from a parking lot was 5°C higher than the rainwater. From a New Zealand context, acute mortality for most native NZ fauna tested to date occurred above 25°C. LT50 values (lethal temperatures that killed 50% of the test organisms over a 10-minute duration) for nine species of native fish ranged from 27.0-31.9°C.57 Juvenile and adult eels were considerably more tolerant than other fish species (LT50 ranges from 34.8-39.7°C) and thus were not used in setting assessment criteria. Native invertebrate species were more sensitive than fish, where LT50 values (24-hour exposure) for 12 species ranged from 25.9-32.4°C.58 One study59 recommended that a maximum value of 3°C below the lowest LT50 would allow for a margin of safety. Based upon the test data and interpretations, slight, moderate and severe adverse effects were estimated to occur above 22°C, 24°C and 26°C, respectively. There are three possible sources of temperature increase from urban land uses: impervious surfaces, standing water in stormwater ponds and the elimination of stream shading. Temperature increases from pavements are mentioned above but stormwater ponds could increase thermal loadings to receiving systems. Ponds may have degraded water quality due to temperature increases, as their surface area tends to be exposed to direct sunlight. As a result, ponds can cause significant adverse effects on downstream macroinvertebrate communities.60 There are ways to reduce these thermals impacts including if the ponds:
Are not located in stream channels
Have below surface outfalls (temperatures are greatest at the surface)
Have a piped outlet that enables discharges to be cooled by heat transfer to the adjacent ground surrounding the outlet pipe, and
Are small enough that riparian vegetation could provide shading of the pond surface.
Thermal impacts from wetlands are reduced when compared to ponds due to increased surface area coverage by wetlands vegetation. Hamilton City Council is recommending 80% vegetation cover in wetlands to help mitigate potential thermal effects. A treatment train approach with multiple devices in series can mitigate the effects of impervious surface temperature increases by moderating temperature as the water passes through multiple devices. In addition, establishment or maintenance of riparian buffers, including large shade trees, would also reduce stream thermal effects.
Cost
Stormwater management costs can relate to several factors including:
Property acquisition
Device construction, and
Whole of life costs relating to subsequent operational expenses. All of these factors can, and should, enter into decisions regarding device selection and implementation. Costs may be difficult to predict on a nationwide basis depending on regulatory requirements from various consenting authorities, and site acquisition costs will be highly variable. An example of highway expected costs comes from the State of Washington61 where the Washington State Department of Transportation estimates $7 million/year for
56 Black, 1980 57 Richardson et al, 1994 58 Quinn et al, 1994 59 Simons, 1986 60 Maxted et al, 2005 61 Hoey et al, 2000

Doc # 11854602 Page 83
maintenance of stormwater devices and capital costs ranging from 8 - 20 percent of total project costs depending on project type and location. Experience by this author of stormwater management devices over the years has indicated operational costs would approximate 5% of construction costs on an annual basis to ensure adequate funding for maintenance activities. There will be years where that funding is not completely used but there will be other years where significant maintenance is required, which averages the long-term costs across the asset life. One element of costs that may not normally be considered are the benefits of stormwater management relating to the following:
Flooding and property damage
Degradation of water quality effects in the receiving environment
Loss of fish and wildlife habitat,
Sedimentation in harbours and estuaries, and
Loss of marine habitat One study has utilised a non-market valuation technique to quantify some of the valued aspects of Auckland’s marine environment.62 They considered that the total benefits derived, based on the level of water quality at that time, were estimated to be $442 million (in 1991 dollars) per annum. In addition, scenarios were considered to calculate future benefits and losses as a result of deterioration in water quality. This work was only an estimation of values associated with the marine environment and excluded freshwater environmental values and the avoided property and safety implications of flooding events in developed areas. While this was only one study it is indicative that there are financial benefits to implementation of stormwater management. Previous discussion has also recognised that using an LID approach to site development can provide cost savings over traditional development.
6.2.3 Contaminant generation
Addressing contaminants should be undertaken on the basis of the receiving system and the potential contaminants generated by the land use activity in the catchment. For years, most stormwater management programmes have been focused towards removal of suspended solids, but that may not be appropriate for activity-derived contaminants or for some of the receiving environments in the Waikato Region. For example, for Lake Rotokauri to the west of Hamilton, phosphorus is the key contaminant of concern, with phosphorus removal being the controlling factor when considering what stormwater management devices are required to achieve water quality targets. When looking at contaminant generation potential, New Zealand data is similar to water quality data collected overseas. Section 15 has a detailed discussion on calculation of contaminant loads for various land uses. In terms of device selection, New Zealand data indicates that as with overseas studies, lead is the least soluble of the key elements in stormwater (<10%) with zinc being the most soluble (about 40%). Cadmium and copper appear to be moderately soluble with about 30% in the soluble phase. If zinc is a concern on a given project, devices that rely on sedimentation will not be effective at total zinc removal. If lead were a specific concern, sedimentation would be an effective approach. The Auckland Council has developed a contaminant load model63 that inputs the land use type) that is generating the contaminant and then allows various stormwater management devices to be applied to determine contaminant discharge from a given area.
62 Ward et al, 1991 63 Auckland Regional Council version, May 2006
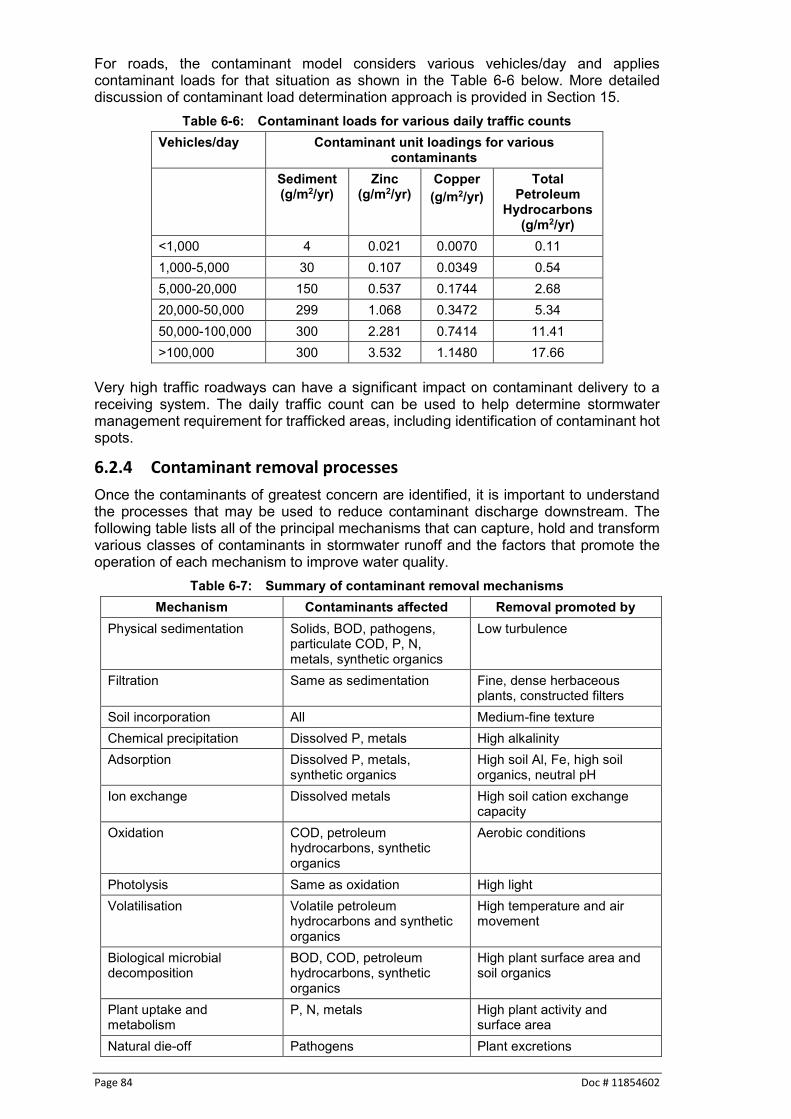
Page 84 Doc # 11854602
For roads, the contaminant model considers various vehicles/day and applies contaminant loads for that situation as shown in the Table 6-6 below. More detailed discussion of contaminant load determination approach is provided in Section 15.
Table 6-6: Contaminant loads for various daily traffic counts Vehicles/day Contaminant unit loadings for various
contaminants Sediment
(g/m2/yr) Zinc
(g/m2/yr) Copper (g/m2/yr)
Total Petroleum
Hydrocarbons (g/m2/yr)
<1,000 4 0.021 0.0070 0.11 1,000-5,000 30 0.107 0.0349 0.54 5,000-20,000 150 0.537 0.1744 2.68 20,000-50,000 299 1.068 0.3472 5.34 50,000-100,000 300 2.281 0.7414 11.41 >100,000 300 3.532 1.1480 17.66
Very high traffic roadways can have a significant impact on contaminant delivery to a receiving system. The daily traffic count can be used to help determine stormwater management requirement for trafficked areas, including identification of contaminant hot spots.
6.2.4 Contaminant removal processes
Once the contaminants of greatest concern are identified, it is important to understand the processes that may be used to reduce contaminant discharge downstream. The following table lists all of the principal mechanisms that can capture, hold and transform various classes of contaminants in stormwater runoff and the factors that promote the operation of each mechanism to improve water quality.
Table 6-7: Summary of contaminant removal mechanisms Mechanism Contaminants affected Removal promoted by
Physical sedimentation Solids, BOD, pathogens, particulate COD, P, N, metals, synthetic organics
Low turbulence
Filtration Same as sedimentation Fine, dense herbaceous plants, constructed filters
Soil incorporation All Medium-fine texture Chemical precipitation Dissolved P, metals High alkalinity Adsorption Dissolved P, metals,
synthetic organics High soil Al, Fe, high soil organics, neutral pH
Ion exchange Dissolved metals High soil cation exchange capacity
Oxidation COD, petroleum hydrocarbons, synthetic organics
Aerobic conditions
Photolysis Same as oxidation High light Volatilisation Volatile petroleum
hydrocarbons and synthetic organics
High temperature and air movement
Biological microbial decomposition
BOD, COD, petroleum hydrocarbons, synthetic organics
High plant surface area and soil organics
Plant uptake and metabolism
P, N, metals High plant activity and surface area
Natural die-off Pathogens Plant excretions

Doc # 11854602 Page 85
Mechanism Contaminants affected Removal promoted by Nitrification NH3-N Dissolved oxygen>2mg/l, low
toxicants, temperature>5-7oC, neutral pH
Denitrification NO3+NO2-N Anaerobic, low toxicants, temperature>15oC
A key factor to consider in the functioning of all mechanisms is time. The effectiveness of settling a solid particle is directly related to the time provided to complete sedimentation at the particle’s characteristic settling velocity (refer to Table 5-4 for settling velocities). Time is also a crucial variable to determine the degree that chemical and biological mechanisms operate. Characteristic rates of chemical reactions and biologically mediated processes must be incorporated to obtain treatment benefits. For all of these reasons, water residence time is the most basic variable to apply as an effective treatment device technology. The information provided in Table 6-7 can also be arranged by features that promote specific contaminant removal objectives. The following features provide for most objectives:
Features that assist in achieving any objective: - Increasing hydraulic residence time - Low turbulence - Fine, dense herbaceous plants, and - Medium-fine textured soil.
Features that assist in achieving specific objectives: - Phosphorus control
o High soil exchangeable aluminium and/or iron content o Addition of precipitating agents
- Nitrogen control o Alternating aerobic and anaerobic conditions o Low toxicants o Neutral pH
- Metals control o High soil organic content o High soil cation exchange capacity o Neutral pH
- Organic control o Aerobic conditions o High light o High soil organic content o Low toxicants o Neutral pH.

Page 86 Doc # 11854602
6.2.5 Device selection
Whilst Section 8 provides detailed discussion on choosing and designing stormwater management devices, this sub-section provides a more generic discussion of devices and their ability to remove various contaminants and function for water quantity control. In a number of situations, stormwater management devices can provide both water quantity and water quality control for a given site. In other situations, this may not be possible and multiple devices may be required to achieve desired outcomes. Table 6-8 below provides some discussion of various devices and their ability to address water quantity and water quality for various contaminants.
Table 6-8: Stormwater management device capabilities Device Peak flow
control Water quality treatment
Sediment Metals TPH Nutrients Dry pond with extended detention
High Moderate Pb - Moderate Cu - Low Zn - Low
Low P - Low N - Low
Wet pond with extended detention
High High Pb - High Cu - Moderate Zn - Moderate
Low P - Moderate N - Low
Wetland High High Pb - High Cu - High Zn - High
High P - High N - High
Filter systems
Low High Pb - High Cu - Moderate Zn - Low
High P - Moderate N - Low
Rain gardens
Low High Pb - High Cu - High Zn - High
High P - High N - Moderate
Infiltration Moderate High Pb - High Cu - High Zn - High
High P - High N - Moderate
Swales and filter strips
Low High Pb - High Cu - Moderate Zn - Moderate
Moderate P - Moderate N - Low
The ability of different devices to mitigate thermal effects is not outlined in the above table. Of the devices that are listed in this table, wet ponds can lead to thermal effects and hence are to be used with caution. As can be seen from this table, selection of a stormwater management device or devices will depend on the contaminants of concern and whether peak flow control is a requirement. Other than ponds and wetlands, water quality devices have limited peak flow control capability and must be used in conjunction with another device if overall peak flow control is to be achieved for the project.
6.2.6 Treatment train approach
As mentioned briefly in the previous paragraph, water quality treatment devices generally have limited peak flow control capability and must be used in conjunction with a water quantity control device if both issues (water quantity/water quality) are to be addressed. It is difficult for one device to provide for multiple benefits. Increasingly more emphasis is being placed on a stormwater “treatment train” approach to stormwater management, where several different types of stormwater devices are used together and integrated into a comprehensive stormwater management system for the site.

Doc # 11854602 Page 87
A treatment train approach ideally considers various levels of stormwater management that includes both source control (with an LID basis) and treatment as part of the overall approach. Source control is generally not considered and can have significant value. Once source control has been implemented to the maximum degree that it can, contaminant removal and peak flow control would then be pursued. Minton64 provides a number of recommendations for a treatment train approach that have been adapted in the following table to discuss how various devices may work in conjunction with one another.
Table 6-9: Treatment train examples Function Examples
Removal of coarse solids to reduce maintenance costs
Forebay in a wet pond or extended detention dry pond followed by a sand filter
Removal of fine sediments to meet a treatment performance goal
Sand filter followed by a wet pond or wetland
Removal of dissolved contaminants Sorptive media filter followed by wet pond, wetland or rain garden
Reduction of petroleum hydrocarbons to prevent clogging of a second treatment
practice
API unit followed by a sand filter or rain garden
Removal of litter to prevent clogging or fouling a second treatment practice
Continuous deflection separation followed by a wetland
Infiltration Swale followed by an Infiltration practice Aesthetics Rain garden followed by a wetland
Wildlife habitat Rain gardens followed by a wetland Reliability of long term performance Wet pond followed by a wetland
Recommendations also adapted from this overall list include the following:
Follow the golden rule: Don’t place two devices in a treatment train that have the same function.
Conversely, follow the second golden rule: have a different function for each element of the treatment train.
When considering a specific system component, the specific contaminant to be removed should be identified, rather than thinking in terms of a general removal of multiple contaminants.
Any two elements of the system should be considered separately.
Recognise that including a second element may only provide minor benefit hence the additional expected benefit of an additional element should be compared to the incremental cost of the added element operation.
Care should be taken when calculating efficiency of the overall treatment train. An example of a treatment train approach could be the use of swales adjacent to a roadway. The swales would then discharge into a wetland. The combination of devices would provide water quantity control and water quality control for sediments and dissolved metals. Depending on the outlet design of the wetland, hydrocarbons would be volatilised and evaporate. The combination of devices would provide excellent water quality control.
Benefits of devices in series
While these devices provide individual benefits for removal of contaminants, their use in series can provide greater benefit than those used only individually.
64 Minton, 2006

Page 88 Doc # 11854602
A simplified equation for the total removal of a given contaminant for two or more stormwater management devices in series is the following65:
R = A + B – [(A x B)/ 100] Where: R = total removal rate A = Removal rate of the first or upstream practice B = Removal rate of the second or downstream practice
The use of this equation is easiest when considering removal percentages rather than using effluent limits as data on performance of devices for effluent limits can be highly variable. Waikato Regional Council has significant interest in sediment and nutrients (in lakes catchments) as contaminants of greatest concern so device performance for them is provided in the following Table 6-10. Using the removal rates provided in the table will allow for calculation of overall removal of the contaminant of greatest concern. If metals are a contaminant of concern Table 6-11 provides those device removal rates and calculation of treatment train benefits. Table 6-10: Removal rates for various stormwater devices for TSS and nutrients Practice Removal rates (%)
TSS Nitrogen Phosphorus Swales 75 20 30 Filter strips 70 20 20 Sand filters 80 35 45 Bioretention devices (normal) Bioretention devices (w/anaerobic zone)
80 80
40 50
60 80
Infiltration devices 80 30 60 Dry ponds (no extended detention)
40 10 20
Dry ponds (with extended detention)
60 20 30
Wet ponds (with extended detention)
75 25 40
Wetlands 80 40 50 Green roofs Volume reduction and
some water quality treatment1
Volume reduction and some water
quality treatment1
Volume reduction and some water
quality treatment1 Water tanks Volume reduction only Volume reduction
only Volume reduction
only Oil water separators 15 0 5 NOTE: 1 Green roofs address water quality primarily by preventing runoff from being generated by the rooftop. They can
prevent stormwater from discharging from the rooftop, potentially eliminating the need for ground level treatment of roof runoff depending on the contaminants of concern.
65 State of New Jersey Department of Environmental Protection, 2004

Doc # 11854602 Page 89
Table 6-11: Removal rates for various stormwater devices for metals
Device Removal rates (%) Zinc Copper
Swales 50 60 Filter strips 50 60
Sand filters (with organic matter)
90 90
Bioretention devices (normal)
Bioretention devices (w/anaerobic zone)
70
70
75
75
Infiltration devices 80 70 Dry ponds (no
extended detention) 10 20
Dry ponds (with extended detention)
20 30
Wet ponds 30 40 Wetlands 60 70
Green roofs Volume reduction only
Volume reduction only
Water tanks Volume reduction only
Volume reduction only
Oil water separators 5 5 As an example, a stormwater management approach uses a swale to drain into a wetland to provide for water quality treatment for both sediment and nutrients from a road project.
R = A + B – [(A x B) / 100]
For sediment R = 70 + 90 – [(70x90)/100] = 160 –63 = 97% removal For nitrogen R = 20 + 40 – [20x40)/100] = 60 – 8 = 52% removal For phosphorus R = 30 + 50 – [(30x50)/100] = 80 – 15 = 65% removal
Obviously, the results depend on the removal rates of a given contaminant by a specific practice. The values given in Table 6-10 are relative values based on international literature. There will be local variation but the values can be considered approximate. When using stormwater treatment devices in series, arrange the devices from upstream to downstream in ascending order of the contaminant removal ability. The lowest removal device should be placed upstream of the higher removal device.

Page 90 Doc # 11854602
7 Design criteria When considering hydrologic design criteria recommendations, the recommendations have to be considered in light of the issues discussed in Section 5 regarding the receiving environment. These issues include:
Water quantity
Stream channel erosion, and
Water quality. The following sections discuss the three issues regarding hydrologic recommendations.
Water quantity design There are two purposes for implementation of water quantity control:
Preventing existing downstream flooding problems from getting worse, and
Controlling intermediate storms to minimise potential increases in out-of-bank flows downstream.
Both of these situations may be encountered on a case-by-case basis. It is important to define the source of flooding problems and situations where flooding issues need to be addressed. The situation considered in this guideline is flooding that is being caused or exacerbated by new impervious surfaces. These surfaces increase stormwater runoff from a pre-development condition that may have been pasture or bush. It is not the intent of this guideline to consider flooding from a tidal surge context. Thus, flooding issues are considered on streams or reticulation systems located within catchments that drain rainfall-generated runoff and are not tidally induced.
7.1.1 Preventing existing flooding problems from getting worse
It is imperative that development projects do not increase the risk of downstream flooding where there is flooding potential for existing structures. Structures, in this context, could be habitable buildings or highways. Where there are downstream flooding problems, peak discharges for the post-development 100-year ARI event may need to be managed to ensure that downstream flood levels are not increased. This will depend on whether the timing of stormwater discharges is an issue, which depends on the catchment, the number of tributaries and the location of the project in a catchment. Two bodies of work have been undertaken related to preventing increases in downstream flood potential when hydrologic analyses have not been carried out on a catchment-wide basis. In a study of the Flat Bush catchment in Manukau City66 catchment modelling was undertaken to determine what level of attenuation was required to mitigate potential downstream flood effects. It was determined that appropriate criteria was that the post-development peak flows for the 100-year ARI event were attenuated to 80% of the pre-development peak flows for the same design event. This level of over-attenuation was found to be warranted to compensate for the increased volume of runoff resulting from development in the catchment. Normal attenuation of this runoff in ponds considerably extends the duration of sub-catchment peak flows, potentially resulting in a greater coincidence of peaks and therefore a greater combined downstream discharge than occurs in the pre-development situation. The indicative target of 80% is necessary to avoid any cumulative hydrological effects that could increase the peak flow downstream.
66 Manukau City Council, 2004
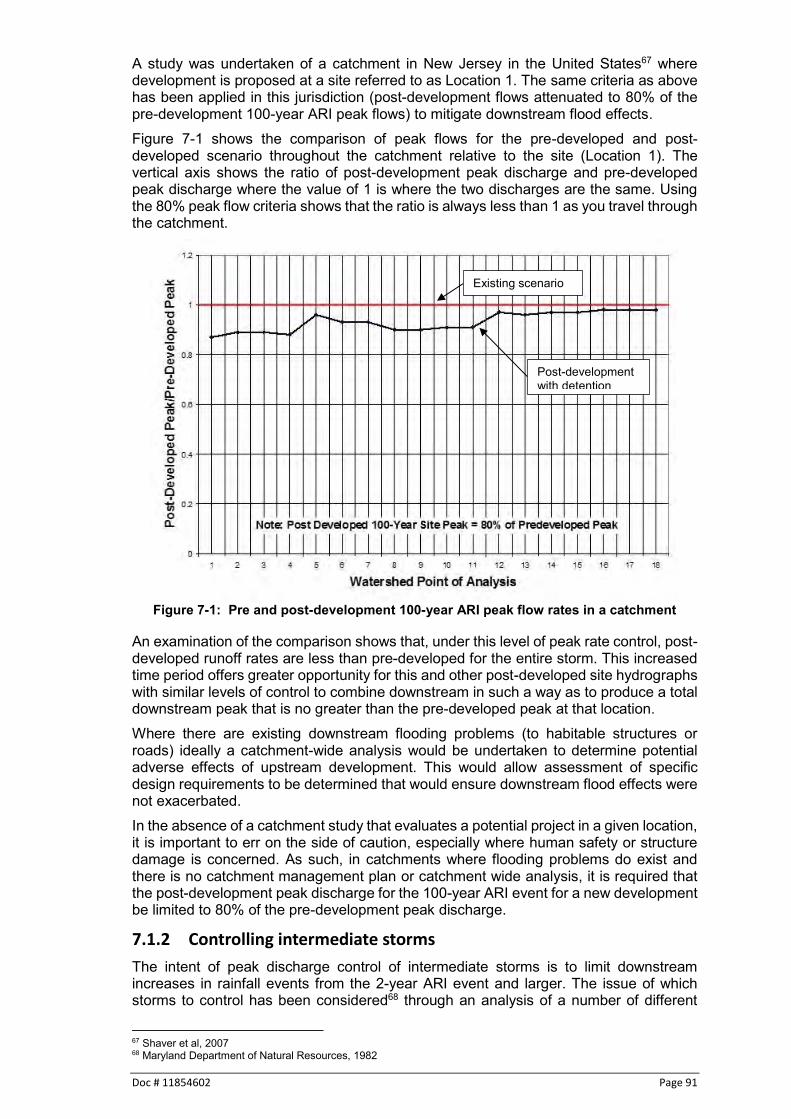
Doc # 11854602 Page 91
A study was undertaken of a catchment in New Jersey in the United States67 where development is proposed at a site referred to as Location 1. The same criteria as above has been applied in this jurisdiction (post-development flows attenuated to 80% of the pre-development 100-year ARI peak flows) to mitigate downstream flood effects. Figure 7-1 shows the comparison of peak flows for the pre-developed and post-developed scenario throughout the catchment relative to the site (Location 1). The vertical axis shows the ratio of post-development peak discharge and pre-developed peak discharge where the value of 1 is where the two discharges are the same. Using the 80% peak flow criteria shows that the ratio is always less than 1 as you travel through the catchment.
Figure 7-1: Pre and post-development 100-year ARI peak flow rates in a catchment
An examination of the comparison shows that, under this level of peak rate control, post-developed runoff rates are less than pre-developed for the entire storm. This increased time period offers greater opportunity for this and other post-developed site hydrographs with similar levels of control to combine downstream in such a way as to produce a total downstream peak that is no greater than the pre-developed peak at that location. Where there are existing downstream flooding problems (to habitable structures or roads) ideally a catchment-wide analysis would be undertaken to determine potential adverse effects of upstream development. This would allow assessment of specific design requirements to be determined that would ensure downstream flood effects were not exacerbated. In the absence of a catchment study that evaluates a potential project in a given location, it is important to err on the side of caution, especially where human safety or structure damage is concerned. As such, in catchments where flooding problems do exist and there is no catchment management plan or catchment wide analysis, it is required that the post-development peak discharge for the 100-year ARI event for a new development be limited to 80% of the pre-development peak discharge.
7.1.2 Controlling intermediate storms
The intent of peak discharge control of intermediate storms is to limit downstream increases in rainfall events from the 2-year ARI event and larger. The issue of which storms to control has been considered68 through an analysis of a number of different
67 Shaver et al, 2007 68 Maryland Department of Natural Resources, 1982
Existing scenario
Post-development with detention

Page 92 Doc # 11854602
policies for peak flow control. By considering a wide range of policies in conjunction with their peak flows, volumes and timing the effects of the various policies can be visually represented through flow duration curves and hydrographs. Figure 7-2 below shows a comparison of flood frequency curves for various stormwater management policies.
Figure 7-2: Comparison of flood frequency curves for various stormwater policies68
To explain what the numbers mean, P stands for policy while the first number after the P stands for the post-development storm frequency and the second number stands for the pre-development storm frequency. A P 2-2 reflects a policy where the post-development peak discharge for the 2-year ARI event cannot exceed the pre-development peak discharge for the 2-year ARI event. A P 5-2 policy means that the post-development 5-year ARI peak discharges cannot exceed the 2-year ARI pre-development peak discharge. What can be seen from the figure is that the 2-2, 10-10 (post-development 2-year ARI event cannot exceed the pre-development 2-year ARI event and the 10-year ARI post-development event cannot exceed the pre-development 10-year ARI event) comes closest to matching the existing frequency curve. By providing multiple storm controls, the post-development frequency curve comes closest to the pre-development frequency curve. Matching the 2 and 10-year ARI post-development events to their pre-development level is a common way of minimising downstream intermediate storm peak discharge increases.

Doc # 11854602 Page 93
7.1.3 Catchment location
A major consideration regarding the requirement for peak flow control is catchment location. As a general rule, stormwater detention for peak flow control should only be provided for developments located in the top half of a catchment to ensure that the potential for discharge peaks to coincide does not occur. This is to ensure the discharge peak from the development does not coincide with the discharge peak from the upper catchment. It is noted that this is a simplified approach, as there are other variables that can affect the timing of discharge peaks, including catchment shape, topography, surface type, etc. It is expected that stormwater design will be undertaken by experienced stormwater practitioners who will be able to determine whether peak flow control is required. The optimal approach to determine where peak flow control is required in a catchment is to conduct a comprehensive catchment analysis where potential locations for peak flow control can be considered. In these situations the study results will determine the need for peak flow control at potential locations within the catchment. If there is confusion regarding whether peak flow control is required, Waikato Regional Council staff can be contacted to discuss further. The same concern does not apply to erosion control criteria, where imposition of volume or extended detention control are required throughout the catchment.
7.1.4 Design rainfall
Waikato Regional Council accepts design rainfall derived using NIWA’s High Intensity Rainfall Design System (HIRDS) Version 369 or more recent versions as they become available.
7.1.5 Hydrologic design method
Hydrologic analyses for all stormwater management purposes should be undertaken according to the Waikato Stormwater Runoff Modelling Guideline70. Waikato Regional Council may consider it acceptable for a consultant or other entity to use an alternative method or computer model as long as it is a legitimate and well recognised method/model. If required, the consultant/entity must be able to demonstrate that the proposed alternative approach is robust and provides comparable outputs to what would be determined using the method outlined in the Waikato Stormwater Runoff Modelling Guideline.
Modelling
When modelling for water quality treatment, extended detention, 2 and 10-year ARI event peak flow control, consider the catchment (or site) to be heterogeneous. Heterogeneous catchments should be modelled by division into separate homogeneous sub-catchments, connected by hydraulic elements. For water quality and extended detention events, issues such as timing or response time are not important as for larger storms. Vegetated swales and filter strips are designed for a peak flow rate, but as they serve very small catchments the catchment response time can be ignored and the peak 10-minute rainfall rate used (minus losses). For 2 and 10-year ARI peak flow determination timing is important. The procedure outlined in the Waikato Stormwater Runoff Modelling Guideline should be used to complete the analysis. Water quality volume is the ‘total outflow’ obtained by summing the storm runoff volumes from separate analyses of the pervious and impervious catchment areas.
69 https://hirds.niwa.co.nz/ 70 Waikato Regional Council, 2018

Page 94 Doc # 11854602
As an additional guidance note relevant to designing swales, wetland swales and filter strips, it is necessary to assess the peak velocities for the water quality event, to ensure the devices are adequately sized. To enable the impact of retention to be incorporated into this assessment, it is recommended that the designer assumes the impervious surfaces have an initial abstraction that is equal to the pre-development initial abstraction, and calculate the peak flow rate, and then velocity, on this basis.
Alternative design methods
Waikato Regional Council recommends that designers use the Waikato Hydrological Modelling Guideline for design calculations. The use of this method will ensure that comparable results are obtained by the use of standard input parameters. It also ensures consistency in analyses within a catchment. The primary situation where alternative methods of design may be used (with Waikato Regional Council approval) is when catchment-wide analyses are undertaken. This may be the situation where characteristics of the catchment or management approach may be better considered through a model that is more appropriate for the specific catchment. Communication between the individual proposing an alternative method of design and Waikato Regional Council should be undertaken prior to modelling being initiated to ensure there are no disagreements on the method of analysis.
7.1.6 Effects of climate change
The Resource Management (Energy and Climate Change) Amendment Act 2004 requires councils to have particular regard to the effects of climate change. Incorporating climate change predictions into stormwater design is important if infrastructure is to maintain the same level of service throughout its lifetime, and to ensure that development occurs in areas that will not be subject to future flood risk. The Ministry for the Environment (MfE) advises that mean rainfall will vary around the country and with season. Extreme rainfall, heavier and/or more frequent extreme rainfall events are expected71. For the Waikato Region, the average temperature increase is predicted to be approximately 2.1°C71 (this is the mid-point of the mid-range scenario in terms of global response to reducing greenhouse gases). Note that as future Intergovernmental Panel on Climate Change (IPCC) assessments are undertaken, the predicted increase in temperature will likely change and the MfE will prepare updated guidance. It is expected that the most recent MfE predictions will be used for this methodology. An updated guideline for climate change72 proposes a range of temperature scenarios however for this guideline, Waikato Regional Council is continuing to rely on the temperature increase detailed previously71 until more specific guidance is provided. The 2 and 10-year Annual Recurrence Interval (ARI) rainfall events are used to confirm a stormwater management device’s ability to convey peak flows under moderately severe conditions. For device components with a design life greater than 25 years the storm event post-development precipitation values (2 and 10-year ARI) should be adjusted to account for climate change. The values obtained from HIRDS for the 2 and 10-year rainfall should be increased by the percentages listed in Table 7-1 per 1°C increase in predicted temperature. This information should be used unless more detailed data is available that provides more accurate recommendations.
71 Ministry for the Environment, 2008 72 Ministry for the Environment, 2016

Doc # 11854602 Page 95
Table 7-1: Climate change percentage adjustments per 1°C temperature increase73
Duration ARI (years)
2 5 10 20 30 50 100
<10 minutes 8.0 8.0 8.0 8.0 8.0 8.0 8.0
10 minutes 8.0 8.0 8.0 8.0 8.0 8.0 8.0
30 minutes 7.2 7.4 7.6 7.8 8.0 8.0 8.0
1 hour 6.7 7.1 7.4 7.7 8.0 8.0 8.0
2 hours 6.2 6.7 7.2 7.6 8.0 8.0 8.0
3 hours 5.9 6.5 7.0 7.5 8.0 8.0 8.0
6 hours 5.3 6.1 6.8 7.4 8.0 8.0 8.0
12 hours 4.8 5.8 6.3 7.3 8.0 8.0 8.0
24 hours 4.3 5.4 6.3 7.2 8.0 8.0 8.0
48 hours 3.8 5.0 6.1 7.1 7.8 8.0 8.0
72 hours 3.5 4.8 5.9 7.0 7.7 8.0 8.0
Note: This table recommends percentage adjustments to apply to extreme rainfall per 1o C of warming, for a range of Average Recurrence Intervals (ARIs). The percentage changes are mid-range estimates per 1o C and should be used only in a screening assessment. The entries in this table for a duration of 24 hours are based on results from a regional climate model driven for the A2 SRES (Special Report on Emissions Scenarios - see MfE, 2008 Appendix 1) emissions scenario.
As stated above, in the Waikato Region the increase in annual mean temperature up to the year 2090 is expected to be 2.1oC. Consideration of a greater time frame for calculation purposes may also go beyond 2090 in the future. While the annual average rainfall is expected to decrease slightly the intensity of storms is expected to increase. Table 7-2 below provides percentage adjustments to apply to rainfall assuming a temperature increase of 2.1°C. For the most up to date temperature increase predictions refer to MfE.
Table 7-2: Climate change percentage adjustments based on predicted 2.1°C temperature increase
Duration ARI (years)
2 5 10 20 30 50 100 <10 minutes 16.8 16.8 16.8 16.8 16.8 16.8 16.8
10 minutes 16.8 16.8 16.8 16.8 16.8 16.8 16.8
30 minutes 15.12 15.54 15.96 16.38 16.8 16.8 16.8
1 hour 14.07 14.91 15.54 16.17 16.8 16.8 16.8
2 hours 13.02 14.07 15.12 15.96 16.8 16.8 16.8
3 hours 12.39 13.65 14.7 15.75 16.8 16.8 16.8
6 hours 11.13 12.81 14.28 15.54 16.8 16.8 16.8
12 hours 10.08 12.18 13.23 15.33 16.8 16.8 16.8
24 hours 9.03 11.34 13.23 15.12 16.8 16.8 16.8
48 hours 7.98 10.5 12.81 14.91 16.38 16.8 16.8
72 hours 7.35 10.08 12.39 14.7 16.17 16.8 16.8
73 Ministry for the Environment, 2008, Table 5-2
Page 96 Doc # 11854602
Climate change is occurring now but predicted temperature increases are what is expected to occur up to 2090. Pre-development rainfall data should not be adjusted for climate change while post-development rainfall data should be adjusted for climate change.
7.1.7 Peak flow control criteria
There are five requirements related to peak flow control criteria: 1. Rainfall data used for all rainfall events shall have 24-hour rainfall distribution. 2. The rainfall data for the 2, 10 and 100-year ARI events should be increased for
the post-development scenario to allow for predicted climate change in accordance with Section 7.1.6.
3. Where there are existing downstream flooding issues, depending on the site’s position in the catchment (refer to Section 7.1.3), it is recommended that the post-development peak discharge for the 100-year ARI rainfall event for a new development be limited to 80% of the pre-development peak discharge (unless there is a catchment study that demonstrates that this is not required).
4. In terms of intermediate storm control, depending on the site’s position in the catchment (refer to Section 7.1.3), the 2 and 10-year ARI post-development peak discharges shall not exceed the 2 and 10-year ARI pre-development peak discharges.
5. As discussed in Section 7.1.3, peak flow control is generally only recommended for projects located in the top half of catchments so as to avoid concerns over coincidence of peaks aggravating downstream flooding concerns. It is expected that stormwater design will be undertaken by experienced stormwater practitioners who will be able to determine whether peak flow control is required. If there is confusion regarding whether peak flow control is required, Waikato Regional Council staff can be contacted to discuss further.
Stream channel erosion Urban development has the effect of increasing the frequency and magnitude of stormwater flows, particularly during frequent, small rainfall events. As a consequence, streams suffer channel stability problems. The composition of the stream banks and bed are the key factors in stream erodibility. Erosion occurs when the shear stress (the “force” of water flowing along the bed and banks) exceeds the ability of the banks or bed to withstand it. Stream erosion is sensitive to changes in the magnitude of flood flows74. A more accurate approach to stream erosion is based on consideration of shear stress. In principle, the total shear stress on the bed of a stream is the average stress over the bed of a stream ( - N/m2) that resists the gravitational forces on the water under uniform conditions75. In practice, shear stress is difficult to calculate because the water surface slope or energy slope varies across and along the reach of a river. That being the case, permissible velocities are established to control stream erosion. Table 7-3 provides information on permissible velocities that limit stream channel erosion concerns.
74 Beca, 2001 75 Jowett et al, 2006

Doc # 11854602 Page 97
Table 7-3: Maximum permissible velocities76 Material Velocity (m/s) Fine sand (colloidal) 0.46 Sandy loam (noncolloidal) 0.53 Silt loam (noncolloidal) 0.61 Alluvial silt (noncolloidal) 0.61 Ordinary firm loam 0.76 Volcanic ash 0.76 Fine gravel 0.76 Stiff clay 1.14 Graded loam to cobbles (noncolloidal) 1.14 Alluvial silt (colloidal) 1.14 Graded silt to cobbles (colloidal) 1.22 Coarse gravel (noncolloidal) 1.22 Cobbles and shingles 1.52 Shales and hard pans 1.83
A compounding factor relating to stream erosion depends on whether the stream has a floodplain or is an incised gully with channel flow whose depth depends on the amount of water being transported. In situations where there is a floodplain, the erosion potential does not increase significantly once the flow spreads out over the floodplain. As flows increase, the flow spreads out on the floodplain and the depth of flow and velocity do not significantly increase. Flow in incised channels progressively increases in velocity and depth as flow increases and leads to further increases in erosion potential. When addressing stream erosion concerns, there are two methods for meeting erosion control objectives, these are discussed further below:
Runoff volume control
Detention time control
7.2.1 Runoff volume control
The volume of runoff can be used as a criterion for developing an erosion control recommendation. It is necessary to specify both the volume (or depth) of runoff to be stored and the duration over which this volume may generally be infiltrated into the ground or used for water supply purposes on site. A given volume of runoff might be specified for retention and that runoff must pass through the retention system and infiltrate in a given period of time, which would depend on the inter-event time period during that time of year when the average inter-event dry period is least. An example of this is that storms in the region during winter months occur approximately every 2-3 days (2 days for Coromandel and Pukekohe, 3 days for the rest of the region). August is the month that has the shortest inter-event dry period. With this scenario, the retained volume must be drained within 48 hours to ensure that the storage volume is available for the next storm. Figure 7-3 shows the average days between rain events per month.
76 Fortier et al, 1926

Page 98 Doc # 11854602
Figure 7-3: Average days between rains per month77
It is also important to consider LID as a design element to reduce increases in stormwater runoff volume. Reduction in site disturbance, soil compaction, and impervious surfaces all translates into a reduction in increases in stormwater runoff volume and peak rates of discharge. LID should be incorporated into all site development plans to reduce potential impacts on receiving systems. In terms of volume control for downstream erosion prevention, it is recommended that the difference between pre- and post-development total volume for smaller storms up to the 2-year ARI event be retained (rainwater re-use, soakage or bioretention) where possible. There will be situations where this volume cannot be retained on site due to slope or soil conditions. A minimum retention of the site pre-development initial abstraction from all impervious areas should be provided. If soil conditioning is not provided for intended pervious areas that have been earth-worked then the initial abstraction of runoff from the entire site should be retained. The reasoning for this volume control criteria is that impervious surfaces have an initial abstraction essentially of approximately 1 mm, which is significantly less than the pre-development condition. Retaining the initial abstraction from impervious surfaces more closely replicates the pre-development condition for initiation of runoff. If a detention device is proposed in combination with up-stream retention for a site, the volume retained can be deducted from the water quality volume and hence the calculated extended detention volume provided in the proposed detention device. From a hydrological analysis perspective, if the volume of runoff associated with the initial abstraction is retained on site, the analysis can use the pre-development initial abstraction for the post-development impervious surface initial abstraction, which will provide some reduction in larger storm volumes and peak rates of discharge.
7.2.2 Detention time control
Another option to mitigate erosion and scour effects is to establish an extended detention time, which is the time interval between the times of the inflow and outflow hydrographs when a defined percent of the volume has been discharged. In this situation duration of flow is recommended that effectively separate the detained flow from the storm
77 Koh S., 2016

Doc # 11854602 Page 99
hydrograph. A general recommendation of 24 hours is recommended to achieve this separation. Retention of runoff should be considered prior to consideration of extended detention.
7.2.3 General discussion
The intent of volume control and extended detention is to prevent initiation or aggravation of stream channel erosion. By reducing the total volume of water running off the land or extending the time that flows take to travel through the catchment, channel erosion potential is reduced. Figure 7-4 below provides a visual representation of that intent.
Figure 7-4: Discharge versus flow duration for pre and post development scenarios78
In general, the figure relates flow discharge with flow duration. As discussed previously, peak rates of flow and higher velocities potentially cause channel erosion. Figure 7-4 shows three lines and those lines represent: pre-development flows without extended detention, post-development flows without extended detention, and the post-development condition with extended detention. If channel erosion were at a given flow rate (as an example 3 m3/sec) the red line would indicate where the flow becomes erosive. Both pre- and post-development conditions cause stream erosion while the extended detention discharge is below the erosion threshold. It is recognised that erosion is a natural process, and the intent of volume control or an extended detention criteria is to prevent accelerated level of erosion as a result of increased catchment imperviousness. There are two questions that need to be addressed:
What criteria should be established?
Where should the criteria be applied?
7.2.4 What criteria should be established?
An overseas study79 for the case of non-cohesive sediments suggested that the runoff discharged from a detention basin for the post-development conditions and a 2-year 24-hour rainfall event should not exceed 25 mm over the 24 hour duration of the design storm. The discharge approximates that of a water quality event.
78 McCuen, 1987 79 McCuen, 1987

Page 100 Doc # 11854602
Work undertaken by Beca80 indicated that for cohesive soils the discharge from a detention basin should not exceed 30 mm over the 24-hour duration storm or within a maximum peak outflow of 7.5 L/s/ha. The study also recommended having an active storage requirement of up to 130% of the water quality volume as being required to achieve erosion control in cohesive soils. Another option to specific criteria would be for the project designer to calculate the receiving stream shear stress in the pre and post-development condition. If the stream is stable then maintain the pre-development peak flow rate and shear stress. If this analysis becomes too complicated then a generalised level of control is recommended. For the purposes of this guideline, the initial abstraction of pre-development runoff losses from all site impervious areas should be retained on site in conjunction with either 1 or 1.2 times the water quality volume (the determination of which value to use depends on evidence of existing stream erosion). This initial abstraction volume should be live storage provided within the stormwater management device to be infiltrated or released over a 24-hour period.
7.2.5 Where the criteria should be applied
The criterion applies to natural (earthen) streams only. It does not have the same limitations or restrictions as peak flow control (top half of catchment), so will generally be recommended throughout a catchment. At the very bottom end of a catchment it is recommended that shear stress analyses be undertaken to determine whether volume control or extended detention is required. In general in the Waikato Region natural stream channels are considered to be unstable unless the third bullet point applies. There are a number of scenarios where extended detention need not be applied:
Once tidal limits are reached, there is no need to consider extended detention.
Discharges that are made directly to a major river, for example the Waikato, Waihou or Piako Rivers, with no direct discharge into tributary streams first.
Where catchment slopes are very slight and velocities of flow are under those provided in Table 7-3. An example of this situation is around the Hauraki Plains. In this area, getting the water off the land is the problem and stream velocities for the 2-year ARI event may be below the permissible velocities.
Catchment imperviousness is less than 3%, and
There is no potential for future development to increase stream channel instability.
7.2.6 Water quality credit for extended detention
One benefit of providing extended detention for stream channel erosion control is that storing and releasing of stormwater over a 24-hour period will provide improved sedimentation due to gravitational sedimentation over that time. As a result, when used in conjunction with a wet pond or wetland the permanently stored volume calculated for water quality control can be reduced by 50% due to a water quality credit provided by the extended detention. This credit is provided if the criteria provided in Section 7.2.4 are followed.
7.2.7 Erosion control criteria
The following options address stream channel erosion. There are four different approaches that address stream channel erosion:
1. It is recommended that the difference between the pre- and post-development total volume for smaller storms up to the 2-year ARI event be retained (rainwater
80 Beca, 2001

Doc # 11854602 Page 101
re-use, soakage or bioretention) where possible. There will be situations where this volume cannot be retained on site due to slope, water table or soil conditions. A minimum retention of the site pre-development initial abstraction from all impervious areas should be provided. If soil conditioning is not provided for intended pervious areas that have been earth-worked then the initial abstraction of rainfall shall be retained per the following method. The initial abstraction is rainfall and converting it to a volume of runoff for impervious surfaces is straightforward where the rainfall is assumed to be directly converted to runoff with no reduction in the amount. For pervious areas that are not rehabilitated, additional analysis is necessary. In those situations:
The pre-development runoff curve number (CN) is used to calculate the runoff volume for the area that will be pervious but not rehabilitated post-development.
The post-development CN should be determined assuming that the soil group is altered to account for soil disruption and compaction. Thus, a group A soil should be considered as a B soil in post-development scenario (similar to a B becomes C, C becomes D).
Volumes for the given area are calculated in the pre- and post-development conditions for the water quality storm with the post-development condition including global warming increases and the volume to be retained represents the difference in runoff volumes. This volume is then combined with the impervious area retention volume to arrive at a total site retention volume.
2. Check the 2-year stream velocities against Table 7-3 to ensure that velocities are non-erosive. If they are non-erosive in the post-development condition assuming maximum probable development of the catchment, then no extended detention is required. If stream velocities are predicted to be erosive then criteria are provided in items 3 and 4 below.
3. Implement extended detention or volume control according to the following: a) If the stream is stable under the existing development condition, design
detention or retention storage for a 24-hour release of an equivalent volume to the water quality storm.
b) If the stream is not stable (refer to Section 7.2.5 above for further discussion), multiply the water quality volume by 1.2 to determine the extended detention volume. That volume is then stored and released over a 24-hour period.
c) The relationship between initial abstraction (Ia) and the water quality volume and extended detention volume should be considered jointly. The water quality volume and the extended detention volume can be reduced by the retained initial abstraction volume. If retention is provided for the full 2-year ARI event for a site, then no extended detention is required for smaller storms, and water quality would be considered to be addressed as well.
4. This item is for those situations where catchment development has already essentially been completed or for growth cell planning where a large proportion of the catchment is proposed to be developed and the effects of one more development can be determined. Only when item 4 is accomplished can consideration be given to modification of item 3 requirements. Conduct a shear stress analysis for a specific site by undertaking the following:
a) Conduct catchment modelling, i.e. continuous simulation, using land use, initial losses and time of concentration for the catchment in the pre-development condition without the proposed project. Another simulation will then have to be undertaken for the catchment with the development in place.

Page 102 Doc # 11854602
b) Input climate information including evaporation data and long-term rainfall.
c) Identify a typical downstream cross-section, slope bed material and channel roughness. Where a model is being applied, if the receiving environment has an existing HCC Watercourse Assessment or Rapid Geomorphic Erosion Assessment Report, the results of this report should be used to inform the model of channel variables including: channel geometry, bed material and bank material.
d) Apply standard channel hydraulics to the cross-section to get a relationship between the discharge and shear stress.
e) Develop the relationship between shear stress and erosion rate. f) Combine this with the discharge/shear stress relationship to get a
discharge/erosion relationship. g) Apply the output hydrographs from the hydrological simulations to get the
discharge/erosion curve to get the long-term time series of erosion rate. h) Calculate the long-term erosion with and without the new project to
determine whether the intended development will make erosion worse. i) Council could allow for another method of calculating erosion potential
through the use of NIWA's 2004 A Guide for Assessing the Effects of Urbanisation on Flow-related Stream Habitat.
Volume control uses the same volumes as recommended for detention but then infiltrates or otherwise uses (water tanks, designed evapotranspiration) the runoff. Stream erosion issues are applicable where:
There is a natural stream, and
Catchment imperviousness exceeds 3%, and
There is potential for future development to increase stream channel instability, and
There is no tidal influence to the stream where the new development discharges to it.
7.2.8 Lands within and draining into Hamilton City Council jurisdiction
It may not always be possible to have sufficiently detailed information to model channel velocity and then define when the threshold is reached as per table 7-3 and as described in Section 7.2 “to develop and discharge/erosion relationship” to define an appropriate extended detention volume. This is particularly true of urbanised channels which display a high degree of channel cross sectional variability (constriction/expansion), via modification, infilling, lining and straightening. This results in high velocity variability and localised scour e.g. Erosion hot spots. Therefore, a precautionary approach is preferred for all channel types as listed in Table 7-3, within and draining to Hamilton City, other than those channels which are lined both bank and bed or are bedrock bank and bed. This would simply mean all other channels require some level of protection / resilience works and extended detention volume as per 3b above of Section 7.2.7 should be calculated and applied. Additionally, where catchment development results in an increase in discharge rate, the volume, frequency and event period also increase. On this basis channel protection / resilience works are likely required as erosive force is increased and the channel is assumed to be affected by residual effects. Stream protection / resilience measures may be in the form of protecting banks and bed through remedial works, such as planting, green treatments, such as biodegradable geotextiles and as required more engineered solutions, including grade control structures and bank strengthening.

Doc # 11854602 Page 103
Within Hamilton City Council jurisdiction limits this may mean the requirement for a financial contribution to erosion prevention / watercourse resilience works, via a Development Contribution or similar.
Water quality design There are several items that need to be considered when discussing stormwater quality design. These items include:
General sizing requirements
Effluent limits versus best practicable option (BPO)
7.3.1 General sizing requirements
The size of stormwater runoff event to be captured and treated is a critical factor in the design of stormwater quality treatment devices. If the design runoff event is too small, the effectiveness of the device will be reduced because too many storms will exceed the capacity of the device. If the design event is too large, the smaller runoff events will tend to empty faster than desired or the cost of the device will be greater than the benefit that it provides. Analytical work to determine optimal policies for rainfall capture81 has indicated that there is a maximised point of runoff volume capture at approximately the 90th percentile storm. The 90th percentile storm is that storm that 90% of all storms on an annual basis are less than. The use of the 90th percentile storm has become widespread throughout the United States. In the Auckland Region, similar work was undertaken based on rainfall information taken from the Botanic Gardens at Manurewa from 1983 to 199082. The frequency distribution of rainfall for events greater than 2 mm is shown in Figure 7-5.
Figure 7-5: Frequency distribution of runoff events82
81 Clar et al, 2004 82 Auckland Regional Council, 1992

Page 104 Doc # 11854602
As an example of the information gained by the use of this figure, the distribution indicates that for a storm depth of 25 mm:
95% of events would have a lesser depth
80% of the storm volume would be captured if a device could capture up to 25 mm of rainfall
Events with a total rainfall depth less than 25 mm have a cumulative rainfall depth of 60% of total rainfall.
Rainfall in the Waikato Region is highly variable. Figure 7-6 shows the 90th percentile storm distribution in the Waikato Region83. A good representation of the 90th percentile storm in a specific location can be found by using NIWA’s High Intensity Rainfall Design System (HIRDS) Version 3 where 1/3 of the 2-year 24-hour rainfall event for a given latitude/longitude approximates the 90th percentile storm. The water quality volume is the stormwater runoff volume determined by calculating the runoff volume from 1/3 of the 2-year 24-hour rainfall at a given location. If the water quality rainfall exceeds 30 mm then 30 mm should be used to calculate water quality volumes. The reasoning for this relates to the steep nature of catchment slopes in portions of the region where higher intensity rainfall occurs (i.e. the Coromandel Peninsula) and the difficulty in sizing practices on those slopes that would need to meet greater rainfall/runoff volumes. From this point on this volume will be identified as the water quality volume.
Figure 7-6: 90th percentile storm at different locations within the Waikato Region
If nutrients are a concern in a lake catchment, it is important that adequate water quality treatment is provided to ensure the nutrients are removed and that they don’t accumulate in the lake. Hence it is considered that two devices in series are required to achieve adequate nutrient removal in sensitive lake catchments. It is important that appropriate devices are selected that target removal of the contaminants of concern. For example, wetlands achieve nitrogen removal through de-nitrification processes involving anaerobic conditions promoting de-nitrification, however pH can be reduced in wetlands causing other contaminants to mobilise such as phosphorus and heavy metals. Hence if phosphorus and nitrogen are a concern, then a
83 New Zealand Transport Agency, 2008

Doc # 11854602 Page 105
device would be required that achieves phosphorus removal such as a raingarden, followed by a wetland to target nitrogen removal.
7.3.2 Effluent limits versus best practicable option
A common approach to determining compliance with consents is the use of a Best Practicable Option (BPO). Section 108(2)(e) of the Resource Management Act 1991 states that:
“A resource consent may include…a condition requiring the holder to adopt the best practicable option to prevent or minimise any actual or likely adverse effect on the environment of the discharge and other discharges (if any) made by the person from the same site or source”
As discussed in Section 1.3, generally a BPO approach is considered acceptable when determining a stormwater management system for a proposed development. However there are situations where the sensitivity of the downstream receiving environment or the scale of proposed development necessitates a more determinative approach, i.e. a science based assessment of potential effects and development of a stormwater management system that ensures effects are mitigated accordingly. Using a BPO approach that is in accordance with design guidance provided in this guideline is recommended. An applicant can propose an alternative approach to site development, however the applicant will be required to demonstrate that a comparable outcome is achieved, relative to the approach recommended in this guideline, in terms of mitigating and avoiding potential adverse effects to the receiving environment.
7.3.3 Water quality treatment criteria
The following requirements apply for stormwater quality design. 1. The water quality volume is the runoff volume from the 1/3 of the 2-year 24 hour
rainfall event at a given location. 2. The water quality volume should be used to determine storage volumes and flow
rates to size stormwater management devices. 3. In areas where the water quality event rainfall is greater than 30 mm, water quality
treatment should be designed using a rainfall depth of 30 mm to determine the water quality volume. This only applies to water quality criteria. Extended detention will require design for the full, un-adjusted volume.
4. Where nutrients are a contaminant of concern, for example in contained lake catchments, a treatment train approach must be used to improve nitrogen and phosphorus removal efficiencies. This is due to the limited ability of individual stormwater management devices to achieve significant removal of nitrogen and phosphorus on their own. This will necessitate at least two devices being used in series to improve nitrogen and phosphorus removal. Refer to Section 6.2.6 for more details about the use of a treatment train approach.
Summary of recommendations The following summarises the key design criteria for managing stormwater runoff from urban areas that are acceptable to Waikato Regional Council.
7.4.1 Peak flow control
There are five requirements related to peak flow control criteria: 1. Rainfall data used for all rainfall events shall have 24-hour rainfall distribution. 2. The rainfall data for the 2, 10 and 100-year ARI events should be increased for
the post-development scenario to allow for predicted climate change in accordance with Section 7.1.6.
3. Where there are existing downstream flooding issues, depending on the site’s position in the catchment (refer to Section 7.1.3), it is recommended that the post-

Page 106 Doc # 11854602
development peak discharge for the 100-year ARI rainfall event for a new development be limited to 80% of the pre-development peak discharge (unless there is a catchment study that demonstrates that this is not required).
4. In terms of intermediate storm control, depending on the site’s position in the catchment (refer to Section 7.1.3), the 2 and 10-year ARI post-development peak discharges shall not exceed the 2 and 10-year ARI pre-development peak discharges.
5. As discussed in Section 7.1.3, peak flow control is generally only recommended for projects located in the top half of catchments so as to avoid concerns over coincidence of peaks aggravating downstream flooding concerns. It is expected that stormwater design will be undertaken by experienced stormwater practitioners who will be able to determine whether peak flow control is required. If there is confusion regarding whether peak flow control is required, Waikato Regional Council staff can be contacted to discuss further.
7.4.2 Stream erosion control
There are four different approaches that address stream channel erosion: 1. It is recommended that the difference between the pre- and post-development
total volume for smaller storms up to the 2-year ARI event be retained (rainwater re-use, soakage or bioretention) where possible. There will be situations where this volume cannot be retained on site due to slope, water table or soil conditions. A minimum retention of the site pre-development initial abstraction from all impervious areas should be provided. If soil conditioning is not provided for intended pervious areas that have been earth-worked then the initial abstraction of runoff from the entire site should be retained as per the following method. The initial abstraction is rainfall and converting it to a volume of runoff for impervious surfaces is straightforward where the rainfall is assumed to be directly converted to runoff with no reduction in the amount. For pervious areas that are not rehabilitated, additional analysis is necessary. In those situations:
The pre-development runoff curve number (CN) is used to calculate the runoff volume for the area that will be pervious but not rehabilitated post-development.
The post-development CN should be determined assuming that the soil group is altered to account for soil disruption and compaction. Thus a group A soil should be considered as a B soil in post-development scenario (similar to a B becomes C, C becomes D).
Volumes for the given area are calculated in the pre- and post-development conditions for the water quality storm with the post-development rainfall including global warming increases and the volume to be retained represents the difference in runoff volumes. This volume is then combined with the impervious area retention volume to arrive at a total site retention volume.
2. Check the 2-year stream velocities against Table 7-3 to ensure that velocities are non-erosive. If they are non-erosive in the post-development condition assuming maximum probable development of the catchment, then no extended detention is required. If stream velocities are predicted to be erosive then criteria are provided in items 3 and 4 below.
3. Implement extended detention or volume control according to the following: a) If the stream is stable under the existing development condition, design
detention or retention storage for a 24-hour release of an equivalent volume to the water quality storm.
b) If the stream is not stable (refer to Section 7.2.5 above for further discussion), multiply the water quality volume by 1.2 to determine the extended detention volume. That volume is then stored and released over a 24-hour period.

Doc # 11854602 Page 107
c) The relationship between initial abstraction (Ia) and the water quality volume and extended detention should be considered jointly. The water quality volume and the extended detention volume can be reduced by the retained initial abstraction volume. If retention is provided for the full 2-year ARI event for a site, then no extended detention is required for smaller storms, and water quality would be considered to be addressed as well.
4. This item is for those situations where catchment development has already essentially been completed or for growth cell planning where a large proportion of the catchment is proposed to be developed and the effects of one more development can be determined. Only when item 4 is accomplished can consideration be given to modification of item 3 requirements. Conduct a shear stress analysis for a specific site by undertaking the following:
a) Conduct catchment modelling, i.e. continuous simulation, using land use, initial losses and time of concentration for the catchment in the pre-development condition without the proposed project. Another simulation will then have to be undertaken for the catchment with the development in place.
b) Input climate information including evaporation data and long-term rainfall.
c) Identify a typical downstream cross-section, slope bed material and channel roughness.
d) Apply standard channel hydraulics to the cross-section to get a relationship between the discharge and shear stress.
e) Develop the relationship between shear stress and erosion rate. f) Combine this with the discharge/shear stress relationship to get a
discharge/erosion relationship. g) Apply the output hydrographs from the hydrological simulations to get the
discharge/erosion curve to get the long-term time series of erosion rate. h) Calculate the long-term erosion with and without the new project to
determine whether the intended development will make erosion worse. i) Council could allow for another method of calculating erosion potential
through the use of NIWA's 2004 A Guide for Assessing the Effects of Urbanisation on Flow-related Stream Habitat.
Volume control uses the same volumes as recommended for detention but then infiltrates or otherwise uses (water tanks, designed evapotranspiration) the runoff. Stream erosion issues are applicable where:
There is a natural stream, and
Catchment imperviousness exceeds 3%, and
There is potential for future development to increase stream channel instability, and
There is no tidal influence to the stream where the new development discharges to it.
7.4.3 Water quality treatment
The following recommendations are made: 1. The water quality volume is equivalent to the stormwater runoff volume from 1/3
of the 2-year 24-hour rainfall event across a defined area at a given location. 2. The water quality volume should be used for determining storage volumes and
flow rates in sizing stormwater management devices.

Page 108 Doc # 11854602
3. In areas where the rainfall for the water quality event is greater than 30 mm, a rainfall depth of 30 mm can be used to determine the water quality volume for water quality treatment. This only applies to water quality. Extended detention will require design for the full-unadjusted rainfall depth.
4. Where the receiving environment has existing nutrient issues (for example in contained lake catchments) at least two devices should be used in series to improve removal of nitrogen and phosphorus from the stormwater discharge.

Doc # 11854602 Page 109
8 Stormwater management device design
Introduction The sections up to now have provided the foundation for the need to consider stormwater management, the types of devices that can be used, analytical approaches and recommendations for the form that management should take from a flooding, erosional and water quality perspective. This section is devoted to detailed design approaches for stormwater quantity and quality control. The section will be broken up to discuss several different areas as follows:
Source control
Designing for ease of operation and maintenance
Designing for safety, and
Flow and treatment control.
Source control Prior to any consideration of stormwater treatment, consideration should be given to source control and a series of questions answered:
Have building materials been used that minimise leaching of contaminants?
Has existing vegetation been preserved to the degree practicable or has vegetation been re-established upon project completion?
Are flow velocities and volumes increased downstream (energy dissipation)?
Has slope disturbance been minimised and have disturbed slopes been vegetated and slope lengths minimised through the use of cut-off drains?
Can concentrated flow areas be minimised?
Are any cross drains combined and considered for erosion protection? When these types of questions have been considered and addressed, the stormwater management device selection process then moves on to flow and treatment control.
Designing for ease of operation and maintenance As well as water quality and water quantity control, another key element that must be considered during the design phase is operation and maintenance of the device. There are several key elements that must be considered during the design phase. Asking and answering some questions or giving serious consideration to operation of the stormwater device and system can answer them.
Spend a year at the device
Asking maintenance questions such as who, what, when, where and how, and
Considering the use of uniform materials or components.
8.3.1 Spend a year at the practice
The stormwater designer must imagine conditions at the completed device throughout an entire year. This should not only include rainy and sunny weather but also consider time of year when evapotranspiration rates are different. Other site conditions may include hot, dry weather or drought when vegetation is stressed or dies. Finally, for safety purposes, the designer should also imagine what the system would be like at night.

Page 110 Doc # 11854602
As these conditions are visualised, the designer should also imagine how they might affect not only the operation of the device itself, but also the people that will maintain it or otherwise interact with it. Will the outlet structure trash rack be prone to clogging from vegetation or debris floating in the stormwater runoff? Is there a safety issue related to maintenance for maintenance employees? This approach is intended to assist the designer to consider and design for possible conditions at the practice, not just for specific storm events.
8.3.2 Maintenance questions
Another key element of design should involve asking specific questions that focus on operation and maintenance characteristics or functions of the practice. The questions should include at least:
1. Who will perform the maintenance? Does the design of the device require operation and maintenance specialists or will someone with general maintenance equipment and training be able to accomplish it?
2. What needs to be maintained? A list of device components that are part of the design may prompt a revised design with either a shorter list or one that modifies a device component to facilitate maintenance. An example of this could be a sand filter system that has heavy covers that are not easily removed by hand or require a specialised piece of equipment to lift the covers.
3. When will maintenance need to be performed? Does maintenance have to be undertaken once a day, once a week, monthly or annually? The recurring costs of maintenance can be substantial. In addition, can maintenance only be undertaken during dry weather? If so, what happens during the lengthy time periods of wet, rainy weather? In terms of effort and possible consequences, it is easier for the designer to provide answers to these questions now rather than having the maintenance personnel having to develop an approach later.
4. Where will maintenance have to be performed? Recognising that these devices/practices are being implemented for new developments within larger development areas, there will always be potential interaction with the public and safety concerns that have to be addressed. Will the maintainer be able to gain easy access to the device? Once there, will they have a stable, safe place to stand and work? Can the design provide a means for the maintenance contractor to reduce the time on site to conduct maintenance inspections and perform maintenance?
5. How will maintenance be performed? The simple instruction to remove sediment or harvest vegetation can become complicated if there hasn’t been any provision made to allow equipment access to the device or even to the site. Are locks used to limit public access to a practice? If security features are used then there has to be a common key to allow easy access. Stormwater devices cannot become a liability to the local community.
8.3.3 Uniform materials or components
Specify materials that will last for as long as the life expectancy of the stormwater management device might be. If further development is anticipated in 15 years than materials used should last 15 years. Reducing construction costs may have a significant adverse impact on long-term maintenance costs. It is absolutely essential that the designer consider these issues during the design phase so they can be addressed now rather than being left for later resolution. The design

Doc # 11854602 Page 111
phase may be the shortest amount of time given to a given project when considering construction time and whole-of-life aspects of a development and its stormwater management practices. It is vital that the design attempts to minimise future maintenance obligations and cost while providing for proper protection of downstream areas.
Designing for safety As discussed in Auckland Council’s GD0184, safe design, integrating health and safety risk identification and assessment methods through the design, should begin early in the design process to eliminate or minimise the risk of death, injury or illness to those who may interact with stormwater management assets. The goal is to eliminate hazards wherever possible. Where this cannot be achieved, the risks are to be minimised as much as practicable. Construction site-safety risk management is essential. However the opportunity to eliminate or reduce a hazard in the design stages, by involving decision makers and considering the life cycle of the project, is invaluable in reducing safety risks. This requires effective collaboration between designers, health and safety professionals, operation and construction staff and other parties such as developers and project managers. Safe design begins in a projects conceptual and planning phases with emphasis on making the right choices about the design, methods of construction, on-going operation and maintenance and materials. Any residual risks remaining at the end of the design phase should be identified to allow them to be addressed or managed during the projects next phases. Table 9 in GD01 presents some examples of safety in design considerations.
84 Cunningham A et al, 2017

Page 112 Doc # 11854602
Specific design guidance for stormwater management devices Specific design guidance is provided in this section for the following devices:
Swales
Filter strips
Sand filters
Bioretention
Infiltration
Wet ponds
Wetlands
Green roofs
Water tanks
Conditioning of soil
Oil and water separators These devices are all considered applicable for new development. Prioritisation of this list is difficult as each device has value, but one or more may be more appropriate in a given catchment. For example, swales, filter strips, sand filters, bioretention devices and oil and water separators are primarily water quality devices with limited ability to address water quantity issues. Wet ponds and wetlands can provide good water quantity control but wet ponds have a limited ability to remove hydrocarbons and soluble metals. One device that is good for both water quantity and water quality control is wetlands. Their organic substrate, density of vegetation and ability to provide live storage for water quantity control makes them suitable for both water quantity and water quality control. The major drawbacks of wetlands are the area that they require and the need to have a catchment area large enough to support hydric soils. Wetlands should be considered whenever peak control or stream erosion protection is a design objective.

Doc # 11854602 Page 113
8.5.1 Swales
Swales are a very appropriate device adjacent to roads and throughout new developments. They can easily occupy a linear corridor without taking up much additional space. They can also take the place of conventional stormwater conveyance systems. Although swales may vary in their purpose in different areas, their overall objective is to slow stormwater flows, capture contaminants and possibly reduce the total volume of stormwater runoff. Water quality treatment can be provided by passing stormwater flows through vegetation. Passage through vegetation and providing contact with organic matter allows physical, chemical and biological processes to occur that reduce contaminant delivery downstream. A key factor in vegetated swale water quality performance is the residence time that the water takes to travel through the swale. Residence time depends on the following items:
The longitudinal slope of the swale,
The cross-sectional area of the swale, and
Velocity of the flow The velocity of flow is a function of the flow area, slope and frictional resistance of the vegetation and a common equation for calculating velocity is Manning’s Equation.
V = R0.67s0.5/n Where: V = Average velocity in metres/sec. R = the hydraulic radius of the swale in metres s = slope of the swale in metres/metre n = Manning coefficient of roughness
Residence time can then be determined by the following equation: t = L/V Where: t = residence time in minutes (divide result by 60 sec/m) V = velocity of flow at the design rate of flow in metres/sec. L = swale length in metres
Basic design parameters
The following Table 8-1 should be used for swale design elements.

Page 114 Doc # 11854602
Table 8-1: Swale design elements Design parameter Criteria
Longitudinal slope < 5% Maximum velocity 0.8 m/s for water quality storm Maximum water depth above vegetation
The water quality design water depth should not exceed design height for grass. This is a key criterion for ensuring Manning roughness coefficient is provided.
Design vegetation height* 100 - 150 mm Manning coefficient 0.25 for WQ storm, 0.03 for
submerged flow (10-yr. Storm) Maximum bottom width 2 m Minimum hydraulic residence time
9 minutes
Minimum length 30 m Minimum swale bottom width 0.3 m Maximum catchment area served
4 hectares
Maximum lateral slope 0% Maximum side slope 4 H:1V (shallow as possible for
mowing purposes) Where longitudinal slope < 2% Perforated underdrains shall be
provided Where longitudinal slope > 5% Check dams shall be provided
to ensure effective slope < 5% Where concentrated flows enter the swale (from pipes)
Level spreaders shall be placed at the head of the swale to disperse flows
10-year storm velocities < 1.5 m/s unless erosion protection is provided
* This applies to normal grasses. Other vegetation, such as Oioi can provide improved performance with reduced maintenance frequency.
There are several points that need some discussion and they include:
Residence time
Manning’s coefficient of roughness, and
Lateral inflow.
Residence time
There have not been many studies that relate water quality performance in swale design. The most recognised work has been undertaken in the U.S.85. That study recommended a residence of 9 minutes for flow to pass through the swale and provide approximately an 80% removal of total suspended solids. Most government agencies in the United States have adopted that criterion. A 9 minute residence time is recommended for use to design swales in the Waikato. Residence time is seemingly more important for sediment reduction than it is for nutrient reduction. Investigations in Brisbane86 have indicated that concentrations of total suspended solids continue to decrease over swale length and do not reach an asymptote. For total phosphorus and total nitrogen, however, there is a very rapid decrease in concentration within the first quarter of the swale length, after which a relatively constant concentration is maintained.
85 Metropolitan Seattle, 1992 86 Fletcher et al, undated

Doc # 11854602 Page 115
Manning’s coefficient of roughness
Determining roughness coefficients is more art than science. Many design handbooks provide one value for Manning’s coefficient of roughness of 0.287 or 0.2588. Auckland Regional Council funded a study89 where dye tests were undertaken on a swale to determine “n” by measuring flow times through the swale. In all of the test trials the values of Manning’s coefficient of roughness varied from 0.18 - 0.30. It is recommended that a standardised value for Manning’s roughness coefficient of 0.25 be used when designing swales. For the 10-year ARI event analysis, it is assumed that the vegetation is submerged so the coefficient of roughness is reduced accordingly. The value selected is 0.03 for flow above grass elevation90.
Swale inflow
There are two common ways that flow enters swales: via concentrated flow or dispersed lateral inflow. Where there is concentrated inflow, erosion control should be used similar to that shown in Figure 8-1 below. In addition to lateral flow diversion, Table 6-10 also illustrates the use of check dams along a swale.
Figure 8-1: Swale with check dams and diversion of lateral inflow91
A common concern with swales having lateral inflow from site areas is that the entire flow does not achieve the 9-minute residence time. It is required that an average residence time of 9 minutes is achieved. There will be areas in the upper part of the swale that may exceed the required residence time, and areas in the lower portions of the swale where residence time may not be met, however the average residence time is appropriate in light of the benefits that swales provide.
Detailed design procedure
The design approach takes the designer through a series of steps that consider swale performance for water quality treatment and consideration of larger flows to ensure that scour or resuspension of deposited sediments does not occur.
1. Estimate runoff flow rate from the water quality storm. One difference between swale and filter strip design and other stormwater management devices is that they are designed by flow rate, which is based on 1/3 of the 2-year 24-hour rainfall event. Other devices are designed by calculation of the water quality volume.
87 Metropolitan Seattle, 1992 88 California Stormwater Quality Association, 2003 89 Larcombe, 2003 90 Chow, 1959 91 Auckland Regional Council, 2003

Page 116 Doc # 11854602
As an additional guidance note relevant to designing swales, wetland swales and filter strips, it is necessary to assess the peak velocities for the water quality event, to ensure the devices are adequately sized. To enable the impact of retention to be incorporated into this assessment, it is recommended that the designer assumes the impervious surfaces have an initial abstraction that is equal to the pre-development initial abstraction, and calculate the peak flow rate, and then velocity, on this basis.
2. Establish the longitudinal slope of the swale. 3. Select a vegetation cover. It should be grass and would generally be either
perennial rye or fescue. 4. The value for Manning’s coefficient of roughness is 0.25 5. Select a swale shape. Two shapes are proposed as they ensure distributed flow
throughout the bottom of the swale. Triangular swales are not recommended as they concentrate flow at the bottom of the swale. Channel geometry and equations for calculating cross-sectional areas and hydraulic radius are provided under the individual configurations in Figure 8-2.
6. An assumption is made on the depth of flow in the swale for the water quality storm. This assumed depth is used for calculating the bottom width of the swale and cross-sectional area.
7. Use Manning’s equation for calculating dimensions of the swale by using first approximations for the hydraulic radius and dimensions for selected shape.
Q = AR0.67s0.5/n
Figure 8-2: Swale channel geometry92
By making some assumptions about depth and width ratios such as the hydraulic radius for a trapezoid approximating the depth (d), the bottom width of a trapezoid (b) equals the following:
b = (Qn/d1.67s0.5) - Zd The slope, depth, discharge and side slope are all known and b can be determined. Where:
Q = Design discharge flow rate (m3/s) 92 Auckland Regional Council, 2003

Doc # 11854602 Page 117
N = Manning’s n (dimensionless) s = Longitudinal slope (m/m) A = Cross-sectional area (m2) R = Hydraulic radius (m) T = Top width of trapezoid/parabolic shape (m) d = Depth of flow (m) b = Bottom width of trapezoid (m)
For a parabola, the depth and discharge are known so the top width can be solved for.
8. Knowing b (trapezoid) or T (parabola), the cross-sectional area can be determined by the equations in Figure 8-2.
9. Calculate the swale velocity from the following equation: V = Q/A
If V > 0.8 m/s repeat steps 1 - 9 until the velocity is less than 0.8 m/s. 10. Calculate the swale length (L in metres)
L = Vt(60 s/minute) Where: t = residence time in minutes.
Flows in excess of the water quality storm
It is expected that runoff from events larger than the water quality design storm will go through the swale. In that situation, a stability check should be performed to ensure that the 10-year, 24 hour ARI event does not cause erosion. For the 10-year storm, flow velocities should not exceed 1.5 m/s, although higher velocities may be designed for with appropriate erosion protection. When considering larger storms consideration must be given to increased rainfall values as a result of climate change, refer to Section 7.1.6.
Shallow or steeper slope situations
Where slopes are less than 2%, an underdrain must be used to prevent soils from becoming saturated during wet times of the year. Figure 8-3 provides a typical cross-section of the underdrain system ensuring that water passes through the invert of the swale, through a loam soil, then geotextile fabric and gravel prior to discharge through a 100 mm perforated pipe.
Figure 8-3: Swale schematic showing soils and underdrain93
93 New Zealand Transport Agency, 2010

Page 118 Doc # 11854602
Using an underdrain can be one method to meet extended detention requirements. In this case, the extended detention volume can pass through the permeable soil with an assumption of total drainage time being 24 hours. Where slopes exceed 5%, swales can only be used if check dams are included so that the ultimate slope between check dams is less than 5%. To determine the spacing between check dams the following equation is to be used.
𝐿𝑐𝑑 = ℎ𝑐𝑑
𝑠⁄ Where: Lcd = length between check dams (m) hcd = height of the check dams (m) s = longitudinal slope
Determining the number of check dams required for the swale is determined by the following equation.
𝑁 = 𝐿𝑙𝑐𝑑
⁄ Where N = number of check dams L = total length of the swale 𝑙𝑐𝑑 = length between check dams
When using check dams it is important to ensure that scour does not occur at the toe of the check dams. If in doubt, erosion control measures such as stone should be placed at the toes of the check dams to ensure stabilisation. Larger storms should be calculated assuming the storage behind the check dams is full and the overall slope of the flow would be the slope from the upstream top of the swale to the bottom.
Vegetation
For the most part, vegetation will consist of either perennial rye or fescue grass. There may be other forms of vegetation that would provide comparable or improved treatment effectiveness with less maintenance requirements. One type of grass is Oioi (Apodasmia similis) that is a very dense grass that grows by rhizome and can become a thick filter media that you do not need to mow.
Swale using Oioi grass reduces maintenance and can be an attractive amenity
Case study - Swale
Project description A small residential development in Huntly is proposed with its expected imperviousness being 50%. The development is two hectares in size with average lot sizes being 500 m2. Predevelopment land use was a pasture and the average slope is 2%. Stormwater treatment for the site has a swale placed adjacent to one side of the site with all runoff traveling to that side.

Doc # 11854602 Page 119
Hydrology Pre-development discharges
Using the Waikato Stormwater Runoff Modelling Guideline: CN pre-development = 69 (orthic Brown Soil) 2-year 24-hour rainfall = 61.9 mm 10-year 24-hour rainfall = 92.7 mm
Pre-development 2-year peak discharge = 0.007 m3/s Pre-development 10-year peak discharge = 0.024 m3/s
These values are not used in sizing of swales but they are important when peak flow control is required. Where required, retention or detention will be necessary, which will involve a device, or devices, to achieve peak flow control or extended detention. Post-development discharges
Post-development discharges must include a climate change factor. Pre-development rainfall – 2-year 24-hour rainfall = 61.9 mm Pre-development rainfall – 10-year 24-hour rainfall = 92.7 mm Adjustment factor for 2-year rainfall = 2.1 x 0.043 x 61.9 = 67.5 mm Adjustment factor for 10-year rainfall = 2.1 x 0.063 x 92.7 = 105 mm Water quality rainfall (1/3 of 2-year) = 22.5 mm
The swale will be designed for the water quality storm but must also be checked to ensure that 10-year non-erosive conveyance will be achieved. As water volumes are not needed for design of swales, the post-development total site peak discharges are the only hydrological calculations required. The pervious areas will have soil remediation provided so that the pre-development curve number is unchanged at 69. Ia = 5.7 mm. To calculate the impact that the increased initial abstraction retention has on water velocities, assume the impervious surfaces have an initial abstraction that is equal to the pre-development initial abstraction of 5.7 mm and calculate the peak flow rate. The increased initial abstraction for impervious surfaces has a very minor impact on the 10-year peak discharges that swales stability needs to be checked for.
Post-development water quality flow rate = 0.0036 m3/s Post-development 10-year flow rate = 0.06 m3/s
As there is minimal site grading, there is no significant compaction of pervious soils so the pervious post-development initial abstraction is maintained at 5.7 mm. The volumes associated with the initial abstraction on impervious surfaces results in a retention storage for impervious surfaces of 57.1 m3. The amount of storage Swale Design Slope of swale alignment = 0.015 Several assumptions have to be made regarding the swale, first of which is that the swale will have a trapezoidal design. Side slopes (Z) will then be recommended and an assumption of design storm depth should be made. That value may change depending on the velocity of flow being less than 0.8 m/s. For this case study, Z = 4 and the depth of flow = 100 mm, which is also the design height of the grass. Based on the value for Q and s, and the assumptions for n and d, solve for the swale bottom width (b).
b = (Qn/d1.67s0.5) - Zd b = ((.0036)(.25)/(.11.67)(.0150.5)) - (4)(.1) = -0.25m which indicates that the swale capacity does not meet the minimum bottom width requirement. In this case, the bottom width is

Page 120 Doc # 11854602
0.3 m as detailed in Table 8-3. If the swale width had exceeded 2 m, the depth of vegetation could have been increased to 150 mm as long as the grass could remain standing during storm flow. Calculate the top width
T = b + 2dZ = 0.3 + 2 (0.1) (4) = 1.1 m Calculate the cross-sectional area
A = bd + Zd2 = (0.3) (0.1) + 4 (0.12) = 0.07 m2 Calculate the flow velocity
V = Q/A = 0.0009 / 0.07 = 0.01 m/s which is well under than the 0.8 m/s maximum - good.
Calculate the swale length L = Vt = 0.12 (540 sec.) = 5.4 metres
As the swale will probably have larger flows pass through it, the swale design can be adjusted to account for the larger flows. In this situation the Manning coefficient of roughness will have to be decreased, as flow will be above the grass height so assume n = .03 as the vegetation is completely submerged. Solve for d and ensure that velocities are not erosive. Q10 = 0.231 m3/s. The following Table 8-2 relating flow depth to Manning’s n to discharge provides information on swale flow under larger flow conditions. Table 8-2: Flow depth vs. Manning’s n versus discharge
Flow depth (m) Manning’s n Discharge (m3/s) 0.1 0.25 0.0009
0.1 - 0.3 0.03 0.158 Total Discharge 0.159
Even adding only 200 mm to the swale depth provides for conveyance considerably beyond the 10-year event of 0.06 m3/s. In terms of ensuring that the velocity is not greater than 1.5 m/s the swale design is adequate.

Doc # 11854602 Page 121
8.5.2 Filter strips
Description: Filter strips are uniformly graded and densely vegetated to treat stormwater runoff by the following:
Filtration Infiltration Adsorption, and Biological uptake
The major difference between swales and filter strips is that swales accept concentrated flow while filter strips accept flow as distributed or sheet flow. Filter strip performance also relies on residence time that stormwater flows take to travel through the filter strip and the depth of water relative to the height of vegetation. Good contact with vegetation and soil is required to promote the operation of the various mechanisms that capture and transform contaminants, so spreading flow in minimal depth over a wide area is essential. They are well suited for treating runoff from small impervious surfaces and for use as a pre-treatment device for other devices such as a sand filter or wetland. A key element of filter strips is that they rely on vegetation to slow runoff velocities. If stormwater runoff is allowed to concentrate, it effectively short-circuits the filter strip and reduces water quality benefits. Filter strips are simple designs that must withstand the full range of storm events without eroding.
Basic design parameters
The following Table 8-3 should be adhered to in designing a filter strip. To be effective, filter strips require sheet flow across the entire strip. Once flow concentrates to form a channel, it effectively short-circuits the filter strip. Unfortunately, this usually occurs within a short distance for filter strips in urban areas. It is difficult to maintain sheet flow over a distance of 45 m for pervious areas and 23 m for impervious areas. This may be due in part to the inability to obtain evenly compacted and level soil surfaces using common construction methodology. For some applications, a level spreader can be used to help ensure even distribution of stormwater onto the filter strip.

Page 122 Doc # 11854602
Table 8-3: Filter strip design elements Design parameter Criteria Longitudinal slope 2% - 5%
Maximum velocity 0.4 m/s for water quality storm Maximum water depth above vegetation
The water quality design water depth should not exceed ½ of the design height for grass. This is a key criterion for ensuring Manning roughness coefficient is provided.
Design vegetation height 100 - 150 mm Manning coefficient 0.35 for WQ storm, 0.03 for
submerged flow (10-yr. storm) Minimum hydraulic residence time
9 minutes
Minimum length Sufficient to attain residence time
Maximum catchment area served
2 hectares
Maximum lateral slope 2% Where longitudinal slope < 2% Filter strips are not
recommended for slopes less than 2% unless they are designed for infiltration of runoff
Where longitudinal slope > 5% Level spreaders shall be provided to ensure effective slope < 5%
Maximum overland flow distance uphill of the filter strip
23 m for impervious surfaces 45 m for pervious surfaces
Where concentrated flows enter the swale (from pipes)
Flows entering a filter strip cannot be concentrated. If this is the situation, level spreaders must be used to disperse flows
10-year storm velocities < 1.5 m/s unless erosion protection is provided
Detailed design procedure
A schematic of a filter strip is shown in Figure 8-4. The schematic shows a collection trench and a level spreader if the flow is from a pipe. In this situation the dispersed flow is maintained across the width of the filter strip.

Doc # 11854602 Page 123
Figure 8-4: Schematic of a filter strip94
Design approach:
1. The first step is to calculate the discharge (Q) for the area draining to the filter strip. As an additional guidance note relevant to designing swales, wetland swales and filter strips, it is necessary to assess the peak velocities for the water quality event, to ensure the devices are adequately sized. To enable the impact of retention to be incorporated into this assessment, it is recommended that the designer assumes the impervious surfaces have an initial abstraction that is equal to the pre-development initial abstraction, and calculate the peak flow rate, and then velocity, on this basis.
2. Once the peak discharge is determined, that discharge can be entered into Manning’s equation to determine the width of the filter strip.
Q = AR0.67s0.5/n Where: A = Width of filter strip x depth of flow (determined by design grass height) W = Width of filter strip in metres
R = Depth of flow (due to very wide flow)(in metres) D = Depth of flow in metres = R S = Slope N = Roughness coefficient (0.35) w is known from individual site conditions so d = (Qn/ws.5).6
94 Delaware Department of Natural Resources and Environmental Control, 1997

Page 124 Doc # 11854602
3. Solve for d, based on knowing other design parameters and d must be less than
50 mm in depth. 4. Q = AV where A = wd so velocity of flow can be determined. 5. Once velocity is determined the length of filter strip can be determined by:
L = Vt
Where: L = Length in metres V = Velocity in m/s T = Time in seconds (540 seconds for 9 minute residence time)
Case Study – Filter strip
Project Description A residential home site is being constructed near Te Kauwhata with a filter strip to treat the access road in front of it. The slope of land adjacent to the access road is 3% and the road is 500 metres with a crown in the centre so the portion of road draining to the filter strip is 3.6 metres wide (1,800 m2). Hydrology Pre-development discharges
Using the Waikato Stormwater Runoff Modelling Guideline. Pre-development land use is pasture. CN pre-development = 79 (orthic Granular Soil – slow permeability C soil) Rainfall – 2-year 24 hour rainfall = 61.5 mm
10-year 24 hour rainfall = 94.2 mm Pre-development 2-year peak discharge = 0.002 m3/s Pre-development 10-year peak discharge = 0.004 m3/s These values are not used in sizing of filter strips but they are important when peak flow control is required. Where required, retention or detention will be necessary, which will involve a device, or devices, to achieve peak flow control or extended detention. The only runoff entering the filter strip originates from an impervious roadway of 1,800 m2. The initial pervious abstraction is 3.4 mm, which results in a retention volume of 6.1 m3 for the roadway draining to the filter strip. Post-development discharges
Post-development discharges must include a climate change factor. Pre-development rainfall – 2-year 24 hour rainfall = 61.9 mm Pre-development rainfall – 10-year 24 hour rainfall = 92.7 mm Adjustment factor for 2-year rainfall = 2.1 x 0.043 x 61.9 = 67.1 mm Adjustment factor for 10-year rainfall = 2.1 x 0.063 x 92.7 = 106.7 mm Qwq = 0.001 m3/s – with retention of Ia volume use Ia post-development as 3.4 mm. Q10 = 0.008 m3/s Filter strip design
1. Q = AR0.67s0.5/n
Where Q = Water quality discharge (0.001 m3/s) A = Area of filter strip = (w -width in m)(depth of flow - d - in metres) R = 0.05 m based on water quality storm and very wide flow path s = 0.03

Doc # 11854602 Page 125
n = 0.35
2. The width is given based on site conditions (75 m) so solve for y and ensure that it is less than 0.05 m.
d = (Qn/ws.5).6
You will know “w” based on local site conditions. For this example, assume w = 75 metres.
d = (0.001 (0.35) / 75 (0.03)0.5).6 d = 2 mm which is well under the maximum of 50 mm.
3. Calculate the flow velocity
V = Q/wd = 0.001 / 75 (0.002) = 0.007 m/s which is well under the maximum 0.4 m/s allowed.
4. Calculate the length of the filter strip.
L = Vt = 0.007 (540) = 3.78 metres in length.
As can be seen from this example, the filter strip width can be reduced substantially to adjust to site conditions. The two key elements are a maximum depth of flow during the water quality storm of 22.4 mm and a residence time of at least 9 minutes (540 seconds) to establish the length of the filter strip. In terms of a 2 or 10-year storm, the main concern is that velocities of flow not exceed 1.5 m/s. Going through an analysis of the 10-year storm (worst case scenario)
Q10 = 0.008 m3/s Again using Manning’s equation:
Q = AR0.67s0.5/n and solve for ‘d’ through the equation: d = (Qn/ws.5).6
As the depth of flow still does not exceed the grass height the same n factor will be used. If the width of the filter strip were smaller and the depth of flow would exceed the design grass height an appropriate roughness coefficient to be used would be n = 0.15
d = (0.008 (0.35) / 75 (0.03)0.5).6 d = 0.007 m
Using the value to ensure that the velocity of flow during a 10-year storm will not exceed 1.5 m/s
V = Q/wd = 0.008 / 75 (0.007) V = 0.02 m/s which is well under an erosive velocity.
The width of the filter strip could be reduced significantly if site conditions require.

Page 126 Doc # 11854602
8.5.3 Sand filters
Description: Sand filters are designed and constructed to capture and treat stormwater runoff through:
Sedimentation Filtration Volatilisation Adsorption, and Biological processes
Sand filters use filtration for treating stormwater runoff. They are similar to bioretention in that stormwater passes through a filtering media such as sand, gravel, compost or peat to filter out contaminants. They are especially suited for small catchment areas and are primarily water quality treatment devices having little water quantity benefit. Their most appropriate use is on commercial and industrial sites. Sand filters have been used to treat stormwater runoff for years, mainly because of sand filter effectiveness at removal of hydrocarbons. They are very suitable in ultra-urban environments where space is limited but are also used where more space is available in a similar fashion to ponds. As they are so effective at removal of finer sediments, they are prone to clogging and require maintenance on a more frequent basis than a device such as wetlands. They are primarily used for high percentages of impervious surfaces where the majority of sediments are in the coarse fraction.
Basic design parameters
Sand filters should have a forebay (or sedimentation chamber) where coarser sediments would be captured and a filtration chamber, having an underdrain, for removal of finer sediments and hydrocarbons. A major component of a sand filter is live storage above the sediment/filtration chambers for storage of stormwater until the water can soak through the sand. The following schematics provide a visual indication of how sand filters can be designed. They can be constructed similarly to ponds as shown in Figure 8-5, or an underground vault as shown in Figure 8-6 or as a linear filter as shown in Figure 8-7.
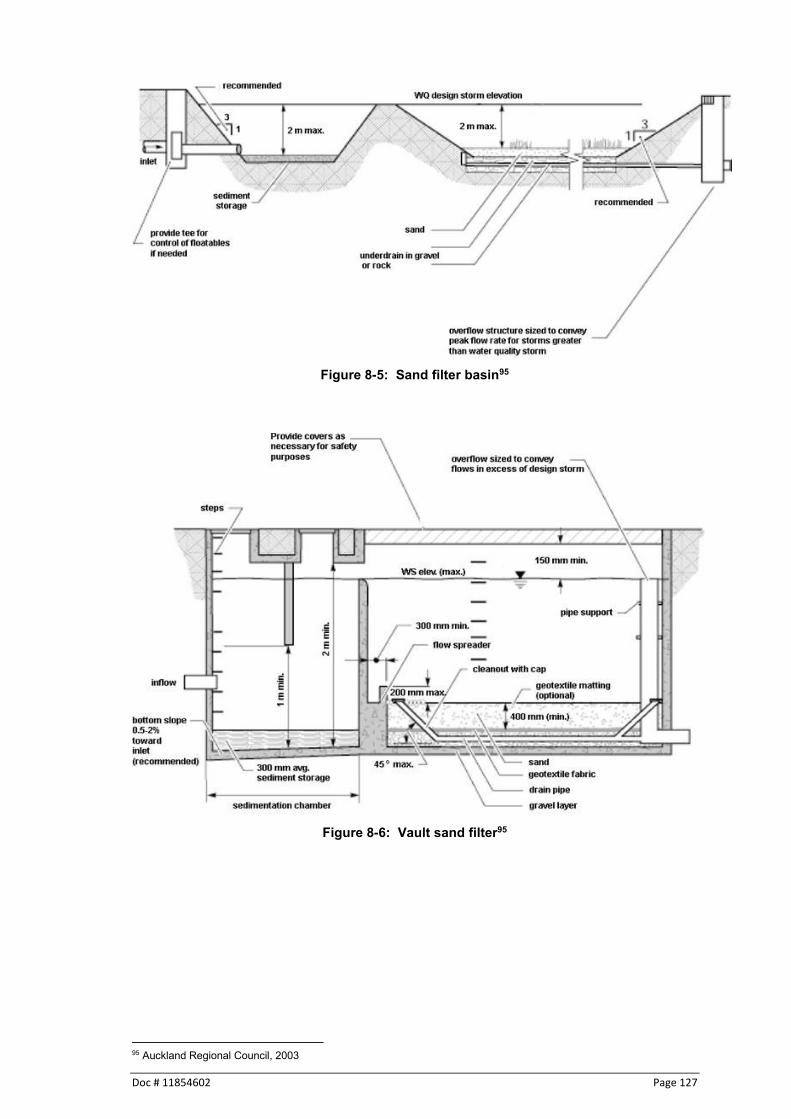
Doc # 11854602 Page 127
Figure 8-5: Sand filter basin95
Figure 8-6: Vault sand filter95
95 Auckland Regional Council, 2003

Page 128 Doc # 11854602
Figure 8-7: Linear sand filter95
The treatment process is the same for all three of the devices, but Figure 8-5 allows for peak flow control in addition to water quality treatment. The other two figures provide water quality control only.

Doc # 11854602 Page 129
An important consideration of sand filter performance is the diversion of larger flows around the filter. Having high flows enter the filter with an overflow in the filter will significantly reduce performance, as turbulent flow will allow for finer sediments to pass over the filter bed. In a similar fashion, hydrocarbons having a specific gravity less than water will pass over the filter into the overflow pipe. As sand filters generally have flow enter the filter in a concentrated flow conveyance a simple way to prevent contaminants from exiting the filter is to have a flow diversion structure placed prior to the sand filter. This is a simple design, especially when the flow into the filter is through a pipe.
Figure 8-8: Diversion weir95
Figure 8-8 provides a schematic of how the flow diverter can be designed so that the water quality storm passes through the sand filter and larger flows bypass it.

Page 130 Doc # 11854602
Figure 8-9: Large flow bypass schematic95
Figure 8-9 shows a schematic of how the system is arranged. Most street and road particulate matter is in coarser fractions. However, most stormwater contaminants are associated with fine particles. As sand filters have two chambers, the sedimentation chamber will remove the coarse sands and gravels while the filtration chamber will remove the finer silts and clays. Similarly to bioretention, use of sand filtration is considered to meet the recommended retention of the initial abstraction due to the practice being designed to drain over a two day period. This effectively separates the discharge from the sand filter from the cat
Detailed design procedure
Design approach: Calculate the water quality volume to be treated. Using a sand filtration practice meets the objective of retaining at least the initial abstraction recommendation. Having a time to drain of 2 days effectively separates the discharge from the bioretention practice from the catchment discharge.
1. A minimum of 37% of the water quality volume must be available as live storage to ensure that the water quality volume passes through the filter without bypassing.
2. The sand filtration chamber is sized by a variation of Darcy’s Law. Af = Vwqdf/k(h+df)tf
Where: Af = surface area of sand bed (m2) Vwq = water quality volume df = sand bed depth (m) k = coefficient of permeability for sand (metres/day) h = average depth of water (WQ storm) above surface of sand (m)
(1/2 max. depth tf = time required for runoff to pass through the filter (days)
The following values should be used.
tf = 2 days (maximum) k = 1 metre/day df = 0.3 metres (minimum)
Several points should be discussed regarding the values that should be used:
Time required to pass the water quality storm

Doc # 11854602 Page 131
The permeability rate selected Time required passing the water quality storm There are several reasons why this value was selected, as follows:
1. Having two days as a limiting value will ensure that the volume is available for the next storm. It should be recognised that these are averages and some fluctuation will occur.
2. Having the system drain within a two day period will prevent the development of biofilms on the surface of the sand, which would reduce permeability rates.
Permeability rate This is an issue that has controversy associated with it. Sand has a high permeability rate (refer to Table 6-2 for permeability rates) and the value selected is very low. Experience has shown that the initial high permeability rate rapidly reduces when contaminated stormwater runoff passes through the sand. The rate reduces to a level where it stabilises for a period of time before complete clogging occurs. The value generally accepted internationally is approximately one metre/day.
1. Size the sedimentation chamber with the following points in mind. a) Inflow into the chamber must not cause resuspension of previously
deposited sediments b) The sedimentation chamber outlet must deliver flow to the filtration
chamber as sheet flow c) The sedimentation chamber must be at least 25% of the filtration area d) Flow velocities in the sedimentation chamber are required to be below
0.25 m/s e) The sedimentation chamber must have a permanent pool with a minimum
depth of 400 mm to reduce potential for sediment resuspension f) The sedimentation chamber should be configured to avoid short-circuiting
of flow. 2. The sand specifications are provided in Table 8-4.
Table 8-4: Sand specification
Sieve size (mm) Percentage passing 9.5 100 6.3 95-100 3.17 80-100 1.5 50-85 0.8 25-60 0.5 10-30 0.25 2-10
There will be some variation in sand grades from the specified grades. However, a number are close to the lower limit and can be used. It is important to meet as closely as possible the specified limits as coarser aggregate will allow for more contamination migration and finer aggregate will clog more quickly. Recent work undertaken by the Facility for Advancing Water Biofiltration in Australia has indicated excellent TSS and metals removal with soil and sand-based filters that are non-vegetated96. Thus, it can be recommended that contaminants of greatest concern in Hamilton City (sediment and metals) could be effectively removed from stormwater discharges using sand filtration. A key
96 Facility for Advancing Water Biofiltration, 2008

Page 132 Doc # 11854602
element in the conclusion is that wetting and drying are key elements in treatment.
3. An under-drainage system shall be provided. The system will normally consist of perforated lateral pipes (150 mm diameter) that are placed in the gravel or stone layer that is under the sand. The depth of the gravel layer shall be at least 200 mm in depth with filter fabric between the gravel and sand to prevent migration out of the system.
Case study – Sand filter
Project description It is the intention to construct a parking lot having a surface area of approximately 2,000 square metres in Whangamata and the site has a 4% slope. Hydrology 1. The 2-year 24 hour storm is 192.8 mm so the water quality storm should be 64.3 mm
of rainfall. However for design purposes a design water quality storm of 30mm can be used (refer to Section 7.3.3).
2. Due to the site discharge being located in a tidal area there is no requirement to retain the initial abstraction volume or to do peak flow control.
3. Calculate the water quality volume to be treated using the Waikato Stormwater Runoff Modelling Guideline.
Vwq = 50.4 m3
Sand filter design 1. Live volume of storage needed Vlive = .37(50.4m3) = 18.6 m3 2. Sand filter surface Area - Assume that max. head, hp = 1 metre so h = 0.5 m
Af = Vwqdf/k(h+df)tf
We know the following: Vwq = 50.4 m3 df = 0.3 m k = 1 m/day h = 0.5 m tf = 2 days Af = (50.4) (0.3) / 1 (0.5 + 0.3) 2 Af =9.45 m2
3. Size sedimentation chamber has to have at least 25% of the surface area of the filter area = 2.4 m2. In reality it has to be larger due to the need to provide 37% live storage, which is 18.6 m3. If the designs live depth of storage is one metre then the volume above the combined filtration and sedimentation areas is 11.9 m3. Since the required live storage is 18.6 m3 then the combination of live storage in both the sediment chamber and filtration chamber must be increased by 6.7 m3. The designer can determine where that additional volume must be obtained, which could possibly include the pipe system draining to the filter. Another option is to increase the maximum head to increase flow through rate. This is only possible if a positive outfall can still be obtained.

Doc # 11854602 Page 133
8.5.4 Bioretention
Description: Bioretention devices are designed and constructed to capture and treat stormwater runoff through:
Sedimentation Filtration Infiltration (depending on soils) Adsorption, and Biological processes
Bioretention is a common term that is used internationally to describe the storage, passage and eventual discharge of stormwater to a receiving system. Bioretention is a description of a process whereby stormwater runoff is treated by passing the water through a soil media and then either the water evapotranspires, or the water infiltrates into the ground or providing a very slow release to surface waters when infiltration to ground cannot be achieved. For the purposes of meeting the retention of runoff associated with the initial abstraction of runoff from impervious surfaces, bioretention is considered to meet that requirement even if discharge to surface water is necessary due to site constraints. Bioretention operates by filtering stormwater runoff through a soil media prior to discharge into either the ground or a drainage system. The major pollutant removal pathways within bioretention devices are97:
Event processes - Sedimentation in the extended detention storage, primary sediments and
metals - Filtration by the filter media, fine sediments and colloidal particles; and - Nutrient uptake by biofilms
Inter-event processes - Nutrient adsorption and pollutant decomposition by soil bacteria; and - Adsorption of metals and nutrients by filter particles.
97 Somes and Crosby, 2008

Page 134 Doc # 11854602
To retain the filter media within the bioretention device and aid drainage, one or more layers are used at the bottom of the filter. The surfaces of most bioretention devices are planted with a range of vegetation. Figure 8-10 shows a schematic of a bioretention device highlighting key elements and flow paths. Bioretention design, as shown in Figure 8-10 differs only slightly from sand filter design. Where sand filtration relies on water quality treatment via passage of stormwater through sand, bioretention devices incorporate plants and soils for removal of contaminants. A downside of the use of plants and soils rather than sand is a reduction in the permeability rate. This results in bioretention devices being larger in surface area than sand filters.
Figure 8-10: Schematic of bioretention device key elements and flow paths98
Bioretention devices have more aesthetic benefits not provided by sand filter systems and provide greater water quality benefits for a wider range of contaminants as a result of additional biological processes provided by plants and organic soils.
Bioretention variations
The most commonly use bioretention device is the one discussed in the previous sections where the design services a variety of land uses. In addition though there are variations to the basic concept for more specialised uses.
Planter box
Tree pit, and
A swale modification to incorporate bioretention. Planter box Planter boxes are a variation to the traditional bioretention device in that they are ideally suited to accept roof runoff and they normally are above ground. Figure 8-11 shows the cross-section of a planter box.
98 City of Kingston, Melbourne, Australia
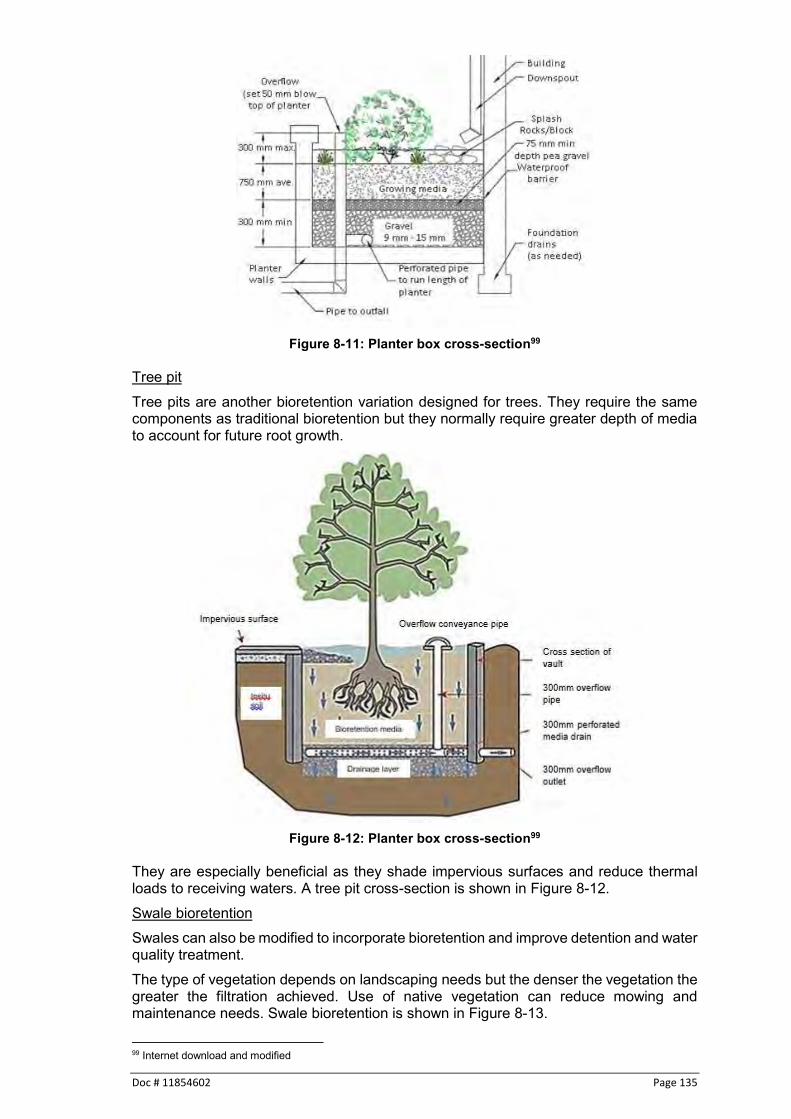
Doc # 11854602 Page 135
Figure 8-11: Planter box cross-section99
Tree pit Tree pits are another bioretention variation designed for trees. They require the same components as traditional bioretention but they normally require greater depth of media to account for future root growth.
Figure 8-12: Planter box cross-section99
They are especially beneficial as they shade impervious surfaces and reduce thermal loads to receiving waters. A tree pit cross-section is shown in Figure 8-12. Swale bioretention Swales can also be modified to incorporate bioretention and improve detention and water quality treatment. The type of vegetation depends on landscaping needs but the denser the vegetation the greater the filtration achieved. Use of native vegetation can reduce mowing and maintenance needs. Swale bioretention is shown in Figure 8-13.
99 Internet download and modified

Page 136 Doc # 11854602
Figure 8-13: Bioretention swale cross-section99
Basic design parameters
The main components of a bioretention device includes:
Grass filter strip for minor pre-treatment (where space is available)
Ponding area in the extended detention zone
Planting soils
Ground cover or mulch layer
Plant material
Underdrain system From an inflow perspective, it is important that flows not cause scour at the inlet of the practice. This can be undertaken easily if flow entry is dispersed but concentrated flow will require armouring to ensure stability. Depending on the natural soils in the area that the bioretention device has been placed, final discharge of stormwater can be to ground or through a drainage system to surface waters. This will depend on the permeability rates of the underlying soil, depth to groundwater or bedrock and the stability of any slopes that the additional water may be discharged within. In the situation where the eventual disposal of stormwater is to ground, testing of infiltration rates needs to be undertaken consistent with infiltration devices discussed in the next subsection. It is not recommended that geotextile filter cloth be used between the different media layers in the bioretention devices, as that will become a point of clogging in the filter. Proper installation of the various layers of media (including the drainage layer) will reduce potential migration of contaminants to the drainage system. Bioretention devices are designed as water quality devices and will generally not be used for water quantity control. If peak control is required and cannot otherwise be provided then consideration should be given to a constructed wetland that also provides peak control. Where nutrient capture is required, a variation to the conventional design will provide for nitrogen removal. Figure 8-14 provides design guidance for nitrogen removal. Providing a saturated zone will avoid nitrogen spikes following dry periods. Using a bioretention practice meets the objective of retaining at least the initial abstraction. Having a time to drain of 2 days effectively separates the discharge from the bioretention practice from the catchment discharge.
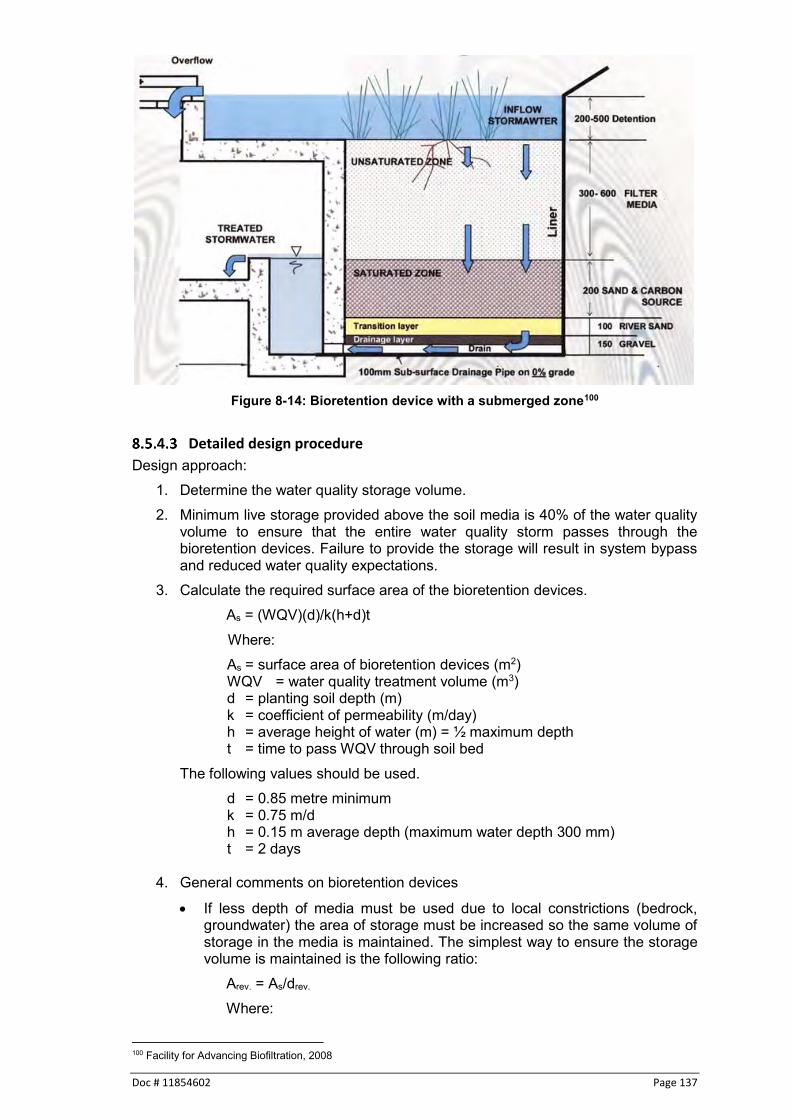
Doc # 11854602 Page 137
Figure 8-14: Bioretention device with a submerged zone100
Detailed design procedure
Design approach: 1. Determine the water quality storage volume. 2. Minimum live storage provided above the soil media is 40% of the water quality
volume to ensure that the entire water quality storm passes through the bioretention devices. Failure to provide the storage will result in system bypass and reduced water quality expectations.
3. Calculate the required surface area of the bioretention devices. As = (WQV)(d)/k(h+d)t Where: As = surface area of bioretention devices (m2) WQV = water quality treatment volume (m3) d = planting soil depth (m) k = coefficient of permeability (m/day) h = average height of water (m) = ½ maximum depth t = time to pass WQV through soil bed
The following values should be used. d = 0.85 metre minimum k = 0.75 m/d h = 0.15 m average depth (maximum water depth 300 mm) t = 2 days
4. General comments on bioretention devices
If less depth of media must be used due to local constrictions (bedrock, groundwater) the area of storage must be increased so the same volume of storage in the media is maintained. The simplest way to ensure the storage volume is maintained is the following ratio:
Arev. = As/drev.
Where:
100 Facility for Advancing Biofiltration, 2008

Page 138 Doc # 11854602
Arev = Revised surface area resulting from decreased depth As = Area of bioretention devices calculated in step 3 (m2) drev. = Actual depth provided/0.85
The coefficient of permeability will initially decline during the establishment
phase, as the filter media settles and compacts, but this will level out and then start to increase as the plant community establishes itself and the rooting depth increases.
Keep drainage areas small and avoid sizing them for too large a catchment area. It is better to have more bioretention devices than larger ones.
Place them in areas where they will not interfere with normal use of the property and where they don’t interfere with sight lines, which may present safety issues.
Where possible, design them as off-line systems so that larger flows do not scour the surface of the bioretention devices.
5. Composition of planting soil There are two options for planting soil.
Three layers per Facility for Advancing Water Biofiltration (FAWB) recommendation.
90% pumice sand with 10% organic matter. Filter media recommendation FAWB has been investigating filter media for several years and has developed the following recommendations for the composition of planting soil101. The bioretention filter media guidelines require three layers of media. The filter media itself (400 - 600 mm deep), a transition layer (100 mm deep) and a drainage layer (50 mm minimum) under drainage pipe cover. The filter media is required to support a range of vegetation types (from groundcovers to trees) that are adapted to freely draining soils with occasional flooding. The material should be:
Based on natural soils or amended natural soils and can be of siliceous or calcareous origin,
In general, the media should be loamy sand with an appropriately high permeability under compaction and should be free of rubbish, deleterious material, toxicants, noxious plants and local weeds and should not be hydrophobic.
The filter media should contain some organic matter for increased water holding capacity but be low in nutrient content.
Pumice sand with 10% organic matter recommendation Work recently undertaken for the Auckland Council102 provided an analysis of various filter media and demonstrated that pumice sand with organic matter can be effective at contaminant capture while providing reasonable saturated hydraulic conductivity. Material should:
Have an average bulk density of 0.505 g/cm3
Pumice sand should be well graded.
Pumice sand is brittle so compaction during installation must be avoided and water must be sprayed during installation to reduce potential particle crushing.
101Facility for Advancing Water Biofiltration, 2008 102 Fassman et al, 2013
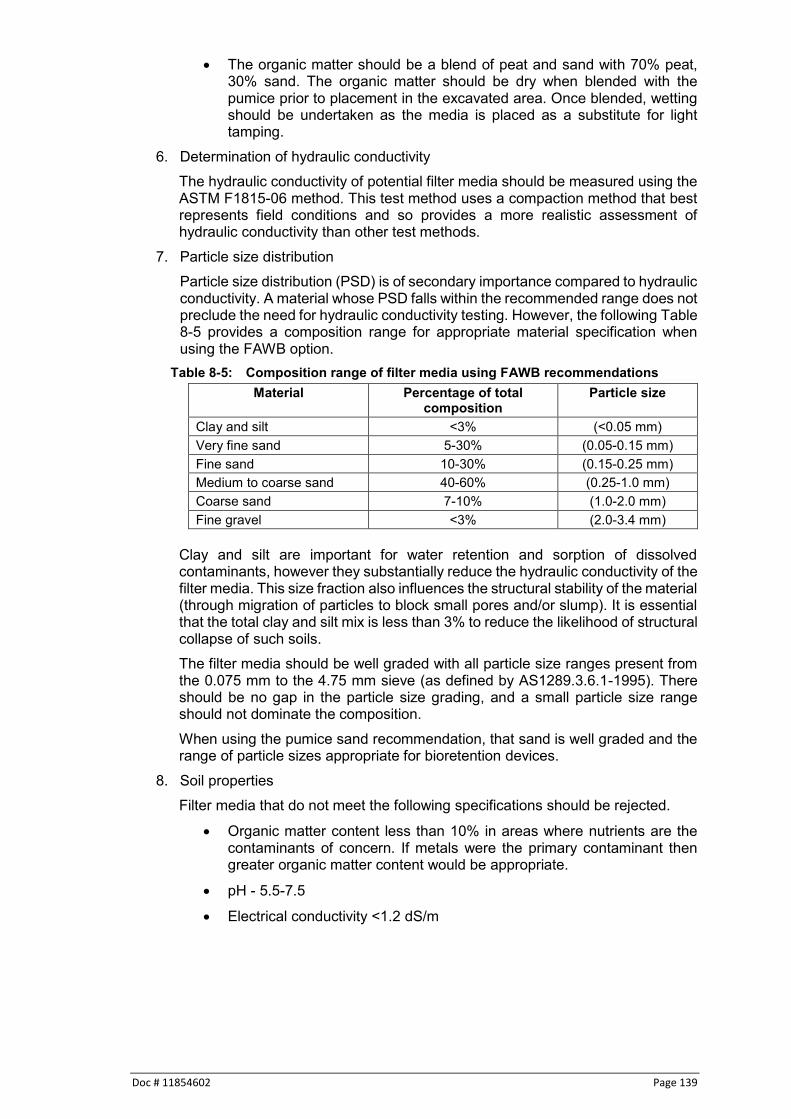
Doc # 11854602 Page 139
The organic matter should be a blend of peat and sand with 70% peat, 30% sand. The organic matter should be dry when blended with the pumice prior to placement in the excavated area. Once blended, wetting should be undertaken as the media is placed as a substitute for light tamping.
6. Determination of hydraulic conductivity The hydraulic conductivity of potential filter media should be measured using the ASTM F1815-06 method. This test method uses a compaction method that best represents field conditions and so provides a more realistic assessment of hydraulic conductivity than other test methods.
7. Particle size distribution Particle size distribution (PSD) is of secondary importance compared to hydraulic conductivity. A material whose PSD falls within the recommended range does not preclude the need for hydraulic conductivity testing. However, the following Table 8-5 provides a composition range for appropriate material specification when using the FAWB option.
Table 8-5: Composition range of filter media using FAWB recommendations Material Percentage of total
composition Particle size
Clay and silt <3% (<0.05 mm) Very fine sand 5-30% (0.05-0.15 mm) Fine sand 10-30% (0.15-0.25 mm) Medium to coarse sand 40-60% (0.25-1.0 mm) Coarse sand 7-10% (1.0-2.0 mm) Fine gravel <3% (2.0-3.4 mm)
Clay and silt are important for water retention and sorption of dissolved contaminants, however they substantially reduce the hydraulic conductivity of the filter media. This size fraction also influences the structural stability of the material (through migration of particles to block small pores and/or slump). It is essential that the total clay and silt mix is less than 3% to reduce the likelihood of structural collapse of such soils. The filter media should be well graded with all particle size ranges present from the 0.075 mm to the 4.75 mm sieve (as defined by AS1289.3.6.1-1995). There should be no gap in the particle size grading, and a small particle size range should not dominate the composition. When using the pumice sand recommendation, that sand is well graded and the range of particle sizes appropriate for bioretention devices.
8. Soil properties Filter media that do not meet the following specifications should be rejected.
Organic matter content less than 10% in areas where nutrients are the contaminants of concern. If metals were the primary contaminant then greater organic matter content would be appropriate.
pH - 5.5-7.5
Electrical conductivity <1.2 dS/m

Page 140 Doc # 11854602
9. Transition and drainage layers
The transition layer material shall be a clean, well-graded coarse sand material containing little or no fines. The drainage layer is to be clean, fine gravel, such as a 2-5 mm washed screenings. Figure 8-15 provides a profile of a bioretention devices giving indicated distances for the various media and underdrain. If pumice is the media of choice, the pumice can eliminate the need for a coarse sand layer but the depth of pumice should include the 100 mm additional depth that the transition layer would occupy. If the soils under the bioretention devices have high permeability, the underdrain can be eliminated and the device will function as an infiltration device with the filter media providing pre-treatment of runoff prior to infiltration.
Figure 8-15: Schematic of bioretention device103
103 Auckland Regional Council, 2003

Doc # 11854602 Page 141
10. Plant material Plants are important for nitrogen and phosphorus removal. They extract these macro-nutrients when actively growing; decomposing leaves and roots gradually release these but at a rate that can be re-used by the plants104. Consider the following when making planting recommendations:
Native plant species should be specified over exotic or foreign species
Appropriate vegetation should be selected on its ability to thrive in wet and dry conditions.
The following two tables (Table 8-6 and Table 8-7) provide some recommendations for plant species suitable for bioretention devices.
Table 8-6: Recommendations for trees and shrubs Trees and shrubs Descriptions
Brachyglottis repanda
rangiora Coastal shrub or small tree growing to 4m+. Large attractive pale green leaves with white fuzz on underside.
Coprosma acerosa
sand coprosma Grows naturally in sand dunes. Yellow, interlaced stems and fine golden foliage. Forms a tangled shrubby ground cover. Tolerates drought and full exposure. Prefers full sun.
Coprosma robusta / C. lucida
karamu, shining karamu
Shrubs or small trees growing to 3m+, with glossy green leaves. Masses of orange-red fruit in autumn are attractive to birds. Hardy plants.
Cordyline australis
ti kouka, cabbage tree Palm-like in appearance with large heads of linear leaves and panicles of scented flowers. Sun to semi-shade. Prefers damp to moist soil. Grows eventually to 12m+ height.
Cordyline banksii
ti ngahere, forest cabbage tree
Branching from the base and forming a clump. Long strap-shaped leaves with red-orange coloured veins. Prefers good drainage and semi-shade.
Corokia buddleioides
korokio
Bushy shrub to 3m, with pale green leaves with silvery underside. Many small bright yellow starry flowers are produced in spring. Prefers an open situation but will tolerate very light shade.
Entelea arborescens whau
Fast growing shrub or small tree (to 5m height) with large bright green heart-shaped leaves. Spiny seed capsules follow clusters of white flowers in spring. Handsome foliage plant
Geniostoma rupestre hangehange
Common forest shrub with pale green glossy foliage, growing to 2-3m. Tiny flowers give off strong scent in spring. Looks best in sunny position where it retains a bushy habit, and prefers well drained soil.
Hebe stricta koromiko
Shrub or small tree growing to 2-5m in height. Natural forms have white to bluish flowers. Many cultivars and hybrids available with other colours, but unsuitable for use near existing natural areas. Full sun.
Leptospermum scoparium manuka
Shrub or small tree growing to 4m+ in height. Natural forms have white to pinkish flowers. Many cultivars and hybrids available with other colours, but unsuitable for use near existing natural areas. Hardy and tolerant of difficult conditions.
Metrosideros robusta
rata Eventually forms a large tree. Flowers bright red in summer. Will tolerate dryness and exposure. Full sun.
Pittosporum cornifolium
tawhirikaro A slender branched shrub grown for its attractive fruiting capsules which are brilliant orange when split open. Sun or semi-shade.
Pittosporum kirkii A small tree with dark green leaves and large yellow flowers in the summer. Prefers shade
Pseudopanax crassifolius
horoeka Very narrow rigid and leathery leaves in its juvenile form. Stunning in amongst bold leaved plants. Sun or semi-shade.
Pseudopanax lessonii
houpara Small tree with attractive foliage. Tolerates full exposure and drought. Sun or semi-shade
104 Fassman et al, 2013
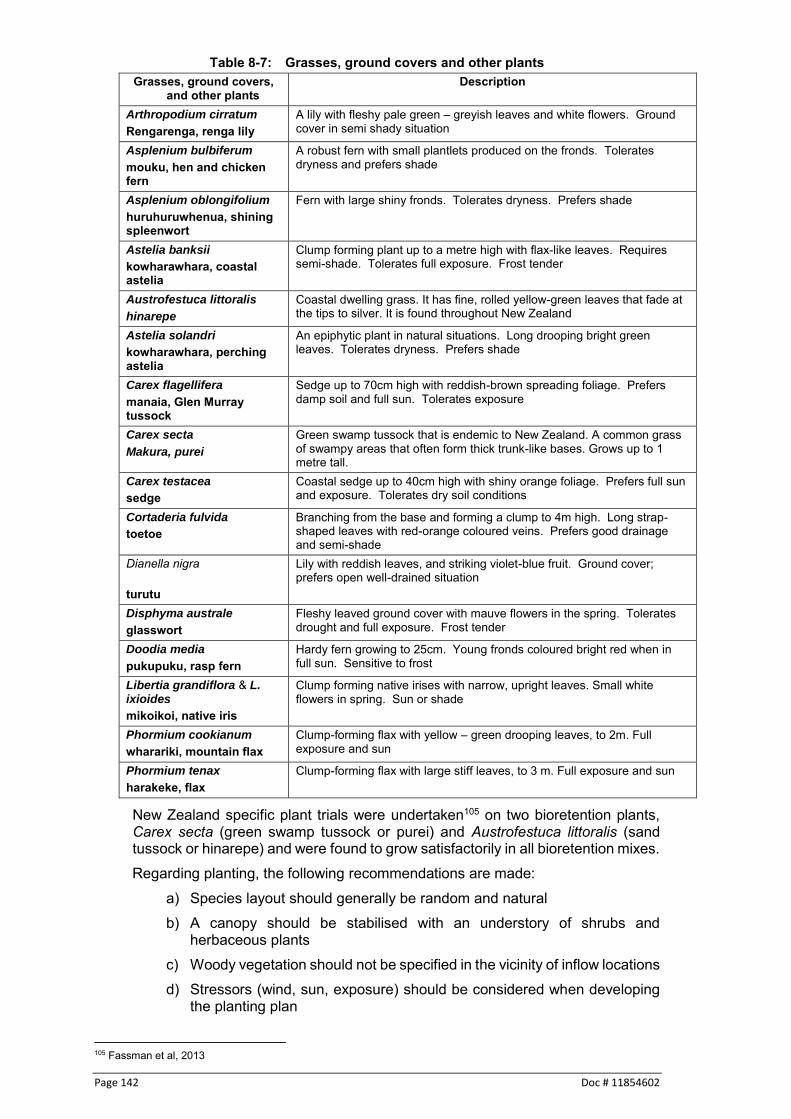
Page 142 Doc # 11854602
Table 8-7: Grasses, ground covers and other plants Grasses, ground covers,
and other plants Description
Arthropodium cirratum
Rengarenga, renga lily A lily with fleshy pale green – greyish leaves and white flowers. Ground cover in semi shady situation
Asplenium bulbiferum
mouku, hen and chicken fern
A robust fern with small plantlets produced on the fronds. Tolerates dryness and prefers shade
Asplenium oblongifolium
huruhuruwhenua, shining spleenwort
Fern with large shiny fronds. Tolerates dryness. Prefers shade
Astelia banksii
kowharawhara, coastal astelia
Clump forming plant up to a metre high with flax-like leaves. Requires semi-shade. Tolerates full exposure. Frost tender
Austrofestuca littoralis
hinarepe
Coastal dwelling grass. It has fine, rolled yellow-green leaves that fade at the tips to silver. It is found throughout New Zealand
Astelia solandri
kowharawhara, perching astelia
An epiphytic plant in natural situations. Long drooping bright green leaves. Tolerates dryness. Prefers shade
Carex flagellifera
manaia, Glen Murray tussock
Sedge up to 70cm high with reddish-brown spreading foliage. Prefers damp soil and full sun. Tolerates exposure
Carex secta
Makura, purei
Green swamp tussock that is endemic to New Zealand. A common grass of swampy areas that often form thick trunk-like bases. Grows up to 1 metre tall.
Carex testacea
sedge Coastal sedge up to 40cm high with shiny orange foliage. Prefers full sun and exposure. Tolerates dry soil conditions
Cortaderia fulvida
toetoe Branching from the base and forming a clump to 4m high. Long strap-shaped leaves with red-orange coloured veins. Prefers good drainage and semi-shade
Dianella nigra
turutu
Lily with reddish leaves, and striking violet-blue fruit. Ground cover; prefers open well-drained situation
Disphyma australe
glasswort Fleshy leaved ground cover with mauve flowers in the spring. Tolerates drought and full exposure. Frost tender
Doodia media pukupuku, rasp fern
Hardy fern growing to 25cm. Young fronds coloured bright red when in full sun. Sensitive to frost
Libertia grandiflora & L. ixioides mikoikoi, native iris
Clump forming native irises with narrow, upright leaves. Small white flowers in spring. Sun or shade
Phormium cookianum
wharariki, mountain flax Clump-forming flax with yellow – green drooping leaves, to 2m. Full exposure and sun
Phormium tenax
harakeke, flax Clump-forming flax with large stiff leaves, to 3 m. Full exposure and sun
New Zealand specific plant trials were undertaken105 on two bioretention plants, Carex secta (green swamp tussock or purei) and Austrofestuca littoralis (sand tussock or hinarepe) and were found to grow satisfactorily in all bioretention mixes. Regarding planting, the following recommendations are made:
a) Species layout should generally be random and natural b) A canopy should be stabilised with an understory of shrubs and
herbaceous plants c) Woody vegetation should not be specified in the vicinity of inflow locations d) Stressors (wind, sun, exposure) should be considered when developing
the planting plan
105 Fassman et al, 2013

Doc # 11854602 Page 143
e) Noxious weeds should not be specified f) Aesthetics and visual characteristics should be given consideration g) Traffic and safety issues must be considered, and h) Existing and proposed utilities must be identified and considered.
11. Mulch The placement of mulch can reduce filter media erosion, suppress weed growth and increase water availability for plants during establishment. A major concern with mulches is floating so steps have to be taken to reduce floating potential106. There are four steps that can reduce the risk of organic mulches floating.
Thoroughly wet organic mulches at installation by irrigation.
Design bioretention devices with sheet flow, or reinforce areas of concentrated flow with stone.
Ensure a dense cover of plants is achieved with 24 months so re-mulching is unnecessary.
Design the bioretention device with bypass of larger flows. Having an overflow pipe within the bioretention device enhances floating mulch transport out of the device.
12. Large flow bypass Larger flows may overwhelm the functional capability of bioretention devices to provide water quality treatment. A common discharge method is to have an outlet overflow pipe within the surface area of the filter media. This approach is not recommended as oils, greases, floating debris and mulch may exit the device and be discharged downstream. It is recommended that excess flow be diverted from entering the bioretention device so that the device is not overwhelmed. Several examples are shown in the following images. In both images larger flows bypass the bioretention devices.
Case study - Bioretention
Project description A commercial parking lot is proposed in Tokoroa with a bioretention devices proposed due to aesthetic reasons and for dissolved metals. The total extent of the catchment being served is 4,000 square metres of which 60% is impervious with the remainder being landscaped. The overall slope is 3% Hydrology 1. The 2-year 24-hour storm is 92.1 (which includes climate change) mm so the water
quality storm is 30.7 mm of rainfall. 2. The initial abstraction for the site is 13.7 mm so this requirement would set a minimum
standard.
106 Simcock et al, 2013

Page 144 Doc # 11854602
3. Soils are orthic pumice soils having a curve number of 79 due to water table concerns.
4. Calculate the water quality volume to be treated using the Waikato Stormwater Runoff Modelling Guideline (pervious and impervious volumes calculated separately and added together).
Vwq = 75 m3
Bioretention devices design 1. Live volume of storage needed Vlive = 0.40 (75 m3) = 30 m3 2. Calculate the required surface area of the bioretention devices.
A s = (WQV)(d)/k(h+d)t Where: As = surface area of bioretention devices (m2) WQV = water quality treatment volume (m3) d = planting soil depth (m) k = coefficient of permeability (m/day) h = average height of water (m) = ½ maximum depth t time to pass WQV through soil bed
The following values should be used. d = 0.85 metre k = 0.75 m/d h = 0.15 m (maximum water depth 300 mm) t = 2 days
As = 75 (0.85) / 0.75 (0.15+0.85) (2) As = 42.5 m2
Check to see that there is adequate live storage (30 m3). Live storage available = surface area times maximum depth or (42.5)(.3) = 12.75 m3 so the bioretention devices surface area has to be increased by 17.25 m2 to provide the necessary live storage which gives a surface area requirement of 59.75 m2. In most cases, the live storage requirement will govern the size of the bioretention devices. If live storage can be provided upstream of the bioretention devices the overall size may not need to increase but the live storage must be available somewhere upstream.
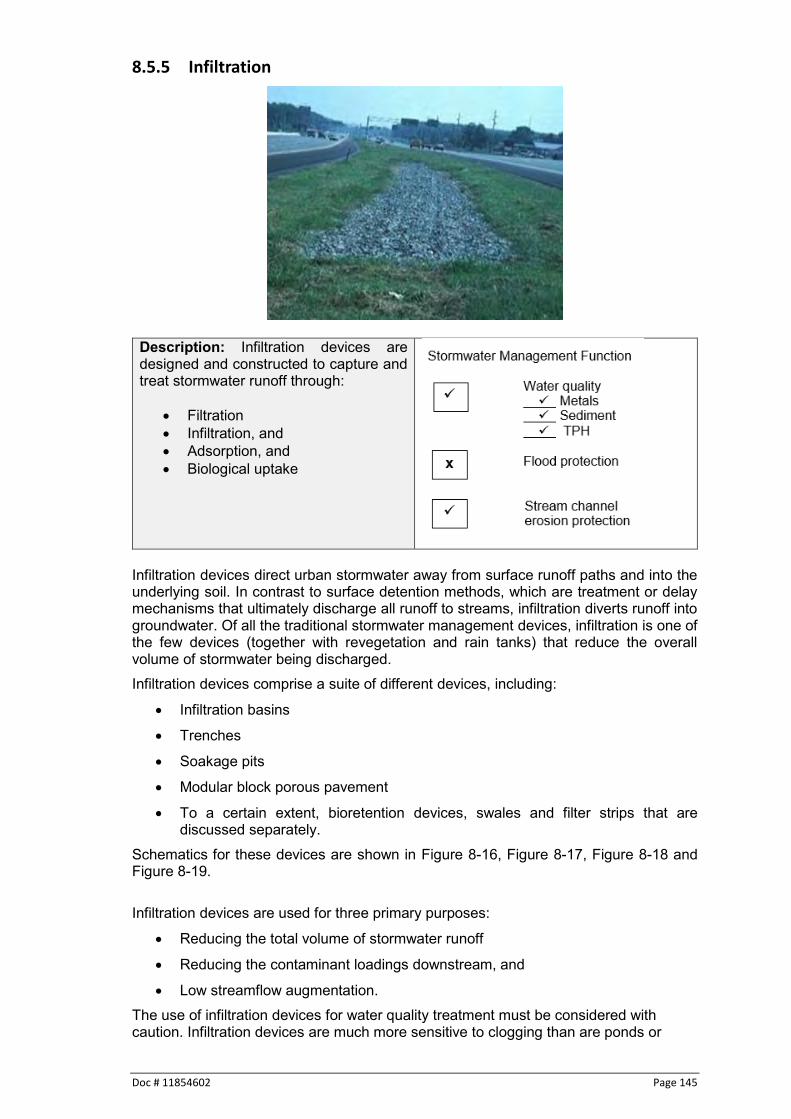
Doc # 11854602 Page 145
8.5.5 Infiltration
Description: Infiltration devices are designed and constructed to capture and treat stormwater runoff through:
Filtration Infiltration, and Adsorption, and Biological uptake
Infiltration devices direct urban stormwater away from surface runoff paths and into the underlying soil. In contrast to surface detention methods, which are treatment or delay mechanisms that ultimately discharge all runoff to streams, infiltration diverts runoff into groundwater. Of all the traditional stormwater management devices, infiltration is one of the few devices (together with revegetation and rain tanks) that reduce the overall volume of stormwater being discharged. Infiltration devices comprise a suite of different devices, including:
Infiltration basins
Trenches
Soakage pits
Modular block porous pavement
To a certain extent, bioretention devices, swales and filter strips that are discussed separately.
Schematics for these devices are shown in Figure 8-16, Figure 8-17, Figure 8-18 and Figure 8-19. Infiltration devices are used for three primary purposes:
Reducing the total volume of stormwater runoff
Reducing the contaminant loadings downstream, and
Low streamflow augmentation. The use of infiltration devices for water quality treatment must be considered with caution. Infiltration devices are much more sensitive to clogging than are ponds or

Page 146 Doc # 11854602
filters. As much as possible, sediment should be prevented from entering these devices.
Figure 8-16: Schematic of an infiltration basin107
An infiltration basin is essentially a pond that has no surface outlet. The only way for the water to leave the ponded area is for infiltration to occur. Figure 8-16 shows a schematic of an infiltration basin. Infiltration trenches receive runoff in a shallow excavated trench that has been backfilled with stone to form a below-grade reservoir as shown in Figure 8-17. Water then enters the underlying subsoil according to its infiltration rate.
Figure 8-17: Schematic of an infiltration trench107
Soakage pits function in a similar fashion with the excavated subgrade being filled with stone and relying upon the void spaces to provide for stormwater storage until the runoff infiltrates into the soil as shown in Figure 8-18.
107 Maryland Department of Natural Resources, 1984

Doc # 11854602 Page 147
Figure 8-18: Schematic of a soakage pit108
Modular block porous pavement permits precipitation to drain through paving blocks with a pervious opening as show in Figure 8-19. Paving blocks are appropriate only for areas with very light or no traffic or for parking pads. They are laid on a gravel subgrade and filled with sand or sandy loam turf but can also be used with grass in the voids which may require irrigation and lawn care during the summer months.
Figure 8-19: Schematic of a permeable pavement108
Applicability
Soil infiltration or permeability is the most critical consideration for the suitability of infiltration devices. Devices are generally built in native soil; but when this is inappropriate, a soil system can be constructed with media such as sand, peat, or a combination. Table 8-8 provides information on the suitability of various soils for infiltration devices. The red line indicates that 7 mm is the lowest infiltration rate that is considered acceptable for use of infiltration devices. Infiltration devices normally convey most runoff directly into the soil to eventually enter the groundwater. Constructed soil systems usually require underdrains. A factor of safety of 0.5 is required, which means that measured infiltration testing must be at least 14 mm per hour to ensure eventual rates of 7 mm/hour.
108 Auckland Regional Council, 2003

Page 148 Doc # 11854602
Table 8-8: Infiltration rate for various soil textural classes Texture Class Approximate Infiltration Rate
in mm/hour Sand 210 Loamy sand 61 Sandy loam 26 Silt loam 13 Sandy clay loam 7 Clay loam 4.5 Silty clay loam 2.5 Sandy clay 1.5 Silty clay 1.3 Clay 1.0 0.5
The next most crucial considerations for the suitability of infiltration devices are:
Avoiding clogging
Avoiding potential to contaminate groundwater. Infiltration devices should be constructed in medium textured soils. They are generally unsuitable for clay because of restricted percolation and for gravel and coarse sands because of the risk of groundwater contamination (unless effective pre-treatment is provided). Any impermeable soil layer close to the surface may need to be penetrated. If the layer is too thick, underdrains may be required. As a minimum measure to prevent clogging, infiltration basins and trenches should require pre-treatment devices to settle larger solids and prevent sediment laden runoff from entering them. Infiltration soakage pits accepting only roof runoff do not require pre-treatment. Pre-treatment is not possible for modular paving either other than keeping extraneous runoff from traveling onto the paving area. The following guidance is applicable to design and implementation of all infiltration devices. Site characteristics Site characteristics relate to whether the infiltration device is intended for quantity control alone or for both quality and quantity control. While quantity control is best achieved with a rapid percolation rate, this rate could be too fast to provide sufficient contact with the soil for contaminant capture if the groundwater table is relatively close to the surface. Consequently, Waikato Regional Council:
Specifies a maximum and a minimum percolation rate to protect groundwater and attain contaminant capture objectives. Infiltration rates greater than 1 m/hr may indicate a direct link to a very permeable aquifer while rates less than 7 mm/hour are too slow
Requires runoff pretreatment to meet water quality objectives before the pretreated runoff is infiltrated for quantity control or stream baseflow augmentation
The following criteria aim to reduce the substantial risks of failure and groundwater contamination, and to achieve the desired urban stormwater management benefits:
The invert of the infiltration devices should be at least one metre from the seasonal high water table (which generally is in late spring or early summer), bedrock, or relatively impermeable soil layer
The percolation rate should be at least 7 mm/hr.
The soil should not have more than 30 percent clay or more than 40 percent clay and silt combined.

Doc # 11854602 Page 149
If the infiltration device is to function primarily for water quality treatment, infiltration rates must not be greater than that given for sand.
Infiltration devices must not be constructed in fill material.
Infiltration devices must not be constructed on slopes exceeding 15 percent.
Catchments draining to infiltration devices must not exceed four hectares, but preferably not more than two hectares.
Infiltration basins are not normally encouraged for use unless approved on a case-by-case basis because their long term historical performance has not been good, mainly as a result of surface clogging.
Permeable paving is designed only to capture rainfall falling on the surface. At this time it is not intended that the permeable surface provide infiltration for other impervious surfaces.
Infiltration devices shall not be located near retaining walls, up gradient from houses or in gullies or floodplains.
Do not locate infiltration practices adjacent to underground power cables. If in doubt contact the appropriate electrical transmission engineers.
Pre-treatment The use of vegetative filters as a pre-treatment device to improve long term performance of infiltration devices cannot be stressed enough. Of primary importance to the long-term function of infiltration devices is the need to ensure all contributing catchment areas are stabilised. Sediment loadings into the device must be kept to a minimum. All inspections of these devices must include inspection for site stabilisation. All areas draining to the infiltration device must be stabilised or premature clogging of the facility will result. Infiltration devices should have annual inspections undertaken for assessing sediment accumulation. The frequency of actual maintenance activities depends on loadings from contributing catchment areas. Inlet stability In addition to pre-treatment long term function depends on having flows enter the infiltration device through a stable system that does not scour and increase sediment load to the practice. Entry can be through various means including:
Filter strips,
Swales, or through
Reticulation systems. If the filter strips or swales are designed according to these guidelines velocities should not cause scour. If entry is through reticulation systems then velocities entering the device can cause scour and the outfalls of the inlets must have erosion control through rip rap or other structural means.
Infiltration basin having some pre-treatment with filter strips
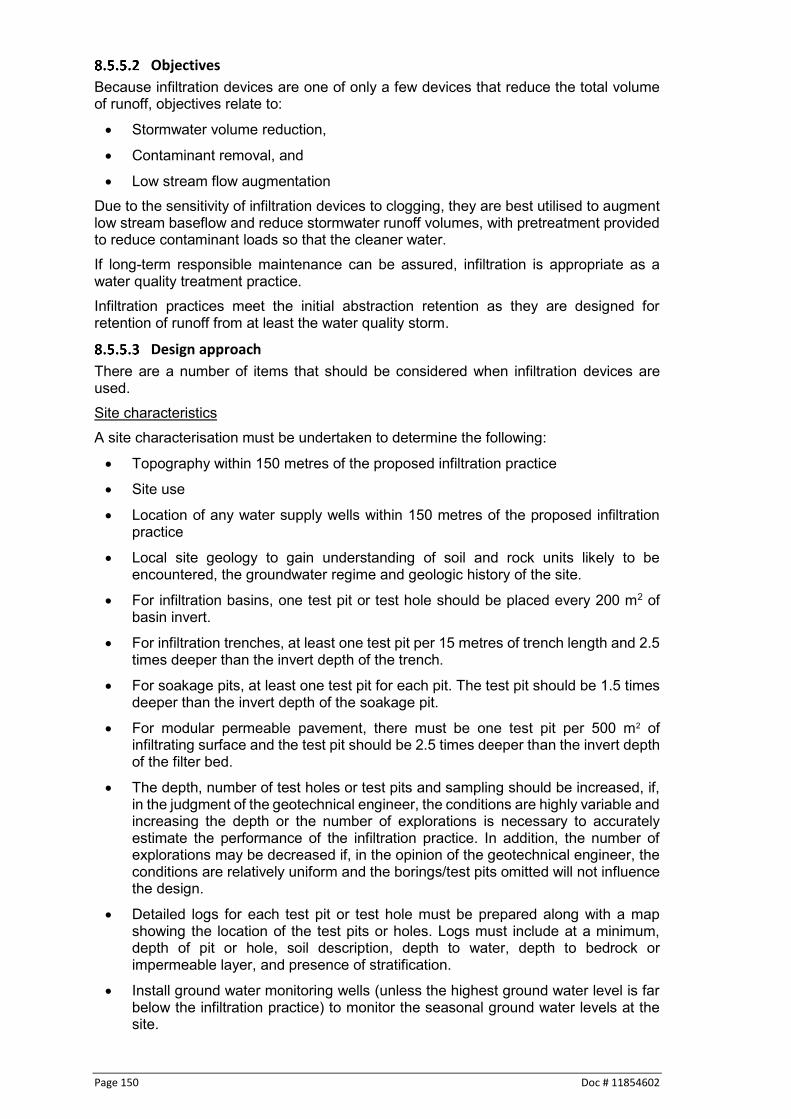
Page 150 Doc # 11854602
Objectives
Because infiltration devices are one of only a few devices that reduce the total volume of runoff, objectives relate to:
Stormwater volume reduction,
Contaminant removal, and
Low stream flow augmentation Due to the sensitivity of infiltration devices to clogging, they are best utilised to augment low stream baseflow and reduce stormwater runoff volumes, with pretreatment provided to reduce contaminant loads so that the cleaner water. If long-term responsible maintenance can be assured, infiltration is appropriate as a water quality treatment practice. Infiltration practices meet the initial abstraction retention as they are designed for retention of runoff from at least the water quality storm.
Design approach
There are a number of items that should be considered when infiltration devices are used. Site characteristics A site characterisation must be undertaken to determine the following:
Topography within 150 metres of the proposed infiltration practice
Site use
Location of any water supply wells within 150 metres of the proposed infiltration practice
Local site geology to gain understanding of soil and rock units likely to be encountered, the groundwater regime and geologic history of the site.
For infiltration basins, one test pit or test hole should be placed every 200 m2 of basin invert.
For infiltration trenches, at least one test pit per 15 metres of trench length and 2.5 times deeper than the invert depth of the trench.
For soakage pits, at least one test pit for each pit. The test pit should be 1.5 times deeper than the invert depth of the soakage pit.
For modular permeable pavement, there must be one test pit per 500 m2 of infiltrating surface and the test pit should be 2.5 times deeper than the invert depth of the filter bed.
The depth, number of test holes or test pits and sampling should be increased, if, in the judgment of the geotechnical engineer, the conditions are highly variable and increasing the depth or the number of explorations is necessary to accurately estimate the performance of the infiltration practice. In addition, the number of explorations may be decreased if, in the opinion of the geotechnical engineer, the conditions are relatively uniform and the borings/test pits omitted will not influence the design.
Detailed logs for each test pit or test hole must be prepared along with a map showing the location of the test pits or holes. Logs must include at a minimum, depth of pit or hole, soil description, depth to water, depth to bedrock or impermeable layer, and presence of stratification.
Install ground water monitoring wells (unless the highest ground water level is far below the infiltration practice) to monitor the seasonal ground water levels at the site.

Doc # 11854602 Page 151
Procedure for conducting an infiltration test The required approach consists of a relatively large-scale infiltration test to better approximate infiltration rates for design of infiltration devices. This approach reduces some of the scale errors associated with relatively small-scale double ring infiltrometre or “stove pipe” infiltration tests.
a. Excavate the test pit at least 1.5 metres below the bottom of the proposed infiltration practice. Lay back the slopes sufficiently to avoid caving and erosion during the test.
b. The surface area of the bottom of the test pit shall be at least 1 square metre. c. Install a vertical minimum 1.5 metre long measuring rod marked in 10 mm
increments in the centre of the pit bottom. d. Use a rigid 150 mm pipe with a splash plate on the bottom to convey water to the
bottom of the pit and reduce side-wall erosion or excessive disturbance of the ponded bottom.
e. Add water to the pit at a rate that will maintain a water level of between 1 - 1.25 metres above the bottom of the pit. A rotametre can be used to measure the flow rate into the pit.
f. Every 15-30 minutes, record the cumulative volume and instantaneous flow rate in litres per minute necessary to maintain the water level at the same point on the measuring rod.
g. Add water to the pit until one hour after the flow rate into the pit has stabilised (constant flow rate) while maintaining the same ponded level.
h. After one hour after the flow rate has stabilised, turn off the water and record the rate of infiltration in mm/hour from the measuring rod data, until the pit is empty. This is a falling head percolation test.
i. A constant head test is where inflow of water is continued after the flow has assumed a constant value. The flow is then measured over time to determine the infiltration rate of the soil. This method is also an acceptable method for calculating infiltration rates.
j. Based on partial clogging, reduce the derived infiltration rate by a factor of 0.5 and reduce this reduced rate in the design calculations.
Site data analysis
Determine representative site infiltration rate from soil test results and the stratification identified during the site investigation.
Determine the textural class from the U.S. Department of Agriculture textural triangle in Figure 8-20. Sand is defined to have a diameter between 2000 um and 50 um while clay has a diameter of less than 2 um. Once the textural class has been determined, the infiltration rates can be found.
Determine infiltration rates by taking direct in-situ measurements of soil infiltration rates.
Long-term infiltration rates greater than one metre per hour (as per steps 8 and 9 above) are considered too rapid to allow significant water quality treatment to occur and pretreatment will have to be provided.

Page 152 Doc # 11854602
Figure 8-20: Soil textural triangle109
Detailed design procedure
This approach relies on Darcy’s Law, which expresses flow through a porous media. There are two equations that are used: one for surface area of the device (As) and one for its volume (V). A third equation provides a check that the maximum depth is not exceeded in the design to ensure that the device drains in the two day drain period. In terms of the design approach:
1. Determine the water quality rainfall from the 90% storm. 2. Calculate the water quality volume. 3. Size the device surface area to allow complete infiltration within 48 hours,
including rainfall falling directly on it. Use the following equation to determine surface area:
𝐴𝑠 = 𝑊𝑄𝑉
(𝑓𝑑)(𝑖)(𝑡)−𝑝
Where: As = surface area of the trench (m2) WQV = water quality volume (m3) fd = infiltration rate (m/hr) - rate reduced by ½ from measured i = hydraulic gradient (m/m) - assumed to be 1 t = time to drain from full condition (hours) - maximum time 48 hours. p = rainfall depth for water quality storm (m)
There is a simple test to see how deep an infiltration device can be to achieve the discharge of the water quality storm. Any deeper than the amount calculated will not achieve the two-day draw down period. The equation is the following:
𝑑𝑚𝑎𝑥 = 𝑓𝑑( 𝑡 𝑉𝑟⁄ )
Where: dmax = Maximum depth of trench fd = Infiltration rate (m/hr) t = Time to drain from full condition (hours)
109 Davis et al, 1927

Doc # 11854602 Page 153
Vr = Void ratio of reservoir stone (normally 0.35 or 0.5 if scoria is used), 1 for infiltration basins
Once dmax has been defined, the actual needed depth can be calculated. If the actual depth exceeds the maximum depth the surface area must be increased to account
4. Find the device volume to provide storage for 37% of the volume required to infiltrate. This allows for storage of excess runoff during those periods when the runoff exceeds the infiltration rate.
𝑉 = 𝑊𝑄𝑉 + 𝑝(𝐴𝑠
𝑉𝑟⁄ )
Where: V = Device volume with any aggregate added
NOTE: Permeable paving does not usually have a contributing drainage area draining to it. As such the volume of storage equals the following:
V = pAs/vr where p is the design rainfall event (at least the water quality storm but generally will be up to the 10-year ARI rainfall event)
5. Calculate the device depth and compare with the maximum depth V/As = depth of trench (d)
If d < dmax the design is adequate. If d > dmax then the surface area must be increased and depth decreased.
Infiltration devices direct urban stormwater away from surface runoff paths and into the underlying soil. In contrast to surface detention methods, which are treatment or delay mechanisms that ultimately discharge all stormwater runoff to streams, infiltration devices divert runoff into groundwater.
Case study - Infiltration
Project description A small commercial development in Cambridge is proposed with the development being 80% impervious and the total development size is 3000 m2. Average slope of the site is 5%, pre-development land use is pasture and the soils are orthic allophanic soils having a curve number of 79. Post-development land use is open space lawn with good grass cover having a curve number of 74 due to the open space soil being conditioned to promote infiltration. With the soil conditioning, the runoff from the grassed areas is less than in the pre-development pasture condition so no management is necessary for the grassed areas and that flow can bypass the infiltration trench and thus reduce its size.
1. The 2-year 24-hour post-development storm with climate change is 78.5 mm so the water quality storm is 26.2 mm of rainfall.
2. The 10-year 24-hour post-development storm with climate change is 125.7 mm. 3. The initial abstraction for pervious areas should be retained on site as a minimum,
which in this case is 3.4 mm. Depending on site conditions the infiltration of the water quality storm will exceed the initial abstraction, which hence meets the retention criteria.
4. Soils are orthic pumice soils having a curve number of 79 due to water table concerns.
5. Infiltration rate through testing is 14 mm/hour. Taking ½ of that rate results in using 7 mm/hour for design purposes.
6. Calculate the water quality volume to be treated using the Waikato Guideline for Stormwater Runoff Modelling. As the pervious areas bypass the trench, storage only needs to be provided for the impervious surface.
Vwq = 52 m3

Page 154 Doc # 11854602
V2-yr = 176 m3 V10-yr = 289 m3
Infiltration trench design 1. Calculate the device surface area
𝐴𝑠 = 𝑊𝑄𝑉
(𝑓𝑑)(𝑖)(𝑡)−𝑝
Where: As = surface area of the trench (m2) WQV = water quality volume (m3) = 52 m3
fd = infiltration rate (m/hr) - rate reduced by ½ from measured =14 mm/hour reduced by ½ as a factor of safety, so fd = 7 mm/hour = 0.007 m/hour i = hydraulic gradient (m/m) - assumed to be 1 t = time to drain from full condition (hours) - maximum time 48 hours p = rainfall depth for water quality storm (m) = .026 m
As = 52 / ((0.007) (1) (48) - 0.026) = 163 m2
Calculate the maximum trench depth
𝑑𝑚𝑎𝑥 = 𝑓𝑑( 𝑡 𝑉𝑟⁄ )
Where: dmax = Maximum depth of trench fd = Infiltration rate (m/hr) = 0.007 m/hour t = Time to drain from full condition (hours) = 48 hours Vr = Void ratio of reservoir stone = 0.35 dmax = 0.007(48/.35) = 0.96 m
2. Find the trench volume V = 0.37(WQV + pAs)/Vr = 0.37 (52 + 0.026 (163)) / 0.35) = 59.5 m3
3. Calculate the trench depth and compare with the maximum depth V/As = depth of trench (d) = 59.5 / 163 = 0.37 m d < dmax so the design is adequate.
In a similar approach the trench could be sized for the 2-year or even 10-year runoff volumes. Those volumes have been provided in the hydrology section of this case study.

Doc # 11854602 Page 155
8.5.6 Stormwater pond
Description: Stormwater ponds can provide peak flow control and water quality treatment. Processes for contaminant reduction are primarily related to:
Sedimentation
Stormwater ponds have been used to manage stormwater for years, initially for water quantity control, but more recently also for water quality control. They have been, and are expected to remain, important components in the stormwater effort to minimise adverse impacts associated with urban land use. This section reviews ponds that are either normally dry or normally wet. Both forms of pond can and may possibly have an extended detention component to them. This section does not include discussion of wetlands. Wetland, while having much in common with deeper stormwater ponds are considered separately in Section 8.5.7. Ponds are defined as: Dry pond - A permanent pond that temporarily stores stormwater runoff to control the peak rate of discharges and provide water quality treatment, primarily through the incorporation of extended detention. These ponds are normally dry between storm events. Wet pond - A permanent pond that has a standing pool of water. These ponds can, through their normal storage of water, or in conjunction with extended detention, provide water quality treatment. They can, also in conjunction with extended detention, provide protection of downstream channels from frequent storms. Stormwater ponds are used for three primary purposes:
Reducing downstream flood potential
Providing water quality treatment, and
Minimising, to the extent possible, downstream channel erosion. It may not be necessary in every situation to address all three purposes, but there will be sites, as discussed later in this section, where all three functions will be included in the design.

Page 156 Doc # 11854602
Water quantity/quality performance
Ponds detain runoff, typically from a design storm, and then discharge it, usually at the pre-development peak discharge rate. Traditionally ponds, especially dry ones, have been used primarily for flood protection. They normally detain runoff and then discharge it at a specified rate, reducing the potential for downstream flooding by delaying the arrival of runoff from upper parts of a catchment. More recently, wet and dry pond designs have been modified to extend the detention time of runoff thereby increasing particulate contaminant settling and minimising downstream channel erosion. Wet ponds are normally designed to have a permanent pool for storage of a specified water quality volume, in the Waikato region this is the water quality storm. Wet ponds also have an outlet design that increases residence time and flow path. Contaminant removal mechanism The primary contaminant removal mechanism of all pond systems is settling or sedimentation. However, the effectiveness may vary to some degree depending on the type of detention system (dry or wet). Flood detention ponds have limited effectiveness at providing sedimentation, as detention times may be several hours only, so only the coarser particles can be removed from the water column. Extended detention ponds that are normally dry also rely on sedimentation during short periods of live storage only although they typically hold flows for longer than flood detention ponds. The best approach for particulate removal hen using ponds is the combination of extended detention in conjunction with a normal wet pool. The pool allows for displacement of water previously stored and the extended detention allows for better sedimentation of excess storm flows. Expected performance Ponds can be effective at reducing peak discharge rates. Depending on their design and their location within a catchment, they may also be effective in reducing downstream channel erosion, downstream flood levels and flooding. Effectiveness at contaminant removal depends on the type of pond system. In general, they can be ranked, from least to most effective, in their ability to remove stormwater contaminants: dry detention, extended dry detention, and then wet detention. Constraints on the use of ponds Dry ponds
Need fairly porous soils or subsurface drainage to assure that the bottom stays dry between storms
Not suitable in areas with high water tables or shallow depth to bedrock
Not suitable on fill sites or steep slopes unless geotechnically checked
May not be suitable if receiving water is temperature sensitive as detention ponds do not detain water long enough to reduce temperatures from impervious surfaces.
Wet ponds
Not suitable on fill sites or near steep slopes unless geotechnically checked
May need supplemental water supply or liner system to maintain permanent pool if not dug into the groundwater
Minimum contributing drainage area of 6 hectares is needed to maintain the permanent pool
Not feasible in very dense urban areas or areas with high land costs due to large surface area needs

Doc # 11854602 Page 157
May not be suitable if receiving water is temperature sensitive due to warming of pond surface area.
Safety issues need to be addressed, depending on normal pool depth Dry flood detention ponds are not recommended for stormwater management systems. They have ongoing maintenance needs because standing water in areas where positive drainage is impeded may cause mosquito problems, and their overall performance for water quality treatment is less than provided by wet ponds. A study in the United States110 indicated that over 70% of the dry ponds in a given jurisdiction were not functioning as designed. In addition, dry ponds tend to have less aesthetic appeal than wet ponds.
Pond component disclaimer
The technical safety criteria for pond design and construction that are beyond the scope of this document include:
Minimum dam top width
Embankment side slopes
Seepage control
Foundation standards
Foundation cutoff
Outlet protection
Access and set aside area for sediment drying Two issues that will be discussed in this section are minimum spillway capacity, as spillway design will affect the duration of detention and therefore stormwater quantity and quality control, and pond forebay areas and capacity. These will be discussed in the Design Procedure section. A typical wet pond is shown in Figure 8-21 and Figure 8-22.
110 DNR, 1986

Page 158 Doc # 11854602
Figure 8-21: Schematic of a stormwater management pond111
111 Auckland Regional Council, 2003

Doc # 11854602 Page 159
Figure 8-22: Pond cross-sections111
The issue of seepage control is important to the long-term stability of a dam. The Bay of Plenty Regional Council advocates a filter collar approach rather than using anti-seep collars. A standard detail of a filter collar is shown in Figure 8-23. Either the use of anti-seep collars or filter collars for seepage control is considered acceptable to Waikato Regional Council, however construction adequacy must be ensured for either one.
Figure 8-23: Design detail for a filter collar112
112 Bay of Plenty Regional Council, 2012
Phreatic line

Page 160 Doc # 11854602
Design approach
Objectives Water quantity objectives
Urbanisation has dramatic impacts on the amount of stormwater runoff that is generated from a catchment. Ponds, when properly sized, can be a primary quantity control practice. Waikato Regional Council criteria for water quantity control depend on the receiving environment. If the receiving environment is a piped stormwater reticulation system with adequate capacity for the increased runoff or tidal (either estuarine or marine), then water quantity control is not an issue and a number of devices can be used to achieve water quality goals. If the receiving environment is a stream, then control of peak rates of runoff may be a requirement, and ponds become a primary option for controlling discharge rates. Water quality objectives
Water quality objectives aim for removal of TSS. Ponds are not as appropriate for dissolved contaminants so treatment of metals may require other devices to be used in conjunction with ponds. They are more appropriate where sedimentation can achieve stated goals. Where possible, water quality ponds need a bypass for larger flows. Because all flows travel through the pond, water quality performance during larger events will be reduced as first flush contaminants are carried through it. Ideally, larger flows should bypass the pond in order to avoid a drop in water quality performance, albeit at the expense of its ability to provide peak flow reduction for larger storms. In those situations, it may be best to use a treatment train approach to stormwater where other devices provide primary water quality treatment while the pond is primarily used for water quantity control. Although desirable, this approach may not always be possible due to site constraints. There is a direct linkage between water quality treatment and flow control. If catchment considerations necessitate peak controls, it is recommended that 50% of the calculated water quality volume be placed as dead storage while 50% of the water quality volume can be live storage and released as part of the extended detention rainfall capture and release requirement (as discussed in the next item). This water quality credit can only be provided when storage and release of the runoff from either the water quality storm or 1.2 times the water quality storm rainfall is required. The permanent storage will reduce flow velocities entering the pond, while the extended detention will facilitate (in addition to the wet pool) settlement of particulates. If there is no requirement for either extended detention or peak control, the entire water quality volume can be stored within the permanent pool level. As discussed in Section 7.3.1, in areas where the quality event rainfall is greater than 30mm, water quality treatment should be designed using a rainfall depth of 30mm to determine the water quality volume. This only applies to water quality criteria. Extended detention will require design for the full, un-adjusted volume. Channel protection objectives
Urban development has the effect of increasing the frequency and magnitude of floods, particularly during frequent small storm events. As a consequence, streams can suffer an increase in erosion, as channels enlarge to cope with the increased storm response. The objective of criteria related to channel protection is to maintain or improve the in-stream channel stability to protect ecological values of the stream and reduce sedimentation downstream. Waikato Regional Council may require on a case-by-case basis that the runoff from 1.2 times the water quality volume to be stored and released over a 24-hour period to minimise potential for stream channel erosion.

Doc # 11854602 Page 161
This provision is in addition to normal stormwater quality and flow attenuation requirements. However, by using extended detention for some of the stormwater quality treatment rather than a full wet pond, the treatment and erosion attenuation volumes may be partially combined, reducing total pond volume. Ponds in series
Waikato Regional Council does not generally recommend the use of ponds in series instead of a single pond with an equivalent surface area. If the single pond were divided into two ponds in series then each of the two ponds would have approximately 1/2 of the surface area of the single one. Each pond then has half the detention time, so the first pond takes out the coarser sediment. The flow is then remixed in the channel between ponds, and the second pond is too small to take out the finer fractions. Therefore ponds in series may be less efficient than single large ponds of equivalent volume. However, sometimes site constraints make it necessary to use two or more treatment ponds in series rather than one larger single pond. To offset the reduction in sediment removal, where two or more ponds in series are necessary they should be sized for 20% greater volume than the volume specified in this guideline for a single pond. Where there are no specific site constraints, a single pond is preferred.
Preferences
Preference for wetlands versus ponds
Constructed wetlands are preferred to open water ponds because they provide better filtration of contaminants, including dissolved ones due to densities of wetland plants, incorporation of contaminants in soils, adsorption, plant uptake, and biological microbial decomposition (more in-depth discussion is provided in Section 8.5.7). In addition, wetlands, being shallow water bodies do not have the safety issues associated with deeper wet ponds. Wet ponds can only be implemented when consideration for a wetland has been rejected and the rejection is acceptable to Waikato Regional Council.
Wet ponds can cause adverse thermal effects on downstream receiving environments hence can only be considered for appropriate receiving environments, and where it can be demonstrated that other practices have been investigated and rejected for valid reasons.
On-line versus off-line
Waikato Regional Council recommends that ponds be ‘off-line’ rather than ‘on-line’. Off-line ponds are considered to be those ponds not physically located in perennial watercourses. They can be in gullies or upland areas. On-line ponds are located on streams having perennial flows and their impact to the stream itself can be significant. On-line ponds alter geomorphic and biological character of streams and these alterations may adversely impact on the streams natural character and function. There may be some circumstances where on-line ponds would be considered suitable. On-line ponds will be considered on a case-by-case basis by Waikato Regional Council. If an on-line pond is proposed, the following requirements apply:
1. Water quality treatment must be provided upstream and off-line. 2. Storage must be provided by dry detention with a naturalised channel provided
at the base to convey the natural stream flows (i.e. storage would be provided within the floodplain of the stream in effect)
Dry ponds versus wet ponds
Dry ponds need more maintenance and have a lower water quality performance than wet ponds. In terms of preference when ponds are the selected options, constructed wetlands are a first choice, followed by wet ponds, and finally dry ponds. Dry ponds are not normally recommended unless there is council acceptance that an online pond is an acceptable stormwater management approach in a specific situation.
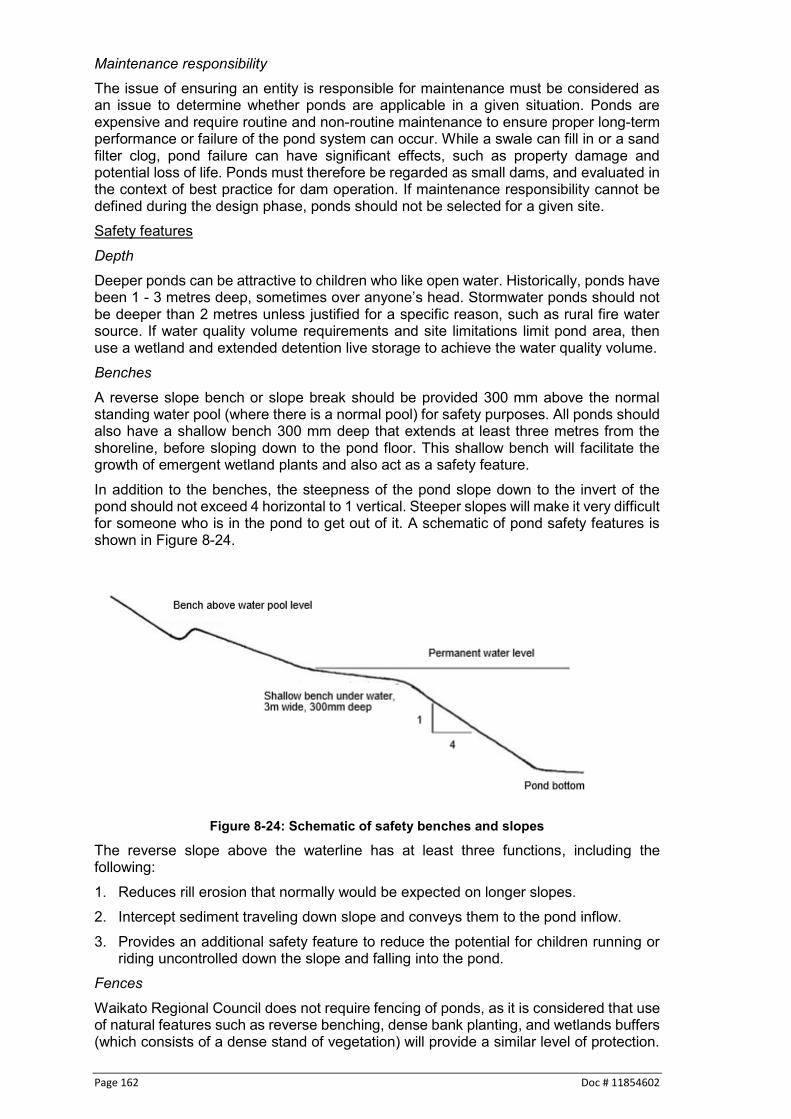
Page 162 Doc # 11854602
Maintenance responsibility
The issue of ensuring an entity is responsible for maintenance must be considered as an issue to determine whether ponds are applicable in a given situation. Ponds are expensive and require routine and non-routine maintenance to ensure proper long-term performance or failure of the pond system can occur. While a swale can fill in or a sand filter clog, pond failure can have significant effects, such as property damage and potential loss of life. Ponds must therefore be regarded as small dams, and evaluated in the context of best practice for dam operation. If maintenance responsibility cannot be defined during the design phase, ponds should not be selected for a given site. Safety features Depth
Deeper ponds can be attractive to children who like open water. Historically, ponds have been 1 - 3 metres deep, sometimes over anyone’s head. Stormwater ponds should not be deeper than 2 metres unless justified for a specific reason, such as rural fire water source. If water quality volume requirements and site limitations limit pond area, then use a wetland and extended detention live storage to achieve the water quality volume. Benches
A reverse slope bench or slope break should be provided 300 mm above the normal standing water pool (where there is a normal pool) for safety purposes. All ponds should also have a shallow bench 300 mm deep that extends at least three metres from the shoreline, before sloping down to the pond floor. This shallow bench will facilitate the growth of emergent wetland plants and also act as a safety feature. In addition to the benches, the steepness of the pond slope down to the invert of the pond should not exceed 4 horizontal to 1 vertical. Steeper slopes will make it very difficult for someone who is in the pond to get out of it. A schematic of pond safety features is shown in Figure 8-24.
Figure 8-24: Schematic of safety benches and slopes
The reverse slope above the waterline has at least three functions, including the following: 1. Reduces rill erosion that normally would be expected on longer slopes. 2. Intercept sediment traveling down slope and conveys them to the pond inflow. 3. Provides an additional safety feature to reduce the potential for children running or
riding uncontrolled down the slope and falling into the pond. Fences
Waikato Regional Council does not require fencing of ponds, as it is considered that use of natural features such as reverse benching, dense bank planting, and wetlands buffers (which consists of a dense stand of vegetation) will provide a similar level of protection.

Doc # 11854602 Page 163
The fencing requirement may be reconsidered on a case-by-case basis and also may be required by the various cities and district councils. Aesthetics Aesthetics must be considered as an essential pond design component. Ponds can be a site amenity if properly designed and landscaped or can be a scar on the landscape. The developer and designer should consider the pond as if they themselves were to be living in the development. Small items can have a big influence on the livability of a given area to residents and the best time to consider the issue is during the design phase. There is a greater discussion of landscaping later in the guideline.
Design procedure
Approach Pond design tasks, in order, include the following: 1. Determine the need for water quantity control. In normal situations if it is required,
that requirement will be to limit post-development peak discharges for the 2 and 10-year ARI rainfall events to their pre-development peak discharge release rates. If downstream flooding is documented, the post-development 100-year ARI storm peak discharge rate may also need to be limited. In this case, a catchment analysis may be necessary or, as an option to the catchment analysis, limiting the 100-year ARI peak discharge to 80% of the pre-development peak release rate.
2. From the initial abstraction calculate the volume of retention as detailed in Section 7.2.7. That volume can reduce the water quality and extended detention volume storage requirement.
3. Protect channel form in receiving environment. If the discharge enters a perennial natural stream channel, its channel will need to be protected from erosion. In such cases the runoff from either the water quality storm or 1.2 times the water quality volume shall be stored and released over a 24 hour period.
4. Determine the need for water quality control. Calculate the water quality volume that needs to be treated when detention is required, and provide at least 50% of that volume as permanent pond storage. The other 50% stores and releases runoff from either the water quality volume or 1.2 times the water quality volume over a 24 hour period.
A hydrological analysis is needed for up to five rainfall events including the 2-year, 10-year and possibly 100-year ARI events, 1.2 times the water quality rainfall, and the water quality rainfall. The 2, 10, and 100-year ARI events must be undertaken for both pre- and post-development while 1.2 times the water quality rainfall (erosion protection) and water quality rainfall events are based on the post-development condition that includes climate change rainfall modification. Spillways and outlet capacity There are two primary outlets from a pond: the service outlet and the emergency outlet. They will be discussed in the context of their sizing. Figure 8-25 illustrates the various outlet elements and components. The terms detailed in the figure are those used in the Hydraulic Flow discussion of this chapter.

Page 164 Doc # 11854602
Figure 8-25: Schematic of pond outlet components113
Service outlet The service outlet should be designed to at least accommodate the flows from the primary drainage system entering the pond. The service outlet will normally convey the flow from the extended detention orifice, the 2-year storm and the 10-year storm. In addition, the service outlet should also have a gate valve at the invert of the normal pool to allow for drainage of the pond during maintenance. When an extended detention orifice is required, that orifice shall not be less than 50 mm in diameter (or 50 mm wide if a slot) unless a cover plate or screen device is used to prevent clogging of the orifice as shown in Figure 8-26. If calculations indicate an orifice (or slot) of smaller size, attention must be given to implementation of protective measures such as cover plate or other means, to prevent blockage of the orifice. It is important to consider blockage on all outlet devices but the extended detention outlet will be highly susceptible to blockage unless specifically designed for.
Figure 8-26: Example of an orifice cover plate to prevent clogging114
Two points are important when using a cover plate. 1. The cover plate should be less than the diameter of the orifice from the orifice wall.
If the orifice is 40 mm in diameter, the orifice plate should be no more than approximately 35 mm from the wall.
2. A good rule of thumb is to have the opening area of the orifice plate at least 5 times the area of the orifice. This would include the area from all four sides (if a rectangular plate is used.
113 Auckland Regional Council, 2003 114 New Zealand Transport Agency, 2010

Doc # 11854602 Page 165
Emergency spillway The emergency spillway will convey flows beyond the service spillway’s capacity. It should be designed to convey at least the 100-year ARI storm with a freeboard of at least 300 mm. The emergency spillway should be located in natural ground and not placed on fill material unless it is armored to prevent scour of the embankment. Operating velocities must be calculated for spillways in natural ground in order to determine the need for additional armoring. If the emergency spillway is placed on fill, the embankment should be constructed higher than the final design to allow for settlement. In situations where embankment failure may lead to loss of life or extreme property damage, the emergency spillway must be able to:
Pass an extreme flood, which may be the Probable Maximum Precipitation (PMP), with no freeboard (after post-construction settlement) and with the service outlet blocked. The PMP is defined as an estimate of an upper physical bound to the precipitation that the atmosphere can produce115. The extreme flood (QV) is defined in NIWA’s document detailed in “A Guide to Probable Maximum Precipitation in New Zealand”116. For high-risk dams, discussion with Waikato Regional Council is essential to determine the needed factor of safety.
Pass the full QIV (100-year ARI flow) assuming the service spillway is blocked with at least 0.5 metres of freeboard (after construction settlement).
Forebay A forebay must be provided for all wet ponds that provides for sediment capture and ensures that flows into the overall pond are non-erosive. The sediment forebay is intended to capture only coarse sediments and is the location where most frequent sediment cleanout will be needed because coarser particles comprise the highest proportion of incoming sediments in terms of total volume. The forebay bund separating the forebay from the main body of the pond should be formed from impermeable material so that the water level in the forebay can be lowered for maintenance purposes. The crest of the forebay weir should be set to the permanent water level. The forebay should meet the following criteria: 1. The volume of the forebay should be at least 15 % of the water quality volume (or
30% of the adjusted volume when extended detention is required). It should be cleaned out when filled in to about 50% of its design volume.
2. Flow velocities from the forebay during the 10-year ARI rainfall event must be less than 0.25 m/s, in order to avoid resuspension of sediment. In some cases this may necessitate more than the minimum forebay volume. The recommended depth of the forebay is 1 metre or more, to reduce velocities.
Hydraulic flow characteristics 1. Calculate the water quality volume to be treated using the water quality rainfall event,
less the retained Ia (or lesser volume depending on site constraints). 2. Take a minimum of 50% of that volume for normal pool (dead) storage (when
detention is required). 3. Use either the water quality volume or 1.2 times the water quality volume to
determine the extended detention volume less the retained Ia (or lesser volume depending on the site constraints). The extended detention volume is then used to determine the depth of runoff that is to be stored and released over a 24 hour period.
4. Either conservatively assume that the entire extended detention volume is in the pond at one time even though this will not actually be the case since the outlet orifice
115 NZSOLD, 2015 116 NIWA, June 1995

Page 166 Doc # 11854602
will be sized to release this volume over a 24 hour duration. Or determine the extended detention volume storage requirement using routing. The steps below relate to the former method.
Use an elevation - storage table to estimate the elevation required to store the full extended detention volume
Calculate the average release rate (equal to the volume/duration) = Qave
At the full extended detention design elevation, the maximum release rate is assumed to be Qmax = 2(Qave)
Calculate the required low flow orifice size: Qi = 0.62A(2ghi)0.5 by trialing various orifice sizes.
hi = elevation difference = the elevation at extended detention - the elevation at normal pool + d/2.
Other devices may be suitable for extended detention design, and all are based on a similar approach to the orifice opening approach. Those designs can include:
Multiple orifices at the same elevation (n orifices, A area each) Qi = n 0.62A(2ghi)0.5
Vertical slot extending to water surface (width w)
Qi = 1.8 w hi3/2
Vertically spaced orifices (situated h1,ha,hb from surface of pond filled to the WQ volume. Each orifice area A)
Q = 0.62A(2gh1)0.5
+ 0.62A(2gha)0.5
+ 0.62A(2ghb)0.5
Pipe (area A) h = (1.5Qi2/2gA
2) + hf
where hf is pipe friction loss
Several different outlet designs for extended detention are detailed in Figure 8-27.
Figure 8-27: Schematic of extended detention outlet structures114
5. Intermediate storm: 2 and 10-year ARI event stormwater management
Set the invert elevation of the 2-year release point at the extended detention water surface elevation (based on the elevation - storage table mentioned in step 4). The service outlet may consist of a drop inlet structure, a broad crested weir, a cascade weir or a weir leading to an open channel. As peak control requirements call for both 2 and 10-year ARI storms to be controlled, the discharge is clearly defined in terms of the following equations.

Doc # 11854602 Page 167
Drop inlet
For moderate flows, the top of the drop shaft acts as a circular sharp weir. For a circular drop inlet, the energy head above the weir lip, (hii) can be used to calculate the flow according to:
Qii = 3.6pR hii3/2
Where R is the radius of the inlet.
For a box weir:
Qii = 7.0whii3/2
Where w is the length of the side of the square box, on the inside.
These equations apply only for hii/R ≤ 0.45 (or, for a box inlet, hii/w ≤ 0.45). For hii/R > 0.45, the weir becomes partly submerged, and for hii/R > 1 the inlet is fully submerged and the flow resistance is equal to the inlet resistance of a pipe, typically:
hii = k(v2/2g)
Where v is the velocity at flow Qii and k is typically 0.5 to 1.0, depending on the details of the inlet
For a circular inlet:
v = Qii/pR2
Starting with the design flow and the chosen pipe radius, the head (hii) can be found by using the appropriate formula for the hii/R value. If this head is higher than desired, a large outlet can be used. Aeration of the flow over the weir should be considered if the flows are so high that inadequate ventilation may cause damage to the drop structure. In general, adequate ventilation will be provided by appropriate sizing of the outlet pipes. It is recommended that the outlet pipe be sized so that when the emergency spillway is operating at maximum flow (Qv), the outlet discharges at 75% full. Standard pipe friction and pipe outlet loss calculations can be performed to determine the required outlet size117. The entry to the outlet should be protected by a screen or grid cage to collect debris. Broad crested weir
In this case, a weir narrower than the emergency weir is used. The weir could be situated away from the emergency weir, or if sufficient erosion protection is provided, in a lowered section of the emergency spillway. The flow may pass down a single chute into a small plunge pool or appropriately lined area. Alternatively, a series of small cascades or a stepped spillway may be used. To size the weir, the change in pond elevation (hii) at the service design flow is found by solution of the following equation:
Qii = 0.57(2g)1/2
(2/3Lh3/2
+ 8/15zh5/2
)
As an approximation, the following formula may be used for a broad-crested weir:
117 USBR, 1977

Page 168 Doc # 11854602
Qii = 1.7 L hii3/2
Weir with channel
This design will be useful for shallower ponds, where the channel can be easily constructed by making a cut in the embankment. The outflow is controlled by the weir. Appropriate texts may be consulted for refined weir calculations, but the following may be used as an approximation for a sharp-crested weir:
Qii = 1.8Lhii3/2
Where Qii is the service design flow, hii is the head over the weir when the emergency spillway starts operation and L is the length of the weir. The outlet channel should be sufficiently large that the water level is below the water level (hii) at the service design flow (to avoid backwater effects). The channel may require covering for safety reasons.
6. Emergency spillway design The emergency spillway section is normally designed as a trapezoidal channel whose sizing is based on trial and error to the following equation:
Q = 0.57(2g)1/2
(2/3Lh3/2 + 8/15Zh
5/2)
Where: Q = discharge through the spillway L = horizontal bottom width of the spillway h = depth of flow at design flow Z = horizontal/vertical side slope (recommended to be 3)
Designs to avoid short-circuiting Dead zones and short-circuiting are undesirable because they reduce effective pond detention times. The flow path length must be at least twice the pond width, and preferably three times the width (but not much greater). The narrower the flow path, the greater the velocity and the less settling will occur. The designer should minimise dead zones and short-circuiting to improve the treatment performance of the pond. Oil separation Stormwater will, in most situations, contain oils and greases. Having an extended detention outlet similar to the reverse sloping pipe shown in Figure 8-27 will allow water to be discharged from below the surface and encourage volatilisation of the hydrocarbons on the surface. Debris screens Screens are used to trap rubbish and organic debris, which is unsightly, especially if trapped in vegetation. Screens should be used to protect extended detention outlets from clogging. Screens may be installed either at the inlet to the pond or at the outlet from the pond. Ease of maintenance Ease of maintenance must be considered as a site design component. Access to the stormwater management pond or wetland must be provided for in the design, and land area adjacent to the pond must be set aside for drying out of sediments removed from the pond when maintenance is performed. The land set aside for pond maintenance should be sized as follows: 1. The set aside area shall accommodate at least 10 percent of the stormwater
management pond volume at a maximum depth of one metre, and 2. The slope of the set aside area shall not exceed 5 percent, and

Doc # 11854602 Page 169
3. The area and slope set aside may be modified if an alternative area or method of disposal is approved on a case-by-case basis.
Pond and site design
Pond shape The design of pond shape should consider engineering constraints, design parameters to achieve treatment, and the existing topography. For a given catchment the design parameters include water volume, surface area, depth, water flow velocity and detention period. In addition, it is recommended that the length to width ratio be 3 horizontal to 1 vertical or greater to facilitate sedimentation. These parameters should be considered in light of the existing topography. Generally, a pond will look more natural and aesthetically pleasing if it is fitted into existing contours. Pond contours Pond contour profiles are critical to the design of a pond: they determine available storage, the range of plants that can be grown and the movement of water through the pond. The safety features of shallow slopes and reverse slopes will help provide areas suitable for a variety of plants. Edge form Edge form influences the appearance of a pond, increases the range of plant and wildlife habitats and has implications for pond maintenance. Edges can include sloping margins where water level fluctuations cause greater areas of wet soils. Generally, sloping margins require a more sophisticated management approach to ensure growth of plants. Areas of gradually varied wetness should be identified and specific planting strategies should be developed for these areas. Such gradually sloping areas can appear a more natural part of the landscape than steep banks, and they provide opportunities for a greater range of plants and habitat. Islands Islands, properly located, can be used to manipulate flow characteristics, to increase the distance that water travels and to help segregate first flush inflow from later flows within a storm event. They also increase the extent of planted margin and can provide a wildlife habitat that offers some protection from domestic animals or people, as well as offering additional aesthetic appeal.
Landscaping
Design of a stormwater pond system should ensure that the pond fits in with the surrounding landscape. General landscape design principles will apply. The area should develop a strong and definite theme or character. This might be generated from particular trees, or views from the site, topographical features, or the cultural character of the surrounding neighbourhood. The landscape design for the area will provide a setting for the pond so that the pond will appear a natural component of the overall setting.
Case study – Stormwater pond
Project Description A 100 lot residential subdivision is being constructed. It is 7.5 hectares in size with no off-site drainage passing through it. It has gentle slopes and average imperviousness is expected to be 50%. Pre-development land use is pasture. The site drains into a stream channel so extended detention is a design component. There are no downstream flooding issues identified. Hydrology A summary of the calculations is provided in Table 8-9.
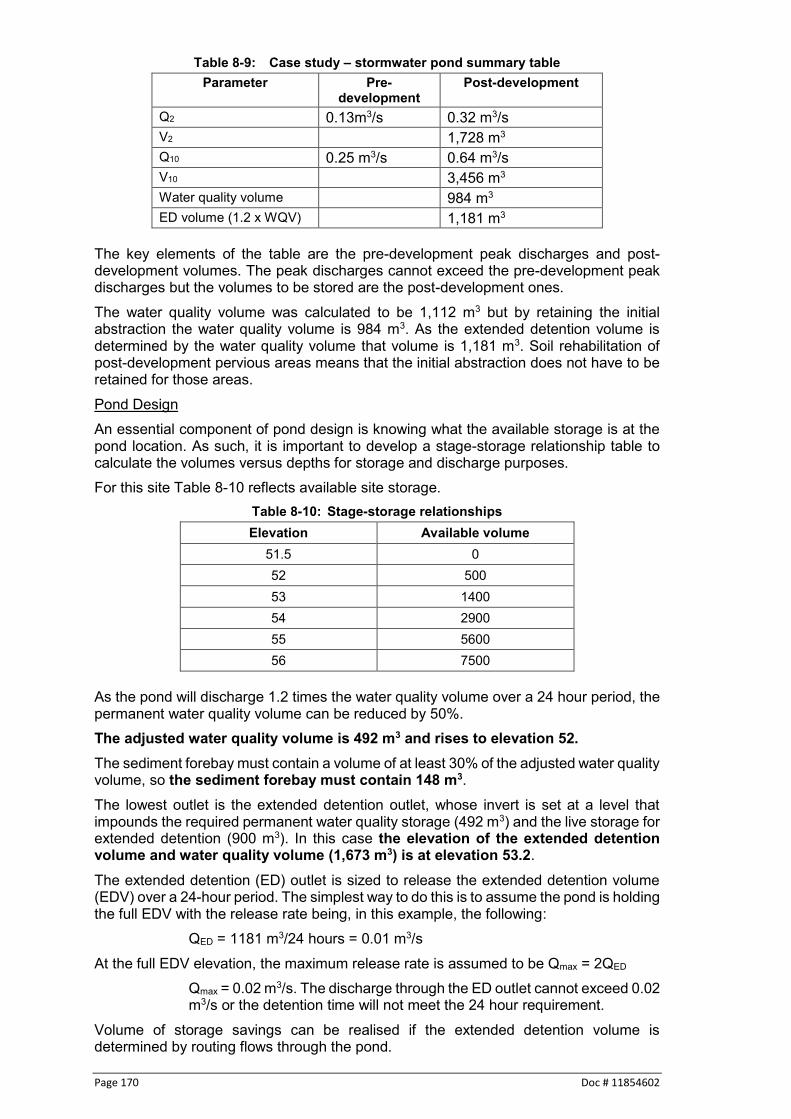
Page 170 Doc # 11854602
Table 8-9: Case study – stormwater pond summary table Parameter Pre-
development Post-development
Q2 0.13m3/s 0.32 m3/s V2 1,728 m3 Q10 0.25 m3/s 0.64 m3/s V10 3,456 m3 Water quality volume 984 m3
ED volume (1.2 x WQV) 1,181 m3
The key elements of the table are the pre-development peak discharges and post-development volumes. The peak discharges cannot exceed the pre-development peak discharges but the volumes to be stored are the post-development ones. The water quality volume was calculated to be 1,112 m3 but by retaining the initial abstraction the water quality volume is 984 m3. As the extended detention volume is determined by the water quality volume that volume is 1,181 m3. Soil rehabilitation of post-development pervious areas means that the initial abstraction does not have to be retained for those areas. Pond Design An essential component of pond design is knowing what the available storage is at the pond location. As such, it is important to develop a stage-storage relationship table to calculate the volumes versus depths for storage and discharge purposes. For this site Table 8-10 reflects available site storage.
Table 8-10: Stage-storage relationships Elevation Available volume
51.5 0 52 500 53 1400 54 2900 55 5600 56 7500
As the pond will discharge 1.2 times the water quality volume over a 24 hour period, the permanent water quality volume can be reduced by 50%. The adjusted water quality volume is 492 m3 and rises to elevation 52. The sediment forebay must contain a volume of at least 30% of the adjusted water quality volume, so the sediment forebay must contain 148 m3. The lowest outlet is the extended detention outlet, whose invert is set at a level that impounds the required permanent water quality storage (492 m3) and the live storage for extended detention (900 m3). In this case the elevation of the extended detention volume and water quality volume (1,673 m3) is at elevation 53.2.
The extended detention (ED) outlet is sized to release the extended detention volume (EDV) over a 24-hour period. The simplest way to do this is to assume the pond is holding the full EDV with the release rate being, in this example, the following:
QED = 1181 m3/24 hours = 0.01 m3/s At the full EDV elevation, the maximum release rate is assumed to be Qmax = 2QED
Qmax = 0.02 m3/s. The discharge through the ED outlet cannot exceed 0.02 m3/s or the detention time will not meet the 24 hour requirement.
Volume of storage savings can be realised if the extended detention volume is determined by routing flows through the pond.

Doc # 11854602 Page 171
Calculate the low flow orifice by assuming an orifice size and ensuring that the outlet discharge does not exceed Qmax.
Q = 0.62A(2gh)0.5 where A = area of ED orifice Try an orifice size of 100 mm diameter Where h = 53.2 - (52 + .05) where D is the ED outlet diameter h = 1.17 m
Q = 0.62(0.00785)((2)(9.8)(1.15))0.5 = 0.023 m3/s which is too large. Try an orifice size of 90 mm.
Q = 0.019 which meets the design criteria. As the orifice size is greater than 50 mm, a cover plate or screen is not required to prevent clogging of the orifice but is still recommended.
ED orifice is 90 mm. Consideration of 2 and 10-year ARI event control will consist of consideration of a rectangular weir to provide for the appropriate outflow rates. Peak outflows should not exceed the pre-development peak discharges which are 0.13 m3/s and 0.25 m3/s. To size the weir we can ignore the outflow that occurs during the rainfall and size the weir so the entire runoff volume can be held with the outflow rate not exceeding the pre-development peak flows. Routing of flows through the pond is also acceptable for this calculation but not for determining the ED volume sizing. 2-year ARI event Pond volume required for the post-development case = 492 (WQ vol.) + 1,728 (2-year post-development volume) = 2,220 m3 Ponded water level is at 53.5 m. Outflow must be determined using the ED orifice and an outlet structure (rectangular weir). Weir invert level is at elevation 52.8 m. Outflow from ED orifice = Q = 0.62A(2gh)0.5
h = 53.5 - (52 + 0.09/2) = 1.45 m QED = 0.62(.0063)((28.42))0.5 = 0.02 m3/s from ED orifice.
Outflow over weir = Q = 1.7 Lh where L = weir width Try L = 220 mm Q = 1.7(.225)(0.3) = 0.11 m3/s
Total outflow = ED + 2-year discharges = 0.02 + 0.11 = 0.13 m3/s which meets the 2-year peak control requirement. So 2-year weir width = 220 mm 10-year ARI event Pond volume required for the post-development case = 492 (WQ vol.) + 3,456 (10-year post-development volume) = 4715 m3 Ponded water level is at elevation 54.3 m. Outflow must be determined using the ED orifice and the 2-year weir control. Outflow from ED orifice = Q = 0.62A(2gh)0.5
H = 54.6 - (52 + 0.09/2) = 2.55 m QED = 0.62(.0063)((49.98))0.5 = 0.027 m3/s from ED orifice. QED = 0.027 m3/s 2-year weir flow = 1.7Lh = 1.7(.220)(1.1) = 0.41 m3/s.

Page 172 Doc # 11854602
Total peak discharge using 2-year weir and ED orifice = 0.41 + 0.027 = 0.44m3/s which exceeds the 10-year maximum discharge criteria (0.25 m3/s). There is little difference between the extended detention requirement and the 2-year peak control rainfalls so the 2-year weir can be fairly large (220 mm) and meet the 2-year peak control requirement. The 10-year rainfall is considerably larger and the elevational difference in storage means that the 2-year weir width must be decreased to meet the 2-year peak control requirements. The advantage is that a weir having a width of 130 mm will control the 2 and 10-year storms. So, the design has an extended detention orifice of 90 mm and a broad crested weir having a width of 130 mm to provide control of all three storms.

Doc # 11854602 Page 173
8.5.7 Wetlands
Description: Wetlands are designed and constructed to capture and treat stormwater runoff through:
Sedimentation Filtration Adsorption, and Biological uptake
Wetlands are complex natural water environments that are dominated by hydrophytic (water loving) vegetation. They differ from stormwater wet ponds that are dominated by large areas of open water. Until recently, the filling and draining of wetlands was accepted practice to “improve” land. We now know that wetlands provide many important benefits including the attenuation of flood flows, maintenance of water quality and support aquatic life and wildlife. Constructed wetlands have become increasingly popular in recent years for improvement of water quality. Wetlands can be designed to accomplish a number of objectives including the following118:
Flood protection
Flow attenuation
Water quality improvement
Landscape
Recreational amenity, and
Provision of wildlife habitat. From a contaminant removal perspective, wetlands provide a number of different removal processes that are not available in deeper wet ponds. Those removal processes are listed in Table 8-11.
118 Wong et al, 1998

Page 174 Doc # 11854602
Table 8-11: Stormwater contaminant removal mechanisms of constructed wetlands119 Contaminant Removal Processes
Organic matter Biological degradation, sedimentation, microbial uptake Organic contaminants Adsorption, volatilisation, photosynthesis and biotic/abiotic (pesticides)
degradation Suspended solids Sedimentation, filtration Nitrogen Sedimentation, nitrification/denitrification, microbial uptake, plant
uptake, volatilisation Phosphorus Sedimentation, filtration, adsorption, plant and microbial uptake Pathogens Natural die-off, sedimentation, filtration, predation, UV degradation,
adsorption Heavy metals Sedimentation, adsorption, plant uptake
A key benefit of a stormwater wetland is its shallow nature. The shallow nature promotes dense vegetation growth that acts as a natural barrier to small children or the general public. Being shallow water systems, they do not have the safety concerns that deeper ponds have. Fewer safety concerns are an important consideration in selecting wetlands for water quality treatment. Two types of wetlands will be discussed in this section: wetland ponds and wetland swales.
Basic design parameters
It is important to specify the contaminants that a stormwater treatment wetland is designed to treat, as effective treatment of different contaminants can require markedly different detention times within the wetland. Suspended solids are at one end of the treatability spectrum and require a relatively short detention time to achieve a high degree of removal. At the other end of the treatability spectrum are the nutrients nitrogen and phosphorus. Given sufficient area and time, wetlands are capable of removing nutrients to very low levels but their efficiency depends on their design. The most common design priority for vegetated wetlands in the Waikato region will be for the removal of:
Sediments,
Hydrocarbons,
Dissolved metals, and
Nutrients. Wetlands are most appropriate on sites that meet or exceed the following criteria:
Catchment areas at least 2 hectares in size (as stated in Table 6-5)
Soils that are silty through clay
No steep slopes or slope stability issues, and
No significant space limitations. Hydrology is the single most important criterion for determining the success of a constructed wetland. They should therefore only be used in areas that have enough inflow from rain, upstream runoff or groundwater to ensure the long-term viability of wetland processes. Design parameters for wetlands are the same as the parameters for wet ponds in the context of storm peak control and stream channel erosion control. So the same design procedures need to be followed. There is some difference in water quality sizing related to the following:
119 Mitchell, 1996

Doc # 11854602 Page 175
Depth of standing water. and
Water quality volumes. Depth of standing water Wetlands are shallow water systems and do not contain large volumes of water per surface area as do wet ponds. The design approach for a constructed wetland is the banded bathymetric design as detailed in Figure 8-28. A banded bathymetric design is preferred for having variable depth that allows for dispersed flow of stormwater through vegetation and has deeper areas for fish, which will assist in preventing mosquito problems. The proposed depth ranges and areas for a vegetated wetland having a banded bathymetric design are the following: Banded bathymetric design % total wetland pool area Dead storage 0.35 -1.0 m depth 40 Dead storage at 0 – 0.35 m depth 60 The banded bathymetric design is recommended due to its configuration providing a reasonable expectation of uniform flow throughout the wetland. No areas of a wetland other than the sediment forebay should be deeper than 1 metre. Water quality volumes As Table 8-11 lists the variety of removal processes that wetlands use to remove contaminants, sedimentation is only one of those processes with the others relying on contact between stormwater contaminants and plants and organic matter. As can be seen from Figure 8-28, wetlands are shallow water systems and rely more on surface area than on having a specific volume of storage.

Page 176 Doc # 11854602
Figure 8-28: Banded bathymetric wetland schematic120
There are several approaches to considering a surface area requirement. The first approach is to use the wetland surface area as a proportion of the catchment area and a recent publication121 recommends a ratio of wetland area to catchment area of 3%. In a similar fashion a report out of Australia122 relates hydrologic effectiveness to wetlands having a surface area as a percentage of catchment area and indicates a desirable ratio of approximately 2% for a catchment of 30% imperviousness and a 72 hour detention time for nitrogen reduction. Another approach is to relate hydrologic effectiveness to wetland storage as a percentage of annual runoff volume. The same report122 shows a “knee” point of approximately 2% where benefits start to wane for further increases in storage. Again, this design is based on the removal of nutrients as a key objective. The ratios in both publications relate to nutrient capture and may be considered appropriate where stormwater runoff is discharged to lakes, but in general the broader range of contaminants of concern in the Waikato Region are sediments, metals (lead, copper, zinc) and nutrients may result in a variety of sizes and detention. As a result, the recommended approach for wetland design is to be conservative and have the surface area of the wetland as 3% of the overall catchment area draining to the wetland when imperviousness of the contributing catchment is less than 69%. Once
120 Auckland Regional Council, 2003 as modified 121 Capiella et al, 2008 122 Wong et al, 1999

Doc # 11854602 Page 177
imperviousness exceeds 70% the surface area requirement increases to 4% of the overall catchment area. Soils An important element of wetland function is the need to maintain hydric conditions for wetland plants. As such, a soils analysis of the invert of the wetland shall be undertaken to ensure that the wetland area will retain water. The following points discuss this issue.
Looking over the NIWA climate report for Waikato, evapotranspiration is at its greatest in January with the Thames area and Taupo having the highest rates. If maximum rates are considered rather than the average ones it comes out to about 5 mm per day, which is a fitting conservative value to use.
A number of values for permeability rates and incorporated evapotranspiration were considered with the result being a value of 0.05 µm/s being a reasonable value. This value would give a daily rate of 4.3 mm and when maximum evapotranspiration is included the result is approximately 9.3 mm/day reduction in water level surface.
The average inter-event dry periods for various locations in the Waikato region are approximately 5 days during the summer months. Using 0.05 µm/s as the permeability rate would mean that a wetland having an approximate depth of 300 mm would take approximately 32 days to lose its standing water.
This value assumes no reduction in permeability due to deposition of sediments and organic matter to the wetland base that would further reduce permeability. It assumes the maximum evapotranspiration rates for the full 32 days. Considering the evapotranspiration rates, there is a considerable drop in that maximum rate outside of the month of January.
It is recommended that when designing a constructed wetland, if the soil permeability rate is less than or equal to 0.05 µm/s then a liner/impermeable layer is not required in the base of the wetland. If the permeability rate is greater than 0.05 µm/s then a liner/impermeable layer is required to achieve the maximum permeability of 0.05 µm/s. Groundwater levels If a constructed wetland is proposed in an area with known high groundwater levels, the groundwater level can be taken into account when considering the need for a liner/impermeable layer in the base of the wetland, regardless of the soil permeability. If the groundwater level, at the lowest level during the year, is above the base of the wetland then the soil analysis is not of great importance as evapotranspiration will not lower the water level in the wetland. In those situations, a liner/impermeable layer is not necessary even in permeable soils to maintain wetland vegetation. However if groundwater levels are high, consideration will need to be made to the impact of groundwater on storage/detention volumes in the constructed wetland. The key requirement when using groundwater to establish the wetland permanent pool is to provide groundwater monitoring wells in the wetland location and monitor groundwater levels as per the following criteria. Depth to groundwater at the location of a proposed impermeable/lined constructed wetland is to be determined through groundwater level monitoring for a minimum of 3 readings over a period of 3-4 months (August to November) sufficient to assess the winter high groundwater level, at a minimum of 1 groundwater monitoring well/piezometer location. Depth to groundwater at the location of a proposed unlined constructed wetland is to be determined through groundwater level monitoring for a minimum of monthly readings over 12 months at a minimum of 1 groundwater monitoring well/piezometer location. Monitoring wells should be of a suitable depth and construction to monitor the near-surface groundwater table only (e.g. screened response zone 2-5m below ground level).

Page 178 Doc # 11854602
If the year is abnormally wet or dry then the monitoring discussed above should be repeated the following year to provide assurance that permanent groundwater levels are understood. The longer the time period of monitoring, the greater the assurance of maintaining hydric conditions in the wetland. Where there is a Catchment Management Plan (CMP) for the area in question, it is expected that the CMP will provide further information about groundwater levels in the catchment. The difference in the above requirements relates to whether the wetland is proposed to have an impermeable layer or not. If the wetland is to have an impermeable layer, the winter high groundwater level is critical to understand in terms of potential impacts on wetland performance (impact on storage/detention volumes). If the wetland isn’t to have an impermeable layer then ideally the full range of groundwater levels needs to be understood in terms of both the impacts of groundwater on storage/detention volumes during winter high groundwater levels, and drawdown and associated effects on vegetation during summer low groundwater levels.
Detailed design procedure
The design basis for a stormwater wetland is twofold:
Water quality objectives are achieved by sizing the wetland surface area to 3% of the catchment drainage area draining to the wetland for sites having imperviousness less than 70% of the site area. Where imperviousness exceeds 70% then the wetland surface area must be at least 4% of the catchment area. The wetland depths are then provided through the relative depths provided in the above depth discussion.
Intermediate storm control and extended detention objectives are met through the same calculations discussed in the wet pond Section that include reductions in storage volume due to retention of the initial abstraction.
Situations where there is no requirement for extended detention must consider velocities through the wetland such that biological function is not adversely impacted. In those situations, the maximum velocity of stormwater through the wetland shall not exceed 0.1 m/s during the water quality storm. Where extended detention is required there is no need for velocity reduction consideration as the 24 hour discharge time period ensures low velocities.
Forebay design is identical to the design detailed in Section 8.5.6.5. The design steps are the following:
1. Calculate the wetland surface area as at least 3% of the contributing catchment area. Once imperviousness exceeds 70% the surface area requirement increases to 4% of the overall catchment area.
2. The shape of the wetland should generally be that its length should be at three times its width. These criteria can be relaxed if extended detention is required as flows will be significantly reduced and the length to width ratio is not as important.
3. Using the depth discussion above ensure that the percentage of wetland depths meet the above criteria with a banded bathymetric design.
4. Calculate the water quality volume that the wetland would have in an identical approach to the wet pond water quality volume. Take 15% of that volume as the necessary volume of a sediment forebay. The surface area determined from this approach can reduce the wetland surface area, as the two areas together can meet the 3% (or 4%) criteria.
5. Determine whether the project needs peak flow control and stream channel erosion control through extended detention.
6. Do calculations identical to the wet pond design for extended detention release sizing and outlet sizing for the 2 and 10-year ARI event.

Doc # 11854602 Page 179
The following table provides a list of plant species for general consideration for use in wetlands. Plants for a given project should be considered for suitability by an appropriately skilled practitioner.
Table 8-12: Preferred vegetation for optimised vegetated wetlands Deep zone: 0.6 – 1.1m Baumea articulata Eleocharis sphacelata Schoenoplectus validus
Typha orientalis (raupo) Myriophyllum propinqum (water milfoil) Potamogeton cheesemanii (manihi)
Shallow zone: 0.3-0.6m Baumea articulata Bolboschoenus fluviatilus Eleocharis sphacelata Eleocharis acuta Carex secta
Schoenoplectus validus Typha orientalis Isolepis prolifer Juncus gregiflorus
Wet margin: 0-0.3m Baumea teretifolia Baumea rubiginosa Carex secta Eleocharis acuta
Juncus gregiflorus Carex virgate Cyperus ustulatus (giant umbrella sedge) Phormium tenax (flax)
Live storage zone (periodically inundated) Syzygium maire (swamp maire) Carex virgata Carex lessoniana (rautahi) Carex dissita (flat leaved sedge) Cyperus ustulatus Juncus articulatus Juncus pallidus
Dacrycarpus dacrydioides (kahikatea) Cordylina australis (cabbage tree) Baumea rubiginosa Phormium tenax (flax) Coprosma tenuicaulis (swamp coprosma) Blechnum novae-zelandiae (swamp kiokio)
Land edge: Coprosma robusta (karamu) Phormium tenax Cordyline australis Carpodetus serratus (putaputa weta) Laurelia novae-zelandiae (pukatea) Leptospermum scoparium (manuka)
Schefflera digitata (pate) Melicytus ramiflorus (mahoe) Pneumatopteris pennigera (gully fern) Dacrycarpus dacrydioides (kahikatea) Cortaderia fuluida (toetoe)
Wetland swale design
Wetland swales consist of broad open channels in areas where slopes are slight, water tables are high or, on a seasonal basis, there is base flow, and there are saturated soil conditions. If soil is saturated for more than two weeks, normal grasses will not grow. Wetland swales are similar to normal constructed wetlands in their use of vegetation to treat stormwater runoff. The wetland swale acts similarly to a long and linear shallow wetland treatment practice. Figure 8-29 shows a typical cross-section for a wetland swale. Design considerations There are two separate approaches that can be used for sizing wetland swales.
Storage of the water quality volume generated by the upstream catchment, or
Ensuring wetland swale residence times exceed 9 minutes. For the purposes of this guideline, the recommended approach is ensuring residence times exceed 9 minutes. As the wetland swale will, for the most part, have water in it with standing vegetation, the vegetation may not be as dense as vegetation in a normal vegetated swale. This will result in using a Manning’s roughness coefficient of 0.1. As a result, wetland swales will either be longer or wider than normal vegetated swales. There are several key design elements to a wetland swale.
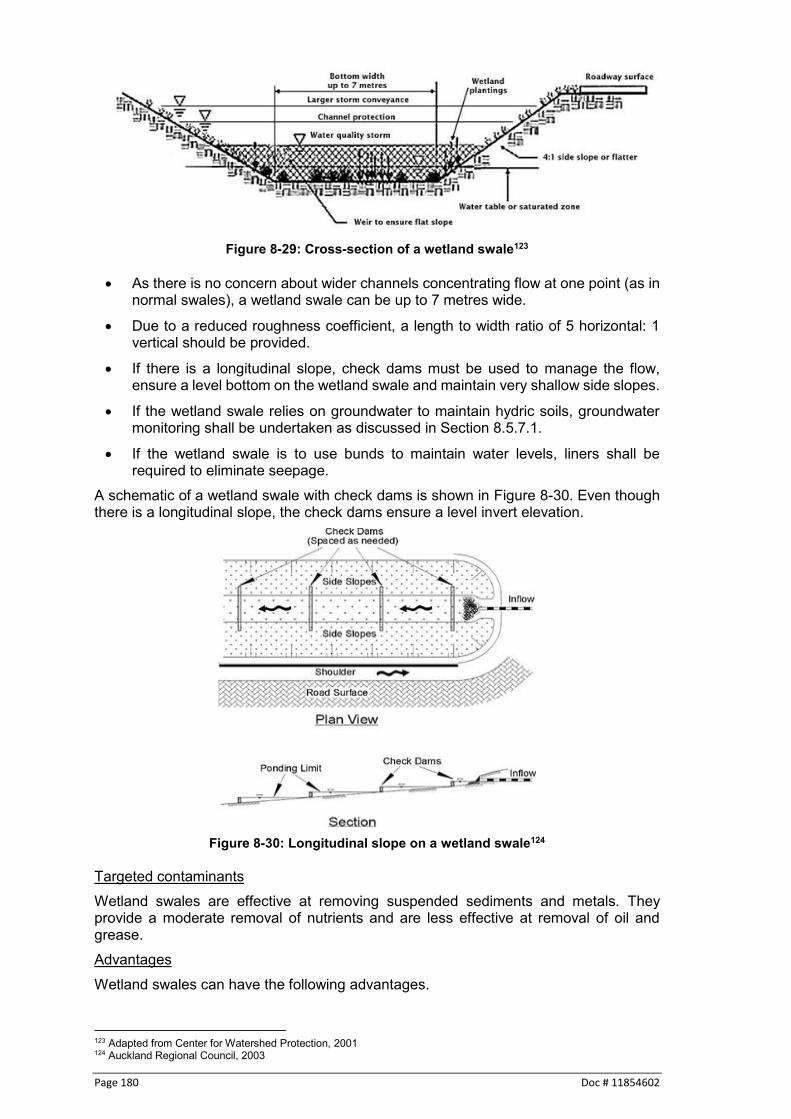
Page 180 Doc # 11854602
Figure 8-29: Cross-section of a wetland swale123
As there is no concern about wider channels concentrating flow at one point (as in
normal swales), a wetland swale can be up to 7 metres wide.
Due to a reduced roughness coefficient, a length to width ratio of 5 horizontal: 1 vertical should be provided.
If there is a longitudinal slope, check dams must be used to manage the flow, ensure a level bottom on the wetland swale and maintain very shallow side slopes.
If the wetland swale relies on groundwater to maintain hydric soils, groundwater monitoring shall be undertaken as discussed in Section 8.5.7.1.
If the wetland swale is to use bunds to maintain water levels, liners shall be required to eliminate seepage.
A schematic of a wetland swale with check dams is shown in Figure 8-30. Even though there is a longitudinal slope, the check dams ensure a level invert elevation.
Figure 8-30: Longitudinal slope on a wetland swale124
Targeted contaminants Wetland swales are effective at removing suspended sediments and metals. They provide a moderate removal of nutrients and are less effective at removal of oil and grease. Advantages Wetland swales can have the following advantages.
123 Adapted from Center for Watershed Protection, 2001 124 Auckland Regional Council, 2003

Doc # 11854602 Page 181
Having an outlet structure for the wetland swale can provide for peak flow control and extended detention,
They can accentuate the natural landscape,
Contaminant removal efficiency can be improved over a normally dry swale, and
They enhance biological diversity and create beneficial habitat between upland areas and streams.
Limitations Wetland swales are not practical in areas of steep topography and are not practical when driveway crossings are required unless significant opening areas are provided. Design sizing The design approach takes the designer through a series of steps that consider swale performance for water quality treatment and consideration of larger flows to ensure that scour or resuspension of deposited sediments does not occur.
1. Estimate runoff flow rate from the water quality storm using 1/3 of the 2-year storm as the water quality storm and calculate the flows. Wetland swales are designed by flow rate as discussed in Section 8.5.1.
2. Design should use the Waikato Stormwater Runoff Modelling Guideline. 3. Establish the longitudinal slope of the wetland swale. The maximum slope (with
or without check dams) should be less than 2%. 4. Select wetland vegetation cover. Types of wetland vegetation to recommend are
detailed in Table 8-12 above.
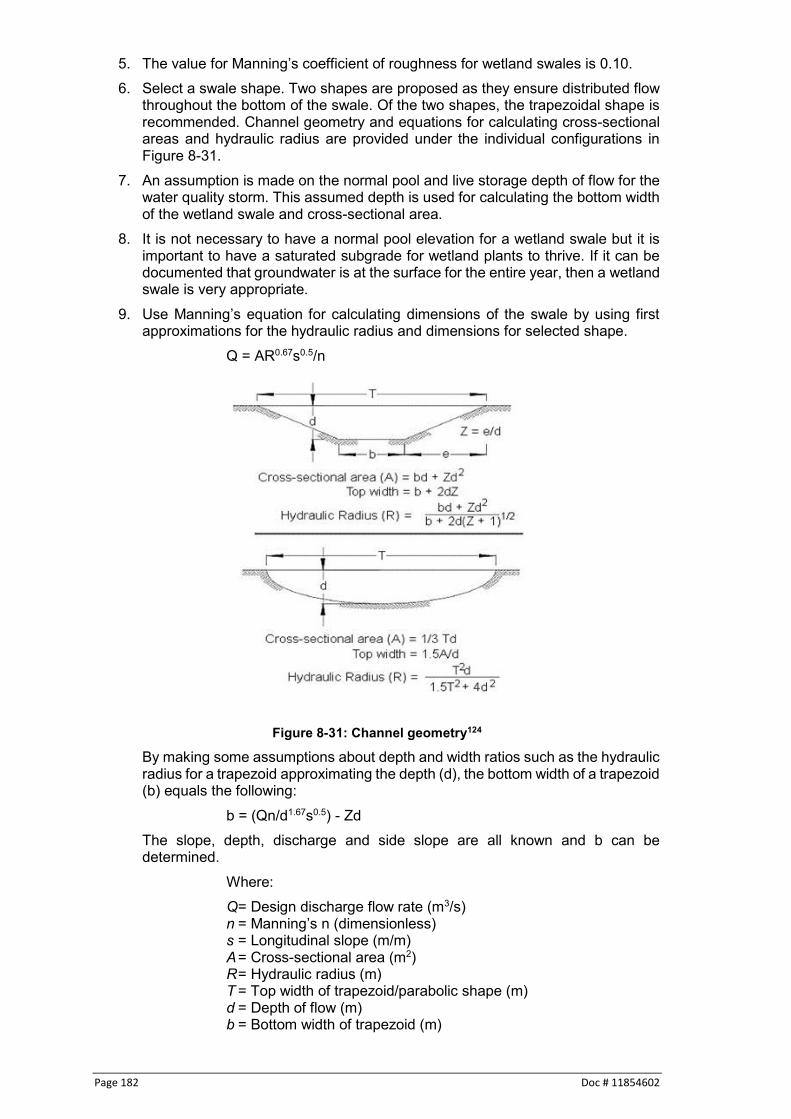
Page 182 Doc # 11854602
5. The value for Manning’s coefficient of roughness for wetland swales is 0.10. 6. Select a swale shape. Two shapes are proposed as they ensure distributed flow
throughout the bottom of the swale. Of the two shapes, the trapezoidal shape is recommended. Channel geometry and equations for calculating cross-sectional areas and hydraulic radius are provided under the individual configurations in Figure 8-31.
7. An assumption is made on the normal pool and live storage depth of flow for the water quality storm. This assumed depth is used for calculating the bottom width of the wetland swale and cross-sectional area.
8. It is not necessary to have a normal pool elevation for a wetland swale but it is important to have a saturated subgrade for wetland plants to thrive. If it can be documented that groundwater is at the surface for the entire year, then a wetland swale is very appropriate.
9. Use Manning’s equation for calculating dimensions of the swale by using first approximations for the hydraulic radius and dimensions for selected shape.
Q = AR0.67s0.5/n
Figure 8-31: Channel geometry124
By making some assumptions about depth and width ratios such as the hydraulic radius for a trapezoid approximating the depth (d), the bottom width of a trapezoid (b) equals the following:
b = (Qn/d1.67s0.5) - Zd The slope, depth, discharge and side slope are all known and b can be determined.
Where: Q = Design discharge flow rate (m3/s) n = Manning’s n (dimensionless) s = Longitudinal slope (m/m) A = Cross-sectional area (m2) R = Hydraulic radius (m) T = Top width of trapezoid/parabolic shape (m) d = Depth of flow (m) b = Bottom width of trapezoid (m)

Doc # 11854602 Page 183
For a parabola, the depth and discharge are known so the top width can be solved for. Knowing b (trapezoid) or T (parabola), the cross-sectional area can be determined by the equations in Figure 8-32.
Calculate the swale velocity from the following equation: V = Q/A
If V > 0.8 m/s repeat steps 1 - 9 until the velocity is less than 0.8 m/s. 11. Calculate the swale length (L in metres)
L = Vt (60 s/minute) Where t = residence time in minutes.
Flows in excess of the water quality storm It is expected that runoff from events larger than the water quality design storm will go through the wetland swale. In that situation, a stability check should be performed to ensure that the 10-year 1-hour storm does not cause erosion. For the 10-year storm, flow velocities should not exceed 1.5 m/s, although higher velocities may be designed for with appropriate erosion protection. When considering larger storms consideration must be given to increased rainfall values as a result of climate change, refer to Section 7.1.6 for details. If extended detention and/or peak flow control is a requirement for a specific project, the outlet of the wetland swale can be modified so that storage volumes are provided.
Case study – Wetland swale
Project description
An access road, driveways and pasture for a 3 lot rural subdivision is proposed to drain to a wetland swale. The lane is 6.4 metres wide and 400 metres long, the three driveways are each 3.4 metres wide and 75 metres long and the pasture area is approximately 10,000 m2. Hydrology
Pre-development land use is pasture on a 2% - 7% slope. A = catchment area in hectares = 1.33 ha. Qwq = 0.04 m3/s Q10 = 0.1 m3/s Swale Design
Slope of swale alignment = 0.02 Several assumptions have to be made regarding the swale, first of which is that the wetland swale will have a trapezoidal design. Side slopes (Z) will then be recommended and an assumption of design storm depth should be made. That value may change depending on the velocity of flow being less than 0.8 m/s. For this case study, Z = 4 and the depth of flow = 100 mm. The static water level (or dead storage) in the wetland swale is estimated to be 100 mm deep as check dams have been designed to maintain a level bottom, but that storage cannot be considered in terms of flow velocities. Since storm flow will overtop the check dams, the slope to use in calculations is the longitudinal slope and not permanent water elevation slope. Based on the value for Q and s, and the assumptions for n and d, solve for the swale bottom width (b).
b = (Qn/d1.67s0.5) - Zd
b = ((.04)(.1)/(.11.67)(.020.5)) - (4)(.1) = 0.97 m
Calculate the top width
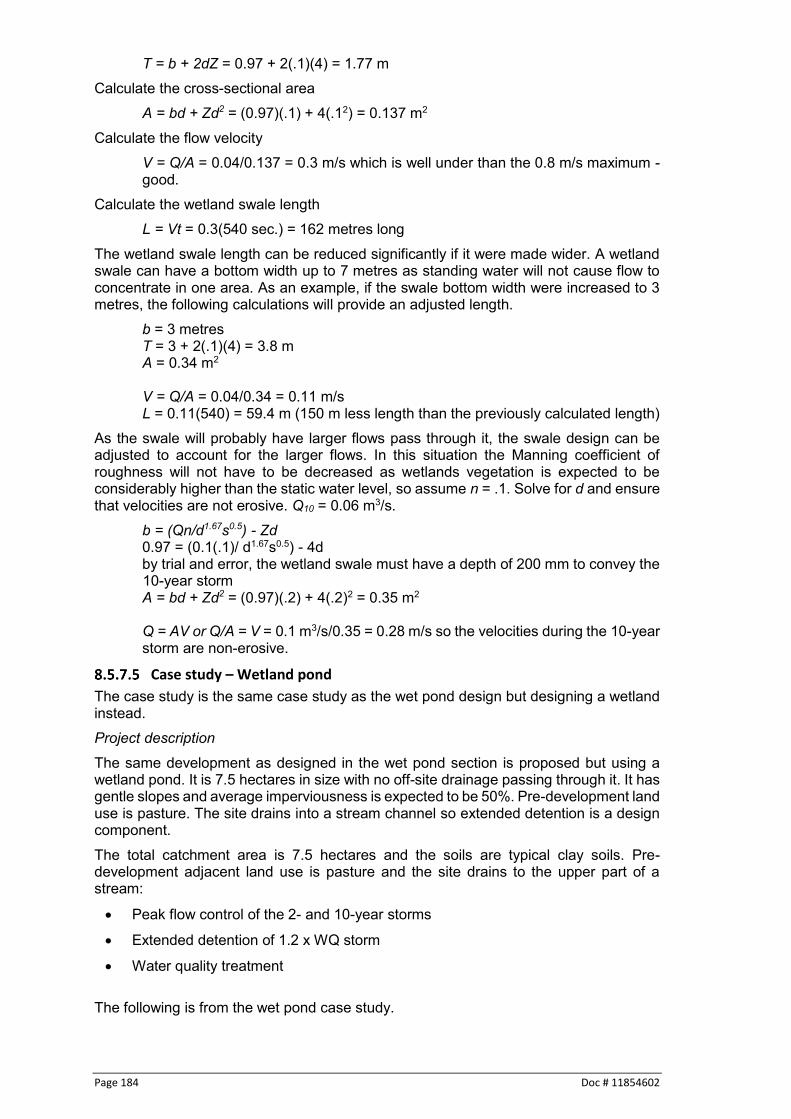
Page 184 Doc # 11854602
T = b + 2dZ = 0.97 + 2(.1)(4) = 1.77 m Calculate the cross-sectional area
A = bd + Zd2 = (0.97)(.1) + 4(.12) = 0.137 m2 Calculate the flow velocity
V = Q/A = 0.04/0.137 = 0.3 m/s which is well under than the 0.8 m/s maximum - good.
Calculate the wetland swale length L = Vt = 0.3(540 sec.) = 162 metres long
The wetland swale length can be reduced significantly if it were made wider. A wetland swale can have a bottom width up to 7 metres as standing water will not cause flow to concentrate in one area. As an example, if the swale bottom width were increased to 3 metres, the following calculations will provide an adjusted length.
b = 3 metres T = 3 + 2(.1)(4) = 3.8 m A = 0.34 m2 V = Q/A = 0.04/0.34 = 0.11 m/s L = 0.11(540) = 59.4 m (150 m less length than the previously calculated length)
As the swale will probably have larger flows pass through it, the swale design can be adjusted to account for the larger flows. In this situation the Manning coefficient of roughness will not have to be decreased as wetlands vegetation is expected to be considerably higher than the static water level, so assume n = .1. Solve for d and ensure that velocities are not erosive. Q10 = 0.06 m3/s.
b = (Qn/d1.67s0.5) - Zd 0.97 = (0.1(.1)/ d1.67s0.5) - 4d by trial and error, the wetland swale must have a depth of 200 mm to convey the 10-year storm A = bd + Zd2 = (0.97)(.2) + 4(.2)2 = 0.35 m2
Q = AV or Q/A = V = 0.1 m3/s/0.35 = 0.28 m/s so the velocities during the 10-year storm are non-erosive.
Case study – Wetland pond
The case study is the same case study as the wet pond design but designing a wetland instead. Project description
The same development as designed in the wet pond section is proposed but using a wetland pond. It is 7.5 hectares in size with no off-site drainage passing through it. It has gentle slopes and average imperviousness is expected to be 50%. Pre-development land use is pasture. The site drains into a stream channel so extended detention is a design component. The total catchment area is 7.5 hectares and the soils are typical clay soils. Pre-development adjacent land use is pasture and the site drains to the upper part of a stream:
Peak flow control of the 2- and 10-year storms
Extended detention of 1.2 x WQ storm
Water quality treatment The following is from the wet pond case study.

Doc # 11854602 Page 185
Table 8-13: Wetland case study - summary table Parameter Pre-development Post-development
Q2 0.13m3/s 0.32 m3/s V2 1,728 m3 Q10 0.25 m3/s 0.64 m3/s V10 3,456 m3 Water quality volume 984 m3
ED volume (1.2 x WQ *V) 1,181 m3
Wetland design
1. Water quality Volume = 984 m3 and the wetland forebay must be 15% of the water quality volume. Sediment forebay size is 148 m3 The surface area of the wetland will be 3% of the contributing catchment area, which is 7.5 hectares. Wetland surface area is 2,250 m2 Since extended detention is a design requirement, the length to width ratio is not as important but for this case study a length to width ratio would provide a general shape of approximately 30 metres wide by 80 metres long. To have the depths defined we use the relationships provided above. Banded bathymetric design % total wetland pool area Areal Extent (m2) Dead storage 0.5 -1.0 m depth 40 900 Dead storage at 0 – 0.5 m depth 60 1350 The forebay volume can be taken from the deeper dead storage so if the forebay is 1.5 m deep, the surface area is 98 m2 so the dead storage for other areas of the wetland deeper than 0.5 m = 502 m2. Figure 8-32 shows this visually. As the forebay elevation is considered part of the wetland surface area, the areas detailed in the banded bathymetric design have been reduced proportionally to account for the forebay area. If the individual areas are added together the total recommended levels are achieved.
2. Extended detention design and peak storm control are undertaken identically as the wet pond design detailed design procedure. They are not replicated here but are detailed in the Wet Pond case study section under the Extended Detention and 2- and 10-year sections of the case study.

Page 186 Doc # 11854602
Figure 8-32: Wetland case study – percentage areas125
125 Adapted from Auckland Regional Council, 2003

Doc # 11854602 Page 187
8.5.8 Green roofs
Description of practice
Description: Green roofs are roofs with a growing media that reduces stormwater runoff through evaporation and evapotranspiration. Their primary benefit from a stormwater management perspective is to reduce the total volume of stormwater runoff.
Green roofs are roof systems that incorporate a growing media and plants to provide a semi-permeable surface on roofs that would normally consist of impervious surfaces. A green roof more mimics a natural environment to filter precipitation through the media and allowing for the wetted media to evapotranspire between storm events. A green roof may eliminate runoff during small rainfall events and will retard the onset of stormwater runoff and increase the time of concentration from a conventional roof, thus reducing downstream stormwater effects.
Design considerations
The figure below illustrates typical green roof components which include the following:
A waterproof membrane to prevent water from leaking into the structure
A drainage layer to allow lateral movement of water to the down spout
Filter media for passage of stormwater and a growth media for plants
Mulch or other material to prevent surface wind and rain erosion, and
Plants.

Page 188 Doc # 11854602
Figure 8-33: Green roof cross-section showing components126
Green roofs are engineered systems, which address all of the critical aspects of design, including the following:
The saturated weight of the system and load bearing capacity of the underlying roof
Moisture and root penetration resistance through use of a waterproof membrane,
Resistance to wind sheer, management of drainage
Vertical drainage features, and
The suitability of the proposed plant material. There are generally considered to be two types of green roofs.
Extensive green roofs, which are shallow systems having less than 100 mm of media, which are not being advocated by this toolbox, and
Intensive green roofs, which are deeper systems having more than 150 mm of media.
Targeted contaminants
From a water quality perspective, green roofs would be effective in retention of fine, wind-blown sediments and dissolved metals.
Advantages
Overseas data indicates that green roofs can be very effective at reducing the total volume of stormwater runoff. A study in North Carolina127 indicated that a green roof retained 45% of total annual runoff. Monitoring undertaken by the former Auckland Regional Council at the University of Auckland Engineering Building green roof indicated the following:
Depth of media between 50 – 70 mm
83 storms were monitored over 13 months
87% average reduction in peak flow rate
68% of rainfall doesn’t become runoff, and
80% retention for storms less than 25 mm of rainfall. Green roofs can be used on a variety of roof types and on any property size, as their installation will not require the use of additional land. In the Waikato Region’s temperate climate, green roofs should not be limited by the ability to establish and maintain vegetative cover.
126 Auckland Regional Council, 2003 127 Moran et al, 2005

Doc # 11854602 Page 189
Another key advantage of green roofs is that they are aesthetically pleasing. They can be very attractive. There are also benefits related to urban cooling during the summer months and insulation benefits for air conditioning and heating.
Limitations
There are several issues that may be considered as limitations:
Green roofs, as recommended in this Guideline, will necessitate increased structural strength of the roof that would increase costs.
Maintenance needs, while expected to be minimal, may be costly and difficult depending on height above ground. Also related to this is the need to provide safety features for access to the roof for maintenance
Establishment of plants and their overall survival may require watering during dry periods, at least for the first several years.
Weed removal may be a requirement depending on individual conditions.
Design sizing
There are several key elements of design that need to be addressed.
Depth of media
Composition of media
Any mechanical building services on the roof must be designed around
Plant selection
Additional support consideration
Roof slope
Drainage layer and impermeable liner, and
Stormwater management benefits.
Depth of media
There are two green roofs in the Auckland Region that are being studied for water quantity and quality benefits: the University of Auckland Engineering Building green roof, and the Waitakere City Council Headquarters building green roof. While these are more recent installations, some guidance can be given on plant propagation that relates to the depth of media. The University of Auckland site has media between 50 mm - 70 mm in depth. Over the 2007-2008 summers, plants were severely stressed due to the lack of moisture in the shallow subgrade. The Waitakere City green roof fared much better due to its depth being 70 - 150 mm.
Deeper media depths are better than shallower ones.

Page 190 Doc # 11854602
It is recommended that there be at least 150 mm of media to promote a sustainable plant community.
Composition of media
The University of Auckland site investigated a number of different media and has found that the mixture of the following provides the best results and that mixture is recommended for use.
30% zeolite,
50% pumice, and
20% composted bark. The mixture should be blended together with gentle tumbling with the maximum moisture content of 15%. Mixing when the mixture is too wet or too dry will compromise various aspects of the roof function. Approximately 20% extra mixture should be blended than needed to account for consolidation and losses.
Plant selection
New Zealand does not have any native succulents, which is the plant of choice internationally due to their ability to thrive in both wet and dry conditions. There are New Zealand plants that are suitable for green roofs, especially with the recommended depth of media being at least 150 mm. Recommended plants include the following:
Disphymae australe (NZ ice plant)
Pimelea prostrata (NZ daphne)
Libertia peregrinans (NZ Iris)
Festuca coxii (native tussock)
Comprosma Hawera
Acaena microphylla (NZ bidibid)
Lepostigma setulosaOther plants will be acceptable, but a plant specialist should be consulted prior to use due to the shallow media depths and the extremes of wetting and drying that will be encountered. In addition, the plants must be selected to survive conditions that can be more stressful than ground-level landscaping and have minimal maintenance needs.
Additional support consideration
The additional load of materials comprising the various components and an assumption of having saturated media conditions needs to be considered when accommodating the roof’s structural load. The calculation has to be based on an assumption of a saturated state. A chartered Professional Engineer must be consulted in the design and construction of a green roof system.
Roof slope
Generally, the construction effort and cost of green roofing increases with slope. Minimal slopes slow down water flow and slopes above 5° will have more rapid runoff. Due to native plants not providing the density of vegetation that would bind the media, it is recommended that green roof slopes not exceed 5° unless steps are taken to prevent media slippage and erosion.
Drainage layer and impermeable liner
The drainage layer should be a Delta NP drainage layer, or equivalent, with a non-woven geotextile, which is a two-layer drainage and waterproofing system with the cloth facing the media. The layer should be tested using ASTM E2398 – 11 Standard Test Method for Water Capture and Media Retention of Geocomposite Drain Layers for Green Roof

Doc # 11854602 Page 191
Systems, and ASTM E2396 – 11 Standard Test Method for Saturated Water Permeability of Granular Drainage Media (Falling – Head Method) for Green Roof Systems. The impermeable liner should be Permathene flexible polypropylene geomembrane (250 um), or equivalent. Both of these products can be substituted for if the substitution meets the same standards as the two presented.
Stormwater management benefits
Green roofs provide an excellent media for water quality treatment of any airborne contaminants and thus meet water quality treatment guidelines. The media recommended includes zeolite, which is a hydrated aluminosilicate mineral having a micro-porous structure. Pumice also has a very high porosity and being highly porous is very lightweight. Design can assume a 50% void ratio for the compost bark, zeolite and pumice. Stormwater quantity control is not required for green roofs.
Case study – Green roof
A typical green roof design is shown in the figure below.
Figure 8-34: Case study parameters for a green roof126

Page 192 Doc # 11854602
8.5.9 Bush revegetation
Description: Bush revegetation reduces site runoff by providing leaf canopy interception, evapotranspiration and soakage into the organic ground cover:
Evapotranspiration Soakage Flow retardance
Relating to land use, stormwater runoff is greatest from impervious surfaces. Less runoff is generated from pasturelands. Native bush that is protected from grazing and having litter and brush covering the ground generates the least amount of stormwater runoff. When land is being converted from rural to residential, commercial or industrial land use the total volume and peak rate of stormwater runoff are increased. As pastureland has a greater volume of stormwater runoff than does bush, conversion of existing pastureland into bush can reduce future runoff and mitigate for the effects of increased impervious surface generation.
Design considerations
The approach is based on extent of area that is set aside for re-establishment of bush. Key considerations related to re-establishment are the following:
Existing areas of bush that can be extended
Natural site features
Slope, and
Location of waterways. Providing additional bush to existing bush areas would increase the value of existing bush by increasing bush interior areas. This would reduce fringe vegetation that could become a weed maintenance problem. When sizing bush restoration for various lot sizes, the level of imperviousness will be very important. As lot size reduces from 1 hectare to 2,000 m2, the proportion of the site that is impervious may limit area required for bush establishment. Under an assumption of a 1 ha lot having 600 m2 of imperviousness; it will take 3500 m2 of bush to compensate for that impervious surface. If a lot is 0.5 ha and the imperviousness of the lot remains at 600 m2 the amount of bush to compensate for the impervious surface is still 3,500 m2 but that will represent approximately 70% of the site area rather than 35%. If the site area goes below 0.5 ha bush cannot compensate for 600 m2 of imperviousness.

Doc # 11854602 Page 193
The approach can be used on a subdivision or catchment wide basis, where area can be set aside, converted to bush and overall subdivision or catchment stormwater runoff reduced. It is not only an individual site practice. Revegetation does not have to totally mitigate for impervious surfaces but it can reduce stormwater runoff increases and reduce the amount of work that other devices have to accomplish to minimise adverse impacts.
Targeted contaminants
While native bush vegetation having a good ground cover can provide contaminant reduction benefits, its main purpose is the reduction of stormwater runoff volumes. Organic matter on the bush floor will remove metals and assist in removal of sediments but residential land use in rural areas does not generate large contaminant loads. Commercial and industrial land use may increase contaminant loads but other devices provided in the guidelines would provide greater levels of treatment.
Advantages
Native bush grows over time and maintenance concerns diminish. Where other stormwater management devices need maintenance to ensure long-term performance, bush revegetation improves its hydrological function over time and maintenance obligations become minimal. Native bush also provides benefits for wildlife habitat, shading and cooling during summer. It can act as a windbreak and can be an aesthetic amenity.
Limitations
Native bush planting can have fairly high maintenance needs during the first 2-3 years of growth relating to weed control and possible watering needs during drought conditions. Native bush can also be seen as limiting site usage. If some livestock were a desired activity on the site, they must be excluded from access to the bush areas to ensure that bush growth is not adversely affected. When planted in widths of less than 20 metres, weeding can remain a problem for years.
Design sizing
Bush re-establishment is based on the following Table 8-14.

Page 194 Doc # 11854602
Table 8-14: Bush planting requirements Proposed site impervious area (m2) Area of bush required (m2)
100 1,000 200 1,500 300 2,000 400 2,500 500 3,000 600 3,500
The calculations, using an annual runoff spreadsheet approach that calculates storm and base flow under various landuse scenarios128 work out to be fairly consistent. For every 100 m2 of imperviousness beyond the first 100 m2 of imperviousness there is a 500 m2 requirement for bush establishment. Recognising the significant areal extent of bush replacement, it may be best to isolate various impervious surfaces and address them separately. That would allow for several devices to provide site management without using too much of a given portion of the site to any one practice.
Case study – Bush revegetation
A house on 1 hectare is being constructed and the footprint for the house and driveway is 550 m2 of imperviousness. The site, as shown in Figure 8-35, has a house, driveway, septic system and needs 3,250 m2 to compensate for impervious surfaces. Since the roof of the house has a water tank that was designed as in the water tank design section then the 250 m2 can be excluded from the bush revegetation approach. In that case, the impervious surface is now 290 m2 so the bush replacement area is now 1,950 m2, which is a significantly reduced area. Using devices in conjunction with one another can significantly reduce the size of a device if it is used to address all of the areas.
128 Beca Carter Hollings & Ferner, 2000
Revegetation
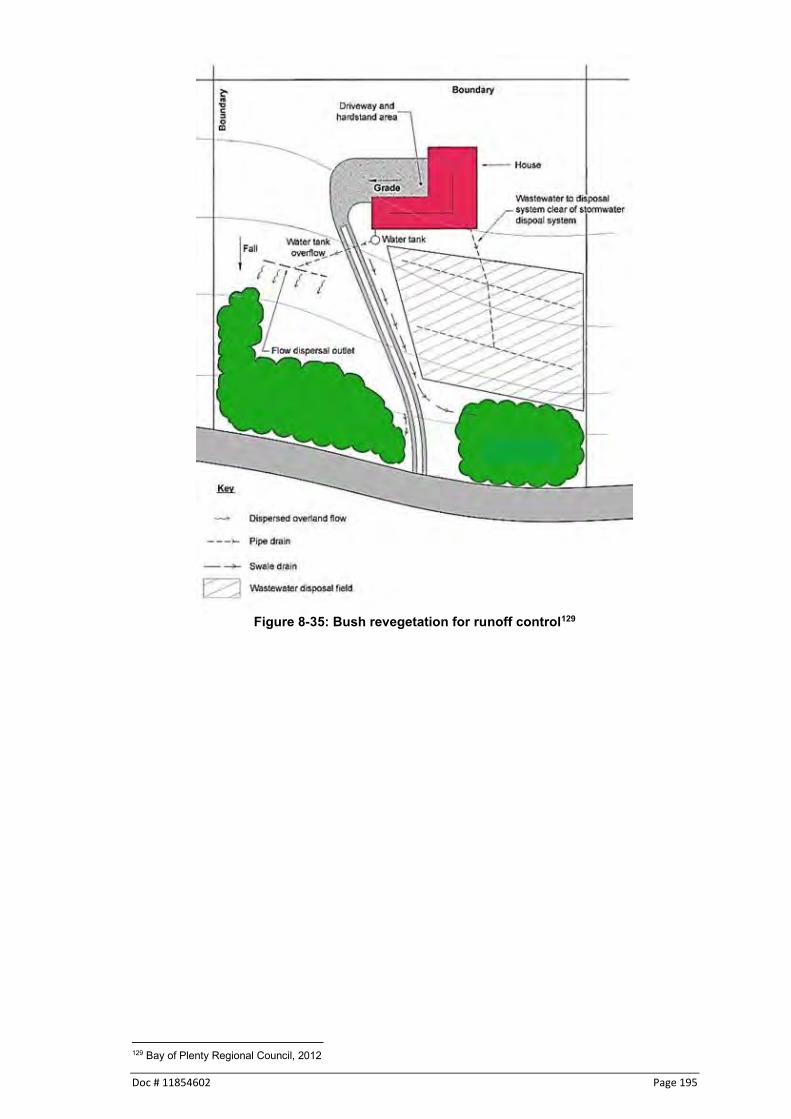
Doc # 11854602 Page 195
Figure 8-35: Bush revegetation for runoff control129
129 Bay of Plenty Regional Council, 2012

Page 196 Doc # 11854602
8.5.10 Water tanks
Description of practice
Description: Water tanks provide detention storage for stormwater runoff and water supply for domestic use. They reduce stormwater runoff through domestic use and thus reduce the total volume of stormwater being discharged during a storm event.
A water tank is a storage receptacle for stormwater runoff that is generated from roof areas. The stored water can then be used for site needs. The primary function of water tanks in a rural area is to provide water supply for residential, commercial and industrial use. In addition to the water supply benefits water tanks also reduce the total volume of stormwater runoff by redirecting the runoff to a storage tank for subsequent use for site water needs. The primary function of water tanks in an urban area is to augment water supply for residential, commercial and industrial use. In addition to the water supply benefits water tanks also reduce the total volume of stormwater runoff by redirecting the runoff to a storage tank for subsequent use for site water needs. In an urban environment there are a number of benefits to using a water tank:
Cost savings depending on size and water use
Good management of natural resources
Delayed investment in new Council infrastructure
Reduced volume and peak flow of stormwater runoff entering streams and harbours, and
Reduced possibility of sewer overflows. It is recognised that in many situations the water tank may be the only source of water for a given site. As such, the tank water will be used for potable purposes. This can involve several health and safety related issues including treating and disinfecting the roof runoff to meet appropriate water quality standards. It is suggested that professional assistance be solicited in these situations. For more information it is suggested that a copy of the Ministry of Health’s “Household Water Supply”130 document be read.
130 https://www.healthed.govt.nz/resource/household-water-supplies
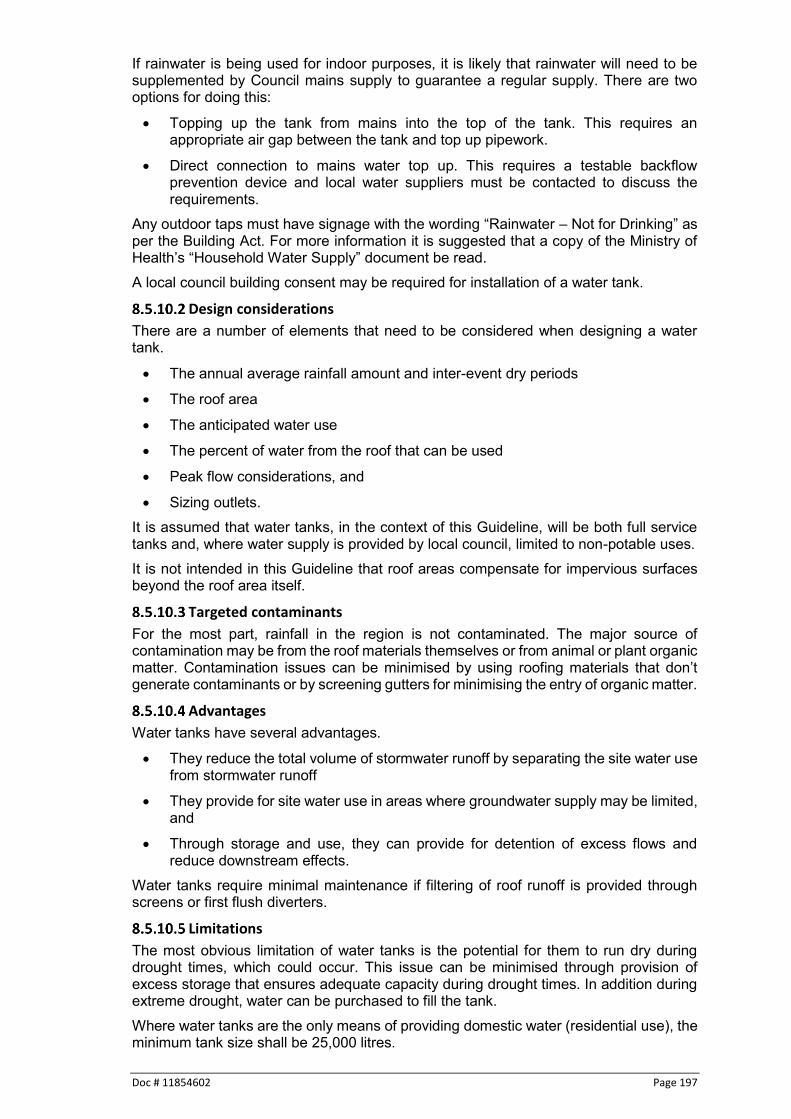
Doc # 11854602 Page 197
If rainwater is being used for indoor purposes, it is likely that rainwater will need to be supplemented by Council mains supply to guarantee a regular supply. There are two options for doing this:
Topping up the tank from mains into the top of the tank. This requires an appropriate air gap between the tank and top up pipework.
Direct connection to mains water top up. This requires a testable backflow prevention device and local water suppliers must be contacted to discuss the requirements.
Any outdoor taps must have signage with the wording “Rainwater – Not for Drinking” as per the Building Act. For more information it is suggested that a copy of the Ministry of Health’s “Household Water Supply” document be read. A local council building consent may be required for installation of a water tank.
Design considerations
There are a number of elements that need to be considered when designing a water tank.
The annual average rainfall amount and inter-event dry periods
The roof area
The anticipated water use
The percent of water from the roof that can be used
Peak flow considerations, and
Sizing outlets. It is assumed that water tanks, in the context of this Guideline, will be both full service tanks and, where water supply is provided by local council, limited to non-potable uses. It is not intended in this Guideline that roof areas compensate for impervious surfaces beyond the roof area itself.
Targeted contaminants
For the most part, rainfall in the region is not contaminated. The major source of contamination may be from the roof materials themselves or from animal or plant organic matter. Contamination issues can be minimised by using roofing materials that don’t generate contaminants or by screening gutters for minimising the entry of organic matter.
Advantages
Water tanks have several advantages.
They reduce the total volume of stormwater runoff by separating the site water use from stormwater runoff
They provide for site water use in areas where groundwater supply may be limited, and
Through storage and use, they can provide for detention of excess flows and reduce downstream effects.
Water tanks require minimal maintenance if filtering of roof runoff is provided through screens or first flush diverters.
Limitations
The most obvious limitation of water tanks is the potential for them to run dry during drought times, which could occur. This issue can be minimised through provision of excess storage that ensures adequate capacity during drought times. In addition during extreme drought, water can be purchased to fill the tank. Where water tanks are the only means of providing domestic water (residential use), the minimum tank size shall be 25,000 litres.

Page 198 Doc # 11854602
Design sizing
As mentioned in Section 8.5.10.2, there is a logical progression of analysis that needs to be undertaken for water tank sizing. The average annual rainfall amount and the inter-event dry periods Average annual rainfall in the region is variable as shown in Figure 8-36. When using water tanks for domestic or industrial site use, it is essential to have a good understanding of the annual rainfall to ensure that water needs are met.
Figure 8-36: Annual rainfall throughout the region131
In terms of providing storage for rain water usage it is important to understand the period of time during the year when it doesn’t rain, as tank storage will have to account for those dry times. This is considered the inter-event dry period and that time period will vary during the year. Figure 7-3 provides the inter-event dry periods and shows the variation from month to month for the region. Inter-event dry periods are important to consider if the water is being used for domestic or industrial use. During periods of dry weather additional water is not available so storage must be provided for those expected dry periods. Although there is only several days’ difference in the inter-event dry period between winter and summer there is some seasonal difference with the average dry period in January through March being approximately 5 days. That means that the volume of storage needs to be provided for the daily-anticipated water usage multiplied by at least 5 to provide for needs during the dry periods. It must be recognised that the 5 is an average value and additional storage would provide longer-term protection. The maximum period of time could be as long as two weeks if water tanks are the sole source of water. If tank water is the sole source of domestic water, it is recommended that 10 days be used as an inter-event dry period to design tank storage for.
131 https://www.waikatoregion.govt.nz/community/about-the-waikato-region/our-climate/

Doc # 11854602 Page 199
How much water can be captured from the roof The first aspect of design is to calculate the roof area that will be drained to a water tank. Figure 8-37 details how that is done. The area that is green and covers the whole plane of the green area is the roof area that is then used in calculations.
Figure 8-37: Calculation of roof surface areas
Another component of roof runoff capture is what percentage of stormwater that runs off the roof can be used depending on roof area, tank size, daily usage and whether there are detention requirements associated with roof imperviousness. The anticipated water use Table 8-15 provides information on anticipated water use for residential properties. This water demand is based on 500 litres/day for a three member household. The values can be extrapolated for more or less members but an average assumption of three members is reasonable given the potential of people relocating. It is recommended that water use for a residence be 325 litres/day for non-potable use.
Table 8-15: Estimated residential water demand for a 3 member household Water use Average litres/day Bathroom 125
Toilet 125 Laundry 100
Gardening 100 Kitchen 50 Total 500
The same assumption cannot be made for rural commercial or industrial land use. In this situation, assumptions need to be made regarding the number of people that will occupy the workplace. Table 8-16 provides information on occupancy ratios.
Table 8-16: Building occupancy ratios for different activities132 Activity Floor to Person Ratio
Office 25 m2
Showroom 35 m2 Warehouse 50 m2 Shops, retail 35 m2 Restaurant/dining areas 15 m2 Local shopping centres 35 m2 Manufacturing 25 m2
132 North Shore City Council, 2008

Page 200 Doc # 11854602
The number of individuals occupying the building will be the gross floor area divided by the floor to person ratio. The amount of office water used per day is the number of individuals times 25 litres/day. At a minimum the value should total 125 litres/day. Industrial sites will have to be considered on an individual basis as the industrial usage may require water use in its operation. The total expected amount of use will then be based on employee and operations usage. The percent of water from the roof that can be used There will be periods of time when the water tank is full due to longer periods of wet weather. The concern related to this situation is when detention storage is required for peak discharge control. It is not an issue for domestic or business use as more water does not present a problem related to consumption. As a guide to collection capacity, consider that each 1mm of rain = 1 Litre (L) of water per square metre (m2) of roof area, then allow a 15% wastage factor. This will allow for a good understanding of whether the roof can provide the needed amount of water that is needed. As an example, 1,250 mm of rainfall on a 200 m2 roof would result in 250,000 litres/year – 37,500 litres (wastage) = 212,500 available litres for site use. If partial site usage was 325 litres/day then having an adequately sized water tank could provide for 100% of site usage while reducing stormwater runoff. If all of the water is captured, the water tank would also supply 100% of needed water for full service use by a three person household. The 15% wastage factor accounts for the time of year that the tank overflows due to rainfall exceeding tank storage. Peak flow consideration When sizing a water tank, there are two possible storage components.
The water needs component, and
An attenuation volume that reduces peak rate of discharge. The attenuation volume occupies the upper storage area of the tank with its outlet orifice placed immediately above the water needs volume as shown in Figure 8-38.
Figure 8-38: Combination attenuation and water use tank133
It is possible that the combined storage would provide more benefit than is estimated. A higher level of attenuation may be achieved in some instances when the tank water level
133 Auckland Regional Council, 2003

Doc # 11854602 Page 201
is lower than the orifice level at the start of the storm. These benefits are very difficult to estimate and are not taken into account in design. There will be a portion of the year when roof runoff will exceed water use and runoff during that time needs to be considered in terms of attenuation. Providing detention storage for the water quality storm provides additional storage to the domestic use volume to further reduce potential impacts to downstream channel erosion. The volumes for detention tank storage are provided in Figure 8-39. This detention volume is in addition to the domestic use volume.
Figure 8-39: Water tank detention storage volumes
The required orifice size is a function of the storage volume and the depth of water above the orifice. This depends on the tank size selected to accommodate the water use and attenuation volume. The tank diameter, in conjunction with the attenuation volume to be stored will provide the depth of water number. This number will then be used with an orifice equation (Q = 0.62A(2gh)0.5). Take the total detention volume and convert it to m3/s to determine the discharge from the tank and that discharge should discharge over a 24-hour period. Where the calculation shows an extended detention orifice as being less than 10 mm, use 10 mm as the orifice size. The design approach is to determine the Q10 for the predevelopment condition and design the orifice size based on the depth of attenuation storage in the tank and the limitation on peak discharge. Commercial and industrial sites will have more concern over the percentage of rainfall that becomes runoff than residential development. The percentage of time that rainfall becomes runoff needs to be calculated using daily water use, roof area and tank size. Roof areas above 500 m2 need to be considered individually and a water budget established. In those situations, attenuation of runoff may be required due to a possible larger expanse of roof area in conjunction with smaller water use. As detailed in Figure 8-38, the water tank has three outlets:
Water supply outlet for site water use,
An outlet for the attenuation storage, and
An overflow pipe for those flows that exceed the tank storage. The water supply outlet is a standard hose connection to a pump or outlet depending on gravity feed to the water use. The outlet from the attenuation storage provides a controlled release for larger storms to reduce downstream stormwater flow increases and the overflow pipe is for all storms to flow when the tank is full of water.

Page 202 Doc # 11854602
Determining detention volumes and sizing outlets The volume of storage needed for detention purposes can be addressed with one storage volume (the water quality volume). The tank elevations can be calculated once the attenuation storage and orifice size have been determined per the following.
1. Select a tank size based on site water needs and needed attenuation storage.
2. Set the water supply outlet at least 200 mm above the tank bottom to allow for debris settlement.
3. Total volumes needed for attenuation and site use are added together. These volumes then must be added to the minimum storage level (volume of tank/height of tank x 200 mm) to ensure that the tank is large enough to accommodate the three storages.
4. Determine the elevations of the various storages. Minimum storage level = 200 mm. Site water use = height of tank/volume of tank x site water use volume = height of water use elevation. This must be added to 200 mm to get elevation in tank of attenuation orifice invert.
5. Calculate invert height of overflow pipe. Overflow invert height = height of tank/volume of tank x attenuation storage volume = height of overflow pipe invert elevation. This must be added to the site water use orifice invert elevation to get the correct overflow elevation.
Case study – Rain tank
A water tank is proposed for a home in Te Aroha. The architects design plans show that the home has a roof area of 250 m2 and it is being designed for a daily water use of 500 litres/day as the tank is the sole supply for domestic water. Design steps
1. With the roof area being 250 m2 and a water use of 500 l/d, calculate the amount of water that can be used where the annual rainfall is 1,250mm. With one m2 of roof area providing one litre of water, the total amount of water available is 312,500 litres minus a 15% wastage factor. So annual amount of rainfall that can be used for water supply is 265,625 litres.
2. Daily water consumption is 500 litres/day or 182,500 litres per annum. This indicates that the non-potable usage can be supplied by the water tank with no need for periodic top ups.
3. At a usage rate of 500 litres/day, the minimum tank size has to accommodate at least 5,000 litres for dry periods (500 l x 10 days). As the water tank is used as the sole supply of domestic water the minimum tank size is 25,000 l. It is recommended that the water tank be sized to hold at least 5,000 litres for domestic storage to account for times where large storm capture can augment supply.
4. Regarding detention, Figure 8-39 provides detention storage requirements for various roof areas. In terms of extended detention storage, the tank needs to have 6.0 m3 of storage for detention purposes.
5. Adding the two volumes together gives a total tank volume of 11.0 m3. In addition there needs to be 200 mm of water at the bottom of the tank to accumulate
Water tanks in a residential neighbourhood
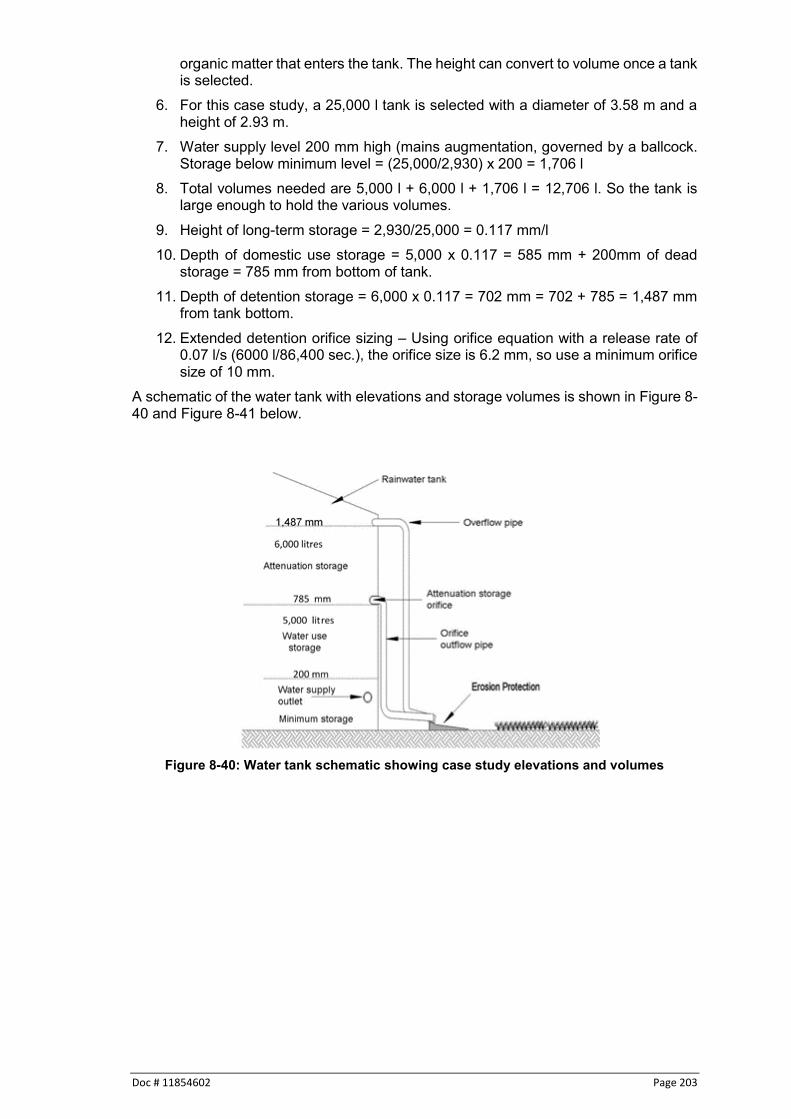
Doc # 11854602 Page 203
organic matter that enters the tank. The height can convert to volume once a tank is selected.
6. For this case study, a 25,000 l tank is selected with a diameter of 3.58 m and a height of 2.93 m.
7. Water supply level 200 mm high (mains augmentation, governed by a ballcock. Storage below minimum level = (25,000/2,930) x 200 = 1,706 l
8. Total volumes needed are 5,000 l + 6,000 l + 1,706 l = 12,706 l. So the tank is large enough to hold the various volumes.
9. Height of long-term storage = 2,930/25,000 = 0.117 mm/l 10. Depth of domestic use storage = 5,000 x 0.117 = 585 mm + 200mm of dead
storage = 785 mm from bottom of tank. 11. Depth of detention storage = 6,000 x 0.117 = 702 mm = 702 + 785 = 1,487 mm
from tank bottom. 12. Extended detention orifice sizing – Using orifice equation with a release rate of
0.07 l/s (6000 l/86,400 sec.), the orifice size is 6.2 mm, so use a minimum orifice size of 10 mm.
A schematic of the water tank with elevations and storage volumes is shown in Figure 8-40 and Figure 8-41 below.
Figure 8-40: Water tank schematic showing case study elevations and volumes
Page 204 Doc # 11854602
Figure 8-41: Orifice and exterior pipe details134
134 Hawke’s Bay Regional Council, 2009

Doc # 11854602 Page 205
8.5.11 Compacted soil remediation
Description: Soil remediation reduces compaction that is often a by-product of site construction activities. Compaction occurs as construction equipment repeatedly travels across a site or when fill material, needing a defined compaction, reduces soil permeability rates.
Background
Soil disturbance/compaction in urban areas occurs during construction cutting and filling operations, general grading operations, and other processes of running heavy equipment over the soil. After construction, continued compaction can occur with site activities such as walking, sports, and even parking heavy vehicles on grassed areas. Slow improvements in soil compaction may occur with time in relatively undisturbed areas by deep rooted plants or by soil insects or other boring animals. Basically, soil infiltration to ground is usually significantly degraded compared to natural soil conditions and is commonly overlooked during hydrologic analyses and design. Knowing the likely effects of this soil compaction on urban hydrological conditions is critical for designing safe drainage systems. Restoring the infiltration capacity of a soil is also possible and can provide significant benefits in stormwater management. There are many different types of soils with different abilities to cope with construction pressures and to recover afterwards. Management during earthwork stages and subsequent restoration needs to be appropriate to the type of soil. Clays are particularly at risk of compaction. Pumice soils from the Central Volcanic Region are resilient to a point but surface crusting can occur if the pumice particles are crushed. Soils with a high water table are also vulnerable to surface crusting and deeper compaction. Organic soils (peats) are vulnerable to oxidation and consolidation, i.e. they ‘shrink’ due to conversion to CO2 gas and collapse in on themselves. In many cases, disturbed urban soils have dramatically reduced infiltration rates, usually associated with compaction of the surface soils. The saturated infiltration rates can be one to two orders of magnitude less than assumed, based on undisturbed/uncompacted conditions. Figure 8-42 and Figure 8-43 show 3D plots of field infiltration data, illustrating water content and compaction, for both sands and clays. Four general conditions were observed to be statistically unique. Compaction has the greatest effect on infiltration rates in sandy soils, with little detrimental effects associated with higher soil-water content conditions (the factor usually considered by most rainfall-runoff models). Clay soils, however, are affected by both compaction and soil-water content. Compaction was seen to have about the same effect as saturation on clayey soils, with saturated and compacted clayey soils having very little effective infiltration.

Page 206 Doc # 11854602
Figure 8-42: Infiltration rates for sandy soil conditions135
Figure 8-43: Infiltration rates for clayey soil conditions135
Protecting the biological integrity of the soil goes a long way to restoration for all soil types.
Description
When considering remediation, it is important to understand what topsoil is and how it relates to subsoils. Top soil refers to the top layer of soil that has a mix of vegetative matter and soil in it. Topsoil provides the richest amount of organic matter for germinating seeds and this organic matter colours the soil dark brown. Organic matter helps soil structure, holds water and nutrients. Microorganisms, from bacteria to fungi, populate the soil keep the cycling of organic matter active. Topsoil is the best substrate for plant growth with its rich nutrients and protected moisture trapped in small, open underground pockets. Good soil is about 50% air space. The air space allows nutrients and water to circulate as well as roots to grow. When soil particles are too close together, compaction occurs. Subsoil is beneath topsoil and does not have high organic matter concentrations so has lighter and varying colours, such as red or yellow.
135 Pitt, 2002

Doc # 11854602 Page 207
Construction approach to soil conditioning
Similar to other approaches for stormwater management, the first step is to minimise compaction. Avoid compaction in the first place by limiting areas where construction or worker equipment travels. Mark undisturbed areas to limit entry. The type of soil remediation varies depending on existing soil type, topography and nature of the earthworks (cut or fill). Earthworks must be designed to maximise the opportunities for remediating surface soil. Where soil remediation is not possible for geotechnical reasons, proposals should specify what will be achieved to provide topsoils in geotechnically critical areas, including vegetative proposals. Compaction problems are most evident where clay soils exist on site. Thus, remediation of clay soils requires more steps to maintain permeability than do other soils. A major consideration of soils remediation relates to drainage. Compaction can lead to drainage of water onto neighbouring properties and increased risk of localised flooding. There also has to be attention given to the potential for land slips, especially in some types of clay soils.
Method of conditioning136
Reinstating surface soil (topsoil and conditioned parent clays) requires careful planning and coordination through the earthworks stages of subdivision development. It is essential to work with caution as compaction can lead to drainage of water onto neighbouring properties and increased risk of localised flooding. Infiltration into some types of clay can lead to land slips. During the initial stripping stages, it is recommended that two types of stripped material be stockpiled. The topsoil should be stripped and stockpiled separately from the underlying 200 mm (approximately) subsoil. Only after stockpiling these surface soils should the underlying materials be used for the bulk earthworking of cut and fill areas. On completing bulk earthworks, the surface soil can be rehabilitated by scarifying and/or subsoiling the finished fill surface, and placing stockpiled subsoil and topsoil in layers similar to their pre-earthwork condition. Topsoil in this guideline is defined as the generally dark coloured mineral soil immediately underlying vegetation and any dense root mat. It contains roots and humus, has a generally friable structure and is typically about 100 mm thick, although this depth can be highly variable. The underlying subsoil is 200 mm – 300 mm thick and is indicative of local geology. It can be distinguished from the parent material by its rootlets, lower water content and better structure. After stripping and bulk earthworks are completed, the parent soils should be conditioned using the following methods:
1. Subsoiling – ripping depths, spacing and directions and timing will be site specific depending on soil type, topography and drainage paths.
2. Scarifying and adding gypsum (if the soils are clay based) – gypsum should be added to the surface at concentrations as per the manufacturer’s recommendation and then scarified and mixed into the top 100 mm of parent materials.
After remediating the parent materials, the stockpiled subsoil and topsoil layers are placed and only lightly compacted. Seeding of the topsoil should be undertaken according to normal seeding specifications. Another way to restore compacted urban soils is through the use of an agricultural spader tillage implement that has been used successfully to restore compacted soils in disturbed areas. This is not a typical rotary tiller that can form a hardpan, but uses a shovelling action to lift up the soil, which does the least soil structure damage. The Tortella Spader from Italy is a preferred spader implement. Dramatic restorations in soil structure are
136 North Shore City Council, 2006

Page 208 Doc # 11854602
possible with the spader, while deep chisel plowing has also been used, but less successfully137.
La Spader Italian Farm Implement138
Building activities on individual lots will have further detrimental effects on the surface soil, even after the remediation of soil undertaken for subdivision construction. Following any excavation and/or regrading required developing individual lots, the affected surface soil, outside of the building and pavement footprint, must be remediated. Material from excavations will need to be hauled off site or, if the soils are suitable, reworked back into the subsoil and topsoil layers.
Remediation of other soils
The main concern with pumice and soils having a high water table is crusting of the surface. In those areas, it is important to scarify the surface of the worked soil using a spader type tillage implement and then providing grass seed. Scarifying to improve permeability works best in low clay content soils Peat soils are unique and the main concern with them is shrinkage where the soil can collapse in on themselves. In those situations, it is important to maintain site hydrology to limit collapse.
Managing compaction
Once remediation has been accomplished, there are a number of steps that should be taken to limit further creep in compacted areas. Reroute traffic. Shift machinery, vehicle, and foot traffic away from the compacted area. Provide alternative routes and block off the area with barriers such as signs and fences. Do this long enough to give the area a rest and consider protecting the area permanently by keeping paths and roads to restrict traffic to one area. Try to designate already degraded soil for paths and household construction to limit the spread of compaction. Put in a cover crop. The roots break up the soil, and then turn it in the soil with a tiller to increase organic matter in the soil and increase aeration. Work in organic material. While you aerate the soil, add compost or mulch.
137 Pitt, 2012 138 http://www.bdimachinery.net/29.html

Doc # 11854602 Page 209
8.5.12 Oil/water separators
Description: Oil and Water Separators are designed and constructed to capture and treat stormwater runoff through:
Specific gravity separation Surface area increases Sedimentation (limited)
Oil/water separator devices are applicable for treating stormwater runoff from areas where hydrocarbon products are handled or where hydrocarbon loads can be very high. They should be located as close to the source of the hydrocarbons as possible to retain the oil in a floatable, non-emulsified form. Oil/water separators are not usually applicable for general urban stormwater runoff treatment as the oil is often emulsified or has coated sediments and is too difficult to separate. For stormwater runoff, oil/water separators would primarily be applicable in areas where there is a very high hydrocarbon load and the oil/water separator would be used in conjunction with another device to function as part of a treatment train. Emulsification occurs when two liquids that normally do not mix do so either through a turbulent environment or through the use of an emulsifying agent. In the case of oil/water separators, the turbulence of stormwater flows can cause the mixing of oil and water. It is important that catchment areas draining to oil/water separators be as small as possible to reduce the potential for emulsification to occur. If that happens the effectiveness of oil/water separators will reduce significantly. In areas where there is significant potential for accidental spills, oil/water separators may be applicable if the material having spill potential has a specific gravity less than water. From a sedimentation standpoint, oil/water separators will capture sand or grit particles but smaller sediments will either pass directly through the system or may be resuspended in subsequent storms. There are a number of different products that are available for use as oil/water separators. These available products should be considered carefully and designed according to their manufacturers recommendations. Most of these products can achieve a maximum concentration of 5 mg/l. One product that can be used as a last resort is an American Petroleum Interceptor (API) that normally can achieve 15 mg/l concentration,

Page 210 Doc # 11854602
which is less desirable than other products due to the greater concentration of oil in the discharge from the device. If an API oil/water separator is used, it shall be designed in accordance with Ministry for the Environment guidelines139. It is not the intention here to provide a list of suitable devices. When an oil/water separator is proposed for a given site, documentation from the manufacturer should be submitted to verify the performance in terms of discharge concentration
139 Ministry for the Environment, 1998

Doc # 11854602 Page 211
9 Outlet design Introduction
Erosion at stormwater management device inlets and outlets is common. Determination of the flow condition and scour potential should be a standard component of stormwater management design. The only safe procedure is to design the inflows and outfalls on the basis that erosion is to be expected and therefore mitigated. A reasonable procedure is to provide at least minimum protection, and then inspect the inflows and outlets after major storms to determine if the protection must be increased or extended. Under this approach, the initial protection against erosion should be sufficient to provide some assurance that extensive damage would not result from one runoff event. Two types of erosion result from stormwater discharges:
Local scour in the vicinity of pipe or channel outfall
General channel degradation further downstream
Local scour is the result of high velocity flow or even channelised flow at inlets or outlets. It tends to have an effect for a limited distance downstream. Natural channel velocities are almost universally less than pipe outlet velocities, because the channel cross section, including the floodplain, is generally larger than the pipe flow area while the frictional resistance of a natural channel is greater than the frictional resistance of a concrete pipe. Thus, flow eventually adjusts to a pattern controlled by the channel characteristics. Channel degradation represents a long term lowering of the stream channel, which may proceed in a fairly uniform manner over a long length or may be evident in one or more abrupt drops. A number of stream channels in the region are degrading as a result of increased stormwater runoff volumes from changed land use, initially from forest to rural use and further from rural to urban use. Waterway instability issues are an essential element of overall stormwater management design. Inlet protection is essential to limit the amount of work that a stormwater management device needs to do to reduce discharge of contaminants. Scour or high velocities at device inlets and cause sediment scour or resuspension of contaminants deposited during previous events. Outlet protection for culverts, stormwater outfalls or ditches is essential to prevent erosion from damaging downstream channels and receiving environments. Outlet protection can be a channel lining, structure or flow barrier designed to lower excessive flow velocities from pipes and culverts, prevent scour, and dissipate energy. Good outlet protection will significantly reduce erosion and sedimentation by reducing flow velocities.
Objective The purpose of this section is to present information that facilitates design for inlets and outlets that dissipate energy to minimise inlet and outlet velocities and subsequent scour. This will facilitate water quality function and reduce subsequent maintenance issues.
Example of erosion at a pipe outfall
Page 212 Doc # 11854602
Design approach Key design elements include:
Pipe or channel grade
Inlet and outlet velocity
Riprap aprons
Engineered energy dissipaters
Flow alignment and outfall setback in freshwater receiving environments
Erosion control in coastal environments These are summarised below.
9.3.1 Pipe or channel grade
To minimise the complexity of analysis and design of inlet or outlet protection structures, the first step is to look for ways to reduce the magnitude of pipe or channel outlet protection by having an invert grade as low a grade as possible, for example by using a drop structure in a pipe a short distance above the outfall. A key element to consider is whether the overall system operates under inlet or outlet control, which relates to the hydraulic grade of the system. Inlet control occurs on steeper grades when the inlet configuration controls the hydraulic capacity of the pipe and the outlet is free-flowing. Under inlet control, the outlet is not submerged and he differences between the upstream and downstream head is large. Key factors relate to headwater depth and entrance conditions. Outlet control occurs when hydraulic capacity is governed by friction through the hydraulic element and tailwater depth. Hydraulic performance is defined by the difference between headwater and tailwater depth, inlet condition and pipe slope, roughness and length.
9.3.2 Inlet and outlet velocities
The design and analysis of riprap protection, stilling basins, and other types of structures can be a complex task to accomplish. The first step is to look for ways to reduce the need for inlet or outlet protection by having grades no steeper than possible (possibly using a drop structure in pipe). When considering inlet and outfall velocities, there is value in considering what velocities natural channels can tolerate prior to eroding, Table 9-1 below provides guidance on this topic. The primary consideration in selecting the type of inlet or outlet protection is the velocity for pipes or channels, which is dependent on the flow profile associated with the design storm. Mechanisms for reduction of inlet scour or resuspension of previous deposited contaminants can include140:
Dispersion of low velocity flow across a landscaped area or filter strip.
Dispersed flow through kerb cuts.
Dispersed flow from paved areas through distributed inlets.
Flow through level spreaders or swales. Pipe flow may be controlled by:
The type of inlet
The throat section
140 Buchanan et al, 2013

Doc # 11854602 Page 213
The pipe capacity or
The type of outlet. The type of control may change from outlet control to inlet control depending on the flow value. For inlet control, the outlet velocity is assumed to be normal depth as calculated by Manning’s equation. For outlet control, the outlet velocity is found by calculating the channel flow from Manning’s equation with the calculated tail-water depth or the critical flow depth of pipe, whichever is greater.
Table 9-1: Maximum permissible velocities for unlined channels141 Material Mean velocity (m/s)
Fine sand, colloidal 0.4 Sandy loam, non-colloidal 0.5 Silt loam, non-colloidal 0.6 Alluvial silts, non-colloidal 0.6 Ordinary firm loam 0.8 Volcanic ash 0.8 Stiff clay, very colloidal 1.1 Alluvial silts, colloidal 1.1 Shales and hardpans 1.8 Fine gravel 0.8 Graded loam to cobbles, non-colloidal 1.1 Graded silts to cobbles, colloidal 1.2 Coarse gravel, non-colloidal 1.2 Cobbles and shingles 1.5
9.3.3 Riprap aprons
Protection at inlets and outlets can take the form of riprap placement with the stone sizing being assessed as part of the storm drainage design, and using these guidelines. Riprap protection is usually less expensive and easier to install than concrete aprons or energy dissipaters. A riprap channel lining is flexible and adjusts to settlement; it also serves to trap sediment and reduce flow velocities. Riprap aprons should not be used to change the direction of inlet or outlet flow: an impact energy dissipater is more appropriate for this. Riprap aprons aim to manage the transition of piped stormwater into a stream channel primarily by their higher Manning’s roughness coefficient, which slows the water velocity. Riprap aprons should be constructed, where possible, at zero percent grades for the specified length. Grouted riprap may be subject to upheaval from periodic saturation of clay subgrades and is therefore not generally recommended for velocity protection. Upheaval can crack the grout resulting in undersized riprap size for the velocities of flow. In general, un-grouted properly sized riprap provides better assurance of long-term performance. Laying riprap directly on soils can allow the water to hit soil particles, dislodging them and causing erosion. Filter cloth laid between the soil and riprap will reduce this concern. Filter cloth is graded on the thickness and permeability characteristics. A qualitative judgement is usually made on the appropriate grade to prevent erosion and prevent puncture by riprap.
141 Fortier et al, 1926

Page 214 Doc # 11854602
9.3.4 Engineered energy dissipators
There are many types of energy dissipators. Commonly used varieties include stilling basins, baffle blocks within a headwall and impact energy dissipators. The figure below demonstrates an engineered stilling basin designed to trigger a hydraulic jump in combination with a tail-water condition.
Figure 9-1: Engineered stilling basin142
Engineered energy dissipators including stilling basins, drop pools, hydraulic jump basins or baffled aprons are required for inlets and outfalls with design velocities more than 6 metres per second. Energy dissipators should be designed using published or commonly known techniques found in references including:
- Hydraulic Energy Management: Inlet and Outlet Design for Treatment Devices, Technical Report 2013/018. Auckland Council, and
- Hydraulic Design of Energy Dissipators for Culverts and Channels, HEC 14, July 2006, Metric Version. U.S. Department of Transportation, United States.143.
9.3.5 Outfalls to freshwater receiving environments
Depending on the location and alignment of the pipe outfall and the receiving stream, outfall structures can have a significant effect on receiving channels. Alignment at a right angle to the stream will force the flow to make a 90o angle to the direction of flow. This can cause scour of the opposite stream bank as well as causing significant turbulence at the point of entry. The preferred approach is to align the pipe flow at no more than a 45o angle to the stream. Figure 9-2 shows an angled outfall entry to a stream.
142 Auckland Regional Council, 2003 143 https://www.fhwa.dot.gov/engineering/hydraulics/pubs/06086/hec14.pdf

Doc # 11854602 Page 215
Figure 9-2: Angled entry of outfall into a stream142
If the pipe outfall must be directly into the stream channel, riprap must be placed on the opposite stream channel boundary to a depth of 300 mm above the elevation of the pipe crown. This is in addition to a riprap apron at the pipe outfall. The impact of new pipe outfalls can be significantly reduced on receiving streams by locating them further back from the stream edge and digging a channel from the outfall to the stream. This would allow for energy dissipation before flows enter the stream, as shown in Figure 9-2. At a minimum, the pipe outfall should be located far enough back from the stream edge to prevent the energy dissipater intruding on the channel.
9.3.6 Outfalls in coastal receiving environments
Discharges and outlet structures may give rise to a number of adverse effects on the coastal environment if they are constructed of inappropriate materials and/or are poorly sited. For example, a discharge may cause or exacerbate erosion of a beach or an outlet may detract from the natural character or amenity value of the coastal environment or impede public access to, from and along the coast. Before locating a discharge in the coastal marine area particular consideration should be given to the following matters to avoid/minimise any adverse effect on the natural character, amenity or public access values of the coastal environment:
1. Discharging in such a location that will not unnecessarily cause or exacerbate erosion, particularly of beach materials. For a discharge to a beach, this may involve locating the point of discharge away from the active beach system, e.g. at or near an adjacent headland.
2. Where there are multiple points of discharge to a beach system, consideration should be given to combining discharges to a common point of discharge, including via a common structure.
3. Ensuring the visual form and appearance of the outlet does not detract from its immediate surrounds and the natural character of the coastal environment, e.g. ensuring the structure is complementary to its locality rather than contrasts with that environment. The use of locally sourced rock and/or coloured and sculpted concrete forms may be appropriate.
4. Keeping the “footprint” of the structure to a minimum. 5. Incorporating the discharge pipe into another structure, e.g. a boat ramp, to
minimise the number of structures in the coastal environment. 6. Locating the outlet and discharge in such a position as to not create an obstacle
to public access to, from or along the coastal marine area.
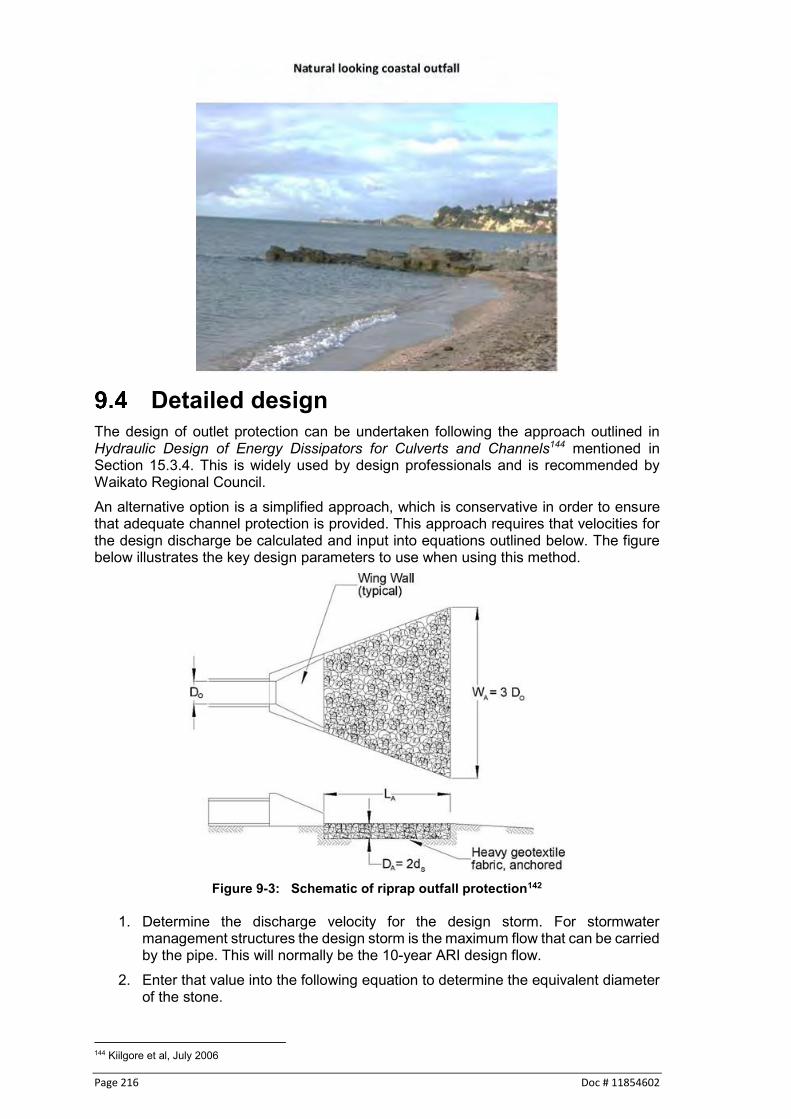
Page 216 Doc # 11854602
Detailed design The design of outlet protection can be undertaken following the approach outlined in Hydraulic Design of Energy Dissipators for Culverts and Channels144 mentioned in Section 15.3.4. This is widely used by design professionals and is recommended by Waikato Regional Council. An alternative option is a simplified approach, which is conservative in order to ensure that adequate channel protection is provided. This approach requires that velocities for the design discharge be calculated and input into equations outlined below. The figure below illustrates the key design parameters to use when using this method.
Figure 9-3: Schematic of riprap outfall protection142
1. Determine the discharge velocity for the design storm. For stormwater
management structures the design storm is the maximum flow that can be carried by the pipe. This will normally be the 10-year ARI design flow.
2. Enter that value into the following equation to determine the equivalent diameter of the stone.
144 Kiilgore et al, July 2006

Doc # 11854602 Page 217
ds = 0.25 x Do x Fo Where: ds = Riprap diameter (m) Do = Pipe diameter (m) Fo = Froude number (compares inertia and gravity) = V/(g x dp )0.5 dp = Depth of flow in pipe (m) V = Velocity of flow in pipe (m/s)
3. The thickness of the stone layer is 2 times the stone dimension. DA =2ds
4. The width of the area protected is 3 times the diameter of the pipe. WA = 3Do
5. The height of the stone is the crown of the pipe + 300 mm. 6. The length of the outfall protection is determined by the following formula.
La = Do(8 + 17xLog Fo) Where: La = Apron length (m) g = 9.8 m/s2
As can be seen from the equations, any reduction in the discharge velocity will reduce the stone size and apron length. Mechanisms to reduce velocity prior to discharge from the outfall are encouraged, such as drop manholes, rapid expansion into pipes of much larger size, or well up discharge designs.
Construction Construction of the inlet or outfall protection must be undertaken at the same time as construction of the pipe outfall itself. It is best to construct the inlet or outfall unit from the bottom up, to prevent concentrated flows (if there is potential for flows to discharge into the device during construction) from being discharged into an un-stabilised location. If construction of the system commences at the top of the structure, the entrance to the system should be blocked off to prevent flow from travelling through the pipe until the outlet protection is completed.
Inlet and outfall structures associated with stormwater management ponds should be constructed in a similar fashion. Once the embankment has been completed and the pipe structures installed, the erosion protection must be constructed.

Page 218 Doc # 11854602
It is important that a sequence of construction be established and followed, such as the following for example:
1. Clear the foundation area of trees, stumps, roots, grass, loose rock, or other unsuitable material.
2. Excavate the cross-section to the lines and grades as shown on the design plans. Backfill over-excavated areas with moist soil compacted to the density of the surrounding material.
3. Ensure there are no abrupt deviations from the design grade or horizontal alignment.
4. Place filter cloth and riprap to line and grade and in the manner specified. Sections of fabric should overlap at least 300 mm and extend 300 mm beyond the rock. Secure the filter cloth at the edges via secure pins or a key trench.
5. Ensure the construction operations are undertaken so as to minimise erosion or water contamination, with all disturbed areas vegetated or otherwise protected against soil erosion.
6. For coastal sites, undertake construction at periods of low tide.
Operation and maintenance Key operation and maintenance tasks include the following:
Inspect inlet and outlet protection on a regular basis for erosion, sedimentation, scour or undercutting
Repair or replace riprap, geotextile or concrete structures as necessary to handle design flows
Remove trash, debris, grass, or sediment Maintenance may be more extensive as smaller rock riprap sizes are used, as people may be tempted to throw or otherwise displace stones or rocks.

Doc # 11854602 Page 219
10 Landscaping Introduction
Landscaping is critical to improving both the function and appearance of stormwater management devices. It has aesthetic, ecological and economic value that is often not recognised during site design and construction. In almost all cases, compliance with regulatory requirements is the key driver and the issue of how a stormwater device fits into the local landscape can often be overlooked. Moreover, where the initial developer is not the eventual property owner, there may not be a long-term interest in landscaping. Where the local council assumes the maintenance responsibility for the device and/or becomes the owner of the device, landscaping issues must become a standard asset management cost in the council’s financial plans. If the device is considered an eyesore, property values will go down and the general public response to stormwater management will be negative. The stormwater device must be an integral part of the development and given the same landscape attention as other parts of the site.
Objective The objectives of landscaping stormwater management devices are to:
Improve their aesthetics
Improve their water quality and ecological function, and
Increase the economic value of the site. A good landscape plan will consider all three objectives. This means involving a professional landscape architect with experience in natural system design. Considerations include:
Site soils
Slopes
Hydrologic conditions, and
Water quality/ecological benefits. The following discussion expands on the three objectives.
10.2.1 Aesthetic appeal of stormwater devices
Aesthetics is a subjective yet very important aspect of everyday life. It is a concept that is difficult to define quantitatively. Something that is good aesthetically tends to be considered tasteful, pleasing, appropriate and fitting for its location. Tastes differ, and disagreement about what is an aesthetic amenity is common. The goal of this section is to provide guidance on how to ensure that stormwater devices are designed as an asset to the property owner and to the overall community.
Green wall on a building in Paris
Example of a stormwater pond that has little aesthetic value

Page 220 Doc # 11854602
10.2.2 Water quality and ecological function
Attention to landscaping as a component of stormwater management devices can have a significant positive effect on water quality and ecological function. Shading of devices can reduce thermal impacts on receiving systems. Vegetated buffer zones (woody or grassed) can reduce sediment entry, and natural vegetation promotes local ecological diversity. Landscaping plans should consider:
Chemical use reduction
Contaminant source reduction, and
Impervious surface mitigation. Projects should be designed to minimise the need for toxic or potentially contaminating materials such as herbicides, pesticides, and fertilisers within the stormwater management device area. Materials that could leach contaminants or pose a hazard to people or wildlife should not be used as components of a stormwater device (examples can include chemically treated wood or galvanised metals). Good landscaping can also reduce impacts of impervious surfaces by incorporating swales adjacent to paths and access ways.
10.2.3 Economic value of the site
A number of studies demonstrate the economic benefits of properly landscaped stormwater systems on the overall property values in the vicinity of the devices. These are summarised as follows:
A study in Maryland in the U.S. found that properly designed stormwater management ponds increased adjacent property values by 10 - 15 %
The U.S. EPA’s literature review of the impacts of urban stormwater ponds on property values is available on EPA’s website at www.epa.gov/OWOW/NPS/runoff.html, and
The City of Christchurch has been engaged in natural stream restoration and has identified significant monetary benefit to property values for properties abutting the restored stream channels.
Native vegetation This guideline encourages the use of native vegetation in stormwater management devices where they are appropriate. Native plants are defined as those species found in the Waikato Region before European migration. Native species have distinct genetic advantages over non-native species for planting. As they have evolved here naturally, indigenous plants are best suited for our local climate. This translates into greater survivorship when planted and less replacement and maintenance during the life of a stormwater management device. Both of these attributes provide cost savings for the device owner. People often plant exotic species for their ornamental value. While it is important to have aesthetic stormwater management devices for public acceptance and the maintenance of property value, it is not necessary to introduce foreign species for this purpose. There are a number of native species that are aesthetically pleasing and can be used as ornaments.
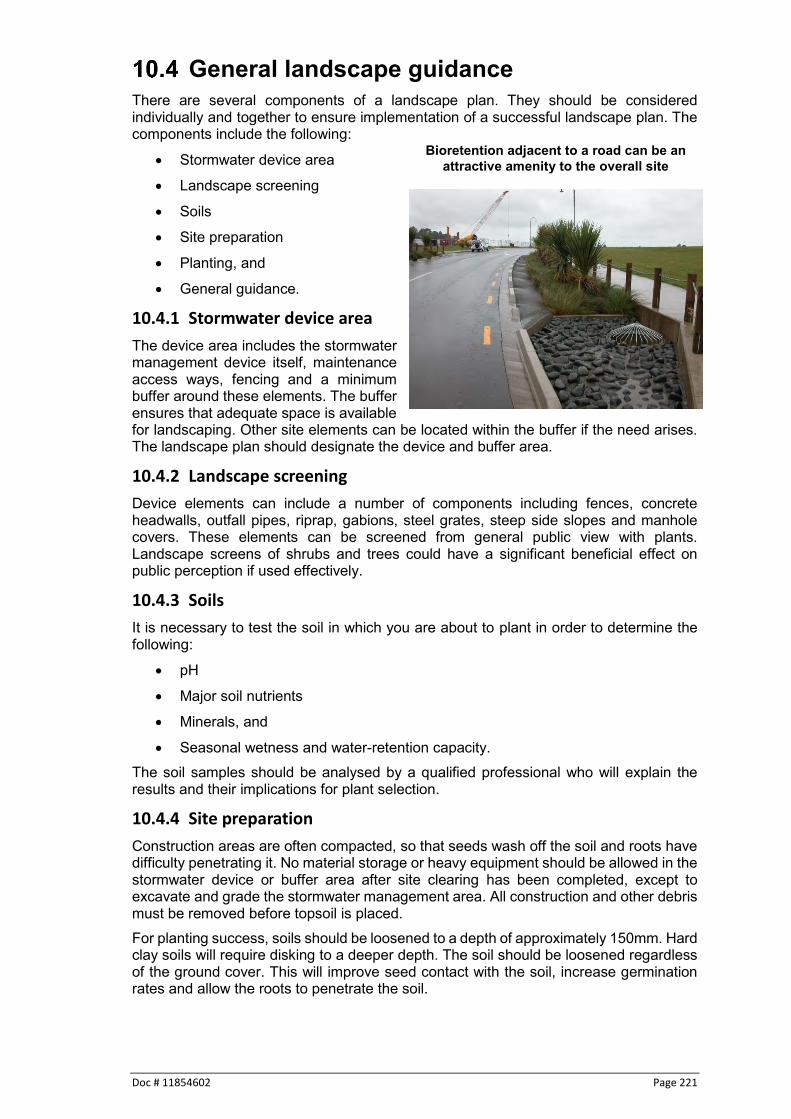
Doc # 11854602 Page 221
General landscape guidance There are several components of a landscape plan. They should be considered individually and together to ensure implementation of a successful landscape plan. The components include the following:
Stormwater device area
Landscape screening
Soils
Site preparation
Planting, and
General guidance.
10.4.1 Stormwater device area
The device area includes the stormwater management device itself, maintenance access ways, fencing and a minimum buffer around these elements. The buffer ensures that adequate space is available for landscaping. Other site elements can be located within the buffer if the need arises. The landscape plan should designate the device and buffer area.
10.4.2 Landscape screening
Device elements can include a number of components including fences, concrete headwalls, outfall pipes, riprap, gabions, steel grates, steep side slopes and manhole covers. These elements can be screened from general public view with plants. Landscape screens of shrubs and trees could have a significant beneficial effect on public perception if used effectively.
10.4.3 Soils
It is necessary to test the soil in which you are about to plant in order to determine the following:
pH
Major soil nutrients
Minerals, and
Seasonal wetness and water-retention capacity. The soil samples should be analysed by a qualified professional who will explain the results and their implications for plant selection.
10.4.4 Site preparation
Construction areas are often compacted, so that seeds wash off the soil and roots have difficulty penetrating it. No material storage or heavy equipment should be allowed in the stormwater device or buffer area after site clearing has been completed, except to excavate and grade the stormwater management area. All construction and other debris must be removed before topsoil is placed. For planting success, soils should be loosened to a depth of approximately 150mm. Hard clay soils will require disking to a deeper depth. The soil should be loosened regardless of the ground cover. This will improve seed contact with the soil, increase germination rates and allow the roots to penetrate the soil.
Bioretention adjacent to a road can be an attractive amenity to the overall site

Page 222 Doc # 11854602
Providing good growing conditions can prevent poor vegetative cover. This saves money, as vegetation will not need to be replanted.
10.4.5 Planting
In selecting plants, consider their desired function in the landscape. Is the plant needed as ground cover, soil stabiliser or a source of shade? Will the plant be placed to frame a view, create a focus or provide an accent? Does the adjacent use provide conflicts or potential problems and require a barrier, screen, or buffer? Nearly every plant and plant location should be provided to serve some function in addition to any aesthetic appeal. Certain plant characteristics are obvious but may be overlooked in the plant selection, especially:
Size, and
Shape. Tree limbs, after several years, can affect power lines. A wide growing shrub may block an important line of sight to oncoming vehicular traffic. A small tree, when full grown, could block views. Consider how these characteristics can work today and in the future. It is critical that selected plant materials are appropriate for soil, hydrological conditions and other device and site conditions. More information on adequacy of specific plant species is provided in the individual sections on each device.
10.4.6 General guidance
Trees, shrubs and any type of woody vegetation are not allowed on a dam embankment. Root penetration of the embankment could weaken it in the future.
Check water tolerances of existing plant materials prior to inundation of area.
Stabilise aquatic and safety benches with emergent wetland plants and wet seed mixes.
Do not block maintenance access to structures with trees or shrubs
To reduce thermal warming, shade inflow and outflow channels as well as northern exposures of ponds.
Shading of standing water reduces undesirable algae blooms
Avoid plantings that will require routine or intensive chemical applications.
Test the soil to determine if there is a need for amendments
Use low maintenance ground cover to absorb stormwater runoff
Plant stream and water buffers with trees and shrubs where possible to stabilise banks and provide shade
Maintain and frame desirable views. Take care not to block views at road intersections or property entrances. Screen unattractive views into the site.
Use plants to prohibit pedestrian access to ponds or steeper slopes.
Consider the long-term vegetation management strategy of the stormwater device, keeping in mind the maintenance obligations of the eventual owners.
Nice example of native bush planting as a riparian ground cover

Doc # 11854602 Page 223
Preserve existing bush areas to the extent possible.
Specific landscape provisions for individual devices In addition to the general guidance presented above, more specific guidance is given below for individual stormwater devices (this guidance is subject to variation from site to site).
10.5.1 Ponds and wetlands
Section 9 provides design guidance for ponds and wetlands. Ponds and wetlands have several defined elements that affect landscaping, including:
Pond shape
Pond topography, and
Zones of water inundation and periodic saturation.
Pond shape
Pond or wetland shape strongly influences public reaction. A rectangular pond is not seen as a ‘natural’ site feature and offers little in terms of amenity value. A pond with an irregular shoreline or one that apparently fits in with natural contours is more attractive. In addition, an irregular shape has a longer edge than a rectangular pond and allows for more planting, both above and below the water line. Council recommends an irregular shoreline or one that follows existing contours. A minimum recommended buffer area around the pond is five metres above the shoreline where a reverse safety bench, as detailed in Section 9, and plantings can be established.
Pond topography
Topography has a major effect on the range of plants that can be grown, the movement of water through the pond or wetland and public safety. Steep side slopes can be dangerous for people slipping into a pond and will affect the types of plants that can be used. Council recommends a 300 mm deep three metre wide level bench below the normal pool level. This is recommended for safety reasons and for growth of emergent wetland plants. The plants will act to restrict public access to deeper water. Islands, effectively placed, can also be used for multiple benefits. They can increase stormwater flow paths, provide additional landscaped areas and provide wildlife habitat. Islands also increase edge lengths and vegetated areas.
Zones of water inundation and periodic saturation
Normal pond and wetland function will result in a number of zones becoming established, each providing different landscaping opportunities.
An attractive pond and plantings as community amenities

Page 224 Doc # 11854602
Zone 1 Periodic flooding zone
Zone 1 is sometimes flooded, but usually above the normal water level. This zone is inundated by floodwaters that quickly recede in a day or less. Key landscaping objectives may be to stabilise steep slopes and establish low maintenance natural vegetation.
Zone 2 Bog zone Apart from periods in the summer, the soil is saturated This encompasses the pond or wetland shoreline. The zone includes the safety bench and may also be periodically inundated if storm events are subject to extended detention. Plants may be difficult to establish in this zone, as they must be able to withstand inundation of water during storms or occasional drought during the summer. These plants assist in shoreline stabilisation and shading the shoreline, contaminant uptake and limiting human access. They also have low maintenance requirements.
Zone 3 0 - 150 mm deep of normal pool depth This is a transition zone between the bog zone and the 150 - 500 mm ponded depth in which the water level sometimes drops and the area becomes a bog. Plants in this area must be able to tolerate periodic (but not permanent) saturated soil conditions.
Zone 4 150 - 500 mm deep This is the main zone where wetland plants will grow in stormwater ponds and wetlands. Plants must be able to withstand constant inundation of water and enhance contaminant uptake. Plants will stabilise the bottom and edge of the pond, absorbing wave impacts and reducing erosion. They will slow water velocities and increase sediment deposition rates along with reducing resuspension of sediments.
Zone 5 500 - more than 1000 mm deep This zone is not generally used for planting because there are not many plants that can survive and grow in this zone.
10.5.2 Infiltration and filter devices
Infiltration and filter devices either take advantage of existing permeable soils or create a permeable medium such as sand. When properly planted, vegetation will thrive and enhance the functioning of the devices. For example, pre-treatment buffers will trap sediments. Successful plantings provide aesthetic value and wildlife habitat, making the facilities more acceptable to the general public.

Doc # 11854602 Page 225
Planting around infiltration or rain garden devices for a 5 - 10 metre distance will cause sediments to settle out before entering the device, thus reducing the frequency of maintenance cleanout. As a planting consideration, areas where soil saturation may occur should be determined so that appropriate plants may be selected. Shrubs or trees must not be planted in areas where maintenance access is needed. Plant material selection should be based on the goal of simulating a terrestrial forested community of native species. Bioretention simulates an upland-species ecosystem. The community should have trees and a distinct community of understory shrubs and herbaceous materials. By creating a diverse, dense plant cover, a bioretention device will be able to treat stormwater runoff and withstand urban stresses from insects, disease, drought, temperature, wind and exposure.
10.5.3 Swales and filter strips
Key considerations include:
Soil characteristics
Plant interaction
Effects on stormwater treatment, and
Riparian buffers. The characteristics of the soil are perhaps as important as device location, size, and treatment volume. The soil must be able to promote and sustain a robust vegetative cover. Plant interaction is also important. Planting woody vegetation next to a swale or filter strip may shade the swale and allow intolerant grass species to grow in it. The landscape plan will have to consider the effects that overall landscaping will have on stormwater treatment. Riparian buffers are an excellent example of filter strips with high ecological, water quality and aesthetic value. When appropriately designed, they can treat dispersed runoff from adjacent land. The buffer, as shown in the adjacent image, can be an amenity to the community and increase economic value of adjacent lands.
Swale treating road runoff

Page 226 Doc # 11854602
10.5.4 Green roofs
Green roofs have to function in very exposed, rapidly changing weather conditions. A healthy, dense plant coverage is essential to successful stormwater management function. The plants must:
Thrive in conditions that many plants would struggle to survive in as opposed to actually thriving in.
Underpin permeability rates by water uptake and evaporation.
Protect the filter media from erosion by having dense plant coverage of the roof. The plants must have:
Low maintenance requirements
The ability to exist in wet and dry periods
Resistance to high, gusty winds, and
Be able to exist in full sunlight with a wide range of temperature conditions.

Doc # 11854602 Page 227
11 Proprietary devices and innovative products
Introduction As the stormwater programme continues to mature, alternative technologies will be proposed to meet water quality design goals. These innovative products may be developed where site or catchment development intensity make it difficult to achieve desired water quality treatment levels with conventional systems, or provide a level of treatment that is not possible with conventional approaches. Waikato Regional Council encourages the development of innovative, cost-effective stormwater management technologies, subject to approval. Approval will depend on submission of objective, verifiable data that supports the claimed efficiency, although a single pilot site may be approved for purposes of data collection to document performance. Another avenue that is available for approval purposes is submission of performance information that has been certified through one of the overseas approval processes discussed later in this section. Innovative products tend to be new technologies that have not been evaluated using approved protocols, but for which preliminary data indicate that they may provide a desirable level of stormwater contaminant capture. Some innovative products have already been installed or are proposed in the Region as parts of treatment trains or as a stand-alone device for a specific project. In some cases, innovative products may be necessary to remove metals or hydrocarbons. Innovative products can also be used for retrofits and where land availability does not permit larger conventional devices.
Approval options There are two potential avenues that an innovative product can take to determine the extent of its use for stormwater quantity or quality function.
1. Submission of an approval that has been given through another certification process (as detailed in Section 13.2.1).
2. Submission of information as detailed in the rest of this section. The preferred option is submission of an approval that has been given through another certification process. There are several processes listed in the next section and particularly the processes in Switzerland and two processes discussed from the United States are the most desirable and evidence of approval through those processes will form the basis of acceptability in the Waikato Region. Waikato Regional Council does maintain the right to not accept a specific certification if the source is not generally recognised by the engineering community as being objective or comprehensive. Only when no certification is available from those sources listed in the next section should a manufacturer request approval to conduct local testing as detailed in Sections 13.2.2 – 13.4. If a device has been developed in an area that has a certification process and the manufacturer has declined the option to go through that process, the manufacturer shall detail to Waikato Regional Council why that device was not submitted through the appropriate certification process.
11.2.1 Approval through another certification process
Austria, Germany, Switzerland and the United States have all developed comparatively successful stormwater quality treatment evaluation protocols, which address the requirements of their legislative authorities and the needs of their national stormwater industries with respect to the accepted use of new and existing treatment devices. Their protocols and rationale are provided in the following subsections.

Page 228 Doc # 11854602
Germany
There is no legally binding federal law in Germany for the discharge of stormwater runoff into surface water. All German states handle the treatment purposes differently according to their own State Water Laws and regulations. Legislation is being updated for soil and groundwater protection and should be completed by 2018 that will provide distinct threshold values that must be met by all stormwater quality treatment devices. In addition, recent regulations of the European Union must be addressed in the future. Currently, there is no unified approach to evaluating the effectiveness of stormwater management treatment devices.
Austria
There are a variety of Standards and guidelines in Austria dealing with different runoff area types (trafficable areas, copper and zinc roofs) and this increases the effort involved with the planning and construction of stormwater quality management devices. Review and evaluation is a complicated process and cannot be undertaken easily or quickly to reflect new changes in science or practical knowledge. As the test procedures have only recently been developed, no certifications exist to date.
Switzerland
The Swiss Federal Roads Office developed criteria to evaluate the performance of stormwater quality treatment devices used to treat road runoff. These evaluation criteria include maximum effluent concentrations discharging into receiving waters, removal efficiencies, specific surface loadings and hydraulic performances. The evaluation criteria also have a ranking system where 5 is the best performing and 1 is worst performing. Evaluation criteria for water quality treatment devices in Switzerland are provided in Table 11-1. Table 11-1: Evaluation criteria for water quality treatment devices in Switzerland145
Rank Hydraulic perf.
(L/m2/min)
Specific surface loading (m2/m2)
TSS (mg/L)
Effluent Concentrations
Cu Zn PAH*
(µg/L) (µg/L) (µg/L)
Removal Efficiencies
TSS Cu Zn (%) (%) (%)
5 >8 >400 <10 <5 <10 <0.1 >90 >90 >90 4 4 200 20 10 20 0.2 80 80 80 3 2 100 30 15 30 0.3 70 70 70 2 1 50 40 20 40 0.4 60 60 60 1 <1 <50 >40 >20 >40 >0.4 <60 <60 <60
* Polycyclic Aromatic Hydrocarbons
United States
There are several regional certification programmes that exist in the United States and there are several other efforts underway to develop a more national approach to certification of water quality treatment devices. The two existing programmes are the following:
Technology Assessment Protocol Ecology (TAPE), and
Technology Acceptance Reciprocity Protocol (TARP). Technology Assessment Protocol Ecology The TAPE programme was established by Washington State Department of Ecology in 2000 to address concerns that claims regarding stormwater quality treatment devices were not actually meeting the State’s criteria for TSS removal (80%). There are three use designations, all of which require field testing:
145 Steiner et al, 2010

Doc # 11854602 Page 229
Pilot level testing that requires laboratory scale based evidence. At this level the manufacturer is allowed to install water quality treatment devices at five sites and provide monitoring to verify that the device meets performance goals.
Conditional Level Designation where the manufacturer must present both laboratory and substantive field data that may not meet full monitoring protocols. If granted then 10 sites are allowed for field monitoring to demonstrate the technology meets the performance goals.
General Use Level Designation, which allows for unlimited use of the technology assuming it meets both the protocol and performance goals. This stage results in a certification letter, which stipulates the specific design criteria, performance limits and maintenance guidelines for the practice.
Approved technologies are then posted on the Department of Ecology’s website which has 79 entries146. Technology Acceptance Reciprocity Protocol This TARP protocol was originally a consortium of six states (California, Massachusetts, Maryland, New Jersey, Pennsylvania and Virginia) that worked together to establish the protocols. The protocols have two tiers of review:
Technology Evaluation Engineering Report (TEER 1) that used an established laboratory protocol, and defined particle size distributions of surrogate sediment for hydrodynamic separators and filters.
Technology Evaluation Engineering Report (TEER 2) that provided a protocol for field testing to demonstrate a removal of 80% TSS for filters and 50% TSS removals for hydrodynamic separators.
This protocol requires that the manufacturer must present a Quality Assurance Project Plan (QAPP) for review and approval. If accepted, the manufacturer moves to a test phase with an independent observer. If not accepted, changes are negotiated with the New Jersey Corporation for Advanced Technologies (NJCAT). If not resolved, an independent review is conducted by selected academic sources. Once the testing is complete a draft finding report is published by NJCAT. This report is placed for public comment, which includes other manufacturers. After the public comment period, changes are made if all comments are addressed and resolved. If not resolved then there is another opportunity for independent review. Once the report is finalised, it is issued as a verification and then can be used for certification by the State of New Jersey Department of Environmental Protection or other jurisdictions that recognise this process147.
Auckland and Australia
The Auckland Regional Council developed a proprietary devices evaluation protocol to provide a framework for the evaluation of the performance of water quality treatment devices. However that protocol has been withdrawn and will no longer be used. In Australia the primary stormwater industry body (Stormwater Australia) has formed an advisory committee to develop a protocol to provide guidance and a framework for the testing, evaluation and certification of the performance of new and existing stormwater quality devices. That process is in a detailed revision and development phase but has not yet been formally adopted. Once the protocol is adopted Waikato Regional Council will evaluate it and accept the certification results if the protocol is considered acceptable.
11.2.2 Information submission to Waikato Regional Council
This part outlines the information that should be submitted to evaluate the performance of alternative technologies whose operating parameters have not yet been verified to the satisfaction of Waikato Regional Council.
146 Ecology, 2016 147 State of New Jersey Department of Environmental Protection, 2016
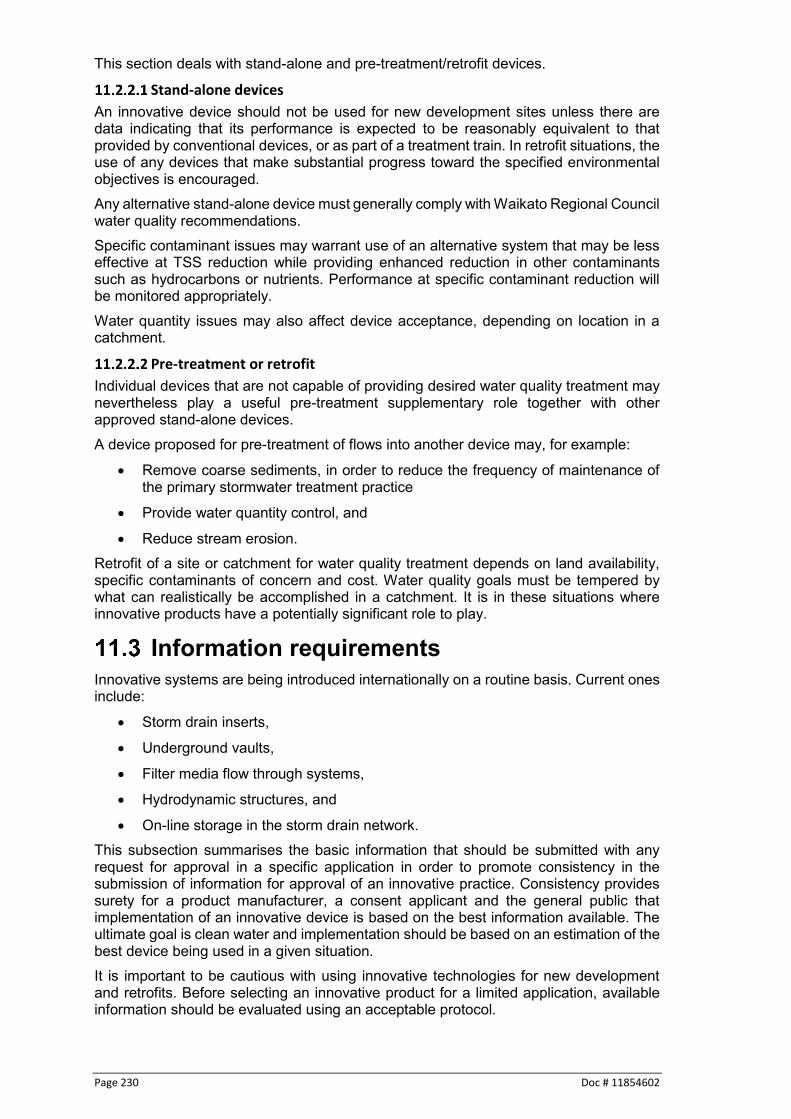
Page 230 Doc # 11854602
This section deals with stand-alone and pre-treatment/retrofit devices.
Stand-alone devices
An innovative device should not be used for new development sites unless there are data indicating that its performance is expected to be reasonably equivalent to that provided by conventional devices, or as part of a treatment train. In retrofit situations, the use of any devices that make substantial progress toward the specified environmental objectives is encouraged. Any alternative stand-alone device must generally comply with Waikato Regional Council water quality recommendations. Specific contaminant issues may warrant use of an alternative system that may be less effective at TSS reduction while providing enhanced reduction in other contaminants such as hydrocarbons or nutrients. Performance at specific contaminant reduction will be monitored appropriately. Water quantity issues may also affect device acceptance, depending on location in a catchment.
Pre-treatment or retrofit
Individual devices that are not capable of providing desired water quality treatment may nevertheless play a useful pre-treatment supplementary role together with other approved stand-alone devices. A device proposed for pre-treatment of flows into another device may, for example:
Remove coarse sediments, in order to reduce the frequency of maintenance of the primary stormwater treatment practice
Provide water quantity control, and
Reduce stream erosion. Retrofit of a site or catchment for water quality treatment depends on land availability, specific contaminants of concern and cost. Water quality goals must be tempered by what can realistically be accomplished in a catchment. It is in these situations where innovative products have a potentially significant role to play.
Information requirements Innovative systems are being introduced internationally on a routine basis. Current ones include:
Storm drain inserts,
Underground vaults,
Filter media flow through systems,
Hydrodynamic structures, and
On-line storage in the storm drain network. This subsection summarises the basic information that should be submitted with any request for approval in a specific application in order to promote consistency in the submission of information for approval of an innovative practice. Consistency provides surety for a product manufacturer, a consent applicant and the general public that implementation of an innovative device is based on the best information available. The ultimate goal is clean water and implementation should be based on an estimation of the best device being used in a given situation. It is important to be cautious with using innovative technologies for new development and retrofits. Before selecting an innovative product for a limited application, available information should be evaluated using an acceptable protocol.

Doc # 11854602 Page 231
For these reasons, submission of an innovative product in a given situation or for general compliance should include a description of the innovative technology or product including:
Whether the operating parameters of the system have been verified
Existing or proposed monitoring data (detailed in Section 13.4)
Documentation of processes by which TSS and other contaminants will be reduced (physical, chemical, biological)
Documentation and/or discussion of potential causes of poor performance or failure of the practice
Key design specifications or considerations
Specific installation requirements
Specific maintenance requirements
Data to support the claimed TSS removal efficiency. If the technology is new or the existing data is not considered reliable, a detailed monitoring programme to assess the TSS removal may be required, and
Ownership issues that could influence use of innovative products on individual sites. Examples of this issue could be refusal of a territorial authority to accept responsibility for operation and maintenance.
Information required to determine adequacy of monitoring data The following summarises the detailed information that is needed to properly judge the adequacy of existing or proposed monitoring data to evaluate performance compliance of an innovative practice, from catchment related information, device related information and water quality information.
11.4.1 Catchment parameters
The context in which the device operates helps define situations where an innovative product is (or is not) appropriate by assessing collection sites for known or new data. This in turn helps to determine the data’s applicability to other locations. It is also important that monitoring be undertaken in the field, as opposed to the laboratory, as field monitoring better reflects actual device performance. Key catchment parameters include:
Catchment area served
% impervious area
Total impervious area
Hydraulic connectivity
Base-flow or storm generated runoff only, and
Catchment land use and expected contaminants.
11.4.2 Device design parameters
Detailing specific elements of the innovative device provides a clear understanding of the water quality treatment processes that occur in the various components of the device. If the device has a standard design that is based on catchment size or maximum flow rate, that information should be clearly stated in the discussion of device parameters as detailed in the general discussion. Key device parameters include:

Page 232 Doc # 11854602
Basic shape (length/width, volume, importance of local topography)
Any permanent pool elevation and levels of service
Surcharge elevation
Forebay characteristics
Inlet/outlet locations and relative elevations
Water level control options
‘On-line’ or ‘off-line’
Age of device where monitoring has been or will be done, and
Specifications for device components (filter media, sieve sizes, geotextile specifications, etc.).
11.4.3 Water quality analysis
Analyses detailed here are primarily for those undertaken in New Zealand. Recognising that many innovative devices are being developed overseas, all information may not be available. In those situations, a degree of judgement is involved regarding the relative importance of specified criteria. Waikato Regional Council will consider the submission of overseas data as full or partial fulfilment of the water quality analyses, depending on the applicability of the collected data to the region. Compliance assurance may necessitate water quality analyses on a limited basis only for those parameters where gaps exist. The following analyses are to be undertaken for device performance documentation:
Flow weighted composite samples used to determine the TSS concentrations in the influent and effluent of the device,
General water quality constituents for monitoring include TSS, pH, conductivity, DO, enterococci and total hydrocarbons,
Total zinc should also be monitored as a ‘keystone’ contaminant for trace metals,
For devices claiming nutrient removal benefits, monitoring of TN and TP,
The performance of the device or system should be based on the sampling results from at least 10 storms representative of those normally occurring in the Region. Depending on the relative variation in results, additional monitoring may be necessary to better understand expected performance,
At least one storm event must be greater than 20 mm of rainfall,
There must be at least three days of dry weather between storms sampled
The samples must be collected and handled according to established procedures that are included in the monitoring plan,
The laboratory selected for analysis of the samples is recognised as technically proficient,
The efficiency of the device is calculated for individual events and is also based on the total TSS load removed for all monitored events,
The monitoring must be conducted in the field as opposed to laboratory testing, and
Depending on the processes involved in treatment, the device or system may need to be in the ground for at least six months at the time of monitoring.
Discussion While the approval process or level of information requested may seem onerous to someone developing or wanting to use an innovative device, it is essential that

Doc # 11854602 Page 233
programme implementation and overall success be underpinned by good technology. With millions of dollars being spent on design, implementation and operation, it is important that environmental objectives are met, especially when considering the costs associated with management. Even if Waikato Regional Council accepts certification results for an individual product, local councils are not obligated to accept operational responsibility for them. Ultimate programme success rests on stormwater strategies, approaches and devices achieving a certain level of performance. We must have confidence that a device will achieve stated goals and a good understanding of device strength, limitations, and performance if we are to meet our obligations under the RMA and public expectations.

Page 234 Doc # 11854602
12 Contaminant loads Introduction
Stormwater management systems are designed to avoid, remedy and mitigate potential adverse effects associated with stormwater runoff from urban areas, relating to stormwater quantity and stormwater quality effects. In terms of stormwater quantity, hydrological and hydraulic modelling can demonstrate that downstream flooding or channel erosion can be prevented or minimised through careful analysis and design. Water quality outcomes are less well defined and environmental outcomes are even more difficult to quantify. The purpose of this section is to provide a means to calculate water quality loadings related to land use and how implementation of stormwater management strategies and devices can reduce contaminant loadings to receiving systems. Contaminant load analysis should be undertaken by the applicant as a component of the application submission. This approach ensures that the applicant has a good understanding of the relationship between land use, contaminant loads and the reductions that stormwater devices can provide.
Determining water quality loads There are a variety of approaches that have been developed in New Zealand and internationally. Several of the more appropriate approaches are discussed here and include the following methods:
Auckland Council’s Contaminant Load Model,
Modelling Nutrient Loads in Tweed Catchment, New South Wales, and
Nutrient Export Coefficient Model used in California, United States of America. These methods are discussed in the following subsections. A further section provides unit loadings for nutrients based on Ministry for the Environment guidance148 that is New Zealand derived. Based on the review of appropriate methods, an approach is recommended to qualitatively predict water quality loads to receiving systems.
12.2.1 Auckland Council’s contaminant load model
This model, Version 2.0, is a spreadsheet model that has been developed to calculate contaminant loads within a catchment for the following contaminants:
Total suspended solids (TSS)
Zinc
Copper, and
Total petroleum hydrocarbons (TPH). The model provides contaminant yields (grams/m2/per annum) and uses data collected for the Auckland Region that has been validated nationally and internationally. The model also inputs relevant removal efficiencies for various stormwater devices to provide a barometer on how much of a given contaminant can be removed by a given device149. It is a good simple method that provides annual estimates of contaminant loads from various land uses. There are several issues that would need to be considered if the method is to be used in the Waikato Region.
148 Elliott et al, 2002 149 Auckland Regional Council, 2010

Doc # 11854602 Page 235
1. In developing their unit loadings that are derived from event mean concentrations, there is an assumption, which is reasonable for the Auckland Region, that annual impervious surface runoff throughout the region is 1,000 mm per annum. The original study that the unit loadings are based on150 used 1,200 mm of rainfall, with an assumption that the rainfall will result in 1,000 mm of runoff. The Waikato Region rainfall varies greatly as the region is traversed so this assumption is less accurate depending on location in the region. Figure 9-37 shows annual rainfall throughout the region and the relative differences in rainfall can be seen.
2. The contaminant loads used as unit loadings for pervious areas account for slope but not soil type other than sedimentary, volcanic and unknown. Auckland soils in most areas are silty clay or clay soils so not accounting for soil permeability is not a problem but the Waikato Region has a large variety of soils, which may significantly influence loadings.
3. The source types are very detailed with considerable information being required regarding impervious surfaces for roads (including vehicles/day information) and impervious surfaces other than roads. There are forty parameters that may need information entry to obtain annual contaminant yields in addition to inputting the variety of treatment devices that will be used for the various land uses. Slopes have to be carefully considered where each source is concerned.
Unit loadings of metals and TPH are reasonable for use in the Waikato Region but sediments and pervious areas may need modification to loadings if more accuracy is required. Rather than identify all forty of the unit loadings, it is suggested that the source document be reviewed.
12.2.2 Tweed Catchment, New South Wales
Whereas the Auckland Council has focused on total suspended solids (TSS), metals and TPH in their spreadsheet approach, there is value to considering another approach that focuses on nutrients. The Tweed catchment in New South Wales was studied to examine historical land use patterns and to assess land use planning scenarios in terms of their potential impact on nutrient emissions. Catchment emissions of total nitrogen (TN) and total phosphorus (TP) were estimated with the intention of raising community awareness of long term contaminant potential and to support sustainable planning151. Model requirements and input data include the following:
Runoff volumes are predicted using the curve number (CN) method, which includes soil type, cover and hydrologic conditions to estimate runoff.
Event mean concentrations (EMC) of contaminants were determined from published sources both in Australia and overseas and are representative of major land use classes. EMCs for urban areas were derived predominantly from the results of monitoring studies152.
Table 12-1 shows EMCs used for nutrient load simulation.
150 Kingett Mitchell et al, 2003 151 Baginska et al, 2012 152 Fletcher et al, 2004

Page 236 Doc # 11854602
Table 12-1: EMCs used for nutrient load simulation Land use class EMC (mg/L)
TN TP Agriculture/cropping 4.4 1.3 Agriculture/improved pasture 1.0 0.5 Urban low density, caravan park, urban park and golf course
1.8 0.25
Urban medium density 2.2 0.7 Commercial/industrial/urban high density, bare land
3.3 0.7
Transport and communication 2.0 0.5 Conservation/bushland, Unimproved pasture, sand/beach
0.7 0.01
It is not suggested that this approach be used throughout the Waikato Region but the information related to nutrient loads may have some value. EMCs can be converted to annual loads by the following equation. It should be noted that mg/L = g/m3. Total Load kg/ha/year = annual rainfall (m) x annual runoff/annual rainfall x unit loading (g/m3) x 10,000 (m2) x 0.001 (kg/g) for a given contaminant
12.2.3 Nutrient export coefficient model
This approach was developed for the State of California153 and identifies nutrient ecoregions of California and compiles the values and ranges of nitrogen export coefficients for various land uses. The values recommended are based on:
Coefficients from a variety of studies and publications
United States Environmental Protection Agency (USEPA) designations for sub-regions of the United States
Export coefficients from other sub-regions within the State of California
Median national or regional values that are applicable, and
Local watershed studies that could be reasonably associated with specific project area land uses.
A distinctive aspect of this work is the variation of contaminant exports with soil type. The study considers many different references for the unit loadings of nitrogen and phosphorus as detailed in the above references and assigns high and low values to nutrients. Those values are given by the following equations:
PC = LPC + (HPC – LPC) x X NC = LNC + (HNC – LNC) x X Where PC or NC = most likely export coefficient for phosphorus (P) or nitrogen (N) LPC or LNC = lower limit export coefficient for P or N HPC or HNC = upper limit export coefficient for P or N X = value associated with each HSG as shown in the following Table 12-2.
153 Rose, 2013
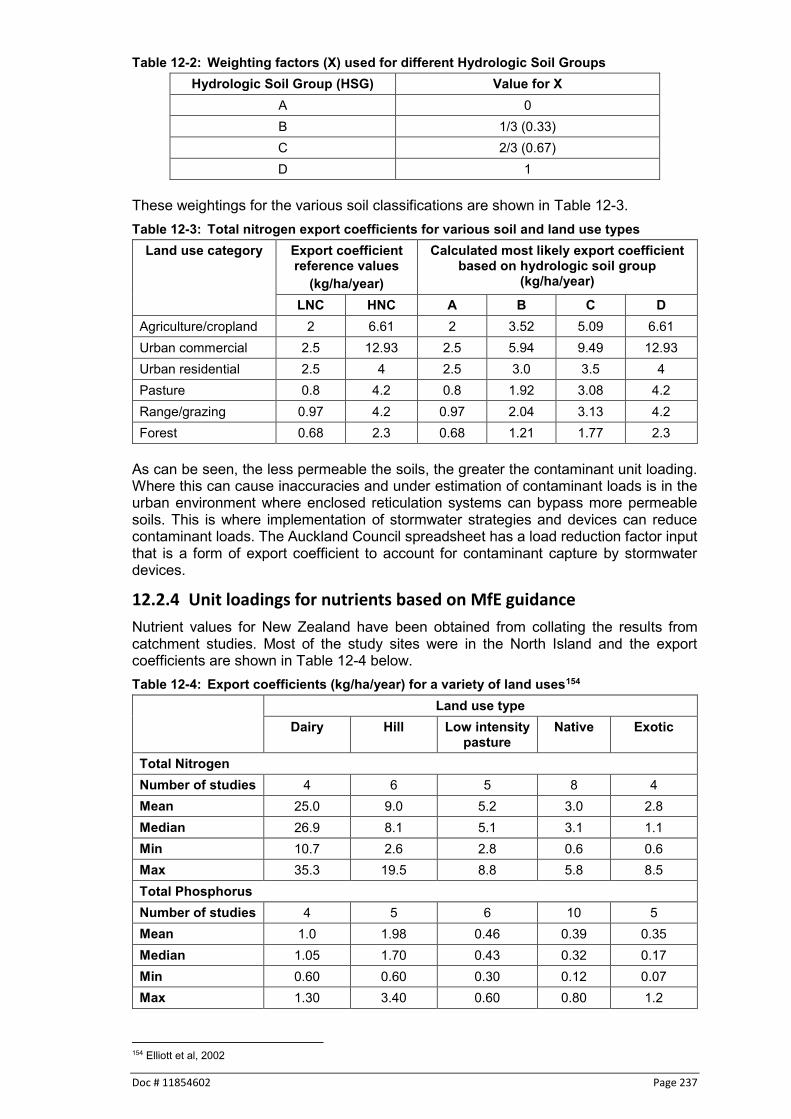
Doc # 11854602 Page 237
Table 12-2: Weighting factors (X) used for different Hydrologic Soil Groups Hydrologic Soil Group (HSG) Value for X
A 0 B 1/3 (0.33) C 2/3 (0.67) D 1
These weightings for the various soil classifications are shown in Table 12-3. Table 12-3: Total nitrogen export coefficients for various soil and land use types
Land use category Export coefficient reference values
(kg/ha/year)
Calculated most likely export coefficient based on hydrologic soil group
(kg/ha/year)
LNC HNC A B C D Agriculture/cropland 2 6.61 2 3.52 5.09 6.61 Urban commercial 2.5 12.93 2.5 5.94 9.49 12.93 Urban residential 2.5 4 2.5 3.0 3.5 4 Pasture 0.8 4.2 0.8 1.92 3.08 4.2 Range/grazing 0.97 4.2 0.97 2.04 3.13 4.2 Forest 0.68 2.3 0.68 1.21 1.77 2.3
As can be seen, the less permeable the soils, the greater the contaminant unit loading. Where this can cause inaccuracies and under estimation of contaminant loads is in the urban environment where enclosed reticulation systems can bypass more permeable soils. This is where implementation of stormwater strategies and devices can reduce contaminant loads. The Auckland Council spreadsheet has a load reduction factor input that is a form of export coefficient to account for contaminant capture by stormwater devices.
12.2.4 Unit loadings for nutrients based on MfE guidance
Nutrient values for New Zealand have been obtained from collating the results from catchment studies. Most of the study sites were in the North Island and the export coefficients are shown in Table 12-4 below. Table 12-4: Export coefficients (kg/ha/year) for a variety of land uses154
Land use type Dairy Hill Low intensity
pasture Native Exotic
Total Nitrogen Number of studies 4 6 5 8 4 Mean 25.0 9.0 5.2 3.0 2.8 Median 26.9 8.1 5.1 3.1 1.1 Min 10.7 2.6 2.8 0.6 0.6 Max 35.3 19.5 8.8 5.8 8.5 Total Phosphorus Number of studies 4 5 6 10 5 Mean 1.0 1.98 0.46 0.39 0.35 Median 1.05 1.70 0.43 0.32 0.17 Min 0.60 0.60 0.30 0.12 0.07 Max 1.30 3.40 0.60 0.80 1.2
154 Elliott et al, 2002

Page 238 Doc # 11854602
These values being locally based would be most appropriate for use in determining contaminant loads where there is a mix of urban and potentially rural land uses.
Recommended approach There are two issues that need to be considered when using approaches that have been developed elsewhere.
The difference in annual rainfall, and
Consideration of local soils. The issue of contaminant reductions via implementation of stormwater strategies and devices is not considered significant as there is general agreement, with only some variation, hence is not discussed further.
12.3.1 Rainfall differences
The annual loadings for urban land uses for the Auckland Region are considered good loading estimates, however they are based on an assumption of a uniform impervious surface runoff of 1,000 mm (based on 1,200 mm of rainfall). Rainfall in the Waikato Region has greater variability and needs to be accounted for in estimating annual loads. As a result, the contaminant yields from the Auckland contaminant load model should be increased by the ratio of average annual rainfall for the site in millimetres (derived from Figure 8-36) divided by 1,200 mm. As an example, a project in Hamilton having an average annual rainfall of 1,300 mm would use a ratio of 1.1 (1,300 mm / 1,200mm = 1.1). Hence would multiply the contaminant yields from the Auckland contaminant load model by a ratio of 1.1 to more accurately reflect the difference in local area runoff. Table 12-5 provides urban contaminant yield values for a variety of land uses in the Waikato Region. Table 12-6 provides contaminant yield values for rural land uses. Most of the values in Table 12-5 have come from the Auckland contaminant load model discussed above but have been converted from g/m2/year to kg/ha/year for consistency with the rural contaminant yields listed in Table 12-6.
Urban nutrient loads have come from international data155.
155 New York State Department of Environmental Conservation, 2003 (modified in 2008)

Doc # 11854602 Page 239
Table 12-5: Urban contaminant yields for use in the Waikato Region Land use Specific
elements Contaminant yield (kg/ha/year)
Total suspended
solids (TSS)
Total zinc
Total copper
Total nitrogen
Total phosphorus
These values need to account for rainfall variation
Roofs Galvanised steel
50 22.4 0.003 15 1.1
Zinc/aluminium 50 2.0 0.009 15 1.1 Zinc/aluminium
coated 50 0.2 0.016 15 1.1
Concrete 160 0.2 0.033 15 1.1 Roads 1k-5k vpd 280 0.26 0.089 14 5.5
5k-20k vpd 530 1.1 0.37 20 4.7 20k-50k vpd 960 2.57 0.86 26 4.0 50k-100k vpd 1580 4.7 1.57 30 3.2
Paved Residential 320 1.95 0.36 14 5.5 Industrial 220 5.9 1.07 - -
commercial 320 - 0.03 - - Pervious Urban
grassland and trees < 50
slope
450 0.016 0.003 91 21
Urban grassland and
trees Slope 5-100
920 0.032 0.006
Urban grassland and
trees Slope >100
1850 0.065 13
Table 12-6: Rural contaminant yields for use in the Waikato Region
Land use Contaminant yield - mean values (kg/ha/year) Total Nitrogen Total
Phosphorus Total suspended solids
(TSS) Dairy 25.0 1.0 26.0 Hill country 9.0 1.98 0.46 Low intensity pasture 5.2 0.46 0.15 Native vegetation 3.0 0.39 0.4 Exotic vegetation 2.8 0.37 0.01
Due to the rainfall variation between the Auckland and Waikato regions discussed above, the values provided in Table 12-5 need to be modified to account for rainfall variation by the appropriate ratio that takes into account the local average rainfall and divides it by 1,200mm. The rainfall ratio should be used for all of the urban land uses for total suspended solids, zine and copper. The international data for nutrients in Table 12-5 does not provide any assumptions for the values, and several categories are not broken down to the same level of detail as the Auckland Regional Council data, hence these values are not modified.

Page 240 Doc # 11854602
This value is then multiplied by the unit loading times the area of the land use in hectares. To use the tables and determine contaminant loading, undertake the following steps:
1. Determine the appropriate land use for a given site and take the values for the contaminants given in Table 12-5 and Table 12-6 to use for subsequent calculations.
2. Find the site location in the region in Figure 8-36 and determine the rainfall ratio (ratio = local average annual rainfall / 1,200 mm)
3. Multiply the rainfall ratio and the unit loadings for total suspended solids, zinc and copper to get the local unit loadings for the site.
4. Multiply the unit loadings from the previous step by the area of the land use in hectares to get the site loadings.
5. To get the loadings that are discharged from the site, the loading must account for the stormwater management devices that are used to treat the site runoff. Table 6-10 and Table 6-11 are then used to determine the percentage reduction of the contaminants of concern. The percentages given in the tables are multiplied by the site loadings to obtain site contaminant discharges.
12.3.2 Local soils
It is not necessary to take local soils into account in an urban context for several reasons. 1. Most urban sites have a reticulation system such that local soils are often
bypassed in transport of stormwater runoff. 2. Soils are often highly disturbed and quantifying their capability of contaminant
reduction is questionable. In those areas where rural land uses are included in an analysis, soils should be incorporated into the analysis for total suspended solids, zinc, copper and total phosphorus. Total nitrogen should not consider soils as the nitrogen will ultimately still be released downstream through groundwater interaction with surface waters. Even though there would be nitrogen reduction into surface runoff, long term nitrogen entry to receiving systems will still occur.
12.3.3 Case study – Contaminant load model
Residential subdivision in Taupo Rainfall at site location = 1100 mm Subdivision size = 8 ha Average lot size = 470 m2 Average home roof area = 250 m2 (2.5 ha across the whole site) Subdivision imperviousness = 60% (4.8 ha) Residential paved areas = 2.3 ha Pervious areas = 3.2 ha Roof material is zinc/aluminium surfaces steel coated long run Ratio of Taupo rainfall versus 1200 mm = 1100/1200 = 0.92 Stormwater treatment is provided by bioretention for all roof areas; paved areas and pervious surfaces are treated with swales. Table 12-7 shows how total site loads are calculated. Removal efficiencies are those shown in Table 6-10 and Table 6-11. Total loads could have additional removal if peak flow control is required for the subdivision and a constructed wetland provides peak and flow control. Since all site runoff would go through the wetland, the total removals shown in the bottom row of the table can be reduced further.

Doc # 11854602 Page 241
Table 12-7: Case study: contaminant load model Land use Contaminant loads (kg/ha/year)
TSS unit load
Zinc unit load
Copper unit load
TN TP
Roofs Loadings from roof (kg/ha/year)
4.6 0.02 0.001 15 1.1
Loadings from roof areas for site (kg/year)
11.5 0.05 0.0025 37.5 2.75
Removal efficiency of bioretention
0.8 (20% discharged)
0.7 (30% discharged)
0.75 (25% discharged)
0.4 (60% discharged)
0.6 (40% discharged)
Loadings after bioretention (kg/year)
2.3 0.015 0.0006 22.5 1.1
Paved areas Loadings from paved areas (kg/ha/year)
29.4 0.18 0.03 14 5.5
Loadings from paved areas for site (kg/year)
67.62 0.41 0.07 32.2 12.65
Removal efficiency of swales
0.75 (25% discharged)
0.5 (50% discharged)
0.6 (40% discharged)
0.2 (80% discharged)
0.3 (70% discharged)
Loadings after swale treatment
16.9 0.21 0.028 25.8 8.86
Pervious areas Loadings from pervious surfaces (kg/ha/year)
41.4 0.001 0.0003 91 21
Loadings from pervious areas for site (kg/year)
132.5 0.003 0.001 291.2 67.2
Removal efficiency of swales
0.75 (25% discharged)
0.5 (50% discharged)
0.6 (40% discharged)
0.2 (80% discharged)
0.3 (70% discharged)
Loadings after swale treatment
33.13 0.0015 0.0004 233 47.04
Total loads discharged from site prior to treatment (kg/year)
211.62 0.46 0.07 360.9 82.6
Total loads discharged from site after treatment (kg/year)
52.33 0.227 0.029 281.3 60.79
Table 12-7 shows the removal capability of stormwater management devices for a variety of contaminants. It is stressed that even with the implementation of stormwater management devices contaminants are discharged from the site. Depending on the receiving system the cumulative impacts of numerous developments could be more than minor. Thus, there is need to also consider low impact design principles during the design and implementation of new developments.

Page 242 Doc # 11854602
13 Bringing the elements together Introduction
In various locations discussed previously in the guidelines, there were items that require addressing in order to have an acceptable application foundation in submitting a discharge consent application. Those items include:
Table 4-3, Receiving environments and stormwater issues,
Table 6-1, a site development scoring approach,
Section 7.4, recommendations for peak flow control, stream erosion control and water quality control,
Section 7.4.2, item 1, retention of the initial abstraction of runoff from impervious surfaces shall be retained on site, and
Section 7.4.2, item 1, soil reconditioning is necessary to ensure permeability of pervious areas or those areas must provide volume control.
Criteria detailed for the various elements 13.2.1 Receiving environments and stormwater issues
The following table summarises the key issues to consider for the different receiving environments in the Waikato. Table 13-1: Receiving environments and stormwater issues (Table 4-3 repeated)
Receiving system Flooding issues Stream erosion issues
Water Quality
Streams May be a priority depending on location within a catchment
High priority if the receiving stream is a natural, earth channel
High priority
Rivers Generally not an issue
Generally not an issue
High priority
Floodplains Peak flows need to be considered downstream of development
Channel stability is considered as an issue of concern
Not an issue
Wetlands High priority High priority High priority Ground Not an issue
depending on overflow
Not an issue High priority
Karst areas High priority Not an issue High priority Estuaries Not an issue Not an issue High priority Harbours Not an issue Not an issue Moderate priority Open Coast Not an issue Not an issue Lower priority Lakes Not an issue Tributary stability High priority Geothermal areas Not an issue Not an issue Protecting existing
land cover in areas adjacent to geothermal areas
When considering a proposed discharge, a key element is awareness of the receiving system that the discharge enters. There may or may not be a specific stormwater related issue depending on discharge location, but it is important that the applicant recognise what sensitivities there are downstream and their approach to site development may, in part, depend on those sensitivities.

Doc # 11854602 Page 243
13.2.2 Low impact design scoring matrix
The following table provides the low impact design scoring matrix to be considered when designing the proposed site layout and stormwater management systems. This is a repeat of Table 6-1. Table 13-2: Scoring matrix for site stormwater management approach (Table 6-1
repeated) Implementation elements
Typical components Maximum Individual score
Total score for each item
Source control maximised
Water re-use 0-4 depending on % of total runoff capture
Site disturbance reduced from a conventional development approach
0-3 depending on % of runoff capture
Impervious surfaces reduced from a traditional approach
0-3 depending on % of runoff capture
Use of building or site materials that do not contaminate
0 or 1 for residential 0-3 for commercial or industrial
Existing streams located on site (including ephemeral) are protected and enhanced. Then entire stream other than possible crossings shall be protected to quality for points.
0 or 3
Riparian corridors are protected, enhanced or created
0 - 3
Protection and future preservation of existing native bush areas
0-2 depending on percentage of site area
LID stormwater devices used
Infiltration devices to reduce runoff volume
0-6 depending on % of runoff capture
Revegetation of open space areas as bush
0-3 depending on % of site covered
Bioretention 0-6 depending on % of runoff capture
Swales and filter strips 0-3 depending on % of runoff capture
Tree pits 0-6 depending on % of runoff capture
Traditional mitigation Constructed wetlands 0-4 depending on % of
runoff capture
Wet ponds 0-1 depending on % of runoff capture
Proprietary devices 0-1 depending on % of runoff capture
Detention ponds (normally dry)
0
Urban design Stormwater management is designed to be an integral and well considered part of the urban design.
0–2
Total score

Page 244 Doc # 11854602
The scoring matrix outlined above relates to stormwater management and focusses on encouraging LID in particular. This doesn't replace the need to consider other values including cultural, social, environmental and economic. It is noted that Items such as streams or riparian corridors that do not exist on site would score 0. Once the total score is calculated, the minimum score in terms of acceptability is 15. Scores lower than that will have to justify rejection for those items not incorporated. At least 6 points are required for source control and 6 points required for LID devices individually. If a specific site does not have existing streams or gullies, riparian corridors or existing native bush the total acceptable score for source control can be reduced to 4 points, which would reduce the acceptable total for site development to 13 points. As stated in Section 1 the Waikato Regional Council uses a Best Practicable Option (BPO) approach for assessing the adequacy of technical design for discharge consents. As such, being unable or unwilling to meet the thresholds indicated above does not automatically mean the consent application will be declined. If an applicant chooses to use another approach to site development then an analysis should accompany the application to demonstrate that similar outcomes are achieved when compared to if a low impact design approach was taken. Highway projects are different from normal development projects and the ability to provide source control is limited. As a result highway projects must still consider LID and traditional mitigation devices and must achieve a total score of at least 8. This table is a tool to encourage developers to consider and implement low impact design approaches on their sites. Details about how points are awarded is provided in Section 6.1.3.1 with an example provided in Section 6.1.3.2.
13.2.3 Peak flow management and erosion potential
The following reiterates the design criteria for peak flow control, stream erosion control and water quality treatment. Peak flow control criteria There are five requirements related to peak flow control criteria:
1. Rainfall data used for all rainfall events shall have 24-hour rainfall distribution. 2. The rainfall data for the 2, 10 and 100-year ARI events should be increased for
the post-development scenario to allow for predicted climate change in accordance with Section 7.1.6.
3. Where there are existing downstream flooding issues, depending on the site’s position in the catchment (refer to Section 7.1.3), it is recommended that the post-development peak discharge for the 100-year ARI rainfall event for a new development be limited to 80% of the pre-development peak discharge (unless there is a catchment study that demonstrates that this is not required).
4. In terms of intermediate storm control, depending on the site’s position in the catchment (refer to Section 7.1.3), the 2 and 10-year ARI post-development peak discharges shall not exceed the 2 and 10-year ARI pre-development peak discharges.
5. As discussed in Section 7.1.3, peak flow control is generally only recommended for projects located in the top half of catchments so as to avoid concerns over coincidence of peaks aggravating downstream flooding concerns. It is expected that stormwater design will be undertaken by experienced stormwater practitioners who will be able to determine whether peak flow control is required. If there is confusion regarding whether peak flow control is required, Waikato Regional Council staff can be contacted to discuss further.
Stream erosion control criteria

Doc # 11854602 Page 245
There are four different approaches that address stream channel erosion: 1. It is recommended that the difference between the pre- and post-development
total volume for smaller storms up to the 2-year ARI event be retained (rainwater re-use, soakage, or bioretention) where possible. There will be situations where this volume cannot be retained on site due to slope, water table or soil conditions. A minimum retention of the site pre-development initial abstraction from all impervious areas should be provided. If soil conditioning is not provided for intended pervious areas that have been earth-worked then the initial abstraction of runoff from the entire site should be retained per the following paragraphs and bullets. The initial abstraction is rainfall and converting it to a volume of runoff for impervious surfaces is straight forward where the rainfall is assumed to be directly converted to runoff with no reduction in the amount. For pervious areas that are not rehabilitated, additional analysis is necessary. In those situations:
The pre-development runoff curve number (CN) is used to calculate the runoff volume for the area that will be pervious but not rehabilitated post-development.
The post-development CN should be determined assuming that the soil group is altered to account for soil disruption and compaction. Thus, a group A soil should be considered as a B soil in post-development scenario (similar to a B becomes C, C becomes D).
Volumes for the given area are calculated in the pre- and post-development conditions for the water quality storm with the post-development condition including global warming increases and the volume to be retained represents the difference in runoff volumes. This volume is then combined with the impervious area retention volume to arrive at a total site retention volume.
2. Check the 2-year stream velocities against Table 7-3 to ensure that velocities are non-erosive. If they are non-erosive in the post-development condition assuming maximum probable development of the catchment, then no extended detention is required. If stream velocities are predicted to be erosive then criteria are provided in items 3 and 4 below.
3. Implement extended detention or volume control according to the following: a) If the stream is stable under the existing development condition, design
detention or retention storage for a 24-hour release of an equivalent volume to the water quality storm.
b) If the stream is not stable (refer to Section 7.2.5 above for further discussion), multiply the water quality volume by 1.2 to determine the extended detention volume. That volume is then stored and released over a 24-hour period.
c) The relationship between initial abstraction (Ia) and the water quality volume and extended detention should be considered jointly. The water quality volume and the extended detention volume can be reduced by the retained initial abstraction volume. If retention is provided for the full 2-year ARI event for a site, then no extended detention is required for smaller storms, and water quality would be considered to be addressed as well.
4. This item is for those situations where catchment development has already essentially been completed or for growth cell planning where a large proportion of the catchment is proposed to be developed and the effects of one more development can be determined. Only when item 4 is accomplished can consideration be given to modification of item 3 requirements. Conduct a shear stress analysis for a specific site by undertaking the following:
a) Conduct catchment modelling, i.e. continuous simulation, using land use, initial losses and time of concentration for the catchment in the pre-

Page 246 Doc # 11854602
development condition without the proposed project. Another simulation will then have to be undertaken for the catchment with the development in place.
b) Input climate information including evaporation data and long-term rainfall.
c) Identify a typical downstream cross-section, slope bed material and channel roughness.
d) Apply standard channel hydraulics to the cross-section to get a relationship between the discharge and shear stress.
e) Develop the relationship between shear stress and erosion rate. f) Combine this with the discharge/shear stress relationship to get a
discharge/erosion relationship. g) Apply the output hydrographs from the hydrological simulations to get the
discharge/erosion curve to get the long-term time series of erosion rate. h) Calculate the long-term erosion with and without the new project to
determine whether the intended development will make erosion worse. i) Council could allow for another method of calculating erosion potential
through the use of NIWA's 2004 A Guide for Assessing the Effects of Urbanisation on Flow-related Stream Habitat.
Volume control uses the same volumes as recommended for detention but then infiltrates or otherwise uses (water tanks, designed evapotranspiration) the runoff. Stream erosion issues are applicable where:
There is a natural stream, and
Catchment imperviousness exceeds 3%, and
There is potential for future development to increase stream channel instability, and
There is no tidal influence to the stream where the new development discharges to it.
Water quality treatment criteria The following recommendations are made:
1. The water quality volume is equivalent to the stormwater runoff volume from 1/3 of the 2-year 24-hour rainfall event across a defined area at a given location.
2. The water quality volume should be used for determining storage volumes and flow rates in sizing stormwater management devices.
3. In areas where the rainfall for the water quality event is greater than 30 mm, a rainfall depth of 30 mm can be used to determine the water quality volume for water quality treatment. This only applies to water quality. Extended detention will require design for the full-unadjusted rainfall depth.
4. Where the receiving environment has existing nutrient issues (for example in contained lake catchments) at least two devices should be used in series to improve removal of nitrogen and phosphorus from the stormwater discharge.
The overall process The overall process requires initial steps of data acquisition in conjunction with the type of development intended at a given location. As the information is gathered decisions start to be made regarding the shape, form and overall approach to site development, which determines the stormwater management approach.

Doc # 11854602 Page 247
The process requires a different approach or paradigm shift for conventional site design in that stormwater related issues must be addressed at the initial site design phase of project development. This has historically not been the approach and stormwater related issues have tended to be considered during the final stages of site design. This paradigm shift is necessary if downstream resources and properties are to be protected when land use change in upstream catchment areas is undertaken. The historic approach relied completely on capture and treatment of stormwater runoff while the current approach requires consideration of source reduction of runoff prior to any consideration of capture and treatment. Reducing the volume of stormwater runoff is of critical importance if our goals of environmental protection can be realised. This paradigm shift how stormwater is managed is also required to ensure that the objectives of the Vision and Strategy for the Waikato River are achieved (and future legislation for other rivers in the region) and that objectives of co-management partnerships with Iwi are recognised. The following simplistic flowchart shown in Figure 13-1 considers the criteria provided in Section 9.2 and where these criteria need to be considered in the overall site planning process. Failure to address these design criteria early in the design process will likely result in a failure to achieve the required stormwater management outcomes.
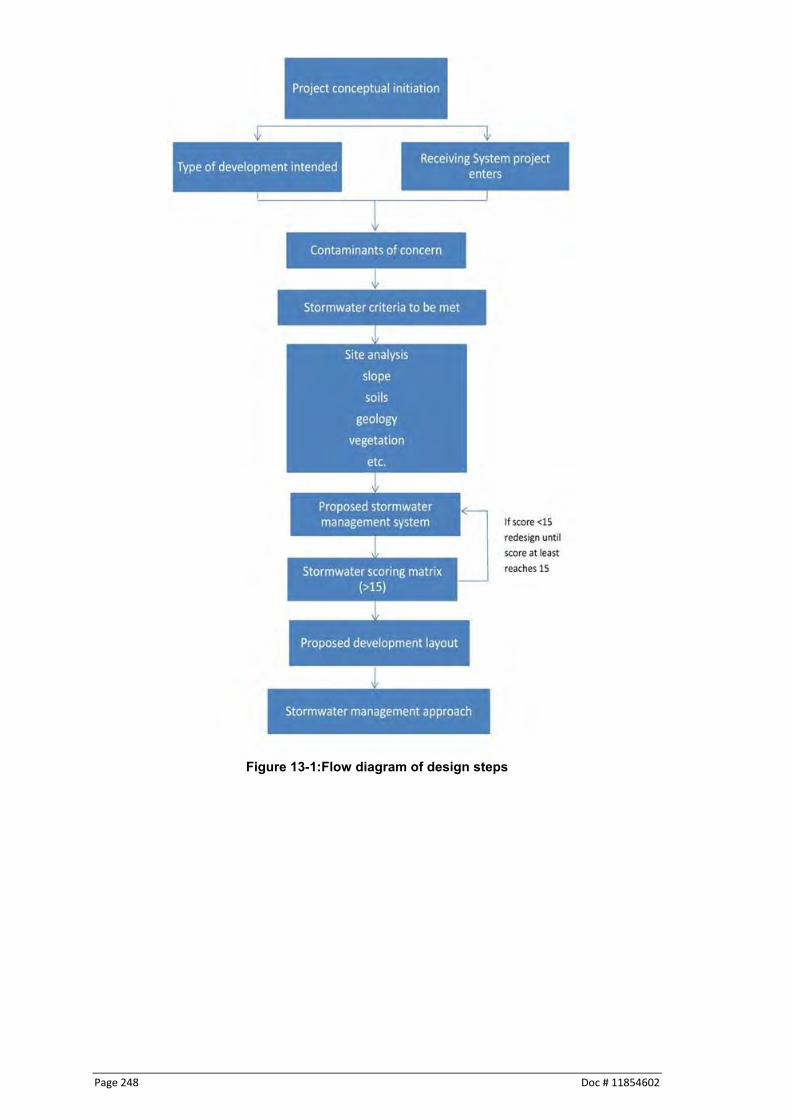
Page 248 Doc # 11854602
Figure 13-1:Flow diagram of design steps

Doc # 11854602 Page 249
Part III: Different site applications for stormwater management

Page 250 Doc # 11854602
14 Industrial site management Much of the information included in this section is from work undertaken for the Hawkes Bay Regional Council.
Introduction Industrial sites are potentially significant sources of contamination to receiving systems. Their impact can be disproportional to their size as they may have significant storage of chemicals, have operations that involve a variety of chemicals and drainage systems that quickly convey the contaminants to receiving systems. Receiving systems are discussed in Section 5 and each of the receiving environments mentioned could be encountered on or near an industrial site. Industrial sites also must continually guard against spillage of chemicals and protect storage areas from coming into contact with stormwater. As a safeguard they must develop and implement operational plans that are risk based to prevent adverse impacts to receiving systems. The following subsections provide a brief discussion of a number of issues related to the establishment and operation of an industrial activity. The following items are discussed:
Source control and site housekeeping,
Industries, contaminants of concern and appropriate treatment devices, and
Stormwater treatment for contaminant reduction and peak flow control. Each of these items is a significant element in developing an effective site management plan and the elements need to be undertaken in conjunction with one another to minimise adverse impacts to receiving systems.
Source control and housekeeping Initial consideration has to be given to source control and preventing discharge of contaminants in the first place. This can only be undertaken when there is a good understanding of site operations, areas potentially draining contaminants and the site drainage system. These items can be considered if there is an up-to-date site plan.
14.2.1 Importance of having site plans
A site plan has to be available that shows the following:
Buildings
All outdoor areas
Site boundaries and adjacent land use, and
Stormwater and wastewater systems.
Bin leaking paint into the stormwater system

Doc # 11854602 Page 251
Figure 14-1: Typical industrial site showing various site elements156 When considering the drainage plan, the following elements need to be considered as part of the drainage system.
Stormwater pipes, their inlets and outlets,
Any open drains,
Direction of stormwater flows and overland flowpaths,
Low points on the site,
Areas where runoff leaves the site (ground or surface water),
Stormwater management devices, and
Any evidence of a cross-connection between the stormwater and wastewater system.
14.2.2 Stormwater pipes, their inlets and outlets
The site drainage system will discharge into one of three systems:
A council reticulation system that will eventually outfall into a stream, lake, ground, estuary, harbour or open coast environment,
A soak hole or general soakage into the ground, or
An excavated ditch, stream, estuary, lake, harbour or open coast environment. It is important to know what the eventual receiving system is in order to determine the potential impact of contaminants to that system.
156 Hawke’s Bay Regional Council, 2009

Page 252 Doc # 11854602
14.2.3 Outdoor areas
Spills and leaks from outdoor activities can easily get into the stormwater system. It is important to know where these activities drain to in the event of a spill. Examples of outdoor activities include:
Loading and unloading areas,
Decanting areas,
Refueling and lubricating areas,
Washdown areas,
Permanent or temporary areas for storage of materials,
Tanks and bunding,
Stormwater monitoring devices,
Stormwater shut off/diversion valves, or
Stormwater treatment systems.
14.2.4 Stormwater and wastewater systems
Stormwater systems are those that accept surface runoff related to rainfall, while wastewater systems can include the following elements:
Sanitary or trade waste sewers,
Gully traps,
Internal floor drains,
Manholes, or
Trade waste connections. It is important to recognise that stormwater systems should not be used for wastewater disposal. Cross-connections are a major source of contaminant entry into stormwater systems. Cross-connections can be a problem, especially for older sites where waste pipes are connected to the stormwater system. These can include:
Boiler blowdown waters,
Compressor condensates,
Cooling water,
Sewage,
Trade wastes, and
Wash waters. If cross-connections are found, the issue should be discussed with the local council and the cross-connection should be disconnected as soon as possible by connecting the waste pipe to the sanitary sewer.
14.2.5 Housekeeping
Inspections can reveal housekeeping problems and any of the following items indicate the need for improved site housekeeping:
Stains or corrosion of any surface, including along concrete heading towards grates or around grates,
Degreasing where runoff can enter the stormwater system

Doc # 11854602 Page 253
Marks on or near any stormwater grate or stormwater cesspit or materials in the indicating that anything other than clean rain water has gotten into them,
Stormwater grates that are blocked with solids like grass, plastic or litter,
Puddles, discolouration, oil or grease or chemicals on the ground,
Leaking or corroded equipment, valves, seals, containers or lines,
Areas where absorbent materials (kitty litter, sawdust) have been used to clean up a spill but not properly removed,
Outdoor bunds where stormwater valves have been left open or are not securely locked,
Litter or waste thrown behind buildings, over fences, onto foreshore or river banks,
Containers that are stored in the open that could contain residues, show signs of corrosion or leaks or torn bags,
Leaks, overflows or spills from tanks, valves, pumps or drip trays,
Containers unsafely stacked on top of each other or
Containers that are not clearly labeled or not labeled at all. Wash-down areas are another source of contaminant discharge to receiving systems. Issues related to wash-down areas can include the following:
Wash-down areas being routinely cleaned after washing to ensure that contaminants removed by the washing operation do not enter the stormwater system,
Equipment being routinely maintained so that they do not produce excessive contaminants when washing is done, and
Wash-down is undertaken in designated areas. Loading, unloading, material handling and decanting areas are another source of contaminant generation and potential discharge. These areas need to be considered for contaminant generation with examples being the following:
Spills caused by decanting liquids. This issue can be reduced by using funnels, drip trays, buckets or other devices to catch liquids,
Checking drip trays routinely to ensure that they do not become overly full,
Filling and transferring materials procedures, and
Checking valves, pumps, flanges, seals, pipe connection points for bulk tanker deliveries for leakage.
Staining that indicates discharge of contaminants into the stormwater system

Page 254 Doc # 11854602
Storage areas are another area that needs to be considered for contaminant generation. These can include:
Raw materials/supply stores
Dangerous goods stores
Finished goods stores
Other materials such as cleaning agents, detergents or weed killers.
Metal drums and vessels, or
Containers or bags. Bunded areas are areas where substantial quantities of chemicals are stored and have a protective bund around the storage area to capture chemicals in the event of a sudden rupture or leak releasing the chemicals. Bunds need to be sized appropriately (normally 110% of tanks storage volume) and routinely inspected and outlet valves tested with the inspection including the following:
Valves
Locks or other controls on valves
Stains or leaks inside and around the bunds
Crash barriers, and
Pipework across roofs to prevent leakage into the stormwater drainage system. Valves should be kept closed unless testing of stored liquids is undertaken to ensure no contaminant discharge prior to release of the liquids. Refuelling, vehicle maintenance and oil storage areas are also potential sources of contaminant generation and potential discharge to stormwater systems. Contamination potential can be reduced through the following activities:
Regularly cleaning around pumps, refuelling areas
Lubrication materials, vehicle maintenance and oil storage being checked and cleaned as needed
Checking and maintaining shut-off valves
A bunded refuelling tank

Doc # 11854602 Page 255
Routine maintenance of company vehicles to prevent leaks
Proper storage of waste oil and routine removal of the waste oil from the site, and
Radiator fluids disposed of as a trade waste. Finally, underground and above ground storage tanks need to be carefully considered for the following:
Tank labelling to show contents
Procedures for filling tanks to minimise risk of overfill, drips or spills
Inspection and maintenance of equipment, and
Volume indicators that can be checked to ensure there is no leakage. Above ground tanks are preferred over underground ones as it is best to see a problem when it arises. Underground tanks for chemical or contaminant storage should be avoided. Where their placement is necessary they should be double skin tanks and testing undertaken periodically to ensure that there is no leakage. All of these activities constitute source control on industrial sites. While they may provide significant reductions in contaminant generation, they will not normally be adequate for effective site control. There will normally be a need for a stormwater management treatment system as an overlay. The combination of source control in conjunction with implementation of stormwater quality treatment will provide the best outcome from a contaminant capture perspective.
Industries, contaminants and treatment devices The following table provides a detailed listing of industries, the contaminants that they generate, the likelihood that those contaminants will be released into the environment and the types of stormwater devices that can be used to reduce the level of a given contaminant from being discharged.
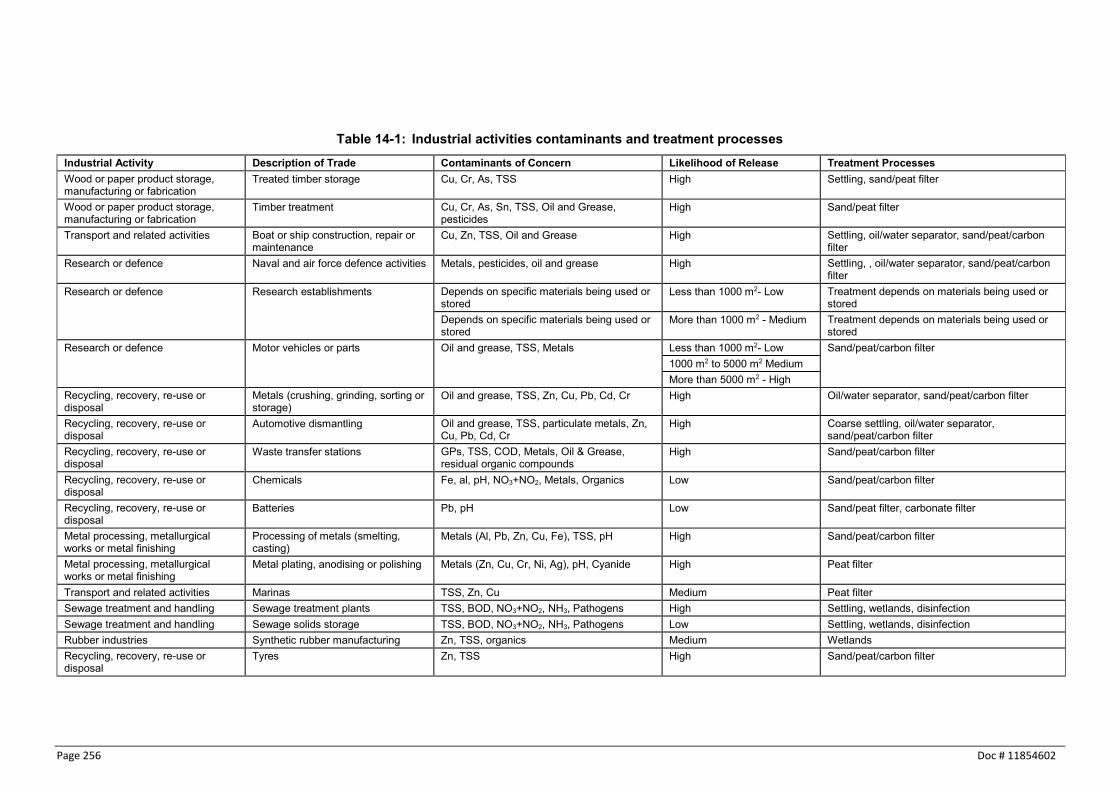
Page 256 Doc # 11854602
Table 14-1: Industrial activities contaminants and treatment processes Industrial Activity Description of Trade Contaminants of Concern Likelihood of Release Treatment Processes Wood or paper product storage, manufacturing or fabrication
Treated timber storage Cu, Cr, As, TSS High Settling, sand/peat filter
Wood or paper product storage, manufacturing or fabrication
Timber treatment Cu, Cr, As, Sn, TSS, Oil and Grease, pesticides
High Sand/peat filter
Transport and related activities Boat or ship construction, repair or maintenance
Cu, Zn, TSS, Oil and Grease High Settling, oil/water separator, sand/peat/carbon filter
Research or defence Naval and air force defence activities Metals, pesticides, oil and grease High Settling, , oil/water separator, sand/peat/carbon filter
Research or defence Research establishments Depends on specific materials being used or stored
Less than 1000 m2- Low Treatment depends on materials being used or stored
Depends on specific materials being used or stored
More than 1000 m2 - Medium Treatment depends on materials being used or stored
Research or defence Motor vehicles or parts Oil and grease, TSS, Metals Less than 1000 m2- Low Sand/peat/carbon filter 1000 m2 to 5000 m2 Medium More than 5000 m2 - High
Recycling, recovery, re-use or disposal
Metals (crushing, grinding, sorting or storage)
Oil and grease, TSS, Zn, Cu, Pb, Cd, Cr High Oil/water separator, sand/peat/carbon filter
Recycling, recovery, re-use or disposal
Automotive dismantling Oil and grease, TSS, particulate metals, Zn, Cu, Pb, Cd, Cr
High Coarse settling, oil/water separator, sand/peat/carbon filter
Recycling, recovery, re-use or disposal
Waste transfer stations GPs, TSS, COD, Metals, Oil & Grease, residual organic compounds
High Sand/peat/carbon filter
Recycling, recovery, re-use or disposal
Chemicals Fe, al, pH, NO3+NO2, Metals, Organics Low Sand/peat/carbon filter
Recycling, recovery, re-use or disposal
Batteries Pb, pH Low Sand/peat filter, carbonate filter
Metal processing, metallurgical works or metal finishing
Processing of metals (smelting, casting)
Metals (Al, Pb, Zn, Cu, Fe), TSS, pH High Sand/peat/carbon filter
Metal processing, metallurgical works or metal finishing
Metal plating, anodising or polishing Metals (Zn, Cu, Cr, Ni, Ag), pH, Cyanide High Peat filter
Transport and related activities Marinas TSS, Zn, Cu Medium Peat filter Sewage treatment and handling Sewage treatment plants TSS, BOD, NO3+NO2, NH3, Pathogens High Settling, wetlands, disinfection Sewage treatment and handling Sewage solids storage TSS, BOD, NO3+NO2, NH3, Pathogens Low Settling, wetlands, disinfection Rubber industries Synthetic rubber manufacturing Zn, TSS, organics Medium Wetlands Recycling, recovery, re-use or disposal
Tyres Zn, TSS High Sand/peat/carbon filter

Doc # 11854602 Page 257
Industrial Activity Description of Trade Contaminants of Concern Likelihood of Release Treatment Processes Recycling, recovery, re-use or disposal
Chemical containers cleaning, reconditioning or recycling
Metals, COD, NO3+ NO2 Medium GPT screen, coarse settling, oil/water separator, oxidation sand/peat/carbon filter
Recycling, recovery, re-use or disposal
Waste transfer stations GPs, TSS, COD, Metals, Oil & Grease, residual organic compounds
Medium GPT screen, coarse settling, oil/water separator, oxidation, sand/peat/carbon filter
Recycling, recovery, re-use or disposal
Non-metal recycling (composting, glass, paper or paper board
TSS, COD, NO3+ NO2, pathogens High Wetlands + oxidation
Recycling, recovery, re-use or disposal
Crushing, grinding or separation works (other than sand, gravel, rock or mineral - e.g. slag, road base, demolition material)
TSS, pH, Zn High Sand/peat filter, wetlands
Recycling, recovery, re-use or disposal
Landfills Metals, TSS, BOD, No3+NO2, NH3, organics High Coarse settling, oil/water separator, oxidation, sand/peat/carbon filter
Recycling, recovery, re-use or disposal
Chemicals Fe, Al, pH, No3+NO2, metals, organics Low Sand/peat/carbon filter
Recycling, recovery, re-use or disposal
Batteries Pb, pH Low Sand/peat filter, carbonate filter
Product storage or handling centres Bulk chemicals AL, Fe, Zn, No3+NO2 Medium Sand/peat/carbon filter Petroleum or coal product manufacturing
Coal products TSS, AL, Fe, pH Medium Settling, wetlands
Non-metallic mineral product manufacturing
Cement, lime, plaster and concrete products
TSS, Fe, pH, Oil and Grease High Settling, wetlands
Non-metallic mineral product manufacturing
Concrete batching plants (ready mixed concrete)
TSS (lime), pH High Settling, wetlands
Motor vehicle services facilities Mechanical servicing of motor vehicles
Oil and grease, metals High Sand/peat/carbon filter
Motor vehicle services facilities Service stations Oil and grease, PAH, BTEX, TSS High Oil/water separator, sand filter, oxidation Metal processing, metallurgical works or metal finishing
Refinement of ores TSS, metals Medium Settlement, wetland
Metal processing, metallurgical works or metal finishing
Metal blasting or coating (excluding spray painting)
Zn, other metals, TSS High Sand/peat filter
Electronics Circuit board manufacturing (excluding assembly only)
Metals (Zn, Cu, Cr, Ni), pH, organics High Sand/peat filter
Commercial livestock processing centres
Tanneries and Fellmongeries BOD, oil and grease, sulfides, Cr, N High Oil/water separator, oxidation, peat filter
Chemical and associated product manufacturing
Fungicides, herbicides, pesticides, timber preservatives and related products
COD, pH, As, Cu, Cr, Pesticides Medium Sand/peat/carbon filter
Chemical and associated product manufacturing
Batteries Pb, pH Medium Sand/peat filter, carbonate filter

Page 258 Doc # 11854602
Industrial Activity Description of Trade Contaminants of Concern Likelihood of Release Treatment Processes Chemical and associated product manufacturing
Paint, pigment, inks and dyes Al, Zn, Fe, COD, organics Medium Sand/peat/carbon filter
Chemical and associated product manufacturing
Acids, alkalis or heavy metals PH, TSS, metals Medium Sand/peat/carbon filter, carbonate filter
Transport and related activities Railway workshops or refuelling depots
Oil and grease, TSS, COD, Zn Medium Settlement, sand/peat filter
Transport and related activities Road freight transport depot (bulk chemical)
Oil and grease, TSS, COD, Zn, organics Medium Sand/peat/carbon filter, oxidation
Transport and related activities Truck refuelling facilities (non-service station)
TPH, PAH Medium Sand/peat filter
Transport and related activities Shipping container reconditioning Oil and grease, TSS, COD Medium Oil/water separator, Settlement Rubber industries Tyre manufacturing or retreading Zn, TSS, organics Medium Sand/peat filter Recycling, recovery, re-use or disposal
Oil, petroleum hydrocarbon wastes Oil and grease, PAH, BTEX Medium Oil/water separator, sand/carbon filter
Recycling, recovery, re-use or disposal
Sewage solids treatment or storage facilities
TSS, BOD, No3+NO2, Pathogen High Retention, oxidation
Recycling, recovery, re-use or disposal
Hazardous materials storage or treatment
TSS, COD, Metals, Oil and Grease, organics High Sand/peat/carbon filter
Product storage or handling centres Bulk hydrocarbons (non-service stations)
Oil and grease, PAH, BTEX Medium oil/water separator, sand/peat/carbon filter
Power Gas, coal or liquid power generation Oil and grease, Zn, TSS Medium oil/water separator, wetlands Power Electrical substations Oil and grease medium Sand filter Petroleum or coal product manufacturing
Bitumen/asphalt premix or hot mix TSS, Zn, TPH Medium oil/water separator, Sand/carbon filter
Animal feedstuffs Pet food manufacture BOD Medium Sand/peat filter, swales Agriculture support industries Inorganic fertiliser manufacture,
storage or handling COD, TSS, Pb, Fe, Zn, P Medium Sand/peat filter, high plant surface area and soil
organics Wood or paper product storage, manufacturing or fabrication
Log storage yards (outside of forested areas)
TSS, COD, NO3+NO2 High Wetlands
Chemical and associated product manufacturing
Synthetic resins TPH, pH, Zn Low Sand/peat filter
Chemical and associated product manufacturing
Solvents TPH Low Sand filter
Chemical and associated product manufacturing
Explosives and pyrotechnics Metals (Pb, Zn), VOC’s Never Low Sand/peat/carbon filter
Wood or paper product storage, manufacturing or fabrication
Particle board or other wood panel manufacturing
TSS, COD, NO3+NO2, oil and grease Medium GPT, Settling, sand filter

Doc # 11854602 Page 259
Industrial Activity Description of Trade Contaminants of Concern Likelihood of Release Treatment Processes Wood or paper product storage, manufacturing or fabrication
Pulp, paper or paper board manufacturing
TSS, COD, NO3+NO2, oil and grease, Zn Medium Wetlands, oil/water separator
Wood or paper product storage, manufacturing or fabrication
Plywood or veneer manufacturing TSS, COD, NO3+NO2, organics Medium Wetlands
Transport and related activities Shipping, loading/unloading Oil and grease, TSS, COD Medium Oil/water separator, sand/peat filter Transport and related activities heliports Oil and grease, TSS, COD Oil/water separator, sand/peat filter Transport and related activities Road freight transport depot (non-
chemical) with mechanical servicing Oil and grease, TSS, metals Never High Oil/water separator, sand/peat filter
Petroleum or coal product manufacturing
Petroleum refining Oil and grease, PAH, BTEX Medium Oil/water separator, sand/carbon filter
Petroleum or coal product manufacturing
Petroleum hydrocarbon, oil or grease manufacturing
Oil and grease, PAH, BTEX Never Low Oil/water separator, sand/carbon filter
Non-metallic mineral product manufacturing
Glass Oil and grease, BOD, TSS Medium Oil/water separator, sand/peat filter
Metal product manufacturing Sheet and structural metal products Fe, Al, Zn Medium Sand/peat filter Machinery or equipment manufacturing
Other machinery or equipment Oil and grease, Fe, Al, Zn Medium Sand/peat filter
Machinery or equipment manufacturing
Industrial machinery or equipment Oil and grease, Fe, Al, Zn Medium Sand/peat filter
Food or beverage manufacturing or handling
Vineyards or wine manufacturing BOD, TSS, oil and grease, N Medium Oil/water separator, high plant activity and surface area
Food or beverage manufacturing or handling
Processed dairy foods manufacturing
BOD, TSS, oil and grease, N Medium Oil/water separator, high plant activity and surface area
Food or beverage manufacturing or handling
Oil or fat product manufacturing or handling
BOD, TSS, oil and grease, N Medium Oil/water separator, high plant activity and surface area
Food or beverage manufacturing or handling
Meat and meat product manufacture (including fish)
BOD, TSS, oil and grease, N Medium Oil/water separator, high plant activity and surface area
Food or beverage manufacturing or handling
Processed dairy foods handling BOD, TSS, oil and grease, N Medium Oil/water separator, high plant activity and surface area
Food or beverage manufacturing or handling
Other foodstuffs handling BOD, TSS, oil and grease, N Medium Oil/water separator, high plant activity and surface area
Food or beverage manufacturing or handling
Meat product handling (including fish)
BOD, TSS, oil and grease, N Medium Oil/water separator, high plant activity and surface area
Food or beverage manufacturing or handling
Beverages or malt product handling BOD, TSS, oil and grease, N Medium Oil/water separator, high plant activity and surface area
Food or beverage manufacturing or handling
Bakery product handing BOD, TSS, oil and grease Medium Oil/water separator, high plant activity and surface area
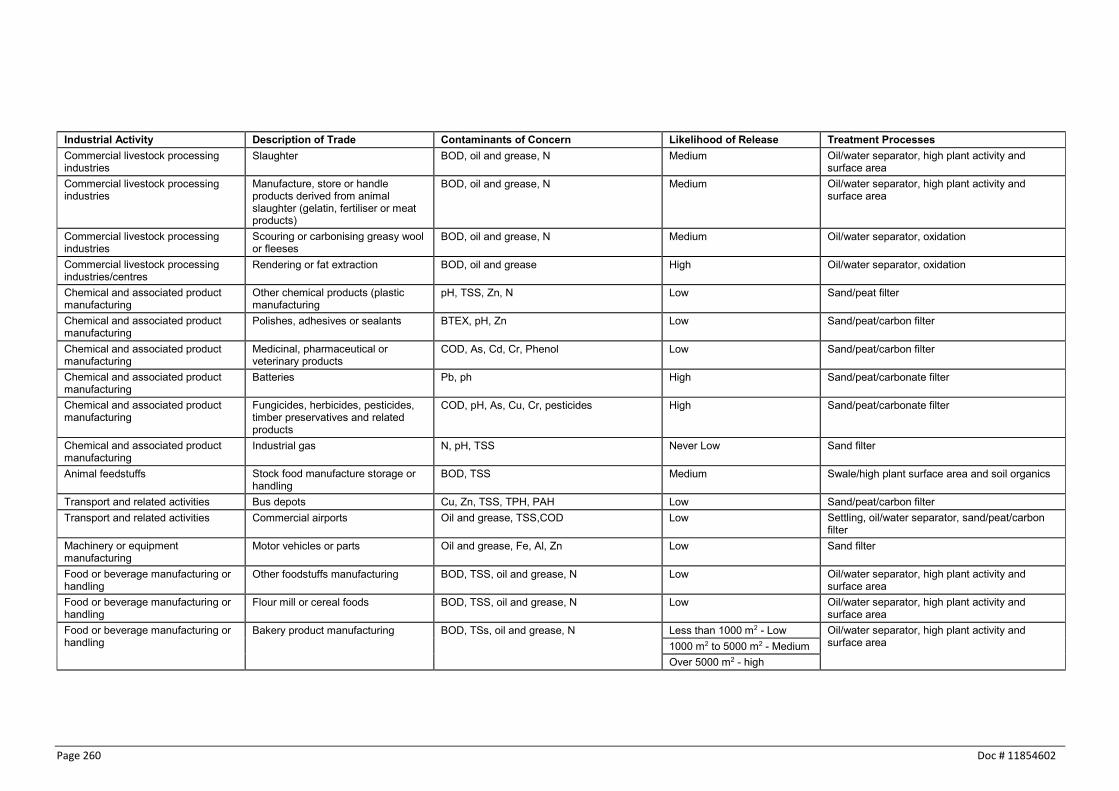
Page 260 Doc # 11854602
Industrial Activity Description of Trade Contaminants of Concern Likelihood of Release Treatment Processes Commercial livestock processing industries
Slaughter BOD, oil and grease, N Medium Oil/water separator, high plant activity and surface area
Commercial livestock processing industries
Manufacture, store or handle products derived from animal slaughter (gelatin, fertiliser or meat products)
BOD, oil and grease, N Medium Oil/water separator, high plant activity and surface area
Commercial livestock processing industries
Scouring or carbonising greasy wool or fleeses
BOD, oil and grease, N Medium Oil/water separator, oxidation
Commercial livestock processing industries/centres
Rendering or fat extraction BOD, oil and grease High Oil/water separator, oxidation
Chemical and associated product manufacturing
Other chemical products (plastic manufacturing
pH, TSS, Zn, N Low Sand/peat filter
Chemical and associated product manufacturing
Polishes, adhesives or sealants BTEX, pH, Zn Low Sand/peat/carbon filter
Chemical and associated product manufacturing
Medicinal, pharmaceutical or veterinary products
COD, As, Cd, Cr, Phenol Low Sand/peat/carbon filter
Chemical and associated product manufacturing
Batteries Pb, ph High Sand/peat/carbonate filter
Chemical and associated product manufacturing
Fungicides, herbicides, pesticides, timber preservatives and related products
COD, pH, As, Cu, Cr, pesticides High Sand/peat/carbonate filter
Chemical and associated product manufacturing
Industrial gas N, pH, TSS Never Low Sand filter
Animal feedstuffs Stock food manufacture storage or handling
BOD, TSS Medium Swale/high plant surface area and soil organics
Transport and related activities Bus depots Cu, Zn, TSS, TPH, PAH Low Sand/peat/carbon filter Transport and related activities Commercial airports Oil and grease, TSS,COD Low Settling, oil/water separator, sand/peat/carbon
filter Machinery or equipment manufacturing
Motor vehicles or parts Oil and grease, Fe, Al, Zn Low Sand filter
Food or beverage manufacturing or handling
Other foodstuffs manufacturing BOD, TSS, oil and grease, N Low Oil/water separator, high plant activity and surface area
Food or beverage manufacturing or handling
Flour mill or cereal foods BOD, TSS, oil and grease, N Low Oil/water separator, high plant activity and surface area
Food or beverage manufacturing or handling
Bakery product manufacturing BOD, TSs, oil and grease, N Less than 1000 m2 - Low Oil/water separator, high plant activity and surface area 1000 m2 to 5000 m2 - Medium
Over 5000 m2 - high

Doc # 11854602 Page 261
Industrial Activity Description of Trade Contaminants of Concern Likelihood of Release Treatment Processes Chemical and associated product manufacturing
Cosmetics, toiletry, soap and other detergents
Zn, N Never Low oil/water separator, oxidation, sand/peat filter
Printers Printing and publishing facilities Solvent, heavy metal, Cr, Pb, metals, fuel, spent solvents
Medium Oil/water separators, sand/peat filter
Spray painting facilities Surface coating of materials using a spray atomising system
Pigment, resins, solvents, thinners, other plastics components
High Use of a spray booth with filters Sand/peat filter
Truck wash facilities Washing vehicles TSS, oils and grease, COD High Sedimentation followed by oil/water separation followed by a sand/peat filter
Textile fibre and textile processing industries where dying and washing of fabric occurs
The entire process of manufacturing materials from raw materials
TSS, pH, oil and grease, COD, heavy metals High Sedimentation, oil/water separation, wetlands
Footwear manufacture Manufacture of footwear Chlorinated phenols, tribromphenol, chlorinated paraffins, dyes, adhesives, pH, chromium, plasticisers
Medium Oil/water separators, wetlands
Stock saleyards Commercial conduct of yards where cattle, sheep or other animals are sold
BOD, sediment, nutrients, metals High Wastewater lagoon, wetlands
Car wash and valet services Washing and cleaning vehicles TSS, oils and grease, COD High Sedimentation followed by oil/water separation followed by a sand/peat filter
Commercial laundries (excluding self-service laundrettes and laundromats)
Providing laundered clothing and other items to industrial or commercial users
Waste oil, recovered solvents, vehicle maintenance waste, lint, plastic bags
Medium Oil/water separation, sand filter
Agricultural support industries Other chemical products (e.g. plastic manufacturing
Solvents, Plasticisers, Paint, Resins, Scrap plastic. Fuels Miscellaneous chemicals
Less than 1000 m2 - Low Minimise exposure Sand/peat/carbon filter Oil/water separator
1000 m2 to 5000 m2 - Medium Over 5000 m2 - high
NOTE: BTEX is an acronym standing for benzene, Toluene, ethylbenzene, xylenes that are volatile organic compounds (VOCs) found in petroleum products Carbon filters are effective at removing sediment and VOCs

Page 262 Doc # 11854602
There may be variations to each of the categories listed in Table 14-1. Table 10-12 below provides a summary of the contaminant removal mechanisms for a range of contaminants.
Table 14-2: Summary of contaminant removal mechanisms Mechanism Contaminants affected Removal promoted by Physical sedimentation Solids, BOD, pathogens,
particulate COD, P, N, metals, synthetic organics
Low turbulence
Filtration Same as sedimentation Fine, dense herbaceous plants, constructed filters
Soil incorporation All Medium-fine texture Chemical precipitation Dissolved P, metals High alkalinity Adsorption Dissolved P, metals, synthetic
organics High soil Al, Fe, high soil organics, neutral pH
Ion exchange Dissolved metals High soil cation exchange capacity
Oxidation COD, petroleum hydrocarbons, synthetic organics
Aerobic conditions
Photolysis Same as oxidation High light Volatilisation Volatile petroleum
hydrocarbons and synthetic organics
High temperature and air movement
Biological microbial decomposition
BOD, COD, petroleum hydrocarbons, synthetic organics
High plant surface area and soil organics
Plant uptake and metabolism P, N, metals High plant activity and surface area
Natural die-off Pathogens Plant excretions Nitrification NH3-N Dissolved oxygen>2mg/l, low
toxicants, temperature>5-7oC, neutral pH
Denitrification NO3+NO2-N Anaerobic, low toxicants, temperature>15oC
Stormwater management devices Stormwater discharges from industrial sites must be managed in accordance with the design criteria provided in Section 7.4 and must be supported by Pollution Control Plans157 and / or Operations and Maintenance Plans where applicable. A brief discussion is provided below about the stormwater management devices and their appropriateness in providing water quality and quantity management for industrial sites. The design of these devices is detailed in Section 8. Most of these devices are appropriate for managing stormwater runoff from industrial sites. However, the use of infiltration devices as a water quality treatment device is not encouraged on industrial sites. The ground is itself a receiving system and contaminants may migrate to groundwater and be discharged into another receiving system (stream, estuary, harbour, open coast, lake). In all cases where stormwater runoff is anticipated, treatment should be provided prior to discharge to prevent migration of contaminants to the receiving environment.
157 Pollution Control Plans are generally a requirement of bylaws pertaining to Stormwater and Tradewaste.

Doc # 11854602 Page 263
The following discussion relates to a number of devices in this guideline. A practice not included is green roofs as they are not normally used for site treatment of industrial sites.
14.4.1 Stormwater management ponds
Water quantity function
Stormwater management ponds are effective at controlled release of stormwater flows related to extended detention for stream erosion protection, intermediate storm control and can also be designed to provide a controlled release for extreme storm events.
Water quality function processes
The primary contaminant removal mechanism of all pond systems is settling or sedimentation. They can be effective at removal of suspended solids (50% – 90%) and have lesser effectiveness for removal of metals, whose removal is primarily through attachment to sediments that may be captured in ponds. One pond component that should be considered is the use of the reverse slope outlet for the capture of hydrocarbons that would otherwise go through surface withdrawal outlets. Water has a specific gravity of 1 and Oil has a specific gravity of 0.9, diesel has a specific gravity of 0.85, kerosene of 0.79 and gasoline has a specific gravity of 0.75. These values show that hydrocarbons will rise to the surface of the stormwater where they will be trapped and allow volatilization to occur. For information about specific industries’ contaminants of concern, refer to Table 14-1. If a particular industry lists oil and grease as a contaminant of concern they have to provide treatment for hydrocarbons. Treatment strategies should be based on site processes as to what contaminants will be of concern. If they are using a pond or wetland they would have to use a submerged outlet pipe to enhance hydrocarbon removal. A design consideration when hydrocarbons are a stormwater concern is the potential for emulsification to occur when turbulence is not reduced when traveling through the pond device. The turbulence of stormwater flows can cause the mixing of oil and water and a reduced capture of the hydrocarbons prior to downstream release. It is essential in designing for hydrocarbon capture that the horizontal flow of stormwater through the pond should be less than 15 times the rise velocity. The rise velocity is the following:
𝑉𝑟 = 𝑔𝑑2(1 − 𝑠)
18𝑣⁄
Where: Vr = rise velocity (m/s) g = acceleration due to gravity (9.8 m/s2) d = diameter of the oil droplet (m) = 0.00006 s = specific gravity for the oil droplet (as stated above) v = kinematic viscosity of water (m2/s) = 0.00000138

Page 264 Doc # 11854602
By calculating the rise velocity, the maximum horizontal velocity through the pond can be calculated to determine if hydrocarbon capture is maximised. The slower the horizontal velocity the greater the percentage of hydrocarbons that are captured.
14.4.2 Constructed wetlands
Water quantity function
Wetlands, identically to ponds, are effective at controlled release of stormwater flows related to extended detention for stream erosion protection and intermediate storm control. Wetlands can also be designed to provide a controlled release for extreme storm events. Water quality function processes
Wetlands can provide the same sedimentation benefits of deeper ponds but they also provide additional treatment through mechanisms that do not exist in deeper ponds. Those mechanisms include the following:
Biological degradation, sedimentation, microbial uptake of organic material.
Adsorption, volatilisation, photosynthesis, and biotic/abiotic degradation of organic contaminants.
Sedimentation, filtration of suspended solids.
Sedimentation, nitrification/denitrification, microbial uptake, plant uptake, volatilisation for nitrogen removal.
Sedimentation, filtration, adsorption, plant and microbial uptake for phosphorus removal.
Natural die-off, sedimentation, filtration, predation, UV degradation, adsorption for pathogens, and
Sedimentation, adsorption, plant uptake for heavy metal reduction.
The accumulation of organic matter from dead plant material also promotes contaminant removal. High-density wetland vegetation is likely to achieve higher treatment efficiency than lower density because the larger surface contact area supports more microorganisms that mediate contaminant removal processes.
14.4.3 Sand and sand/peat filters
Water quantity function
Sand filters are water quality treatment devices and generally provide little control of stormwater quantity. They can be adapted for larger flow control by increasing live storage. Basic water quality function processes
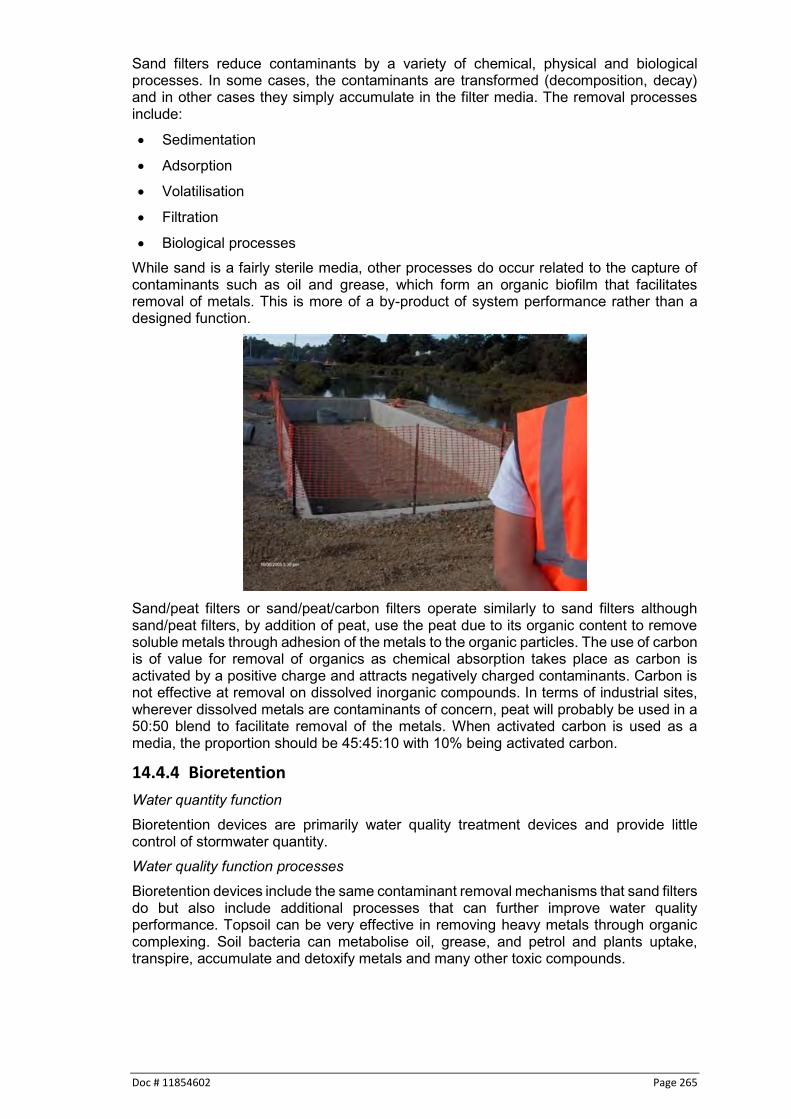
Doc # 11854602 Page 265
Sand filters reduce contaminants by a variety of chemical, physical and biological processes. In some cases, the contaminants are transformed (decomposition, decay) and in other cases they simply accumulate in the filter media. The removal processes include:
Sedimentation
Adsorption
Volatilisation
Filtration
Biological processes While sand is a fairly sterile media, other processes do occur related to the capture of contaminants such as oil and grease, which form an organic biofilm that facilitates removal of metals. This is more of a by-product of system performance rather than a designed function.
Sand/peat filters or sand/peat/carbon filters operate similarly to sand filters although sand/peat filters, by addition of peat, use the peat due to its organic content to remove soluble metals through adhesion of the metals to the organic particles. The use of carbon is of value for removal of organics as chemical absorption takes place as carbon is activated by a positive charge and attracts negatively charged contaminants. Carbon is not effective at removal on dissolved inorganic compounds. In terms of industrial sites, wherever dissolved metals are contaminants of concern, peat will probably be used in a 50:50 blend to facilitate removal of the metals. When activated carbon is used as a media, the proportion should be 45:45:10 with 10% being activated carbon.
14.4.4 Bioretention
Water quantity function
Bioretention devices are primarily water quality treatment devices and provide little control of stormwater quantity. Water quality function processes
Bioretention devices include the same contaminant removal mechanisms that sand filters do but also include additional processes that can further improve water quality performance. Topsoil can be very effective in removing heavy metals through organic complexing. Soil bacteria can metabolise oil, grease, and petrol and plants uptake, transpire, accumulate and detoxify metals and many other toxic compounds.
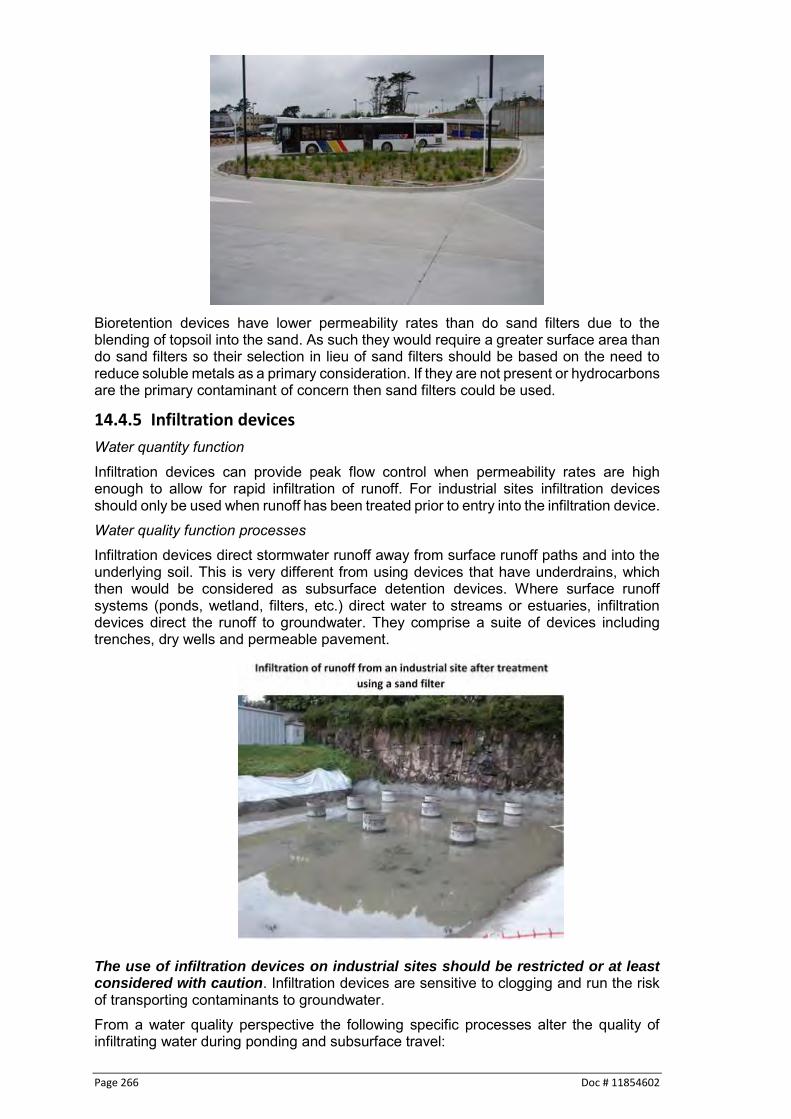
Page 266 Doc # 11854602
Bioretention devices have lower permeability rates than do sand filters due to the blending of topsoil into the sand. As such they would require a greater surface area than do sand filters so their selection in lieu of sand filters should be based on the need to reduce soluble metals as a primary consideration. If they are not present or hydrocarbons are the primary contaminant of concern then sand filters could be used.
14.4.5 Infiltration devices
Water quantity function
Infiltration devices can provide peak flow control when permeability rates are high enough to allow for rapid infiltration of runoff. For industrial sites infiltration devices should only be used when runoff has been treated prior to entry into the infiltration device. Water quality function processes
Infiltration devices direct stormwater runoff away from surface runoff paths and into the underlying soil. This is very different from using devices that have underdrains, which then would be considered as subsurface detention devices. Where surface runoff systems (ponds, wetland, filters, etc.) direct water to streams or estuaries, infiltration devices direct the runoff to groundwater. They comprise a suite of devices including trenches, dry wells and permeable pavement.
The use of infiltration devices on industrial sites should be restricted or at least considered with caution. Infiltration devices are sensitive to clogging and run the risk of transporting contaminants to groundwater. From a water quality perspective the following specific processes alter the quality of infiltrating water during ponding and subsurface travel:

Doc # 11854602 Page 267
Filtration
Adsorption
Biodegradation
Growth of micro-organisms
Chemical oxidation and reduction
Chemical precipitation and dilution
Volatilisation
Photochemical reactions Soils vary in their ability to filter and adsorb and a greater discussion of their processes is probably beyond what is needed here.
14.4.6 Swales and filter strips
Water quantity function
Swales and filter strips are water quality devices and have negligible capability for storage of stormwater flows. They are water quality treatment devices although with some modification through subsurface storage and discharge they could provide storage to achieve retention of the initial abstraction or possibly extended detention. Water quality function processes
Contaminant removal depends on the residence time of water through the swale or filter strip and the depth of water relative to the height of vegetation. Good contact with vegetation and soil is required to promote the operation of the various mechanisms that capture and transform contaminants, so spreading flow in minimal depth over a wide area is best.
The passage of stormwater through vegetated swales and filter strips utilises a number of physical, chemical and biological processes to remove stormwater contaminants. Those factors include the following:
Reduction of flow speed by vegetation to improve settlement
Filtration by dense vegetation
The rough nature of the soil/vegetation interface which improves retention of settled material and reduces resuspension
Some infiltration of runoff depending on soil conditions
Contact between stormwater contaminant and the abundant organic matter in swales which can result in adsorption
Existence of micro-organisms which degrade organic contaminants
Uptake of contaminants by plants

Page 268 Doc # 11854602
Although Section 8 recommends a flow residence time of 9 minutes, significant water quality benefits can be gained by smaller residence times. Metals reductions can be significant even with shorter residence times although TSS reductions will be somewhat less.
14.4.7 Oil and water separators
Water quantity function
Oil and water separators are water quality treatment devices only. Basic water quality function processes
Oil and water separators are applicable to treat stormwater runoff from areas where hydrocarbon products are handled or where small spills routinely fall on paved surfaces exposed to rain. They are not usually applicable for general urban runoff, because by the time the oil reaches the device it has emulsified or coated sediment in the runoff and is too difficult to separate. Oil and water separators have significant benefits for spill containment. Spills enter the separator and mix with the water. Then the oil in the spill will rise to the surface. All separators should hold the 2,500 litres of oil that is the industry standard. Grease and oil will be present as oil droplets of different sizes or as a surface slick.
Oil products have a specific gravity that is lighter than water. The actual specific gravity depends on water temperature and the density of the oil. Oil and water separators use the fact that oil entering the separator will rise to the surface of the water and be prevented from exiting by the presence of baffles. The use of oil specific gravity of 0.9 is considered appropriate for general use as diesel has a specific gravity of 0.85, kerosene of 0.79 and gasoline has a specific gravity of 0.77.
14.4.8 Oxidation
While not discussed as a device in these guidelines, oxidation is mentioned as a treatment practice for some industrial contaminants. Oxidation is the interaction between oxygen molecules and all of the various substances that they interact with. It involves the loss of at least one electron when two or more substances interact. From an industrial contaminant perspective, oxidation is the
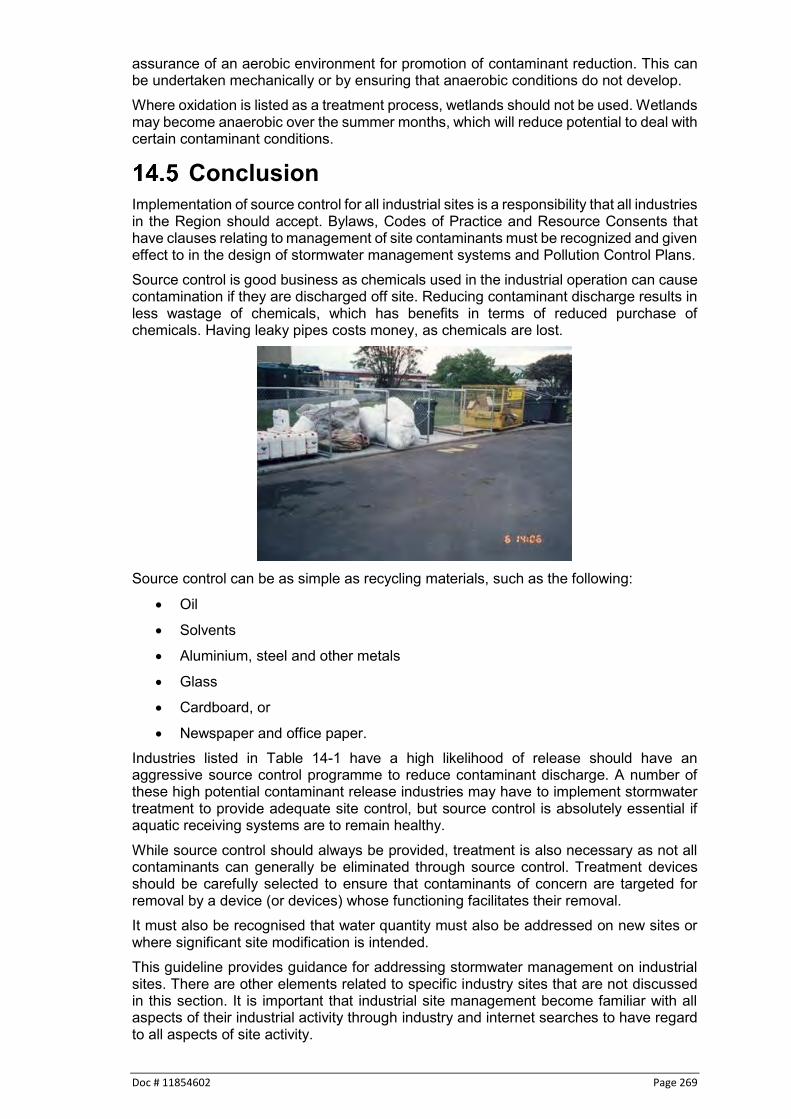
Doc # 11854602 Page 269
assurance of an aerobic environment for promotion of contaminant reduction. This can be undertaken mechanically or by ensuring that anaerobic conditions do not develop. Where oxidation is listed as a treatment process, wetlands should not be used. Wetlands may become anaerobic over the summer months, which will reduce potential to deal with certain contaminant conditions.
Conclusion Implementation of source control for all industrial sites is a responsibility that all industries in the Region should accept. Bylaws, Codes of Practice and Resource Consents that have clauses relating to management of site contaminants must be recognized and given effect to in the design of stormwater management systems and Pollution Control Plans. Source control is good business as chemicals used in the industrial operation can cause contamination if they are discharged off site. Reducing contaminant discharge results in less wastage of chemicals, which has benefits in terms of reduced purchase of chemicals. Having leaky pipes costs money, as chemicals are lost.
Source control can be as simple as recycling materials, such as the following:
Oil
Solvents
Aluminium, steel and other metals
Glass
Cardboard, or
Newspaper and office paper. Industries listed in Table 14-1 have a high likelihood of release should have an aggressive source control programme to reduce contaminant discharge. A number of these high potential contaminant release industries may have to implement stormwater treatment to provide adequate site control, but source control is absolutely essential if aquatic receiving systems are to remain healthy. While source control should always be provided, treatment is also necessary as not all contaminants can generally be eliminated through source control. Treatment devices should be carefully selected to ensure that contaminants of concern are targeted for removal by a device (or devices) whose functioning facilitates their removal. It must also be recognised that water quantity must also be addressed on new sites or where significant site modification is intended. This guideline provides guidance for addressing stormwater management on industrial sites. There are other elements related to specific industry sites that are not discussed in this section. It is important that industrial site management become familiar with all aspects of their industrial activity through industry and internet searches to have regard to all aspects of site activity.

Page 270 Doc # 11854602

Doc # 11854602 Page 271
15 Rural residential development Much of the background information in this section has come from ‘The Countryside Living Toolbox’158 a document that was prepared for several local councils in the Auckland Region.
Introduction There is a recurring theme to urban intensification into rural areas. Initially, development occurs on large lots that have individual water supply and wastewater treatment. As further intensification occurs, these rural lots are subdivided into smaller lots and the smaller lots increase pressure on local councils to provide water supply and wastewater treatment. Once those infrastructures are in place, further intensification can be expected. This guidance addresses stormwater management concerns for the initial rural residential development, be it an individual home or a small rural subdivision. It is specifically targeted for rural residential development that is most often a permitted activity. The Regional Plan provides for permitted activities subject to the following conditions:
a) There shall be no adverse effect on water quality of the receiving water body. b) Any adverse erosion effects occurring as a result of the discharge to be remedied
as soon as practicable. c) There shall be no adverse effects from increased water levels downstream of the
discharge point. d) The Waikato Regional Council shall be notified in writing of the discharge, its
volume, contaminant concentrations and the water quality of the receiving water body 10 working days prior to the discharge commencing.
This section provides guidance on how rural residential development can comply with the permitted activity requirements.
Key objectives The primary objective of the rural residential guidance is to outline and demonstrate the minimum acceptable approach for stormwater management in rural residential areas in the Waikato Region. It provides a variety of approaches ranging from using natural vegetation to mitigate effects, to the use of structural stormwater management devices. The goals of the guidance are:
1. To minimise changes to the hydrological regime in order to protect the physical structure of streams and also to reduce potential downstream flooding; and
2. To reduce sediment discharges resulting from increased stream channel erosion and small scale rural development.
General principles Stormwater management needs to be considered during the earliest stages of site design. The way a site or subdivision is laid out can directly affect the volume and quality of stormwater which is discharged from the site. There are a number of general principles which apply to site design and preventing stormwater effects159. Changes to the hydrological regime should be minimized.
158 Rodney District Council and Waitakere City Council 2009 159 URS, 2005

Page 272 Doc # 11854602
Piped stormwater discharges should be set back from streams and incorporate erosion protection to prevent localized scour and erosion.
Dispersed discharges are preferred over concentrated flow discharges.
Site disturbance should be minimized and natural features/ vegetation protected.
Sediment control should be utilized during the construction phase.
Impervious areas should be limited to the greatest extent possible.
Appropriate stormwater management devices should be used to attenuate flows and provide water quality treatment.
Effective stormwater management includes the implementation of both structural controls (i.e. stormwater devices) and non-structural controls (such as site design).
Source, flowpaths and receiving environments Recognising that stormwater issues may not be well understood by an individual rural residential property owner or developer, it is important to understand the process of runoff movement through a property to a receiving environment. This process depends on three levels of consideration:
Source,
Pathway, and
Receiving environment.
15.4.1 Source
In this context, source essentially means the impervious areas created by development itself, specifically the roofs, driveways, local roads and parking areas. For rural residential development, roofs will generally go to water tanks, driveways should disperse downslope and local roading will have swales or filter strips. Swales and filter strips function as pathways for the stormwater to travel from the source to the receiving environment. The main issues related to source are the level of imperviousness and the potential contaminant load coming from those surfaces. Reducing the source therefore reduces the effects of impervious surfaces. One of the aims of this section is to recommend measures which will reduce and disconnect impervious areas.
15.4.2 Pathway
The pathway is the route taken by stormwater runoff from the source to the receiving environment. The pathway can include:
Overland dispersed flow across vegetation,
Flow via a vegetated swale,
Surface flow in a ditch, or
Flow in a concrete channel or reticulation system The pathway is important from two different contexts:
A means of delivery of stormwater runoff to a receiving environment, and
The stability and design of the pathway itself. As a means of delivery, the pathway can, depending on its composition, convey water very quickly to a receiving system or, by following natural drainage paths, deliver the stormwater to the receiving system at a more natural rate, resulting in fewer adverse impacts. The following two tables provide information on stormwater conveyance. The first table, Table 15-1 provides information on Mannings roughness coefficients, which

Doc # 11854602 Page 273
in turn relate to flow velocities. The higher the Mannings coefficient, the lower the velocity.
Table 15-1: Recommended design values of Manning’s roughness coefficients160 Channel condition Mannings n range
Unlined open channels Earth, uniform section Clean, after weathering 0.018-0.02 In graveled soil, uniform section, clean 0.022-0.025 Earth, fairly uniform section No vegetation 0.022-0.025 Sides clean, cobble bottom 0.030-0.040 Rock Smooth and uniform 0.035-0.040 Jagged and irregular 0.040-0.045 Channels not maintained, weeds and brush uncut
Dense weeds, high as flow depth 0.08-0.12 Clean bottom, brush on sides 0.05-0.08 Roadside channels and swales with maintained vegetation
Depth of flow up to 210 mm Good stand, any grass Length about 300 mm 0.09-0.18 Length about 600 mm 0.15-0.30 Depth of flow 210mm-450mm Good stand, any grass Length about 300 mm 0.07-0.12 Length about 600 mm 0.10-0.20 Natural stream channels Minor streams Fairly regular section Some grass and weeds, little or no brush 0.030-0.035 Some weed, heavy brush on banks 0.05-0.07 Irregular section, with pools, slight channel meander; increase two above values by
0.01-0.02
Mountain streams, no vegetation in channel, banks usually steep
Bottom of gravel, cobbles and a few boulders 0.04-0.05 Bottom of cobbles, with large boulders 0.05-0.07
160 McCuen, 1998

Page 274 Doc # 11854602
Table 12-2 relates the type of channel material with permissible velocities to ensure that channel erosion is kept to a minimum. Table 15-2: Maximum permissible velocities for unlined channels161
Material Mean velocity (m/s) Fine sand, colloidal 0.4 Sandy loam, noncolloidal 0.5 Silt loam, noncolloidal 0.6 Alluvial silts, noncolloidal 0.6 Ordinary firm loam 0.8 Volcanic ash 0.8 Stiff clay, very colloidal 1.1 Alluvial silts, colloidal 1.1 Shales and hardpans 1.8 Fine gravel 0.8 Graded loam to cobbles, noncolloidal 1.1 Graded silts to cobbles, colloidal 1.2 Coarse gravel, noncolloidal 1.2 Cobbles and shingles 1.5
The combination of the two tables helps to answer questions related to the following issues:
Is the stormwater pathway adequate in terms of stability for stormwater drainage to enter it with minimal impact, and
Would the pathway provide mitigation for stormwater runoff quantity and quality? The answer to the first question can be resolved through consideration of the pathways for runoff from a specific development. The answer to the second one is slightly more complicated and requires some discussion. As adverse effects of stormwater are cumulative, a key question relating to pathways will relate to the following:
The erosional potential of the pathway, and
The expected contaminant load
The erosion potential of the pathway
If the stormwater discharge goes to a high-energy receiving environment or natural features of the pathway provide stormwater treatment and water quality concerns are not an issue, the stability of the pathway will determine whether stormwater management would be recommended for a project. If the pathway is a stable system and can accommodate the additional flow of a new project then stormwater management for pathway protection is not required.
The expected contaminant load
A key element with respect to water quality treatment will depend on the pathway. If the pathway is a densely vegetated system that can provide water quality treatment, that treatment may substitute for downstream stormwater quality treatment on a given project. Drainage systems in rural areas that are not kerbed and rely on passage of stormwater through swales or filter strips will have water quality treatment benefits that may substitute for more formal treatment systems. Having organic matter and vegetation can provide significant water quality benefits and the potential value of using those systems should be incorporated into design and operation.
161 Auckland Regional Council, 2003

Doc # 11854602 Page 275
15.4.3 Receiving environment
Whether a particular receiving environment is at risk is determined by a consideration of the overall risk from the source-pathway-receptor combination Types of receiving environments include:
Streams
Floodplains
Wetlands
Ground
Karst areas
Estuaries
Harbours
Open coasts
Lakes
Geothermal areas Stormwater issues related to receiving environments are detailed in Table 4-3 provided earlier in this guideline. In addition, a key issue relating to all receiving environments is the provision of outfall erosion protection in order to ensure scour at the point of discharge is minimised. Any item in the table that is identified with either a high or moderate priority must be addressed in design and implementation. Low priority items should be discussed with Waikato Regional Council to determine if that item needs consideration during design. An example of the consideration of source, pathway and receiving environment is shown in Figure 15-1.
Figure 15-1: Example of a small rural residential development162
162 Adapted from Figure 5-3 in Countryside Living Methods (Version 3), 2005

Page 276 Doc # 11854602
Consideration of source, pathway and receiving environment will therefore assist in determining the stormwater management design objectives.
Hydrology Hydrologic analysis is broken into two parts:
An individual residence constructed in a rural area, or
A rural residential subdivision.
15.5.1 An individual residence
If an individual residence is constructed in a rural zone, stormwater management requirements can be met through a series of devices that eliminate the need for a more detailed analysis. Those devices include:
Capture of roof runoff in a water tank that is used for domestic water supply. The overflow from the tank shall be discharged into an infiltration soakage pit (refer to Section 8.5.5) or a bioretention device (Section 8.5.4).
Runoff from driveways, access roads shall be accounted for either through soakage (Section 8.5.5), bioretention (Section 8.5.4) or bush revegetation according to Section 8.5.9.
If there is significant earthworking proposed to facilitate construction, those disturbed areas of the site should be rehabilitated according to Section 8.5.11.
15.5.2 Rural residential subdivision
Hydrologic analysis shall be undertaken according to the Waikato Stormwater Runoff Modelling Guideline. The same requirements as required in Section 7.4 shall be designed for on these developments. This includes retention of the initial abstraction of water before runoff begins.
15.5.3 Device capability to detain flows
There are two potential detention requirements for rural residential subdivisions:
Detention for peak flow control, and
Extended detention for downstream erosion protection.
Detention for peak flow control
Rural development normally does not involve mass grading of an entire development site. This ensures that the runoff from pervious areas is essentially unchanged from the predevelopment condition. As such, stormwater management devices should only be designed and constructed for those specific areas that need management. Certain devices can provide control of the differences in the 2 and 10-year ARI events by providing storage within the device. Devices that can provide volume control of the difference in peak discharges for the 2 and 10-year ARI events are the following:
Swales with underdrains and check dams
Bioretention
Infiltration trenches
Water tanks
Revegetation, and
Green roofs. The discussion on extended detention control by providing the water quality volume (or 1.2 times the water quality volume if there is downstream channel instability) for design also provides for control of the volume increases for the 2 and 10-year ARI events if designed correctly. The combination of live storage on the device and void ratios in the
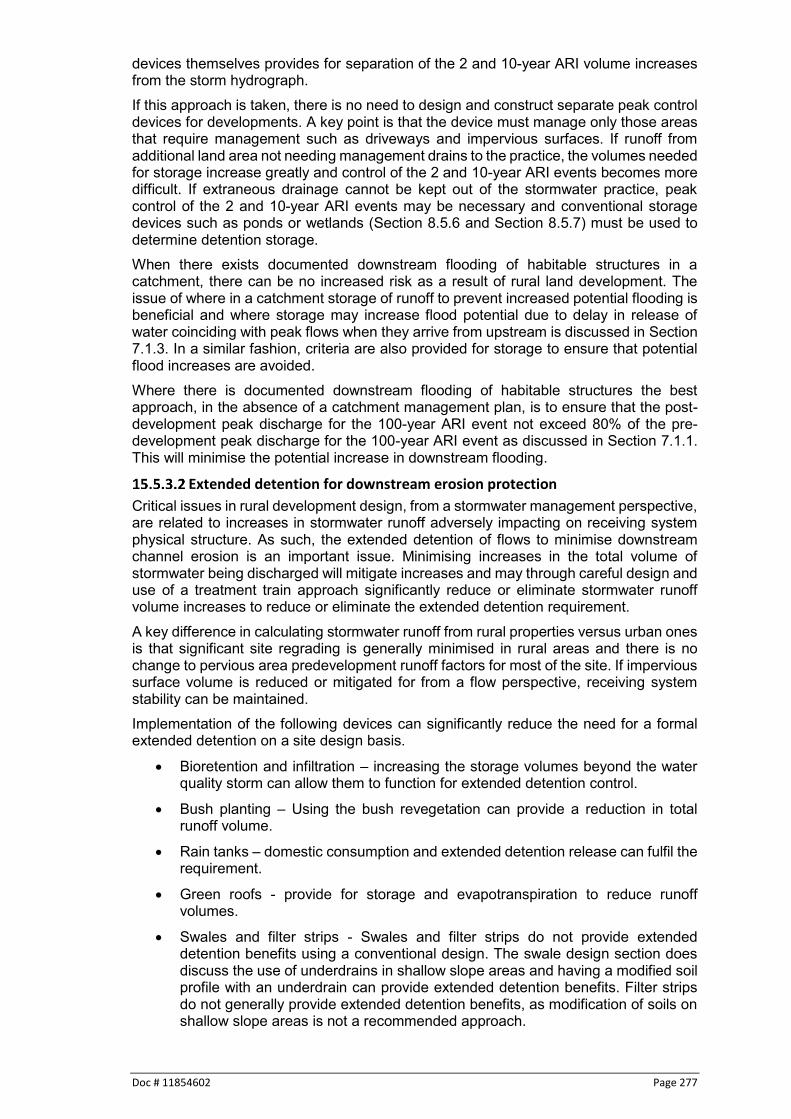
Doc # 11854602 Page 277
devices themselves provides for separation of the 2 and 10-year ARI volume increases from the storm hydrograph. If this approach is taken, there is no need to design and construct separate peak control devices for developments. A key point is that the device must manage only those areas that require management such as driveways and impervious surfaces. If runoff from additional land area not needing management drains to the practice, the volumes needed for storage increase greatly and control of the 2 and 10-year ARI events becomes more difficult. If extraneous drainage cannot be kept out of the stormwater practice, peak control of the 2 and 10-year ARI events may be necessary and conventional storage devices such as ponds or wetlands (Section 8.5.6 and Section 8.5.7) must be used to determine detention storage. When there exists documented downstream flooding of habitable structures in a catchment, there can be no increased risk as a result of rural land development. The issue of where in a catchment storage of runoff to prevent increased potential flooding is beneficial and where storage may increase flood potential due to delay in release of water coinciding with peak flows when they arrive from upstream is discussed in Section 7.1.3. In a similar fashion, criteria are also provided for storage to ensure that potential flood increases are avoided. Where there is documented downstream flooding of habitable structures the best approach, in the absence of a catchment management plan, is to ensure that the post-development peak discharge for the 100-year ARI event not exceed 80% of the pre-development peak discharge for the 100-year ARI event as discussed in Section 7.1.1. This will minimise the potential increase in downstream flooding.
Extended detention for downstream erosion protection
Critical issues in rural development design, from a stormwater management perspective, are related to increases in stormwater runoff adversely impacting on receiving system physical structure. As such, the extended detention of flows to minimise downstream channel erosion is an important issue. Minimising increases in the total volume of stormwater being discharged will mitigate increases and may through careful design and use of a treatment train approach significantly reduce or eliminate stormwater runoff volume increases to reduce or eliminate the extended detention requirement. A key difference in calculating stormwater runoff from rural properties versus urban ones is that significant site regrading is generally minimised in rural areas and there is no change to pervious area predevelopment runoff factors for most of the site. If impervious surface volume is reduced or mitigated for from a flow perspective, receiving system stability can be maintained. Implementation of the following devices can significantly reduce the need for a formal extended detention on a site design basis.
Bioretention and infiltration – increasing the storage volumes beyond the water quality storm can allow them to function for extended detention control.
Bush planting – Using the bush revegetation can provide a reduction in total runoff volume.
Rain tanks – domestic consumption and extended detention release can fulfil the requirement.
Green roofs - provide for storage and evapotranspiration to reduce runoff volumes.
Swales and filter strips - Swales and filter strips do not provide extended detention benefits using a conventional design. The swale design section does discuss the use of underdrains in shallow slope areas and having a modified soil profile with an underdrain can provide extended detention benefits. Filter strips do not generally provide extended detention benefits, as modification of soils on shallow slope areas is not a recommended approach.

Page 278 Doc # 11854602
Wetland swales - In a similar manner as swales and filter strips, wetland swales do not provide extended detention. Having a series of check dams can provide for extended detention if designed specifically to provide that function.
Ponds and wetlands - Ponds and wetlands can easily be modified to provide for extended detention. There may be situations where an existing pond can be modified to provide for additional storage either by lowering the normal pool level or modifying the embankment or outlet structure.
Stormwater management device design The stormwater management devices have design have design criteria specified in Section 8.5. Of particular applicability on rural residential sites the following are emphasised:
Swales (Section 8.5.1)
Filter strips (Section 8.5.2)
Bioretention Section 8.5.4)
Infiltration trenches and soakage pits (Section 8.5.5)
Wetland swales (Section 8.5.7)
Water tanks (Section 8.5.10)
Bush revegetation (Section 8.5.9), and
Green roofs (Section 8.5.8).

Doc # 11854602 Page 279
16 Waikato Regional Council administered drainage areas Much of the background information included in this section is from Waikato Regional Council’s report ‘Managing land use change and Council’s administered drainage areas’163.
Introduction There are significant areas in the Waikato Region that are very flat and getting water off the land and into a positive outfall are difficult. As a result rural drainage channels have been constructed to provide land drainage for agricultural purposes, to lower localised water tables and to reduce flooding potential. Many of these drainage systems have been formalised to constitute land drainage areas. Waikato Regional Council is responsible for administering many of these drainage systems. At the present time it is responsible for managing and maintaining drainage networks within 92 separate areas in the region. Four drainage advisor subcommittees have been established to oversee the management of the drainage areas; Aka Aka/Otaua, Franklin Waikato, Waikato Central and Thames Valley. Figure 16-1 shows where these drainage areas are within the region. In addition, six territorial authorities also manage drainage systems that are not managed by Waikato Regional Council. The territorial administered drainage areas are shown on Figure 16-1. These systems have been established to serve rural land use with a primary emphasis on ensuring land productivity and accessibility.
163 Wood M, 2014

Page 280 Doc # 11854602
Figure 16-1: Waikato Regional Council and territorial authority drainage areas
Drainage standards Due to the nature of the various catchments, objectives can sometimes be met with different design standards. As a result designs in individual drainage systems need to be undertaken with consideration of the standards specific to the specific catchment. In general though, the design approach is based on surface water flow only and the intent is to remove ponding from a storm with a 10-year annual exceedance probability (AEP) within three days. The reasoning behind the three day time period is to prevent significant pasture vegetation damage by standing water.

Doc # 11854602 Page 281
Due to different catchment and drainage characteristics of each drainage area, the runoff design standard for each drainage area varies. The following runoff standards have been adopted for each drainage area (runoff to be cleared within 24 hours):
Thames Valley: 38 mm
Franklin Waikato: 25 mm
Waikato Central: - Fencourt, Hautapu, Rotomanuka, Ohaupo/ Ngaroto 25mm - All others 38mm
Aka Aka/Okaua 10 mm An example of how these runoff standards are used is the 38 mm of runoff that is used in a number of drainage areas that has to clear the catchment within 24 hours. The 38 mm of runoff standard has been adopted for larger catchments/drainage areas and does assume/allow for some deterioration in the drain capacity between cleans, so that capacity would drop to approximately 20-25 mm/day before the system was cleaned and brought back to the 38 mm standard. It is a uniform criterion based on 20 mm of runoff per day over three days allowing for 60 mm total runoff from a 10-year rainfall event. The 20 mm standard is the minimum standard that must be maintained. Around the region a 10-year ARI 24-hour rainfall event is approximately 120 mm. Therefore the 20 mm/day runoff standard will allow for 60 mm of runoff total over three days, which is approximately 50% of the rainfall depth, which is a fair representation of total runoff from a 10-year ARI rainfall from rural pastoral areas.
Problem identification Council’s administered drainage areas are generally necessary to ensure flat areas with limited drainage are drained to enable farming to be undertaken. These areas are rural and have a low level of service provided, they are informal drainage networks that have evolved over time to primarily manage groundwater levels, and convey flood flows to ensure ponding from a 10-year ARI event drains away within 3 days. These land drainage areas were not established or designed to cater for urban stormwater runoff. A major issue associated with the changing nature of land use in these drainage areas is the likely change in expectation on how the drainage systems should perform. Those with a small residential lifestyle block will not want to accept a portion of the property being flooded for three days. Maintenance property access to undertake regular inspections and perform needed maintenance could also be an issue with land being divided up into smaller sections with more land owners to deal with.

Page 282 Doc # 11854602
Ideally these areas would remain rural, however land use intensification is occurring in the vicinity of some of these drainage areas, particularly around the fringes of Hamilton. The urban growth areas need outfalls and drainage area networks are being looked at to provide this. The drainage networks are not designed to take urban flows and the expansion of urban areas into these drainage systems can cause complications. Conventional stormwater management approaches are generally used by consultants but that approach doesn’t work well in these conditions, as attenuation leads to extended duration of peak flow, which can exacerbate erosion and scour issues in low capacity drains, and can also exacerbate ponding duration on adjacent land.
Urban development issues There are several issues that need to be discussed regarding council administered drainage areas, as follows:
1. Their design is not based on peak flow but rather on getting a specific volume of water to drain the system within three days. Volumes of water are more important than peak rates of discharge.
2. The design approach has been based on an evolutionary approach to drainage rather than on specific criteria.
3. The drainage areas are very flat. 4. High velocities are not generally a problem due to the flat grades. Getting water
out of the drainage systems due to lack of grade is the primary concern. 5. While lowering of local water tables is a goal, it is not a conveyance consideration. 6. Channel erosion is generally not an issue with existing rural runoff, but could be
with increased flows. Areas with sandy soils need special consideration if the runoff and flow characteristics are likely to change.
7. The runoff standards do not account for climate change while intended urban development must consider that issue. This means there must be greater storage from new urban land uses than from rural land and is an issue that must be addressed.
8. There is some overlap with the council’s stormwater management approach but criteria for council administered drainage areas will vary from region wide criteria due to being primarily a volume-based approach.
Land use change and drainage areas 16.5.1 Introduction
If you are undertaking a development that interacts with a Waikato Regional Council administered drainage area, refer to Waikato Regional Council’s document “Managing land use change and Council’s administered drainage areas” for further information on what to consider.
16.5.2 Site specific criteria
Criteria for urban development that proposes to drain to a Waikato Regional Council administered drainage area is as follows:
Total volume of runoff from the post-development 10-year ARI rainfall must not exceed the pre-development runoff volume.
The runoff depth that is released for the 10-year ARI event shall have an extended detention time of 72 hours so as not to overload the receiving drainage channel.
Other criteria related to water quality treatment shall still be required.

Doc # 11854602 Page 283
The requirement for the runoff volume to not exceed the pre-development runoff volume for the 10-year ARI rainfall event is stringent. As a result, meeting this requirement negates the need to provide peak flow or erosion control as normally required in Section 7.4. Having the runoff volume not exceeding the pre-development runoff volume in conjunction with the 72-hour detention will meet those objectives. If this criterion cannot be met then an assessment of effects will be required to demonstrate that no adverse effects are expected. The following outlines the information requirements.
16.5.3 Information requirements
The level of potential effects on a land drainage area depends on the scale of the proposed development, hence the level of assessment that is required can vary. The following categories and associated information requirements have been developed to help provide clarity about what information is required for different levels of development. Note that the categories outlined below do not relate to any planning documents and have been developed for the purposes of this guidance only to help inform the assessment process. If you are proposing to undertake a development that interacts with a Waikato Regional Council administered land drainage area, you will need to consider the following information requirements. Table 16-1: Information requirements
Category Activity Information requirements
Comment
Small scale development
2 – 10 additional lots As above. Also requires a drainage plan and additional information in accordance with Section 11.5.3 below.
Potential effects range from generally minor to potentially significant
Larger scale development
> 10 additional lots and/or Triggers non-compliance with Rule 3.5.11.4 Permitted Activity Rule – Discharge of Stormwater to Water1
As above but also requires an Assessment of Effects in accordance with Section 11.5.4 below.
Potential effects generally range from more than minor to potentially significant
NOTE: 1 Refer to the Waikato Regional Plan and to Waikato Regional Council’s Resource Use Group for
queries relating to the rules.
16.5.4 Information requirements for small scale subdivision
This process outlines the key details required to be submitted to Waikato Regional Council when seeking drainage comments to undertake small scale subdivision that drains to, or is located within, a Waikato Regional Council managed drainage area.
1. The minimum details required are: 2. Name and address of the Surveyor. 3. Name and address of the Landowner/Developer. 4. Email addresses and phone numbers of the above. 5. Address and legal description of the land being subdivided. 6. Rates/Roll assessment number if available. 7. Name of the Waikato Regional Council drainage area that the subdivision lies in. 8. Layout plan of the proposal showing:

Page 284 Doc # 11854602
a) Titles of the new lots. b) Nearest Waikato Regional Council managed drain. c) Proposed drainage route linking the subdivision to the Council drain. d) Ground levels in proposed new titles including the lowest ground levels. e) Existing drain invert levels. This needs to extend at least 200m
downstream of the proposed connection point to the Council drain. f) A long section of the proposed drain inverts. g) The proposed size of the new or upgraded drain linking to the Council
drain. h) The proposed size of any culverts in the proposed new or upgraded link
drain. i) The size of the nearest existing culvert in the Council drain, downstream
of the proposed connection point. If there is / or will be a Waikato Regional Council drain within the lot, and the lot is under 5 hectare, then Waikato Regional Council require an easement in favour of Waikato Regional Council. To ensure ongoing access for maintenance purposes, within the area of subdivision the following is required:
Access gates between lots are required along Waikato Regional Council drains.
All hedging and trees are to be removed along Waikato Regional Council drains
16.5.5 Information requirements for larger scale development
For larger scale developments, those creating more than 10 additional lots, or those that trigger non-compliance with the Rule 3.5.11.4 Permitted Activity Rule – Discharge of Stormwater to Water, an assessment of effects is required to determine the potential effects of the activity and any proposed mitigation measures. When preparing an assessment of effects for a proposed new discharge to a land drainage area, it is essential that the effects of the predicted increase in stormwater runoff are assessed on the drainage system to the point where it can be demonstrated that the predicted increase has no effect. This will generally be to the point where the drainage system exits into a natural system. Note that some drainage areas are extensive, such as the Komakorau, for this drainage area the assessment may need to extend to where the drainage system drains to the Mangawara River at Taupiri. Currently developers are required to prepare stormwater management plans or catchment management plans for proposed developments as part of their resource consent/catchment planning requirements. However the scope of these assessments generally end close to the point of discharge from the site. It is essential that if the proposed development is interacting with a land drainage area, that the assessment extends to the appropriate termination point. The assessment would need to:
Demonstrate that the drainage system could still meet the relevant design standard taking into account the increase in stormwater peak flows, velocities and volumes, including the tributaries of the drainage system.
Consider potential effects of the proposal on groundwater levels, especially where the normal groundwater levels are naturally high.
Consider ongoing operation and maintenance requirements.
Include survey (topography and fall in drainage networks, especially in upper reaches) AND hydraulic modelling to inform the assessment.

Doc # 11854602 Page 285
If the assessment demonstrated that there was a predicted effect on the drainage system from the proposal, and there were no alternative discharge points available or options to mitigate the effects, the drainage system could be upgraded to accommodate the increase in flows and to ensure the drainage standard could be maintained. The system would need to be upgraded to the point where it was demonstrated that there was no effect. The upgrade option would need to consider potential effects on groundwater and would need to demonstrate that the groundwater level regime was not negatively impacted. Greater capacity can be provided by widening channels but not deepening them in these circumstances, as long as there is adequate fall in the system. Where the receiving catchment contains peat land the assessment should also include consideration of how the system will change over time with peat settlement and what future proposals would need to be implemented to manage the increased stormwater input as peat settlement occurs. If there is / or will be a Waikato Regional Council drain within the lot, and the lot is under 5 hectare, then Waikato Regional Council require an easement in favour of Waikato Regional Council. To ensure ongoing access for maintenance purposes, within the area of subdivision the following is required:
Access gates between lots are required along Waikato Regional Council drains.
All hedging and trees are to be removed along Waikato Regional Council drains
16.5.6 Funding
The management of the drainage areas is currently funded by targeted drainage rates. There is no regional contribution to land drainage, with each respective area being self-funding through the rating structure. Each drainage area or subdivision has its own rating system and the rates collected within each system provide the income for the maintenance of that area only. This funding system is based on rural properties being rated to maintain rural drainage systems for rural land use. The land drainage network is established to an agreed standard that is fair to all ratepayers, and where gravity drainage allows, clears water from the land to avoid damage to pasture. There is a mechanism to classify urban land as an ‘Urban’ category and to rate at a higher level for this land, as is currently applied to properties in several areas in the region. The higher rating is uniform for the classification, hence does not necessarily reflect the true cost of the urban stormwater runoff input to the drainage network. If a portion of an existing land drainage area becomes urban, then there will be a greater quantity of hard stand area, and hence higher volumes and peak flows and velocities of runoff will be generated within the catchment. This input into an existing rural drainage system could cause adverse effects that could lead to an altered management and maintenance approach being required which is likely to be more costly. Based on the current funding system, the downstream rural land owners would be paying for the increased maintenance costs as a result of the upstream urban land use. Ideally if a new urban area was to drain to a drainage area, a funding arrangement would be established to ensure all those in the contributing catchment were contributing funds to cover the costs of managing the drainage area at an appropriate rate. Examples where funding arrangements are in place to address urban drainage discharging input rural drainage areas include Manor Park, Waitakauru and Matamata Urban.
16.5.7 Land ownership
While Waikato Regional Council has responsibility for a drainage network within drainage areas, most (if not all) of the drains are located on private land. Hence any modifications to the existing drainage systems to facilitate extra or increased flows would have to be arranged or funded by the developer. Consideration for gaining access and undertaking

Page 286 Doc # 11854602
of works on any drains on private land would have to been taken into consideration by the developer.
Conclusion Urban development in council administered drainage areas cannot be taken lightly. These drainage systems are operating at peak capacity and any increase in the volume of runoff will either increase the risk of flooding, the areal extent of the flooding and/or increase the duration of flooding. Development in these drainage systems must take all possible steps to protect other property owners from adverse impacts of the urban land use. Increased widespread urban growth into these drainage systems will need to be considered carefully and may require all channels within a given system to be enlarged to accommodate the increased flow. That option should be limited as much as possible.

Doc # 11854602 Page 287
17 Retrofitting stormwater management Introduction
While implementation of stormwater management devices is most easily undertaken during initial development construction, there are many situations where the existing land use may be impacting downstream receiving environments. In these situations, retrofitting stormwater management devices for a given catchment or sub-catchment may be beneficial. The following section discusses some of the matters to be considered when progressing retrofit solutions to achieve stormwater management outcomes.
Retrofit process There are a number of steps to consider when implementing retrofit projects in a given catchment. Figure 17-1 below provides a suggested overall process that can be used to assist with the implementation of retrofit projects. The first step is the identification of issues that have arisen as a result of stormwater runoff from urban areas across a jurisdictional area. These issues can then be prioritised based on the lead agencies prioritisation criteria. Some suggested criteria are provided in Section 17.3 below. Once project prioritisation has been undertaken, feasibility studies would need to be undertaken to determine whether projects are practicable. Feasibility studies should include consideration of the following items:
Magnitude of impact
Availability of an appropriate device
Space availability
Is there positive drainage to the device?
Magnitude of benefit
Cost These items are discussed in more detail in the following sections. Once feasibility studies have been completed, a list of projects for implementation will be produced. It is a good idea to consider whether any of the projects on the list can be wholly or partially implemented (or partially funded) as part of any proposed development proposals that are being undertaken in the vicinity of where the issues are arising. Final recommendations can then be made as to which retrofit projects are to be implemented. These projects can then be recommended for funding approval, planning, design and implementation.

Page 288 Doc # 11854602
Figure 17-1: Retrofit process
Prioritisation of projects When considering the prioritisation of retrofit projects, it is up to the lead agency to determine the criteria used to prioritise the projects, and the subsequent prioritisation. The following criteria can be used at a macro scale to help prioritise projects with criteria provided in order of highest to lowest priority.
Projects related to public safety generally have the highest priority. This would include situations where flooding of habitable structures is occurring as a result of upstream urban land use.

Doc # 11854602 Page 289
Collaborative projects are to be supported. Having a multi-agency project can provide a better overall outcome in terms of capacity building, improved collaboration and connections moving forwarded, and potentially higher funding resources being available as the costs are spread over multiple agencies. Overall outcomes can be improved especially where the retrofitting solution addresses catchment problems from varied land uses under the jurisdiction of multiple agencies.
Projects that address water quality issues have a high priority in terms of managing the effects of urban land use on our regions water bodies. In terms of priority, water quality retrofits can have a beneficial effect on a wider range of receiving environments (streams, groundwater, estuaries, lakes and harbours) than would stream erosion retrofits hence has a higher priority.
Projects that address stream erosion issues are also of high priority, with primary consideration being given to address local erosion issues and also to projects that address general stream degradation/cumulative effects of upstream urban land use.
Magnitude of impact 17.4.1 Public safety
If public safety is recognised as an issue in relation to stormwater effects, the project will have a high priority. In terms of ranking within this category, the greater the number of individuals who may be adversely impacted by flooding, the higher up the project would rate on the prioritisation list. It is important to mention the difference between public safety and property flooding. Property flooding (often due to its location within a floodplain) is not considered a priority for retrofitting. The following public safety issues are considered a high priority:
Flooding of habitable structures, or
Increased flood levels on roads, which could jeopardise public safety.
17.4.2 Collaborative projects
Cross-agency projects to address stormwater issues are supported. Collaboration on solving catchment or sub-catchment issues related to flooding, water quality or stream erosion, ensures that solutions are developed with a broader context and thus providing greater potential benefit. In terms of prioritisation, projects that provide catchment wide solutions are considered to have a higher priority than projects providing sub-catchment solutions. Joint projects that may be undertaken in conjunction with a specific development project have a lower priority for implementation than the previous two scenarios. Catchment-wide or sub-catchment-wide solutions will rely on sufficient catchment or sub-catchment studies being undertaken to identify problems and solutions prior to prioritisation of these projects. While joint projects may be undertaken in conjunction with a private developer, the project needs to have a broader context than just the area of development to warrant consideration for retrofit potential.
17.4.3 Water quality retrofits
Magnitude of impact can be somewhat qualitative in given situations but receiving system impacts can be quantified using contaminant spreadsheets and unit loading approaches. An important issue is the determination that a given receiving system is being degraded either through sediment analyses or via aquatic organism decline. Once that determination has been made and contaminant load modelling or monitoring is

Page 290 Doc # 11854602
undertaken that identifies a given land use as being a major source of degradation, then retrofitting can be prioritised. The degree of impact is important and will have to be made on a case-by-case basis. The former Auckland Regional Council’s Environmental Response Criteria (ERC)164 is an example of guidance towards receiving system impact consideration. The ERC are conservative thresholds that provide an early warning of environmental degradation, and they provide guidance as to when intervention may be necessary to protect or mitigate for environmental degradation. Another factor to consider for water quality retrofit ranking is having a project benefit multiple receiving systems. Providing a water quality retrofit of a given land use that drains into a stream and then an estuary would be given a higher priority than a project that only benefits one receiving system. A variation to this “rule of thumb” would be a receiving system that is much degraded and a retrofit project would have a significant beneficial effect on it.
For the most part, water quality retrofits will be undertaken to resolve a locally recognised problem. It is anticipated that local government monitoring (sediment, water quality, aquatic organisms) will provide the background information that retrofitting is responding to.
17.4.4 Stream erosion reduction
Stream erosion can occur as localised erosion or general degradation along a stream reach. Localised erosion can be caused by inadequate energy dissipation at culvert or pipe outlets and can be relatively easy to resolve through design and implementation of energy dissipation outlet protection.
164 Auckland Regional Council, 2004

Doc # 11854602 Page 291
General stream channel degradation is more complicated to address, possibly due to increased flows on a more frequent basis. It may be difficult to determine whether a given land use is a primary cause of the degradation. Larger catchments reduce the potential for any one activity to be identified as a principal cause of erosion. The most common situation where a development having a high degree of imperviousness can individually cause channel instability is where the catchment is relatively small and site imperviousness proportionately large. Site imperviousness in excess of 10% of a total catchment area could be a major source of general channel degradation. Prioritisation should be based on the degree of general degradation.
Device availability Device availability depends on the stormwater related problem that is being addressed. The following items consider the types of devices that may be appropriate to mitigate a specific problem.
17.5.1 Downstream flooding impacts
If downstream flooding impacts are identified, the issue then becomes whether appropriate action can be taken to reduce those impacts. There are three devices that are generally appropriate to mitigate downstream flood effects:
Detain flows using stormwater detention ponds
Detain flows upstream of cross-culverts to provide flood storage, or
Purchase or flood proof downstream habitable structures. If these options are not available, it may not be possible to mitigate the flood effects. If this is the case, further project consideration would be discontinued unless it can be considered cooperatively with another entity, which could expand possible solutions and allow for cost sharing.
17.5.2 Downstream channel erosion effects
There are three key ways that downstream channel erosion effects can be addressed:
Reducing the volume of stormwater that is discharged, or
Providing extended detention storage of runoff for 1.2 times the water quality rainfall event using stormwater detention ponds or wetlands, or
Armour downstream banks to protect banks from erosion. Infiltration of existing runoff is possibly the only device available for reducing the volume of stormwater. Retrofitting an entire sub-catchment with rain tanks will not normally be practical and may not be effective as much of the runoff is delivered by other impervious

Page 292 Doc # 11854602
surfaces. The suitability of infiltration in a catchment will depend on soils, slopes, depth to groundwater or bedrock and space availability and may not be a practicable option in a given situation. Another option relates to the provision of temporary storage and release of stormwater runoff for 1.2 times the water quality rainfall over a 24-hour period. The amount of storage required to achieve this needs to be considered on a case-by-case basis for determination of site suitability. Armouring downstream channel boundaries may address a symptom of the problem more than resolving the problem and is generally considered as a last resort. Armouring channel boundaries may not reduce erosion potential of other parts of the stream, and can displace the erosion effects to the edge of the armoured areas.
17.5.3 Stormwater quality
Providing water quality retrofit will depend on a number of items including the contaminants of concern and the space available to provide stormwater quality treatment. Table 6-8 lists the treatment performance provided by different stormwater management devices and Table 6-10 and Table 6-11 provide information about removal efficiencies for different contaminants. If adequate space is available then the following devices are recommended for retrofit to provide water quality treatment, or a combination of these devices:
Wetlands
Swales and filter strips
Bioretention devices or raingardens. If space is limited then generally a proprietary filtration device is the main option to provide water quality treatment. Or it might be advantageous to use a number of small at-source devices across the area of interest depending on where space is available and what type of devices would suit the available locations. This approach could utilise a range of devices such as raingardens, filter strips, filtration devices and swales, depending on the local constraints. If space is very constrained, it may be worthwhile to consider providing water quality treatment for the first flush of contaminants only. The topic of first flush is introduced in Section 2.3.3 and is further discussed below. Some contaminants exhibit more of a first flush effect than others. The first flush may be more pronounced for dissolved metals than particulate ones and will be more pronounced for hydrocarbons. In addition, the shape of the catchment and total area may dampen a first flush effect depending on the catchment arrangement. A study looking into the effect of first flush events165 indicates that for a catchment imperviousness of 50%, that zinc has a pronounced first flush effect while copper has a lesser effect. Sediment has a slight first flush effect. The study considered a first flush event to constitute the first 2.5 mm of runoff. The study also considered the effect of rainfall depth on percent of annual load. For a catchment with 50% imperviousness the following table presents the zinc and copper contaminant levels in different depths of runoff as a percentage of annual load. Table 17-1: Zinc and copper contaminant levels in runoff165
Contaminant % of annual load Runoff Depth Interval (mm)
0 - 2.5 2.5 - 7.6 7.6 - 12.7 12.7 - 19 19-25 Zinc 40 36 11 4 9 Copper 21 39 20 6 14
165 Minton, 2002
Doc # 11854602 Page 293
As can be seen, capturing the first 7.6 mm of runoff may provide a significant reduction in annual load for zinc and copper. If these metals are the primary contaminants of concern for a retrofit solution and space is constrained, the findings of this study suggest that targeting the first flush for treatment may provide a reasonable outcome in terms of reduction of the annual loads for these contaminants. It is important to recognise that this ‘first flush’ approach does not achieve the same level of contaminant reduction that is intended for new development but in situations where there is less available space and a specific contaminant can be targeted, benefits can be achieved. Water quality treatment in an existing urban environment is as much a result of opportunity as it is about criteria.
Space availability Availability of space to retrofit stormwater management is an important aspect of the decision matrix. Space has to be available or retrofitting cannot be undertaken. Any device that is constructed will eventually need maintenance and that maintenance can only be undertaken if access to the site for maintenance purposes has been provided. An essential element of any retrofit project design is the need to consider future access to the device for maintenance equipment. Undertaking a collaborative project with multiple agencies or even with a developer may provide the required space. In general, retrofitting is more practical when considered as a collaborative project than attempting to reduce effects individually.
Positive drainage While there may be space available to retrofit a stormwater management device, gravity may prevent a given location from being feasible. Elevation differences may mean that an available area is not located down-gradient from where the runoff is generated and hence runoff cannot be directed to the location. In addition, existing development will have a reticulated system to discharge stormwater downstream and that drainage system may not allow for flows to drain to a stormwater management device. The existing site drainage system and site topography have to be considered to determine whether a retrofit is practical.
Magnitude of benefit The ability of a retrofit to individually, or in conjunction with other efforts, reduce existing adverse effects to receiving systems must be considered. The decision whether a given contaminant reduction provides value to a receiving system depends on a case-by-case analysis of monitoring data and modelling of long-term effects. In many situations, retrofit will be considered in response to a local problem identification but retrofitting actions should also be considered from a catchment-wide perspective. The magnitude of the benefit cannot be considered until a decision is made regarding whether a device can be used at a given location and what level of contaminant reduction can be provided. Once those questions are answered, the magnitude of benefit from the proposed retrofit device can be assessed.
Cost Cost is another important component of the retrofit approach. It can be considered from several different perspectives.

Page 294 Doc # 11854602
Cost versus magnitude of benefit for a given project
Total cost for a given retrofit, or
Total cost for the overall retrofit programme.
17.9.1 Cost benefit analysis
A cost benefit analysis is recommended to determine whether a retrofit can provide a benefit to a receiving system. It may be that removing only 10% of a given contaminant will provide only a minor improvement to receiving system health unless undertaken in conjunction with other projects that are programmed or intended. Once the decision is made that a given retrofit project will result in a measurable improvement to receiving system health, the cost of that improvement must be determined and considered against the benefits provided. When financial resources are low, it can be difficult to justify expenditure that addresses stormwater related issues beyond those that ensure public safety. Providing value to aquatic receiving systems is not well defined and tends to be more qualitative than quantitative, and has often been over-looked. However in the Waikato Region, as discussed in Section 3, the Waikato Regional Policy Statement (RPS) gives effect to the Vision and Strategy for the Waikato River which has overarching objectives that include:
The restoration and protection of the health and wellbeing of the Waikato River, and
The restoration of water quality within the Waikato River so that it is safe for people to swim in and take food from over its entire length.
The RPS is the primary direction-setting document for the Waikato River and its catchments and provides clear direction that helps to justify retrofit solutions that help the objectives of the Vision and Strategy to be achieved.
17.9.2 Total cost
While a given project may be feasible from a design and space allocation perspective, the overall cost of project implementation and operation may make a project impractical. There are several examples of this as follows:
Due to slopes and space availability, a retrofit may require retaining walls to fit in a confined space. While there would be water quality benefit, the cost to construct the device would be very high. In those situations it may provide greater benefit to do several other projects than the one being considered.
If space is limited, design could be based on providing a smaller surface area for treatment than would normally be recommended for a new consented activity. This would necessitate maintenance on a more frequent basis. If there are maintenance access problems the whole-of-life costs may be too high to justify project implementation.
To some degree, the final decision will be based on a qualified determination of benefit but the feasibility process provided here will allow greater quantification of benefits versus cost to assist in reducing uncertainty in decision-making. It is important that project cost reflect whole-of-life costing rather than just construction. Whole-of-life costing will reflect the long-term cost of maintaining continued function in addition to design and construction. This is critical in areas where space is limited and maintenance access may require road closure or work being undertaken at night versus during the day.
17.9.3 Total cost for the maintenance programme
This is an item that needs to have a basic assured funding base so that continuing efforts may be undertaken. Without having a dedicated funding source proactive approaches

Doc # 11854602 Page 295
cannot be undertaken. Too often local programmes are focused on requesting funding to address a specific problem without having a proactive approach to problem solving. It is important that operation and maintenance is assured so that investigations and prioritisation of actions can have a solid foundation. Relating actions to specific catchments will offer a comprehensive approach to problem solving by highlighting problem areas, identifying those stressors that cause the problem and considering options for solution. These activities cannot be undertaken without assurance of funding on a long-term basis.
Taking advantage of opportunities Retrofitting presents many unique, complex challenges – institutional, technical and financial. Institutionally, retrofitting is best accomplished through catchment approaches. Technically, a given approach may be land intensive and inappropriate for use in highly urbanised areas, where land is scarce and expensive. It is important to have good communication and coordination between all of those entities involved in a given project, and this needs to be occurring early in the problem identification process to avoid conflicts and to allow for synergies to occur. Retrofitting can be undertaken through an almost limitless number of ways. These include the following:
Retrofitting existing stormwater quantity control structures
Using existing road crossings to impound stormwater
Demonstration projects
Use of new consenting to exceed individual project benefits, and
Retrofitting through education.

Page 296 Doc # 11854602
17.10.1 Retrofitting existing stormwater quantity control structures
Nearly any modification of an existing runoff control device which will slow velocities, increase detention time or promote runoff flow through vegetation will increase the removal of contaminants. The simplest way to retrofit stormwater detention ponds is to modify the existing outlet structure to provide extended detention or provide a normal pool of water for a wetland. If site conditions are appropriate, dry detention or failing infiltration systems can be converted to wet systems to improve contaminant capture. Any permanent pool may have to be excavated below the existing device invert so the storage volume is not reduced. A retrofit could be as simple as adding a weir above the invert of a pipe to provide for some detention of water.
17.10.2 Using existing road crossings to impound stormwater
Roads and highways, by their linear nature cross catchment boundaries. Where they pass over drainage systems there is generally an embankment that elevates the roadway above a given floodplain elevation. The upstream inlet of the highway can be modified to extend detention time. Grassy medians, shoulders, clearways and interchanges all provide opportunities for retrofitting for water quality treatment. Obviously, these options would have to be coordinated and approved by the appropriate road or highway responsible entity (territorial authority, NZTA, land owner, etc.).
17.10.3 Demonstration projects
Retrofitting is often undertaken as a demonstration project. It provides an opportunity not only to treat stormwater but to test innovative treatment devices. They tend to be limited to showing examples of innovative devices in a forum where they are visible. Visibility is important when the intention is to increase public awareness of stormwater management proactive or to have people become aware of devices that may be promoted on a more widespread basis (possibly water tanks). The value of demonstration projects as an educational tool can be very important. Auckland Council has established a stormwater themed area at the Auckland Botanic Gardens in Manukau City where people can see stormwater management devices and learn more about them from interpretive signs. There are many opportunities to make the public more aware of stormwater management issues.

Doc # 11854602 Page 297
Figure 17-2:Auckland Council stormwater demonstration area
17.10.4 Use of new consenting to exceed individual project benefits
A new development may provide an opportunity to incorporate some retrofitting as a cost share initiative or provision of adjacent area retrofit as a consent condition. It may be that an increased density could be allowed for land that may provide broader treatment than for an individual development. An example could be when a road is widened and treatment must be provided for the new section of carriageway. It may not be possible to split the new road section from the existing road section and hence treatment can be provided for the whole road including the portion of existing carriageway. This would improve on the existing situation.
17.10.5 Retrofitting through education
Public education can result in a significant improvement to catchment management outcomes. Every day activities add contaminants to streets, parking lots, lawns and other surfaces. Public education campaigns highlighting the importance of our waterway, the connectivity of stormwater systems to our waterways, the importance of reducing contaminants that reach the stormwater system can be an effective retrofitting tool. Possible topics for education campaigns can include:
Caring for our streams
Correct disposal of household chemicals and automotive waste
Proper use of lawn fertiliser and pest control chemicals
Correct disposal of lawn clippings and green waste (not throwing them into streams or gullies)
The benefits of water tank installation
The benefits of washing cars on grass rather on driveways or the road, and
Avoiding littering (including picking up dog droppings).

Page 298 Doc # 11854602
Public education can also increase the effectiveness of spill readiness programmes, through activating the community to assist with notification of when spills occur. By increasing awareness of contaminant indicators and having a simple notification system in place, spill events might be more readily noticed and reported by the community, hence the spill can be contained and managed more efficiently by officials, reducing potential effects on the environment. Environmental education in existing urban areas can provide one of the most practical and cost-effective approaches to contaminant reduction. A key point in considering public educational programmes is that they must be ongoing. If a programme is presented for a limited time the public often slips back into old habits that can cause contamination. Public education programmes will only provide long term benefits if they are ongoing.

Doc # 11854602 Page 299
Part IV: Construction, operations and maintenance

Page 300 Doc # 11854602
18 Construction related issues Introduction
Effective planning, good design, good construction, maintenance inspection and operation and an understanding by all of those involved in the total process are essential elements of successful stormwater management programme implementation. A breakdown in any one of these areas will cause additional expenses that would not arise if all steps were undertaken correctly. The best design plan has little value if the device is not constructed properly. The use of poor quality materials for construction and poor construction in general can negate all of the time and effort expended during the design phase. Problems associated with poor construction range from minor to major. Minor problems can include partial premature clogging of a filtration or infiltration device, premature maintenance needs related to sediment removal, replacement of a device component such as riprap, slope erosion or standing water (where there is not supposed to be any). Major problems could necessitate reconstruction of an entire device, structural repairs or increased safety concerns. Proper construction will have a significant beneficial impact on future maintenance. Construction inspection can be broken down into several components166 including:
A clearly defined responsibility for proper construction
Pre-construction activities
Device construction, and
Final acceptance responsibility. These items are discussed individually to provide guidance on successful construction of stormwater management devices. Any inspection forms that are completed should remain with the project files in the event that to resolve future maintenance issues they need to be referred to.
Responsibility for construction There has to be an individual who has the assigned responsibility for proper construction of stormwater management devices. That individual must have authority, or be given a defined approach to construction problem resolution. This is to ensure that construction is undertaken correctly and that any required changes are made if the quality of any portion of a device construction is undertaken less than adequately. A variety of problem resolution options must be available to the responsible individual and could include items such as:
166 Watershed Management Institute, 1997
Bioretention construction - sediment entry is compromising future performance
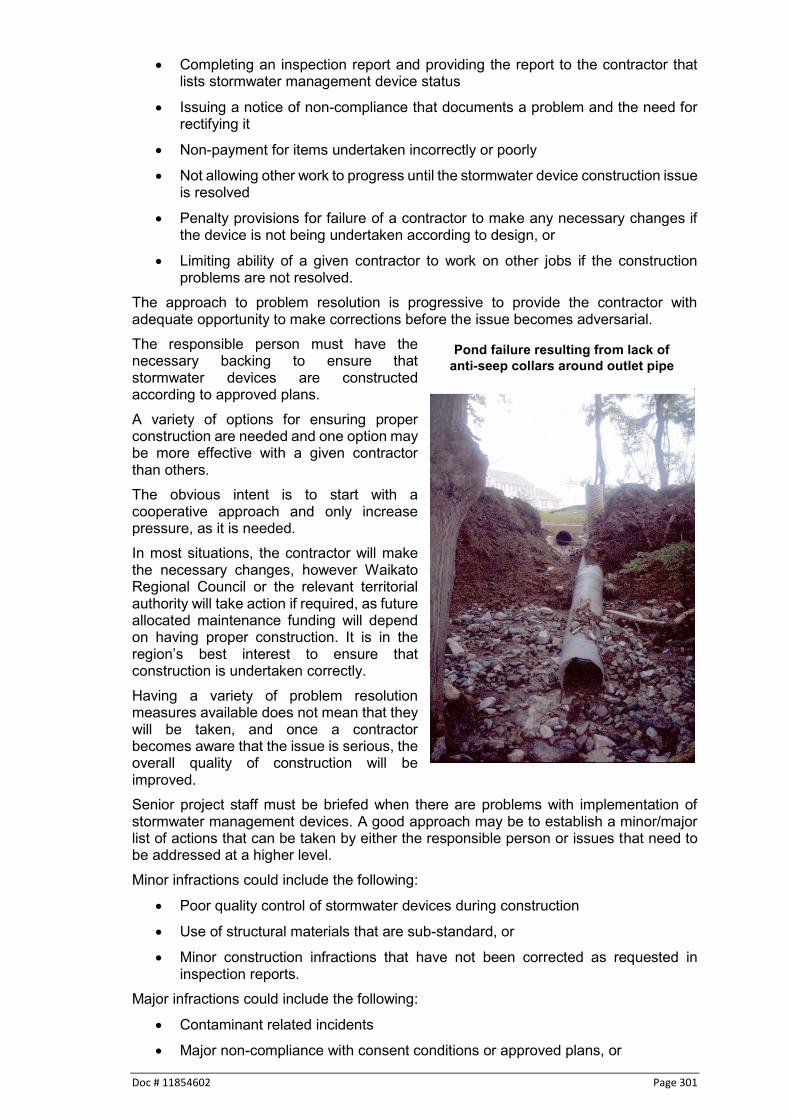
Doc # 11854602 Page 301
Completing an inspection report and providing the report to the contractor that lists stormwater management device status
Issuing a notice of non-compliance that documents a problem and the need for rectifying it
Non-payment for items undertaken incorrectly or poorly
Not allowing other work to progress until the stormwater device construction issue is resolved
Penalty provisions for failure of a contractor to make any necessary changes if the device is not being undertaken according to design, or
Limiting ability of a given contractor to work on other jobs if the construction problems are not resolved.
The approach to problem resolution is progressive to provide the contractor with adequate opportunity to make corrections before the issue becomes adversarial. The responsible person must have the necessary backing to ensure that stormwater devices are constructed according to approved plans. A variety of options for ensuring proper construction are needed and one option may be more effective with a given contractor than others. The obvious intent is to start with a cooperative approach and only increase pressure, as it is needed. In most situations, the contractor will make the necessary changes, however Waikato Regional Council or the relevant territorial authority will take action if required, as future allocated maintenance funding will depend on having proper construction. It is in the region’s best interest to ensure that construction is undertaken correctly. Having a variety of problem resolution measures available does not mean that they will be taken, and once a contractor becomes aware that the issue is serious, the overall quality of construction will be improved. Senior project staff must be briefed when there are problems with implementation of stormwater management devices. A good approach may be to establish a minor/major list of actions that can be taken by either the responsible person or issues that need to be addressed at a higher level. Minor infractions could include the following:
Poor quality control of stormwater devices during construction
Use of structural materials that are sub-standard, or
Minor construction infractions that have not been corrected as requested in inspection reports.
Major infractions could include the following:
Contaminant related incidents
Major non-compliance with consent conditions or approved plans, or
Pond failure resulting from lack of anti-seep collars around outlet pipe

Page 302 Doc # 11854602
Continued refusal to make necessary field changes.
Pre-construction activities The individual responsible for proper construction of stormwater management devices should:
Review the approved design plan to become comfortable with all of the plan components, and
Conduct a pre-construction meeting with the contractor. The review of the design plan should include the following:
The overall project proposal and site conditions
Location of the stormwater management devices
Location of the existing or proposed drainage system
Dimensions of the stormwater devices
Any construction problems that might be anticipated
Any special consent or approval conditions
Material specifications
The sequence of construction, and
Any right-of-way limitations or restrictions. The pre-construction meeting is important to ensure that the contractor has a good understanding of key aspects of device construction and the need for proper construction. The meeting assists in the development of a dialogue between the contractor and the responsible person. Other individuals having roles in stormwater device construction also should be included, especially subcontractors and individuals responsible for any utility construction. Items that should be discussed at the pre-construction meeting include:
Contact information (cell phone, email, etc.)
Importance of having design plans on site
The purpose of the stormwater management approach
Specific design details that require special attention
Safety briefing/traffic management
Construction sequences, schedules and timetables, and
Chains of command in the event that field changes become necessary.
Device construction As stormwater management devices are varied in their composition, shape and form it would be best to address construction individually. Much of the information provided in this section is from Auckland Regional Council’s TP10.
18.4.1 Swale and filter strip construction
A key requirement of any vegetative treatment system is to obtain a stand of vegetation that can effectively filter stormwater runoff. Ideal vegetation characteristics include a dense, uniform growth of fine-stemmed plants that can tolerate soil saturation and the climatological, soil, and pest conditions of the area. Catchment areas are generally fairly small, less than 4 hectares. It is essential to maintain proper hydraulic conditions to avoid uneven, channelised flows through the swale or filter strip. Uneven flow across its width reduces contaminant
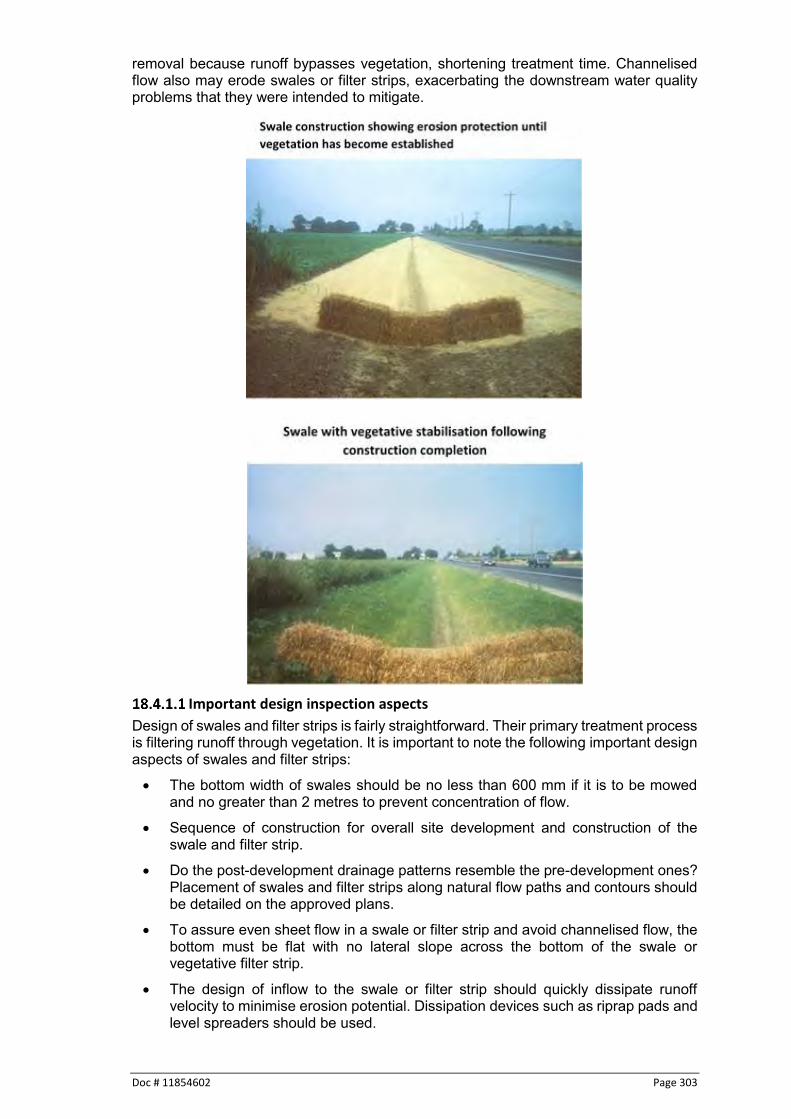
Doc # 11854602 Page 303
removal because runoff bypasses vegetation, shortening treatment time. Channelised flow also may erode swales or filter strips, exacerbating the downstream water quality problems that they were intended to mitigate.
Important design inspection aspects
Design of swales and filter strips is fairly straightforward. Their primary treatment process is filtering runoff through vegetation. It is important to note the following important design aspects of swales and filter strips:
The bottom width of swales should be no less than 600 mm if it is to be mowed and no greater than 2 metres to prevent concentration of flow.
Sequence of construction for overall site development and construction of the swale and filter strip.
Do the post-development drainage patterns resemble the pre-development ones? Placement of swales and filter strips along natural flow paths and contours should be detailed on the approved plans.
To assure even sheet flow in a swale or filter strip and avoid channelised flow, the bottom must be flat with no lateral slope across the bottom of the swale or vegetative filter strip.
The design of inflow to the swale or filter strip should quickly dissipate runoff velocity to minimise erosion potential. Dissipation devices such as riprap pads and level spreaders should be used.
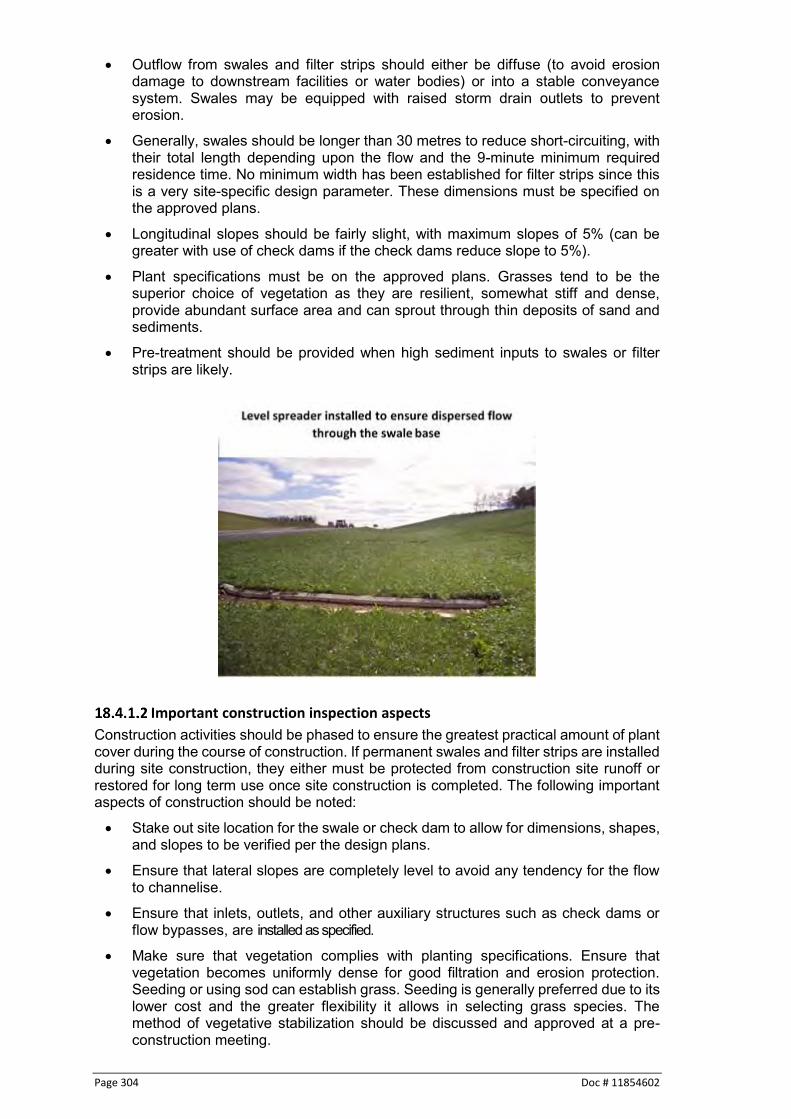
Page 304 Doc # 11854602
Outflow from swales and filter strips should either be diffuse (to avoid erosion damage to downstream facilities or water bodies) or into a stable conveyance system. Swales may be equipped with raised storm drain outlets to prevent erosion.
Generally, swales should be longer than 30 metres to reduce short-circuiting, with their total length depending upon the flow and the 9-minute minimum required residence time. No minimum width has been established for filter strips since this is a very site-specific design parameter. These dimensions must be specified on the approved plans.
Longitudinal slopes should be fairly slight, with maximum slopes of 5% (can be greater with use of check dams if the check dams reduce slope to 5%).
Plant specifications must be on the approved plans. Grasses tend to be the superior choice of vegetation as they are resilient, somewhat stiff and dense, provide abundant surface area and can sprout through thin deposits of sand and sediments.
Pre-treatment should be provided when high sediment inputs to swales or filter strips are likely.
Important construction inspection aspects
Construction activities should be phased to ensure the greatest practical amount of plant cover during the course of construction. If permanent swales and filter strips are installed during site construction, they either must be protected from construction site runoff or restored for long term use once site construction is completed. The following important aspects of construction should be noted:
Stake out site location for the swale or check dam to allow for dimensions, shapes, and slopes to be verified per the design plans.
Ensure that lateral slopes are completely level to avoid any tendency for the flow to channelise.
Ensure that inlets, outlets, and other auxiliary structures such as check dams or flow bypasses, are installed as specified.
Make sure that vegetation complies with planting specifications. Ensure that vegetation becomes uniformly dense for good filtration and erosion protection. Seeding or using sod can establish grass. Seeding is generally preferred due to its lower cost and the greater flexibility it allows in selecting grass species. The method of vegetative stabilization should be discussed and approved at a pre-construction meeting.

Doc # 11854602 Page 305
Place the swale or filter strip so that no portion will be in the shade of buildings or trees throughout the entire day, as this will cause poor plant growth.
Make sure that construction runoff is not entering the swale or check dam. If it is, require removal of sediments and re-establish vegetation upon the completion of construction.
Ensure that measures are in place to divert runoff while vegetation is being established. If runoff is probable and cannot be diverted, ensure that adequate erosion control measures are in place.
Inspect liners, underdrains, riprap, and check dam spacing, if these are included in the approved plan.
Make sure that any level spreaders are completely level and stable enough to remain level during their operation.
Check for proper installation of pre-treatment devices, if required.
Ensure that kerb cuts and their locations are as specified.
18.4.2 Sand filters
Sand filters may involve reinforcing steel, concrete, significant site preparation and excavation before construction. The approved plans should be reviewed and discussed for any concerns at the pre-construction meeting. The following construction times and items are important to recognise during the site inspection:
Stake out the sand filter location.
Generally, do not use sand filters for sediment control during construction.
Pre-fabricated structural components should be available on-site to verify adequacy of materials. Reinforcing bars should meet design specifications, as should all other structural components such as any pipes, aggregate material and filter fabric.
Clear foundation areas of any organic material, which could cause uneven settlement as the material decomposes. Unsuitable foundation material should be removed and replaced with suitable material.
Compact the foundation area to sustain the load placed on it by the sand filter. Level the foundation as detailed on the plans to ensure proper drainage of the facility.
Ensure the responsible person is on site when the sand filter has been formed up with reinforcing bars in place but before pouring the concrete so pouring can be observed.
During concrete pouring, the responsible person must verify that the concrete meets design specifications for the design load.
If the sand filter is composed of prefabricated units, the inspector must approve the means of joining the sections and the steps taken to prevent leakage from between the prefabricated units.
Sand filter under construction. Flow prevented from entering the filter until site stabilisation is
completed

Page 306 Doc # 11854602
Before backfilling, fill the filters with water once the concrete has set (or joints on prefabricated units have been sealed) and allowed to sit for 24 hours and observe whether the unit has any leaks.
When installation has been completed to meet size and volume requirements, has no leakage and the contributing catchment areas have been stabilised, place the underdrains on the proper slope and wrap them in filter fabric to prevent migration of the filtration material out of the facility.
Place the filter material in the facility. The material should meet criteria specified on the design plans. The sand should be clean, washed aggregate.
Conduct a final inspection to verify that the filter material is placed correctly and the first sedimentation chamber is clean of any accumulated sediments or other construction debris.
18.4.3 Bioretention devices
Ideally, defer building the bioretention device until after the contributing drainage area has been stabilised.
Do not use the area excavated as a sediment ponding area during site construction, as finer sediments may seal the bottom before it starts operation.
Stake out the general location of the bioretention device so that location and dimensions can be considered in terms of site suitability.
Excavate the bioretention device and connect the underdrains to the stormwater drainage system. If there is no stormwater system, the underdrain should be connected to a flow distribution system to avoid concentrated flows downstream. Impervious lining or filter fabric should be placed at this time.
Place gravel backfill, sand backfill and planting soil in excavation. Verify composition of materials and compaction.
Plant vegetation, lay mulch and complete site stabilisation.
Bioretention device - lining around garden and perforated underdrain prior to backfilling

Doc # 11854602 Page 307
18.4.4 Infiltration
Infiltration trenches
Infiltration trenches can be up to several metres deep, with a large length to width ratio. Filled with stone, scoria, gravel or sand aggregate, they are generally used in areas where space available for stormwater management is limited. Runoff is stored in the voids of the aggregate material, which are normally is between 30 and 40% of the total volume. Scoria has a higher void space ratio of approximately 50%. The stored runoff then exits the trench through the side and bottom walls into the ground. Construction inspection should include the following items:
Verify the infiltration trench dimensions and location on site before trench construction. Verify distance to any building foundations, septic systems, wells, etc.
Excavate the trench using a backhoe or a ladder type trencher. Front-end loaders or bulldozers should not be used, as their blades can seal the infiltration soil surface. Place excavated materials far enough away from the sides of the excavated area, in order to minimise the risk of sidewall cave-ins and prevent migration of the soils back into the trench after the stone, gravel, or sand aggregate has been placed.
Inspect the trench bottom and sidewalls and remove objectionable material such as tree roots that protrude and could possibly puncture or tear the filter fabric.
Line the sides and bottom with filter fabric. The sidewall fabric will prevent migration of soil particles from the sidewalls into the trench. The bottom fabric will prevent sealing of the aggregate soil interface.
Lay the fabric with sufficient length to overlap the top of the trench. Covering the trench after placement of the aggregate will protect the completed device by preventing excess site sediment from entering it.
Install an observation well in the aggregate so that future inspections can determine whether the device is functioning as designed. The observation well should consist of a perforated PVC pipe, 100 - 200 mm in diameter and have a footplate and a cap. The footplate will prevent the entire observation well from lifting up when the cap is removed during future inspections.
Inspect the aggregate material before placement to ensure that it is clean and free of debris. The size of the material should be as specified on the approved plans.
Infiltration trench - footplate and observation well

Page 308 Doc # 11854602
Upon completion of trench construction, the adjacent areas should be stabilised
with vegetation. Direct the trench overflow to a non-erosive outlet channel.
Install a pre-treatment device such as a swale or other approved method before the runoff enters the trench in order to remove suspended solids.
Cap the observation well and measure and record the initial depth measured and noted on the inspection checklist.
Soakage Pits
Similar to infiltration trenches, soakage pits are excavated areas that are filled with an aggregate material. The main difference is that soakage pits accept runoff from roof areas only. They therefore receive lower loadings of suspended solids than from what would be expected from ground surface runoff. The major concern with soakage pits is their proximity to building foundations. Careful consideration must be given to the correct placement of them so that building foundation problems do not occur. Construction inspection should include the following:
Verify the soakage pit dimensions and location on site prior to construction. Verify distance to foundations, wastewater systems, wells, and utilities.
Excavate the soakage pit using a backhoe or ladder type trencher. Front-end loaders or bulldozers should not be used as the equipment blades may cause compaction of the soakage pit floor.
Place excavated materials a sufficient distance from the sides of the excavated area to minimise sidewall cave-ins and to prevent migration of the soils back into the pit after the aggregate has been placed.
Inspect the soakage pit bottom and side walls and remove objectionable material.
Line the sides with filter fabric to prevent migration of soil particles from the side walls into the pit.
Install an observation well in the aggregate to allow for future maintenance inspections to determine functioning over time.
Inspect the aggregate material before placement to ensure that it is clean and free of debris. The size of the material should be as specified on the approved plans.
Permeable pavement
These devices create road and parking lot surfaces that allow for stormwater runoff to travel through the surface into the ground. Under the porous surface, an aggregate material serves as a reservoir base for temporary storage of the runoff until the water infiltrates into the ground. Their best applications are in areas where there is a low
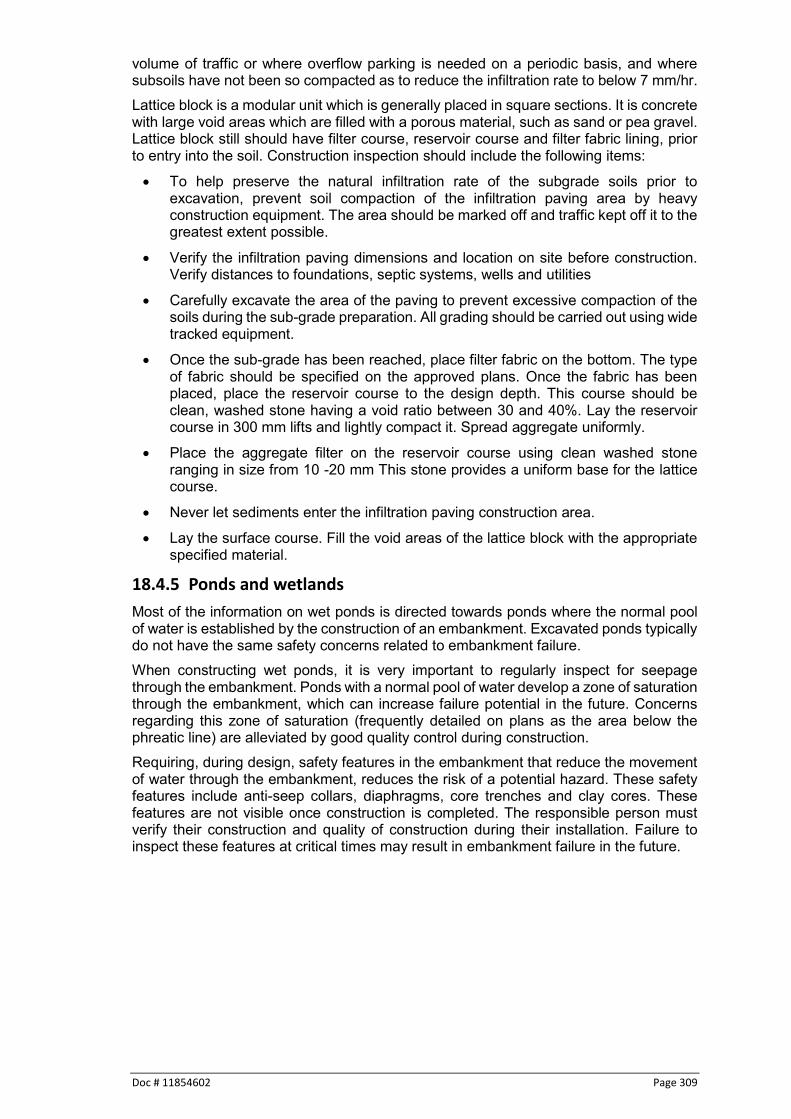
Doc # 11854602 Page 309
volume of traffic or where overflow parking is needed on a periodic basis, and where subsoils have not been so compacted as to reduce the infiltration rate to below 7 mm/hr. Lattice block is a modular unit which is generally placed in square sections. It is concrete with large void areas which are filled with a porous material, such as sand or pea gravel. Lattice block still should have filter course, reservoir course and filter fabric lining, prior to entry into the soil. Construction inspection should include the following items:
To help preserve the natural infiltration rate of the subgrade soils prior to excavation, prevent soil compaction of the infiltration paving area by heavy construction equipment. The area should be marked off and traffic kept off it to the greatest extent possible.
Verify the infiltration paving dimensions and location on site before construction. Verify distances to foundations, septic systems, wells and utilities
Carefully excavate the area of the paving to prevent excessive compaction of the soils during the sub-grade preparation. All grading should be carried out using wide tracked equipment.
Once the sub-grade has been reached, place filter fabric on the bottom. The type of fabric should be specified on the approved plans. Once the fabric has been placed, place the reservoir course to the design depth. This course should be clean, washed stone having a void ratio between 30 and 40%. Lay the reservoir course in 300 mm lifts and lightly compact it. Spread aggregate uniformly.
Place the aggregate filter on the reservoir course using clean washed stone ranging in size from 10 -20 mm This stone provides a uniform base for the lattice course.
Never let sediments enter the infiltration paving construction area.
Lay the surface course. Fill the void areas of the lattice block with the appropriate specified material.
18.4.5 Ponds and wetlands
Most of the information on wet ponds is directed towards ponds where the normal pool of water is established by the construction of an embankment. Excavated ponds typically do not have the same safety concerns related to embankment failure. When constructing wet ponds, it is very important to regularly inspect for seepage through the embankment. Ponds with a normal pool of water develop a zone of saturation through the embankment, which can increase failure potential in the future. Concerns regarding this zone of saturation (frequently detailed on plans as the area below the phreatic line) are alleviated by good quality control during construction. Requiring, during design, safety features in the embankment that reduce the movement of water through the embankment, reduces the risk of a potential hazard. These safety features include anti-seep collars, diaphragms, core trenches and clay cores. These features are not visible once construction is completed. The responsible person must verify their construction and quality of construction during their installation. Failure to inspect these features at critical times may result in embankment failure in the future.

Page 310 Doc # 11854602
Detention or retention devices, which are normally dry, do not develop a zone of saturation (which results from standing water) and internal water seepage is not a critical concern.
Important inspection aspects related to design
When certain site conditions are encountered or where the design has an unusual aspect, it is important to keep in regular communication with the appropriate professional (geotechnical, structural, etc.) to avoid some common mistakes. Examples of items which should be discussed include:
Encountering sandy soils when building a wet pond designed with a normal pool of water when the plan does not specify a pond liner.
Stormwater inlets too near the intended outfall, thereby short-circuiting flow to the outlet. While this may be acceptable from a stormwater quantity perspective, the short-circuiting will reduce treatment and lessen water quality benefits.
Steep slopes into the pond with no slope breaks (benches) can increase the hazard potential and erosion of side slopes.
Failure to include on the plans essential components normally associated with ponds, such as anti-seep collars, trash protection for low flow pipes, service and emergency spillways.
Failure to include a draw down mechanism in wet ponds. Ponds having normal pools should have a means to draw the water level down should draining the pond become necessary. From a responsible person’s viewpoint, a wet detention pond without a draw down mechanism should be brought to the attention of the designer. Where groundwater provides the permanent water pool, a draw down mechanism won't be available. The responsible person should know the expected or design ground water elevations at a site, especially the seasonal high level. This information should be on the approved plans.

Doc # 11854602 Page 311
Important inspection aspects related to construction
This section highlights important things to inspect during the construction of ponds.
A major cause of pond failure is soil piping - water travelling along the outside of the service spillway. It generally occurs along an outlet pipe where water, which is under pressure from the depth of water in the pond, causes erosion of soil adjacent to the pipe. Erosion of this material causes the pond embankment to be weakened at that point and failure of the embankment results. This failure is much more likely to occur in wet detention ponds than in normally dry ones because they have a permanent pool of water next to the embankment. Water will soak into the embankment and seek a lower elevation. Failure potential can be prevented by proper installation of anti-seep collars or diaphragms, in conjunction with proper compaction of soils adjacent to the service spillway and collars or diaphragms.
The general minimum standards for construction work also apply to the construction of stormwater ponds. Does the construction comply with local material and equipment requirements for earthwork, concrete, other masonry, reinforcing steel, pipe, water gates, metal and woodwork?
Are interior and exterior side slopes no steeper than 2.5:1 (horizontal to vertical)? The reason most stormwater embankment ponds remain stable is that the mass of earth in the embankment is heavy enough to prevent slippage of material caused by water pressure on the upstream slope. Steep side slopes are not only more dangerous to the general public, but they also reduce the total mass of earth material in the embankment. This can increase the potential for embankment failure.
Vibratory compactor being used to compact material around the outlet pipe. Anti-seep collar
can be seen on the left side of the picture.

Page 312 Doc # 11854602
Are elevations relatively accurate and according to the approved plans? An
inspector should carry a simple Locke level to determine whether a given location is at proper elevation. The invert elevation of a service spillway must be lower than the elevation of the pond embankment or trouble can be expected. A Locke level provides a quick, moderately accurate, means to verify field implementation.
Are inlet and outlet areas stabilised to prevent erosion? Relying only on vegetative practices for stabilisation is generally inadequate since it takes time for the vegetation to become well established. Some form of additional stabilisation technique is generally necessary to protect soil until vegetation is established. This can include erosion control matting, riprap, gabions, and the like.
Are safety features provided? These may include the shallow bench surrounding the pond edge, barrier plantings to discourage approach by children, and/or fencing where required.
A sequence of construction must be established and followed. It is just as important that construction be undertaken in the correct order, as it is to have good quality construction. The sequence of construction includes pre-construction meetings, temporary erosion and sediment control, core trench, and so on.
Upon completion of construction, a final inspection should be performed. This inspection provides written documentation to the developer/contractor of the satisfactory completion of the facility. Depending on regional or local council requirements, this inspection augments the submission of an As-built plan.
18.4.6 Green roofs
Due to the lack of overall expertise in construction of green roofs, care must be taken with each phase of construction. The following items must be followed to ensure that construction problems are eliminated and long term performance is maximised.
The roof that is placed prior to installation of the waterproof membrane must be clean. All debris, nails, screws, stones, etc. must be removed and the overall roof must not have potential to puncture the lining.
As the green roof may have substantial weight, the structural integrity of the support system must be checked throughout the construction phase to ensure that there are no structural weaknesses that would cause a partial or full failure of the structural support.
Slope is an important element of the roof and construction shall ensure that the design slope is maintained and not increased.
The waterproof membrane must be of high quality and checked over carefully to ensure that there are no potential weak spots or rips that would compromise the
Doc # 11854602 Page 313
integrity of the membrane. When installing nails, screws or cutting implements must be kept off the roof.
If there are any pipes, vents, chimneys or flues that are in the green roof area, the waterproof membrane must be carefully placed around them and sealed to prevent these areas from becoming sources of leakage.
Once the waterproof membrane is installed, a water test should be undertaken where water can be pooled on the roof for approximately 24 hours to check for any leakage.
Regarding the drainage layer, ensure that there are no imperfections in the mat and where two mats abut each other, there should be a minimum of 100 mm overlap.
The substrate must be checked to ensure that it complies with the design specifications listed in Section 8.5.8. The method of getting the substrate onto the roof shall be discussed at the pre-construction meeting and shall receive council approval of the method.
Once the substrate is placed, foot traffic across it should be minimised to prevent compaction.
Planting shall be undertaken according to the design recommendations and shall be undertaken either from late autumn to early spring to improve propagation. If not undertaken during this time of year then irrigation will be necessary to ensure survival.
A good reference document for guidance on the construction of green roofs is Auckland Council’s ‘Construction of Stormwater Management Devices in the Auckland Region, TR2010/052’167.
18.4.7 Water tanks
There are five components to water tanks that are used for stormwater management purposes as listed below:
Gutters and downspouts
The tank itself
The pipe system that conveys water from the tank to site usage
An overflow conveyance for times when the tank is full, and
An outflow orifice when some portion of storage in the tank is used for detention of stormwater runoff.
As almost all tanks are pre-constructed and delivered to the site as a single unit, much of the water tank construction discussion will be on placement rather than on actual construction. The following items should be considered when a water tank is placed on the site:
How will the tank be placed at its desired location?
The location should consider trees and other vegetation that could impact on long term function of the tank.
The tank should be placed in a location where maintenance access can be easily provided.
The tank has to be placed on level ground and secured to the ground if there is potential for movement during high wind events.
If the tank is intended on being buried, any utilities should be located prior to placement of the tank and those utilities should be avoided. In addition, local
167 Auckland Regional Council, August 2010

Page 314 Doc # 11854602
seasonal groundwater levels should be determined to avoid any floatation concerns.
If a tank is to be buried the tanks structural integrity shall be verified for burial.
The design plans shall be consulted if the tank is being used for detention of runoff. The elevation and diameter of outlets from the tank must comply with the design.
The gutters and downspouts draining into the tank shall have protection to ensure that leaves or debris cannot get into the tank.
The tank shall have an access port that is easy to access for maintenance or for additional water delivery if domestic use is an issue.
If the tank delivery system can potentially have a cross-connection with a public water supply, appropriate plumbing will be required and will require a building consent under the Building Code.
All water tanks shall have an overflow means for times when the tank is full and additional stormwater cannot be accommodated. The overflow device shall be discharged in a non-erosive manner to an appropriate outfall.
18.4.8 Bush revegetation
Planting native bush can improve environmental outcomes while at the same time add value to property. Native bush can make a landscape more attractive, provide shade, shelter and habitat for wildlife and stabilise steep slopes. The following items are important to implement when planting native bush as a component of an overall stormwater management system:
The area where bush is to be planted should be staked to minimise potential for vehicle compaction of soils. If extensive site re-grading is done, the soils should be rehabilitated prior to planting.
If planting is being undertaken in an area that has pasture grasses, long grasses should be removed. It may be more effective to spray the area several weeks prior to planting.
Planting should be undertaken from mid-May through to September although in areas with heavy frosts, spring planting is preferable. Plants should be kept cool and moist until planting is done.
Planting should be undertaken according to a planting plan that has been prepared during the design phase.
Holes should be dug slightly larger and deeper than the size of the root-ball. If the soil is hard, dig the spade into the bottom of the hole several times to break up the soil. Position the tree in the hole so the stem is just below ground level to allow for approximately one centimetre of soil to be placed on top. Fill the hole with loose soil and press down with your foot.
In open field areas fertiliser should be composted into the bottom of the hole before planting.
Maintenance should be undertaken for several years after planting to reduce competition from weeds and grasses.
If there are possums or rabbits in the area, a pest control programme should be implemented to protect the plants.
18.4.9 Oil/water separators
Oil/water separators are prefabricated units that would arrive at the construction site in one piece. There are several key issues related to their proper installation as follows:

Doc # 11854602 Page 315
The sub-grades must be compacted to acceptable standards to prevent any uneven settlement of the separator, which would impact on performance.
The grades must be as shown on plans to ensure proper outfall to the downstream receiving system.
Final acceptance Final sign-off of a completed stormwater management device should only be undertaken when an As-Built plan of the device has been submitted, reviewed and the completed device accepted. The As-Built plan is vital to long-term operation as it forms the basis for the completed device and the level that will be re-established when maintenance is undertaken.
Inspection reports and construction notes It is a requirement that the stormwater management construction related information be retained in the project file. This is to ensure that this information can be referred to in the event that operational issues occur and historical information related to construction may be necessary to better understand why a given operational element has become a problem. This applies to unforeseen problems such as quality of materials or excess seepage out of a device, and does not apply to normal maintenance activities where contaminants are removed from a device, or mowing or plant maintenance is undertaken. It is also recommended that the site file contain a record of all stormwater management devices in terms of construction dates, type of device and any unforeseen problems that occurred during construction.
Construction inspection checklists Appendix A has an example of a pre-construction meeting checklist that can be used to ensure that all pertinent issues are discussed prior to initiation of construction. In addition, checklists have been included in Appendix A for stormwater management devices to ensure that inspections are undertaken at critical times during construction to maximise potential for effective function.

Page 316 Doc # 11854602
19 Operation and maintenance Introduction
Once construction has been completed the long-term assurance of adequate stormwater management device performance is initiated. Stormwater management devices are expected to perform their water quality and quantity management functions as long as the land use they serve exists. There are a number of reasons why this continued function is important, as follows:
Maintenance is necessary to ensure outcomes that the devices were constructed to achieve are, in fact, achieved,
Public safety may be compromised if maintenance is not undertaken, and
The stormwater management devices may be required by an RMA consent and the eventual property owner will have a legal obligation to ensure continued device function.
From a stormwater management context, failure to maintain stormwater management devices may result in the following impacts:
Increased discharge of contaminants downstream
Increased flooding downstream
Increased downstream stream channel instability
Potential loss of life or property, resulting from a device failure, and
Aesthetic or nuisance problems, such as mosquitoes.
All of these impacts may be avoided through proper and timely maintenance of stormwater management devices. The bottom line relating to implementation of stormwater management devices is that maintenance has to be assured or the device should not be built in the first place. The most common cause of stormwater management device failure is lack of maintenance. Good design and construction can reduce subsequent maintenance needs and costs but they cannot eliminate the need for maintenance. Maintenance will always be needed and will require a long-term commitment of resources and personnel to ensure it is undertaken. Stormwater management devices are effective at contaminant capture and this will necessitate maintenance to ensure continued function.

Doc # 11854602 Page 317
Inspection and maintenance There are two key elements to ensuring that stormwater management devices are maintained:
When devices are to be inspected, and
When maintenance needs to be accomplished. Both of these items are discussed in more detail to provide guidance.
19.2.1 Device inspection frequencies
Stormwater management devices need to be inspected on a routine basis to ensure that they are functioning adequately. The inspection needs to consider all of the device components, as they all are integral to performance. In terms of sensitivity of the individual devices to impaired performance the following discussion of each device provides a brief discussion of the principal reasons why performance deteriorates.
Swales and filter strips
Swales and filter strips are susceptible to impaired performance primarily as a result of excess sediment loadings smothering vegetation. Oils and greases can also be a serious concern as their entry could kill vegetation. These impacts can occur very quickly if large amounts of these contaminants are introduced in a short time frame. Another common cause of poor performance is the existence of concentrated flow in them. Their optimum performance depends on the maintenance of distributed flow. Concentrated flow will be ineffective at contaminant removal and could also cause erosion, which is contrary to their purpose.

Page 318 Doc # 11854602
Sand filters and rain gardens
Sand filters and rain gardens are very sensitive to excessive loadings of oil and grease, which can clog their surface. Sediments can also be a problem, especially New Zealand’s fine-grained sediments in the silt/clay category. Coarser sediments do not cause a significant reduction in permeability although they do fill the forebay of sand filters and may cause premature bypass of rain gardens by clogging inlet points.
Infiltration devices
Infiltration devices are very sensitive to impaired performance if excessive amounts of sediments or oils and greases are introduced into them. The greatest problem is clogging of soils in the sides and bottom or in the case of permeable paving surface clogging. This can occur fairly rapidly if inflow sediment loads are not reduced by pre-treatment devices. Other contaminants, which are attached to sediments, are not considered a clogging concern. Another problem is poor drainage as a result of high water table, groundwater mounding or a confining soil layer. Prolonged wetness encourages micro-organism growths that tend to clog soils.

Doc # 11854602 Page 319
Ponds and wetlands
One of the greatest benefits of stormwater management ponds and wetlands is their resilient performance even when excessive contaminant loads enter them. However, performance will suffer if sediment is introduced in large amounts over a lengthy time frame. Sediments reduce the volume of storage and reduce extended detention times, which ultimately reduce the pond or wetland’s contaminant reduction potential. This impaired function is not something that tends to occur dramatically in a short time period but rather occurs cumulatively over a longer time period if the incoming sediment load is consistently elevated. Another problem that ponds and wetlands have that other devices do not have to such an extent is maintenance problems associated with debris clogging inlets and outlet areas. While other devices can have visual issues related to debris, pond outlets can become blocked, especially the extended detention orifices. Clogging of these outfall orifices can cause significant adverse effects by elevating water in the pond or wetland and potentially killing the vegetation, increasing safety concerns and increasing the zone of saturation in the pond or wetland embankment.
Green roofs
Principal reasons why this device performance can deteriorate are the following:
Impermeable membrane failure due to leakage, puncture or UV deterioration
Excessive weed growth outcompeting planted growth
Ponding of water on flat roofs
Concentration of flows across the green roof causing scour and discharge at locations not designed for
Clogging of substrate, and
Plugged outlets.
Water tanks
Water tank function can be compromised mainly due to two reasons: 1. Inadequate water supply where demand exceeds supply, and 2. The tank outlets or downspouts become clogged due to excessive vegetative
entry into the tank from roof spouting. The issue where demand exceeds supply is generally an issue during summer months and usage should be monitored during this period. Clogging of tank outlets or downspouts can be reduced if filtering systems are placed in the gutters to prevent discharge of leafy material into the system.
Bush revegetation
Long term establishment and propagation of plants is mainly a concern over the first 5 10 years but within that timeframe there can be a concern due to predation by possums or rabbits. They can eat new plants and attack leafy growth on established plants.
Sediment forebay clogged with sediment and needing to be cleaned
out
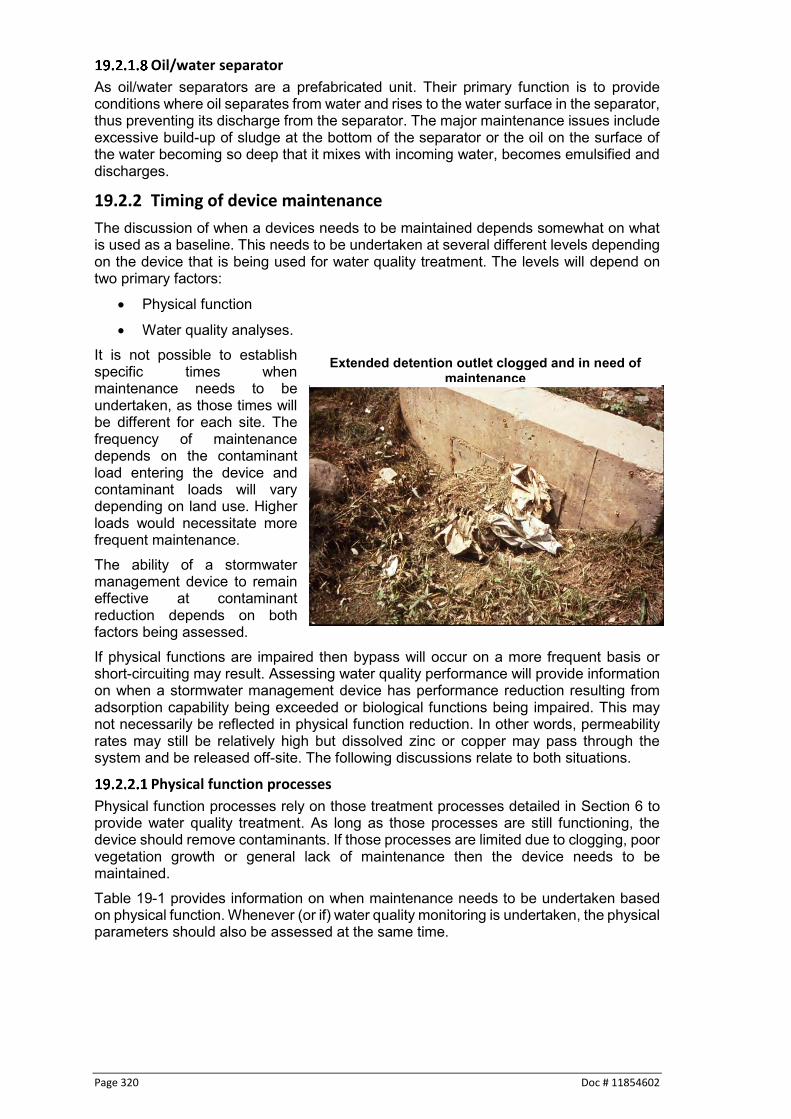
Page 320 Doc # 11854602
Oil/water separator
As oil/water separators are a prefabricated unit. Their primary function is to provide conditions where oil separates from water and rises to the water surface in the separator, thus preventing its discharge from the separator. The major maintenance issues include excessive build-up of sludge at the bottom of the separator or the oil on the surface of the water becoming so deep that it mixes with incoming water, becomes emulsified and discharges.
19.2.2 Timing of device maintenance
The discussion of when a devices needs to be maintained depends somewhat on what is used as a baseline. This needs to be undertaken at several different levels depending on the device that is being used for water quality treatment. The levels will depend on two primary factors:
Physical function
Water quality analyses. It is not possible to establish specific times when maintenance needs to be undertaken, as those times will be different for each site. The frequency of maintenance depends on the contaminant load entering the device and contaminant loads will vary depending on land use. Higher loads would necessitate more frequent maintenance. The ability of a stormwater management device to remain effective at contaminant reduction depends on both factors being assessed. If physical functions are impaired then bypass will occur on a more frequent basis or short-circuiting may result. Assessing water quality performance will provide information on when a stormwater management device has performance reduction resulting from adsorption capability being exceeded or biological functions being impaired. This may not necessarily be reflected in physical function reduction. In other words, permeability rates may still be relatively high but dissolved zinc or copper may pass through the system and be released off-site. The following discussions relate to both situations.
Physical function processes
Physical function processes rely on those treatment processes detailed in Section 6 to provide water quality treatment. As long as those processes are still functioning, the device should remove contaminants. If those processes are limited due to clogging, poor vegetation growth or general lack of maintenance then the device needs to be maintained. Table 19-1 provides information on when maintenance needs to be undertaken based on physical function. Whenever (or if) water quality monitoring is undertaken, the physical parameters should also be assessed at the same time.
Extended detention outlet clogged and in need of maintenance
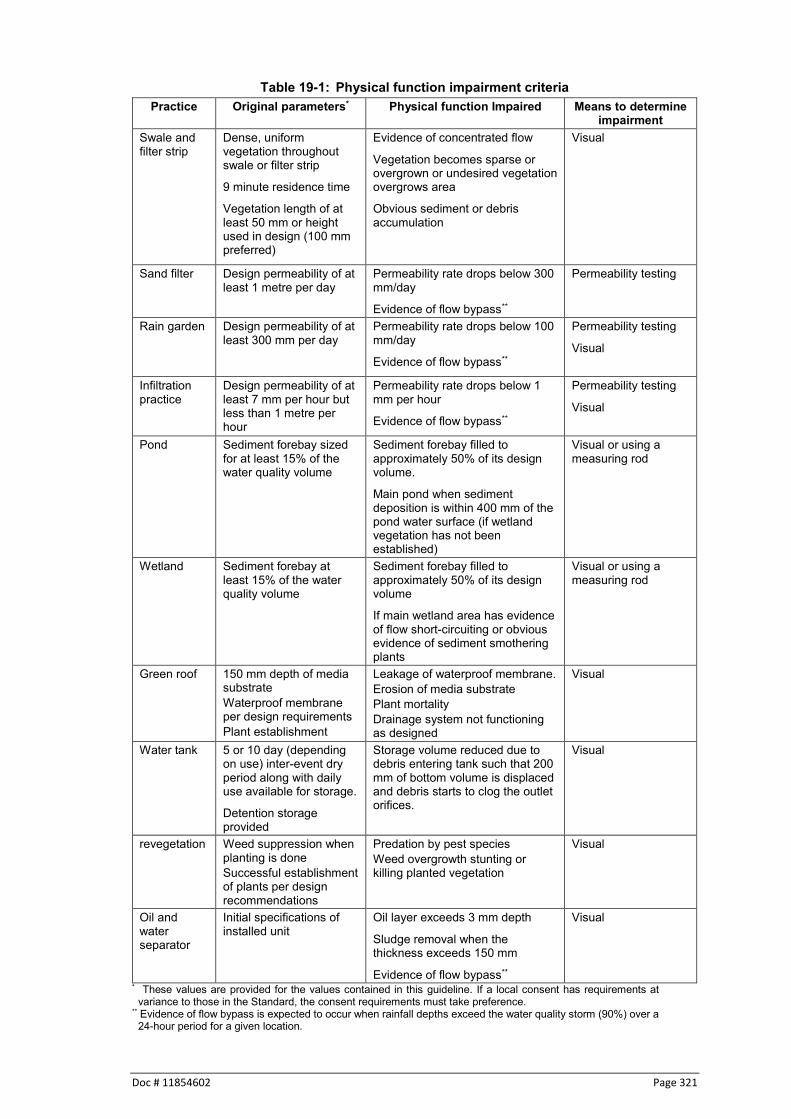
Doc # 11854602 Page 321
Table 19-1: Physical function impairment criteria
Practice Original parameters* Physical function Impaired Means to determine impairment
Swale and filter strip
Dense, uniform vegetation throughout swale or filter strip
9 minute residence time
Vegetation length of at least 50 mm or height used in design (100 mm preferred)
Evidence of concentrated flow
Vegetation becomes sparse or overgrown or undesired vegetation overgrows area
Obvious sediment or debris accumulation
Visual
Sand filter Design permeability of at least 1 metre per day
Permeability rate drops below 300 mm/day
Evidence of flow bypass**
Permeability testing
Rain garden Design permeability of at least 300 mm per day
Permeability rate drops below 100 mm/day
Evidence of flow bypass**
Permeability testing
Visual
Infiltration practice
Design permeability of at least 7 mm per hour but less than 1 metre per hour
Permeability rate drops below 1 mm per hour
Evidence of flow bypass**
Permeability testing
Visual
Pond Sediment forebay sized for at least 15% of the water quality volume
Sediment forebay filled to approximately 50% of its design volume.
Main pond when sediment deposition is within 400 mm of the pond water surface (if wetland vegetation has not been established)
Visual or using a measuring rod
Wetland Sediment forebay at least 15% of the water quality volume
Sediment forebay filled to approximately 50% of its design volume
If main wetland area has evidence of flow short-circuiting or obvious evidence of sediment smothering plants
Visual or using a measuring rod
Green roof 150 mm depth of media substrate Waterproof membrane per design requirements Plant establishment
Leakage of waterproof membrane. Erosion of media substrate Plant mortality Drainage system not functioning as designed
Visual
Water tank 5 or 10 day (depending on use) inter-event dry period along with daily use available for storage.
Detention storage provided
Storage volume reduced due to debris entering tank such that 200 mm of bottom volume is displaced and debris starts to clog the outlet orifices.
Visual
revegetation Weed suppression when planting is done Successful establishment of plants per design recommendations
Predation by pest species Weed overgrowth stunting or killing planted vegetation
Visual
Oil and water separator
Initial specifications of installed unit
Oil layer exceeds 3 mm depth
Sludge removal when the thickness exceeds 150 mm
Evidence of flow bypass**
Visual
* These values are provided for the values contained in this guideline. If a local consent has requirements at variance to those in the Standard, the consent requirements must take preference.
** Evidence of flow bypass is expected to occur when rainfall depths exceed the water quality storm (90%) over a 24-hour period for a given location.

Page 322 Doc # 11854602
As can be seen from the sand filter, rain garden and infiltration devices a good barometer of performance would be actual permeability testing. In this situation, the site inspection equipment should include an auger, a hollow pipe and several litres of water. Performance of those devices cannot be determined through visual inspection during dry weather. Information gathered visually is indicative only.
Chemical function processes
Considering chemical function means taking and evaluating water quality samples to determine or verify performance of stormwater management devices. There may be situations where chemical monitoring is to be pursued due to a consent requirement, particularly on an industrial consent. This might be where there is a need to determine when the stormwater device has provided all of the storage that it can for a given contaminant and maintenance needs to be undertaken. If meeting effluent limits is a consent requirement it is assumed that taking grab samples rather than the use of continuous sampling will be the method of sampling. Grab sampling is low cost and tends not to be very representative because of the temporal and spatial variability usually associated with urban water resources and stormwater runoff. As such the results obtained cannot be considered terribly accurate and should be used from a relative context rather than as an absolute measure of performance. Regardless, the information obtained from this type of approach can provide good information for device maintenance frequency. The water quality monitoring should also include a visual examination of the stormwater discharge. Visual examinations provide a simple and inexpensive means of obtaining a rough assessment of stormwater quality. The visual examination is of the stormwater sample collected to note the following:
Any colour
Odour
Clarity
Floating solids
Settled solids
Suspended solids
Foam
Oil sheen, and
Any other indicators of possible stormwater pollution. This approach to monitoring is to assess performance of stormwater treatment devices. If there are more than two devices on a given site, the consent holder may consider monitoring only one device discharge if it is believed that the discharges from the different devices would have substantially identical effluents. Monitoring should be undertaken twice a year for up to three years to provide data on performance to determine maintenance intervals. Once a maintenance frequency is determined by the monitoring, the monitoring can be reduced or eliminated until a change in site condition or a consent requirement would require otherwise. Key points include the following items:
Grab samples are the common method for sample collection
Storm sampled should be greater than 5 mm of rainfall
An inter-event dry period of at least 72 hours before monitoring
Two samples should be collected: the first within 30 minutes of discharge commencement, and the second one approximately 60 minutes after discharge commencement, and

Doc # 11854602 Page 323
Visually examine the sample. Monitoring protocols shall be approved by Waikato Regional Council prior to initiation.
Summary of maintenance criteria
In terms of when device maintenance needs to be performed, there are two measures that determine when maintenance needs to be undertaken:
1. Maintenance needs to be undertaken when physical functions are impaired. This is an obvious requirement. Regardless of the water quality issues, impairment will cause a device to bypass, which will prevent proper water quality function. The parameters detailed in Table 18-1 provide criteria for when stormwater management device maintenance needs to be undertaken.
2. Water quality issues This measure can be considered from two different contexts: a) The discharge violates a consent condition or a water quality standard
referred to in a consent such as the ANZECC Guidelines This is a difficult criterion to consider for a number of reasons:
Having to relate the discharge to downstream effects
Concentrations will be related to the size of the storm. A larger storm will have lower event mean contaminant concentrations than a smaller one.
Grab samples can only be indicative at best. To attempt to use the results of two grab samples (reference and subsequent) for an indication of maintenance need would be difficult and longer-term monitoring would provide better, more accurate results.
It is important to understand the complexities of undertaking monitoring by using effluent standards. While mentioning the difficulties of going with an effluent limits approach, the U.S. EPA uses that approach for monitoring compliance with National Pollutant Discharge Elimination Standards (NPDES). The problems mentioned above exist in the U.S. but they have gone down this track, which was founded in point source industrial discharges over 30 years ago. They took that well-founded approach and have adapted it to stormwater discharges even though there are difficulties with that.
b) The quality of the discharge is significantly at variance to grab samples taken shortly after a given device is completed. The rationale behind this approach is to determine when various parameters indicate that the ability of a device to capture contaminant loads has been reduced. The following recommendations are made for use in implementation.
1. The monitoring programme would identify the contaminants of greatest concern for the site, the functional impairment issues and how testing of contaminant and function will be done.
2. Two initial grab samples are taken according to when it is suitable to take the samples as per what is outlined in Table 19-2.

Page 324 Doc # 11854602
Table 19-2: Initial monitoring timeframes for stormwater devices Device or practice Initial monitoring and recommendation Swale and filter strip 3 months after construction Sand filter 1 month after completion Rain garden 2 months after completion and site
stabilisation Infiltration device 1 month after completion Pond 90% pond perimeter stabilised Wetland 1 year after construction Green roof No monitoring necessary Water tank No monitoring necessary Revegetation No monitoring necessary Oil and water separator Immediately
3. Subsequent sampling and the storm rainfall information should be
taken approximately 6 months apart to provide an indication of device performance. Being taken twice a year, the sampling would provide an indication of declining performance or whether a threshold has been passed that would indicate maintenance needs.
4. Physical function impairment should also be assessed at the same time that grab samples are taken.
5. The water quality monitoring is to determine if maintenance is needed. If at any time, metals or sediment results are more than a magnitude greater than the reference condition, maintenance needs to be accomplished. The results indicate a need for maintenance and the monitoring time frame assists in determining when future maintenance may need to be accomplished.
6. If physical function is significantly impaired (per Table 18-1) and by-pass may occur, the maintenance contractor has to be notified and provided with a time frame for when maintenance needs to be accomplished.
7. Results of the functional basis analyses and water quality sampling shall be documented. That documentation shall include the following:
Results of functional basis analyses
Water quality monitoring results
Any maintenance activities undertaken during the time
Recommendations for maintenance for subsequent years. Where there is an existing land use having an existing water quality standard as a consent requirement, it will not be possible to have initial monitoring results to use as a barometer for establishing subsequent maintenance frequency. How to address those situations will depend on a number of issues including:
1. Whether there is an existing consent for the site 2. Whether the existing consent requires water quality monitoring and for what
purpose. 3. To what extent the stormwater management device treats contaminants of
greatest concern. The same issue exists for this situation as the new sites in the context of BPO versus water quality standards. If there is an existing consent, the consent has to be reviewed to assess the stormwater management device’s appropriateness for the site, whether

Doc # 11854602 Page 325
there are water quality parameters and limits that have been imposed and what obligations the property owner has for maintenance. These values do not relate to ANZECC guidelines or any other standard. In terms of other contaminants those values can be provided if desired. They are selected only as being representative values to determine that a stormwater management device performance is clearly impeded and maintenance needs to be accomplished. It is not recommended to go any further with recommendations due to the variability and inaccuracies associated with a grab sample approach. If greater accuracy were needed then a different, more comprehensive monitoring approach would have to be pursued. The advantage of the grab sample approach is that it is inexpensive, can be undertaken by any individual with some direction and can be used for making general recommendations for maintenance.
Documenting inspection and maintenance Device tracking and recording of information are important components of the maintenance of stormwater management devices. It is important that site operators or owners track maintenance by use of a database. This would allow inspectors to know what devices need to be inspected when, when maintenance was last accomplished and when additional maintenance may be needed.
The data should include identification numbers for each device, the type of device and its location, special maintenance needs and data from previous inspections including any functional or chemical monitoring that is done. The approach would then identify maintenance timeframes. This approach would assist in assuring that problems are corrected in the order of risk that they pose. It would ensure that no devices “fall through the cracks” in terms of inspection frequency and maintenance. Tracking of when a device was last inspected and the device’s status should never rely on the memory of any one individual.
Prioritising maintenance tasks Maintenance can be broken down into three types and are listed in a declining order of priority:
Corrective maintenance
Preventive maintenance, and
Aesthetic maintenance
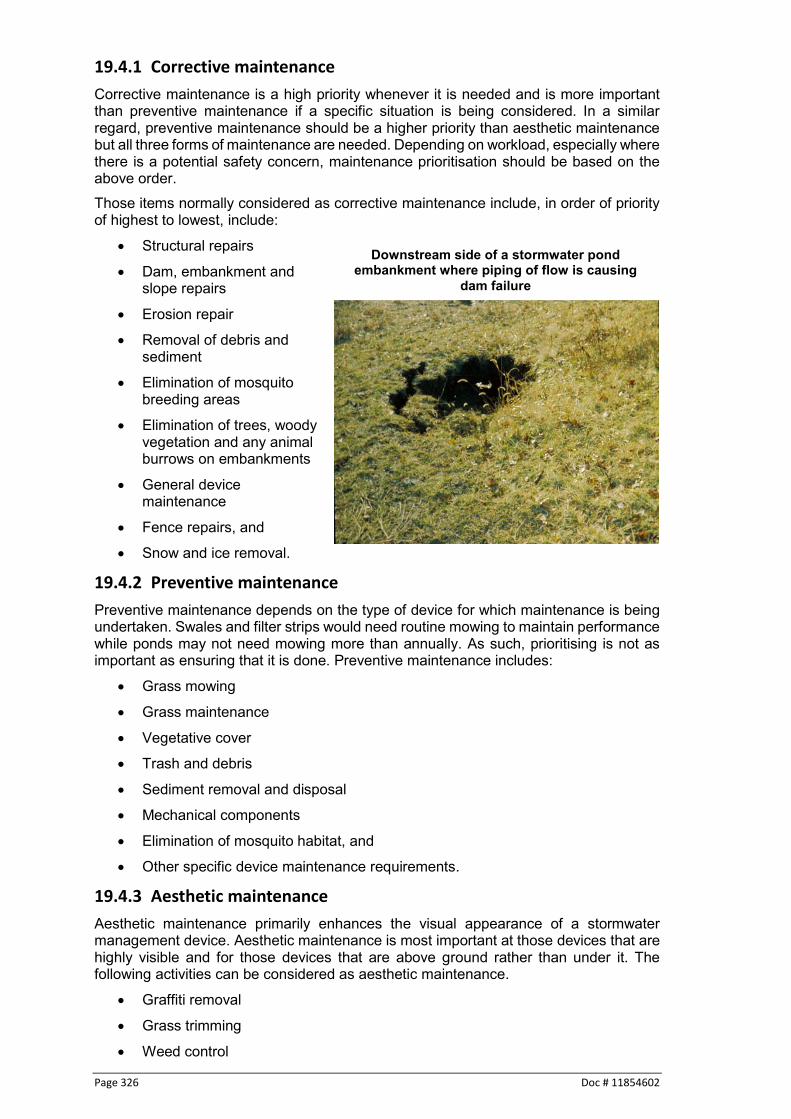
Page 326 Doc # 11854602
19.4.1 Corrective maintenance
Corrective maintenance is a high priority whenever it is needed and is more important than preventive maintenance if a specific situation is being considered. In a similar regard, preventive maintenance should be a higher priority than aesthetic maintenance but all three forms of maintenance are needed. Depending on workload, especially where there is a potential safety concern, maintenance prioritisation should be based on the above order. Those items normally considered as corrective maintenance include, in order of priority of highest to lowest, include:
Structural repairs
Dam, embankment and slope repairs
Erosion repair
Removal of debris and sediment
Elimination of mosquito breeding areas
Elimination of trees, woody vegetation and any animal burrows on embankments
General device maintenance
Fence repairs, and
Snow and ice removal.
19.4.2 Preventive maintenance
Preventive maintenance depends on the type of device for which maintenance is being undertaken. Swales and filter strips would need routine mowing to maintain performance while ponds may not need mowing more than annually. As such, prioritising is not as important as ensuring that it is done. Preventive maintenance includes:
Grass mowing
Grass maintenance
Vegetative cover
Trash and debris
Sediment removal and disposal
Mechanical components
Elimination of mosquito habitat, and
Other specific device maintenance requirements.
19.4.3 Aesthetic maintenance
Aesthetic maintenance primarily enhances the visual appearance of a stormwater management device. Aesthetic maintenance is most important at those devices that are highly visible and for those devices that are above ground rather than under it. The following activities can be considered as aesthetic maintenance.
Graffiti removal
Grass trimming
Weed control
Downstream side of a stormwater pond embankment where piping of flow is causing
dam failure

Doc # 11854602 Page 327
Debris removal, and
Miscellaneous items such as painting, tree pruning, leaf removal.
Disposal of removed contaminants Inspections determine when contaminant removal is needed for each stormwater management device. When contaminant removal is undertaken the sediments or water removed from the individual devices cannot be considered as clean and must be taken to a landfill or a designated contaminant disposal site. Internationally, data has been collected to document contaminant levels that may exist in stormwater device sediments. Most of the information relates to concentrations of heavy metals and nutrients in sediments but not much data exists on organic contaminants such as petroleum hydrocarbons. Table 19-3 summarises the concentrations of heavy metals in stormwater sediments from different types of devices serving a variety of land uses, while Table 19-4 summarises the concentrations of heavy metals in the sediments of stormwater devices serving different land uses. The data in both tables is for surficial sediments (the top 25 mm). Five of the sites also included data from different layers of the stormwater sediments. The concentrations of heavy metals were highest in surficial layers, but diminished rapidly within the top 200 mm of sediments. Table 19-3: Heavy metal concentrations in sediments from stormwater devices168
Stormwater practice
Number of observations/site
Concentration (mg/kg) Cd Cr Cu Ni Pb Zn
Wet pond 430/21 3.6 83.3 25.6 13.1 227 150 Swale 9/3 5.5 69.7 89.5 35.6 1060 497.3
Infiltration trench
2/1 3 14.5 8 NA 80 80
Table 19-4: Heavy metal concentrations from stormwater devices serving various land
uses168 Land Use Number of
Observations/site
Concentration (mg/kg) Cd Cr Cu Ni Pb Zn
Single family
residential
75/3
2.1
17.4
9.1
8
29.2
29.9
Multi family residential
15/1
1.2
3.2
21.2
7.2
32
22.2
Commercial 17/4 2.3 14.2 26.3 6.4 110.2 150.9 Mixed
commercial and
residential
57/3
2.7
14.8
26.1
4
351.6
176.1
Highways 313/14 5.7 51.3 54 26.1 676.8 298.4 As can be seen from the reported contaminant levels in these two tables, the sediment removed from stormwater devices is not clean. Sediments removed from stormwater devices should be taken to landfills. If local councils have guidelines that meet or exceed those presented above, there is no requirement to only go by the information presented in this section.
168 Livingstone et al, 1995

Page 328 Doc # 11854602
Safety issues The importance of safety when conducting maintenance inspections needs to be stressed. Often a single individual will inspect stormwater management devices and their safety must be considered the highest priority when undertaking inspections or when maintenance is being undertaken. Safety concerns during inspections are common sense. Possible concerns can include:
Looking out for holes. Holes can indicate a serious problem or just provide an opportunity to twist an ankle but an inspector must always look where they walk.
Use caution opening manholes or other structural covers. They can be very heavy can slip and cause serious injury. In addition they are heavy and improper handling can cause back pain.
Never enter a confined space unless proper certification has been obtained.
Do not enter pipes or conduits, even with others present, if there is concern about the pipes structural integrity.
Be careful of steep slopes or entering water where the depth is unknown.
Take care around nails, broken glass, needles or sharp objects. Always wear safety shoes.
Gloves should be worn when handling mechanical or structural parts.
Always wash hands after an inspection.
In areas of poor ventilation don’t light matches, lighters or cigarettes until venting has occurred.
Always be careful. Roads can be dangerous and care must be taken to be well away from traffic.
Always wear safety equipment.
Inspection reports and operational notes Stormwater management inspection documentation, monitoring analyses and file information must be located and maintained in an area on-site for commercial or industrial sites and be readily available for council to review. Location of maintenance information for residential properties must be located in a well-documented location either at a council office or at a body corporate location known by council.
As-built certification Appendix A has a form that can be completed (when required) for certification that construction of stormwater management devices was undertaken according to the approved design.
Manhole cover removal can be dangerous to hands or feet

Doc # 11854602 Page 329
This form includes checking on the various stages of construction along with photo documentation. This certification further ensures that stormwater management devices will function as designed and reduce potential maintenance issues. The last items in Appendix A are forms that can be used for maintenance inspections to ensure that all pertinent elements of a given device are checked for continued functionality and performance.

Page 330 Doc # 11854602
References Allibone R, Horrox J, Parkyn S 2001. Stream classification and instream objectives for
Auckland’s urban streams. National Institute of Water and Atmospheric Research client Report for Auckland Regional Council, ARC00257.
ANZECC 2000. National water quality strategy: Australian and New Zealand guidelines for fresh and marine water quality. Canberra, Australian and New Zealand Environment and Conservation Council and Agriculture and Resources Management Council of Australia and New Zealand.
Auckland Regional Council 1999. Environmental operations plan booklet. Auckland, Auckland Regional Council.
Auckland Regional Council 1999. Guidelines for stormwater runoff modelling in the Auckland Region. Technical Publication Number 108. Auckland, Auckland Regional Council.
Auckland Regional Council 2000. Low impact design manual for the Auckland Region. Technical Publication 124. Auckland, Auckland Regional Council.
Auckland Regional Council 2003. Stormwater management devices: Design guidelines manual. 2nd ed. Technical Publication Number 10. Auckland, Auckland Regional Council.
Auckland Regional Council 2004. Blueprint for monitoring urban receiving environments. Rev. ed. Technical Publication No. 168. Auckland, Auckland Regional Council.
Auckland Regional Council 2010. Development of the contaminant load model. Auckland Regional Council Technical Report 2010/004. Auckland, Auckland Regional Council.
Baginska B, Lu Y, Pritchard T 2005 (Modified in 2012). Modelling nutrient loads to better manage impacts of urbanisation in Tweed Catchment, New South Wales, Australia. Water & Catchments Science Section. Department of Environment & Conservation. Sydney, Dept. of Environment & Conservation.
Bay of Plenty Regional Council 2012. Stormwater management guidelines for the Bay of Plenty Region. Bay of Plenty guideline 2012/01. Whakatane, Bay of Plenty Regional Council.
Beca Carter Hollings & Ferner 2001. Stream erosion: A hydrological basis for management. Prepared for Auckland Regional Council.
Beca Carter Hollings & Ferner 2014. Flat Bush catchment management implementation plan. Version A6. Prepared for Manukau City.
Black P 1980. Water quality patterns during a storm on a mall parking lot. Water Resources Bulletin 16, 4, 615.
Buchanan K, Clarke C, Voyde E 2013. Hydraulic energy management: inlet and outlet design for treatment devices. Prepared by Morphum Environmental for Auckland Council. Auckland Council Technical Report TR2013/018.
California Stormwater Quality Association 2003. California stormwater best management practice handbook: New development and redevelopment. Menlo Park, Calif. California Stormwater Quality Association.

Doc # 11854602 Page 331
Cappiella K, Fraley-McNeal L, Novotney M, Schueler T 2008. The next generation of stormwater wetlands. Wetlands & Watersheds Article #5. Prepared for Office of Wetlands, Oceans and Watersheds, U.S. EPA.
Carr DW 1999. An assessment of an in-line alum injection facility used to treat stormwater runoff in Pinellas County, Florida. Sixth Biennial Stormwater Research & Watershed Management Conference.
Center for Watershed Protection 2001. The practice of watershed protection. Ellicott City, Maryland, Center for Watershed Protection.
Center for Watershed Protection 2003. Impacts of impervious cover on aquatic systems. Ellicott City, Maryland, Center for Watershed Protection.
Chow VT 1959. Open channel hydraulics. New York, McGraw-Hill.
Christchurch City Council 2003. Waterways, wetlands and drainage Guide, Part B: Design. Christchurch, Christchurch City Council.
City of Portland 2000. Stormwater management manual: Adopted 1 July, 1999. Revised 1 September, 2000. Portland, City of Portland.
Clar ML, Barfield BJ 2004. Stormwater best management practice design guide, volume 1: General considerations. EPA-600/R-04/121. Washington DC, United States Environmental Protection Agency.
Clearwater S, Valler T 2012. Contaminants in Hamilton’s urban stream sediments and ecotoxicity to amphipods. National Institute of Water and Atmospheric Research. Prepared for Waikato Regional Council. Document #2275458.
Collier K, Kelly J 2006. Patterns and trends in the ecological condition of Waikato Streams based on the monitoring of aquatic invertebrates from 1994 to 2005. Environment Waikato Technical Report 2006/04. Hamilton, Waikato Regional Council (Environment Waikato).
Collier K, Clements B, David B, Lake M, Leathwick J 2010. Significant natural areas of the Waikato Region: streams and rivers. Environment Waikato Technical Report 2010/19. Hamilton, Waikato Regional Council (Environment Waikato).
Cunningham A, Colibaba A, Hellberg B, Silyn Roberts G, Symcock R, Vigar N, Woortman W 2017. Stormwater management devices in the Auckland region. Auckland Council guideline document, GD2017/01.
Davis ROE, Bennett HH 1927. Grouping of soils on the basis of mechanical analysis. United States Department of Agriculture. Departmental Circulation No. 419.
Delaware Department of Natural Resources and Environmental Control. Date unknown. Delaware erosion and sediment control handbook for development. Dover, Delaware, Dept. of Natural Resources and Environmental Control.
Delaware Department of Natural Resources and Environmental Control 1997. Conservation design for stormwater management: A joint effort between DNREC and the Environmental Management Center of the Brandywine Conservancy. Dover, Delaware, Dept. of Natural Resources and Environmental Control.
Department of Building and Housing 2003. Compliance document for New Zealand Building Code. Clause E1 Surface Water. Reprinted September 2003. Wellington, Dept. of Building and Housing.

Page 332 Doc # 11854602
Ding Y, Dresnack R, Chan PC 1999. Assessment of high-rate sedimentation processes: Microcarrier weighted coagulation jar tests. Prepared for the U.S. EPA. Contract number 7C-R364-NAFX. New Jersey, U.S.A.
Ecology 2016. Stormwater treatment technologies approved through TAPE and CTAPE, http://ecy.wa.gov/programs/wq/stormwater/newtech/technologies.html [accessed June 2017]
Edwards T, de Winton M, Clayton J 2009. Assessment of the ecological condition of lakes in the Waikato Region using LakeSPI – 2009. National Institute of Water and Atomospheric Research. Client report for Waikato Regional Council (Environment Waikato). Document #1506213.
Elliott S, Sorrell B 2002. Lake managers’ handbook: Land-water interactions. Prepared for the Ministry for the Environment. ME number 442. Wellington, Ministry for the Environment.
Environment Waikato (Waikato Regional Council) 2008. The health of the Waikato River and catchment: Information for the Guardians Establishment Committee. Hamilton, Environment Waikato.
Facility for Advancing Water Biofiltration 2008. Fawb-day1-performance. http://www.monash.edu.au/fawb/products/fawb-day1-performance.pdf. [accessed June 2017]
Facility for Advancing Water Biofiltration 2008. Guidelines for soil media in bioretention systems. Version 2.01. Clayton, Vic., Monash University.
Fassman-Beck E, Simcock R 2013. Living roof review and design recommendations for stormwater management. Prepared by Auckland UniServices for Auckland Council. Auckland Council Technical Report TR2013/045.
Fletcher T, Duncan H, Lloyd S, Poelsma P 2004. Stormwater flow and quality and effectiveness of stormwater treatment measures. CRC for Catchment Hydrology. Melbourne, Monash University.
Fortier S 1926. Maximum permissible velocities recommended and the corresponding unit-tractive force values. Recommended for use in 1926 by the Special Committee on Irrigation Research of the American Society of Civil Engineers.
Fortier S, Scobey FC 1926. Permissible canal velocities. Transactions of the American Society of Civil Engineers, v. 89, Paper no. 1588, p. 940-984
Geological and Nuclear Sciences 2007. Groundwater quality in New Zealand: State and trends 1995 – 2006. Published by the Ministry for the Environment, Publication number: ME 831August 2007. Wellington, Ministry for the Environment.
Hawke’s Bay Regional Council 2009. Guidelines for waterways: Industrial stormwater design guidelines for the Hawke’s Bay Region. Technical Guidelines M08/13 related to Guidelines for Waterways. Napier, Hawke’s Bay Regional Council.
Hawke’s Bay Regional Council 2009. Industrial stormwater design guidelines for the Hawke’s Bay Region, Technical Guidelines AM08/13 related to Guidelines for Waterways. Napier, Hawke’s Bay Regional Council.
Herald JR 1989. Hydrological impacts of urban development in the Albany Basin, Auckland, A thesis presented in fulfilment of requirements for the degree of Doctor of Philosophy in Geography. Department of Geography. University of Auckland.

Doc # 11854602 Page 333
Hoey J, Girts M 2000. Technical memorandum: Stormwater management cost Information. Prepared for Washington Stormwater Policy Advisory Committee.
Horner RR, Skupien J, Livingston E, Shaver E 1994. Fundamentals of urban runoff management: Technical and institutional issues. Terrene Institute in cooperation with the U.S. Environmental Protection Agency. Washington, D.C., Terrene Institute.
Horner RR, May CW 1999. Regional study supports natural land protection as leading best management practice for maintaining stream ecological integrity, Comprehensive Stormwater and Aquatic Ecosystem Management. First South Pacific Conference.
Ira SJT, Roa A, Carter R 2016. Understanding and determining the cost of long term maintenance and resilience of WSD. Conference paper at Water New Zealand’s Stormwater Conference 2016.
Jenkins B, Vant B 2007. Potential for reducing the nutrient loads from the catchments of shallow lakes in the Waikato Region. Prepared for Waikato Regional Council (Environment Waikato). Document #1077213.
Jowett I G, Elliott A 2005. Cohesive sediment design parameters for Auckland streams. Prepared for the Auckland Regional Council. NIWA Client Report.
Julian JP, Torres R 2006. Hydraulic erosion of cohesive riverbanks. Department of Geological Sciences, University of South Carolina. Geomorphology 76 (2006) 193-206.
Kadlec RH, Knight RL 1996. Treatment wetlands. Boca Raton, Florida, CRC Press.
Kennedy P 2003. The effects of road transport on freshwater and marine ecosystems. Wellington, Ministry of Transport (June 1999 and updated October 2003).
Kingett Mitchell Ltd, Diffuse Sources Ltd 2003. A study of roof runoff quality in Auckland New Zealand: Implications for stormwater management. Auckland Regional Council technical publication 213. Auckland, Auckland Regional Council.
Koh S 2016. Average days between rains per month. Personal communication dated 12 August 2016. Waikato Regional Council staff member.
Larcombe M 2002. Design for vegetated wetlands for the treatment of urban stormwater: A monitoring report. Prepared for the Auckland Regional Council.
Larcombe M 2003. Removal of stormwater contaminants using grass swales. Prepared for the Auckland Regional Council.
Lawless JV, Lovelock BG 2001. New Zealand's geothermal resource base. New Zealand Geothermal Association Seminar, Taupo. New Zealand Geothermal Association.
Lewis M, Simcock R, Davidson G, Bull L 2010. Landscape and ecology values within stormwater management. Prepared by Boffa Miskell for Auckland Regional Council. Auckland Regional Council Technical Report TR2009/083. Auckland, Auckland Regional Council.
Livingston EH, Cox JH 1995. Stormwater sediments: Hazardous waste or dirty dirt? Proceedings of the 4th Biennial Stormwater Research Conference, South West Florida Water Management District.

Page 334 Doc # 11854602
Maryland Department of Natural Resources 1982. The effects of alternative stormwater management design policy on detention basins. Baltimore, Maryland, Maryland Department of Natural Resources.
Maryland Department of Natural Resources 1984. Standards and specifications for infiltration practices. Water Resources Administration. Baltimore, Maryland, Maryland Department of Natural Resources.
Maryland Department of the Environment 2000. Maryland stormwater design manual, Volumes I & II. Baltimore, Maryland, Maryland Dept. of the Environment.
Maxted JR, McCready CH, Scarsbrook MR 2005. Effects of small ponds on stream water quality and macroinvertebrate communities. New Zealand Journal of Marine and Freshwater Research 39: 1069-1084.
Mazer G, Booth D, Ewing K 2001. Limitations to vegetation establishment and growth in biofiltration swales. Ecological Engineering 17 (4): 429-443.
McCuen RH, Moglen GE, Kistler EW, Simpson PC 1987. Policy guidelines for controlling stream channel erosion with detention basins. College Part, Maryland, Dept of Civil Engineering, University of Maryland.
McCuen RH 1989. Hydrologic analysis and design. 2nd ed. Englewood Cliffs, N.J, Prentice-Hall.
McDowall RM 1990. New Zealand freshwater fishes: A natural history and guide. Rev. ed. Auckland, Heinemann Reed / MAF Publishing Group.
McIntosh J 2004. Assessment of nutrient reduction treatments (Forest Research and URS). Report to the Regulation & Monitoring Committee, meeting of 23 November 2004.
Ministry for the Environment 1998. Environmental guidelines for water discharges from petroleum industry sites in New Zealand. Prepared for a Joint Working Group of the Ministry for the Environment, local authorities and petroleum marketing companies. Wellington, Ministry for the Environment.
Ministry for the Environment 2010. Tools for estimating the effects of climate change on flood flows: A guidance manual for local government in New Zealand. Wellington, Ministry for the Environment.
Ministry of Works and Development 1978. Culvert manual, volume 1. Civil Division Publication CDP 706/A. Wellington, Ministry of Works and Development.
Minton GR 2002. Stormwater treatment: Biological, chemical and engineering principles. Resource Planning Associates.
Minton GR 2006. Treatment trains, don’t get run over. Stormwater Journal for Surface Water Quality Professionals, July/August.
Mitchell C 1996. Pollutant removal mechanisms in artificial wetlands. Course notes for the 1996 International Water Environmental School. Gold Coast, Australia.
Municipality of Metropolitan Seattle 1992. Biofiltration swale performance, recommendations and design considerations. Water Pollution Control Department. Publication 657. Seattle, Municipality of Metropolitan Seattle.
New York State Department of Environmental Conservation 2003 (modified in 2008). New York State Stormwater Management Design Manual, Appendix A.

Doc # 11854602 Page 335
Calculating Urban Stormwater Loads. Albany, NY, State Dept. of Environmental Conservation.
New Zealand Transport Agency 2010. Stormwater treatment standard for state highway Infrastructure. Wellington, New Zealand Transport Agency.
New Zealand Water Environment Research Foundation 2004. On-site stormwater management guideline. Wellington, NZ Water Environment Research Foundation.
NIWA 1995. A guide to probable maximum precipitation in New Zealand. Science and Technology Series No. 19. Wellington, National Institute of Water & Atmospheric Research (NIWA).
North Shore City Council 2001. North Shore City Council coastal outfalls. Report prepared by Beca Carter Hollings and Ferner.
North Shore City Council 2008. Rain tank guidelines. Auckland, North Shore City Council.
Parkyn S, Phillips N, Smith B 2006. Aquatic invertebrate biodiversity and spatial characterisation of non-perennial streams in native forest in the Waikato Region. Environment Waikato Technical Report 2006/38. Hamilton, Waikato Regional Council (Environment Waikato).
Patterson M, Cole A 1998. The economic value of ecosystem services in the Waikato Region. Report prepared for Environment Waikato. Palmerston North, Massey University.
Pitt R 2012. Compacted urban soils and their remediation. An article prepared for Aqua Terra International Ltd. Stormwater Meanderings Newsletter, Issue 8, March.
Quinn JM, Steele GL, Hickey CW, Vickers ML 1994. Upper thermal tolerances of twelve New Zealand stream invertebrate species. New Zealand Journal of Marine and Freshwater Research 28: 391-397.
Richardson J, Boubee JAT, West DW 1994. Thermal tolerance and preference of some native New Zealand freshwater fish. New Zealand Journal of Marine and Freshwater Research 28: 399-407.
Rodney District Council, Waitakere City Council 2009. The countryside living toolbox: A guide for the management of stormwater discharges in countryside living areas in the Auckland Region. Auckland, Auckland Regional Council.
Rose C 2013. General outline and structure for preparing TMDL reports, Appendix F: export coefficient model. San Luis Obispo, California Regional Water Quality Control Board, Central Coast Region.
Rosgen D 1996. Applied river morphology. Pagosa Springs, Colorado, Wildland Hydrology.
Rowe D, Quinn J, Parkyn S, Collier K, Hatton C, Joy M, Maxted J, Moore S 2006. Stream ecological valuation (SEV): A method for scoring the ecological performance of Auckland streams and for quantifying mitigation. Auckland Regional Council. Technical Publication No 302. Auckland, Auckland Regional Council.
Scarsbrook M, Wright-Stow A, Joute-Howes K, Joy K 2008. Aquatic ecosystems of the Maniapoto karst. Environment Waikato Technical Report 2008/31. Hamilton, Waikato Regional Council (Environment Waikato).

Page 336 Doc # 11854602
Semadeni-Davies A 2009. Fall velocities of stormwater sediment particles. Literature review. Prepared by NIWA Ltd for Auckland Regional Council. Auckland Regional Council Technical Report 2009/035.
Shaver E 2000. Low impact design manual for the Auckland Region. Auckland Regional Council Technical Publication No. 124. Auckland Regional Council, Auckland.
Shaver E, Horner R, Skupien J, May C, Ridley G 2007. Fundamentals of urban runoff management: Technical and institutional Issues. 2nd ed. North Atlantic Lake Management Society.
Shaver E 2009. Low impact design versus conventional development: Literature review of developer-related costs and profit margins. Prepared by Aqua Terra International Ltd for Auckland Regional Council. Auckland Regional Council Technical Report 2009/045.
Simons MJ 1986. Effects of elevated temperature on three migratory fish from the Waikato River. Technical Publication 40. Hamilton, New Zealand, Waikato Valley Authority.
Somes N, Crosby J 2007. Review of street scale WSUD in Melbourne study findings, Kingston City Council and the Better Bays and Waterways Institutionalising Water Sensitive Design and Best Management Practice Project (revised).
Speirs D 2001. The diversity and distribution of freshwater fish and their habitat in the major rivers of the Waikato Region. Environment Waikato Technical Report 2001/11. Hamilton, Waikato Regional Council (Environment Waikato).
State of New Jersey Department of Environmental Protection 2004. New Jersey stormwater best management practices manual. New Jersey Department of Environmental Protection website, [accessed June 2017] http://www.njstormwater.org/bmp_manual/NJ_SWBMP_4%20print.pdf
State of New Jersey Department of Environmental Protection 2016. New Jersey Department of Environmental Protection website, www.nj.gov/dep/ [accessed June 2017].
Steiner M, Goosse P, Rutz F, Brodmann R, Pazeller A 2010 Straßenabwasserbehandlungsverfahren, Stand der Technik. Bundesamt für Straßen ASTRA. Bundesamt für Umwelt BAFU, Bern, pp. 1–130 (in German).
Taylor A 2001. The freshwater macroinvertebrate communities of the Waikato, Waihou and Waipa Rivers. Environment Waikato Technical Report 2001/12. Hamilton, Waikato Regional Council (Environment Waikato).
Thompson PL, Kilgore RT 2006. Hydraulic design of energy dissipators for culverts and channels. 3rd ed. Hydraulic engineering circular, Number 14 (HEC 14). Washington, D.C., U.S. Department of Transportation, Federal Highway Administration. https://www.fhwa.dot.gov/engineering/hydraulics/pubs/06086/hec14.pdf [accessed June 2017]
United States Environmental Protection Agency 1992. NPDES storm water sampling guidance document. Office of Water, United States Environmental Protection Agency.
United States Environmental Protection Agency 1999. Guidance manual for the monitoring and reporting requirements of the NPDES multi-sector storm water general permit. Office of Water, United States Environmental Protection Agency.
Doc # 11854602 Page 337
United States Environmental Protection Agency 2002. Urban stormwater BMP performance monitoring: A guidance manual for meeting the national stormwater BMP database requirements. Prepared by GeoSyntec Consultants, Urban Drainage and Flood Control District and Urban Water Resources Research Council of American Society of Civil Engineers. Office of Water, United States Environmental Protection Agency.
URS Ltd 2005. Countryside living methods: Version 3.0. Prepared for Waitakere City Council and Rodney District Council.
Ven Te Chow 1964. Handbook of applied hydrology: A compendium of water-resources Technology. New York, McGraw-Hill.
Waikato Regional Council 2018 in press. Waikato stormwater runoff modelling guideline. Waikato Regional Council Technical Report 2018/02.
Ward J, Scrimgeour F 1991. Auckland regional stormwater project: An economic view. Working Report #55. Auckland, Auckland Council
Washington State Department of Ecology 2000. Stormwater management manual for Western Washington, Volume 5: Runoff treatment BMP’s. Publications No. 99-15. Lacey, Washington, Dept. of Ecology.
Washington State Department of Ecology 2001. Stormwater management manual for Western Washington, Volume 1: Minimum technical requirements for site planning. Publication Numbers 99-11 through 99-13. Lacey, Washington, Dept. of Ecology.
Washington State Department of Transportation 1995. Highway runoff manual. Olympia, Washington, Washington State Dept. of Transportation.
Watershed Management Institute 1997. Institutional aspects of urban runoff management: A guide for program development and implementation. Ingleside, Maryland, Watershed Management Institute.
Watershed Management Institute 1997. Operation, maintenance and management of stormwater management systems. In cooperation with Office of Water, U.S. Environmental Protection Agency, Washington DC. Ingleside, Maryland, Watershed Management Institute.
Wildland Consultants Ltd 2009. Methodologies for ranking of lake ecosystems for biodiversity management in the Waikato Region. Report No. 2029. Prepared for Waikato Regional Council (Environment Waikato).
Wildland Consultants Ltd 2011. Geothermal vegetation of the Waikato Region: An update based on 2007 aerial photographs. Waikato Regional Council Technical Report 2011/29. Hamilton, Waikato Regional Council.
Wong T, Breen PF, Somes NLG, Lloyd SD 1999. Managing urban stormwater using constructed wetlands. 2nd ed. Industry Report, Report 98/7. Cooperative Research Centre for Catchment Hydrology and Department of Civil Engineering of Monash University. Clayton, Vic. Dept. of Civil Engineering, Monash University.
Wood M 2014. Managing land use change and Council’s administered drainage areas. Waikato Regional Council Technical Report 2014/13. Hamilton, Waikato Regional Council.

Page 338 Doc # 11854602
Appendix A: Glossary of terms Much of this information has been adapted from a variety of sources including a ‘Glossary of Stormwater Terms’ prepared by Auckland Council, March 2016. Absorption Attachment of chemicals to sediments by association with solids
within the sediment particles.
Adsorption Attachment of chemicals to sediment surfaces.
AEP Annual Exceedance Probability event - the probability that a given rainfall total accumulated over a given duration will be exceeded in any one year.
Aquifer Describes underground layers of saturated permeable material that can both hold and let water move through the ground.
ARI Average Recurrence Interval - the average or expected value of the periods between exceedances of a given rainfall total accumulated over a given duration.
As Built Plan Plans showing details of fittings and connections on a site. May also show new public assets and their connection to existing networks.
Baffle Is a device used to deflect or regulate water flow. They may also be used to improve sediment removal by increasing flow paths.
Baseflow Sustained residual flow in streams. Excludes quickflow or stormflow. Usually results from groundwater inflow or release of flow from the root zone.
Best practicable In relation to a discharge of a contaminant or an emission of noise, option (BPO) means the best method for preventing or minimising the adverse
effects on the environment having regard, among other things, to: a) The nature of the discharge or emission and the sensitivity of
the receiving environment to adverse effects, and b) The financial implications, and the effects on the environment,
of that option when compared with other options, and c) The current state of technical knowledge and the likelihood that
the option can be successfully applied. Bubble up Describes a catchpit that does not have an outlet pipe. It allows catchpit water to bubble up and flow overland to the nearest receiving environment. Bund A barrier, dam or mound used to contain or deflect substances.
Often used to prevent spills on industrial sites.
Catchpit A stormwater device composed of a grate, small chamber and a sediment sump area. They may be private or public and are usually associated with drainage of roading or driveways.
Catchment area The area contributing runoff to a single point measured in a horizontal plane, which is enclosed in a ridge line.
Catchment Plan for addressing runoff generated in a catchment to meet specific Management Plan water quantity and/or water quality objectives.

Doc # 11854602 Page 339
Chamber The area within manholes and catchpits where stormwater goes before going out through the pipes.
Channels, streams A channel is a built feature that carries surface water and is open to and water courses the air. Streams are natural systems and a watercourse is a generic
term that covers both channels and streams.
Check dam Small dam constructed in a gully, swale or other small watercourse to decrease the stream stormwater flow velocity.
Culvert` Pipe or concrete box structure to convey surface water flow
Dam Stores surface water to control flooding, supply drinking water, power generation or irrigation.
Detention pond A permanent structure for the temporary storage of stormwater runoff that is designed so as not to create a permanent pool of water.
Debris screen Used in watercourses or at pipe inflows or outflows to capture debris and prevent debris conveyance downstream.
Downpipe Pipes from guttering to the ground that carries rainwater to a stormwater system.
Embankment Mound or wall of soil or other material that impounds water.
Emergency Path designed to be taken by runoff when the capacity of a pond Spillway or dam is exceeded by a rain event.
Energy dissipater Rocks or concrete pads constructed at outlets to slow or regulate water flow and reduce erosion potential.
Erosion Abrasion, detachment and removal of soil by rain, flowing water, wind, frost, temperature change or other natural or human-made cause.
Extended Temporary impoundment of stormwater over a specified period of detention time to a downstream receiving system for the purpose of water quality treatment or stream channel erosion control. Filter strip A densely vegetated section of land engineered to accept
stormwater runoff as overland sheet flow from upstream development.
Filtration device Device that passes stormwater through a porous media filter.
First flush The delivery of a disproportionately large load of contaminants during the early part of storms.
Fish ladder Device used to enable fish species to climb barriers to travel further upstream from a potential blockage to migration.
Floodplain Area that catchment flows cover when stream channel conveyance is exceeded. It is normally recognised as an area that becomes inundated in storms up to and including a 1 in 100-year runoff event.
Freeboard The vertical distance between the design water surface elevation and the elevation of the top of a tank wall or pond embankment.

Page 340 Doc # 11854602
Grease trap A device to prevent grease and solids entering the stormwater/wastewater network.
Groundwater Water that has infiltrated the ground to subsoil and bedrock. During dry periods, stream flow is maintained by groundwater.
Groundwater Replenishment of groundwater reservoirs. recharge Gutter/spouting Narrow trough fixed under the eaves of a structure for conveying
rainwater to downpipes.
Impervious Hard surfaces that prevent or retard the entry of water into soil. surfaces
Infiltration Passage or movement of water from the land surface into the soil.
Infiltration device A stormwater management device that temporarily impounds stormwater runoff and discharges it through the surrounding soil.
Inlet Entry point of a pipe to a stormwater management device, a piped drainage network or a receiving system.
Invert Bottom of a pipe, channel or stormwater device.
Kerb outlet Stormwater discharge point into a roadway that is collected from a property in a pipe.
Live storage Storage volume of the device excluding the volume that is permanently filled with water.
Low impact A design approach for site and catchment development or design (LID) re-development that protects and conserves and incorporates
natural site features into stormwater management design and implementation.
Manhole Chamber that provides entry to a piped network. Access is provided via a cover.
Oil/water A device used to separate oil from water. separator 100-year Land which may be inundated with water statistically once every floodplain 100 years. It can occur during any year.
Orifice Small outlet from a stormwater device that controls outflow rates.
Outfall End of a stormwater pipe or network where water leaves the built stormwater system and enters a receiving environment.
Overland flow path Route taken by runoff not captured in a reticulated or natural stormwater system. If flows over the ground and can concentrate in gullies.
Permeable/porous Natural ground surfaces, including trees, shrubs, grass an soil which allow water to pass through and soak into the ground.

Doc # 11854602 Page 341
Permeable An open graded asphaltic or reticular concrete or other material that pavement allows water to pass through it.
Pre-development Conditions that exist at the time that plans for the land development of a tract of land are approved.
Post-development Conditions that reasonably may be expected or anticipated to exist after completion of the land development activity on a specific site or tract of land.
Quickflow The portion of flow that drains from the catchment during or shortly after a storm event.
Rain tank An above or below ground tank that stores water collected from the roof area of a building.
Rain garden Stormwater device that includes bioretention and biodetention devices that allow runoff to pass through a media and infiltrate the runoff or release it at a very slow rate through an underdrain.
Residence time Time a small parcel of fluid spends in the treatment device.
Retention Storage of runoff followed by infiltration or evaporation.
Reticulation Piped stormwater network.
Riprap Rock or other materials used to armour shorelines, streambeds and banks, bridge abutments, pilings and other structures against scour and water or ice erosion.
Riser Underground, vertical section of a manhole which rises up from the pipes at the base to ground level. A riser assembly is also used in stormwater ponds to raise storage in the pond to the overflow level.
Runoff Water flows which result from rain water that is not absorbed by permeable surfaces or drains from impermeable surfaces.
Sand filter An above or below ground tank containing a bed of sand to filter stormwater runoff and remove contaminants.
Scruffy dome A steel grill, usually domed, placed over an inlet or a manhole to allow stormwater runoff to enter a piped network but precludes larger debris from entering the network.
Sediment forebay Small pool designed to capture coarse sediment
Seepage A flow of subsoil water appearing at ground level in shallow excavations or from behind retaining walls. Seepage control is essential for reducing flow around pipes in dams.
Service outlet Outlet used to pass flows less than flows for which emergency outlet is used but larger than flows through an extended detention outlet.
Sheet flow Flows occurring as a sheet over the surface rather than channelised flow.
Soakage pit An excavated area that remains below ground to accept stormwater runoff and allow it to soak into the ground.
Page 342 Doc # 11854602
Spillway A large outlet (usually a weir) in an embankment used to pass flood flows.
Stop bank An earth bund or embankment to prevent water flowing in a particular direction. Usually used to prevent frequent flooding, but generally is not designed to prevent all flooding.
Stormwater The portion of precipitation that is discharged across land surfaces or through conveyances to receiving systems.
Stormwater For quantity control, a system of vegetative and structural management measures that control the increased volume and rate of surface runoff caused by human made changes to the land; and For quality control, a system of vegetative, structural and other
measures that reduce or eliminate contaminants that might otherwise be carried by stormwater runoff.
Subsoil Beneath the topsoil, the subsoil does not have high organic matter concentrations so has lighter and varying colours.
Subsoil drain An underground drainage system that allows for the collection and passage of subsoil water to a stormwater drain.
Swale An earthen conveyance system that is broad and shallow with erosion resistant grasses and check dams, engineered to remove contaminants from stormwater runoff by filtration through grass and infiltration into the ground.
Topsoil The top layer of soil that has a mix of vegetative matter and soil in it. Topsoil provides the richest amount of organic matter for germinating seeds and this organic matter colours the soil dark brown. Organic matter helps soil structure, holds water and nutrients. Microorganisms, from bacteria to fungi, populate the soil and keep the cycling of organic matter active.
Treatment device A generic term to cover a wide range of devices to remove contaminants from stormwater runoff.
Tree pit A stormwater filtering device that collects runoff from impermeable surfaces and filters the runoff through the tree roots and surrounding soil.
Underdrain Drain used to collect and convey water that has passed through soil or a filter bed.
Water table Level of the saturated portion of a groundwater aquifer.
Wetland Areas that are inundated by surface or groundwater at a frequency and duration to support, and under normal circumstances do support, a prevalence of vegetation typically adapted for life in saturated soil conditions.
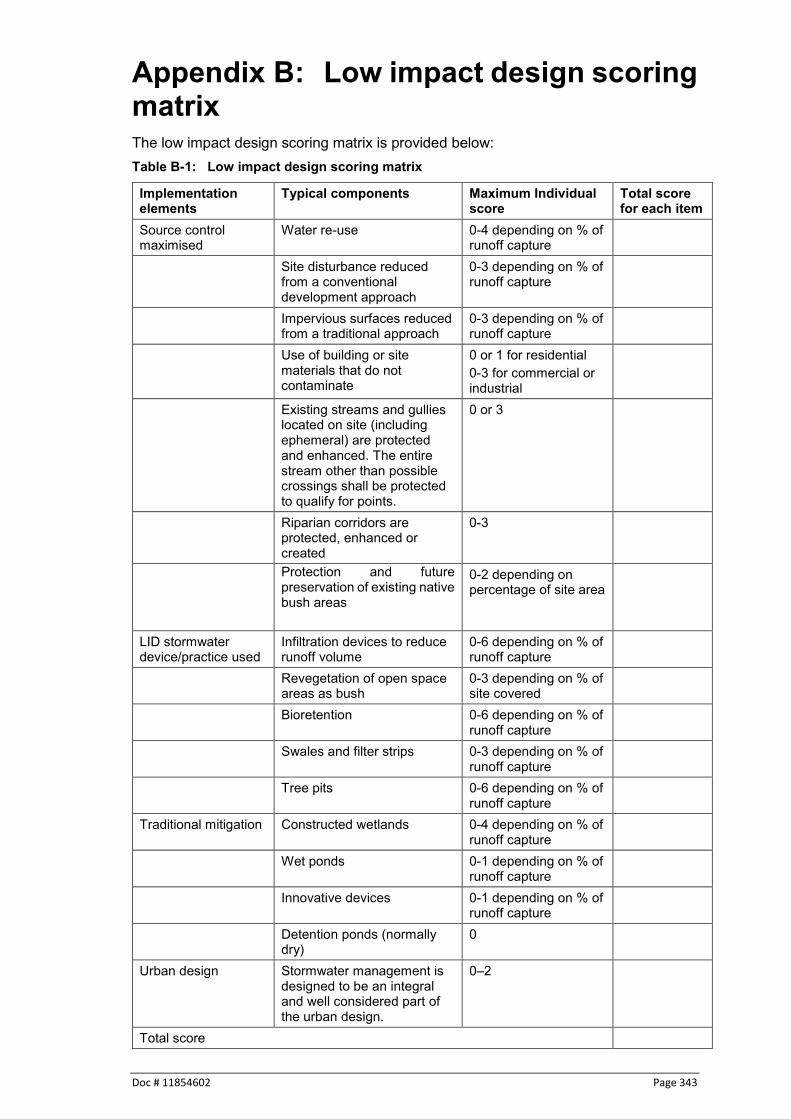
Doc # 11854602 Page 343
Appendix B: Low impact design scoring matrix The low impact design scoring matrix is provided below: Table B-1: Low impact design scoring matrix
Implementation elements
Typical components Maximum Individual score
Total score for each item
Source control maximised
Water re-use 0-4 depending on % of runoff capture
Site disturbance reduced from a conventional development approach
0-3 depending on % of runoff capture
Impervious surfaces reduced from a traditional approach
0-3 depending on % of runoff capture
Use of building or site materials that do not contaminate
0 or 1 for residential 0-3 for commercial or industrial
Existing streams and gullies located on site (including ephemeral) are protected and enhanced. The entire stream other than possible crossings shall be protected to qualify for points.
0 or 3
Riparian corridors are protected, enhanced or created
0-3
Protection and future preservation of existing native bush areas
0-2 depending on percentage of site area
LID stormwater device/practice used
Infiltration devices to reduce runoff volume
0-6 depending on % of runoff capture
Revegetation of open space areas as bush
0-3 depending on % of site covered
Bioretention 0-6 depending on % of runoff capture
Swales and filter strips 0-3 depending on % of runoff capture
Tree pits 0-6 depending on % of runoff capture
Traditional mitigation Constructed wetlands 0-4 depending on % of runoff capture
Wet ponds 0-1 depending on % of runoff capture
Innovative devices 0-1 depending on % of runoff capture
Detention ponds (normally dry)
0
Urban design Stormwater management is designed to be an integral and well considered part of the urban design.
0–2
Total score

Page 344 Doc # 11854602
The scoring matrix outlined above relates to stormwater management and focusses on encouraging LID in particular. This doesn't replace the need to consider other values including cultural, social, environmental and economic. It is noted that Items such as streams or riparian corridors that do not exist on site would score 0. Once the total score is calculated, the minimum score in terms of acceptability is 15. Scores lower than that will have to justify rejection for those items not incorporated. At least 6 points are required for source control and 6 points required for LID devices individually. If a specific site does not have existing streams or gullies, riparian corridors or existing native bush the total acceptable score for source control can be reduced to 4 points, which would reduce the acceptable total for site development to 13 points. As stated in Section 1 the Waikato Regional Council uses a Best Practicable Option (BPO) approach for assessing the adequacy of technical design for discharge consents. As such, being unable or unwilling to meet the thresholds indicated above does not automatically mean the consent application will be declined. If an applicant chooses to use another approach to site development then an analysis should accompany the application to demonstrate that similar outcomes are achieved when compared to if a low impact design approach was taken. Highway projects are different from normal development projects and the ability to provide source control is limited. As a result highway projects must still consider LID and traditional mitigation devices and must achieve a total score of at least 8. Scoring matrix values It is important to provide a consistent approach to selecting values for each category component. The following subsections provide scoring values for each component so that the values selected are not arbitrary. Source control
1. Water re-use Flow detention only is 1 point. Site use for garden watering is 2 points. Site use for garden watering and for non-potable inside waters uses
including laundry and toilets is 3 points. Site use for full water supply is 4 points
2. Site disturbance reduced from a conventional development approach 10 % reduction from a conventional development is 2 points. 20% and greater reduction from conventional development is 3 points
3. Impervious surfaces reduced from a conventional development approach 5% reduction is 2 points. 10% reduction is 3 points.
4. Use of building or site materials that do not contaminate Residential roofs, gutters, down spouts made of non-contaminant
leaching materials is 1 point. Commercial roof, gutters, down spouts made of non-contaminant
leaching materials is 3 points. 5. Existing streams and gullies (including ephemeral streams) are protected and
enhanced Preservation and protection of natural streams and gullies is 3 points.
6. Riparian corridors are protected, enhanced or created Riparian corridor protection scores depend on the width of corridor
provided. 5 metres on either side of the stream is 1 point, 10 metres is 2 points and greater than 10 metres is 3 points.
7. Protection and future preservation of existing native bush areas
Doc # 11854602 Page 345
Protection, preservation and, if needed, enhancement of native bush areas that exceed 10% of the site is given 2 points.
LID stormwater devices/practices used 1. Infiltration devices to reduce runoff volume
Meeting the capture and infiltration requirements of the initial abstraction volume is given 2 points.
Meeting the capture and infiltration requirements for the site water quality storm is given 3 points.
Meeting the capture and infiltration requirements for the 2-year ARI event for the site is given 6 points.
2. Revegetation of open areas as bush Planting open space and providing maintenance of planting for 3 years if
open space is equal to or exceeds 10% of overall site area is given 3 points.
3. Bioretention (including tree pits) Meeting the capture and retention requirements of the initial abstraction
volume is given 2 points. Meeting the capture and retention requirements for the site water quality
storm is given 3 points. Meeting the capture and retention requirements for the 2-year storm for
the site is given 6 points. 4. Swales and filter strips
All impervious surfaces draining to swales and filter strips that have capacity for conveying the water quality event is given 2 points.
All impervious surfaces draining to swales and filter strips that have capacity for conveying the 2-year ARI event is given 3 points.
Traditional mitigation 1. Constructed wetlands
Meeting the water quality design storm criteria is given 2 points. Meeting extended detention and peak control requirements is given an
additional 2 points. 2. Wet ponds
Use of a wet pond for stormwater quantity control and stream channel protection is 1 point.
3. Innovative devices Meeting water quality requirements using council accepted devices is
given 1 point. 4. Detention ponds (normally dry)
As this device provides negligible water quality benefit use of the device for quantity control is 0 points.
Urban design
1. Stormwater management is designed to be an integral and well considered part of the urban design is 2 points.

Page 346 Doc # 11854602
Appendix C: Forms for construction and operation

Doc # 11854602 Page 347
Forms for use when constructing or operating stormwater management devices
To facilitate proper construction and operation of stormwater management devices, this appendix has been prepared. It is intended that these forms be used whenever there is a stormwater management device. Their use will facilitate proper construction and subsequent operation of the stormwater management devices. Forms that are included include the following:
Preconstruction meeting form
Individual device construction checklists - Swales and filter strips - Sand filters - Rain gardens - Infiltration trenches - Ponds and wetlands
As-built documentation forms - Swales and filter strips - Sand filter - Rain garden - Infiltration trench - Pond or wetland
Post-construction operation and maintenance forms - Swales and filter strips - Sand filters - Rain gardens - Infiltration trenches - Ponds and wetlands - Oil/water separators
These forms have been adapted from forms prepared previously for the New Zealand Transport Agency and the Auckland Regional Council.

Page 348 Doc # 11854602
Pre-construction meeting form

Doc # 11854602 Page 349
STORMWATER MANAGEMENT PRE-CONSTRUCTION MEETING AGENDA
Prerequisites:
Read consent report and conditions
Ensure the appropriate people attend: Consent issuance authority representative, Project Engineer, Contractor.
Prepare copies of construction check lists for all stormwater management devices to be used
Site Name: __________________ Date: ___________
Address: __________________ Consent No: ___________
File Number: ___________
Contractor contact information:
Name: _______________________
Organisation: _______________________
Mailing address _______________________
_______________________
_______________________
Phone no. _______________________
Email _______________________
Stormwater project engineer contact information (individual responsible for inspecting and signing off key construction milestones and providing final as-builts): Name: _______________________
Organisation: _______________________
Mailing address _______________________
_______________________
_______________________
Phone no. _______________________
Email _______________________
Consent issuance authority representative contact information:
Name: _______________________
Organisation: _______________________
Mailing address _______________________
_______________________
_______________________
Phone no. _______________________

Page 350 Doc # 11854602
Email _______________________
Other attendees at the meeting _______________________
_______________________
_______________________
_______________________
Purpose To coordinate stormwater management construction activities of the contractor with the project inspection staff and other interested parties such as the appropriate consenting authority, utility contractors, and sub-contractors. This meeting is to be held between all parties prior to any construction work on the project. A pre-construction meeting provides the opportunity for all parties involved to discuss roles and responsibilities on the project. The importance of stormwater management should be discussed and the importance of proper construction of stormwater management devices should be emphasized. Having a pre-construction meeting is invaluable in preventing issues that may arise later. It also establishes good communication at the beginning of a project to prevent potential problems, potential enforcement and corrections to device construction that may not otherwise have been undertaken correctly. Key discussion points The following items need to be discussed so that a clear understanding of project elements, time frames and important project components are understood by all attendees. 1. Project Description. Make sure that the development and the proposed stormwater
device construction agrees with the approved plan or plans _______________________________________________________________
_______________________________________________________________
_______________________________________________________________
_______________________________________________________________
_______________________________________________________________
_______________________________________________________________
2. Delineation of lines of authority. Names and telephone numbers for the Contractor
and others will be entered into the record. In addition, the individual designated by the contractor for construction of stormwater management devices shall be identified.
Name Cell phone number
____________________ ________________________
____________________ ________________________
____________________ ________________________
____________________ ________________________
3. Proposed Starting Dates - Contractors and subcontractors - lead-in time and
number of shifts or extra hours they propose to be working, any variation to normal working hours, etc.

Doc # 11854602 Page 351
Starting date ____________________________
Unusual working times or days
_________________________________________
_________________________________________
_________________________________________
4. Intended project schedule and overall time frame
_________________________________________
_________________________________________
_________________________________________
_________________________________________
5. Project phases in chronological order.
Approximate Date
Project initiation, _____________
Implementation of erosion and sediment control, _____________
Mass earthworks, _____________
Final grade establishment, _____________
Road construction, _____________
Drainage system construction, _____________
Construction of sediment controls to protect
stormwater devices _____________
Stormwater management device construction,
Critical Stages:
_____________ _____________
_____________ _____________
_____________ _____________
_____________ _____________
Final stabilisation. _____________
Removal of sediment controls _____________
Utility construction _____________
6. Stormwater management issues:
Are the approved plans and consent on-site? Yes No
If not, why? ______________________________
Stormwater management devices need to be reviewed. The construction checklists should be used to detail key stages of construction. Those devices on this project include:
_______________________________________
_______________________________________

Page 352 Doc # 11854602
_______________________________________
_______________________________________
_______________________________________
Stormwater consent requirements need to be gone over
Time frame for construction of stormwater management devices
_______________________________________
Who will submit As Built Plans? _______________________________
Who will submit Operation and Maintenance Plans
_________________________________________
The relationship between the contractor’s as-builts and the stormwater
project engineers as-builts to be discussed and agreed
Who will submit the Planting Plan (if appropriate)
_________________________________________
There is a requirement that an inspection be undertaken at key stages of construction for stormwater management devices. These stages can be found on the “as-built” requirements forms and the key stages should be specifically identified and discussed,
Overall stormwater management device sizing undertaken according to approved plans?
Yes No
If not, what is the variance from the approved plans?
_______________________________________
_______________________________________
_______________________________________
_______________________________________
Construction methodology and materials used to construct stormwater management devices shall be discussed. This would apply to embankment materials and compaction, filter media, vegetation, stone or gravel sizing, etc.,
Outfall structure construction proposed with suitable energy dissipation,
Site stabilisation requirements,
Any variation from plans that have been approved,
Routine inspections to check construction progress,
Final inspection requirements,
As built certification requirement including overland flow path dimensions,
Waikato Regional Council inspection and enforcement policies.
7. Utility locations. Discussion needs to be held with utility contractors to determine where utilities are/will be located and when they will be constructed. In addition, it would be good if the names and phone numbers of utility contact persons could be obtained. Who is responsible for stabilizing areas disturbed by utility construction?
8. Plan errors and omissions. The contractor should discuss errors and omissions in the plans that are known to exist. Pre-construction minutes should reflect the

Doc # 11854602 Page 353
Contractor's knowledge of errors or omissions in detail. Errors or omissions identified include:
_____________________________________________
_____________________________________________
_____________________________________________
_____________________________________________
_____________________________________________
9. Conversion of sediment control structures to stormwater management structures. Is there a relationship between erosion and sediment control and storm water management (use of stormwater devices for erosion and sediment control). Procedures should be gone over for final maintenance before handing the device over to the responsible maintenance entity, if applicable.
10. Other consents review and discussion. Are there other consents that need to be discussed (sediment control, stream works, dam consent, etc.)? Those consents include the following:
_____________________________________________
_____________________________________________
_____________________________________________
_____________________________________________
11. Sensitive environmental issues. Discussion of any sensitive environmental issues (contaminated soils, stream protection, and coastal management areas. Listing of sensitive issues includes:
_____________________________________________
_____________________________________________
_____________________________________________
_____________________________________________
12. Time extensions for work. Submittal procedure for and needed time extensions.
13. Consultant interaction. If a Consultant is providing the construction engineering and inspection or materials testing; discuss the procedures, relationships and responsibilities that exist between the Consultant, Waikato Regional Council and the Contractor.
14. Consent transfer. Transfer of consent to the responsible maintenance entity:
When ____________________________________
How ____________________________________
Additional Notes: _____________________________________________________________________
_____________________________________________________________________
_____________________________________________________________________
_____________________________________________________________________
_______________________________ _________________
Waikato Regional Council Representative Date

Page 354 Doc # 11854602
Device construction forms Construction forms are provided for the following devices:
Swales and filter strips
Sand filters
Rain gardens
Infiltration trenches
Ponds and wetlands The oil/water separators are prefabricated units so it is not necessary to have a separate inspection form for them.

Doc # 11854602 Page 355
Correct noted site deficiencies by
____________________________________________________________________________
1st Notice:
____________________________________________________________________________
2nd Notice:

Page 356 Doc # 11854602
_____________________________________________________________________________
Submit plan modifications as noted in written comments by
____________________________________________________________
Other action taken to obtain needed corrections
____________________________________________________________________________
Final inspection, project completed
_____________________________________________________________________________
Responsible person’s signature: _________________________________

Doc # 11854602 Page 357

Page 358 Doc # 11854602

Doc # 11854602 Page 359

Page 360 Doc # 11854602

Doc # 11854602 Page 361

Page 362 Doc # 11854602

Doc # 11854602 Page 363

Page 364 Doc # 11854602
As-built documentation forms Individual As-Built documentation of stages of construction is provided for each device other than the oil/water separator. That device does not have an “As-Built” plan requirement as they are pre-fabricated units and the only item of concern is the elevation they are placed at. The “forms” for each device are provided on individual sheets for ease of reproduction.

Doc # 11854602 Page 365
As-Built Certification for Completed Stormwater Management Devices – Swale and/or Filter Strip
Site Name Address Engineer Consent Number Date The following information must be completed and submitted with the As-Built drawing of the stormwater management swales or filter strips. Stormwater Management Swale or Filter Strip As-Built Items to be included in the As-Built Plan submission as required. It is necessary that photographic evidence be submitted to document stages of construction. Where large boxes are provided, please place an image or submit pictures of that stage to verify that construction was undertaken according to the plan. Yes No 1. Is the size and location of the swale or filter strip
according to the approved plans? 2. Are the lateral slopes completely level? Yes No 3. Are the longitudinal slopes within the Yes No
design range? 4. Are check dams and level spreaders Yes No
installed and spaced correctly? 5. Are level spreaders constructed completely level? Yes No 6. Are all inlets, outlets and bypasses installed correctly? Yes No 7. Are kerb cuts installed per plans? Yes No

Page 366 Doc # 11854602
8. Does the vegetation comply with planting Yes No specifications and is topsoil adequate in composition and placement?
9. Are erosion control measures in place and adequate Yes No to protect the swale from excess sedimentation? 10. Is overall construction undertaken according to
plans? Yes No
11. Verify locations and locate on as-built plans Yes No
all utilities that may impact on future maintenance. For all those items listed above where “No” has been marked, please provide a discussion of the variation of those items from the consented design and why they are at variance. It is also requested that you state that the exceptions to the approved design do not adversely affect the intended performance or safety of the swale or filter strip. If you cannot state that there is no adverse effect, you must also note to that effect. _____________________________________________________________________
_____________________________________________________________________
_____________________________________________________________________
_____________________________________________________________________
_____________________________________________________________________
_____________________________________________________________________
_____________________________________________________________________
_____________________________________________________________________
_____________________________________________________________________
_____________________________________________________________________
_____________________________________________________________________
_____________________________________________________________________
_____________________________________________________________________
_____________________________________________________________________
_____________________________________________________________________
________________
Insert a photograph to show the completed swale or filter
strip

Doc # 11854602 Page 367
The exceptions to the approved design do not adversely affect the intended performance or safety of the swale or filter strip. I certify that this stormwater management swale or filter strip is constructed according to the consented design. This statement has been based upon on-site observation of the swale or filter strip conducted by me or by my designee under my direct supervision. The as-built plan accurately reflects site conditions. Name (printed) Signature Date Qualification

Page 368 Doc # 11854602
As-Built Certification for Completed Stormwater Management Devices – Sand Filter
Site Name Address Engineer Consent Number Date The following information must be completed and submitted with the As-Built drawing of the stormwater management sand filter. Stormwater Management Sand Filter As-Built Items to be included in the As-Built Plan submission as required. It is necessary that photographic evidence be submitted to document stages of construction. Where large boxes are provided, please place an image or submit pictures of that stage to verify that construction was undertaken according to the plan. Yes No 1. Were the dimensions of the sand filter (length,
width and depth) as detailed on the approved plans sized appropriately in the field? For a prefabricated unit, is the unit sized to approved plans?
2. Was the foundation area compacted to meet
minimum specifications? Yes No 3. Are the underdrains sized and placed
correctly to the correct grade? Yes No 4. Does the filter media meet design specification? Yes No
Insert a photograph of the foundation area of the sand filter
prior to placement of the filter
Provide a photograph showing the underdrains

Doc # 11854602 Page 369
5. Are all joints and pipe connections sealed and joined Yes No properly? 6. Inflow and overflow systems installed correctly? Yes No 7. Verify locations and locate on as-built plans Yes No
all utilities that may impact on future maintenance. 8. Constructed related sediments removed? Yes No
For all those items listed above where “No” has been marked, please provide a discussion of the variation of those items from the consented design and why they are at variance. It is also requested that you state that the exceptions to the approved design do not adversely affect the intended performance or safety of the sand filter. If you cannot state that there is no adverse effect, you must also note to that effect. _____________________________________________________________________
_____________________________________________________________________
_____________________________________________________________________
_____________________________________________________________________
_____________________________________________________________________
The exceptions to the approved design do not adversely affect the intended
performance or safety of the sand filter. I certify that this stormwater management sand filter is constructed according to the consented design. This statement has been based upon on-site observation of the sand filter conducted by me or by my designee under my direct supervision. The as-built plan accurately reflects site conditions. Name (printed) Signature Date Qualification

Page 370 Doc # 11854602
As-Built Certification for Completed Stormwater Management Devices – Rain Garden
Site Name Address Engineer Consent Number Date The following information must be completed and submitted with the As-Built drawing of the stormwater management rain garden. If there are multiple rain gardens, one form can be used but the individual rain gardens should be numbered on the plans so that reference to them in comments can be related to the specific one in the field. Stormwater Management Rain Garden As-Built Items to be included in the As-Built Plan submission as required. It is necessary that photographic evidence be submitted to document stages of construction. Where large boxes are provided, please place an image or submit pictures of that stage to verify that construction was undertaken according to the plan. Yes No 1. Were the dimensions of the rain garden (length,
width and depth) as detailed on the approved plans constructed in the field?
2. Was a liner placed as required? Yes No 3. Perforated underdrain installed correctly
according to standard engineering principles?
Yes No NA 4. Storm drain system installed and connected? Yes No
Insert picture of liner placement in excavation
Insert picture of underdrain placement

Doc # 11854602 Page 371
5. Gravel, sand and planting media backfilled
correctly and meets compaction specifications? Yes No 6. Inflow and overflow systems installed Yes No according to design? Yes No 7. Vegetation complies with planting
specifications? 8. Groundcover or mulch laid to specification? Yes No
9. Verify locations and locate on as-built plans Yes No
all utilities that may impact on future maintenance. 10. Catchment contributing to rain garden stabilised? Yes No 11. Constructed related sediments removed? Yes No
12. Has access for maintenance been provided? Yes No
Insert a photograph showing the planting media prior to
placement in the excavation area

Page 372 Doc # 11854602
13. Rain garden completed according to
plan? Yes No For all those items listed above where “No” has been marked, please provide a discussion of the variation of those items from the consented design and why they are at variance. It is also requested that you state that the exceptions to the approved design do not adversely affect the intended performance or safety of the rain garden. If you cannot state that there is no adverse effect, you must also note to that effect. _____________________________________________________________________
_____________________________________________________________________
_____________________________________________________________________
_____________________________________________________________________
_____________________________________________________________________
_____________________________________________________________________
_____________________________________________________________________
_____________________________________________________________________
_____________________________
The exceptions to the approved design do not adversely affect the intended performance of the rain garden. I certify that this stormwater management rain garden is constructed according to the consented design. This statement has been based upon on-site observation of the rain garden conducted by me or by my designee under my direct supervision. The as-built plan accurately reflects site conditions. Name (printed) Signature Date Qualification
Insert a picture of the completed rain garden here

Doc # 11854602 Page 373
As-Built Certification for Completed Stormwater Management Devices – Infiltration Trench
Site Name Address Engineer Consent Number Date The following information must be completed and submitted with the As-Built drawing of the stormwater management drywell or infiltration trench. Stormwater Management Dry Well or Infiltration Trench As-Built Items to be included in the As-Built Plan submission as required. It is necessary that photographic evidence be submitted to document stages of construction. Where large boxes are provided, please place an image or submit pictures of that stage to verify that construction was undertaken according to the plan. Yes No 1. Is the size and location of the infiltration trench
according to the approved plans? 2. Was filter fabric placed on the bottom and sides Yes No of the trench according to the approved plans? 3. Are the aggregate materials sized
according to the approved plans? Yes No 4. Has an observation well been installed? Yes No
5. Does the aggregate filter course meet size Yes No
specifications and is clean, washed stone?
Insert a photograph of the trench being filled to show aggregate and filter fabric

Page 374 Doc # 11854602
6. Has the porous surface material been placed properly? Yes No 7. Verify locations and locate on as-built
plans (all utilities that may impact on future maintenance).
Yes No
.
For all those items listed above where “No” has been marked, please provide a discussion of the variation of those items from the consented design and why they are at variance. It is also requested that you state that the exceptions to the approved design do not adversely affect the intended performance or safety of the dry well or infiltration trench. If you cannot state that there is no adverse effect, you must also note to that effect. _____________________________________________________________________________________________________________________________________________________________________________________________________________________________________________________________________________________________________________________________________________________________________________________________________________________________________________________________________________________________________________________________________________________________________________________________________ ___________________________________________________________
The exceptions to the approved design do not adversely affect the intended performance or safety of the infiltration trench. I certify that this stormwater management infiltration trench is constructed according to the consented design. This statement has been based upon on-site observation of the dry well or infiltration trench conducted by me or by my designee under my direct supervision. The as-built plan accurately reflects site conditions. Name (printed) Signature Date Qualification
Insert a photograph to show the completed infiltration
trench

Doc # 11854602 Page 375
As-Built Certification for Completed Stormwater Management Devices – Stormwater Management Pond or Wetland
Site Name Address Engineer Consent Number Date The following information must be completed and submitted with the As-Built drawing of the stormwater management pond. Stormwater Management Pond or Wetland As-Built Items to be included in the As-Built Plan submission as required. It is necessary that photographic evidence be submitted to document stages of construction. Where large boxes are provided, please place an image or submit pictures of that stage to verify that construction was undertaken according to the plan. Yes No 1. All pipes, their sizing and associated structures
are those specified on design drawings? 2. Cut-off trench excavated a minimum of 1
metre below sub-grade and minimum of 1 metre below proposed pipe invert, with side slopes no steeper than 1:1?
Yes No 3. Pipe placement undertaken according to sound Yes No
engineering practices and uses water tight connections when pipes are joined?
4. Anti-seep collars or other seepage device properly
spaced, with water tight connections to pipe and installed properly?
Yes No
Insert picture of cut-off trench here
Insert picture of anti-seep collars or here

Page 376 Doc # 11854602
5. Embankment properly compacted around pipe and fill placed in maximum 200 mm lifts?
Yes No 6. Riser base set to design elevation? Yes No 7. Principal spillway meets design specifications Yes No
specifications and elevations? 8. Pond toe drain installed correctly
according to standard engineering principles?
Yes No 9. Impounded area meets design contours Yes No
and side slopes? This includes any benches both above and below the permanent pool elevation.
10. Forebay is constructed according to design plans, meeting depth and area requirements with appropriate energy dissipation? Yes No 11. Emergency spillway is excavated to Yes No proper cross-section, side slopes and bottom width and armoured according to the design plans?
Insert picture of embankment during
construction
Insert picture of pond or wetland toe drain here
Insert picture of forebay clearly showing
configuration and any energy dissipation

Doc # 11854602 Page 377
12. Outlet protection installed according to Yes No detailed design plans in terms of materials and configuration?
13. Site vegetatively stabilized, landscaping Yes No plants and any wetland plants planted? 14. Maintenance access provided? Yes No 15. Set aside areas provided for sediment Yes No
clean-out maintenance? 16. Verify locations and locate on as-built plans all Yes No utilities that may impact on future
maintenance. For all those items listed above where “No” has been marked, please provide a discussion of the variation of those items from the consented design and why they are at variance. It is also requested that you state that the exceptions to the approved design do not adversely affect the intended performance or safety of the pond. If you cannot state that there is no adverse effect, you must also note to that effect. _____________________________________________________________________
_____________________________________________________________________
_____________________________________________________________________
_____________________________________________________________________
_____________________________________________________________________
_____________________________________________________________________
_____________________________________________________________________
_____________________________________________________________________
_____________________________________________________________________
_____________________________________________________________________
_____________________________________________________________________
_____________________________________________________________________
_____________________________________________________________________
Insert picture of maintenance access point clearly showing
any gates, fencing and means of entry..

Page 378 Doc # 11854602
_____________________________________________________________________
_____________________________________________________________________
_____________________________________________________________________
_____________________________________________________________________
_____________________________________________________________________
_____________________________________________________________________
_____________________________________________________________________
____________________
The exceptions to the approved design do not adversely affect the intended performance or safety of the pond. I certify that this stormwater management pond is constructed according to the consented design. This statement has been based upon on-site observation of the pond conducted by me or by my designee under my direct supervision. The as-built plan accurately reflects site conditions. Name (printed) Signature Date Qualification

Doc # 11854602 Page 379
Operation and maintenance forms Operation and maintenance forms are provided for the following devices:
Swales and filter strips
Sand filters
Rain gardens
Infiltration trenches
Ponds and wetlands
Oil/water separators

Page 380 Doc # 11854602

Doc # 11854602 Page 381
DEVICE:

Page 382 Doc # 11854602

Doc # 11854602 Page 383
DEVICE:

Page 384 Doc # 11854602

Doc # 11854602 Page 385
DEVICE:

Page 386 Doc # 11854602

Doc # 11854602 Page 387
DEVICE:

Page 388 Doc # 11854602

Doc # 11854602 Page 389
DEVICE:

Page 390 Doc # 11854602
DEVICE:

Doc # 11854602 Page 391