wahyu lubis teti armiati argo - rdi · 3 assessing household risk mitigation to flooding in lowland...
TRANSCRIPT
`
1
Working Paper Series No. 1 | January 2015
© Resilience Development Initiative
Assessing Household Risk Mitigation to Flooding in Lowland Area of Palembang
Wahyu Lubis
Resilience Development Initiative
Saut Sagala
School of Architecture, Planning, and Policy Development, Institute of Technology Bandung
Ramanditya Wimbardana
Resilience Development Initiative
Teti Armiati Argo
Resilience Development Initiative

`
2
WP No : 1
Date : January, 2015
Resilience Development Initiative (RDI) is a think tank initiative based in Bandung, Indonesia that focuses on environmental change and sustainable development. RDI contributes to the body of knowledge on development and disaster research studies in Indonesia and South East Asian Region.
RDI Working Paper Series is published electronically by RDI.
The views expressed in each working paper are those of the author or authors of the paper. They do not necessarily represent the views of RDI or its editorial committee.
Citation of this electronic publication should be made in Harvard System of Referencing.
Editorial Team:
Elisabeth Rianawati
M Wahyu Anhaza Lubis
Dr. Saut Sagala
Contact:
Address: Jalan Imperial II No. 52, Bandung 40135 Jawa Barat – INDONESIA
Phone: +62 22 2536574 Email: [email protected]
Website: www.rdi.or.id

`
3
Assessing Household Risk Mitigation to Flooding in Lowland Area of Palembang*
Wahyu Lubis1, Saut Sagala2, Ramanditya Wimbardana1 and Teti Armiati Argo2
1Resilience Development Initiative
Bandung
2School of Architecture, Planning, and Policy Development, Institute of Technology Bandung Bandung
Abstract
To achieve urban development agenda, there have been efforts in urban development practices. One of the most common effort is converting existing protected areas into built-up areas. Consequently, this effort is increasing the occurrences of flood hazard. Based on the data, people are frequently subjected of to this hazard. Fortunately, this disaster risk can be minimized with the active participation of community members. Their capacity can be improved by a set of disaster risk mitigation efforts. The more risk mitigation efforts they can prepare, the more resilient they are. This research aims to build a concept of disaster resilient communities in Palembang based on their current preparedness. In order to achieve this, firstly we need to identify and assess the level of community structural and non-structural mitigation in Palembang. This article will follow up by a discussion of literature review of how preparedness is related with resilience.
Keywords:
1. Introduction
Urbanization requires space and land to grow. Both are needed to facilitate the demand of housing, commerce, industry, infrastructure, or even farmland in order to achieve urban development agenda (Sagala, Dodon, Lutfiana, & Wimbardana, 2013). However, since the availability of developable land is very limited in urban areas, there have been efforts in urban development practices to change existing land use (Situngkir et al 2014). Some of them typically continue to expand land and thereby convert existing protected areas into built-up areas (Firman, 2009; Martinuzzi et al., 2015; Partoyo & Shrestha, 2013). Some research indicated that the rates of converted protected areas due to urban expansion have been increasing substantially in developing countries over the last decades, such as in Metro Cebu, the Philippines (Ancog & Ruzol, 2015) and Mexico City, Mexico (Merlín-Uribe et al., 2013).
Consequently, the landscape changes of protected areas can diminish their ecosystem services capacity leading to environmental degradation, such as the increasing occurrence of flood hazards. It is caused by the increased stormwater runoff into surface waters and the decreased infiltration for groundwater recharge. According to International Federation of Red Cross (IFRC) in 2013, there have been 1,762 flood occurrences in the world from 2003 to 2012 or approximately 45% disaster events were floods. During this time, the half proportion of human losses due to disaster events were a result of flooding events. It means that people are frequently subjected of to flood hazards.
Disaster losses or impacts can illustrate how community living in the close proximity of hazard sources is vulnerable. It is not only the product of how built environment around the community’s living space have capacity to resist natural hazards occurrences, but also how community as a group consisting of individuals with different characteristics have capacity to prepare, to respond, and to recover from adverse threats (Cutter, Ash, & Emrich, 2014). Recent research found that the behavior
* The full work of this chapter is published in the book “Masyarakat Tangguh Bencana, Pendekatan Sosial Ekonomi, Tata Kelola dan Tata Ruang.” Chapter 3.5, 1st Edition. Editor: Herryal Z. Anwar. LIPI, 2015
`
4
resulting damages and losses is low preparedness level due to lack of knowledge and experience, little awareness, and no institutionalized measures for early warning or evacuation contributed to the human and material losses during the disaster (Bowman & Henquinet, 2015; Couling, 2014).
Certainly, disaster risk can be minimized with the active participation of community members so that they may not get major losses and impact in the aftermath of disaster events. Their capacity can be improved by a set of disaster risk mitigation efforts. Disaster risk mitigation refers to the increase in the likelihood that a household will be able to anticipate, resist or recover from the losses sustained from the hazard or other threat without external assistance (Vojinovic and Abott, 2013). The more risk mitigation efforts they can prepare, the more resilient they are. In order to achieve community resilience, several initiatives have been done, including integrating social protection, disaster risk reduction, and climate change adaptation approaches in disaster affected area (Coirolo, Commins, Haque, & Pierce, 2013; Davies et al., 2013).
Some residential areas in Ilir Barat I Sub-District, Palembang City, is chosen for this study. This city is one of the biggest city in Indonesia with the highest number of swamps. However, this number continues to decline, swamp land with the total of 73.12% in 1919, has decreased to 27.5% in 2010 (Bappeda, 2010). This means that nearly half of the land in Palembang has its function changed. It was also associated with flood events data a few years back in Palembang City. The flooding events increased from 18 events in 2007 to 46 events in 2012 (BPBD Palembang, 2013). Not only that, the increased incidence of floods is also followed by an increase in inundation height and duration (Sagala et al, 2013). Ilir Barat I has the largest size of wetland areas in Palembang.
This research aims to build a concept of disaster resilient communities in Palembang based on their current preparedness. Preparedness is seen as a basic step to build resilience condition. Nonetheless, without a proper capacity and intervention, preparedness only adresses a portion of resilience. In order to achieve this, firstly we need to identify and assess the level of community mitigation in Palembang. Flood mitigation measures are often divided into structural and non-structural measures. Structural measures can be defined as physical interventions in the physical conditions of building facilities, such as raising of structures and installation of protecting walls. Non-structural measures can be defined as interventions which are based on mechanism that influence human behavior, such as perception on risk and planning (Vojinovic and Abott, 2013). This article will follow up by a discussion of literature review of how preparedness is related with resilience. Furthermore, this study will explain the research method used in this paper.
2. Literature Review
2.1. Urban Flood Risk: Causes and Effects
Flood risk in urban area is simply defined as the function of flood hazards on a receptor that has a set of vulnerability attributes. However, it is resulted by a complex combination of natural factors and anthropogenic factors. Some researchers argue that exposure of community living near flood hazard source also contribute to flood risk (Güneralp, Güneralp, & Liu, 2015; Koks, Jongman, Husby, & Botzen, 2015).
Flooding can act as natural hazard that occurs from various water sources in a urban area, including from the sea (coastal flooding), from waterways (fluvial flooding), from overland flow of water that has not reached a natural drainage channel (pluvial flooding), from rising groundwater, from technological failure or convective (flash flood) and from the failure of artificial water systems (Jha, Bloch, & Lamond, 2012; Lamond, Booth, Hammond, & Proverbs, 2012). The natural factors that increase hazard occurrence are a combination of extreme metrological and hydrological factors, for example precipitation and flows. Climate change is predicted to warm seas, change precipitation patterns and rise sea levels in the future (IPCC, 2014). Although there are different scenario upon future climate prediction, increased precipitation and more intense rainfall patterns are predicted to increase the amount of storm water quantity resulting potential flood (Hirabayashi et al., 2013; Kundzewicz et al., 2014).
However, flood is also caused by human activities in urban area that diminish services provided by

`
5
environment. Recent urbanization will lead to serious sustainability challenge because of population boom as predicted to reach almost 5 billion people (60% of the world’s population), compared to 2.9 billion in 2000 (47%) (UN/DESA, 2014). There are benefits attracting people to live and to work in urban area, including economic opportunities, infrastructure services, attractive social life, education provision, etc (Kodoatie, 2013). Consequently, urban density will be higher and followed by increasing needs to provide space for settlement, offices, commerce, industries, infrastructures, etc. To fulfill the needs of socio-economic development in urban area, developable lands are required.
Current urban development practice trends in developing countries lead to unplanned growth (Firman, 2009; Jha et al., 2012; Lamond et al., 2012). The expansion replaces green open spaces and it is not followed by adequate drainage system to substitute the service that environment provides (Ancog & Ruzol, 2015; Merlín-Uribe et al., 2013). The land use changes contribute to the loss of infiltration function and the increase of surface run-off. The storm water that is not absorbed into the ground, will likely to flood and inundate the floodplain. Flooding is also generated by the inability of a watercourse to convey the quantity of runoff flowing downstream.
The trend of socio-economic development in cities in developing countries is predicted to increase the exposure and vulnerability of people, economic activities, and infrastructure to flood risk which will be further intensified by climate change (Güneralp et al., 2015). People, human activities, buildings, and infrastructure are placed within floodplain zone, making them highly exposed to flooding. Güneralp et al. (2015) predict that by 2030, nearly half of the global urban expansion, i.e., over 500,000 km2 from 200,000 km2 in 2000, will take place in the high-frequency flood zones. Although laws and regulations to control new infrastructure construction and the variety of building types exist, they are often not enforced properly because of economic or political factors, or capacity or resource constraints (Jha et al., 2012). People lack awareness, experiences, and information related to flooding events causing inappropriate behavior toward flooding (Scolobig, De Marchi, & Borga, 2012).
Jha et al. (2012) resumed previous research in flooding issue that flooding can cause losses and damage directly and indirectly ways within an urban setting. People are very often to suffer human death, injury, and electrocution because of flooding events. Exacerbated water borne diseases, such as diarrhea, generate health risk because of a lack of pure drinking water and poor sanitation leading to hygiene issue. Flooding disrupts mobility and transportation infrastructure, inundating roads during the flood and causing expensive damage. Buildings and their structure contents are damaged by flood inundation, such as corrosive effect of salinity and damping, which the level of damage depends on flood speed, duration, depth, and contaminant. Both affected infrastructure and buildings disrupt on-going economic activities, for example production process and supply chain. Critical public service, for instance electricity and water supplies, is very often to be off service during the flood event. In the aftermath of a flood, longer-term and intangible impacts of flooding arise such as financial problem for flood victims to return their life and stress-related problems.
2.2 Flood Mitigation Measures
Flood mitigation is one of integral measures in flood risk reduction. It is not only a set of measures that should be taken at the moment of flood occurring, but also before and after the events. Flood mitigation is the combination of structural and non-structural measures to minimize flood, ranging from modifying water flow to preparing community to cope with adverse flood (Jha et al., 2012).
Traditionally, structural measures focus on how engineering-based solution and natural measures can mitigate flood risk in floodplain areas (Jha et al., 2012; Kelman & Rauken, 2012). In this point of view, flooding problems can be solved by hydrological methods and approach. The hydraulic engineering-based solution provides physical interventions to separate water from human activities and their critical infrastructure at different scale, such as rising of structures at a house, building retention dam, construction dikes in some parts of river watershed and installing protecting walls along city shoreline. In addition, other built environment modification could be done by repairing waterways from sedimentation, doing re-vegetation, stabilizing slope, etc.

`
6
Structural flood mitigation is commonly applied within urban settings, but it has drawbacks (Jha et al., 2012). Water amount is potentially to exceed the capacity of infrastructures design as climate change effects could arise more intense precipitation. Structural infrastructures are expensive to build and give temporary safety as, sometimes they do not actually solve the root problems. Construction of dams and other flood control structures contribute to a negative impact on the environment, such as biodiversity loss. It is also. The 2013 Jakarta floods showed that a structural approach, such as the normalization of rivers and canals manufacture of large had not been able to solve the problems of risk (Sagala, Lassa, Yasaditama, & Hudalah, 2013).
Non-structural measure can be defined as interventions which are based on mechanism that influence human behavior, such as perception on risk and preparedness. The active community participation must be combined with structural measures in order to get minimum risk. Non-structural measure is aimed to reduce vulnerability embedded in community characteristics. It includes predicting flood occurrence, setting early warning system, communicating flood risk, conducting disaster preparedness, and regulating land use development (Jha et al., 2012; Nicholls, 2012; Situngkir et al 2014). Comparing to structural measure, these efforts are relatively inexpensive, but it needs comprehensive participation from institutional level to public level.
2.3 Community Disaster Resilience
“Community resilience” term has been used widely by policymakers, scholars, and practitioners who work in emergency management. Despite it has gained its popularity, there is no rigid definition due to wide and different view on how the term is used by them. The term also vary widely from many disciplines, such psychology, public health, ecology, etc. Cutter et al. (2014) defines that resilience enhance capacities “to absorb stress or destructive forces through resistance or adaptation; to manage, or maintain certain basic functions and structures, during disastrous events; and to recover after an event”. Resilience is a state where people can adapt to environmental changes and to be prepared toward future sustainability (Cutter, 2013). Arbon, Gebbie, Cusack, Perera, and Verdonk (2012) emphasize resilience as a process of continuous engagement that builds preparedness prior to a disaster and allows recovery afterwards. Recent researchers have proposed disaster resilience model from different perspective, including institutional network capacities (Doerfel, Chewning, & Lai, 2013; Islam & Walkerden, 2015), the economy (Park, Cho, & Rose, 2011), a set of social capital (Rivera & Nickels, 2014; Wickes, Zahnow, Taylor, & Piquero, 2015), governance (Djalante, Holley, & Thomalla, 2011), and infrastructure (Chang, McDaniels, Fox, Dhariwal, & Longstaff, 2014).
Kapucu, Hawkins, and Rivera (2013) argue that community resilience can be achieve through four keys. The capacity of communities is composed of four key factors. First, social capital plays important role in building strong relationships and networks within the community. It provides financial supports (e.g., in-kind donation and loans for property repair) and non-financial resources (e.g., search and rescue, debris removal, child and elderly care during recovery, psychological support, emergency shelter, and hazard information) (Aldrich & Meyer, 2015). Secondly, community capability to collaborate in problem solving strategies, skills, and flexibility is also an important factor in determining the capacity of communities. Strong social ties among community members influence evacuation behavior and coordination. Thirdly, information flows within the community and communication infrastructure are necessary to give trusted resources of information so that they can prepare and cope. Therefore, community needs strong partnership and coordination with national, regional, and local agencies with clear lines of responsibility (Nicholls, 2012). Fourthly, necessary resources and risks need to be fairly distributed across the community.
To be resilient, community requires the ability of an individual, family, group, class or community to use resources and access the resources (Kapucu et al., 2013). The resource can be acquired from different sources, including individual to organizational resources. The resources are economic (e.g. immediate money to recover), political (e.g. representation in DRR policy-making), social (solidarity and ability to collective activities) and human (particular skills in creating jobs) resources (Wisner, Gaillard, & Kelman, 2012). The resources has fulfill four criterion: robustness, redundancy, rapidity, and resourcefulness (Kapucu et al., 2013). Robustness of resources means to the strength and quality
`
7
of the resources under disaster stress. Redundancy highlights the need for alternative resources in the event of a disaster so that community can keep maintaining their needs. Rapidity is a resource capacity to meet priorities and achieve goals in timely manner. Resourcefulness is the ability to utilize human and physical resources to meet predetermined goals.
To be resilient community requires learning process how to adapt to new conditions and spend more resources and efforts preparing for future disasters (Kapucu et al., 2013). Community can learn from previous experience as well as information gained from different stakeholders that are involved in emergency management practices. The learning process can be done from individual level, organizational level, and community level.
Having a plan on the right scale means that the planning of community sustainability and resilience are not only performed on the actors at the top position, but it also should pay attention to the involvement of local communities (Patterson, Weil, & Patel, 2010). Involvement of local communities is needed in order to insert local and traditional knowledge into comprehensive planning (Mercer, Kelman, Taranis, & Suchet-Pearson, 2010). With the involvement of local people in monitoring, understanding, communication, and decision making for aspects of the disaster then expected losses can be minimized.
3. Methods
3.1 Data Analysis Method
This study is using a quantitative as the main approach, in which measurement process is a central part in the study because the measurements provide fundamental connection between empirical observations and mathematical expressions. Acquisition of data from the respondents was analyzed inductively, which means that this study is based on the most likely condition that will eventually produce a new general hypothesis. Descriptive analyses are used to describe the state of the object of study, so that the information can be easily read and understood.
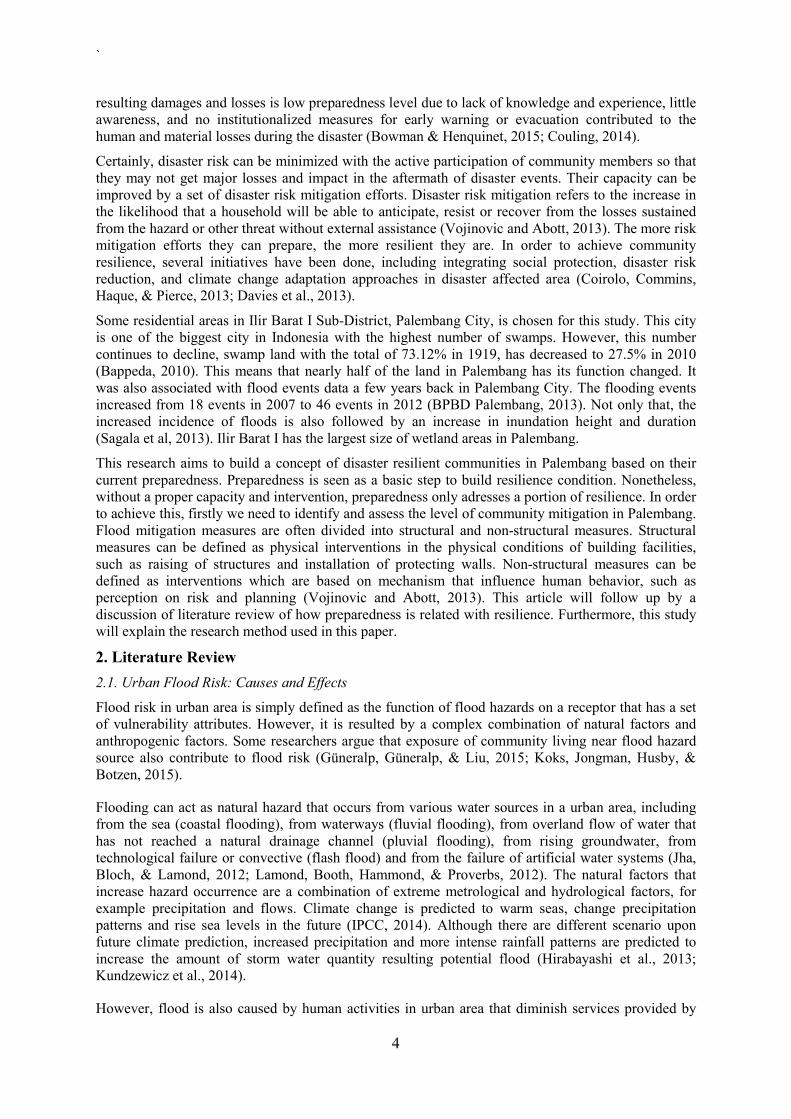
This study basically wants to encourage people, to realize that they are located in a disaster prone area and make them willing to undertake mitigation actions, until a disaster resilient community will be formed. The study area for this research is taken at Macan Lindungan Settlement, which is one of the highest degree of vulnerability to flooding in Palembang (black circle in Figure 1).
Figure 1 Flood-prone Area in Palembang Source: Bappeda of Palembang City, 2010
3.2 Data Collection Methods
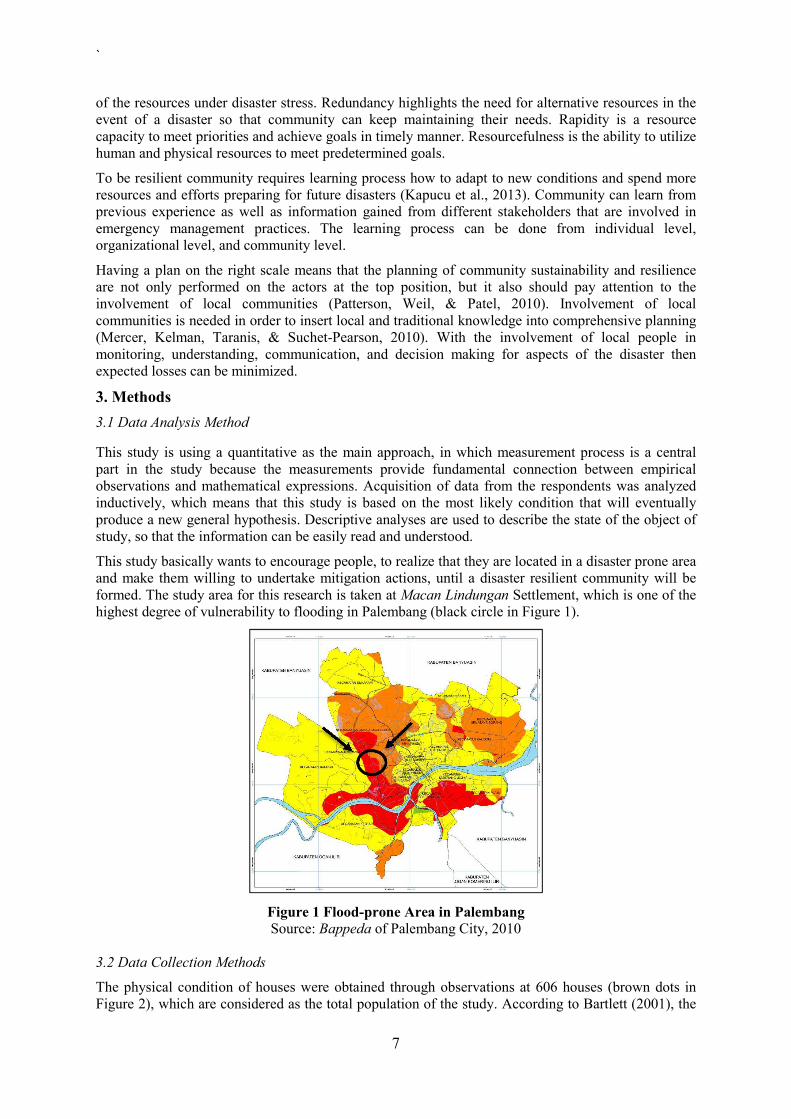
The physical condition of houses were obtained through observations at 606 houses (brown dots in Figure 2), which are considered as the total population of the study. According to Bartlett (2001), the
`
8
appropriate sample size, refer to the table with 90% confidence level with margin of error of 5%, and total population size of 700 is 196 samples. We managed to get 198 samples that can be considered as the representative of the population who were given a questionnaire. This study is using quota sampling, which is a technique for determining sample of the population that have certain characteristics. The samples were taken based on similar characteristics and geographical proximity. It was done to determine to what extent the preparedness of house with different characteristics.
Figure 2 The Area of Study
4. Results
4.1 Identification of Structural Mitigation
Preparedness is not only about performing various mitigations, but also by adjusting the conditions of the building (Kreibich et al, 2007). This section will show societies’ structural preparedness obtained through field observations.
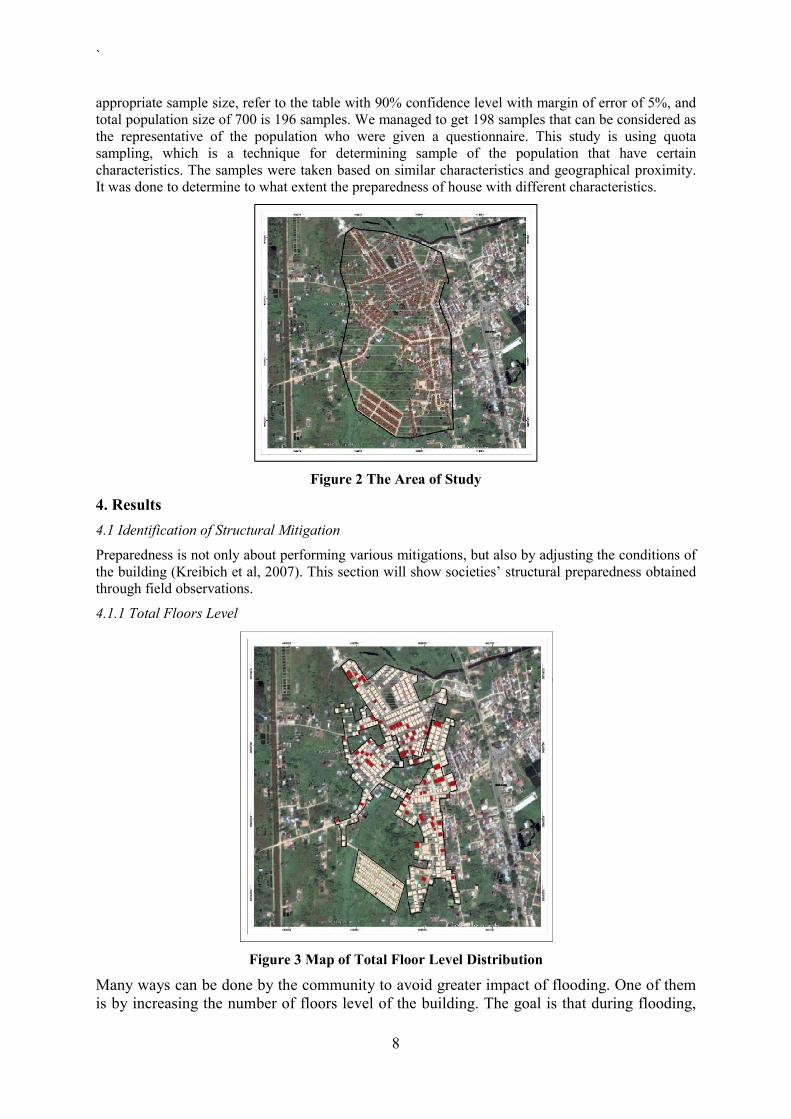
4.1.1 Total Floors Level
Figure 3 Map of Total Floor Level Distribution
Many ways can be done by the community to avoid greater impact of flooding. One of them is by increasing the number of floors level of the building. The goal is that during flooding,

`
9
the homeowner does not need to evacuate to move from his home, evacuates to higher floors level of the house is enough. Figure 3 shows the distribution of the number of floors level in Macan Lindungan Settlement. Based on the results obtained, the white dots show houses with only one level of floor, while the red dots show houses that have two or more level of floors. The descriptive analysis is shown in Table 1. Based on the table, only 11.1% houses out of 606 houses, that can be considered safe in terms of the number of floors level of the house. While the rest, forced to seek temporary fty7gfj5jynrfu5ynf7shelter or they can stay in their homes still, but with conditions flooded conditions.
Table 1 Total Floors Level
Floors Level Total
1 539
2 67
Total Houses 606
Figure 4 Houses with Two Floors Level
4.1.2 The Hight of the First Floor to Street Surface
Figure 5 Map of the First Floor Height to Street Surface
One of the most common ways of society to deal with flooding is by elevating the position of the first floor until higher than the street in front. This is the most commonly used way by the people at Macan

`
10
Lindungan Settlement. This way can secure the entire interior of the house when flooding occur. But on the other hand, the cost of required expenditures to elevate the first floor is big enough. More details about this mitigation can be seen in Figure 5.
Based on observations, it was found that the overall height of houses in Macan Lindungan Settlement varies from -75 cm to 300 cm above the road surface. The higher position of the first floor of building, the less probability of the houses to be affected by floods. On Figure 5, the white dots show houses with lower first floor than the street surface, while houses with a color other than white are houses with higher first floor than the street surface, but in various heights. Based on statistical data processing, there are 77.4% houses that already have higher position of the first floor than the street surface in front.
Table 2 Number of House First Floor Position to Street Surface
Position to Street Surface Total
Lower 137
Higher 469
Total Houses 606
Figure 6 Position of First Floor to Street Surface
4.1.3 Use of Water Barrier at Door
Figure 7 Map of Water Barrier Users
If it is too expensive to elevate the first floor of the house, usually people would choose to make such a barrier in the door of the house entrance in order to avoid water to enter the house. There are two
`
11
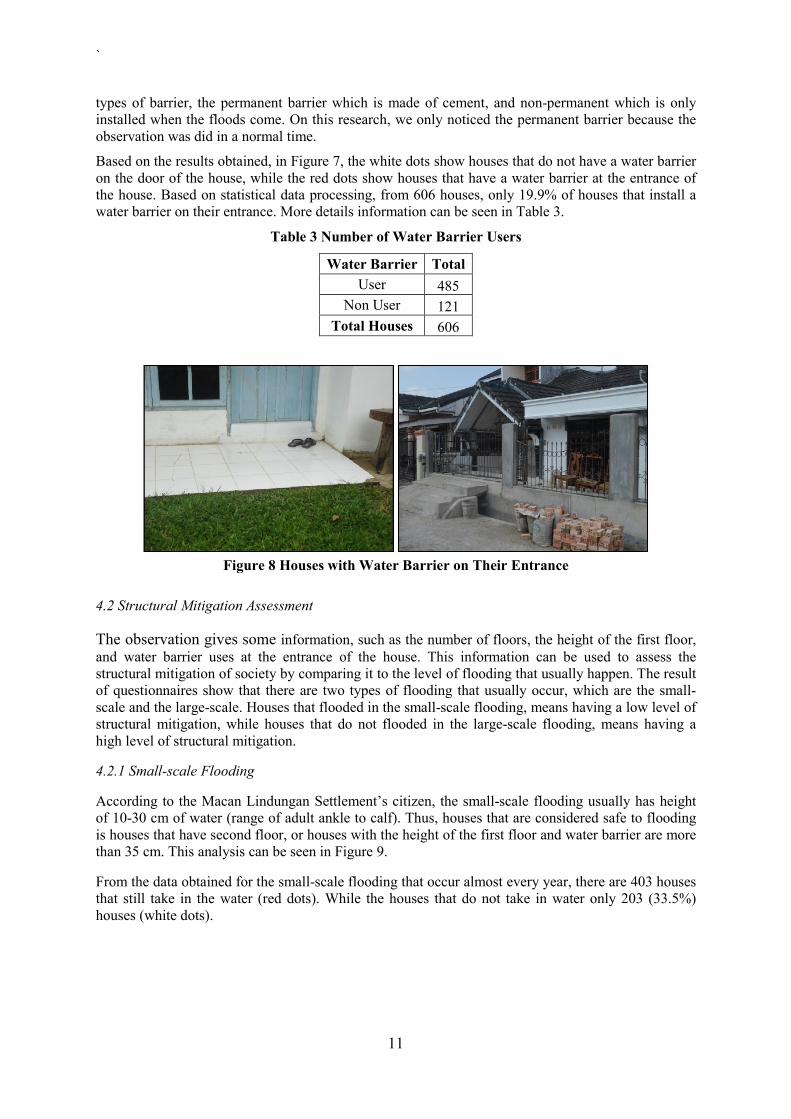
types of barrier, the permanent barrier which is made of cement, and non-permanent which is only installed when the floods come. On this research, we only noticed the permanent barrier because the observation was did in a normal time.
Based on the results obtained, in Figure 7, the white dots show houses that do not have a water barrier on the door of the house, while the red dots show houses that have a water barrier at the entrance of the house. Based on statistical data processing, from 606 houses, only 19.9% of houses that install a water barrier on their entrance. More details information can be seen in Table 3.
Table 3 Number of Water Barrier Users
Water Barrier Total
User 485
Non User 121
Total Houses 606
Figure 8 Houses with Water Barrier on Their Entrance
4.2 Structural Mitigation Assessment
The observation gives some information, such as the number of floors, the height of the first floor, and water barrier uses at the entrance of the house. This information can be used to assess the structural mitigation of society by comparing it to the level of flooding that usually happen. The result of questionnaires show that there are two types of flooding that usually occur, which are the small-scale and the large-scale. Houses that flooded in the small-scale flooding, means having a low level of structural mitigation, while houses that do not flooded in the large-scale flooding, means having a high level of structural mitigation.
4.2.1 Small-scale Flooding
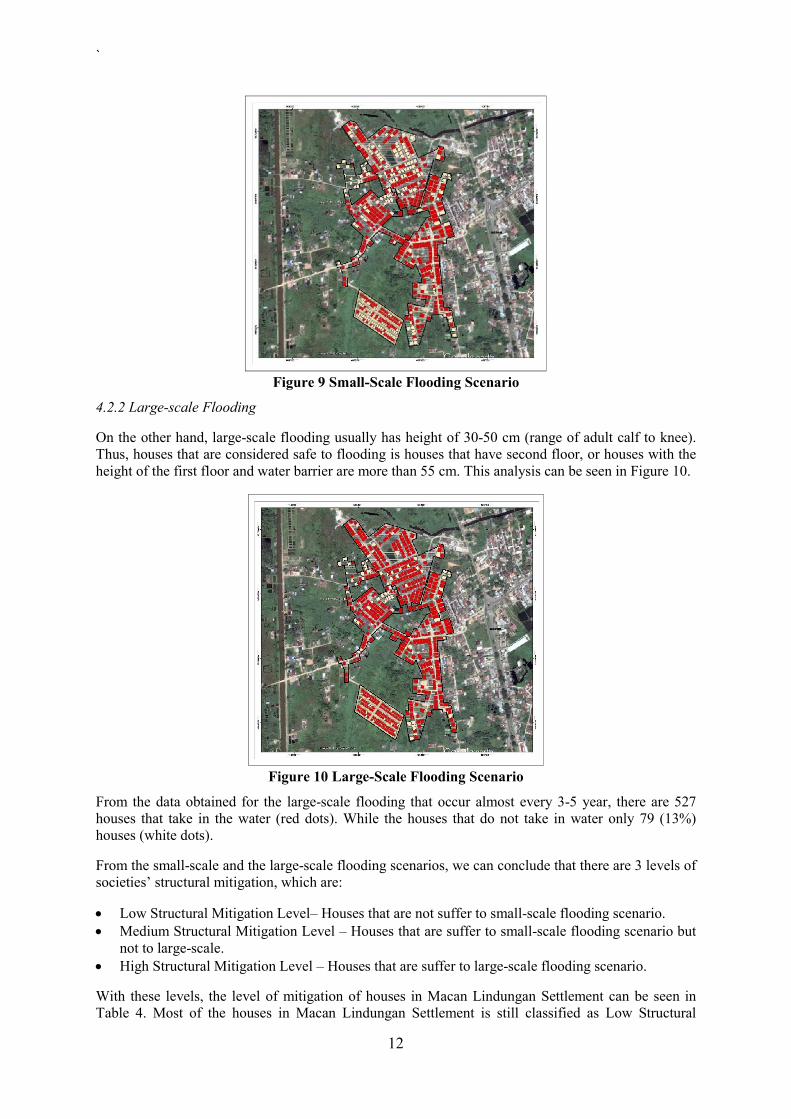
According to the Macan Lindungan Settlement’s citizen, the small-scale flooding usually has height of 10-30 cm of water (range of adult ankle to calf). Thus, houses that are considered safe to flooding is houses that have second floor, or houses with the height of the first floor and water barrier are more than 35 cm. This analysis can be seen in Figure 9.
From the data obtained for the small-scale flooding that occur almost every year, there are 403 houses that still take in the water (red dots). While the houses that do not take in water only 203 (33.5%) houses (white dots).
`
12
Figure 9 Small-Scale Flooding Scenario
4.2.2 Large-scale Flooding
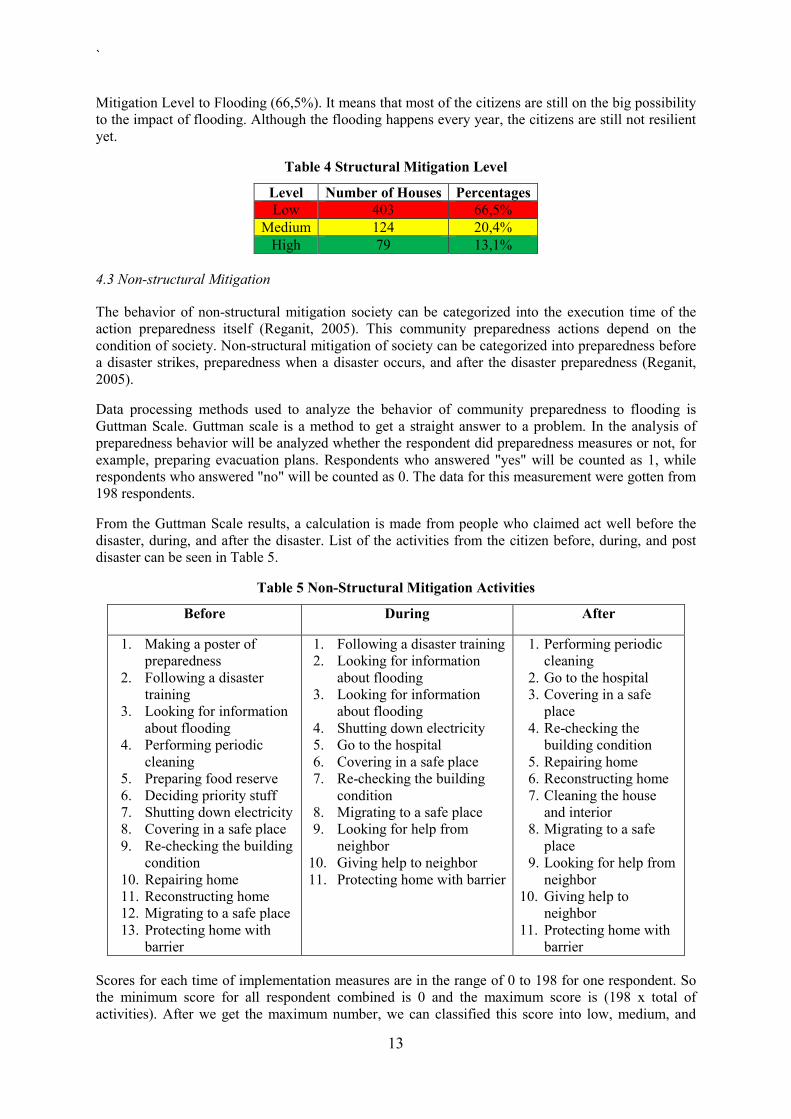
On the other hand, large-scale flooding usually has height of 30-50 cm (range of adult calf to knee). Thus, houses that are considered safe to flooding is houses that have second floor, or houses with the height of the first floor and water barrier are more than 55 cm. This analysis can be seen in Figure 10.
Figure 10 Large-Scale Flooding Scenario
From the data obtained for the large-scale flooding that occur almost every 3-5 year, there are 527 houses that take in the water (red dots). While the houses that do not take in water only 79 (13%) houses (white dots).
From the small-scale and the large-scale flooding scenarios, we can conclude that there are 3 levels of societies’ structural mitigation, which are:
Low Structural Mitigation Level– Houses that are not suffer to small-scale flooding scenario. Medium Structural Mitigation Level – Houses that are suffer to small-scale flooding scenario but
not to large-scale. High Structural Mitigation Level – Houses that are suffer to large-scale flooding scenario.
With these levels, the level of mitigation of houses in Macan Lindungan Settlement can be seen in Table 4. Most of the houses in Macan Lindungan Settlement is still classified as Low Structural
`
13
Mitigation Level to Flooding (66,5%). It means that most of the citizens are still on the big possibility to the impact of flooding. Although the flooding happens every year, the citizens are still not resilient yet.
Table 4 Structural Mitigation Level
Level Number of Houses Percentages Low 403 66,5%
Medium 124 20,4% High 79 13,1%
4.3 Non-structural Mitigation
The behavior of non-structural mitigation society can be categorized into the execution time of the action preparedness itself (Reganit, 2005). This community preparedness actions depend on the condition of society. Non-structural mitigation of society can be categorized into preparedness before a disaster strikes, preparedness when a disaster occurs, and after the disaster preparedness (Reganit, 2005).
Data processing methods used to analyze the behavior of community preparedness to flooding is Guttman Scale. Guttman scale is a method to get a straight answer to a problem. In the analysis of preparedness behavior will be analyzed whether the respondent did preparedness measures or not, for example, preparing evacuation plans. Respondents who answered "yes" will be counted as 1, while respondents who answered "no" will be counted as 0. The data for this measurement were gotten from 198 respondents.
From the Guttman Scale results, a calculation is made from people who claimed act well before the disaster, during, and after the disaster. List of the activities from the citizen before, during, and post disaster can be seen in Table 5.
Table 5 Non-Structural Mitigation Activities
Before During After
1. Making a poster of preparedness
2. Following a disaster training
3. Looking for information about flooding
4. Performing periodic cleaning
5. Preparing food reserve 6. Deciding priority stuff 7. Shutting down electricity 8. Covering in a safe place 9. Re-checking the building
condition 10. Repairing home 11. Reconstructing home 12. Migrating to a safe place 13. Protecting home with
barrier
1. Following a disaster training 2. Looking for information
about flooding 3. Looking for information
about flooding 4. Shutting down electricity 5. Go to the hospital 6. Covering in a safe place 7. Re-checking the building
condition 8. Migrating to a safe place 9. Looking for help from
neighbor 10. Giving help to neighbor 11. Protecting home with barrier
1. Performing periodic cleaning
2. Go to the hospital 3. Covering in a safe
place 4. Re-checking the
building condition 5. Repairing home 6. Reconstructing home 7. Cleaning the house
and interior 8. Migrating to a safe
place 9. Looking for help from
neighbor 10. Giving help to
neighbor 11. Protecting home with
barrier
Scores for each time of implementation measures are in the range of 0 to 198 for one respondent. So the minimum score for all respondent combined is 0 and the maximum score is (198 x total of activities). After we get the maximum number, we can classified this score into low, medium, and
`
14
high. Based on the results, we can conclude that, the non-structural mitigation of citizen in Macan Lindungan Settlement before, during, and post flooding are still low. The detail of this information can be seen in Table 6.
Table 6 Structural Mitigation Level
Timing Score Class
Before 380 Low
During 289 Low
After 676 Low
5. Discussion
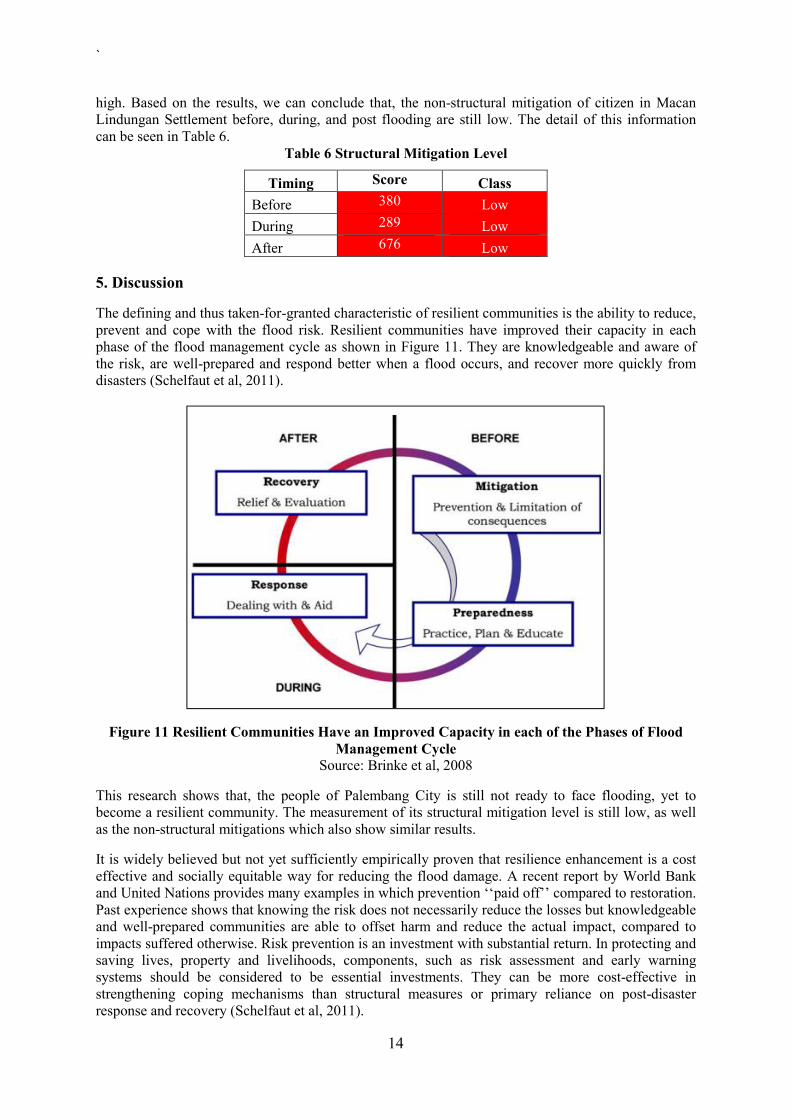
The defining and thus taken-for-granted characteristic of resilient communities is the ability to reduce, prevent and cope with the flood risk. Resilient communities have improved their capacity in each phase of the flood management cycle as shown in Figure 11. They are knowledgeable and aware of the risk, are well-prepared and respond better when a flood occurs, and recover more quickly from disasters (Schelfaut et al, 2011).
Figure 11 Resilient Communities Have an Improved Capacity in each of the Phases of Flood Management Cycle
Source: Brinke et al, 2008
This research shows that, the people of Palembang City is still not ready to face flooding, yet to become a resilient community. The measurement of its structural mitigation level is still low, as well as the non-structural mitigations which also show similar results.
It is widely believed but not yet sufficiently empirically proven that resilience enhancement is a cost effective and socially equitable way for reducing the flood damage. A recent report by World Bank and United Nations provides many examples in which prevention ‘‘paid off’’ compared to restoration. Past experience shows that knowing the risk does not necessarily reduce the losses but knowledgeable and well-prepared communities are able to offset harm and reduce the actual impact, compared to impacts suffered otherwise. Risk prevention is an investment with substantial return. In protecting and saving lives, property and livelihoods, components, such as risk assessment and early warning systems should be considered to be essential investments. They can be more cost-effective in strengthening coping mechanisms than structural measures or primary reliance on post-disaster response and recovery (Schelfaut et al, 2011).

`
15
Resilience of flood-prone communities can be evaluated according to natural, physical, economic, institutional and social criteria (Cutter et al., 2010; Shaw, 2009). It is generally accepted that the integration of more dimensions can positively contribute to the level of resilience.
6. Conclusion
This paper has discussed how community preparedness is related with community resilience in the context residential areas of Palembang City. This was addressed in the first aim, which was to examine the structural mitigation of the citizen to flooding. Most of the houses in Macan Lindungan Settlement is still classified as Low Structural Mitigation Level to Flooding (66,5%). It means that most of the citizens are still on the big possibility to the impact of flooding. Although the flooding happens every year, the citizens are still not resilient yet. The second aim is also not much different. The non-structural mitigation of citizen in Macan Lindungan Settlement before, during, and after flooding are also low.
This study found a various numbers of structural and non-structural measures conducted by the community. However, it is shown rather as coping mechanisms rather than a systematic way to reduce the risks. This is because the source of risks is beyond community capacity. There should be an external intervention from government, private sector, etc (Sagala et al, 2015). Resilience should be an integral part of the development and the agenda of the stakeholders involved in the risk context. In this situation, many landuse conversion is due to private developers. The role of local government through implementation, monitoring, evaluation of local law related to wetland conversion is necessary. Community can play role to inform local government if there is any violation in term of landuse conversion that cause flooding. Therefore, there needs to be a strong channel where community voice can be used and followed up with intervention.
Resilience enhancement provides an added value to operational flood risk management. The resilience concept is seen as a multi-disciplinary approach in which technical measures are integrated with economic, environmental, social and governance measures. The establishment of flood resilient communities promises effective means for adaptive management of disasters in a changing world. Although authorities do not yet completely acknowledge the implementation of this concept, some measures are already partly or fully implemented in recent FRM approaches. The latter proves that the introduction of resilience into flood risk management is feasible. It remains yet innovative to have resilience measures implemented in an integrated
Acknowledgments
This research is partially supported by data from ITB Research Grant in 2014 entitled “Model of Provision of Sustainable Retention Pond to Mitigate Flooding in Wetland Area of Urban Palembang” (Hibah Penelitian Proyek Pengembangan ITB (III) 2014) and ITB Innovation Research Grant 2014 “Spatial Model of Wetlands Change and The Increasing of Flood Events in Palembang City”. We thank Dodon Yamin, Fernando Situngkir, Ayuwas Widia Sari during data collection of this research and also our respondents in Ilir Barat I Sub-District, Palembang.
References
Aldrich, D. P., & Meyer, M. A. (2015). Social Capital and Community Resilience. American Behavioral Scientist, 59(2), 254-269. doi:10.1177/0002764214550299
Ancog, R., & Ruzol, C. (2015). Urbanization adjacent to a wetland of international importance: The
case of Olango Island Wildlife Sanctuary, Metro Cebu, Philippines. Habitat International, 49, 325-332. doi:http://dx.doi.org/10.1016/j.habitatint.2015.06.007
Arbon, P., Gebbie, K., Cusack, L., Perera, S., & Verdonk, S. (2012). Developing a model and tool to
measure community disaster resilience. Adelaide: Torrents Resilience Institute.

`
16
Bartlett, J. E., Kotrlik, J. W., & Higgins, C. C. (2001). Organizational Research: Determining Appropriate Sample Size in Survey Research. Lousiana: Organizational Systems Research Association.
Bowman, L. J., & Henquinet, K. B. (2015). Disaster risk reduction and resettlement efforts at San
Vicente (Chichontepec) Volcano, El Salvador: toward understanding social and geophysical vulnerability. Journal of Applied Volcanology, 4(1), 1-18. doi:10.1186/s13617-015-0031-0
Brinke, W.B.M., Saeijs, G.E.M., Helsloot, I., van Alphen, J., 2008. Safety chain approach in flood
risk management. Proceedings of the Institution of Civil Engineers-Municipal Engineer 161 (2), 93–102.
Chang, S. E., McDaniels, T., Fox, J., Dhariwal, R., & Longstaff, H. (2014). Toward Disaster-Resilient
Cities: Characterizing Resilience of Infrastructure Systems with Expert Judgments. Risk Analysis, 34(3), 416-434. doi:10.1111/risa.12133
Coirolo, C., Commins, S., Haque, I., & Pierce, G. (2013). Climate Change and Social Protection in
Bangladesh: Are Existing Programmes Able to Address the Impacts of Climate Change? Development Policy Review, 31, o74-o90. doi:10.1111/dpr.12040
Couling, M. (2014). Tsunami risk perception and preparedness on the east coast of New Zealand
during the 2009 Samoan Tsunami warning. Natural Hazards, 71(1), 973-986. doi:10.1007/s11069-013-0945-y
Cutter, S.L., Burton, C.G., Emrich, C., 2010. Disaster resilience indicators for benchmarking baseline
conditions. Journal of Homeland Security and Emergency Management 7 (1), 1–22. Cutter, S. L. (2013). Building disaster resilience: steps toward sustainability. Challenges in
Sustainability, 1, 72+. Retrieved from http://go.galegroup.com/ps/i.do?id=GALE%7CA370212716&v=2.1&u=sunybuff_main&it=r&p=AONE&asid=7fe1494d0e7c76c15e24fa93791709d8
Cutter, S. L., Ash, K. D., & Emrich, C. T. (2014). The geographies of community disaster resilience.
Global environmental change, 29, 65-77. doi:http://dx.doi.org/10.1016/j.gloenvcha.2014.08.005
Davies, M., Béné, C., Arnall, A., Tanner, T., Newsham, A., & Coirolo, C. (2013). Promoting Resilient
Livelihoods through Adaptive Social Protection: Lessons from 124 programmes in South Asia. Development Policy Review, 31(1), 27-58. doi:10.1111/j.1467-7679.2013.00600.x
Djalante, R., Holley, C., & Thomalla, F. (2011). Adaptive governance and managing resilience to
natural hazards. International Journal of Disaster Risk Science, 2(4), 1-14. doi:10.1007/s13753-011-0015-6
Doerfel, M. L., Chewning, L. V., & Lai, C.-H. (2013). The Evolution of Networks and the Resilience
of Interorganizational Relationships after Disaster. Communication Monographs, 80(4), 533-559. doi:10.1080/03637751.2013.828157
Firman, T. (2009). The continuity and change in mega-urbanization in Indonesia: A survey of
Jakarta–Bandung Region (JBR) development. Habitat International, 33(4), 327-339. Güneralp, B., Güneralp, İ., & Liu, Y. (2015). Changing global patterns of urban exposure to flood and
drought hazards. Global environmental change, 31, 217-225. doi:http://dx.doi.org/10.1016/j.gloenvcha.2015.01.002

`
17
Hirabayashi, Y., Mahendran, R., Koirala, S., Konoshima, L., Yamazaki, D., Watanabe, S., . . . Kanae, S. (2013). Global flood risk under climate change. Nature Climate Change, 3(9), 816-821. doi:10.1038/nclimate1911
IFRC. (2013). World Disaster Report. Retrieved from Geneva, Switzerland: IPCC. (2014). Climate Change 2014: Impacts, Adaptation, and Vulnerability. Part B: Regional
Aspects. Contribution of Working Group II to the Fifth Assessment Report of the Intergovernmental Panel on Climate Change. Cambrigde, UK and New York, USA: Cambridge University Press.
Islam, R., & Walkerden, G. (2015). How do links between households and NGOs promote disaster
resilience and recovery?: A case study of linking social networks on the Bangladeshi coast. Natural Hazards, 78(3), 1707-1727. doi:10.1007/s11069-015-1797-4
Jha, A. K., Bloch, R., & Lamond, J. (2012). Cities and flooding: a guide to integrated urban flood risk
management for the 21st century: World Bank Publications. Kapucu, N., Hawkins, C. V., & Rivera, F. I. (2013). Disaster Preparedness and Resilience for Rural
Communities. Risk, Hazards & Crisis in Public Policy, 4(4), 215-233. doi:10.1002/rhc3.12043
Kelman, I., & Rauken, T. (2012). The paradigm of structural engineering approaches for river flood
risk reduction in Norway. Area, 44(2), 144-151. doi:10.1111/j.1475-4762.2011.01074.x Kreibich, Heide., Thieken, Annegret. 2007. “Coping With Floods in the City Of Dresenden,
Germany”. Journal in Natural Hazard and Earth System Sciennces Koks, E., Jongman, B., Husby, T., & Botzen, W. (2015). Combining hazard, exposure and social
vulnerability to provide lessons for flood risk management. Environmental Science & Policy, 47, 42-52.
Kundzewicz, Z. W., Kanae, S., Seneviratne, S. I., Handmer, J., Nicholls, N., Peduzzi, P., . . .
Sherstyukov, B. (2014). Flood risk and climate change: global and regional perspectives. Hydrological Sciences Journal/Journal des Sciences Hydrologiques, 59(1), 1-28. doi:10.1080/02626667.2013.857411
Lamond, J. E., Booth, C. A., Hammond, F. N., & Proverbs, D. (2012). Flooding in the Built
Environment. In J. E. Lamond, C. A. Booth, F. N. Hammond, & D. Proverbs (Eds.), Flood Hazards (pp. 1-6). Florida, USA: CRC Press.
Martinuzzi, S., Radeloff, V. C., Joppa, L. N., Hamilton, C. M., Helmers, D. P., Plantinga, A. J., &
Lewis, D. J. (2015). Scenarios of future land use change around United States’ protected areas. Biological Conservation, 184, 446-455. doi:http://dx.doi.org/10.1016/j.biocon.2015.02.015
Mercer, J., Kelman, I., Taranis, L., & Suchet-Pearson, S. (2010). Framework for integrating
indigenous and scientific knowledge for disaster risk reduction. Disasters, 34(1), 214-239. Merlín-Uribe, Y., Contreras-Hernández, A., Astier-Calderón, M., Jensen, O. P., Zaragoza, R., &
Zambrano, L. (2013). Urban expansion into a protected natural area in Mexico City: alternative management scenarios. Journal of Environmental Planning & Management, 56(3), 398-411. doi:10.1080/09640568.2012.683686
`
18
Nicholls, S. (2012). The resilient community and communication practice. Australian Journal of Emergency Management, The, 27(1), 46-51.
Park, J., Cho, J., & Rose, A. (2011). Modeling a major source of economic resilience to disasters:
recapturing lost production. Natural Hazards, 58(1), 163-182. doi:10.1007/s11069-010-9656-9
Partoyo, & Shrestha, R. P. (2013). Monitoring farmland loss and projecting the future land use of an
urbanized watershed in Yogyakarta, Indonesia. Journal of Land Use Science, 8(1), 59-84. Patterson, O., Weil, F., & Patel, K. (2010). The role of community in disaster response: conceptual
models. Population Research and Policy Review, 29(2), 127-141. Reganit, Mefi Palmino 2005 : Analysis of community's coping mechanisms in relation of floods : a
case study in Naga City, Philippines. Thesis. International Institute for Geo-Information Science and Earth Observation Enschede Netherland-ITC
Rivera, J. D., & Nickels, A. E. (2014). Social Capital, Community Resilience, and Faith-Based
Organizations in Disaster Recovery: A Case Study of Mary Queen of Vietnam Catholic Church. Risk, Hazards & Crisis in Public Policy, 5(2), 178-211. doi:10.1002/rhc3.12050
Sagala, S., Dodon, D., Lutfiana, D., & Wimbardana, R. (2013). Wetlands Land Use Change in
Palembang City: Issues and Implication to Urban Flood Mitigation Policy. In H. Anwar (Ed.), Disaster Management Issues in Indonesia (In Indonesian Languange). Bandung, Indonesia: Indonesian Institute of Science (LIPI).
Sagala, S., Lassa, J. A., Yasaditama, H., & Hudalah, D. (2013). The evolution of risk and
vulnerability in Greater Jakarta: contesting government policy. IRGSC Working Paper, 2. Sagala, S., Anwar, H., Lubis, W. and Yamin, D. (2015) Strengthening Community Resilience from
Spatial Plan Perspective, LIPI Book.Scolobig, A., De Marchi, B., & Borga, M. (2012). The missing link between flood risk awareness and preparedness: findings from case studies in an Alpine Region. Natural Hazards, 63(2), 499-520. doi:10.1007/s11069-012-0161-1
Schelfaut, K., Pannemans, B., van der Craats, I., Krywkow, J., Mysiak, J.,Cools. Bringing flood
resilience into practice: the FREEMAN project. 2011. DOI: 10.1016/j.envsci.2011.02.009 Shaw, R., 2009. Climate Disaster Resilience: Focus on Coastal Urban Cities in Asia. Technical
Report. International Environment and Disaster Management (IEDM) Laboratory, Graduate School of Global Environmental Studies, Kyoto University.
Situngkir, F., Sagala, S., Yamin, D., & Widyasari, A. (2014). Spatial Relationship Between Land Use
Change and Flood Occurrences in Urban Area of Palembang. UN/DESA. (2014). World Urbanization Prospects: The 2014 Revision. . Retrieved from New York: Van Asselen, S., Verburg, P. H., Vermaat, J. E., & Janse, J. H. (2013). Drivers of Wetland
Conversion: a Global Meta-Analysis. PLoS ONE, 8(11), e81292. doi:10.1371/journal.pone.0081292
Wickes, R., Zahnow, R., Taylor, M., & Piquero, A. R. (2015). Neighborhood Structure, Social
Capital, and Community Resilience: Longitudinal Evidence from the 2011 Brisbane Flood Disaster*. Social Science Quarterly, 96(2), 330-353. doi:10.1111/ssqu.12144

`
19
Wisner, B., Gaillard, J. C., & Kelman, I. (2012). Handbook of Hazards and Disaster Risk Reduction and Management: Routledge.