wahiawa irrigation system economic impact study -...
TRANSCRIPT
Wahiawa Irrigation System Economic Impact Study
Final
November 21, 2008
By:
Mana K. Southichack, Ph.D. Economist
Hawaii Department of Agriculture Agricultural Development Division Market Analysis and News Branch
Department of Agriculture
STATE OF HAWAII

i
Acknowledgments
Farm owners and operators who participated in the mail-in survey and who spent their valuable time answering questions face-to-face- and over the phone are greatly appreciated. Dr. Matthew K. Loke, Administrator of the Agricultural Development Division, HDOA, and Mr. Alfredo A. Lee, Executive Director of the Agribusiness Development Corporation, have provided helpful guidance and suggestions. Appreciation is extended to Dr. Khem Sharma and Dr. Binsheng Li of Department of Business and Economic Development and Tourism, for explaining the new Hawaii inter-regional multipliers; and to the National Agricultural Statistics Services-Hawaii Field Office for providing certain data. The cooperation of anonymous industry members in providing information and clarifying some issues are highly valuable. However, all errors and omissions are the author’s responsibility alone.
Disclaimer
The views and opinions expressed herein are those of the author and do not necessarily represent or reflect the position of the Hawaii Department of Agriculture.
ii
Executive Summary The Wahiawa Irrigation System (WIS) has a critical role in the economy of Hawaii by providing an essential input for agricultural production in the Wahiawa-Waialua-Haleiwa area. Like for many other types of infrastructure such as roads, airports, harbors and power grid, the economic impact of an irrigation system is most crucial in the service it provides that makes possible for other economic activities to take place and thrive. In fact, the WIS is the sole factor making agricultural production possible in the area under study, which is among the most productive agricultural lands in Hawaii and Oahu in particular. The study aims at analyzing the economic impact of the WIS in its current operating configuration, which requires a six-person team to maintain with an estimated annual operations budget of approximately $765,000, based on 2007 costs, and with existing farm operations. The economic impact is estimated and presented in three different measures: (1) sales value of farm products; (2) direct contribution to Gross Domestic Product (GDP) by agricultural production; and (3) total economic impact with multiplier effects. The study is useful as an essential reference for decision making regarding the acquisition and management of the currently private-owned and managed WIS by State of Hawaii. Built in 1906, it originally had 50 million gallon a day of irrigation capacity to serve 12,000 acres of sugarcane fields and 5,000 acres of pineapple fields. Before the Waialua Sugar Company ceased operation in 1996, and so did its plantation, 30 million gallons were drawn from the WIS daily. Most recently, roughly 10 million gallons of water has been drawn daily from the system to service approximately 6,400 acres growing diversified crops and the remaining pineapples. In 2007, the WIS contributed to approximately $37.7 million in farm production, sold at farm- gate prices, 569 full-time and part-time farm jobs and $14.4 million of household earnings (in wages and business profits). After subtracting costs of farm inputs imported (fuel, fertilizer, materials, equipment and machinery, etc.) and locally supplied intermediate inputs from the aggregate farm sale value, it is determined that farm production in that year contributed nearly $28 million to State’s GDP. Although these figures provide useful measures of the economic worth of the WIS, from different perspectives, they do not provide the full scale of economic impacts of the WIS. To depict the full scale of economic impacts of the WIS, the input-output method is applied to account for the multiplier effects through industrial interdependence. The indirect and induced effects of farm operations, through intra- and inter-industry purchases and household expenditures of disposable incomes, resulted in $47.5 million of goods and serviced produced and sold, 411 full-time and part-time jobs, and $14.3 million of earnings across industries statewide. Adding the initial impacts (at the farm level) to the indirect and induced effects, it is concluded that the WIS resulted in approximately $85.2 million of goods and services produced and sold in total across industries in Hawaii's economy. Associated with this economy-wide total impact on output is $28.7 million of household earnings and 980 full-time and part-time jobs created in a wide range of industries in Hawaii. The total economic impact estimates
iii
exclude the value added created (from exporting, transporting, warehousing, wholesaling, retailing, and processing) beyond farm gate value and Dole’s agricultural tourism operations onsite. If these are included, the total economic impact figures will rise slightly. Farm operations in the WIS-serviced area contributed indirectly to $9.4 million of sales, $2.8 million in earnings, and 69 jobs in the construction sector. Other sectors which benefited indirectly from farm operations in the WIS-serviced area were agriculture, real estate and rentals, health services, retail trade, finance and insurance, professional services, wholesale trade, manufacturing, etc. Through indirect and induced effects, farm operations in the WIS-serviced area supported 25, 9, and 19 jobs, respectively, in Hawaii County, Kauai County, and Maui County. These jobs were responsible for the production/sale of goods and services worth $2.8 million in Hawaii County, nearly a million dollar in Kauai County, and $2.2 million in Maui County. Due to the discharge of R-2 water into the system, by the Wahiawa Wastewater Treatment Plant (1.8 mgd) and the Army wastewater treatment facility (4.0 mgd), irrigation water from the WIS is considered R-2 quality and its use is limited to the growing of trees and orchard crops. Prohibited crops include root crops and those that would expose their edible parts to the water (e.g., vegetables). Both facilities have plans to upgrade their recycle water to R-1 quality which will have no restrictions on its use for irrigation. With R-1 water quality, the economic potential of the WIS will considerably expand. The study is limited in scope. It focuses on pure economic impact of the WIS in broad, ignoring the extent to which the WIS affects the economy and livelihood of residents in the Wahiawa, Waialua, Haleiwa, and the North Shore region. The non-economic value of an open space of managed greenery in the WIS-serviced area is also important. While there may not be a good measure of the dollar value for this managed green space, it has environmental and psychic benefits (the enjoyment people get from seeing the greenery) to residents and visitors.
iv
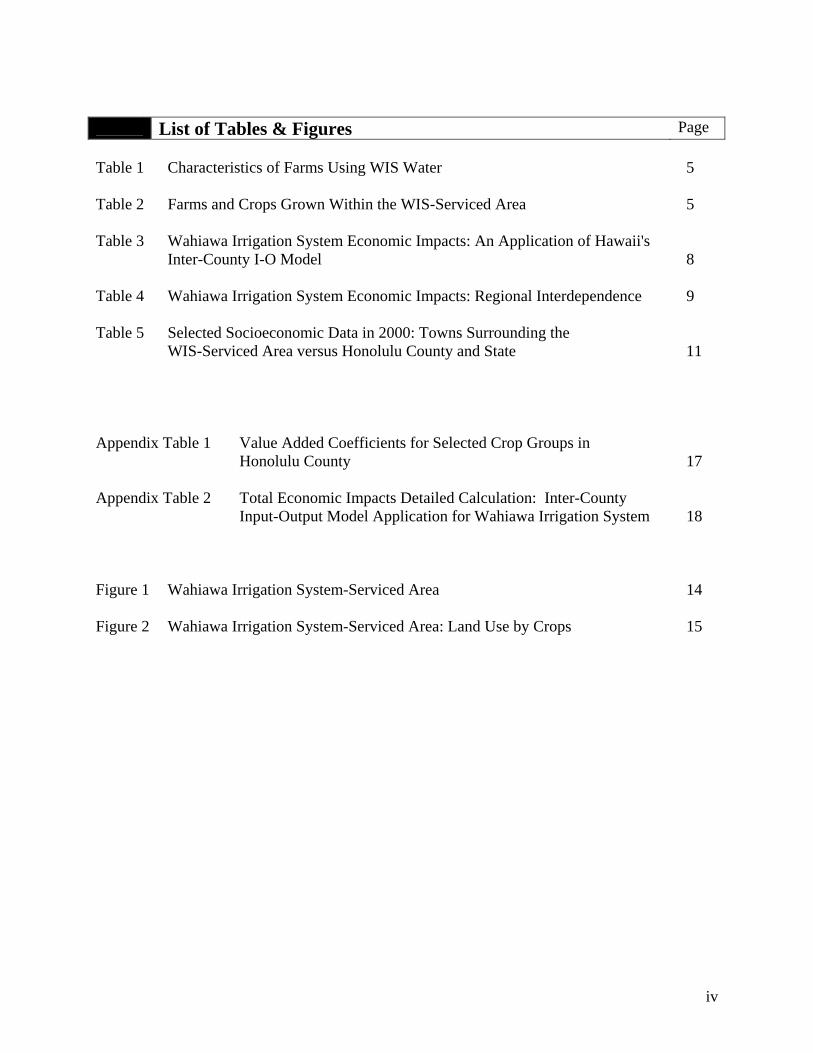
List of Tables & Figures Page Table 1 Characteristics of Farms Using WIS Water 5 Table 2 Farms and Crops Grown Within the WIS-Serviced Area 5 Table 3 Wahiawa Irrigation System Economic Impacts: An Application of Hawaii's Inter-County I-O Model 8 Table 4 Wahiawa Irrigation System Economic Impacts: Regional Interdependence 9 Table 5 Selected Socioeconomic Data in 2000: Towns Surrounding the WIS-Serviced Area versus Honolulu County and State 11 Appendix Table 1 Value Added Coefficients for Selected Crop Groups in Honolulu County 17 Appendix Table 2 Total Economic Impacts Detailed Calculation: Inter-County
Input-Output Model Application for Wahiawa Irrigation System 18
Figure 1 Wahiawa Irrigation System-Serviced Area 14 Figure 2 Wahiawa Irrigation System-Serviced Area: Land Use by Crops 15
v
Table of Content Page Executive Summary ii List of Tables & Figures iv 1. Introduction 1 2. Methodology and Data 2 3. Background: The WIS and Farm Operations 4 4. The Economic Impacts 6 4.1. Farm Production 6 4.2. Total Economic Impacts 7 4.3. Processing and Agricultural Tourism 10 4.4. WIS Economic Impacts on the Waialua-North Shore Communities 10 5. Conclusion 11 Reference 13 Appendices 17
1
1. Introduction
Irrigation plays a critical role in the economy by providing an essential input for agricultural production. The study aims at analyzing the economic impact of the Wahiawa Irrigation System (WIS) in its current operating configuration and with existing farm operations. The extent of the economic impact is estimated and presented in terms of farm production sales value, farm direct contribution to State’s GDP, and total impact through multipliers effects. Total economic impacts estimated include impacts on production, household income, and employment. The study is useful as an essential reference for decision making regarding the acquisition and management by the State of Hawaii of the currently private-owned and managed irrigation system. The WIS is located in the northern part of Oahu, covering parts of Wahiawa, Waialua and Haleiwa (Figure 1). As a result of the WIS development in 1906, sugar and pineapple plantations dominated the landscape of the region. Although the sugarcane plantation operation ceased in 1996, today much of the land remains highly productive and is a fertile ground for the thriving diversified crops that replaced sugarcane. Thus, the WIS which once served sugarcane and pineapple plantations, now provides water to a variety of fruit and other commercial crops. The economic impact of an irrigation system is most crucial in the service it provides that raises the productivity of agriculture, which further stimulates other economic activities. It is similar to that of other types of infrastructures (roads, harbors, airports, electricity, etc.), which impact the economy by providing services that raise the productivity of other economic activities that can make use of their services. Often, the absence of basic infrastructures, such as irrigation, makes it impossible for other economic activities even to take place and retarding economic growth. In fact, the WIS is the sole factor making agricultural production possible in the area under study. The survey reveals that, without the WIS, agricultural production currently using the irrigation water would cease.
The WIS has been in operation, providing water to farms in the region for more than 100 years. For such many years, not only farm production has been depending on it. Businesses that provide essential inputs to its operation and, especially, to farm operations are also depending on it. Additionally, businesses that use raw materials from farm production, such as coffee processor and noni (morinda citrifolia) juice processor, are depending on the coffee beans and noni fruits that are grown there. Businesses that provide numerous farm inputs, wholesalers and retailers of farm products, transportation providers, and even agricultural tourism organizers are established and have evolved around the WIS. Incomes earned by workers and business owners directly and indirectly associated with farm production with WIS water are spent and further created demand for various economic goods and services. Therefore, economic activity and jobs that are associated with the WIS directly and indirectly are widespread. Next section (2) discusses methodology and data used for the economic impact analysis. Section 3 briefly presents background and characteristics of farm operations in the studied area. Section 4 presents the analytical results, and Section 5 concludes the study.
2
2. Methodology and Data
The WIS operation has an impact on the economy directly and indirectly, through its backward and forward linkages effects. With an estimated annual operation budget of only about $765,000 (based on 2007 prices) and a team of six people, its direct and indirect economic impacts through backward linkages effects are considerably limited.1 The most significant economic impact of the WIS lies in agricultural production made possible by the water it delivers. Thus, central to the problem is agricultural production, which further spurs economic activity along the production stream in the economy. Therefore, the economic impact analysis focuses on agricultural production, and the WIS is treated as an endogenous factor—an input purchased by farms. The economic impact analysis begins with estimating the total sale value of farm outputs, farm employment, and farms’ direct contribution to State’s Gross Domestic Product (GDP). The direct contribution to State’s GDP is estimated using DBEDT’s Honolulu County-specific value added coefficients for five crop groups: (1) macadamia nuts, coffee, other fruits; (2) pineapples; (3) flowers and nursery products; (4) other crops; and (5) forestry and logging.2 The estimation of farm output sales values for all commodities are based on sales of farm outputs only, estimated at farm gate prices. That is, the aggregate sales value is the sum of those sold to local distributors or processors. In doing so, it excludes the un-marketable and un-marketed portions of the total output. Next, the total economic impacts of agricultural production using WIS water are estimated using Hawaii’s 2002 inter-county input-output (I-O) economic model, which accounts for the multipliers effects. The inter-county I-O model accounts for county-specific and inter-county industrial interdependence. Being able to account for county-specific is important because differences in cross-county industrial structure (and thus, industrial interdependence) may have a significant impact on the estimation results. The ability to capture inter-county industrial linkages allows readers to valuate the significance of how changes in an industry located in one county affect industries and the economy in other counties. For the multipliers effect analysis, the total final demand multipliers are used to account for both the indirect effects (as a result of intra- and inter-industry purchases) and induced effects of household expenditures. In-state expenditures by farm operations, used in the multipliers effect analysis, are estimated based on estimated output in conjunction with industry transaction table reported in the inter-county I-O model.3 Although actual expenditure data of farm operations are more desirable, such proprietary information is not available.
1 Element Environmental LLC (September 2007). 2 These value added coefficients are calculated from the estimated value added for Honolulu County specific crop groups presented in Hawaii Inter-County Input-Output Study: 2002 Benchmark Report (DBEDT, 2007). Value added is the income side of gross domestic product (GDP). GDP has two sides of the same value: expenditure side and income side. In technical terms, based on DBEDT’s definition, value added is comprised of: (1) compensation to employees, (2) proprietors’ income, (3) taxes on production and imports less subsidies, and (4) other capital costs. 3 In-state expenditures by any industry comprise of all intermediate purchases and other expenditures minus imports.
3
The I-O model analysis of multiplier effects accounts for backward linkages only. Thus, the multipliers effect analysis based on farm production accounts for economic impacts of farm operations, excluding the economic impact of activities beyond the farm—export, transportation services, warehousing, wholesale and retail trade, and processing. The farm operations’ backward linkages effects operate through farm expenditures on personnel, farm materials, machineries, tools, electricity and fuel, communication, vehicles, supplies, professional services, etc. The backward linkages continue with purchases of inputs by those businesses supporting farm operations, and purchases of inputs by those that supply inputs to businesses that provide supports to farm operations, and so on. Theses linkages create more economic outputs and jobs further along the industrial stream. In addition, individual workers and business owners would spend a portion of their disposable incomes on goods and services (food, housing, clothing, healthcare, entertainment, etc.), further creating jobs and incomes in the economy. The processes involved in getting fresh produces to final consumers through the super markets, or grocery stores, within the economic region under studied (Hawaii State) create added value to the goods, as a result of transporting, packaging, and retailing. These are real services to final consumers and which create jobs and incomes in the economy.4 If Hawaii is a closed economy and if local produces were to disappear, it will affect the transportation, wholesale, retail businesses and all others that support their operations. However, Hawaii is an open economy. Should local produces disappear from the market, imports would immediately replace them, and the impact on transportation and retail businesses and the related jobs and incomes would be at a minimum at most. Thus, if everything grown were sold as fresh produces in-state and nothing went to export markets and processing plants, analyzing the economic impacts of farm production at the farm level alone would account for the total impacts. Agricultural exports and agricultural processing create additional jobs and incomes. However, the significance of economic impacts may be different between the two. If raw materials used in processing were not unique and could be replaced instantly by imports, economic impacts of local production of raw materials (agriculture) on processing would be insignificant. However, if the business success of agricultural processing were based on the unique quality of local materials, local production of raw materials would have a significant effect on the processing industry and the related businesses. On the other hand, for Hawaii, local production of agricultural exports cannot be replaced by imports for re-export (although it may be different elsewhere). Thus, a change in production of exported agricultural products would inevitably affect jobs and incomes in the agricultural export sector. The multipliers effect analysis in this paper does not account for the economic impact of export and processing activities, particularly for coffee, noni and kukui oil, due to inadequate data. While capturing the economic impacts of exports and processing of these products would more fully account for the total economic impact of the WIS. Leaving them out would not be a substantial loss to the estimation, since their combined production value is very small relative to the total output in the WIS-serviced area. 4 Consumers save on costs associated with locating, travelling and picking the produces they want themselves.
4
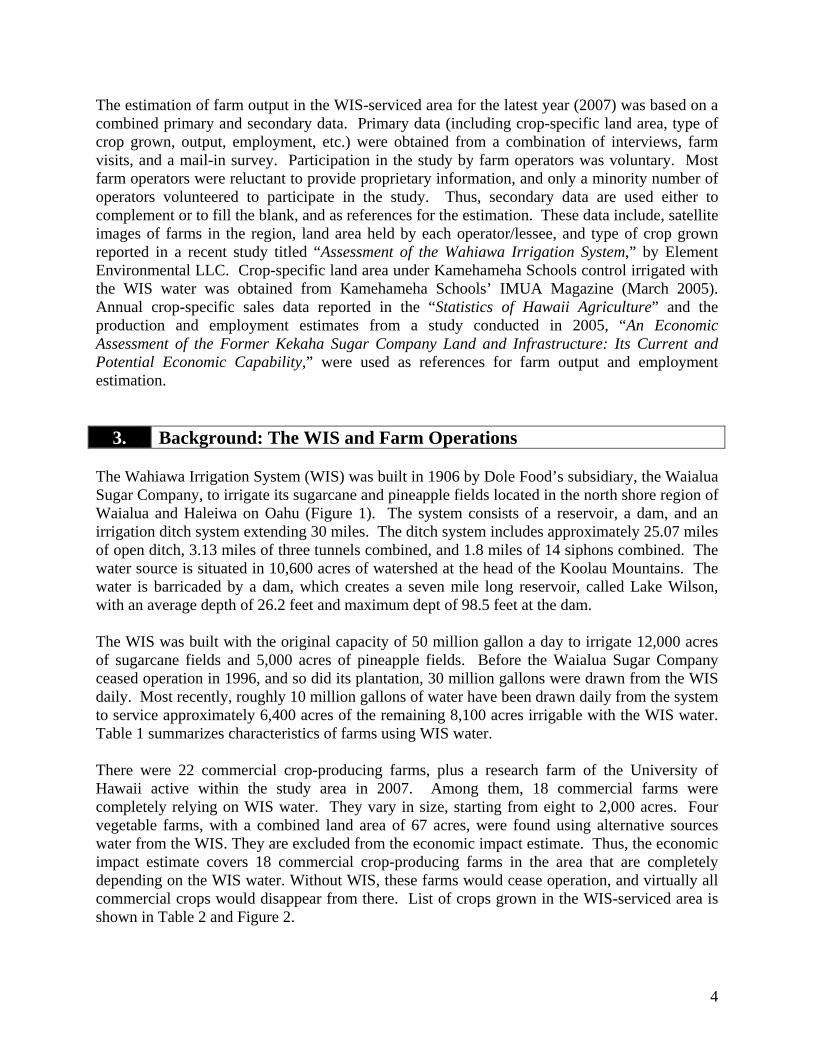
The estimation of farm output in the WIS-serviced area for the latest year (2007) was based on a combined primary and secondary data. Primary data (including crop-specific land area, type of crop grown, output, employment, etc.) were obtained from a combination of interviews, farm visits, and a mail-in survey. Participation in the study by farm operators was voluntary. Most farm operators were reluctant to provide proprietary information, and only a minority number of operators volunteered to participate in the study. Thus, secondary data are used either to complement or to fill the blank, and as references for the estimation. These data include, satellite images of farms in the region, land area held by each operator/lessee, and type of crop grown reported in a recent study titled “Assessment of the Wahiawa Irrigation System,” by Element Environmental LLC. Crop-specific land area under Kamehameha Schools control irrigated with the WIS water was obtained from Kamehameha Schools’ IMUA Magazine (March 2005). Annual crop-specific sales data reported in the “Statistics of Hawaii Agriculture” and the production and employment estimates from a study conducted in 2005, “An Economic Assessment of the Former Kekaha Sugar Company Land and Infrastructure: Its Current and Potential Economic Capability,” were used as references for farm output and employment estimation.
3. Background: The WIS and Farm Operations The Wahiawa Irrigation System (WIS) was built in 1906 by Dole Food’s subsidiary, the Waialua Sugar Company, to irrigate its sugarcane and pineapple fields located in the north shore region of Waialua and Haleiwa on Oahu (Figure 1). The system consists of a reservoir, a dam, and an irrigation ditch system extending 30 miles. The ditch system includes approximately 25.07 miles of open ditch, 3.13 miles of three tunnels combined, and 1.8 miles of 14 siphons combined. The water source is situated in 10,600 acres of watershed at the head of the Koolau Mountains. The water is barricaded by a dam, which creates a seven mile long reservoir, called Lake Wilson, with an average depth of 26.2 feet and maximum dept of 98.5 feet at the dam. The WIS was built with the original capacity of 50 million gallon a day to irrigate 12,000 acres of sugarcane fields and 5,000 acres of pineapple fields. Before the Waialua Sugar Company ceased operation in 1996, and so did its plantation, 30 million gallons were drawn from the WIS daily. Most recently, roughly 10 million gallons of water have been drawn daily from the system to service approximately 6,400 acres of the remaining 8,100 acres irrigable with the WIS water. Table 1 summarizes characteristics of farms using WIS water. There were 22 commercial crop-producing farms, plus a research farm of the University of Hawaii active within the study area in 2007. Among them, 18 commercial farms were completely relying on WIS water. They vary in size, starting from eight to 2,000 acres. Four vegetable farms, with a combined land area of 67 acres, were found using alternative sources water from the WIS. They are excluded from the economic impact estimate. Thus, the economic impact estimate covers 18 commercial crop-producing farms in the area that are completely depending on the WIS water. Without WIS, these farms would cease operation, and virtually all commercial crops would disappear from there. List of crops grown in the WIS-serviced area is shown in Table 2 and Figure 2.
5
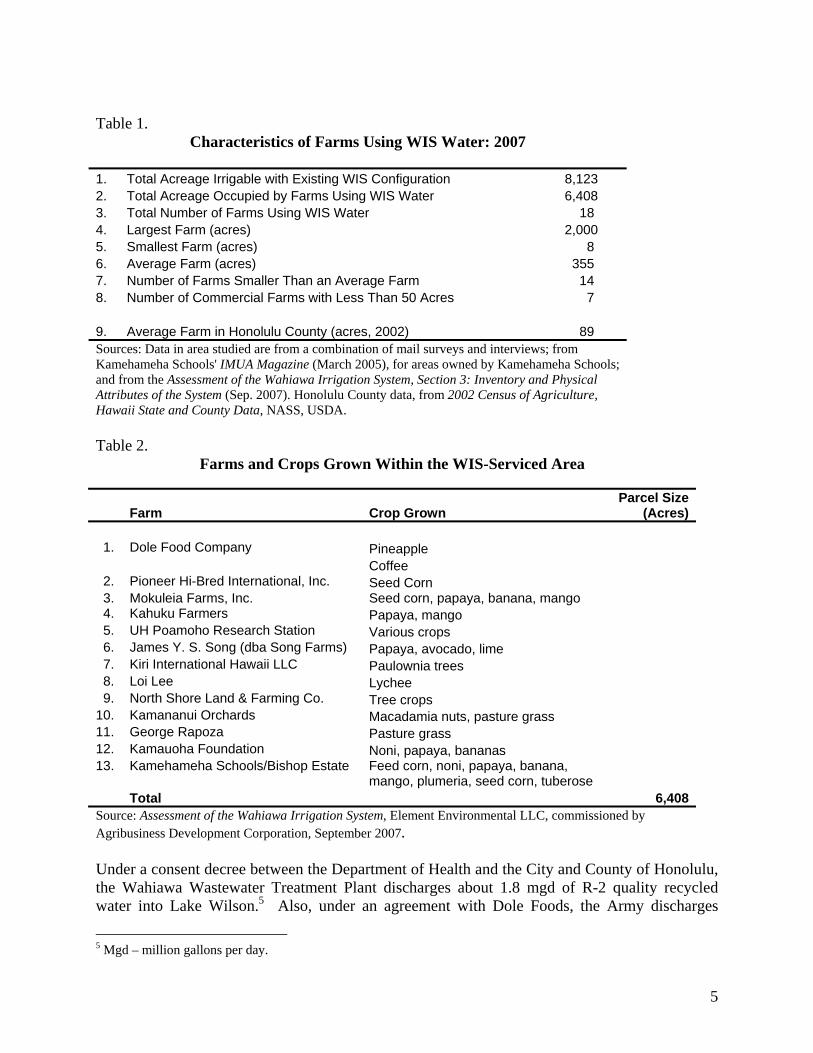
Table 1.
Characteristics of Farms Using WIS Water: 2007 1. Total Acreage Irrigable with Existing WIS Configuration 8,123 2. Total Acreage Occupied by Farms Using WIS Water 6,408 3. Total Number of Farms Using WIS Water 18 4. Largest Farm (acres) 2,000 5. Smallest Farm (acres) 8 6. Average Farm (acres) 355 7. Number of Farms Smaller Than an Average Farm 14 8. Number of Commercial Farms with Less Than 50 Acres 7 9. Average Farm in Honolulu County (acres, 2002) 89 Sources: Data in area studied are from a combination of mail surveys and interviews; from Kamehameha Schools' IMUA Magazine (March 2005), for areas owned by Kamehameha Schools; and from the Assessment of the Wahiawa Irrigation System, Section 3: Inventory and Physical Attributes of the System (Sep. 2007). Honolulu County data, from 2002 Census of Agriculture, Hawaii State and County Data, NASS, USDA. Table 2.
Farms and Crops Grown Within the WIS-Serviced Area
Farm Crop Grown Parcel Size
(Acres)
1. Dole Food Company Pineapple Coffee
2. Pioneer Hi-Bred International, Inc. Seed Corn 3. Mokuleia Farms, Inc. Seed corn, papaya, banana, mango 4. Kahuku Farmers Papaya, mango 5. UH Poamoho Research Station Various crops 6. James Y. S. Song (dba Song Farms) Papaya, avocado, lime 7. Kiri International Hawaii LLC Paulownia trees 8. Loi Lee Lychee 9. North Shore Land & Farming Co. Tree crops
10. Kamananui Orchards Macadamia nuts, pasture grass 11. George Rapoza Pasture grass 12. Kamauoha Foundation Noni, papaya, bananas 13. Kamehameha Schools/Bishop Estate Feed corn, noni, papaya, banana,
mango, plumeria, seed corn, tuberose Total 6,408 Source: Assessment of the Wahiawa Irrigation System, Element Environmental LLC, commissioned by Agribusiness Development Corporation, September 2007. Under a consent decree between the Department of Health and the City and County of Honolulu, the Wahiawa Wastewater Treatment Plant discharges about 1.8 mgd of R-2 quality recycled water into Lake Wilson.5 Also, under an agreement with Dole Foods, the Army discharges
5 Mgd – million gallons per day.
6
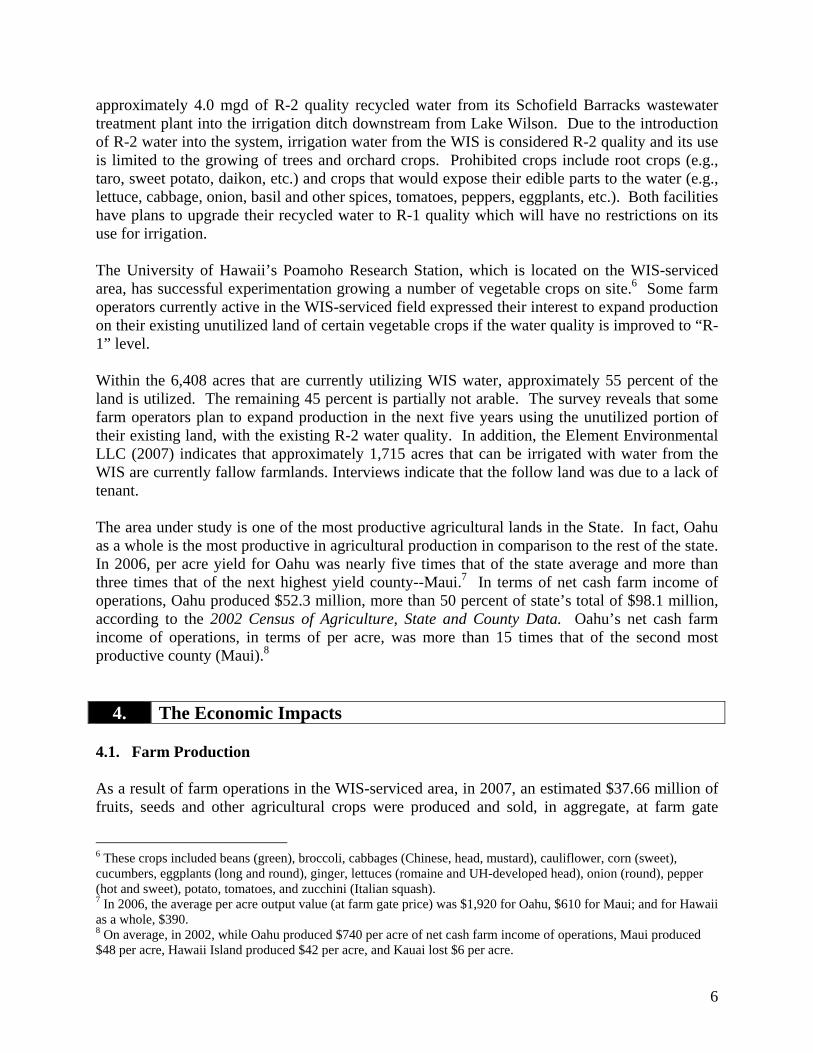
approximately 4.0 mgd of R-2 quality recycled water from its Schofield Barracks wastewater treatment plant into the irrigation ditch downstream from Lake Wilson. Due to the introduction of R-2 water into the system, irrigation water from the WIS is considered R-2 quality and its use is limited to the growing of trees and orchard crops. Prohibited crops include root crops (e.g., taro, sweet potato, daikon, etc.) and crops that would expose their edible parts to the water (e.g., lettuce, cabbage, onion, basil and other spices, tomatoes, peppers, eggplants, etc.). Both facilities have plans to upgrade their recycled water to R-1 quality which will have no restrictions on its use for irrigation. The University of Hawaii’s Poamoho Research Station, which is located on the WIS-serviced area, has successful experimentation growing a number of vegetable crops on site.6 Some farm operators currently active in the WIS-serviced field expressed their interest to expand production on their existing unutilized land of certain vegetable crops if the water quality is improved to “R-1” level. Within the 6,408 acres that are currently utilizing WIS water, approximately 55 percent of the land is utilized. The remaining 45 percent is partially not arable. The survey reveals that some farm operators plan to expand production in the next five years using the unutilized portion of their existing land, with the existing R-2 water quality. In addition, the Element Environmental LLC (2007) indicates that approximately 1,715 acres that can be irrigated with water from the WIS are currently fallow farmlands. Interviews indicate that the follow land was due to a lack of tenant. The area under study is one of the most productive agricultural lands in the State. In fact, Oahu as a whole is the most productive in agricultural production in comparison to the rest of the state. In 2006, per acre yield for Oahu was nearly five times that of the state average and more than three times that of the next highest yield county--Maui.7 In terms of net cash farm income of operations, Oahu produced $52.3 million, more than 50 percent of state’s total of $98.1 million, according to the 2002 Census of Agriculture, State and County Data. Oahu’s net cash farm income of operations, in terms of per acre, was more than 15 times that of the second most productive county (Maui).8
4. The Economic Impacts 4.1. Farm Production As a result of farm operations in the WIS-serviced area, in 2007, an estimated $37.66 million of fruits, seeds and other agricultural crops were produced and sold, in aggregate, at farm gate
6 These crops included beans (green), broccoli, cabbages (Chinese, head, mustard), cauliflower, corn (sweet), cucumbers, eggplants (long and round), ginger, lettuces (romaine and UH-developed head), onion (round), pepper (hot and sweet), potato, tomatoes, and zucchini (Italian squash). 7 In 2006, the average per acre output value (at farm gate price) was $1,920 for Oahu, $610 for Maui; and for Hawaii as a whole, $390. 8 On average, in 2002, while Oahu produced $740 per acre of net cash farm income of operations, Maui produced $48 per acre, Hawaii Island produced $42 per acre, and Kauai lost $6 per acre.
7
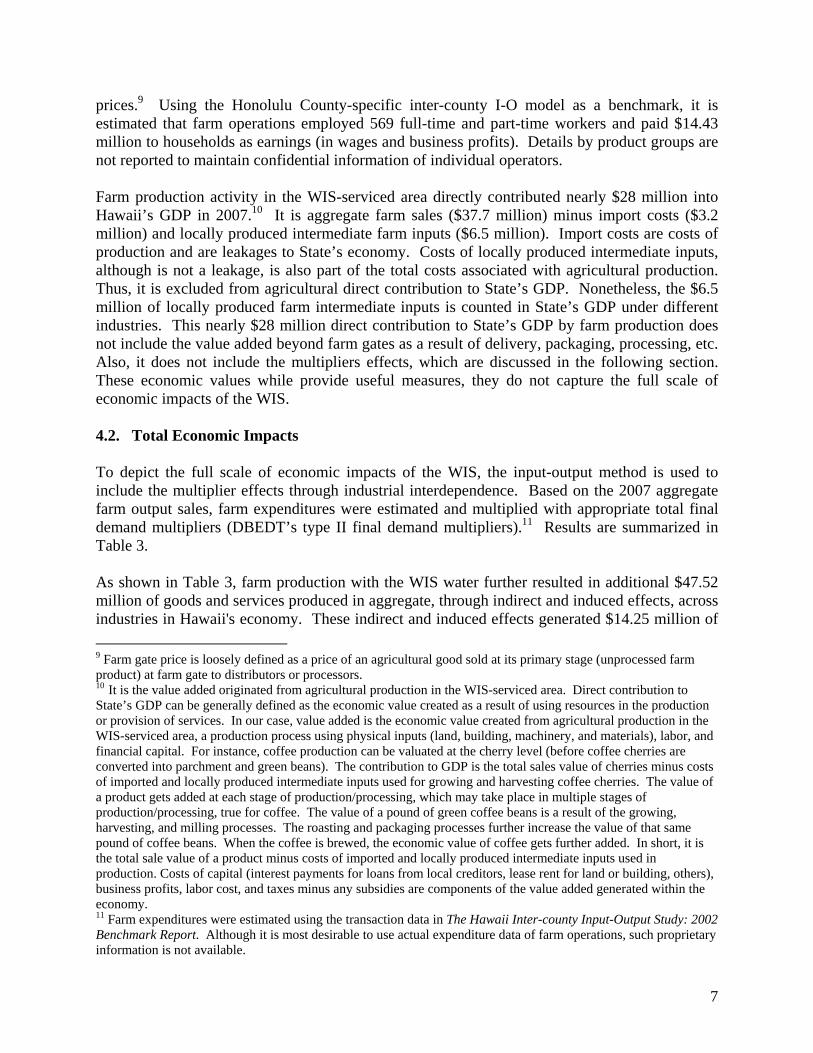
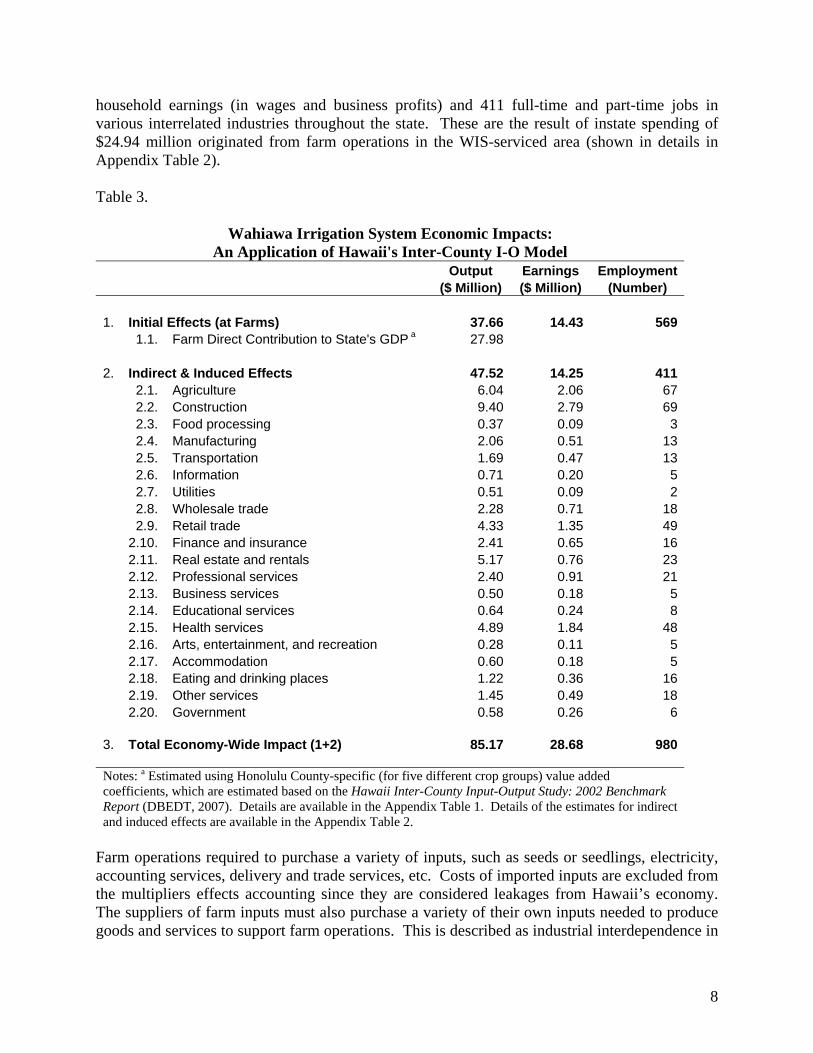
prices.9 Using the Honolulu County-specific inter-county I-O model as a benchmark, it is estimated that farm operations employed 569 full-time and part-time workers and paid $14.43 million to households as earnings (in wages and business profits). Details by product groups are not reported to maintain confidential information of individual operators. Farm production activity in the WIS-serviced area directly contributed nearly $28 million into Hawaii’s GDP in 2007.10 It is aggregate farm sales ($37.7 million) minus import costs ($3.2 million) and locally produced intermediate farm inputs ($6.5 million). Import costs are costs of production and are leakages to State’s economy. Costs of locally produced intermediate inputs, although is not a leakage, is also part of the total costs associated with agricultural production. Thus, it is excluded from agricultural direct contribution to State’s GDP. Nonetheless, the $6.5 million of locally produced farm intermediate inputs is counted in State’s GDP under different industries. This nearly $28 million direct contribution to State’s GDP by farm production does not include the value added beyond farm gates as a result of delivery, packaging, processing, etc. Also, it does not include the multipliers effects, which are discussed in the following section. These economic values while provide useful measures, they do not capture the full scale of economic impacts of the WIS. 4.2. Total Economic Impacts To depict the full scale of economic impacts of the WIS, the input-output method is used to include the multiplier effects through industrial interdependence. Based on the 2007 aggregate farm output sales, farm expenditures were estimated and multiplied with appropriate total final demand multipliers (DBEDT’s type II final demand multipliers).11 Results are summarized in Table 3. As shown in Table 3, farm production with the WIS water further resulted in additional $47.52 million of goods and services produced in aggregate, through indirect and induced effects, across industries in Hawaii's economy. These indirect and induced effects generated $14.25 million of 9 Farm gate price is loosely defined as a price of an agricultural good sold at its primary stage (unprocessed farm product) at farm gate to distributors or processors. 10 It is the value added originated from agricultural production in the WIS-serviced area. Direct contribution to State’s GDP can be generally defined as the economic value created as a result of using resources in the production or provision of services. In our case, value added is the economic value created from agricultural production in the WIS-serviced area, a production process using physical inputs (land, building, machinery, and materials), labor, and financial capital. For instance, coffee production can be valuated at the cherry level (before coffee cherries are converted into parchment and green beans). The contribution to GDP is the total sales value of cherries minus costs of imported and locally produced intermediate inputs used for growing and harvesting coffee cherries. The value of a product gets added at each stage of production/processing, which may take place in multiple stages of production/processing, true for coffee. The value of a pound of green coffee beans is a result of the growing, harvesting, and milling processes. The roasting and packaging processes further increase the value of that same pound of coffee beans. When the coffee is brewed, the economic value of coffee gets further added. In short, it is the total sale value of a product minus costs of imported and locally produced intermediate inputs used in production. Costs of capital (interest payments for loans from local creditors, lease rent for land or building, others), business profits, labor cost, and taxes minus any subsidies are components of the value added generated within the economy. 11 Farm expenditures were estimated using the transaction data in The Hawaii Inter-county Input-Output Study: 2002 Benchmark Report. Although it is most desirable to use actual expenditure data of farm operations, such proprietary information is not available.
8
household earnings (in wages and business profits) and 411 full-time and part-time jobs in various interrelated industries throughout the state. These are the result of instate spending of $24.94 million originated from farm operations in the WIS-serviced area (shown in details in Appendix Table 2). Table 3.
Wahiawa Irrigation System Economic Impacts: An Application of Hawaii's Inter-County I-O Model
Output Earnings Employment ($ Million) ($ Million) (Number) 1. Initial Effects (at Farms) 37.66 14.43 569
1.1. Farm Direct Contribution to State's GDP a 27.98
2. Indirect & Induced Effects 47.52 14.25 411 2.1. Agriculture 6.04 2.06 67 2.2. Construction 9.40 2.79 69 2.3. Food processing 0.37 0.09 3 2.4. Manufacturing 2.06 0.51 13 2.5. Transportation 1.69 0.47 13 2.6. Information 0.71 0.20 5 2.7. Utilities 0.51 0.09 2 2.8. Wholesale trade 2.28 0.71 18 2.9. Retail trade 4.33 1.35 49 2.10. Finance and insurance 2.41 0.65 16 2.11. Real estate and rentals 5.17 0.76 23 2.12. Professional services 2.40 0.91 21 2.13. Business services 0.50 0.18 5 2.14. Educational services 0.64 0.24 8 2.15. Health services 4.89 1.84 48 2.16. Arts, entertainment, and recreation 0.28 0.11 5 2.17. Accommodation 0.60 0.18 5 2.18. Eating and drinking places 1.22 0.36 16 2.19. Other services 1.45 0.49 18 2.20. Government 0.58 0.26 6
3. Total Economy-Wide Impact (1+2) 85.17 28.68 980
Notes: a Estimated using Honolulu County-specific (for five different crop groups) value added coefficients, which are estimated based on the Hawaii Inter-County Input-Output Study: 2002 Benchmark Report (DBEDT, 2007). Details are available in the Appendix Table 1. Details of the estimates for indirect and induced effects are available in the Appendix Table 2.
Farm operations required to purchase a variety of inputs, such as seeds or seedlings, electricity, accounting services, delivery and trade services, etc. Costs of imported inputs are excluded from the multipliers effects accounting since they are considered leakages from Hawaii’s economy. The suppliers of farm inputs must also purchase a variety of their own inputs needed to produce goods and services to support farm operations. This is described as industrial interdependence in
9
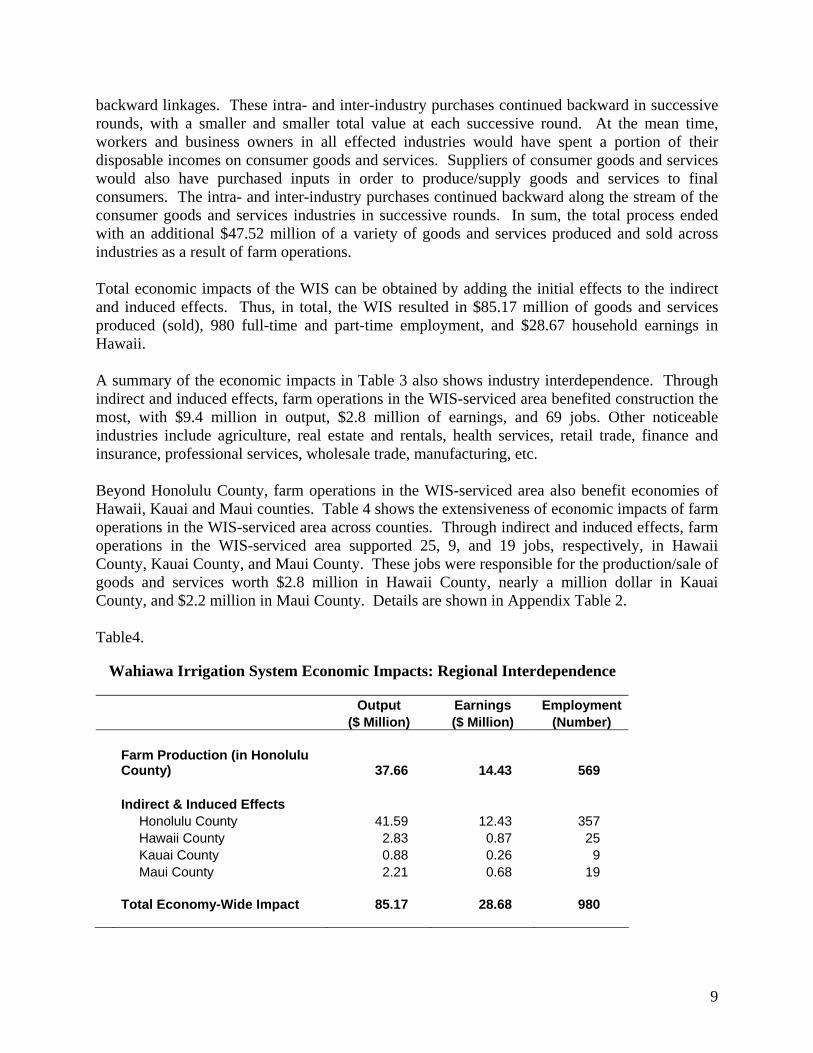
backward linkages. These intra- and inter-industry purchases continued backward in successive rounds, with a smaller and smaller total value at each successive round. At the mean time, workers and business owners in all effected industries would have spent a portion of their disposable incomes on consumer goods and services. Suppliers of consumer goods and services would also have purchased inputs in order to produce/supply goods and services to final consumers. The intra- and inter-industry purchases continued backward along the stream of the consumer goods and services industries in successive rounds. In sum, the total process ended with an additional $47.52 million of a variety of goods and services produced and sold across industries as a result of farm operations. Total economic impacts of the WIS can be obtained by adding the initial effects to the indirect and induced effects. Thus, in total, the WIS resulted in $85.17 million of goods and services produced (sold), 980 full-time and part-time employment, and $28.67 household earnings in Hawaii. A summary of the economic impacts in Table 3 also shows industry interdependence. Through indirect and induced effects, farm operations in the WIS-serviced area benefited construction the most, with $9.4 million in output, $2.8 million of earnings, and 69 jobs. Other noticeable industries include agriculture, real estate and rentals, health services, retail trade, finance and insurance, professional services, wholesale trade, manufacturing, etc. Beyond Honolulu County, farm operations in the WIS-serviced area also benefit economies of Hawaii, Kauai and Maui counties. Table 4 shows the extensiveness of economic impacts of farm operations in the WIS-serviced area across counties. Through indirect and induced effects, farm operations in the WIS-serviced area supported 25, 9, and 19 jobs, respectively, in Hawaii County, Kauai County, and Maui County. These jobs were responsible for the production/sale of goods and services worth $2.8 million in Hawaii County, nearly a million dollar in Kauai County, and $2.2 million in Maui County. Details are shown in Appendix Table 2. Table4.
Wahiawa Irrigation System Economic Impacts: Regional Interdependence
Output Earnings Employment ($ Million) ($ Million) (Number)
Farm Production (in Honolulu County) 37.66 14.43 569
Indirect & Induced Effects Honolulu County 41.59 12.43 357 Hawaii County 2.83 0.87 25 Kauai County 0.88 0.26 9 Maui County 2.21 0.68 19
Total Economy-Wide Impact
85.17
28.68
980
10
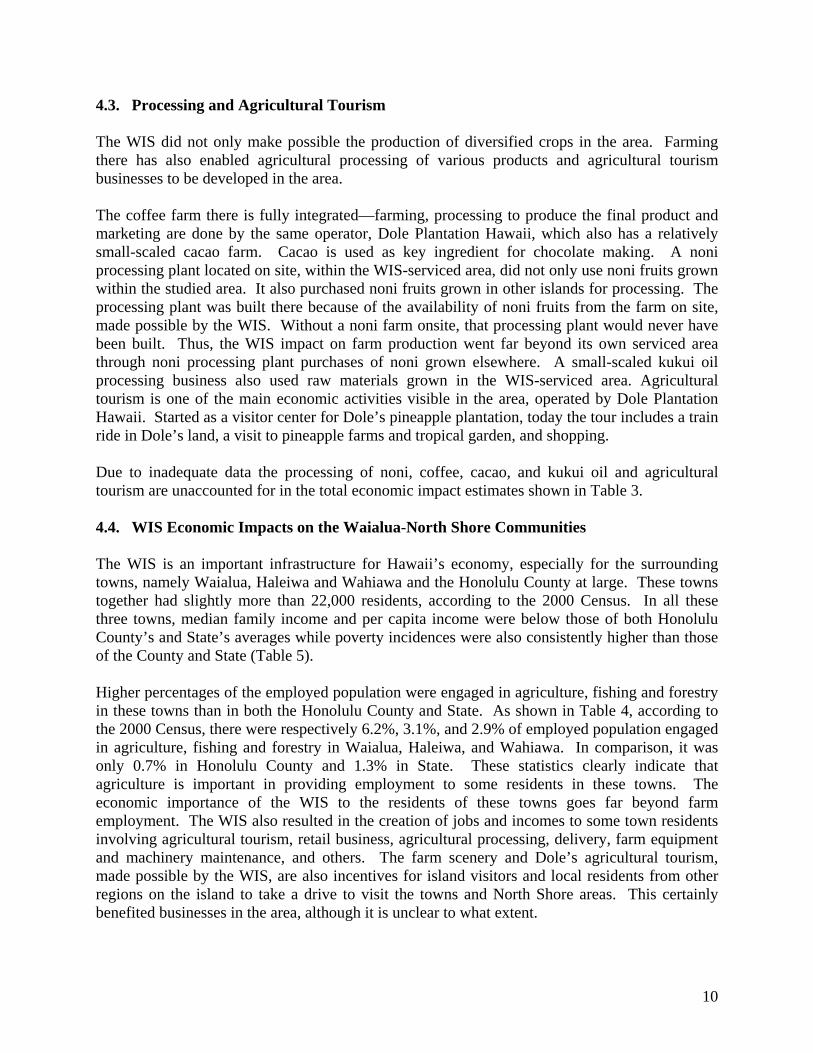
4.3. Processing and Agricultural Tourism The WIS did not only make possible the production of diversified crops in the area. Farming there has also enabled agricultural processing of various products and agricultural tourism businesses to be developed in the area. The coffee farm there is fully integrated—farming, processing to produce the final product and marketing are done by the same operator, Dole Plantation Hawaii, which also has a relatively small-scaled cacao farm. Cacao is used as key ingredient for chocolate making. A noni processing plant located on site, within the WIS-serviced area, did not only use noni fruits grown within the studied area. It also purchased noni fruits grown in other islands for processing. The processing plant was built there because of the availability of noni fruits from the farm on site, made possible by the WIS. Without a noni farm onsite, that processing plant would never have been built. Thus, the WIS impact on farm production went far beyond its own serviced area through noni processing plant purchases of noni grown elsewhere. A small-scaled kukui oil processing business also used raw materials grown in the WIS-serviced area. Agricultural tourism is one of the main economic activities visible in the area, operated by Dole Plantation Hawaii. Started as a visitor center for Dole’s pineapple plantation, today the tour includes a train ride in Dole’s land, a visit to pineapple farms and tropical garden, and shopping. Due to inadequate data the processing of noni, coffee, cacao, and kukui oil and agricultural tourism are unaccounted for in the total economic impact estimates shown in Table 3. 4.4. WIS Economic Impacts on the Waialua-North Shore Communities The WIS is an important infrastructure for Hawaii’s economy, especially for the surrounding towns, namely Waialua, Haleiwa and Wahiawa and the Honolulu County at large. These towns together had slightly more than 22,000 residents, according to the 2000 Census. In all these three towns, median family income and per capita income were below those of both Honolulu County’s and State’s averages while poverty incidences were also consistently higher than those of the County and State (Table 5). Higher percentages of the employed population were engaged in agriculture, fishing and forestry in these towns than in both the Honolulu County and State. As shown in Table 4, according to the 2000 Census, there were respectively 6.2%, 3.1%, and 2.9% of employed population engaged in agriculture, fishing and forestry in Waialua, Haleiwa, and Wahiawa. In comparison, it was only 0.7% in Honolulu County and 1.3% in State. These statistics clearly indicate that agriculture is important in providing employment to some residents in these towns. The economic importance of the WIS to the residents of these towns goes far beyond farm employment. The WIS also resulted in the creation of jobs and incomes to some town residents involving agricultural tourism, retail business, agricultural processing, delivery, farm equipment and machinery maintenance, and others. The farm scenery and Dole’s agricultural tourism, made possible by the WIS, are also incentives for island visitors and local residents from other regions on the island to take a drive to visit the towns and North Shore areas. This certainly benefited businesses in the area, although it is unclear to what extent.
11
Table 5. Selected Socioeconomic Data in 2000
Towns Surrounding the WIS-Serviced Area Versus Honolulu County and State
Waialua Wahiawa HaleiwaHonolulu
County State
Population
3,761
16,151
2,225 876,156
1,211,537 Population employed in agriculture, fishing, and forestry occupations 92 183 29 2,534 6,909 As percent of employment a 6.20% 2.90% 3.10% 0.70% 1.30%Median family income (1999) 51,801 46,524 48,553 60,118 56,961 Per capita income (1999) 17,220 16,366 16,504 21,998 21,525 Families below poverty level 8.90% 13.50% 15.00% 7.00% 7.60%Individuals below poverty level 11.70% 16.70% 17.60% 9.90% 10.70% Notes: a Percent of population age 16 and above who were employed within the survey period. Source: U.S. Bureau of the Census, Census 2000.
5. Conclusion Like for many other types of infrastructure such as roads, airports, electricity, the economic impact of an irrigation system is most crucial in the service it provides that makes possible for other economic activities to take place and thrive. In 2007, the Wahiawa Irrigation System (WIS) directly contributed to $37.7 million of farm production in aggregate, sold at farm prices. It directly produced $14.4 million of earnings, in wages and business profits, that supported approximately 569 full-time and part-time farm jobs. After subtracting costs of farm inputs imported (fuel, fertilizer, materials, equipment and machinery, etc.) and locally supplied intermediate inputs from the aggregate farm sale value, it is determined that farm production in that year contributed nearly $28 million to State’s GDP. To depict the full scale of economic impacts of the WIS, the input-output method is applied to account for the multiplier effects through industrial interdependence. The indirect and induced effects of farm operations resulted in $47.5 million of goods and serviced produced and sold, 411 full-time and part-time jobs, and $14.3 million of earnings across industries statewide. Adding the initial impacts (at the farm level) to the indirect and induced effects, it is concluded that the WIS resulted in approximately $85.2 million of goods and services produced and sold in total across industries in Hawaii's economy. Associated with this economy-wide total impact on output are $28.7 million of household earnings and 980 full-time and part-time jobs in a wide range of industries in Hawaii. The total economic impact estimates exclude the value added created (from exporting, transporting, warehousing, wholesaling, retailing, and processing) beyond farm gate value and Dole’s agricultural tourism operations onsite. If these are included, the total economic impact figures will rise slightly. Farm operations in the WIS-serviced area indirectly contributed to $9.4 million of sales, $2.8 million in earnings, and 69 jobs in the construction sector. Other sectors indirectly benefited from farm operations in the WIS-serviced area were agriculture, real estate and rentals, health
12
services, retail trade, finance and insurance, professional services, wholesale trade, manufacturing, etc. (see Table 3). Through indirect and induced effects, farm operations in the WIS-serviced area supported 25, 9, and 19 jobs, respectively, in Hawaii County, Kauai County, and Maui County. These jobs were responsible for the production/sale of goods and services worth $2.8 million in Hawaii County, nearly a million dollar in Kauai County, and $2.2 million in Maui County. Due to the discharge of R-2 water into the system, by the Wahiawa Wastewater Treatment Plant (1.8 mgd) and the Army wastewater treatment facility (4.0 mgd), irrigation water from the WIS is considered R-2 quality and its use is limited to the growing of trees and orchard crops. Prohibited crops include root crops (e.g., taro, sweet potato, daikon, etc.) and crops that would expose their edible parts to the water (e.g., lettuce, cabbage, onion, basil and other spices, tomatoes, peppers, eggplants, etc.). Both facilities have plans to upgrade their recycle water to R-1 quality which will have no restrictions on its use for irrigation. With R-1 water quality, the economic potential of the WIS will considerably expand. The total economic impact analysis which includes the multipliers effects reveals how extensive the WIS affects the economy across industries and regions (counties) in Hawaii. Also, it should be noted that although estimates in this study are based on 2007 WIS and farm operations, the multipliers and value added coefficients are derived based on 2002 economic data which may be slightly different than those for 2007 economic data. However, job multipliers were adjusted to 2007 employment (for inflation and productivity gain) according to the forecast in the DBEDT’s Inter-County I-O model. The study is also limited in scope. It focuses on pure economic impacts of the WIS in broad, ignoring the extent to which the WIS affects the economy and livelihood of residents in the Wahiawa, Waialua, Haleiwa, and the North Shore region. The non-economic value of an open space of managed greenery in the WIS-serviced area is also important. While there may not be a good measure of the dollar value for this managed green space, it has environmental and psychic benefits (the enjoyment people get from seeing the greenery) to residents and visitors.

13
References Element Environmental LLC (September 2007). Assessment of the Wahiawa Irrigation System,
commissioned by Agribusiness Development Corporation, Honolulu, HI. Fox News (February 2, 2006). “Del Monte to End Hawaii Pineapple Production,”
http://www.foxnews.com/story/0,2933,183645,00.html. Hawaii Department of Agriculture (December 2002). Economic Impact of the Waiahole
Irrigation System. Agricultural Development Division, Market Analysis and News Branch, Honolulu, HI.
Hawaii Department of Business, Economic Development and Tourism (2007). The Hawaii Inter-County Input-Output Study: 2002 Benchmark Report, Research and Economic Analysis Division, Honolulu, HI.
IMUA Magazine (March 2005). “Growing Kawailoa,” a publication of Kamehameha Schools, Honolulu, HI, pp. 14-23.
Leung, PingSun and Loke, Matthew K. (January 2008). The Contribution of Agriculture to Hawaii’s Economy: 2005. Economic Issues (EI-13), University of Hawaii, College of Tropical Agriculture and Human Resources, Cooperative Extension Service, Honolulu, HI.
Market Analysis and News Branch (December 2002). Economic Impact of the Waiahole Irrigation System, Hawaii Department of Agriculture, Agricultural Development Division, Honolulu, HI.
NASS-Hawaii Field Office. Online publications of various crops, http://www.nass.usda.gov/Statistics_by_State/Hawaii/index.asp.
_____ Statistics of Hawaii Agriculture, an annual publication, various issues, Honolulu, HI. Nelson, Scot C. (March 2001). Noni cultivation in Hawaii, Fruits and Nuts (F&N-4), University
of Hawaii, College of Tropical Agriculture and Human Resources, Cooperative Extension Service, Honolulu, HI.
Southichack, Mana K. (October 2005, Revised). An Economic Assessment of the Former Kekaha Sugar Company Land and Infrastructure: Its Current and Potential Economic Capability, Hawaii Department of Agriculture, Agricultural Development Division, Market Analysis and News Branch, Honolulu, HI.
The Honolulu Advertiser (October 8, 2007). “Hawaii state agency urged to run irrigation system,” http://the.honoluluadvertiser.com/article/2007/Oct/08/ln/hawaii710080340.html.
U.S. Department of Commerce Bureau of the Census (2000). Census 2000. U.S. Department of Commerce Bureau of Economic Analysis (March 1997). Regional
Multipliers, A User Handbook for the Regional Input-Output Modeling System (RIMS II). U.S. Government Printing Office, Washington, DC 20402.
Interviews Lee, Alfredo, Executive Director, Agribusiness Development Corporation Matsuda, Melvin, Manager of the WIS and owner of Kahuku Farms Migita, Susan, Farm Manager, University of Hawaii Poamoho Research Station
14
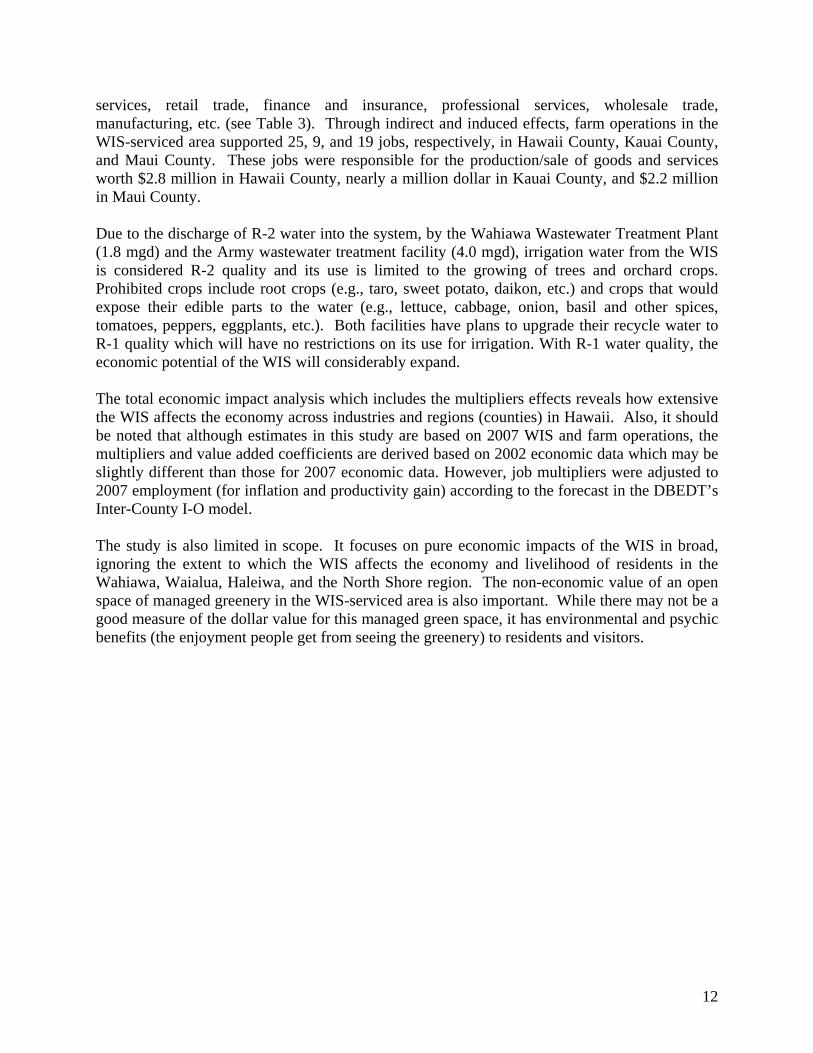
Figure 1. Wahiawa Irrigation System-Serviced Area
Note: Figure borrowed from Element Environmental LLC (September 2007). Assessment of the Wahiawa Irrigation System, commissioned by Agribusiness Development Corporation, Honolulu, HI.
15
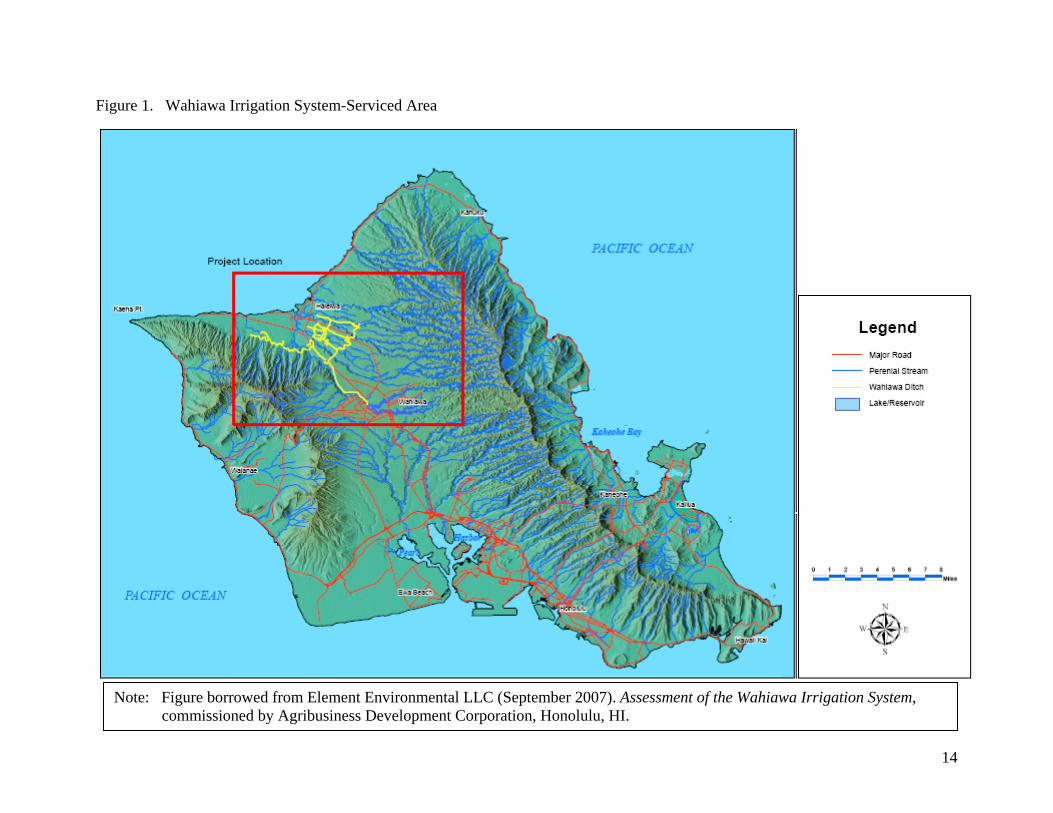
Figure 2. Wahiawa Irrigation System-Serviced Area: Land Use by Crops

16
This page is left blank on purpose.
17
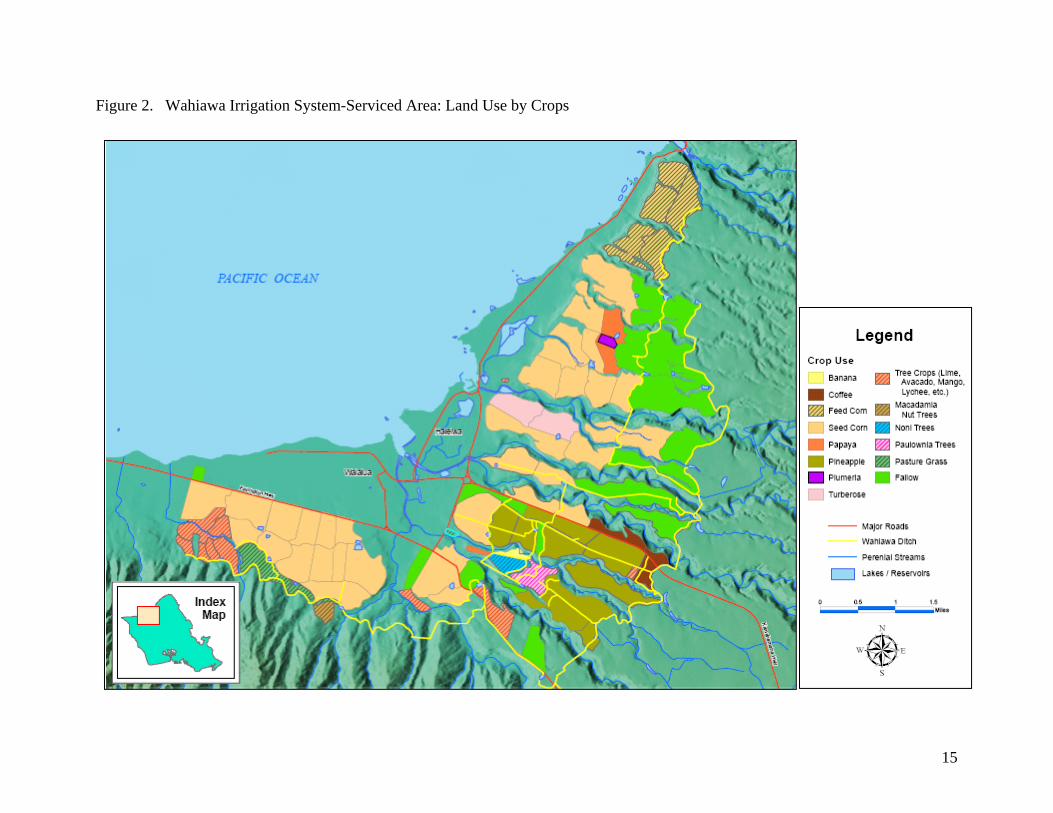
Appendix Table 1.
Value Added Coefficients for Selected Crop Groups in Honolulu County
Total Value Added
Value Added Coefficients c ($ mil.)
Macadamia Nuts, Coffee, Other Fruits 0.88 Pineapples 0.67 Flowers and Nursery Products 0.51 Other Crops 0.77 Forestry & Logging 0.35 Total 27.98 c Honolulu County crop group-specific value added coefficients are calculated from value added for each corresponding crop group presented in the Hawaii Inter-County Input-Output Study: 2002 Benchmark Report (DBEDT, 2007). A value added coefficient indicates the value added created per dollar of output produced (sold). As an example, a 0.67 value added coefficient for pineapples indicates that for every dollar worth of pineapple produced (sold), 67 cents of economic value has been created and added to State’s GDP.
18
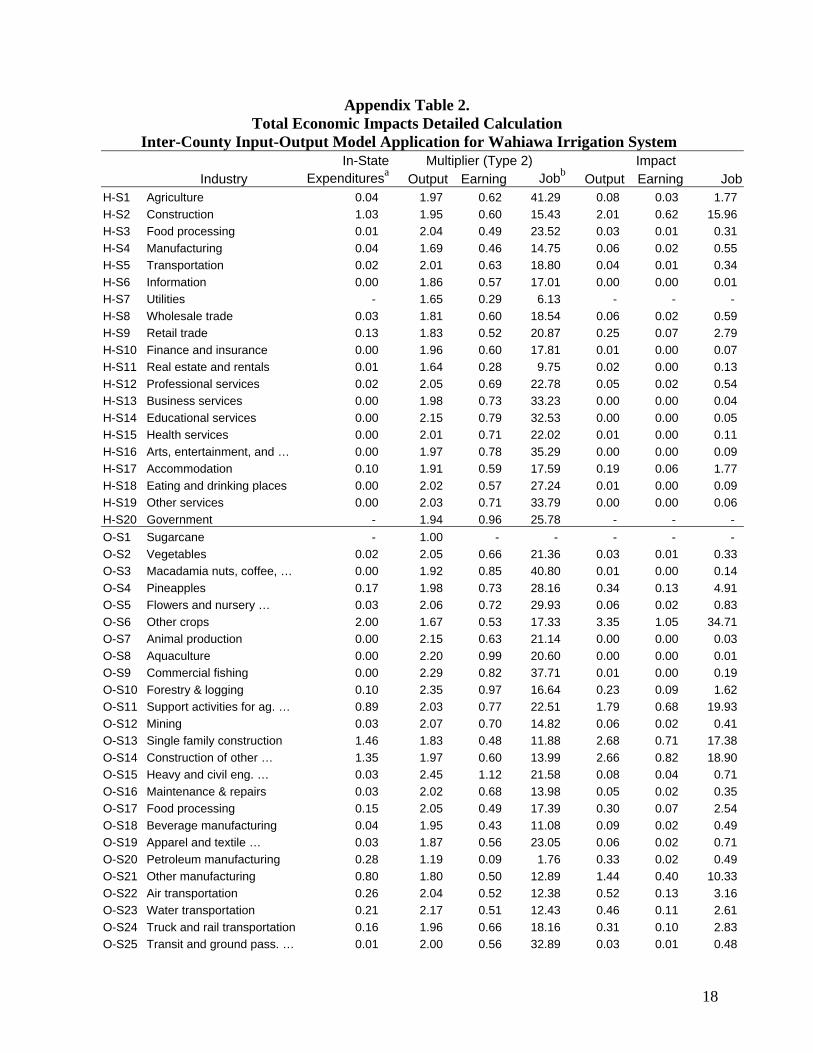
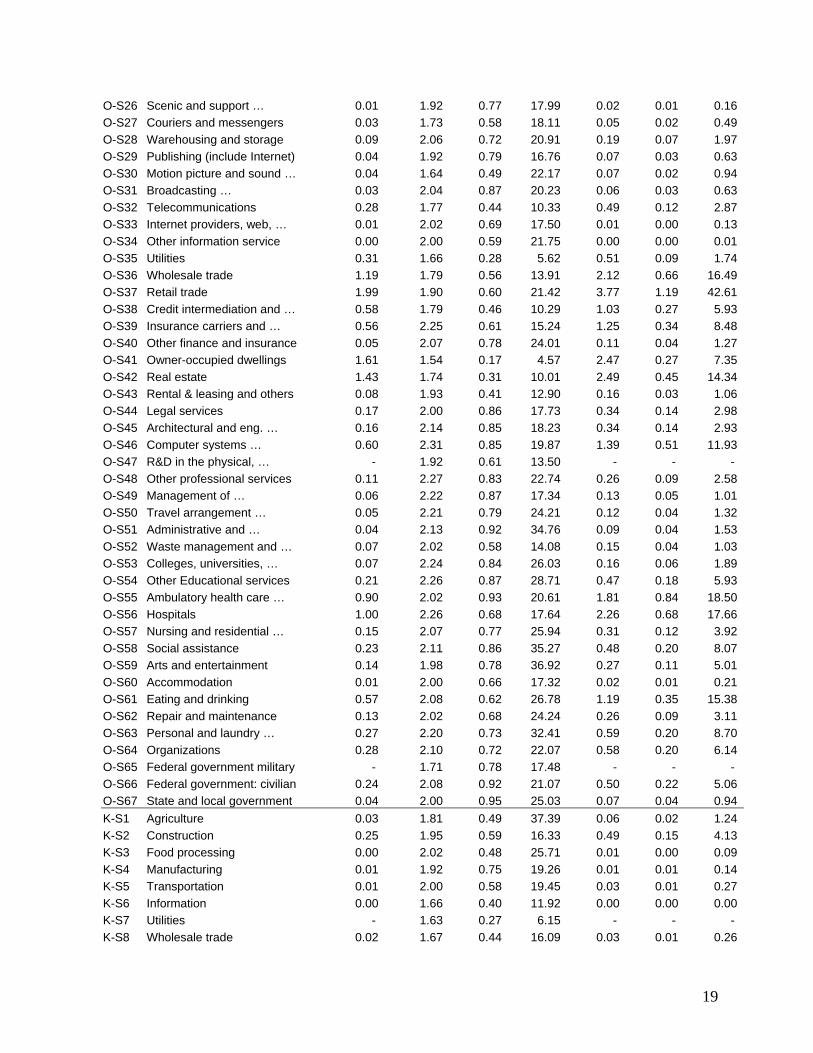
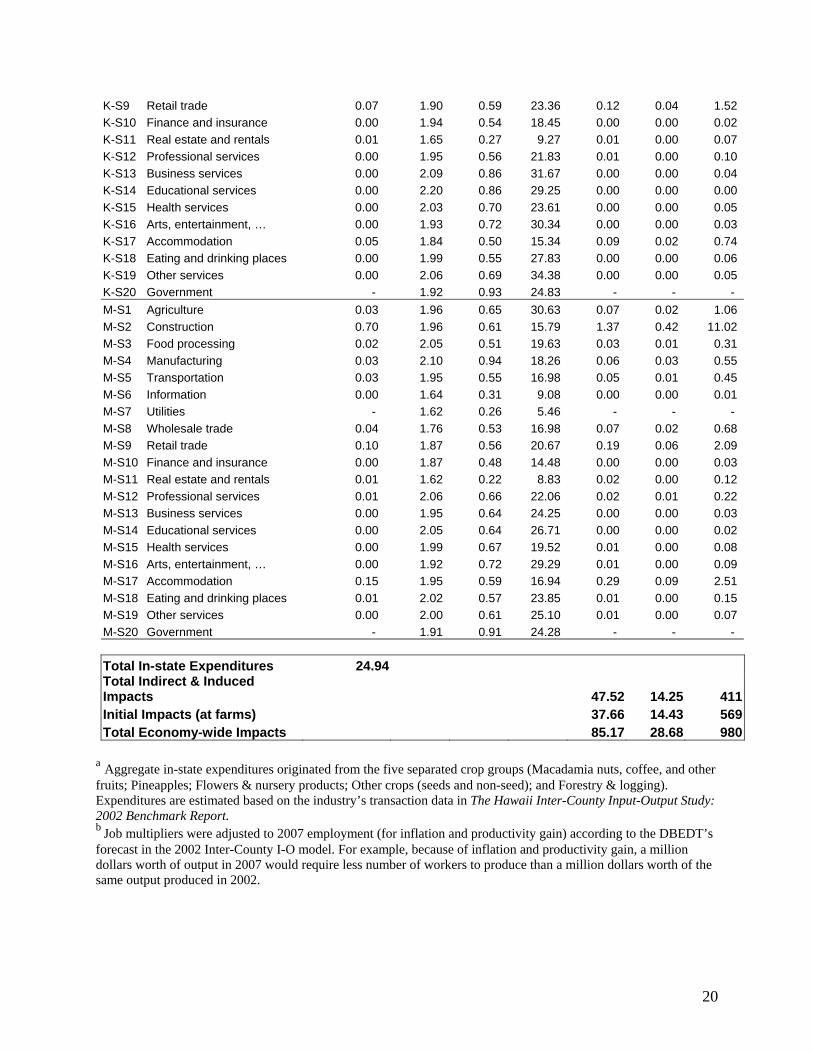
Appendix Table 2. Total Economic Impacts Detailed Calculation
Inter-County Input-Output Model Application for Wahiawa Irrigation System In-State Multiplier (Type 2) Impact
Industry Expendituresa Output Earning Jobb Output Earning JobH-S1 Agriculture 0.04 1.97 0.62 41.29 0.08 0.03 1.77 H-S2 Construction 1.03 1.95 0.60 15.43 2.01 0.62 15.96 H-S3 Food processing 0.01 2.04 0.49 23.52 0.03 0.01 0.31 H-S4 Manufacturing 0.04 1.69 0.46 14.75 0.06 0.02 0.55 H-S5 Transportation 0.02 2.01 0.63 18.80 0.04 0.01 0.34 H-S6 Information 0.00 1.86 0.57 17.01 0.00 0.00 0.01 H-S7 Utilities - 1.65 0.29 6.13 - - - H-S8 Wholesale trade 0.03 1.81 0.60 18.54 0.06 0.02 0.59 H-S9 Retail trade 0.13 1.83 0.52 20.87 0.25 0.07 2.79 H-S10 Finance and insurance 0.00 1.96 0.60 17.81 0.01 0.00 0.07 H-S11 Real estate and rentals 0.01 1.64 0.28 9.75 0.02 0.00 0.13 H-S12 Professional services 0.02 2.05 0.69 22.78 0.05 0.02 0.54 H-S13 Business services 0.00 1.98 0.73 33.23 0.00 0.00 0.04 H-S14 Educational services 0.00 2.15 0.79 32.53 0.00 0.00 0.05 H-S15 Health services 0.00 2.01 0.71 22.02 0.01 0.00 0.11 H-S16 Arts, entertainment, and … 0.00 1.97 0.78 35.29 0.00 0.00 0.09 H-S17 Accommodation 0.10 1.91 0.59 17.59 0.19 0.06 1.77 H-S18 Eating and drinking places 0.00 2.02 0.57 27.24 0.01 0.00 0.09 H-S19 Other services 0.00 2.03 0.71 33.79 0.00 0.00 0.06 H-S20 Government - 1.94 0.96 25.78 - - - O-S1 Sugarcane - 1.00 - - - - - O-S2 Vegetables 0.02 2.05 0.66 21.36 0.03 0.01 0.33 O-S3 Macadamia nuts, coffee, … 0.00 1.92 0.85 40.80 0.01 0.00 0.14 O-S4 Pineapples 0.17 1.98 0.73 28.16 0.34 0.13 4.91 O-S5 Flowers and nursery … 0.03 2.06 0.72 29.93 0.06 0.02 0.83 O-S6 Other crops 2.00 1.67 0.53 17.33 3.35 1.05 34.71 O-S7 Animal production 0.00 2.15 0.63 21.14 0.00 0.00 0.03 O-S8 Aquaculture 0.00 2.20 0.99 20.60 0.00 0.00 0.01 O-S9 Commercial fishing 0.00 2.29 0.82 37.71 0.01 0.00 0.19 O-S10 Forestry & logging 0.10 2.35 0.97 16.64 0.23 0.09 1.62 O-S11 Support activities for ag. … 0.89 2.03 0.77 22.51 1.79 0.68 19.93 O-S12 Mining 0.03 2.07 0.70 14.82 0.06 0.02 0.41 O-S13 Single family construction 1.46 1.83 0.48 11.88 2.68 0.71 17.38 O-S14 Construction of other … 1.35 1.97 0.60 13.99 2.66 0.82 18.90 O-S15 Heavy and civil eng. … 0.03 2.45 1.12 21.58 0.08 0.04 0.71 O-S16 Maintenance & repairs 0.03 2.02 0.68 13.98 0.05 0.02 0.35 O-S17 Food processing 0.15 2.05 0.49 17.39 0.30 0.07 2.54 O-S18 Beverage manufacturing 0.04 1.95 0.43 11.08 0.09 0.02 0.49 O-S19 Apparel and textile … 0.03 1.87 0.56 23.05 0.06 0.02 0.71 O-S20 Petroleum manufacturing 0.28 1.19 0.09 1.76 0.33 0.02 0.49 O-S21 Other manufacturing 0.80 1.80 0.50 12.89 1.44 0.40 10.33 O-S22 Air transportation 0.26 2.04 0.52 12.38 0.52 0.13 3.16 O-S23 Water transportation 0.21 2.17 0.51 12.43 0.46 0.11 2.61 O-S24 Truck and rail transportation 0.16 1.96 0.66 18.16 0.31 0.10 2.83 O-S25 Transit and ground pass. … 0.01 2.00 0.56 32.89 0.03 0.01 0.48
19
O-S26 Scenic and support … 0.01 1.92 0.77 17.99 0.02 0.01 0.16 O-S27 Couriers and messengers 0.03 1.73 0.58 18.11 0.05 0.02 0.49 O-S28 Warehousing and storage 0.09 2.06 0.72 20.91 0.19 0.07 1.97 O-S29 Publishing (include Internet) 0.04 1.92 0.79 16.76 0.07 0.03 0.63 O-S30 Motion picture and sound … 0.04 1.64 0.49 22.17 0.07 0.02 0.94 O-S31 Broadcasting … 0.03 2.04 0.87 20.23 0.06 0.03 0.63 O-S32 Telecommunications 0.28 1.77 0.44 10.33 0.49 0.12 2.87 O-S33 Internet providers, web, … 0.01 2.02 0.69 17.50 0.01 0.00 0.13 O-S34 Other information service 0.00 2.00 0.59 21.75 0.00 0.00 0.01 O-S35 Utilities 0.31 1.66 0.28 5.62 0.51 0.09 1.74 O-S36 Wholesale trade 1.19 1.79 0.56 13.91 2.12 0.66 16.49 O-S37 Retail trade 1.99 1.90 0.60 21.42 3.77 1.19 42.61 O-S38 Credit intermediation and … 0.58 1.79 0.46 10.29 1.03 0.27 5.93 O-S39 Insurance carriers and … 0.56 2.25 0.61 15.24 1.25 0.34 8.48 O-S40 Other finance and insurance 0.05 2.07 0.78 24.01 0.11 0.04 1.27 O-S41 Owner-occupied dwellings 1.61 1.54 0.17 4.57 2.47 0.27 7.35 O-S42 Real estate 1.43 1.74 0.31 10.01 2.49 0.45 14.34 O-S43 Rental & leasing and others 0.08 1.93 0.41 12.90 0.16 0.03 1.06 O-S44 Legal services 0.17 2.00 0.86 17.73 0.34 0.14 2.98 O-S45 Architectural and eng. … 0.16 2.14 0.85 18.23 0.34 0.14 2.93 O-S46 Computer systems … 0.60 2.31 0.85 19.87 1.39 0.51 11.93 O-S47 R&D in the physical, … - 1.92 0.61 13.50 - - - O-S48 Other professional services 0.11 2.27 0.83 22.74 0.26 0.09 2.58 O-S49 Management of … 0.06 2.22 0.87 17.34 0.13 0.05 1.01 O-S50 Travel arrangement … 0.05 2.21 0.79 24.21 0.12 0.04 1.32 O-S51 Administrative and … 0.04 2.13 0.92 34.76 0.09 0.04 1.53 O-S52 Waste management and … 0.07 2.02 0.58 14.08 0.15 0.04 1.03 O-S53 Colleges, universities, … 0.07 2.24 0.84 26.03 0.16 0.06 1.89 O-S54 Other Educational services 0.21 2.26 0.87 28.71 0.47 0.18 5.93 O-S55 Ambulatory health care … 0.90 2.02 0.93 20.61 1.81 0.84 18.50 O-S56 Hospitals 1.00 2.26 0.68 17.64 2.26 0.68 17.66 O-S57 Nursing and residential … 0.15 2.07 0.77 25.94 0.31 0.12 3.92 O-S58 Social assistance 0.23 2.11 0.86 35.27 0.48 0.20 8.07 O-S59 Arts and entertainment 0.14 1.98 0.78 36.92 0.27 0.11 5.01 O-S60 Accommodation 0.01 2.00 0.66 17.32 0.02 0.01 0.21 O-S61 Eating and drinking 0.57 2.08 0.62 26.78 1.19 0.35 15.38 O-S62 Repair and maintenance 0.13 2.02 0.68 24.24 0.26 0.09 3.11 O-S63 Personal and laundry … 0.27 2.20 0.73 32.41 0.59 0.20 8.70 O-S64 Organizations 0.28 2.10 0.72 22.07 0.58 0.20 6.14 O-S65 Federal government military - 1.71 0.78 17.48 - - - O-S66 Federal government: civilian 0.24 2.08 0.92 21.07 0.50 0.22 5.06 O-S67 State and local government 0.04 2.00 0.95 25.03 0.07 0.04 0.94 K-S1 Agriculture 0.03 1.81 0.49 37.39 0.06 0.02 1.24 K-S2 Construction 0.25 1.95 0.59 16.33 0.49 0.15 4.13 K-S3 Food processing 0.00 2.02 0.48 25.71 0.01 0.00 0.09 K-S4 Manufacturing 0.01 1.92 0.75 19.26 0.01 0.01 0.14 K-S5 Transportation 0.01 2.00 0.58 19.45 0.03 0.01 0.27 K-S6 Information 0.00 1.66 0.40 11.92 0.00 0.00 0.00 K-S7 Utilities - 1.63 0.27 6.15 - - - K-S8 Wholesale trade 0.02 1.67 0.44 16.09 0.03 0.01 0.26
20
K-S9 Retail trade 0.07 1.90 0.59 23.36 0.12 0.04 1.52 K-S10 Finance and insurance 0.00 1.94 0.54 18.45 0.00 0.00 0.02 K-S11 Real estate and rentals 0.01 1.65 0.27 9.27 0.01 0.00 0.07 K-S12 Professional services 0.00 1.95 0.56 21.83 0.01 0.00 0.10 K-S13 Business services 0.00 2.09 0.86 31.67 0.00 0.00 0.04 K-S14 Educational services 0.00 2.20 0.86 29.25 0.00 0.00 0.00 K-S15 Health services 0.00 2.03 0.70 23.61 0.00 0.00 0.05 K-S16 Arts, entertainment, … 0.00 1.93 0.72 30.34 0.00 0.00 0.03 K-S17 Accommodation 0.05 1.84 0.50 15.34 0.09 0.02 0.74 K-S18 Eating and drinking places 0.00 1.99 0.55 27.83 0.00 0.00 0.06 K-S19 Other services 0.00 2.06 0.69 34.38 0.00 0.00 0.05 K-S20 Government - 1.92 0.93 24.83 - - - M-S1 Agriculture 0.03 1.96 0.65 30.63 0.07 0.02 1.06 M-S2 Construction 0.70 1.96 0.61 15.79 1.37 0.42 11.02 M-S3 Food processing 0.02 2.05 0.51 19.63 0.03 0.01 0.31 M-S4 Manufacturing 0.03 2.10 0.94 18.26 0.06 0.03 0.55 M-S5 Transportation 0.03 1.95 0.55 16.98 0.05 0.01 0.45 M-S6 Information 0.00 1.64 0.31 9.08 0.00 0.00 0.01 M-S7 Utilities - 1.62 0.26 5.46 - - - M-S8 Wholesale trade 0.04 1.76 0.53 16.98 0.07 0.02 0.68 M-S9 Retail trade 0.10 1.87 0.56 20.67 0.19 0.06 2.09 M-S10 Finance and insurance 0.00 1.87 0.48 14.48 0.00 0.00 0.03 M-S11 Real estate and rentals 0.01 1.62 0.22 8.83 0.02 0.00 0.12 M-S12 Professional services 0.01 2.06 0.66 22.06 0.02 0.01 0.22 M-S13 Business services 0.00 1.95 0.64 24.25 0.00 0.00 0.03 M-S14 Educational services 0.00 2.05 0.64 26.71 0.00 0.00 0.02 M-S15 Health services 0.00 1.99 0.67 19.52 0.01 0.00 0.08 M-S16 Arts, entertainment, … 0.00 1.92 0.72 29.29 0.01 0.00 0.09 M-S17 Accommodation 0.15 1.95 0.59 16.94 0.29 0.09 2.51 M-S18 Eating and drinking places 0.01 2.02 0.57 23.85 0.01 0.00 0.15 M-S19 Other services 0.00 2.00 0.61 25.10 0.01 0.00 0.07 M-S20 Government - 1.91 0.91 24.28 - - - Total In-state Expenditures 24.94 Total Indirect & Induced Impacts 47.52 14.25 411Initial Impacts (at farms) 37.66 14.43 569Total Economy-wide Impacts 85.17 28.68 980
a Aggregate in-state expenditures originated from the five separated crop groups (Macadamia nuts, coffee, and other fruits; Pineapples; Flowers & nursery products; Other crops (seeds and non-seed); and Forestry & logging). Expenditures are estimated based on the industry’s transaction data in The Hawaii Inter-County Input-Output Study: 2002 Benchmark Report. b Job multipliers were adjusted to 2007 employment (for inflation and productivity gain) according to the DBEDT’s forecast in the 2002 Inter-County I-O model. For example, because of inflation and productivity gain, a million dollars worth of output in 2007 would require less number of workers to produce than a million dollars worth of the same output produced in 2002.