wages determinants in the european union
TRANSCRIPT

S TAT I S T I C A L R E P O R T S
S TAT I S T I C A L R E P O R T S
Reconciliation of EU-SILC data and national accounts
2019 edition
Wages determinants in the European Union
EVIDENCE FROM STRUCTURE OF EARNINGS SURVEY (SES 2014) DATA 2020 edition


Wage determinants in the European Union
EVIDENCE FROM STRUCTURE OF EARNINGS SURVEY (SES 2014) DATA 2020 edition

Manuscript completed in March 2020 Neither the European Commission nor any person acting on behalf of the Commission is responsible for the use that might be made of the following information. Luxembourg: Publications Office of the European Union, 2020 © European Union, 2020 Reuse is authorised provided the source is acknowledged. The reuse policy of European Commission documents is regulated by Decision 2011/833/EU (OJ L 330, 14.12.2011, p. 39). Copyright for photographs: © Shutterstock/POPOKEVA_IRINA For any use or reproduction of photos or other material that is not under the EU copyright, permission must be sought directly from the copyright holders. For more information, please consult: https://ec.europa.eu/eurostat/about/policies/copyright The information and views set out in this publication are those of the authors and do not necessarily reflect the official opinion of the European Union. Neither the European Union institutions and bodies nor any person acting on their behalf may be held responsible for the use which may be made of the information contained therein. Theme: Population and social conditions Collection: Statistical reports PDF ISBN 978-92-76-17435-6 ISSN 2529-3222 doi:10.2785/596126 KS-FT-20-003-EN-N

3 Wage determinants in the European Union
Foreword Since the turn of the millennium, the European Commission (Eurostat) has published detailed and
harmonized information on the nominal wages paid by the employers to their employees. This
information, collected with the support of the European Statistical System, provides important
insights into the labour market situation of the different Member States of the European Union. For
employers, wages represent an important part of the production costs and determine to some extent
their cost competitiveness. For most employees, wages make the main part of their income thereby
contributing to their economic welfare. The importance of ensuring fair and transparent wages was
highlighted in the European pillar of social rights (Commission, 2017) that was fully endorsed by the new
Commission (van der Leyen, 2019).
It is therefore important to monitor the levels and developments of wages and total labour costs at a
macroeconomic level, as done by Eurostat through a complete set of annual and quarterly
releases(1). It is equally useful to analyse how the individual job profiles and characteristics of the
employer determine wage patterns in the different EU countries. This provides information on how
labour markets reward the different characteristics of the job tenant and how the different types of
businesses compete in terms of wages offered to their employees. By crossing job characteristics
with sex, such analyses also shed light on possible gaps between the financial returns on education,
part-time work etc. offered to men versus women.
The study presented in this document uses the detailed information collected through the latest
Structure of Earnings Survey (SES 2014) that records the gross wages received and the individual
characteristics of about 240 000 enterprises and 11 million employees throughout the EU.
This statistical working paper should help users to better understand the determinants of wages in
the different EU countries thus contributing to the public debate and policy actions in the labour
market domain.
Keywords: labour market statistics, wages, structure or earnings
Authors: Javier Alcantara-Ortega, Thibaut Henrion, Denis Leythienne (Eurostat, Unit F-3: Labour
market statistics and lifelong learning)
(1) See in particular: https://ec.europa.eu/eurostat/statistics-explained/index.php?title=Labour_cost_structural_statistics_-_levels https://ec.europa.eu/eurostat/statistics-explained/index.php?title=Labour_cost_structural_statistics_-_changes https://ec.europa.eu/eurostat/statistics-explained/index.php?title=Labour_cost_index_-_recent_trends

4 Wage determinants in the European Union
Table of contents Foreword........................................................................................................................................ 3 Table of contents .......................................................................................................................... 4
Introduction ................................................................................................................. 5 1.1 Background ........................................................................................................................ 5 1.2 Aim of the study ................................................................................................................. 6
Data source and methodology ................................................................................... 7 2.1 The Structure of Earnings Survey ..................................................................................... 7 2.2 Method ................................................................................................................................ 8
Results and Analysis ................................................................................................ 11 3.1 Age ......................................................................................................................................... 11 3.2 Education............................................................................................................................... 13 3.3 Other effects .......................................................................................................................... 15
Conclusions .............................................................................................................. 20
References ................................................................................................................ 21
Appendix: Sector and occupation ........................................................................... 22

1 Introduction
5 Wage determinants in the European Union
1.1 Background The analytical framework used in this study is provided by the seminal work “Schooling, experience
and earnings” (Mincer, 1974) where Jacob Mincer modelled the earnings as a function of schooling
and experience.
More precisely, the logarithm of earnings was described as a function of both the sum of years of
education and a quadratic function of years of potential experience. The introduction of the variable
‘experience’ with both a linear and a quadratic factor was due to the typical concave shape that the
actual data from earnings displayed as the age variable increases: a bigger increase of the earnings
at the beginning of the working life with a flattened pattern towards the end of the working life.
In this study, the original Mincer equation was adapted, as the Structure of Earnings Survey (SES)
does not collect the years of potential experience but the age of the employee and his/her tenure
(number of years) with the latest employer.
Moreover, additional variables collected through SES were included in the model, such as the effect
of part-time work and of indefinite versus fixed term contracts as well as the main characteristics of
the employing firm (NACE activity, size).
Finally, some individual characteristics of the employees have been crossed with sex to estimate the
interaction between gender and other wage determinants such as age, education and part time work.
1 Introduction

1 Introduction
6 Wage determinants in the European Union
1.2 Aim of the study The aim of the study is to explain how earnings are determined in the different Member States, using
the same regression model across countries and applying it to a harmonized source (SES). By
analysing gross earnings, and comparing their determinants across countries, we can understand
better the functioning of labour markets in Europe. In addition, by crossing the explanatory variables
with the gender dimension, we can also identify, measure and possibly interpret any differences in
the gross wages earned by men versus women in EU labour markets.
The coefficients obtained from the regression represent the financial returns of a given
characteristics, such as holding a Bachelor degree or equivalent, to the expected earnings of the job
holder.
When the financial returns significantly differ for a category of employees, e.g. working part-time or
under fixed term contracts, this can point to a possible segmentation in the labour market concerned.
Moreover, by comparing financial returns across countries, it is possible in some cases to isolate
group of countries with similar outcomes with respect to the variable studied.
In the next part (§ 2.1) of this document, we will first introduce the data source used in this study
namely the Structure of Earnings Survey.
In part 2.2, we will then describe the regression model used and detail the explanatory (exogenous)
variables.
The coefficients obtained from the regression are interpreted, with a cross country perspective, in
part 3 whereas the main conclusions are drawn in part 4.
2 Data source and methodology
7 Wage determinants in the European Union
2.1 The Structure of Earnings Survey The Structure of Earnings Survey (SES) is a large business survey that provides comparable micro
data on the link between the level of earnings and the individual characteristics of the employees
(sex, age, occupation, educational level) and of their employer (economic activity, size of the
enterprise, etc.).
This survey is run every four years by the European Statistical System, in accordance with Council
Regulation 530/1999. The data analysed in this study refer to reference year 2014 (SES 2014)
pending the next wave (SES 2018) to be analysed in the course of 2021.
The gross hourly earnings collected by the SES refer to the wages and salaries earned by full-time
and part-time employees, per hour paid, in the reference month (generally October 2014 for the SES
2014 exercise) before any tax and social security contributions are deducted. Wages and salaries
include any overtime pay, shift premiums, allowances, bonuses, commission, etc. SES data refer to
enterprises with at least 10 employees operating in all areas of the economy except public
administration (Section O of the Statistical classification of economic activities in the European
Community). Information on public administration as well as enterprises with less than 10 employees
is also available for some countries on a voluntary basis.
The National Statistical Institutes are responsible for selecting the sample, preparing the
questionnaires, conducting the survey and forwarding the results to Eurostat in accordance with the
common coding scheme as stipulated by the implementing arrangements prepared by Eurostat. The
data are centrally processed by Eurostat.
The SES is also used to compile other structural indicators such as the gender pay gap or the
proportion of low wage earners.
2 Data source and methodology
2 Data source and methodology
8 Wage determinants in the European Union
2.2 Method We have carried out a regression on gross earnings collected from SES with the explanatory
variables collected through the same survey. The regression coefficients are estimated using the
SES detailed information on individual earnings (endogenous variable), which are matched with the
individual characteristics of the employee and his/her employer (exogenous). In addition, an
enterprise-level random effect is included to take into account the unobserved characteristics, at the
enterprise level. Finally, the regression model is the following:
𝑦𝑦𝑖𝑖𝑖𝑖 = 𝑥𝑥′𝑖𝑖𝑖𝑖𝛽𝛽 + 𝜇𝜇𝑖𝑖 + 𝜀𝜀𝑖𝑖𝑖𝑖 Where:
- yij is the natural logarithm of hourly (gross) wages of an individual i working in enterprise j. Wages
do not include bonuses or irregular payments;
- The vector x of explanatory variables consists of personal characteristics, job characteristics and
enterprise characteristics (see table below); interactions of several variables with the gender dummy
were used where statistically significant;
- μ is the enterprise-level random effect, modelled through a cluster variable, which allows for
different earnings within a given enterprise, irrespective of the characteristics of its labour force.
- ε is the error term.
The analysis is constrained by the different effects that personal and job characteristics may have on
wages in the different Member States, as well as the differences in sample sizes and coverage.
In line with the relevant scientific literature, persons below the age of 23, above the age of 65, those
working less than 16 hours and apprentices were excluded from the analysis, as well as any cases
with incomplete information in the variables of interest. The individuals with the lowest and highest
0.5% of hourly wage are excluded as well in order to avoid a bias in the results due to outliers. Some
industries and occupations (e.g. fishing industry, armed forces) are not included at all in SES data. In
this case, no indication for the average salary for these particular industries and occupations can be
given.
Regression models It was decided to use 4 ISCED categories, splitting tertiary education into lower tertiary (ISCED
levels 5 and 6) and upper tertiary levels (ISCED levels 7 and 8).
The 2-digit level of the ISCO-08 classification has been used. Finally, a binary variable for part / full
time work has been used. Indeed, the relation between earnings and the number of hours worked is
generally not linear, part-time workers earnings generally less, per hour worked, than full-timers.
We selected in the regression model those SES variables that had a significant effect on wages in a
majority of Member States, as listed in table 1.

2 Data source and methodology
9 Wage determinants in the European Union
Table1: List of SES variables selected in the regression model
(1) https://ec.europa.eu/eurostat/statistics-explained/index.php?title=Glossary:International_standard_classification_of_education_(ISCED) (2) https://ec.europa.eu/eurostat/statistics-explained/index.php?title=Glossary:International_standard_classification_of_occupations_(ISCO) Source: Eurostat, Structure or Earnings Survey 2014
There are no cut-offs for the variable “tenure in the current firm”, but if the amount of years entered
exceeds "age-14" it will not be accepted, as it implies the individual started to work at age 13 or
younger. Individuals working less than 16 or more than 60 hours per week were excluded from the
regression analysis.
Variable Values Notes
Gross hourly wages Natural logarithm Dependent variable; the lowest and highest 0.5% of wages were excluded from the sample.
Gender male (base), female Interactions between female and age, age squared and education are included.
Age age, age squared
Individuals aged 23 - 65 are included. Proxy for experience; the age squared term is necessary to capture changing returns to experience.
Education
ISCED level 1+2 (basic education up to lower secondary), 3+4 (upper secondary), 5+6 (lower tertiary up to Bachelor and equivalent), 7+8 (upper tertiary up to Master and Doctoral) (1)
Occupation 2-digit ISCO-08 code (2)
Base category is ISCO code 9.1 (Elementary occupations - subgroup “Cleaners and helpers”); ISCO code 6 (skilled agricultural and fishery workers) are not available for all Member States.
Job experience measured as “tenure” (number of years with the current employer)
in years Only the experience in the current job is taken into account in this variable.
Type of contract fixed term, permanent Apprentices were excludedWorking time Full-time / part-time
Industry NACE rev. 2 sections
Information for section "Public administration and defence; compulsory social security" is not available for all Member States.
Enterprise size 1-9; 10-49; 50-249; 250-499; 500-999; 1000+
Information for enterprises with less than 10 employees is not available for all MS.
Personal and job characteristics:
Enterprise characteristics:

2 Data source and methodology
10 Wage determinants in the European Union
Plausibility checks The plausibility of the earnings estimated according to the above-described model were tested
through a large number of cases. The simulation generated plausible results except for some
countries, in particular for older employees. For this reason, it was necessary to withdraw the
variable combining age with gender from the regression in the case of Czechia, Denmark, Spain and
Romania, and to withdraw the variable combining age2 with gender in the case of Germany, Finland,
France and Hungary.
Coefficient of determination The coefficient of determination (R2) indicates which share of the variation in earnings, as measured
by the variance, is explained by the model and which part remains unexplained.
The results for the coefficient of determination of the regression are displayed in table 2.
Table 2: Coefficient of determination
Source: Eurostat, Structure or Earnings Survey 2014
The share of the variance in the logarithm of the earnings which is determined by the SES-based
model described on part 2.2 varies between 41% in Latvia to 79% in Belgium. This means that
earnings are determined in Belgium, to a large extent, by the characteristics of the employer and the
employees. This is less the case in Latvia where a large part of the earnings is left unexplained being
due to other variables (e.g. total work experience) that are not collected in SES or due to the
individual performance of each employee irrespective of its objective characteristics.
BE BG CZ DK DE EE IE EL ES FR0.8 0.5 0.6 0.5 0.6 0.4 0.5 0.6 0.6 0.6HR IT CY LV LT LU HU MT NL AT0.5 0.6 0.7 0.4 0.5 0.7 0.5 0.5 0.6 0.6PL PT RO SI SK FI SE0.6 0.7 0.6 0.5 0.5 0.6 0.5
3 Results and analysis
11 Wage determinants in the European Union
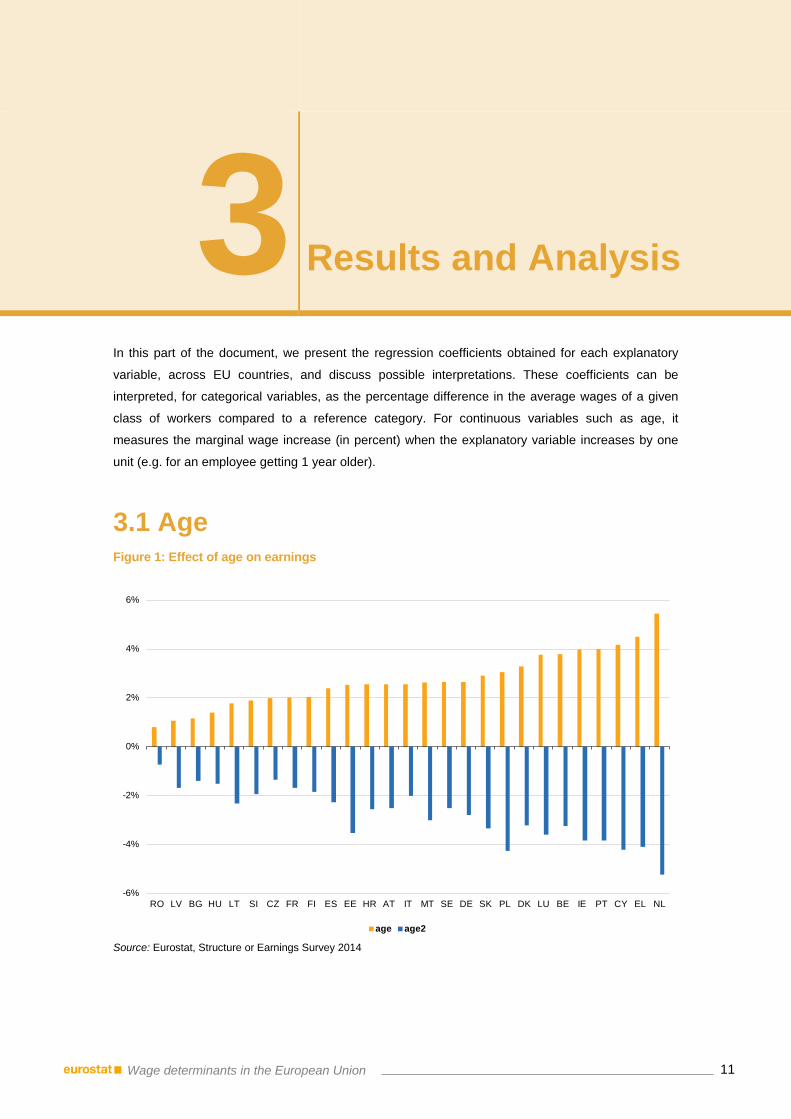
In this part of the document, we present the regression coefficients obtained for each explanatory
variable, across EU countries, and discuss possible interpretations. These coefficients can be
interpreted, for categorical variables, as the percentage difference in the average wages of a given
class of workers compared to a reference category. For continuous variables such as age, it
measures the marginal wage increase (in percent) when the explanatory variable increases by one
unit (e.g. for an employee getting 1 year older).
3.1 Age Figure 1: Effect of age on earnings
Source: Eurostat, Structure or Earnings Survey 2014
-6%
-4%
-2%
0%
2%
4%
6%
RO LV BG HU LT SI CZ FR FI ES EE HR AT IT MT SE DE SK PL DK LU BE IE PT CY EL NL
age age2
3 Results and Analysis

3 Results and analysis
12 Wage determinants in the European Union
The chart in the previous page shows that salaries increase with age (positive coefficient for variable
“age”). The effect of age is highest in the Netherlands. This relationship is generally non-linear, as if
there was a cap on the average salaries that translates into a negative coefficient for age-squared
(age2).
The following chart shows the effect of age on the earnings of women compared with men. The
coefficient for the variable age × female is generally negative, showing that the financial return on
age is smaller for women than for men (with a small exception in Hungary). This could be due to the
fact that some women are penalised in the first stage of their careers when they stop working (or
they work part-time) in order to take care of their children, slowing down their professional
development and accumulation of working experience. The correlation coefficient for age-squared is
generally positive, which could be interpreted as a catching-up effect for women that were penalised
at the start of their careers leaving room for wage increases until the salary cap has been reached.
Countries that display a large negative coefficient for age × female generally display another equally
large coefficient for age2 × female that mitigates the impact of the first coefficient for older workers.
Finally, it must be noted that a number of countries show equal financial returns on age for men and
women.
Figure 2: Effect of age and sex on earnings
* The effect of (age × female) has not been estimated for Czechia, Denmark, Spain and Romania nor the effect of (age2 × female) for Germany, Finland, France and Hungary.
Source: Eurostat, Structure or Earnings Survey 2014
-2.5%
-2.0%
-1.5%
-1.0%
-0.5%
0.0%
0.5%
1.0%
1.5%
2.0%
2.5%
3.0%
SK EE HR IE PT BG MT IT LT NL EL SE PL FI* FR* DE* AT BE CY LU LV SI HU* CZ* DK* ES* RO*
age × female age2 × female

3 Results and analysis
13 Wage determinants in the European Union
3.2 Education The next chart shows the impact of education on earnings. The first stack in each column reflects the
impact on earnings of completing upper secondary education in reference to just completing lower
secondary education (school-leaving certificate). The second stack reflects the impact on earnings of
completing lower tertiary education (Bachelor degree’s and other lower tertiary qualifications) in
reference to just completing upper secondary education. The third stack reflects the impact of
completing upper tertiary education (Master’s and Doctoral degrees) when compared against just
completing lower tertiary education.
Figure 3: Effect of education on earnings
Source: Eurostat, Structure or Earnings Survey 2014
First of all, all stacks are positive, showing that higher levels of education always yield higher
average earnings (when compared to the education level immediately below).
The impact of education (all levels combined) on earnings is highest in Hungary, Slovakia and
Croatia. Completing upper secondary is rewarded the highest in Slovakia and Portugal. In 19 out of
28 countries, completing upper tertiary (against lower tertiary) brings a bigger increase in earnings
than completing lower tertiary (against just upper secondary). This is more noticeable in Belgium,
Estonia, Spain, Finland and Sweden. On the contrary, in the other 9 countries, the increase in
earnings when going from upper secondary to lower tertiary is bigger than when going from lower
tertiary to upper tertiary. This is more noticeable in Hungary and Portugal, where the effort of
completing upper tertiary is not rewarded financially as high as it is done for lower tertiary alone.
0%
10%
20%
30%
40%
50%
60%
LU IE EE IT FI ES CY BG DK CZ MT PL DE LV EL AT FR NL BE LT PT RO SI SE HR SK HU
Upper secondary vs Lower secondary Lower tertiary vs Upper secondary Upper tertiary vs Lower tertiary

3 Results and analysis
14 Wage determinants in the European Union
The next chart shows the financial return of education levels for women, compared with men, ranked
according to the results obtained for lower tertiary education. Three groups can be distinguished. A
first group (comprising Slovakia, Germany, Austria, Spain, Finland and Sweden) covers countries
where women seem to get a lower financial return on their education as compared to men at least for
some education levels. A second group (comprising Croatia, Luxembourg, Latvia, Greece, Portugal,
Hungary and Slovenia) covers countries where women on the contrary seem to get a higher financial
return than men from their educational achievements. And finally a middle group covers countries
with limited or no impact of gender on the financial return of education.
Figure 4: Effect of education and sex on earnings
Source: Eurostat, Structure or Earnings Survey 2014
-15%
-10%
-5%
0%
5%
10%
15%
SK DE AT ES FI SE BG BE CY CZ DK EE FR IE IT LT MT NL PL RO SI HU PT EL LV LU HR
Secondary × female Lower tertiary education × female Upper tertiary × female

3 Results and analysis
15 Wage determinants in the European Union
3.3 Other effects Duration of the contract As shown in the chart on the next page, the average salaries are lower for fixed-term workers,
compared with the reference category which consists of employees with indefinite contracts,
especially in Poland, Luxembourg and Croatia.
This could reflect a dual labour market, with marked difference in the wages offered under indefinite
versus fixed-term contracts. However, this is not systematic and some Member States namely:
Bulgaria, Belgium, Estonia, Greece, Latvia, Malta and Sweden do not exhibit significant differences
according to the duration of the contract.
Figure 5: Effect of fixed term contracts on earnings
Source: Eurostat, Structure or Earnings Survey 2014
-16%
-14%
-12%
-10%
-8%
-6%
-4%
-2%
0%PL LU HR IE DE SI NL SK CZ LT PT FI HU AT IT CY ES FR RO DK BG BE EE EL LV MT SE

3 Results and analysis
16 Wage determinants in the European Union
Part-time work The reference level being full-time workers, working part-time has a negative impact on hourly wages
in all EU countries except Denmark and Luxembourg (see the chart next page). The countries where
working part-time has the highest negative effect are Greece, Romania and Italy.
As for duration though, some countries do not record significant differences between the expected
earnings of full-time versus part-time workers. This is the case for Cyprus, Finland, Croatia, Latvia,
Malta and Poland.
Figure 6: Effect of part-time work on earnings
Source: Eurostat, Structure or Earnings Survey 2014
-14%
-12%
-10%
-8%
-6%
-4%
-2%
0%
2%
4%
6%
EL RO IT HU SK LT ES SI AT IE PT NL DE CZ BE EE BG FR SE CY FI HR LV MT PL LU DK

3 Results and analysis
17 Wage determinants in the European Union
Job tenure This chart shows that salaries increase with the number of years spent in the firm (positive coefficient
for variable “tenure”) used as a proxy to the “total number of years of employment” which is not
available in the Structure of Earnings Survey. It must be noted that these financial returns on
experience in the same firm cumulate with the effect of age analysed in part 3.1.
The effect of tenure is highest in Cyprus, and Greece (where perhaps workers tend to stay longer in
the same firm) and lowest for Finland and Sweden (where the labour market might be more dynamic
and workers might change jobs more often).
Figure 7: Effect of job tenure on earnings
Source: Eurostat, Structure or Earnings Survey 2014
0.0%
0.2%
0.4%
0.6%
0.8%
1.0%
1.2%
1.4%
1.6%
1.8%
FI SE IT MT NL BE SK HR DK PL EE IE LT CZ HU FR SI BG RO DE LV PT AT ES LU EL CY

3 Results and analysis
18 Wage determinants in the European Union
Size of the enterprise The next chart shows the effect of the enterprise size on hourly wages, the reference category being
employees working in very large enterprises of more than 1000 employees. Countries are ranked
according to the results obtained for enterprises with 50 to 249 employees. The graphs reflects the
fact that in general the smaller the enterprise, the smaller the average hourly salary. This difference
is most visible in Romania, Bulgaria, Germany, Ireland, Cyprus, Czechia and Slovakia. The only
exceptions are Finland, Denmark and Latvia where some middle to large sized companies pay better
than the very large enterprises of more than 1000 employees, on average (though the effect is very
limited).
Figure 8: Effect of the enterprise size on earnings
Source: Eurostat, Structure or Earnings Survey 2014
-60%
-50%
-40%
-30%
-20%
-10%
0%
10%
20%
RO BG DE IE CY CZ SK LT PO PT HU MT LU EL IT ES FR SI AT BE NL EE FI HR SE DK LV
9 or less employees 10-49 employees 50-249 employees 250-499 employees 500-999 employees

3 Results and analysis
19 Wage determinants in the European Union
Sector and occupation Given the numerous sectors and occupations used in the regression, the results are displayed in
annex in the form of tables followed by a short analysis.
Effect of ‘capital’ regions
In addition to the standard model described in part 2.2, we tested the existence of pay gaps between
the ‘capital regions’, defined as the NUTS 1 region that includes the capital of the country, and the
average hourly earnings in the country as a whole. The correction coefficients for capital regions
were obtained as follows:
1. For each record i, adjusted earnings were calculated as: exp (µi+εi)
2. The average adjusted earnings for the whole country was calculated as:
Mcountry = Mean (i ∈ country) [exp (µi+εi) ]
3. The average adjusted earnings for the capital region was calculated as:
Mcapital = Mean (i ∈ capital region) [exp (µi+εi) ]
4. The correction coefficient is obtained as MCapital / Mcountry.
These tests were applied to the countries and NUTS regions listed in table 3.
Table 3: NUTS I capital regions analysed separately
Source: Eurostat, Structure or Earnings Survey 2014
Table 4 includes the coefficients for all countries/regions concerned. The intention is to inform users
of the existence of a ‘capital effect’ as the tool provides estimates for the country as a whole.
Table 4: Earnings gap measured in the capital regions compared with the country as a whole
Source: Eurostat, Structure or Earnings Survey 2014
NUTS 1 code English translation of the regionAT1 East AustriaBE1 Brussels Capital RegionBG4 South-Western and South-Central BulgariaDE3 BerlinES3 Community of MadridFR1 Île-de-France (Paris region)EL3 AtticaHU1 Central HungaryITI Central Italy
NL3 West NetherlandsPL1 Central region (Poland)RO3 Macroregion three (Romania)SE1 East Sweden
BE1 BG4 DE3 EL3 ES3 FR1 ITI HU1 NL3 AT1 PL1 RO3 SE10% 4% -2% 4% 4% 8% 0% 8% 2% 1% 6% 10% 1%

3 Results and analysis
20 Wage determinants in the European Union
In this study, we have used the latest vintage (SES2014) of Structure of Earning Survey data to
study the relation between the individual characteristics of the employees and their employers and
their gross wages. We have estimated the impact of each variable collected in SES on the expected
earnings of employees and compared them across countries highlighting those with similar patterns.
Although SES does not include all relevant variables that would explain earnings, in particular the
total working experience, the regression model selected for this analysis could generally explain
more than 50% of the total variance and up to 79% in one case.
The results obtained indicate that the main drivers of earnings are: the age of the employee (which is
a cumulative factor for every year of age), his/her level of education and occupation. The
characteristics of the employer, namely the size and sector of activity of the employer also play a
major role in the expected earnings of employees.
Moreover, the study confirmed the generally negative impact of working part-time or with a fixed-term
contract (as opposed to an indefinite contract) on the expected wages received by employees.
However, this is not systematic and some Member States do not exhibit such a segmentation
between higher paid jobs, with full time and permanent contracts, and lower paid employees under
more precarious conditions.
In most cases, different financial returns for age were observed for men versus women. Whereas the
latter are generally less rewarded for the factor age at the beginning of their careers, this effect is
partly mitigated with positive returns (in comparison to men) when they get closer to retirement.
The financial returns on education are sometimes smaller for women than for men although the
reverse might be true in some countries. For most Member States, the difference was found
negligible or limited to specific education levels.
Finally, we have analysed the effect of working in a capital region which can lead to a wage
differential of 5% or more in some Member States (France, Hungary, Poland and Romania), most
likely due to higher costs of living in the corresponding capital regions.
4 Conclusions

4 Chapter title
21 Wage determinants in the European Union
Bazen S. (2011), Econometric methods for labour economics, Oxford: Oxford University Press.
European Commission (2017), Communication from the Commission on establishing a European Pillar of Social Rights — Social Scoreboard.
Eurostat (2009), Development of econometric methods to evaluate the gender pay gap using Structure of Earnings Survey data.
Eurostat (2016), Statistics Explained: Earnings statistics.
Eurostat (2014), Structure of Earnings Survey 2014. Eurostat’s arrangements for implementing the Council Regulation 530/1999, the Commission Regulations 1916/2000 and 1738/2005.
Eurostat (2018), Leythienne, D. and Ronkowski, P., A decomposition of the unadjusted gender pay gap using Structure of Earnings Survey data.
Eurostat (2020), Statistics Explained: Salary calculator.
Lewis, T.H. (2017), Complex Survey Data Analysis with SAS, Boca Raton: CRC Press.
Van der Leyen, Ursula (2019), A Union that strives for more: my agenda for Europe.
Mincer, J. (1974), Schooling, experience and earnings, New York: National Bureau of Economic Research.
References

4 Chapter title
22 Wage determinants in the European Union
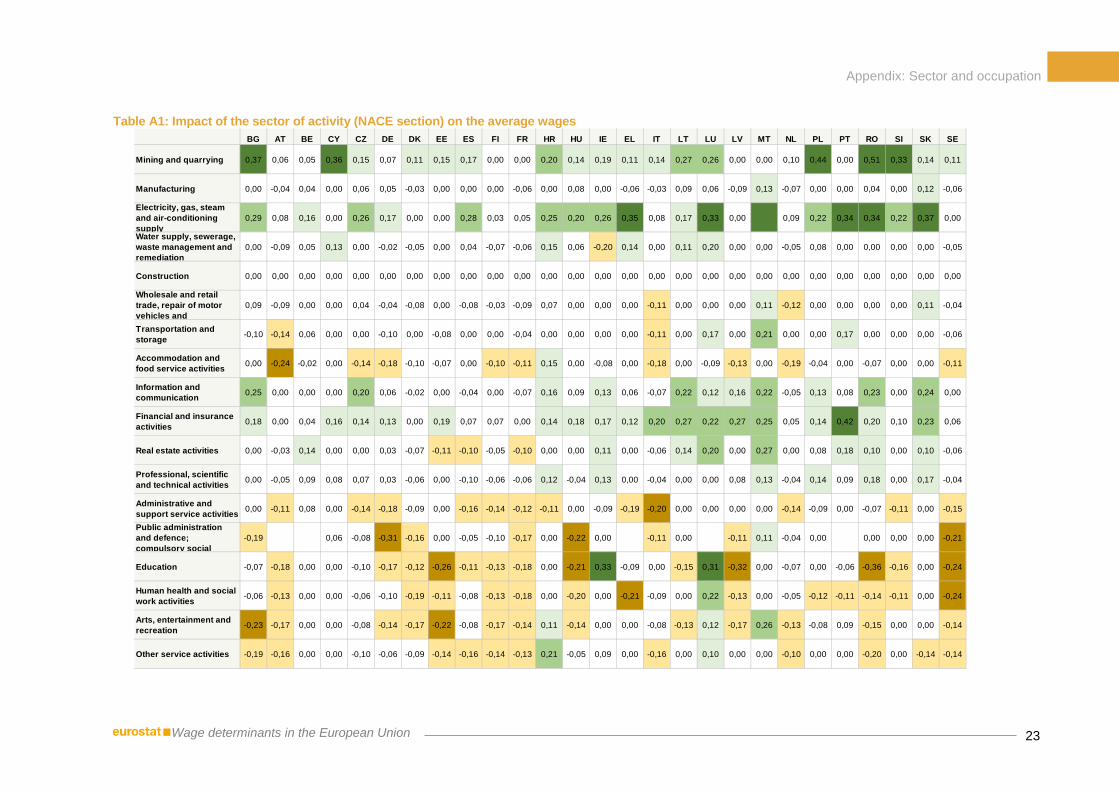
In the next tables, we show the impact of the sector of activity of the employer (table A1) and the
impact of the occupation of the employee on its expected salaries (table A2).
Table A1 shows the impact of the sector of activity of the employer on the average wages of their
employees, all other things being equal, compared with the ‘Construction’ sector. According to their
regression coefficients, the high-paying sectors are: “Mining and quarrying”, “Electricity and gas”,
“Information and communication” and “Financial insurance activities”. Those sectors that pay lower
than construction are: “Accommodation and food services”, “Administrative support”, “Public
administration and support” and “Education” (with the notable exceptions of Ireland and Luxembourg
that record high positive coefficients for education), “Human health and social work” (again with the
exception of Luxembourg), “Arts, entertainment and recreation” (with the exception of Malta), and the
sector “Other service activities” (with the exception of Croatia).
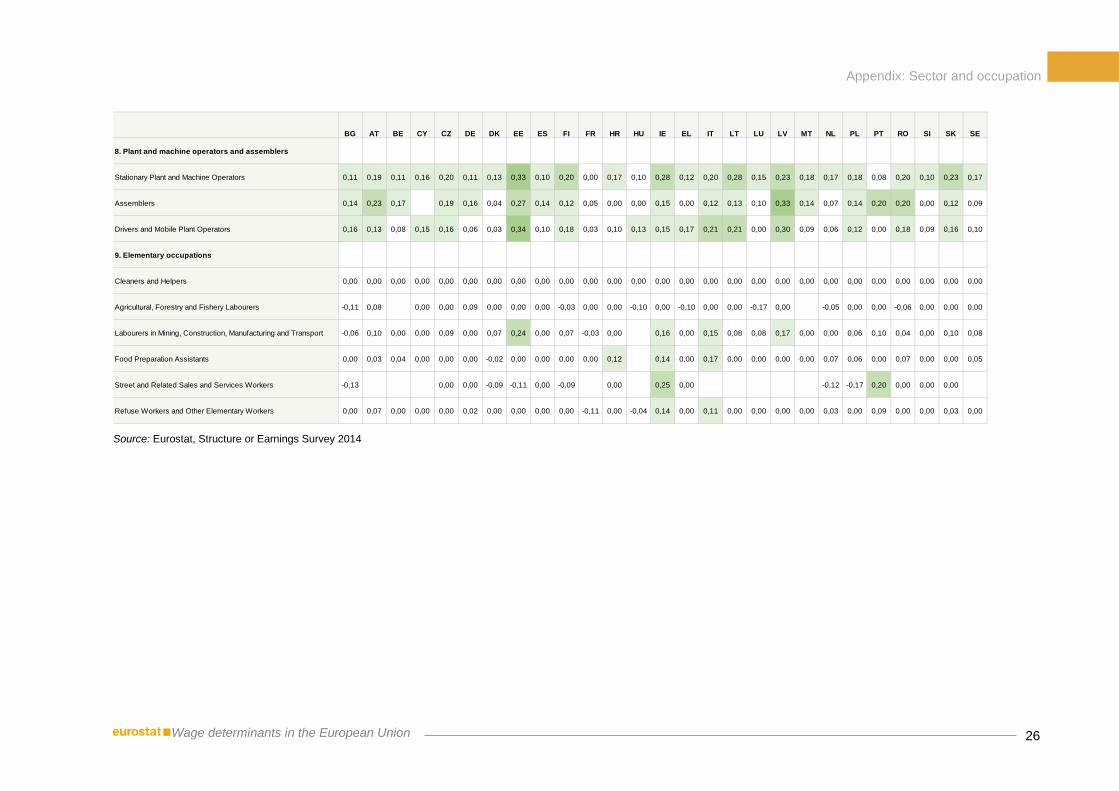
Table A2 shows the impact of the occupation of the employee on its expected salaries, as compared
with “Elementary occupations” as the reference group (level 0 being the second digit occupation
“Cleaners and helpers” inside “Elementary occupations”). The well-paying occupations are
expectedly “Managers” then “Professionals”, “Technicians and associate professionals”. Occupations
paying less well (though still more than the bottom line “Elementary occupations”) are: “Clerical
support”, “Service and sales workers”, “Skilled agricultural, forestry and fishery workers” and “Plant
and machine operators and assemblers”.
Appendix: Sector and occupation
Appendix: Sector and occupation
23 Wage determinants in the European Union
Table A1: Impact of the sector of activity (NACE section) on the average wages
BG AT BE CY CZ DE DK EE ES FI FR HR HU IE EL IT LT LU LV MT NL PL PT RO SI SK SE
Mining and quarrying 0,37 0,06 0,05 0,36 0,15 0,07 0,11 0,15 0,17 0,00 0,00 0,20 0,14 0,19 0,11 0,14 0,27 0,26 0,00 0,00 0,10 0,44 0,00 0,51 0,33 0,14 0,11
Manufacturing 0,00 -0,04 0,04 0,00 0,06 0,05 -0,03 0,00 0,00 0,00 -0,06 0,00 0,08 0,00 -0,06 -0,03 0,09 0,06 -0,09 0,13 -0,07 0,00 0,00 0,04 0,00 0,12 -0,06
Electricity, gas, steam and air-conditioning supply
0,29 0,08 0,16 0,00 0,26 0,17 0,00 0,00 0,28 0,03 0,05 0,25 0,20 0,26 0,35 0,08 0,17 0,33 0,00 0,09 0,22 0,34 0,34 0,22 0,37 0,00
Water supply, sewerage, waste management and remediation
0,00 -0,09 0,05 0,13 0,00 -0,02 -0,05 0,00 0,04 -0,07 -0,06 0,15 0,06 -0,20 0,14 0,00 0,11 0,20 0,00 0,00 -0,05 0,08 0,00 0,00 0,00 0,00 -0,05
Construction 0,00 0,00 0,00 0,00 0,00 0,00 0,00 0,00 0,00 0,00 0,00 0,00 0,00 0,00 0,00 0,00 0,00 0,00 0,00 0,00 0,00 0,00 0,00 0,00 0,00 0,00 0,00
Wholesale and retail trade, repair of motor vehicles and
0,09 -0,09 0,00 0,00 0,04 -0,04 -0,08 0,00 -0,08 -0,03 -0,09 0,07 0,00 0,00 0,00 -0,11 0,00 0,00 0,00 0,11 -0,12 0,00 0,00 0,00 0,00 0,11 -0,04
Transportation and storage -0,10 -0,14 0,06 0,00 0,00 -0,10 0,00 -0,08 0,00 0,00 -0,04 0,00 0,00 0,00 0,00 -0,11 0,00 0,17 0,00 0,21 0,00 0,00 0,17 0,00 0,00 0,00 -0,06
Accommodation and food service activities 0,00 -0,24 -0,02 0,00 -0,14 -0,18 -0,10 -0,07 0,00 -0,10 -0,11 0,15 0,00 -0,08 0,00 -0,18 0,00 -0,09 -0,13 0,00 -0,19 -0,04 0,00 -0,07 0,00 0,00 -0,11
Information and communication 0,25 0,00 0,00 0,00 0,20 0,06 -0,02 0,00 -0,04 0,00 -0,07 0,16 0,09 0,13 0,06 -0,07 0,22 0,12 0,16 0,22 -0,05 0,13 0,08 0,23 0,00 0,24 0,00
Financial and insurance activities 0,18 0,00 0,04 0,16 0,14 0,13 0,00 0,19 0,07 0,07 0,00 0,14 0,18 0,17 0,12 0,20 0,27 0,22 0,27 0,25 0,05 0,14 0,42 0,20 0,10 0,23 0,06
Real estate activities 0,00 -0,03 0,14 0,00 0,00 0,03 -0,07 -0,11 -0,10 -0,05 -0,10 0,00 0,00 0,11 0,00 -0,06 0,14 0,20 0,00 0,27 0,00 0,08 0,18 0,10 0,00 0,10 -0,06
Professional, scientific and technical activities 0,00 -0,05 0,09 0,08 0,07 0,03 -0,06 0,00 -0,10 -0,06 -0,06 0,12 -0,04 0,13 0,00 -0,04 0,00 0,00 0,08 0,13 -0,04 0,14 0,09 0,18 0,00 0,17 -0,04
Administrative and support service activities 0,00 -0,11 0,08 0,00 -0,14 -0,18 -0,09 0,00 -0,16 -0,14 -0,12 -0,11 0,00 -0,09 -0,19 -0,20 0,00 0,00 0,00 0,00 -0,14 -0,09 0,00 -0,07 -0,11 0,00 -0,15
Public administration and defence; compulsory social
-0,19 0,06 -0,08 -0,31 -0,16 0,00 -0,05 -0,10 -0,17 0,00 -0,22 0,00 -0,11 0,00 -0,11 0,11 -0,04 0,00 0,00 0,00 0,00 -0,21
Education -0,07 -0,18 0,00 0,00 -0,10 -0,17 -0,12 -0,26 -0,11 -0,13 -0,18 0,00 -0,21 0,33 -0,09 0,00 -0,15 0,31 -0,32 0,00 -0,07 0,00 -0,06 -0,36 -0,16 0,00 -0,24
Human health and social work activities -0,06 -0,13 0,00 0,00 -0,06 -0,10 -0,19 -0,11 -0,08 -0,13 -0,18 0,00 -0,20 0,00 -0,21 -0,09 0,00 0,22 -0,13 0,00 -0,05 -0,12 -0,11 -0,14 -0,11 0,00 -0,24
Arts, entertainment and recreation -0,23 -0,17 0,00 0,00 -0,08 -0,14 -0,17 -0,22 -0,08 -0,17 -0,14 0,11 -0,14 0,00 0,00 -0,08 -0,13 0,12 -0,17 0,26 -0,13 -0,08 0,09 -0,15 0,00 0,00 -0,14
Other service activities -0,19 -0,16 0,00 0,00 -0,10 -0,06 -0,09 -0,14 -0,16 -0,14 -0,13 0,21 -0,05 0,09 0,00 -0,16 0,00 0,10 0,00 0,00 -0,10 0,00 0,00 -0,20 0,00 -0,14 -0,14

Appendix: Sector and occupation
24 Wage determinants in the European Union
Table A2: Impact of occupation on the average wages
BG AT BE CY CZ DE DK EE ES FI FR HR HU IE EL IT LT LU LV MT NL PL PT RO SI SK SE
1. Managers
Chief Executives, Senior Officials and Legislators 0,84 0,86 0,82 1,11 0,67 0,78 0,50 0,93 0,75 0,76 0,84 0,84 0,56 0,65 0,52 1,20 0,66 1,10 0,40 0,75 0,64 0,94 0,84 0,93 0,77 0,74 0,72
Administrative and Commercial Managers 0,95 0,78 0,58 1,00 0,88 0,77 0,52 0,79 0,67 0,78 0,56 0,81 0,58 0,72 0,66 1,22 0,77 0,88 0,68 0,73 0,60 0,74 0,94 0,90 0,56 0,69 0,63
Production and Specialized Services Managers 0,76 0,71 0,55 0,86 0,80 0,66 0,43 0,72 0,60 0,68 0,47 0,79 0,64 0,59 1,10 0,59 0,78 0,61 0,62 0,54 0,63 0,77 0,79 0,47 0,69 0,56
Hospitality, Retail and Other Services Managers 0,70 0,53 0,40 0,66 0,52 0,63 0,27 0,57 0,53 0,67 0,48 0,64 0,41 0,44 0,30 0,81 0,50 0,46 0,35 0,66 0,43 0,45 0,59 0,68 0,44 0,49 0,37
2. Professionals
Science and Engineering Professionals 0,54 0,51 0,33 0,44 0,55 0,46 0,34 0,63 0,44 0,47 0,43 0,56 0,44 0,54 0,40 0,54 0,42 0,55 0,43 0,49 0,36 0,41 0,60 0,61 0,41 0,46 0,39
Health Professionals 0,47 0,70 0,45 0,37 0,67 0,60 0,33 0,88 0,57 0,70 0,50 0,64 0,52 0,38 1,06 0,50 0,76 0,49 0,58 0,45 0,41 0,66 0,66 0,62 0,55 0,47
Teaching Professionals 0,44 0,52 0,53 0,67 0,54 0,43 0,20 0,69 0,48 0,36 0,27 0,35 0,38 0,53 0,52 0,71 0,77 0,58 0,46 0,40 0,39 0,91 0,83 0,57 0,46 0,45 0,25
Business and Administration Professionals 0,60 0,57 0,38 0,65 0,70 0,56 0,36 0,75 0,48 0,53 0,52 0,60 0,58 0,59 0,32 0,50 0,52 0,53 0,57 0,51 0,42 0,45 0,61 0,64 0,41 0,57 0,44
Information and Communications Technology Professionals 1,02 0,49 0,36 0,50 0,70 0,50 0,36 0,84 0,42 0,50 0,44 0,51 0,60 0,35 0,47 0,62 0,47 0,71 0,54 0,38 0,61 0,60 0,90 0,47 0,60 0,41
Legal, Social and Cultural Professionals 0,55 0,49 0,33 0,47 0,42 0,43 0,29 0,63 0,37 0,40 0,43 0,42 0,44 0,59 0,27 0,79 0,43 0,56 0,42 0,25 0,39 0,53 0,60 0,55 0,41 0,28 0,36
3. Technicians and associate professionals
Science and Engineering Associate Professionals 0,41 0,44 0,24 0,30 0,44 0,35 0,23 0,58 0,32 0,30 0,23 0,38 0,33 0,39 0,34 0,35 0,34 0,40 0,41 0,31 0,33 0,32 0,45 0,48 0,32 0,38 0,28
Health Associate Professionals 0,27 0,43 0,27 0,30 0,53 0,35 0,21 0,60 0,23 0,34 0,31 0,45 0,42 0,20 0,34 0,29 0,54 0,45 0,55 0,29 0,27 0,38 0,41 0,38 0,38 0,22
Business and Administration Associate Professionals 0,45 0,45 0,23 0,40 0,48 0,41 0,25 0,59 0,28 0,33 0,26 0,46 0,32 0,37 0,26 0,44 0,31 0,37 0,41 0,32 0,32 0,34 0,47 0,38 0,33 0,43 0,27
Legal, Social, Cultural and Related Associate Professionals 0,30 0,35 0,23 0,36 0,36 0,40 0,17 0,39 0,22 0,25 0,22 0,34 0,31 0,37 0,26 0,26 0,28 0,38 0,23 0,26 0,24 0,28 0,45 0,41 0,31 0,24 0,23
Information and Communications Technicians 0,30 0,42 0,22 0,23 0,49 0,44 0,26 0,61 0,24 0,31 0,22 0,37 0,37 0,18 0,41 0,19 0,31 0,37 0,27 0,23 0,33 0,42 0,38 0,37 0,36 0,24

Appendix: Sector and occupation
25 Wage determinants in the European Union
BG AT BE CY CZ DE DK EE ES FI FR HR HU IE EL IT LT LU LV MT NL PL PT RO SI SK SE
4. Clerical support workers
General and Keyboard Clerks 0,13 0,32 0,14 0,15 0,36 0,28 0,15 0,40 0,06 0,18 0,13 0,29 0,27 0,12 0,24 0,16 0,25 0,26 0,15 0,17 0,21 0,26 0,29 0,20 0,35 0,14
Customer Services Clerks 0,15 0,33 0,14 0,15 0,36 0,22 0,06 0,34 0,08 0,14 0,07 0,26 0,19 0,19 0,11 0,29 0,25 0,29 0,28 0,15 0,14 0,18 0,21 0,27 0,20 0,21 0,09
Numerical and Material Recording Clerks 0,20 0,31 0,19 0,20 0,37 0,20 0,11 0,41 0,16 0,18 0,07 0,31 0,24 0,12 0,30 0,24 0,21 0,35 0,16 0,20 0,17 0,19 0,30 0,17 0,28 0,12
Other Clerical Support Workers 0,26 0,22 0,00 0,31 0,32 0,22 0,00 0,36 -0,08 0,05 0,08 0,27 0,22 0,23 0,06 0,24 0,00 0,29 0,13 0,00 0,11 0,15 0,22 0,19 0,12 0,17 0,00
5. Service and sales workers
Personal Services Workers 0,06 0,15 0,06 0,13 0,15 0,10 0,08 0,26 0,10 0,12 0,09 0,17 0,14 0,13 0,09 0,21 0,14 0,17 0,24 0,14 0,13 0,09 0,12 0,14 0,09 0,12 0,10
Sales Workers 0,04 0,16 0,03 0,00 0,11 0,09 0,00 0,18 0,00 0,09 0,07 0,09 0,14 0,06 0,24 0,10 0,13 0,13 0,15 0,10 0,07 0,14 0,11 0,00 0,11 0,11
Personal Care Workers 0,04 0,26 0,16 0,11 0,23 0,16 0,09 0,15 0,05 0,16 0,11 0,36 0,15 0,17 0,13 0,14 0,06 0,21 0,06 0,14 0,21 0,07 0,07 -0,03 0,17 0,07 0,21
Protective Services Workers -0,21 0,04 0,14 0,00 0,12 0,21 0,19 0,00 0,20 0,25 0,22 0,00 0,30 0,00 0,41 0,15 0,16 0,14 0,17 0,23 -0,09 0,00 -0,06 0,16 0,20 0,18
6. Skilled agricultural, forestry and fishery workers
Market-oriented Skilled Agricultural Workers 0,87 0,00 0,20 0,22 0,05 0,32 0,10 0,04 0,00 0,00 0,00 0,28 0,00 0,00 0,11 0,00 0,00 0,11 0,00 0,00 0,00 -0,06 0,00 0,00 0,06
Market-oriented Skilled Forestry, Fishery and Hunting Workers -0,16 0,00 0,15 0,10 0,00 0,00 0,00 0,58 0,00 0,00 0,00 0,00 0,00 0,00 0,70 0,00 0,00 0,00 0,33 -0,07 0,00 0,00 0,00
Subsistence Farmers, Fishers, Hunters and Gatherers 0,00
7. Craft and related trades workers
Building and Related Trades Workers (excluding Electricians) 0,26 0,24 0,11 0,22 0,17 0,21 0,17 0,38 0,10 0,20 0,00 0,00 0,09 0,23 0,09 0,26 0,20 0,19 0,27 0,15 0,21 0,12 0,12 0,21 0,06 0,19 0,17
Metal, Machinery and Related Trades Workers 0,28 0,26 0,11 0,23 0,26 0,21 0,17 0,49 0,19 0,16 0,08 0,22 0,31 0,16 0,24 0,28 0,21 0,38 0,18 0,16 0,23 0,26 0,28 0,11 0,27 0,13
Handicraft and Printing Workers 0,00 0,30 0,17 0,27 0,17 0,16 0,16 0,33 0,08 0,12 0,06 0,14 0,00 0,32 0,15 0,23 0,22 0,00 0,32 0,13 0,12 0,18 0,17 0,24 0,17 0,17 0,14
Electrical and Electronic Trades Workers 0,26 0,30 0,15 0,17 0,31 0,22 0,19 0,38 0,15 0,21 0,12 0,24 0,16 0,44 0,18 0,24 0,27 0,21 0,37 0,17 0,15 0,25 0,28 0,26 0,18 0,25 0,21
Food Processing, Woodworking, Garment and Other Craft and Related Trades Workers 0,05 0,11 0,00 0,00 0,09 0,08 0,11 0,28 0,00 0,12 0,03 0,00 0,08 0,15 0,00 0,10 0,14 0,11 0,16 0,12 0,11 0,00 0,00 0,12 0,00 0,06 0,07
Appendix: Sector and occupation
26 Wage determinants in the European Union
Source: Eurostat, Structure or Earnings Survey 2014
BG AT BE CY CZ DE DK EE ES FI FR HR HU IE EL IT LT LU LV MT NL PL PT RO SI SK SE
8. Plant and machine operators and assemblers
Stationary Plant and Machine Operators 0,11 0,19 0,11 0,16 0,20 0,11 0,13 0,33 0,10 0,20 0,00 0,17 0,10 0,28 0,12 0,20 0,28 0,15 0,23 0,18 0,17 0,18 0,08 0,20 0,10 0,23 0,17
Assemblers 0,14 0,23 0,17 0,19 0,16 0,04 0,27 0,14 0,12 0,05 0,00 0,00 0,15 0,00 0,12 0,13 0,10 0,33 0,14 0,07 0,14 0,20 0,20 0,00 0,12 0,09
Drivers and Mobile Plant Operators 0,16 0,13 0,08 0,15 0,16 0,06 0,03 0,34 0,10 0,18 0,03 0,10 0,13 0,15 0,17 0,21 0,21 0,00 0,30 0,09 0,06 0,12 0,00 0,18 0,09 0,16 0,10
9. Elementary occupations
Cleaners and Helpers 0,00 0,00 0,00 0,00 0,00 0,00 0,00 0,00 0,00 0,00 0,00 0,00 0,00 0,00 0,00 0,00 0,00 0,00 0,00 0,00 0,00 0,00 0,00 0,00 0,00 0,00 0,00
Agricultural, Forestry and Fishery Labourers -0,11 0,08 0,00 0,00 0,09 0,00 0,00 0,00 -0,03 0,00 0,00 -0,10 0,00 -0,10 0,00 0,00 -0,17 0,00 -0,05 0,00 0,00 -0,06 0,00 0,00 0,00
Labourers in Mining, Construction, Manufacturing and Transport -0,06 0,10 0,00 0,00 0,09 0,00 0,07 0,24 0,00 0,07 -0,03 0,00 0,16 0,00 0,15 0,08 0,08 0,17 0,00 0,00 0,06 0,10 0,04 0,00 0,10 0,08
Food Preparation Assistants 0,00 0,03 0,04 0,00 0,00 0,00 -0,02 0,00 0,00 0,00 0,00 0,12 0,14 0,00 0,17 0,00 0,00 0,00 0,00 0,07 0,06 0,00 0,07 0,00 0,00 0,05
Street and Related Sales and Services Workers -0,13 0,00 0,00 -0,09 -0,11 0,00 -0,09 0,00 0,25 0,00 -0,12 -0,17 0,20 0,00 0,00 0,00
Refuse Workers and Other Elementary Workers 0,00 0,07 0,00 0,00 0,00 0,02 0,00 0,00 0,00 0,00 -0,11 0,00 -0,04 0,14 0,00 0,11 0,00 0,00 0,00 0,00 0,03 0,00 0,09 0,00 0,00 0,03 0,00

Getting in touch with the EU In person All over the European Union there are hundreds of Europe Direct information centres. You can find the address of the centre nearest you at: https://europa.eu/european-union/contact_en On the phone or by e-mail Europe Direct is a service that answers your questions about the European Union. You can contact this service: – by freephone: 00 800 6 7 8 9 10 11 (certain operators may charge for these calls), – at the following standard number: +32 22999696 or – by email via: https://europa.eu/european-union/contact_en Finding information about the EU Online Information about the European Union in all the official languages of the EU is available on the Europa website at: https://europa.eu/european-union/index_en EU publications You can download or order free and priced EU publications at: https://op.europa.eu/en/publications. Multiple copies of free publications may be obtained by contacting Europe Direct or your local information centre (see https://europa.eu/european-union/contact_en). EU law and related documents For access to legal information from the EU, including all EU law since 1952 in all the official language versions, go to EUR-Lex at: http://eur-lex.europa.eu Open data from the EU The EU Open Data Portal (http://data.europa.eu/euodp/en) provides access to datasets from the EU. Data can be downloaded and reused for free, for both commercial and non-commercial purposes. The EU Open Data Portal (http://data.europa.eu/euodp/en/data) provides access to datasets from the EU. Data can be downloaded and reused for free, both for commercial and non-commercial purposes.

Reconciliation of EU-SILC data and national accounts
2019 edition
Wages determinants in the European UnionEVIDENCE FROM STRUCTURE OF EARNINGS SURVEY (SES 2014) DATA
This publication analyses the impact of the different characteristics of the employee (age, occupation, etc.) and of its employer (industry, size) on wages, throughout the European Union. The study is based on regression techniques applied on microdata taken from the Structure of Earnings Survey 2014, which gathers harmonized information from 240 000 enterprises and 11 million employees working across the 27 Member States. Regression coefficients provide information on how the different labour markets reward the different characteristics of the job tenant and how the different types of businesses compete in terms of wages offered to their employees. By crossing job characteristics with sex, this analysis also sheds light on possible gaps between the financial returns on education, part-time work etc. offered to men versus women.
For more informationhttps://ec.europa.eu/eurostat/
PDF: KS-FT-20-003-EN
-N
PDF: ISBN 978-92-76-17435-6