wages, deflation and the role of minimum wages in the world
TRANSCRIPT
Wages, Deflation and the Role of Minimum Wages in the World Economy in the 2010s
Hansjörg Herr and Milka Kazandziska
September 2011
In the first part of this paper we give an overview about the economic constellation of
developed countries in the 2010s. We restrict ourselves to developed countries as these seem
to be the centre of economic problems we are confronted with. What follows is a debate about
the role of wages and especially minimum wages for macroeconomic development. Then we
look at the empirical development of wages and minimum wages in selected countries.
Finally we draw conclusions for wage policy and minimum wage development.
1. The Economic constellation in the 2010s
In 2007 the subprime crisis hit the world economy. It started as a financial crisis in the United
States which infected the world financial system. Then it led to a deep economic recession
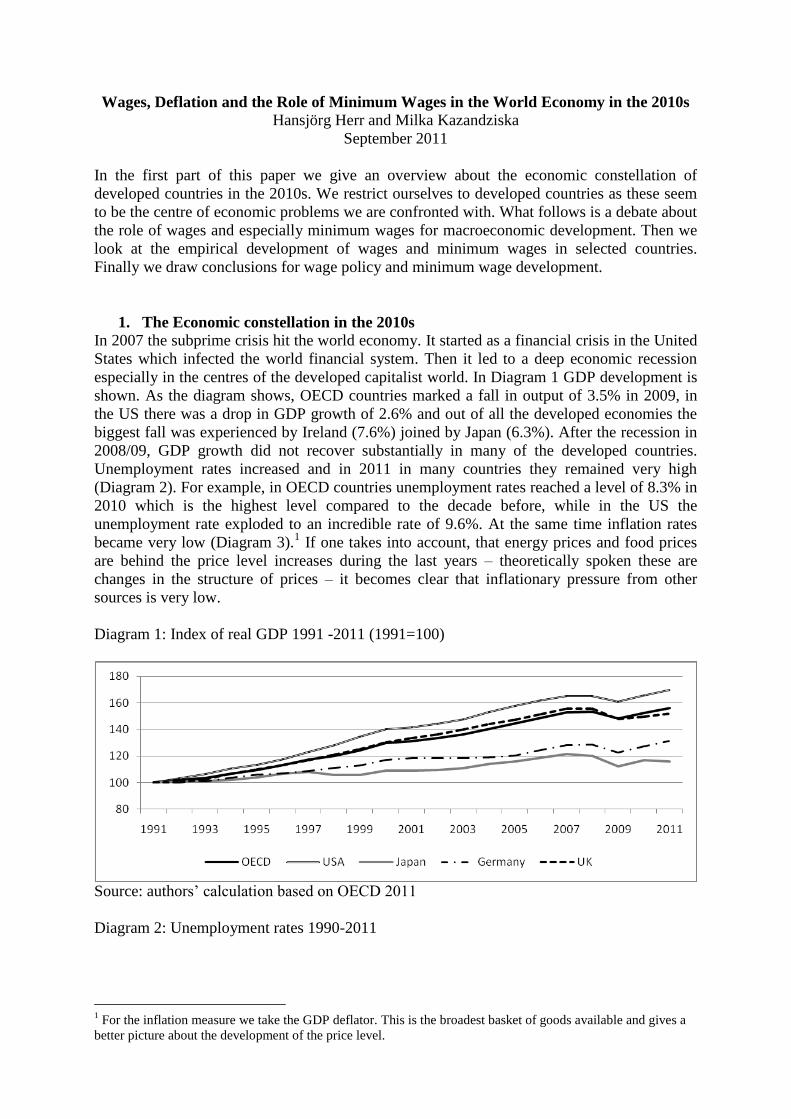
especially in the centres of the developed capitalist world. In Diagram 1 GDP development is
shown. As the diagram shows, OECD countries marked a fall in output of 3.5% in 2009, in
the US there was a drop in GDP growth of 2.6% and out of all the developed economies the
biggest fall was experienced by Ireland (7.6%) joined by Japan (6.3%). After the recession in
2008/09, GDP growth did not recover substantially in many of the developed countries.
Unemployment rates increased and in 2011 in many countries they remained very high
(Diagram 2). For example, in OECD countries unemployment rates reached a level of 8.3% in
2010 which is the highest level compared to the decade before, while in the US the
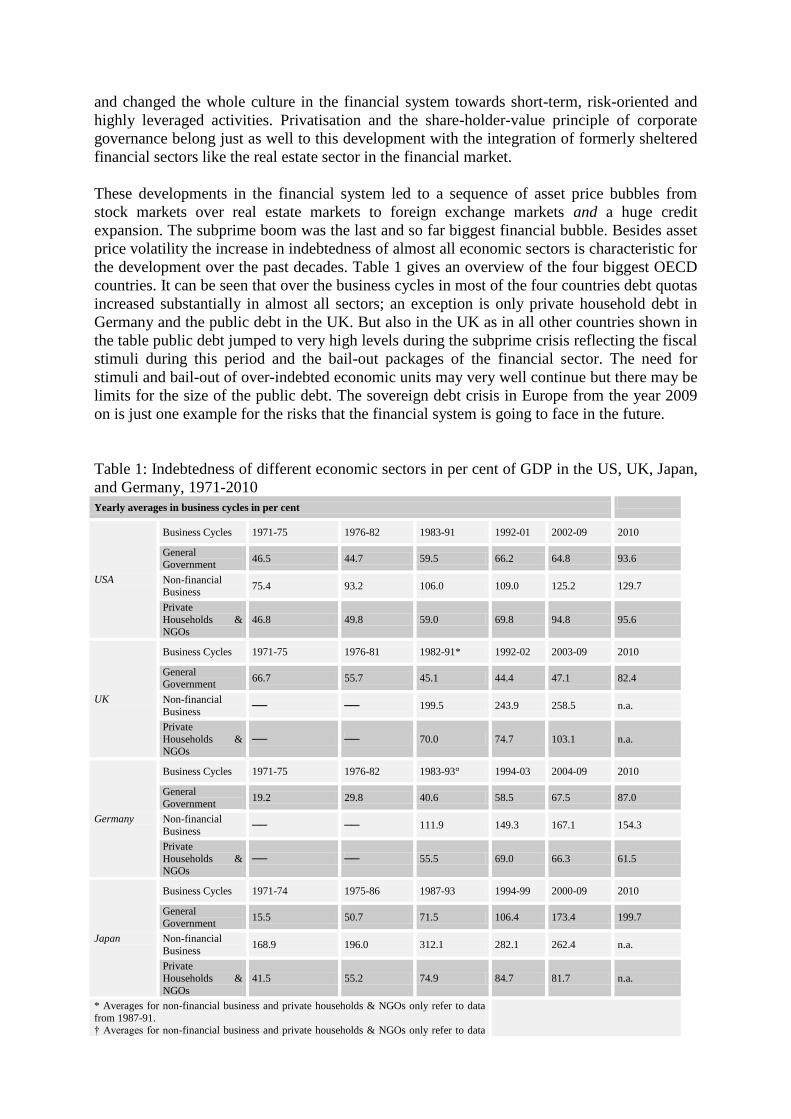
unemployment rate exploded to an incredible rate of 9.6%. At the same time inflation rates
became very low (Diagram 3).1 If one takes into account, that energy prices and food prices
are behind the price level increases during the last years – theoretically spoken these are
changes in the structure of prices – it becomes clear that inflationary pressure from other
sources is very low.
Diagram 1: Index of real GDP 1991 -2011 (1991=100)
Source: authors‟ calculation based on OECD 2011
Diagram 2: Unemployment rates 1990-2011
1 For the inflation measure we take the GDP deflator. This is the broadest basket of goods available and gives a
better picture about the development of the price level.
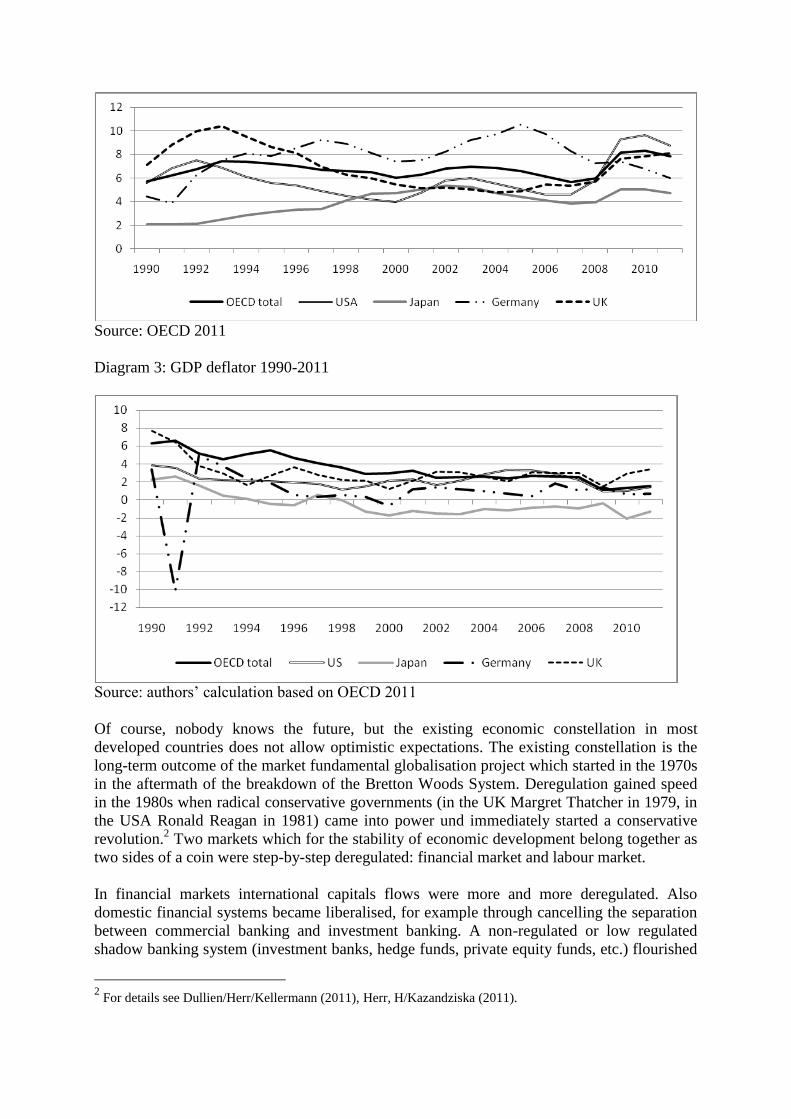
Source: OECD 2011
Diagram 3: GDP deflator 1990-2011
Source: authors‟ calculation based on OECD 2011
Of course, nobody knows the future, but the existing economic constellation in most
developed countries does not allow optimistic expectations. The existing constellation is the
long-term outcome of the market fundamental globalisation project which started in the 1970s
in the aftermath of the breakdown of the Bretton Woods System. Deregulation gained speed
in the 1980s when radical conservative governments (in the UK Margret Thatcher in 1979, in
the USA Ronald Reagan in 1981) came into power und immediately started a conservative
revolution.2 Two markets which for the stability of economic development belong together as
two sides of a coin were step-by-step deregulated: financial market and labour market.
In financial markets international capitals flows were more and more deregulated. Also
domestic financial systems became liberalised, for example through cancelling the separation
between commercial banking and investment banking. A non-regulated or low regulated
shadow banking system (investment banks, hedge funds, private equity funds, etc.) flourished
2 For details see Dullien/Herr/Kellermann (2011), Herr, H/Kazandziska (2011).
and changed the whole culture in the financial system towards short-term, risk-oriented and
highly leveraged activities. Privatisation and the share-holder-value principle of corporate
governance belong just as well to this development with the integration of formerly sheltered
financial sectors like the real estate sector in the financial market.
These developments in the financial system led to a sequence of asset price bubbles from
stock markets over real estate markets to foreign exchange markets and a huge credit
expansion. The subprime boom was the last and so far biggest financial bubble. Besides asset
price volatility the increase in indebtedness of almost all economic sectors is characteristic for
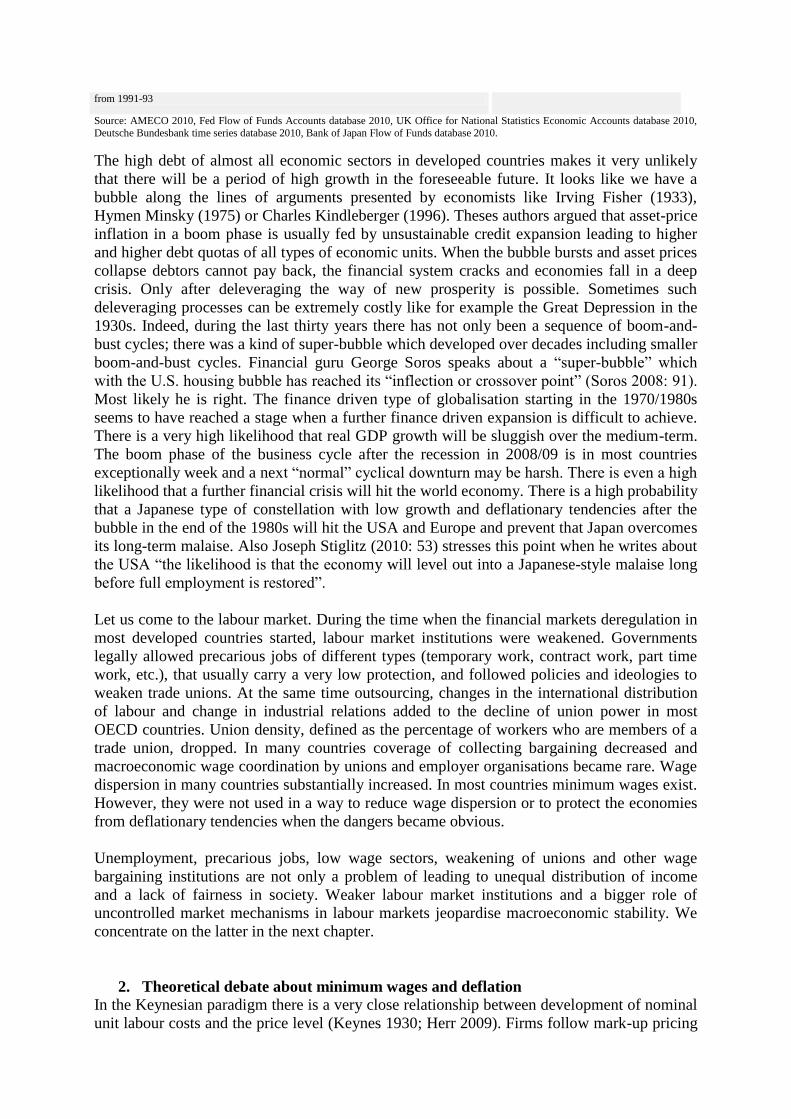
the development over the past decades. Table 1 gives an overview of the four biggest OECD
countries. It can be seen that over the business cycles in most of the four countries debt quotas
increased substantially in almost all sectors; an exception is only private household debt in
Germany and the public debt in the UK. But also in the UK as in all other countries shown in
the table public debt jumped to very high levels during the subprime crisis reflecting the fiscal
stimuli during this period and the bail-out packages of the financial sector. The need for
stimuli and bail-out of over-indebted economic units may very well continue but there may be
limits for the size of the public debt. The sovereign debt crisis in Europe from the year 2009
on is just one example for the risks that the financial system is going to face in the future.
Table 1: Indebtedness of different economic sectors in per cent of GDP in the US, UK, Japan,
and Germany, 1971-2010
Yearly averages in business cycles in per cent
USA
Business Cycles 1971-75 1976-82 1983-91 1992-01 2002-09 2010
General Government
46.5 44.7 59.5 66.2 64.8 93.6
Non-financial Business
75.4 93.2 106.0 109.0 125.2 129.7
Private
Households &
NGOs
46.8 49.8 59.0 69.8 94.8 95.6
UK
Business Cycles 1971-75 1976-81 1982-91* 1992-02 2003-09 2010
General Government
66.7 55.7 45.1 44.4 47.1 82.4
Non-financial
Business ── ── 199.5 243.9 258.5 n.a.
Private
Households & NGOs
── ── 70.0 74.7 103.1 n.a.
Germany
Business Cycles 1971-75 1976-82 1983-93° 1994-03 2004-09 2010
General
Government 19.2 29.8 40.6 58.5 67.5 87.0
Non-financial
Business ── ── 111.9 149.3 167.1 154.3
Private
Households & NGOs
── ── 55.5 69.0 66.3 61.5
Japan
Business Cycles 1971-74 1975-86 1987-93 1994-99 2000-09 2010
General
Government 15.5 50.7 71.5 106.4 173.4 199.7
Non-financial
Business 168.9 196.0 312.1 282.1 262.4 n.a.
Private
Households &
NGOs
41.5 55.2 74.9 84.7 81.7 n.a.
* Averages for non-financial business and private households & NGOs only refer to data
from 1987-91. † Averages for non-financial business and private households & NGOs only refer to data
from 1991-93
Source: AMECO 2010, Fed Flow of Funds Accounts database 2010, UK Office for National Statistics Economic Accounts database 2010,
Deutsche Bundesbank time series database 2010, Bank of Japan Flow of Funds database 2010.
The high debt of almost all economic sectors in developed countries makes it very unlikely
that there will be a period of high growth in the foreseeable future. It looks like we have a
bubble along the lines of arguments presented by economists like Irving Fisher (1933),
Hymen Minsky (1975) or Charles Kindleberger (1996). Theses authors argued that asset-price
inflation in a boom phase is usually fed by unsustainable credit expansion leading to higher
and higher debt quotas of all types of economic units. When the bubble bursts and asset prices
collapse debtors cannot pay back, the financial system cracks and economies fall in a deep
crisis. Only after deleveraging the way of new prosperity is possible. Sometimes such
deleveraging processes can be extremely costly like for example the Great Depression in the
1930s. Indeed, during the last thirty years there has not only been a sequence of boom-and-
bust cycles; there was a kind of super-bubble which developed over decades including smaller
boom-and-bust cycles. Financial guru George Soros speaks about a “super-bubble” which
with the U.S. housing bubble has reached its “inflection or crossover point” (Soros 2008: 91).
Most likely he is right. The finance driven type of globalisation starting in the 1970/1980s
seems to have reached a stage when a further finance driven expansion is difficult to achieve.
There is a very high likelihood that real GDP growth will be sluggish over the medium-term.
The boom phase of the business cycle after the recession in 2008/09 is in most countries
exceptionally week and a next “normal” cyclical downturn may be harsh. There is even a high
likelihood that a further financial crisis will hit the world economy. There is a high probability
that a Japanese type of constellation with low growth and deflationary tendencies after the
bubble in the end of the 1980s will hit the USA and Europe and prevent that Japan overcomes
its long-term malaise. Also Joseph Stiglitz (2010: 53) stresses this point when he writes about
the USA “the likelihood is that the economy will level out into a Japanese-style malaise long
before full employment is restored”.
Let us come to the labour market. During the time when the financial markets deregulation in
most developed countries started, labour market institutions were weakened. Governments
legally allowed precarious jobs of different types (temporary work, contract work, part time
work, etc.), that usually carry a very low protection, and followed policies and ideologies to
weaken trade unions. At the same time outsourcing, changes in the international distribution
of labour and change in industrial relations added to the decline of union power in most
OECD countries. Union density, defined as the percentage of workers who are members of a
trade union, dropped. In many countries coverage of collecting bargaining decreased and
macroeconomic wage coordination by unions and employer organisations became rare. Wage
dispersion in many countries substantially increased. In most countries minimum wages exist.
However, they were not used in a way to reduce wage dispersion or to protect the economies
from deflationary tendencies when the dangers became obvious.
Unemployment, precarious jobs, low wage sectors, weakening of unions and other wage
bargaining institutions are not only a problem of leading to unequal distribution of income
and a lack of fairness in society. Weaker labour market institutions and a bigger role of
uncontrolled market mechanisms in labour markets jeopardise macroeconomic stability. We
concentrate on the latter in the next chapter.
2. Theoretical debate about minimum wages and deflation
In the Keynesian paradigm there is a very close relationship between development of nominal
unit labour costs and the price level (Keynes 1930; Herr 2009). Firms follow mark-up pricing

and role-over costs. When oil prices increase firms will increase prices; when value-added tax
increases, prices increase; when the currency depreciates and imports become more costly,
prices rise, and when wage costs increase, prices will also increase. Wages for firms are
obviously costs which are rolled over to the consumer as all costs are. In fact, nominal unit
labour costs are the most important cost factor because prices of intermediate and capital
goods used by a company also depend on wage costs and in the end all costs in a closed
economy can be traced back to wage costs. Of course there are other factors influencing the
price level – all the cost factors mentioned above and also disequilibria between demand and
supply – , but one has to search a long time to find a similar close relationship to the one that
exists between unit-labour cost development and price-level development (see below). The
close relationship between nominal unit labour costs and price level changes leads to the
conclusion that unions and employers can only negotiate nominal wages and not real wages.
“There may exist no expedient by which labour as a whole can reduce its real wages to a
given figure by making revised money bargains with entrepreneurs.” (Keynes 1936: 13)
Unions simply have no control over real wages as nominal wage changes lead to price level
changes modified by productivity developments.
Unit labour costs depend on changes in nominal wages and changes in labour productivity.
Labour productivity is measured as output per hour. It reflects changes in the technological
knowledge (inventions and innovations), the intensity of work and natural conditions which
influence productivity (for example higher costs to produce scarce resources). The relation
between unit labour costs and the price level is realised in the medium-term. Firms relatively
quickly increase prices when costs go up, but decreasing costs only slowly lead to falling
prices as the competition mechanism between firms in the goods market takes time. In the
short-term also demand-supply-relationships play a role. Last but not least, statistically
productivity fluctuates over the business cycle as firms do not want and cannot synchronize
changes in GDP and employment perfectly. Thus the medium-term development of the
variables is important. The percentage medium-term change in unit labour costs ( mu ) depends
on the percentage change in medium-term nominal wages ( mw ) minus the medium-term
percentage change in labour productivity ( m ). The main factor to influence medium-term
changes in the price level ( mP ) are unit labour costs. Thus we get:
mu = mw - m with mu → mP ,
If nominal wage increases are too high and lead to an inflationary development central banks
usually will (and must) start fighting against inflation. It can be discussed at which inflation
rate central banks should start to fight against inflation.3 However, there can be no doubt that
in a capitalist economy, with the distinguished functions of money, a central bank has to
defend the stability of its money; otherwise the financial systems will erode. This means that
central banks will sooner or later increase interest rate to reduce aggregate goods market
demand and output. Unemployment increase and weakens unions to such an extent that
nominal wage increases will be reduced.
If nominal wages decrease and productivity does not decrease unit labour costs and the price
level will fall and the economy ends up with (goods market) deflation. Deflation in a
constellation of high debt is a disaster. Who knows better than the father of the debt-deflation
theory of Great Depression Irving Fisher: “In the short, the big bad actors are debt
3 For a more detailed discussion on the role of the central bank in fighting inflation see Herr/Kazandziska (2011).

disturbances and price-level disturbances. …. these two economic maladies, the debt disease
and the price-level disease …. are, in great booms and depressions, more important causes
than all others put together.” (Fisher 1933: 341) Deflation increases the real debt burden of
businesses, households and governments and leads to major distortions in the financial
system. The catastrophe here is that all debtors in domestic currency suffer from deflationary
consequences. Even if the central bank reduces its refinancing rate to zero a 25 per cent
deflation rate, for example, increases the real debt burden by 25 percent and causes serious
cash flow problems for all debtors. In addition, a deflationary process will reduce investment
demand and consumption demand and output further as firms and households will postpone
expenditures for the future. There is no incentive for financial institutions and private wealth
owners to give credit to (risky) debtors as long as they can realise an increase in the real value
of their liquidity holdings without taking any risk. In short: a substantial deflationary process
in a situation of high debt destabilises the economic boat. “The more the economic boat tips,
the more it tends to tip. It is not tending to right itself, but is capsizing.” (Fisher 1933: 344) It
is worthwhile noting that central banks lose their power to stabilize the economy during a
deflation.
In Table 1 it was shown that in the present economic constellation the debt disease is high and
intensifying. The price-level disease cannot be excluded to become the second bad actor
which brings the economic boat to capsize. Under the permanent attack of conservative
economists and politicians and the bad economic development labour market institutions
including unions became terribly weak in so many countries that a next great depression
becomes a real threat. If economic development remains weak and unemployment high a next
downturn and even more a next financial crisis may lead to such a pressure in the labour
market that nominal wages decrease and the economy falls into a deflation.
If too high wage increases lead to a too high inflation and restrictive monetary policy and
decreasing nominal wages to disastrous deflation, how should nominal wages increase to
establish a nominal wage anchor which is an important stabilising element of a capitalist
economy? The wage norm, the functional increase in nominal wages, should look as follows
(for details see Herr/Kazandziska 2011):
w norm = medium-term and total economy + P target of central bank
The target inflation rate of the central bank is the medium-term inflation rate central banks
officially announce or implicitly prefer. Usually, in developed countries this rate is between
two or three per cent. The nominal wage rate per hour should increase according to medium-
term or trend productivity changes plus the target inflation rate of the central bank.4 If the
trend of productivity for the whole economy is not available, productivity development of the
industrial sectors is a good substitute.
In the ideal case the wage norm described above should be a guideline for wage increases in
all sectors of the economy. Using sectoral productivity in a certain industry as a guideline for
sectoral wage development in the industry under discussion would mean that in some
industries (for example the car industry) nominal wages (and real wages) would increase
permanently and in other sectors (for example the elderly care sector) nominal (real wages)
4 It was above already mentioned that statistically measured productivity is influenced by the business cycle.
Measured productivity decreases during recession as firms cannot or do not want to fire employees in line with
falling demand and production. In the first phase of a boom measured productivity jumps to a certain extent as
firms can increase output without additional labour input. It would destroy the whole idea of a nominal wage
anchor when during a recession the statistically decreasing productivity would lead to lower wage increases or
even falling wages. Thus trend productivity is important for the wage norm.
would increase at a lower rate or stagnate completely. Even worse is firm-level productivity
as a guideline for firm-level wage development. Such a wage guideline would reduce the
innovative power of an economy. Poorly performing companies would be subsidised by low
wages whereas companies with more than average profits would be punished by high wages.
Wages for a certain qualification should be the same in the whole industry and even in the
whole economy. The law of one price for wages is the best carrot to force companies to
increase productivity. And ultimately, higher national productivity is the only way to increase
average real wages in the medium and long run.5
Under the present economic constellation and the latent danger of a deflationary development
statutory minimum wages become extremely important. In many countries unions in the
foreseeable future may not have the power to prevent nominal wages cuts and guarantee a
wage development according to the wage norm. Unions may be too weak to increase wages
sufficiently, some industries may not be covered by unions, not all firms in one industry may
belong to employer organisations, there may be only firm based negotiations, not all
employees in a firm are paid negotiated wages, etc. In many countries statutory minimum
wages are needed as unions cannot fulfil the function to prevent nominal wage cuts in the
whole economy. Already today in many countries minimum wages play an important role for
wage coordination. “In the Czech Republic, France, Lithuania, Portugal and Slovenia, the
state imposed national minimum wage is the dominant form of wage coordination.
Furthermore, the rate of increase in the minimum wage is often used as a reference for
sectoral or even firm level bargaining in France, Greece, Ireland and Spain.” (Du Caju et al
2008: 18) We do not argue that minimum wages are the only instrument to help to defend the
wage norm. A strong union movement and high union density undoubtedly would be the best
solution. In Scandinavian countries with high union density in almost all industries no
statutory minimum wage may be needed. A general extension mechanism of collective
bargaining (as for example in France) or compulsory memberships of all firms in employer
organisations (as in Austria) are also instruments to prevent wage cuts. Statutory minimum
wages should also not substitute wage bargaining. Unions can and should bargain wages on
top of minimum wages and especially decide upon the general wage structure.
The existence of statutory minimum wages is not sufficient to guarantee positive effects.
According to the analysis of the wage norm, minimum wage policy should be in line with the
following principles (cp. Herr/ Kazandziska/Mahnkopf-Praprotnik 2009, Herr/Kazandziska
2011a):
- Minimum wages should increase at least according to trend productivity growth plus the
target inflation rate of the central bank. This means minimum wage increases should increase
at least according to the wage norm developed above. Otherwise they cannot help to establish
a nominal wage anchor against deflation efficiently. Given the important role of statutory
minimum wages in wage bargaining and wage coordination in many countries statutory
minimum wage increases according to the wage norm can have a very important stabilising
effect.
-Minimum wages must affect a sufficient number of employees – they must be “in touch”
with the existing wage structure in a country. If minimum wages are at such a low level that
almost all employees are not affected by minimum wages statutory minimum wages exist
only on paper and minimum wage increases are ineffective.
5 The law of one price for wages does not necessarily apply for regions in a currency area. If regional
productivity levels are very different in regions minimum wages should become regionally adjusted. Thus, a
compromise has to be found between equal living conditions in one currency area which demand more or less
equal wages and regional development needs.
-Minimum wages should be adjusted frequently. In countries with a low inflation rate the
adjustment should be done annually.
- Minimum wages should increase at least in line with average or median wages because this
is the only possibility to prevent the development of a low-wage sector. This means that
minimum wages should increase faster than the wage norm in case the general wage level
increases faster than the wage norm. The argument is that in such a situation it is needed that
generally increasing wages are reduced to the level of the wage norm. Minimum wages in
such an inflationary situation should not be misused to fight against inflation. However, in the
foreseeable future inflationary wage developments seem not to be the problem but too low
wage increases or even wage cuts.
Minimum wages have in some countries a somewhat multifaceted function. Initially they
were thought to be an instrument to prevent a market-driven increase of an unacceptable low-
wage sector especially in a situation when unions cannot prevent the expansion of this sector.
In this function statutory minimum wages compress the wage structure from below and
influence wage dispersion and income distribution. However, as was discussed above, in
many countries minimum wages also can signal and coordinate the general wage
development. In an extreme case statutory minimum wages can only influence the wage level
but not the wage structure. This is the case when all wage increases are linked to the
minimum wage, for example when semi-skilled workers earn two thirds of the minimum
wage, skilled workers two times the minimum wage, etc. For the function of statutory
minimum wages to prevent a deflationary development the second group of countries is more
suitable in spite of the fact that in general it is better when unions coordinate the general wage
development and minimum wages only prevent a low-wage sector. But also in countries
which belong to the first group statutory minimum wages can and should be used to prevent
deflation. Yet, in this group we must expect a probably strong compression of the wage
structure from below which makes things potentially more difficult.
Before we look at some countries in more detail we like to shortly mention the debate about
minimum wages and employment. The traditional neoclassical argument is that minimum
wages which are effective lead to unemployment. The neoclassical argument is that the
undistorted market mechanism leads to equilibrium with full employment. However, all
workers have to be paid according to their (marginal) productivity. Unskilled workers have,
so the argument, a low (marginal) productivity and can only earn low wages; otherwise they
are unemployed. Keynes (1936: 14) turned the argument around: „In other words, the struggle
about money-wages primarily affects the distribution of the aggregate real wage between
different labour-groups, and not its average amount per unit of employment, which depends ...
on a different set of forces“. This implies that the wage structure is given by the relative
strength of the different fractions of the working class, by conventions and institutions,
political factors and the like. When the wage structure and the productivities are given a
certain structure of relative prices evolves reflecting these two factors. Employment is
independent of the structure of prices. It depends on effective goods market demand made up
of investment, consumption, government demand and exports minus imports. Under these
premises we can have countries with low wage dispersion and full employment (and relatively
high prices for example for cleaning and restaurant services). Examples for this would be
Scandinavian countries. And we can have countries with high wage dispersion and low
employment (and relatively low prices for cleaning and restaurant services). An example for
this case would be Germany in the last decade, the US or southern European countries.
Between wage and price structure and employment there is - theoretically spoken - no clear
relationship. To sum up: minimum wages do not cost jobs. Actually the opposite can be
expected in case higher minimum wages change income distribution towards low-wage
earners. But minimum wages can become a very important factor to help to prevent a
deflationary development in economic constellation which exists in many developed countries
in the present situation.
3. Empirical research of selected countries
We selected countries in the case study which are affected by deflationary developments or
are in danger to fall into deflation. The questions asked are: a) Why did or do these countries
suffer from deflationary dangers? b) How did minimum wages – if statutory minimum wages
exist at all – develop? Could minimum wages prevent falling nominal wages and deflationary
developments?
3.1 Japan A distinguished feature of Japanese development is the deflationary process which gripped
Japan in the 1990s and has not been overcome since. Japan was first hit by deflation around
the mid-1990s and then again especially after the Asian crises and throughout the first ten
years after 2000. Being exposed to the last financial crisis which spread also to the Asian
economies, for Japan it was made even harder to consolidate the budget deficits and the level
of public debt which reached an incredible level of almost 200% of GDP in 2010 and is
projected to be above 210% of GDP in 2011 (see Table 1 in this paper; OECD 2011). It
should be no surprise that Japan suffered greatly from stagnating employment and increasing
unemployment. Compared with other countries, unemployment rates are relatively low;
however, for the Japanese society rates of around 5 per cent are ominously high. The
structure of employment has also started to change. Since 1985 non-regular employment
(especially part-time) has increased (Ohashi 2011:8). Pressure on workers and unions
increased markedly and led to an erosion of traditionally stable labour market conditions in
Japan.
In Japan, union density was around 25 per cent in the 1990s, decreasing to 18 per cent by
2006 (cp. for these and the following data Du Caju et al 2008: Table 4 and 5). By
international comparison this is not especially low. Union coverage or collective bargaining
coverage shows how many workers are secured by collective agreements. Looking at this
indicator, union coverage in Japan is very low and even dropped from 23 per cent in the
1990s to around 16 per cent in 2006. Amongst industrial countries only the United States,
with approximately 14 per cent, has such a low coverage. This means that in Japan there is no
formal or informal mechanism, which extends collective bargaining agreements to non-union
members in any relevant way. Unions in Japan are first and foremost firm-based unions. In
2008 around 57200 unions existed and organised approximately 10 million workers (Japanese
Government 2009: Table 9). The mainly firm-level unions traditionally organise more or less
only regular workers. The latter often automatically become members of the corresponding
company union. Japan is characterised by a certain amount of wage co-ordination which
vitally depends on employers‟ associations. In spite of some elements of inter- and even intra-
industrial coordination mechanisms, Du Caju et al (2008) sees Japan in the group of countries
with a largely deregulated and only weakly coordinated wage bargaining process, together
with countries like the United States, United Kingdom, Poland or the Czech Republic.
Japan is the most interesting case for the topic of our paper as it went through a deflationary
process which has not come to an end yet. The combination of low wage increases and
especially after 1999/2000 also wage cuts, over-indebtedness of the households and
corporations (and later the government), together with a hesitant monetary and fiscal policy
and a stagnating or only slightly increasing output, has proven to be a constellation which
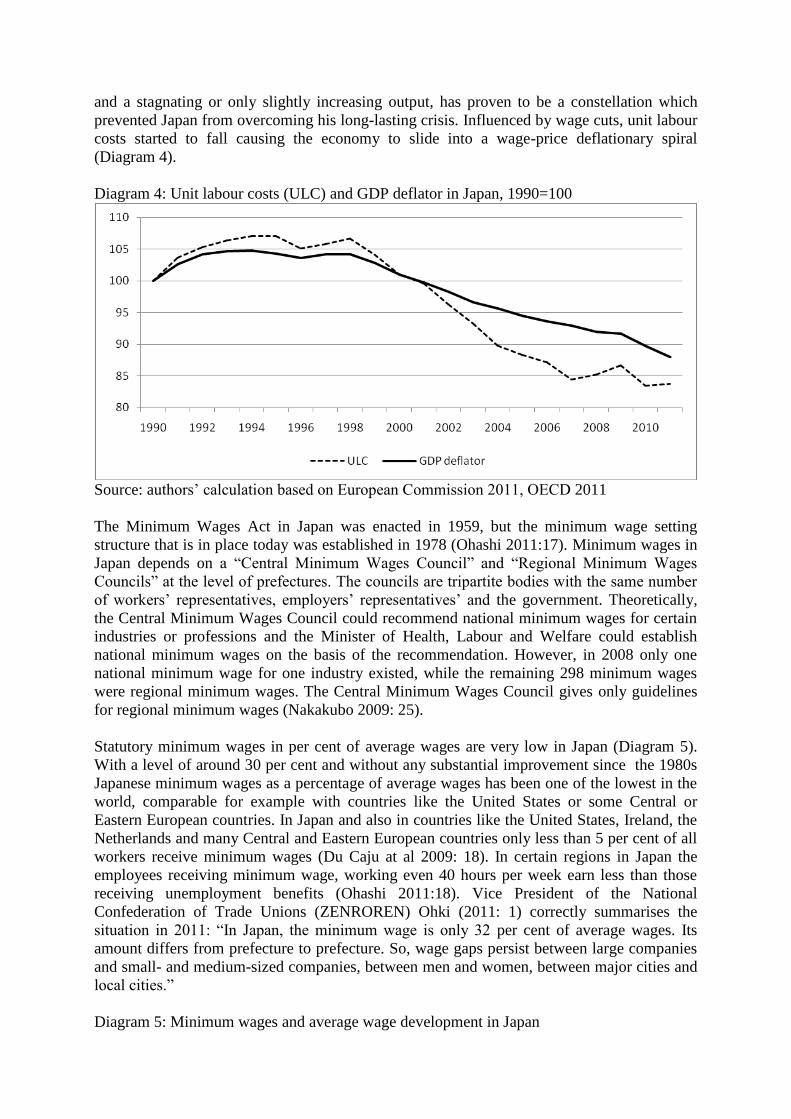
prevented Japan from overcoming his long-lasting crisis. Influenced by wage cuts, unit labour
costs started to fall causing the economy to slide into a wage-price deflationary spiral
(Diagram 4).
Diagram 4: Unit labour costs (ULC) and GDP deflator in Japan, 1990=100
Source: authors‟ calculation based on European Commission 2011, OECD 2011
The Minimum Wages Act in Japan was enacted in 1959, but the minimum wage setting
structure that is in place today was established in 1978 (Ohashi 2011:17). Minimum wages in
Japan depends on a “Central Minimum Wages Council” and “Regional Minimum Wages
Councils” at the level of prefectures. The councils are tripartite bodies with the same number
of workers‟ representatives, employers‟ representatives‟ and the government. Theoretically,
the Central Minimum Wages Council could recommend national minimum wages for certain
industries or professions and the Minister of Health, Labour and Welfare could establish
national minimum wages on the basis of the recommendation. However, in 2008 only one
national minimum wage for one industry existed, while the remaining 298 minimum wages
were regional minimum wages. The Central Minimum Wages Council gives only guidelines
for regional minimum wages (Nakakubo 2009: 25).
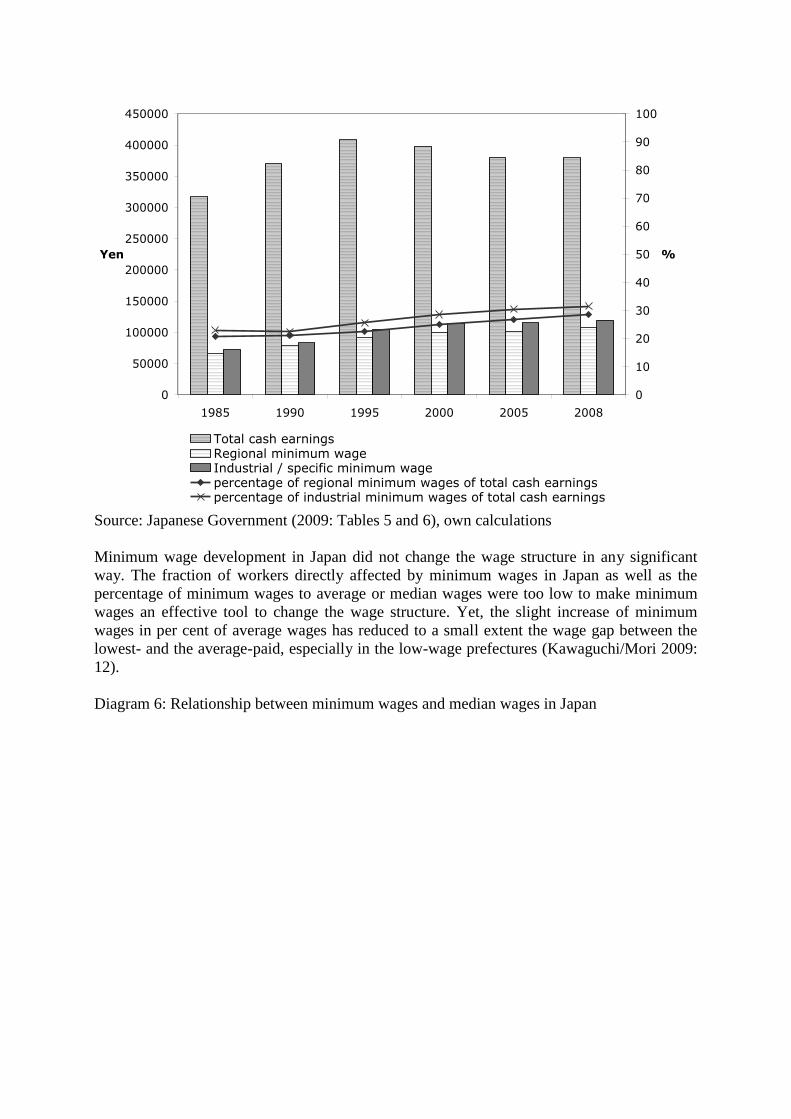
Statutory minimum wages in per cent of average wages are very low in Japan (Diagram 5).
With a level of around 30 per cent and without any substantial improvement since the 1980s
Japanese minimum wages as a percentage of average wages has been one of the lowest in the
world, comparable for example with countries like the United States or some Central or
Eastern European countries. In Japan and also in countries like the United States, Ireland, the
Netherlands and many Central and Eastern European countries only less than 5 per cent of all
workers receive minimum wages (Du Caju at al 2009: 18). In certain regions in Japan the
employees receiving minimum wage, working even 40 hours per week earn less than those
receiving unemployment benefits (Ohashi 2011:18). Vice President of the National
Confederation of Trade Unions (ZENROREN) Ohki (2011: 1) correctly summarises the
situation in 2011: “In Japan, the minimum wage is only 32 per cent of average wages. Its
amount differs from prefecture to prefecture. So, wage gaps persist between large companies
and small- and medium-sized companies, between men and women, between major cities and
local cities.”
Diagram 5: Minimum wages and average wage development in Japan
0
50000
100000
150000
200000
250000
300000
350000
400000
450000
1985 1990 1995 2000 2005 2008
Yen
0
10
20
30
40
50
60
70
80
90
100
%
Total cash earningsRegional minimum wageIndustrial / specific minimum wagepercentage of regional minimum wages of total cash earningspercentage of industrial minimum wages of total cash earnings
Source: Japanese Government (2009: Tables 5 and 6), own calculations
Minimum wage development in Japan did not change the wage structure in any significant
way. The fraction of workers directly affected by minimum wages in Japan as well as the
percentage of minimum wages to average or median wages were too low to make minimum
wages an effective tool to change the wage structure. Yet, the slight increase of minimum
wages in per cent of average wages has reduced to a small extent the wage gap between the
lowest- and the average-paid, especially in the low-wage prefectures (Kawaguchi/Mori 2009:
12).
Diagram 6: Relationship between minimum wages and median wages in Japan
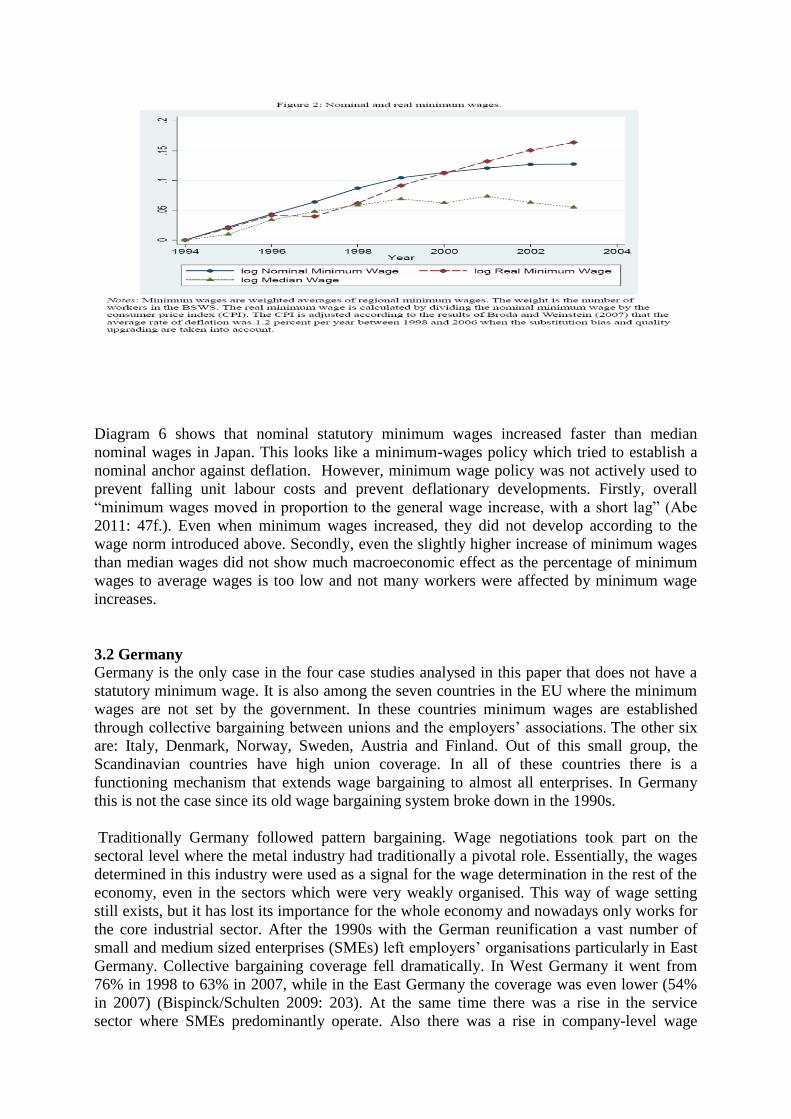
Diagram 6 shows that nominal statutory minimum wages increased faster than median
nominal wages in Japan. This looks like a minimum-wages policy which tried to establish a
nominal anchor against deflation. However, minimum wage policy was not actively used to
prevent falling unit labour costs and prevent deflationary developments. Firstly, overall
“minimum wages moved in proportion to the general wage increase, with a short lag” (Abe
2011: 47f.). Even when minimum wages increased, they did not develop according to the
wage norm introduced above. Secondly, even the slightly higher increase of minimum wages
than median wages did not show much macroeconomic effect as the percentage of minimum
wages to average wages is too low and not many workers were affected by minimum wage
increases.
3.2 Germany Germany is the only case in the four case studies analysed in this paper that does not have a
statutory minimum wage. It is also among the seven countries in the EU where the minimum
wages are not set by the government. In these countries minimum wages are established
through collective bargaining between unions and the employers‟ associations. The other six
are: Italy, Denmark, Norway, Sweden, Austria and Finland. Out of this small group, the
Scandinavian countries have high union coverage. In all of these countries there is a
functioning mechanism that extends wage bargaining to almost all enterprises. In Germany
this is not the case since its old wage bargaining system broke down in the 1990s.
Traditionally Germany followed pattern bargaining. Wage negotiations took part on the
sectoral level where the metal industry had traditionally a pivotal role. Essentially, the wages
determined in this industry were used as a signal for the wage determination in the rest of the
economy, even in the sectors which were very weakly organised. This way of wage setting
still exists, but it has lost its importance for the whole economy and nowadays only works for
the core industrial sector. After the 1990s with the German reunification a vast number of
small and medium sized enterprises (SMEs) left employers‟ organisations particularly in East
Germany. Collective bargaining coverage fell dramatically. In West Germany it went from
76% in 1998 to 63% in 2007, while in the East Germany the coverage was even lower (54%
in 2007) (Bispinck/Schulten 2009: 203). At the same time there was a rise in the service
sector where SMEs predominantly operate. Also there was a rise in company-level wage
bargaining and individual wage-setting in companies. Competition coming from outsourcing
to union free sectors in Germany and/or other countries put pressure on unions to accept wage
restraints and opening clauses even in the sector where the old wage bargaining model
survived. In many cases firms got much room for manoeuvre and de facto violated the signed
collective contracts (Streeck 2009). Union density also shrank, from 33% in 1990 to around
21% in 2006 (Du Caju, et al 2008:40).
Another very important development in the German labour market was the rise in atypical,
precarious employment. So-called mini jobs emerged and increased sharply, mostly in the
hands of female workers. Only between 2003 and 2010, the number of mini jobs increased
from 5.5 million to around 7.4 million. During the same period, the number of workers
employed in part-time jobs increased from 4.3 to 5.4 millions (Federal Employment Agency
2011).
As in most other countries in the world dealing with the effects of a financial crisis in the
recent years, Germany also had to set up bail-out packages for the troubled financial
institutions. The budget went from small surplus in 2008 to a deficit of 3.2% of GDP in 2010.
At the same time the public debt reached a level of 87% of GDP in 2010 (OECD 2011).
During the subprime crisis falling foreign demand had a strong negative impact on production
and employment. However, statistics show that the effects of the financial crisis on the level
of unemployment were not as severe as in Spain, Ireland, Italy or other European countries
and the US. Unemployment increases which posed big problems in many countries in the
world here did not take place. This can be explained by the fact that different forms of
employment were used (like the mini jobs, the 1-Euro jobs, fixed term contracts, part-time
jobs, etc.), and firms used different techniques rather than firing employees, such as reducing
the working hours, cutting overtime, etc. Important was that the government financially
supported firms which did not fire workers (Federal Employment Agency 2011). Last but not
least, Germany gained from sharply increasing exports to countries like China, India, etc.
which overcame the financial crisis quickly.
Analysing the wage development in Germany, it is inevitable to point out the wage
moderation after the end 1990s (see Diagram 7). Essentially we can see that nominal wage
increases were very low and unit labour costs were in many years either stagnating or falling
during when productivity increases remained to be high. Wage moderation was a strategy
pushed forward by the exporting companies trying to cut costs and maintain their
competitiveness. Unions were pushed towards the wall to accept the low wage increases or
even wage cuts to preserve employment in times when the unemployment rate was among the
highest in the EU.6 Also some of the unions were part of the German export model and did
not really fight for higher wages as they feared a loss of export markets. Real wages did not
go much up during the last two decades in Germany (Diagram 7).
Diagram 7: Nominal wages, real wages, unit labour costs and GDP-deflator in Germany
(1990 =100)
6 In 2002 it even reached 11.2% (European Commission 2011).

Source: authors‟ calculation based on European Commission 2011
The dual system of wage negotiations in Germany form the 1990s on spurred an emergence of
uncoordinated wage development across regions, sectors and companies even within the same
sector. For example the average wage for a white-collar worker in the West Germany
amounted to 3285 Euro and in the East Germany it was only 2415 Euro (2002). The situation
is the same for blue-collar workers who received a pay of 2480 Euro in the West and 1833
Euro in the East (Federal Statistical Office 2003:433-442).7 According to Gernandt/Pfeiffer
(2007) after the mid 1990s wage dispersion in Germany increased substantially.8 In West
Germany this change happened primarily in the lower end of the wage structure (coming from
the drastically low increases in the wages of the poorest workers) and in East Germany
primarily in the upper end (from the high salaries paid to highly qualified workers who were
extremely needed in these areas). All in all, the low wage sector exploded in Germany
(Diagram 8).9 To support this, according to Bosch/Kalina/Weinkopf (2009:9) the share of low
wages to total wages went up from 15% in 1995 to 22.2% in 2006, which draws a very
striking picture about the German labour market.
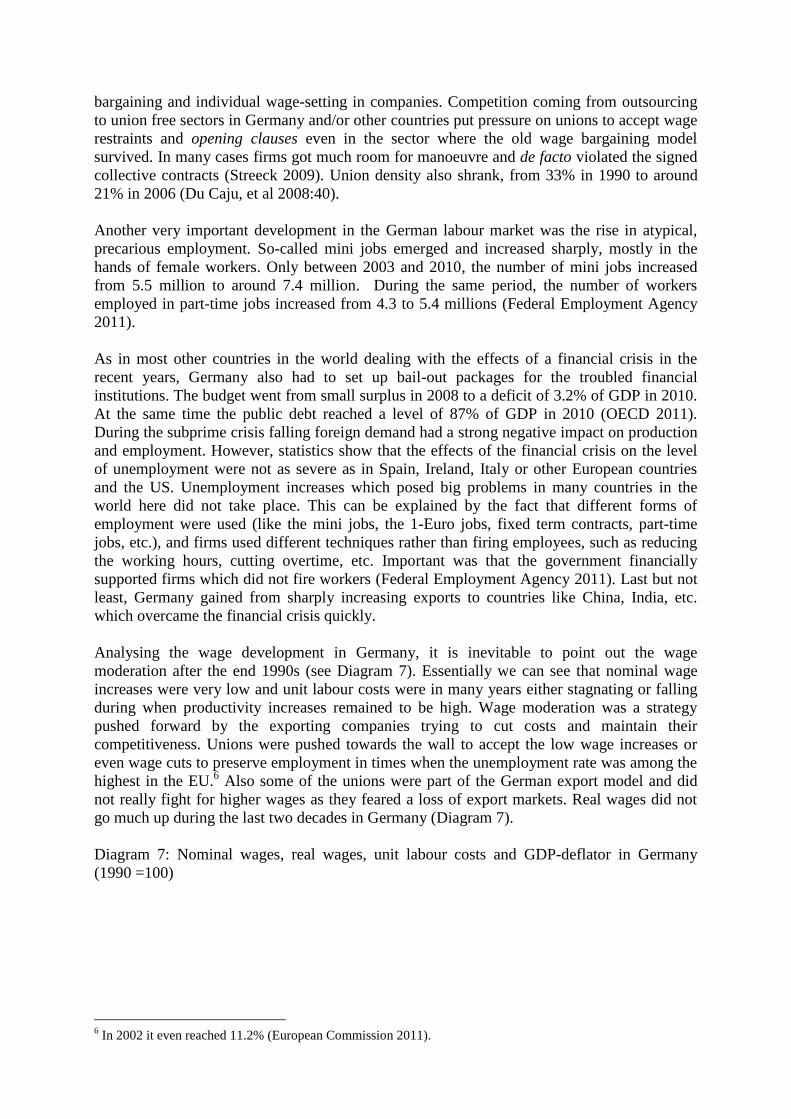
Diagram 8: Low wage sector in Germany (number of employees)
7 Another example is hairdressers (which are among the lowest paid). In 2007 on average they received a wage
of 615 Euro per month in the East and 1312 Euro in the West Germany (WSI 2008). 8 The 90
th and 10
th percentile in the real gross hourly wages are used to describe the top and low income in the
wage structure respectively. 9 Low wages are considered those which are below 2/3 of the median wage (Bosch/Kalina/Weinkopf 2009).
Source: Federal Employment Agency statistics
At the same time functional income distribution changed. The wage share10
fell from 63% of
GDP for the period 1971-1980 to a level of 57% for the last decade (European Commission
2011).
As mentioned at the beginning of the analysis of Germany, statutory minimum wages are not
existent. In certain industries and negotiated between employers‟ associations and unions
there are minimum agreed pay rates included in the collective agreements which can be made
official and binding for the respective sector after the government‟s signature is received.
However, they exist only in a few and rather very small branches (construction occupations,
industrial and commercial cleaning, waste management, security services and long-term care
services). They differ between East and West Germany and sometimes between blue-collar
and white-collar workers. Moreover, they do not play a significant role and do not affect the
wages in the rest of the economy.
To sum up, the German economy and specifically the labour market underwent deep
structural changes which had an immense impact on the wage development, the wage
structure and the income distribution. Without having a statutory minimum wage the low-
wage sector in Germany will further widen and income inequality will further increase. There
is the danger of a race to the bottom in terms of wage dumping within Germany. This leads to
an increase in poverty and social exclusion. And it leads to a further stagnating consumption
demand which makes Germany so dependant on exports. But exports cannot be a solution for
Germany especially in a world where the rest of Europe, the USA and Japan have stagnating
economies. With a falling union coverage and already very low union density and generally
no collective agreement extension mechanisms, Germany seems to be in a similar
constellation with Japan. In a future crisis or medium-term stagnation nominal wage cuts in
Germany cannot be excluded leading to a disastrous development not only in Germany but
also in Europe.
Taking all the above into consideration it is not a sustainable strategy to depend only on
exports for growth when a large economy like Germany is in question, but instead a focus on
promoting domestic demand would have been more successful (the years prior to the German
10
Wage share is calculated as compensation per employee as percentage of GDP.
reunification when the growth was driven not only by exports but also by a strong domestic
demand and investment are a proof for this argument). Having been on the edge of
deflationary development already in the past it is highly recommendable for Germany to
adopt a statutory minimum wage policy which has already been debated for long and pushed
forward by the unions.
3.3 Spain and Ireland
Spain and Ireland are in the same market constellation. We also could have added Greece and
Portugal. All these countries share despite other differences one common point. During the
time of the existence of the European Monetary Union (EMU) nominal unit labour cost
increases were compared with the above discussed wage norm in all of these countries too
high. This is already problematic. However, the major problem is that Germany as the biggest
country in the EMU had very low increases in nominal unit labour costs. Looking at the
period from 1999 when the EMU was created, to 2007 when the subprime crisis hit the world
economy Germany violated the wage norm about to the same extent as Spain etc. did,
however, in different direction. One obvious consequence of this development is that
Germany increased its international price competitiveness considerably whereas the other
countries became less and less competitive. The relatively low GDP growth in Germany
compared to the rest of EMU together with the development of nominal unit labour costs led
to an explosion of German current account surpluses and at the same time to increasing
current account deficit in the other countries in the EMU mentioned above.
In Spain, Ireland, etc. growth was driven by a credit expansion especially stimulating the
consumption and the construction sector. With the subprime crisis this growth model came to
an end similarly to the UK or USA. All of these countries suffer form asset price deflation
with its negative effects described by Fisher (1933) or Minsky (1975). The first “malady”- the
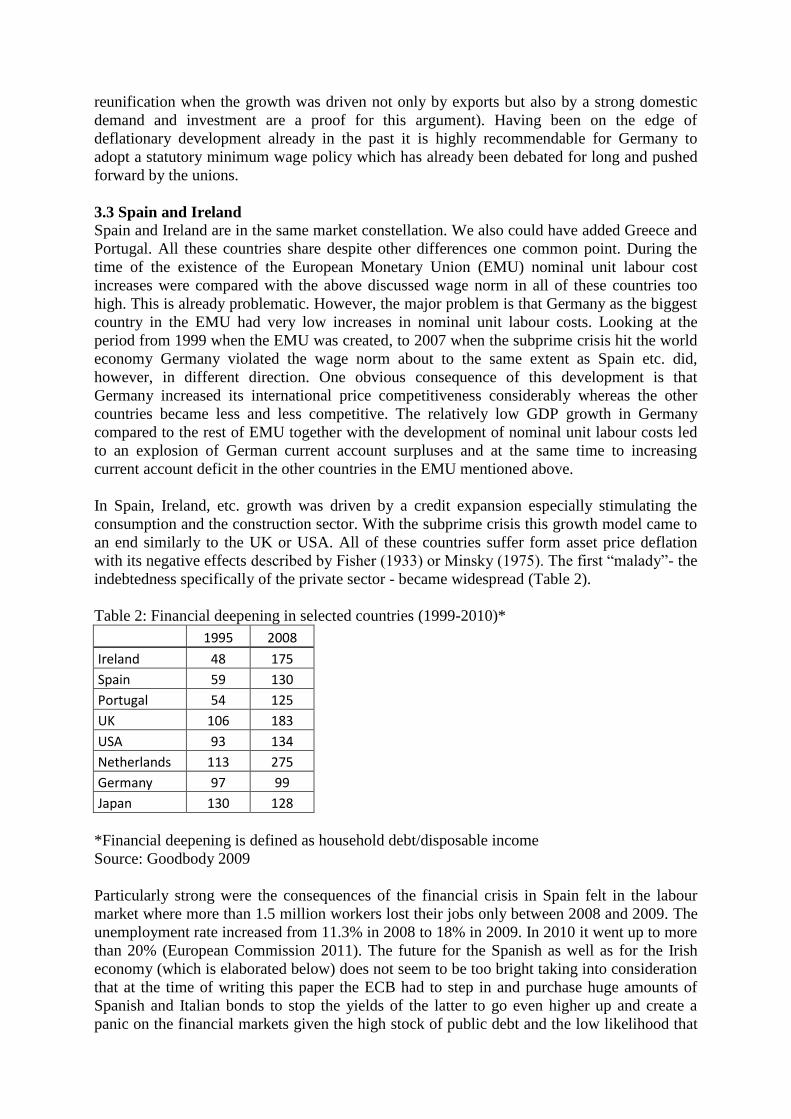
indebtedness specifically of the private sector - became widespread (Table 2).
Table 2: Financial deepening in selected countries (1999-2010)*
1995 2008
Ireland 48 175
Spain 59 130
Portugal 54 125
UK 106 183
USA 93 134
Netherlands 113 275
Germany 97 99
Japan 130 128
*Financial deepening is defined as household debt/disposable income
Source: Goodbody 2009
Particularly strong were the consequences of the financial crisis in Spain felt in the labour
market where more than 1.5 million workers lost their jobs only between 2008 and 2009. The
unemployment rate increased from 11.3% in 2008 to 18% in 2009. In 2010 it went up to more
than 20% (European Commission 2011). The future for the Spanish as well as for the Irish
economy (which is elaborated below) does not seem to be too bright taking into consideration
that at the time of writing this paper the ECB had to step in and purchase huge amounts of
Spanish and Italian bonds to stop the yields of the latter to go even higher up and create a
panic on the financial markets given the high stock of public debt and the low likelihood that
budget deficits can be reduced without substantially harming economic growth in both
countries.11
With a budget deficit soaring to 11% of GDP in 2009 the Spanish economy has
been in a very fragile position.12
In 2011 the projections are that the budget deficit is reduced
to 6.3% of GDP, but the chances are slim to realise the target as the economy has not really
recovered yet and the unemployment rate is the highest in the EU (OECD 2011). The public
debt/GDP ratio went up to 66.1% in 2010 and the projections are that in 2011 it will further
increase to 73.6% (OECD 2011).
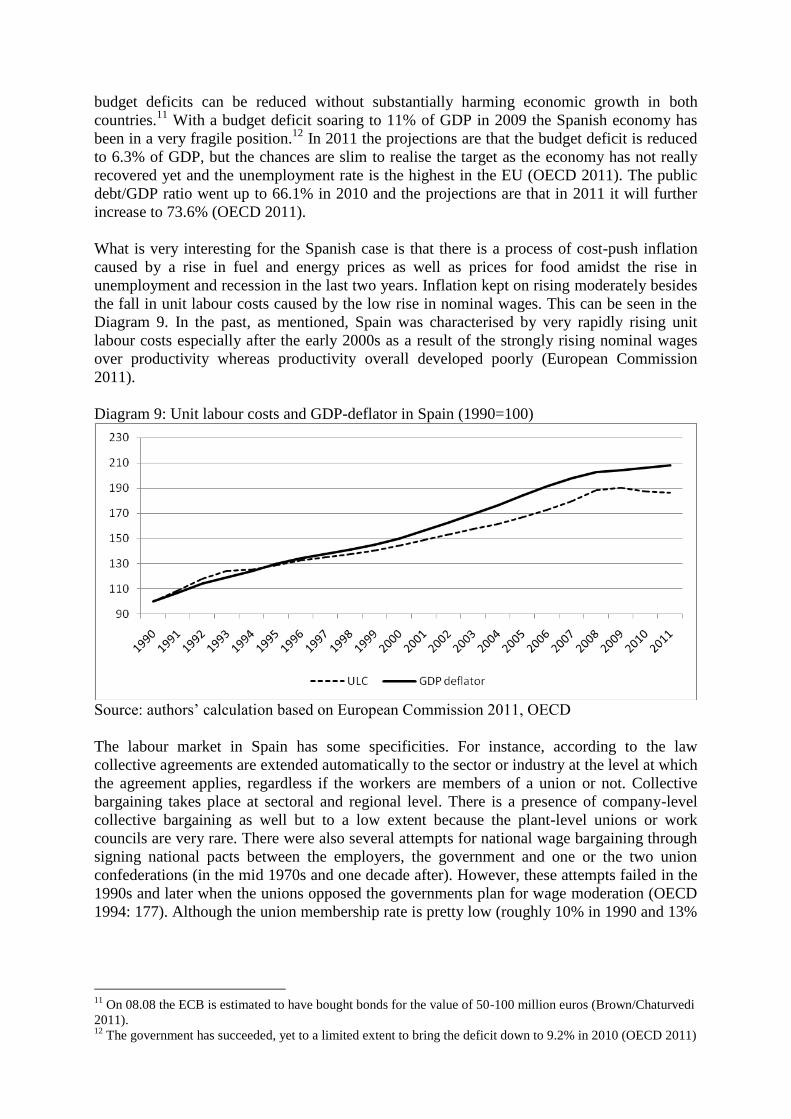
What is very interesting for the Spanish case is that there is a process of cost-push inflation
caused by a rise in fuel and energy prices as well as prices for food amidst the rise in
unemployment and recession in the last two years. Inflation kept on rising moderately besides
the fall in unit labour costs caused by the low rise in nominal wages. This can be seen in the
Diagram 9. In the past, as mentioned, Spain was characterised by very rapidly rising unit
labour costs especially after the early 2000s as a result of the strongly rising nominal wages
over productivity whereas productivity overall developed poorly (European Commission
2011).
Diagram 9: Unit labour costs and GDP-deflator in Spain (1990=100)
Source: authors‟ calculation based on European Commission 2011, OECD
The labour market in Spain has some specificities. For instance, according to the law
collective agreements are extended automatically to the sector or industry at the level at which
the agreement applies, regardless if the workers are members of a union or not. Collective
bargaining takes place at sectoral and regional level. There is a presence of company-level
collective bargaining as well but to a low extent because the plant-level unions or work
councils are very rare. There were also several attempts for national wage bargaining through
signing national pacts between the employers, the government and one or the two union
confederations (in the mid 1970s and one decade after). However, these attempts failed in the
1990s and later when the unions opposed the governments plan for wage moderation (OECD
1994: 177). Although the union membership rate is pretty low (roughly 10% in 1990 and 13%
11
On 08.08 the ECB is estimated to have bought bonds for the value of 50-100 million euros (Brown/Chaturvedi
2011). 12
The government has succeeded, yet to a limited extent to bring the deficit down to 9.2% in 2010 (OECD 2011)
in 2000) (Ebbinghaus 2002: 5) statistics show that about 84% of the employees were covered
by collective agreements in 2008 (ICTWSS database).13
Statutory minimum wages in Spain were introduced as early as 1963. They are adjusted
annually or biannually by the government in consultation with social partners. The most
important factors taken into account when adjusting the minimum wage are: current and
expected inflation rate (the most important), productivity development and the overall
economic situation in the country (Eurofound 2005). During the Franco years wages were
kept under direct control of the government and minimum wages played only a symbolic role.
Even though the labour market institutions were reformed in the late 1970s and early 1980s,
statutory minimum wages remained low. In 2004 minimum wages were de-linked from the
welfare system. Before the minimum wage was used as a basis for calculating entitlement to
unemployment benefit and assistance as well as for determining the size of the benefits (Recio
2006:163)14
In 2004 then a moderate increase of minimum wages of 8% was allowed (Recio
2006:157). Overall, statutory minimum wages as percentage of average or median wages
were initially set at a very low level and have not since then been significantly increased. The
ratio of minimum/average wage has been constantly declining since the 1980s up to 2004
when it slightly increased to around 35-36% and stayed at that level until 2010 (Eurostat). In
relation to the median wage, the minimum wage stood at 44.7% in 2008 (Schulten 2010:7).
Barely 1-3% of the workers receive the minimum wage which is another fact that describes
the dysfunctionality of the minimum wage in Spain, as it affects an insignificant share of the
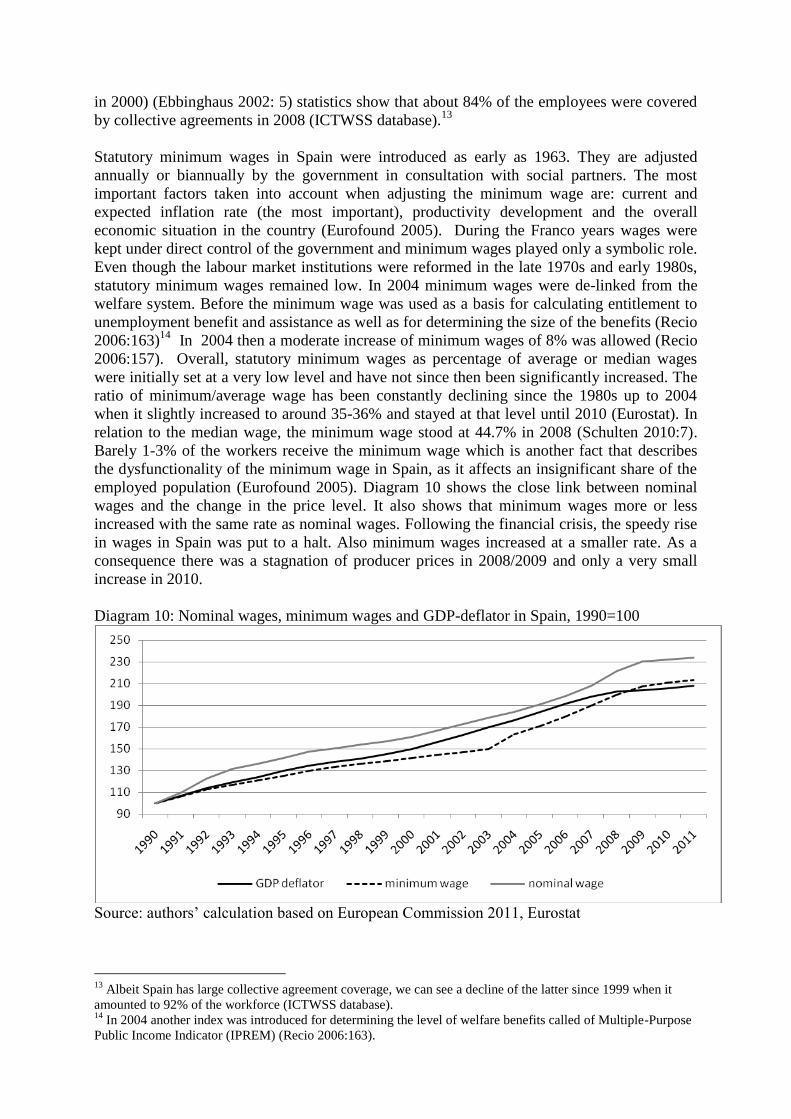
employed population (Eurofound 2005). Diagram 10 shows the close link between nominal
wages and the change in the price level. It also shows that minimum wages more or less
increased with the same rate as nominal wages. Following the financial crisis, the speedy rise
in wages in Spain was put to a halt. Also minimum wages increased at a smaller rate. As a
consequence there was a stagnation of producer prices in 2008/2009 and only a very small
increase in 2010.
Diagram 10: Nominal wages, minimum wages and GDP-deflator in Spain, 1990=100
Source: authors‟ calculation based on European Commission 2011, Eurostat
13
Albeit Spain has large collective agreement coverage, we can see a decline of the latter since 1999 when it
amounted to 92% of the workforce (ICTWSS database). 14
In 2004 another index was introduced for determining the level of welfare benefits called of Multiple-Purpose
Public Income Indicator (IPREM) (Recio 2006:163).
The minimum wage has not played a significant role in the Spanish economy. The most
important role it received was controlling government expenditures and the overall public
budget up to 2004 due to the direct link between the minimum wage and welfare benefits.
Nowadays in the recessionary environment, and with a growing informal economy and
immigration, the Spanish economy clearly needs to replenish the role of the minimum wage to
prevent the rise of the low wage sector (which was as big as 15.2% of total employed
workforce in 2006).15
Secondly, it should be actively used as a labour market instrument to
put a halt to the increase in inequality.16
Unemployment in Spain in 2011 with 20.6% is
extremely high (Eurostat 2011). The only way to protect the economy from deflation would
be to have high collective bargaining coverage, no violation of wage agreements, as well as
higher minimum wages which will affect a significant number of workers, especially if the
minimum wage sends a signal to the wage development in the informal economy.
Let us come to Ireland. After 1980s the financial market liberalization wave that started off in
many of the developed countries, like the US or the UK, spread over also to Ireland. The
loosening of controls contributed to very rapid lending to the private sector and made Ireland
a kind of offshore centre for international financial transactions (Kelly, et al. 2011: 12). In the
aftermath of the sluggish growth and high unemployment in the 1980s, the Celtic tiger
managed to have impressive economic growth which was also reflected in a high level of
employment. Consumption was supported by the low interest rate environment and the
liberalization that took place in the financial market stimulating higher credit demand and
investment in the stock and real estate markets17
Private household debt increased
tremendously. The ratio of household debt to disposable income increased from a level of
48% in 1995 to 176% in 2008 which is the highest increase yet compared to the rest of
developed countries (see Table 2). Like in many other European countries, the wage share
started dropping after the early 1970s and particularly after the beginning 1980s. In fact in
2011 the wage share reached a level below the average of the EU.18
Ireland was hit very hard by the financial crisis in 2008, and up to this date was not able to
recover. It entered a recession, sliding from 5.6% GDP growth in 2007 to -3.5% in 2008 and -
7.6% in 2009. In 2010 Ireland still had a negative growth (-1.1%). Due to the severe impact of
the financial crisis whereby the financial system was on the brink of collapse and firms facing
big liquidity problems the number of fixed term employment contracts and temporary
employment increased dramatically and many people lost their job. This was reflected in the
level of unemployment, which increased from 4.6% in 2007 to 13.7% towards the end 2010
(European Commission 2011). In Ireland during the long recession a typical debt-deflation
scenario occurred. Due especially to bailing out of the financial system the level of public
debt increased enormously (from 29% of GDP in 2007 to 102.4% of GDP in 2010) and there
are no signs that it is going to be reduced in the near future.19
In Ireland there is an important institution to coordinate wage development – the so called
national social pact – through which wages, the welfare provisions and taxation amongst
15
According to Schneider (2007) the size of the informal economy is estimated to be roughly 20% of GDP. The
share of informally employed to total labour force is estimated to be between 11 and 32% in 1997/1998
(Schneider 2002:23). 16
The rise in inequality can be seen through the rise in the S80/S20 disposable income quintile ratio from 5.3 in
2006 to 6.0 in 2009, which is the ratio of total disposable income received by the 20 % of the population with the
highest income (top quintile) to that received by the 20 % of the population with the lowest income (lowest
quintile) (Eurostat 2011). 17
For illustration, the number of mortgages increased more than twofold between 1995 and 2005 (ibid. 11) 18
The wage share had an extreme fall from 68.3% on average for the period 1960-1970 to 50.4% for the period
2001-2011 (authors‟ calculation based on Ameco, database of the European Commission). 19
The OECD statistics (OECD 2011) estimate a public debt/GDP ratio of 120.4% in 2011.
unions, employers and the government are debated (Roche 2007). Using the social pact since
1987 Ireland showed a different attitude than US or UK, which clearly employed a
neoclassical strategy of weakening and excluding unions. However, in essence these pact
merely had a symbolic meaning, as the unions in fact have very little say and because of the
voluntaristic character of these agreements. Voluntaristic character basically means that the
agreements are not rules, but rather recommendations. Unions‟ power was weakened with the
government‟s strategy to attract foreign direct investment and thus lax regulations in the
labour market coupled with very low enterprise taxes since the early 1980s (Roche 2007).
Union density showed a markedly high drop from 62% in 1980 to 31% in 2008 (CSO 2008).
That the social pact was not really successful is also proven by the fact that even though after
1987 seven national agreements were signed the most recent 10-year agreement signed in
2006 “Towards 2016” was revised already in 2009 against the will of the unions. The key
problem was that the unions did not agree with the substantial wage cuts (McDonough 2010).
Subsequently in November 2009 the government decided to impose public sector wage cuts
of about 15% on average (Sheehan 2010). This is a policy known from the Brüning
government in Germany (1930-1932) which led to a severe deflation as wage cuts in the
public sectors most likely will spill over to the private sector.20
In 2010 the government and
the unions signed the Public Service Agreement 2010-2014, otherwise known as the „Croke
Park deal‟, but it is not a national social pact.21
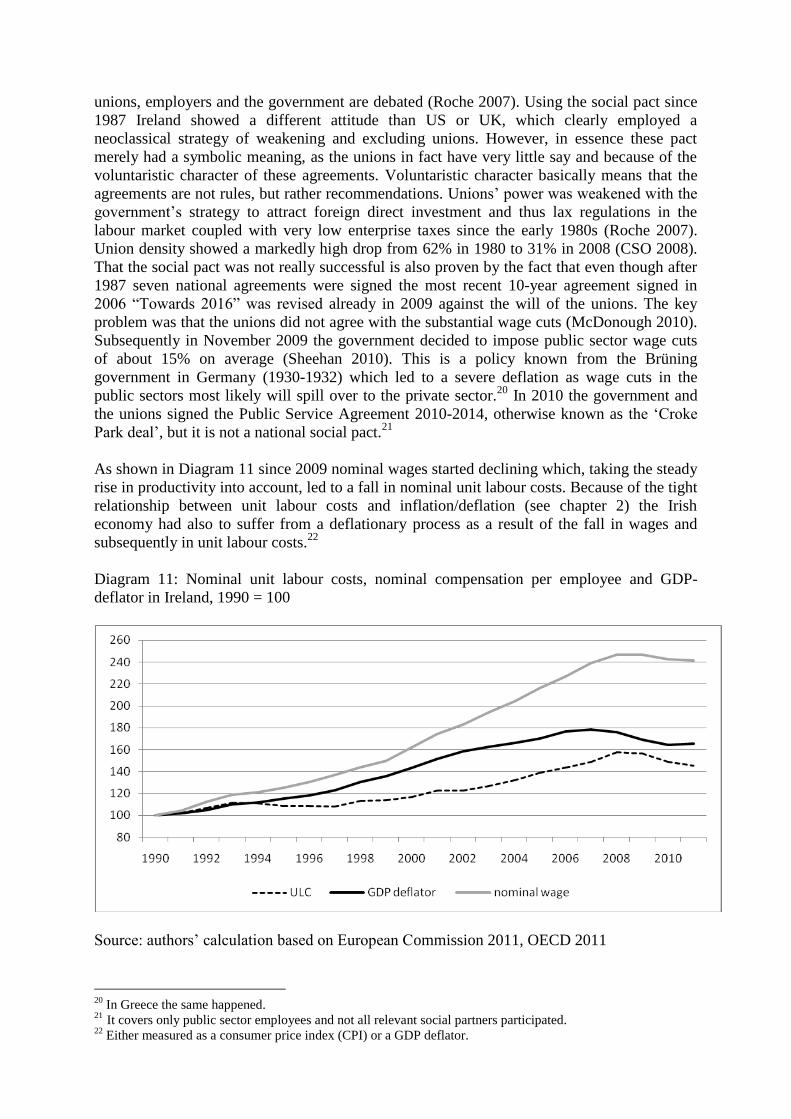
As shown in Diagram 11 since 2009 nominal wages started declining which, taking the steady
rise in productivity into account, led to a fall in nominal unit labour costs. Because of the tight
relationship between unit labour costs and inflation/deflation (see chapter 2) the Irish
economy had also to suffer from a deflationary process as a result of the fall in wages and
subsequently in unit labour costs.22
Diagram 11: Nominal unit labour costs, nominal compensation per employee and GDP-
deflator in Ireland, 1990 = 100
Source: authors‟ calculation based on European Commission 2011, OECD 2011
20
In Greece the same happened. 21 It covers only public sector employees and not all relevant social partners participated. 22
Either measured as a consumer price index (CPI) or a GDP deflator.
A statutory minimum wage in Ireland was initially introduced through the National Wage Act
of 2000, and put into force in 2001 at a rate of 5.59 Euro per hour. The proportion of full time
employees earning the minimum wage was around 3% in 2005 (Regnard 2007: 5). In the
process of setting and adjusting the minimum wage trade unions, employers, as well as the
government play a crucial role through signing a tripartite agreement which is then adopted as
the statutory minimum wage by the government. Could the social partners not agree about the
level of the minimum wages, the Labour Court (including representatives of employees and
employers‟ associations) gives a recommendation for the development of minimum wages.
Nevertheless, the last say is in the hands of the government which officially has a right to
decline the agreement about the minimum wage delivered in the social pact or the
recommendation of the Labour Court, but in practice it has never been the case (Murphy
1998).
In relation to the average wage, in 2008 the minimum wage stood at 44.5% of the mean wage
and at 52.8% of the median wage (Schulten 2010:7). In spite of the relatively high
minimum/average wage ratio, the minimum wage has not been successful in narrowing the
wage gap between the highest and lowest income earners in the country (CSO 2005).
According to Crouch (1999: 160), the gap between the 10% richest and the 10% poorest in
Ireland in the 1980s was higher than in any other European country, a situation which did not
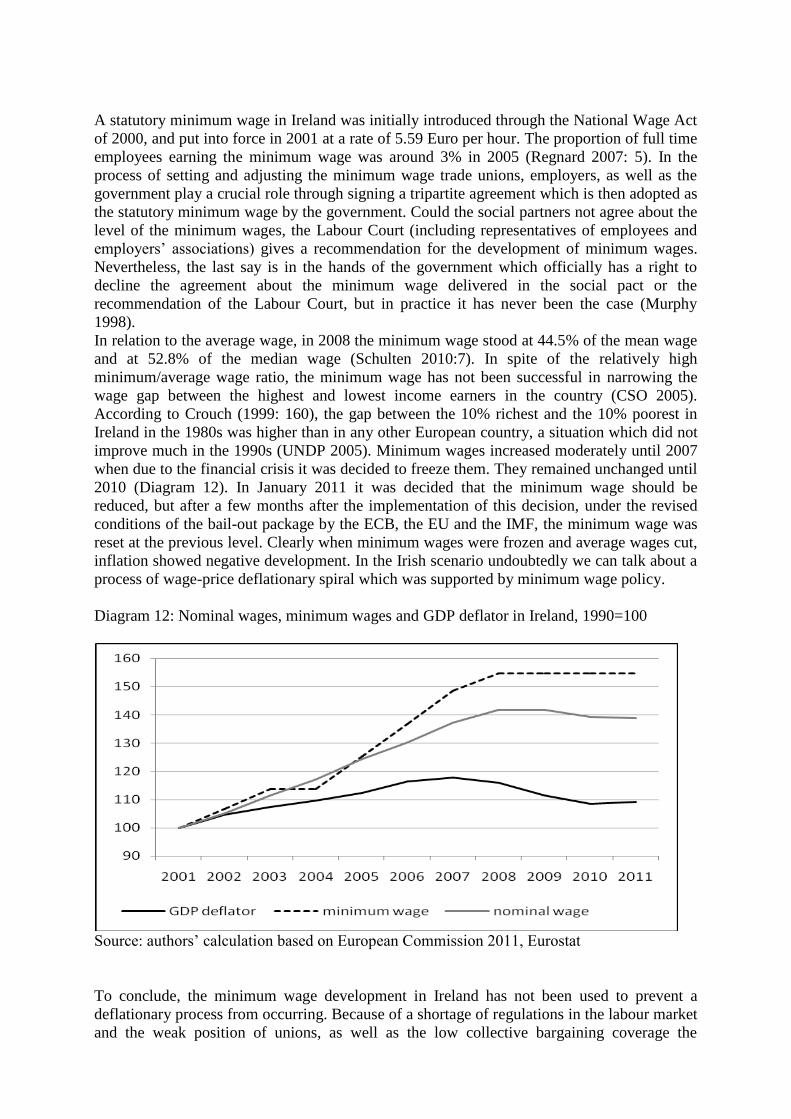
improve much in the 1990s (UNDP 2005). Minimum wages increased moderately until 2007
when due to the financial crisis it was decided to freeze them. They remained unchanged until
2010 (Diagram 12). In January 2011 it was decided that the minimum wage should be
reduced, but after a few months after the implementation of this decision, under the revised
conditions of the bail-out package by the ECB, the EU and the IMF, the minimum wage was
reset at the previous level. Clearly when minimum wages were frozen and average wages cut,
inflation showed negative development. In the Irish scenario undoubtedly we can talk about a
process of wage-price deflationary spiral which was supported by minimum wage policy.
Diagram 12: Nominal wages, minimum wages and GDP deflator in Ireland, 1990=100
Source: authors‟ calculation based on European Commission 2011, Eurostat
To conclude, the minimum wage development in Ireland has not been used to prevent a
deflationary process from occurring. Because of a shortage of regulations in the labour market
and the weak position of unions, as well as the low collective bargaining coverage the
government was able to even impose wage cuts in the public sector and a freeze in the growth
of the minimum wage
4. Conclusion
Deflation is back – who would have expected that some decades before. Japan is caught in a
deflationary constellation which keeps the financial system distorted due to permanently
increasing real debt and prevents the recovery of sufficient aggregate demand. Minimum
wage policy in Japan was not functional to prevent the deflation. Ireland is already in
deflation. Deflationary policies were actively pushed by the Irish government: wages in the
public sector were cut and the minimum wage was frozen. Spain is in a constellation
comparable to Ireland and will follow the deflationary development. Portugal is also affected
by falling nominal wages and falling prices. For illustration, during the last quarter of 2009
and the first two quarters of 2010, the core inflation showed a fall by 0.41 percent, and in
2011 wages are estimated to drop by 0.25% (European Commission 2011). There is a
difference between the deflationary development of EMU-countries and Japan. The EMU
countries have no exchange rate mechanism left to balance their high external deficits. As
Germany and other surplus countries will not substantially increase unit labour costs the
deficit countries only have the possibility to cut wages to become internationally competitive
again. Economic and political pressure from EMU surplus countries within the international
institutions forces these countries to deflationary developments. However, the deflationary
effect to increase the real debt burden will hit these countries as it has hit Japan. The
likelihood that these countries come out of the crisis is not very high. Some small countries
may manage by deflationary policies to stimulate exports to such an extent that they start to
grow again. But this has to be seen as an exception which is also harmful for other countries.
The ILO in its Global Wage Pact (2009) suggests that the governments in combination with
in-work benefits (tax credits) or income transfers (for both the employed and unemployed)
use minimum wages to “reduce poverty and inequity, increase demand and contribute to
economic stability” (ILO 2009). This has to be supported. However, the countries in our case
study were not able to follow such a policy or even actively violated strategies following the
ILO suggestions.
What is needed in almost all countries is a domestic demand driven stimulation based on more
equal income distribution. Minimum wages can play a vital role by preventing a fall in the
general wage und price level and changing wage dispersion. If it is not possible to prevent
nominal wage cuts, the phase of asset price deflation will spill over into a phase of goods
market deflation. Then we are back in 1930. Actually the case studies we presented make us
not very optimistic. The pressure from unemployment and misled stabilisation policies in the
EMU actively demanding deflation were strong enough to prevent rational policies to
overcome the present crisis constellation. Let us hope that other countries can learn from the
1930s, Japan in the 1990/2000s and the EMU crises countries to follow at least a rational
wage and minimum wage policy. To follow such a policy is a free lunch for governments, not
to follow it leads to a disaster.
Literature
Abe, Y. (2011): Minimum Wages and Employment in Japan, in: Japan Labour Review, vol. 8,
42-54.
Bispinck, R., Schulten T. (2009): Re-Stabilisierung des deutschen
Flächentarifvertragssystems, WSI-Mitteilungen Nr.4, 62. Jahrgang, Bund Verlag.

Bosch, G., Kalina, C., Weinkopf, T. (2009): Mindestlöhne in Deutschland, WISO Diskurs,
Friedrich Ebert Stiftung, Bonn.
Brown, N., Chaturvedi, M. (2011): ECB buys Italian, Spanish Bonds Again, Article in the
Wall Street Journal online, 10. August 2011
(http://online.wsj.com/article/SB10001424053111904007304576498023643429378.html).
Crouch, C. (1999): Social Change in Western Europe, Oxford University Press, Oxford.
CSO (2005): Quarterly national household survey
(www.cso.ie/eusilc/national_poverty_indicators.htm)
CSO (2008): Quarterly National Household Survey: Union Membership Q2 2007, Central
Statistics Office, Dublin.
Du Caju, P., Gautier, E., Momferatou, D., Ward-Warmedinger, M. (2008): Institutional
Features of Wage Bargaining in 23 European Countries, the US and Japan. Forschungsinstitut
zur Zukunft der Arbeit, IZA DP No. 3867, http://ftp.iza.org/dp3867.pdf
Dullien, S., Herr, H., and C. Kellermann 2011: Decent Capitalism, Pluto, London.
Ebbinghaus, B. (2002): Trade unions‟ changing role: membership erosion, organisational
reform, and social partnership in Europe, EU Paper Series, (available at:
eucenter.wisc.edu/publications/ebbinghaus02.pdf).
European Commission (2011): Ameco, online database.
Eurofound (2005): Minimum Wages in Europe, European Industrial Relations Observatory
Online (available online at http://eurofound.europa.eu/eiro/2005/07/study/tn0507101s.htm).
Fisher, I. (1933): The Debt-Deflation Theory of Great Depressions, in: Econometrica, vol. 1,
337-257.
Federal Employment Agency (2011): Employed in mini jobs 2003-2010, Institute of
Sociology, University of Duisburg, Essen (available at: http://www.sozialpolitik-
aktuell.de/arbeitsmarkt-datensammlung.html#atypische_beschaeftigung_-_1821).
Federal Statistical Office (2003): Ost-West-Verdienstrelation- Eine Untersuchung mit Hilfe
der laufenden Verdiensterhebung 2002, Wirtschaft und Statistik 5/2003.
Gernandt, J., Pfeiffer, F. (2007): Rising Wage Inequality in Germany, Discussion Paper No.
06-019 (available at: ftp://ftp.zew.de/pub/zew-docs/dp/dp06019.pdf).
Goodbody Stockbrokers (2009): Recovery in Sight, Irish Economic Commentary, Dublin,
Ireland.
Herr, H. (2009): The Labour Market in a Keynesian Economic Regime: Theoretical Debate
and Empirical Findings, in: Cambridge Journal of Economics, Vol. 33, 949-965.
Herr, H. (2011): Making an Unstable Financial System Work: Reform Options, in:
International Journal of Labour Research, Vol. 3, 133-156.
Herr, H., Kazandziska, M. (2010): Labour Market and Deflation in Japan, in: International
Journal of Labour Research, vol. 2, p. 78-98.
Herr, H., Kazandziska, M. (2011): Macroeconomic Policy Regimes in Western Industrial
Countries, Routledge, London.
Herr, H., Kazandziska, M. (2011a): Principles of Minimum Wage Policy – Economics,
Institutions and Recommendations, Global University Working Paper No. 11, March.
Herr, H., Kazandziska, M., Mahnkopf-Praprotnik, S. (2009): The Theoretical Debate About
Minimum Wages. Global Labour University Working Papers, no. 6, February.
International Labour Organization (ILO) (2009): Recovering from the Crisis: A Global Jobs
Pact, adopted by the International Labour Conference, Geneva, 19 June 2009.
International Monetary Fund (IMF) (2011): World Economic Outlook database, April 2011
(available online at: http://www.imf.org/external/pubs/ft/weo/2011/01/weodata/index.aspx).
Japanese Government (2009): Third Periodic Report by the Government of Japan under the
Articles 16 and 17 of the International Covenant on Economic, Social and Cultural Rights,
December 2009, Tokio.
Kawaguchi, D., Mori, Y. (2009): Is Minimum Wage an Effective Anti-Poverty Policy in
Japan? RIETI Discussion Paper Series 09-E-032.
Kelly, R., McQuinn, K., Stuart, R. (2011): Exploring the Steady-State Relationship between
Credit and GDP for a Small Open Economy - The Case of Ireland, Research Technical Paper,
Central Bank of Ireland.
Keynes, J. M. (1930): Treatise on Money, Vol. 1, The Pure Theory of Money, MacMillan,
Collected Writings, Vol. V, London.
Keynes, J.M. (1936): The General Theory of Employment, Interest and Money, Cambridge
University Press, Cambridge, UK.
Kindleberger, C.P. (1996): Manias, Panics, and Crashes: a History of Financial Crises, 3rd
edn, Wiley and Sons, New York.
McDonough, T., Dundin, T. (2010): Thatcherism Delayed? The Irish crisis and the paradox of
social partnership, Industrial Relations Journal, 41 (6): 544-562.
Minsky, H.P. (1975): John Maynard Keynes, Columbia University Press, New York.
Murphy, T. V. (1997?): The resolution of industrial disputes, In: Murphy, T. V., Roche, W. K.
Irish Industrial Relations in Practice, Oak Tree Press, Dublin.
Nakakubo, H. (2009): A New Departure in the Japanese Minimum Wage Legislation, in:
Japan Labour Review, vol. 6, 22-38.
Nolan, B., Williams, J., Blackwell, S. (2003): New results on the impact of the minimum
wage on Irish firms, In: Quarterly Economic Commentary (1-10).
OECD (1994): Collective Bargaining, In: Employment Outlook 1994, pp.167-208, Paris.
OECD (2004): Wage Setting Institutions and Outcomes, in OECD Employment Outlook,
Paris.
OECD (2011): OECD Economic Outlook No. 89, available online at the OECD iLibrary
(http://www.oecd-ilibrary.org/).
Ohashi, I. (2011): The Minimum Wage System in Japan: In Light of Circumstances in the
United States and Europe, Japan Labour Review, Volume 8, Number 2, Spring 2011.
Ohki, H. (2011): Let Us Achieve a Minimum Wage Raise to 1,000 Yen per Hour Using the
Power of Social Solidarity, http://www.zenroren.gr.jp/jp/english/2007/english070821.html.
Recio, A. (2006): The statutory minimum wage in Spain, In: Schulten, T., Bispinck, R.,
Schäfer, C., Minimum wages in Europe, ETUI-REHS, Brussels.
Regnard, P. (2007): Minimum wages 2007 – Variations from 92 to 1570 euro gross per
month, Statistics in Focus, No. 71/2007, Eurostat, European Communities.
Roche, W.K. (2007): Social Partnership in Ireland and New Social Pacts, Industrial Relations,
46, 3, 395-425.
Schneider, F. (2002): Size and Measurement of the Informal Economy in 110 Countries
around the World, Paper presented at the Workshop of Australian National Tax Centre, ANU,
Canberra, Australia, July 17, 2002
Schneider, F. (2007): The size of the shadow economies of 145 countries all over the world:
first results over the period 1999 to 2003, Journal of Population Economics. 20 (3): 495 –
526.
Schulten, T. (2010): Minimum wages under the conditions of the global economic crisis,
draft, to be published in: J. Heyes and L. Rychly (ed.), Labour Administration and the
Economic Crisis. Challenges, Responses and Opportunities, International Labour
Organisation, Geneva.
Sheehan, B. (2010): Public sector unions launch action against pay cuts, European Industrial
Relations Observatory On-Line (EIRO).
Soskice, D. (1990): Wage Determination: the Changing Role of Institutions in Advanced
Industrial Countries. Oxford Review of Economic Policy, Vol. 6, 36-61.
Stiglitz, J. (2010): Free Fall. America, Free Markets, and the Sinking of the World Economy,
W.W. Norton, New York and London.
Soros, G. (2008): The New Paradigm for Financial Markets: the Credit Crisis of 2008 and
What it Means, Public-Affairs Ltd, London.
UNDP (United Nations Development Programme) (2005): Human Development Index 2005.
WSI (2008): Annual collective bargaining report, In: Institute of Sociology, University of
Duisburg, Essen (available at: www.sozialpolitik-aktuell.de).