wage theft in australia - squarespace · wage theft in australia findings of the national temporary...
TRANSCRIPT
WAGE THEFT IN AUSTRALIA
Findings of the National Temporary Migrant Work Survey
Laurie Berg and Bassina Farbenblum I November 2017

© Laurie Berg and Bassina Farbenblum 2017. All material in this report is provided under a Creative Commons Attribution-NonCommercial-NoDerivatives 4.0 International (CC BY-NC-ND 4.0) license.
Design and layout Hard Working Farmboys
Cover image by Juan Monino, istockphoto
3
Authors ......................................................................................4
Acknowledgements .............................................................4
Executive summary ..............................................................5
Section I: Introduction ................................................ 8
About the survey ...................................................................... 10
Method ........................................................................................ 11
Section II: Demographic profile of survey participants ............................................................ 12
Visa cohorts ............................................................................... 12
Students’ educational institution ..................................... 14
Year of arrival ............................................................................ 15
Nationality ................................................................................. 16
Gender ......................................................................................... 19
Section III: Characteristics of low paid jobs undertaken by temporary migrants ............................ 20
Industry / job ............................................................................. 20
Location ...................................................................................... 21
Weekly Hours............................................................................. 22
Section IV: Underpayment among different groups of temporary migrants ...................................... 24
How far below the legal wage were temporary migrants paid? ....................................... 24
Wage rates by visa category ............................................... 26
Wage rates by nationality ................................................... 28
Wage rates by industry / job ............................................... 30
Wage rates by gender ............................................................ 32
Section V: How temporary migrants find low paid jobs ............................................................... 33
Section VI: Temporary migrants’ perceptions of the minimum wage in Australia and prevalence of underpayment among peers ............. 34
Temporary migrants’ perception of the minimum wage in Australia .............................................. 34
Temporary migrants’ perception of prevailing wages for migrants on their visa ........... 35
Section VII: Payment of temporary migrants in cash and non-provision of pay slips ...................................... 38
Payment in cash ...................................................................... 38
Failure to provide pay slips .................................................. 40
Section VIII: Temporary migrants’ experience of other exploitative employment practices ................. 41
Passport confiscation ............................................................ 41
Immigration-reporting threats ......................................... 43
Payments to obtain job ........................................................ 43
‘Cash back’ payment to employer ................................... 45
Section IX: Unauthorised work ...................................... 46
Survey participants who disclosed potential unauthorised work ......................... 47
Unauthorised workers’ lowest paid jobs ....................... 47
Conclusion ............................................................................ 48
Annex 1: Characteristics of temporary migrants’ lowest paid job: further graphs ..................................... 49
Lowest paid job for temporary migrants of different nationalities and visa classes ..................... 49
Temporary migrants’ lowest paid job in different states and territories ............................... 51
Hours worked by temporary migrants in their lowest paid job ......................................................... 52
Annex 2: How temporary migrants found low paid jobs: further graph ........................................... 53
Annex 3: Number of Participants (n) for Each Figure in Report ................................................. 54
Contents
4
Authors
Laurie Berg is Senior Lecturer in the Faculty of Law, University of Technology Sydney.
Bassina Farbenblum is Senior Lecturer in the Faculty of Law, UNSW Sydney, and Director of the Australian Human Rights Centre’s Migrant and Refugee Rights Project. She is the founding director of UNSW Law’s Human Rights Clinic.
Laurie and Bassina co-direct the Migrant Worker Justice Initiative (www.mwji.org), which engages in detailed empirical research in Australia and globally to catalyse improved enforcement of rights and just remedies for temporary migrants.
Acknowledgements
Freelance social researcher and data analyst Christine Eastman ([email protected]) provided expert and insightful data analysis, and the graphic representation of the data in this report.
Dr Stephen Clibborn (University of Sydney, School of Business) partnered with the authors in the design and execution of the survey. Yumeng Yue and Andreea Constantin provided research assistance in the setup of the survey and the editing and re-coding of data. Angela Kintominas, Research Associate at the Migrant Worker Justice Initiative, provided editorial assistance on the report. Lisa Jeffery assisted with compilation of initial distribution contacts.
The authors appreciate the time and effort contributed by the many individuals who voluntarily assisted throughout the study, including:
• Isabel Salinas Alcaraz, who passionately worked with the authors to develop and implement the survey distribution strategy, including recruitment and oversight of the Outreach Committee;
• The Outreach Committee and other volunteers who assisted with distribution of the survey within their community and language groups and with reviewing survey translations including: Ahmed Bishtawi, Anil Shrestha, Bhatara Reza, Charlin Feng, Emma Moore, Margherita Angelucci, Maria Azzurra Tranfaglia, Marvin Quevedo, Michael Fraser, Michael Tran, Miriam Thompson, Mizuki Kawano, Muhammed Zohaib Javed, Patrick Earle, Peter Luo, Sherry Huang, Sohoon Lee, Song Hyunseok, Wendy Tran and Yao-Tai Li;
• Organisational members of the Migrant Workers Rights Network and other unions and organisations throughout Australia who provided feedback on survey design and distributed information on the survey to their networks. These included the Salvation Army Freedom Partnership, United Voice, the National Union of Workers, Unions NSW, the Shop, Distributive and Allied Employees Association, Redfern Legal Centre, Australian Meat Industry Employees Union, Federation of Ethnic Community Councils of Australia, Korean Working Holiday Youth, Taiwanese Working Holiday Youth, Council of International Students Australia, along with many others;
• Universities and individual faculties that distributed the survey to their international students; and
• Dr Benjamin James Matthews who provided expert advice on social media distribution strategies.
The authors thank Associate Professors Joo-Cheong Tham and Joanna Howe for insightful feedback on an earlier draft of the report.
The authors are deeply grateful to each of the current and former temporary migrants who were willing to share information about their work experience in Australia and generously gave their time to complete the survey.
5
Executive summary
Overview of the study
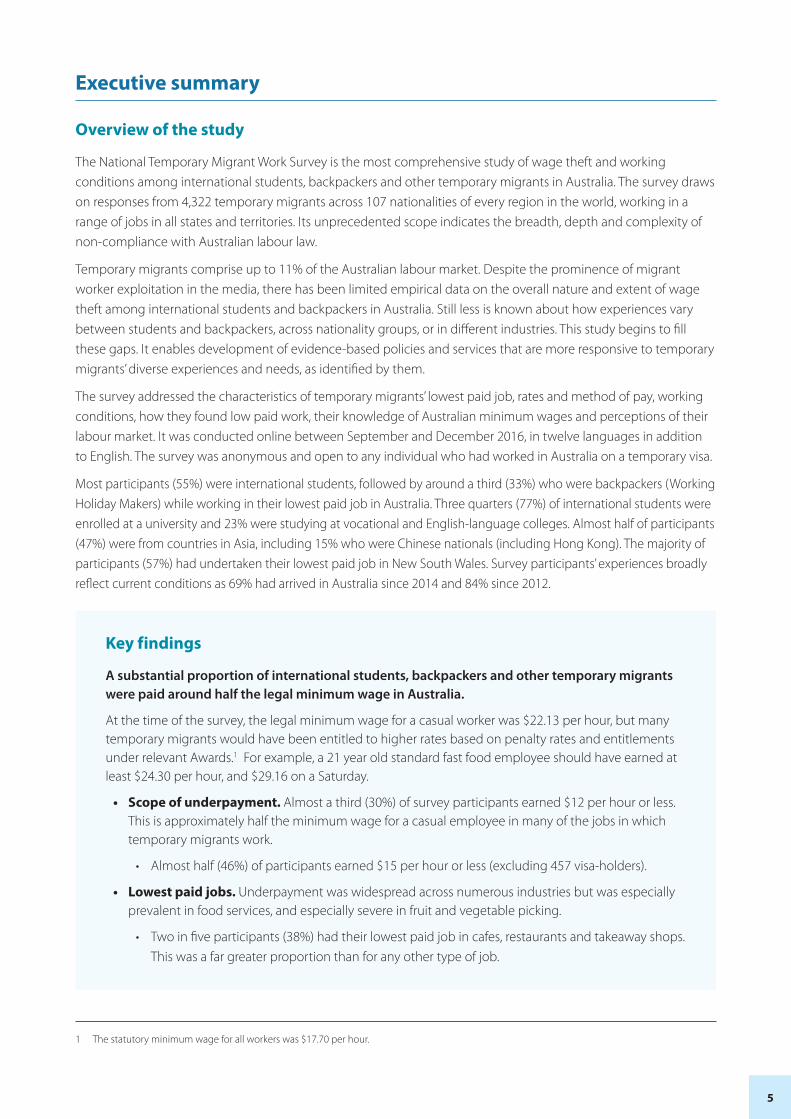
The National Temporary Migrant Work Survey is the most comprehensive study of wage theft and working conditions among international students, backpackers and other temporary migrants in Australia. The survey draws on responses from 4,322 temporary migrants across 107 nationalities of every region in the world, working in a range of jobs in all states and territories. Its unprecedented scope indicates the breadth, depth and complexity of non-compliance with Australian labour law.
Temporary migrants comprise up to 11% of the Australian labour market. Despite the prominence of migrant worker exploitation in the media, there has been limited empirical data on the overall nature and extent of wage theft among international students and backpackers in Australia. Still less is known about how experiences vary between students and backpackers, across nationality groups, or in different industries. This study begins to fill these gaps. It enables development of evidence-based policies and services that are more responsive to temporary migrants’ diverse experiences and needs, as identified by them.
The survey addressed the characteristics of temporary migrants’ lowest paid job, rates and method of pay, working conditions, how they found low paid work, their knowledge of Australian minimum wages and perceptions of their labour market. It was conducted online between September and December 2016, in twelve languages in addition to English. The survey was anonymous and open to any individual who had worked in Australia on a temporary visa.
Most participants (55%) were international students, followed by around a third (33%) who were backpackers (Working Holiday Makers) while working in their lowest paid job in Australia. Three quarters (77%) of international students were enrolled at a university and 23% were studying at vocational and English-language colleges. Almost half of participants (47%) were from countries in Asia, including 15% who were Chinese nationals (including Hong Kong). The majority of participants (57%) had undertaken their lowest paid job in New South Wales. Survey participants’ experiences broadly reflect current conditions as 69% had arrived in Australia since 2014 and 84% since 2012.
Key findings
A substantial proportion of international students, backpackers and other temporary migrants were paid around half the legal minimum wage in Australia.
At the time of the survey, the legal minimum wage for a casual worker was $22.13 per hour, but many temporary migrants would have been entitled to higher rates based on penalty rates and entitlements under relevant Awards.1 For example, a 21 year old standard fast food employee should have earned at least $24.30 per hour, and $29.16 on a Saturday.
• Scope of underpayment. Almost a third (30%) of survey participants earned $12 per hour or less. This is approximately half the minimum wage for a casual employee in many of the jobs in which temporary migrants work.
• Almost half (46%) of participants earned $15 per hour or less (excluding 457 visa-holders).
• Lowest paid jobs. Underpayment was widespread across numerous industries but was especially prevalent in food services, and especially severe in fruit and vegetable picking.
• Two in five participants (38%) had their lowest paid job in cafes, restaurants and takeaway shops. This was a far greater proportion than for any other type of job.
1 The statutory minimum wage for all workers was $17.70 per hour.
6
• Almost a third (28%) of these workers were paid $12 per hour or less. Half (49%) were paid $15 per hour or less.
• Jobs in food services strongly predominated as the lowest paid job among the top 6 nationalities of international students and backpackers.
• Large-scale wage theft was prevalent across a range of industries, but the worst paid jobs were in fruit- and vegetable-picking and farm work.
• Almost one in seven participants working in fruit- and vegetable-picking and farm work (15%) earned $5 per hour or less. Almost a third (31%) earned $10 per hour or less.
• In convenience stores/petrol stations and car washes, a fifth earned $10 per hour or less (19% and 20% respectively). In retail, over a third (36%) received $12 per hour or less. Among cleaners, over half (56%) received $15 per hour or less.
• International students. A quarter (25%) of all international students earned $12 per hour or less and 43% earned $15 or less in their lowest paid job.
• University students did not earn substantially higher wages than students at vocational and English language colleges.
• Students who worked more than 20 hours per week (potentially breaching their visa conditions) earned substantially lower wages than other students.
• Backpackers. A third (32%) of all backpackers earned $12 per hour or less and almost half (46%) earned $15 or less in their lowest paid job.
• Nationalities. Extremely poor wage rates ($12 per hour or less) were reported by at least a fifth of temporary migrants from every nationality.
• Participants from several Asian countries had the lowest wage rates overall compared with participants from major English-speaking countries that had the highest rates. Around three quarters (75-81%) of Chinese, Taiwanese and Vietnamese participants earned $17 per hour or less, compared with 35-41% of American, Irish and British participants.
• How lowest paid job found. Most participants who earned between $6 and $12 per hour found their job either through a friend or family member (23%) or by contacting their employer directly (24%). 17% found their job on an English-language site such as Gumtree, and 21% found it through an internet site in their own language. Three in five Koreans (59%) who earned $6 to $12 per hour found their job on a Korean-language website.
• Weekly hours worked. Temporary migrants worked a substantial number of hours in their lowest paid job.
• Almost three quarters (72%) of backpackers indicated that they worked 21 hours per week or more.
• Two thirds (64%) of international students reported that they worked between 9 and 20 hours each week, and a further 13% worked 21 hours or more.
International students and backpackers were aware of the Australian minimum wage and knew they were being underpaid, but believed that few people on their visa can expect to receive that wage.
• Contrary to popular assumptions, underpaid international students and backpackers knew they were receiving less than the Australian minimum wage. Among those earning $15 per hour or less,
• Three quarters of students (73%) and backpackers (78%) knew that the minimum wage was higher than what they were earning.

7
• 86% of students at vocational and English-language colleges knew the minimum wage was higher than what they were earning, a higher proportion than among students at universities (69%).
• Underpaid participants believed underpayment is endemic among people on their visa. At least 86% of temporary migrants who earned $15 per hour or less believed that many, most or all other people on their visa are paid less than the basic national minimum wage.
Employers widely paid temporary migrants in cash and did not provide pay slips, especially in food services and among Chinese workers.
• A substantial proportion (44%) of temporary migrants were paid in cash, and 50% reported that they never or rarely received pay slips. This rose to almost three quarters of those paid $12 per hour or less (70% paid in cash and 74% rarely or never received pay slips).
• Two in three (65%) waiters, kitchen-hands and food servers were paid in cash.
• Two in three (65%) Chinese participants were paid in cash, far higher than proportions of American and British participants (26% each).
International students, backpackers and other temporary migrants also experienced other indicators of exploitation and criminal forced labour.
• 91 participants had their passport confiscated by their employer (3%) and 77 by their accommodation provider (2%). Most were in food services (28%) or horticulture (18%).
• 173 participants (5%) paid an upfront ‘deposit’ for a job in Australia.
• 112 participants (4%) indicated that their employer required them to pay money back in cash after receiving their wages
Conclusion
The study confirms that wage theft is endemic among international students, backpackers and other temporary migrants in Australia. For a substantial number of temporary migrants, it is also severe.
This raises urgent and challenging questions for a number of actors. For government, it demands examination of levels of resourcing required to address the scale of non-compliance, and consideration of specialised programs and infrastructure to prevent and remedy wage theft among temporary migrants. Employers, franchisors and businesses at the peak of supply chains must employ more effective methods to detect and remedy wage theft in the knowledge that it is widespread within their industries in Australia. The findings also invite scrutiny of how certain businesses profit from wage theft and gain advantage over others that pay workers in compliance with Australian labour law, and how wage theft among temporary migrants may be driving wages down for all workers in certain industries.
The study presents confronting data for educational institutions regarding their international students, and raises questions as to the support services the sector should provide. It also indicates an urgent need for resourcing of legal services, community organisations and unions to provide far greater levels of support to underpaid temporary migrants. Finally, the findings raise challenging questions regarding the benefits that consumers may derive from wage theft in the form of lower-priced food, goods and services -- questions which have yet to receive sustained attention in Australia.

8
Section I: Introduction
The National Temporary Migrant Work Survey is the most comprehensive study on wage theft and working conditions of temporary migrants in Australia. Its unprecedented scope indicates the depth of non-compliance with Australian labour law, drawing on responses from 4,322 temporary migrants across 107 nationalities, working in a range of jobs in all states and territories. The report focuses in particular on wage theft2 -- employers pocketing a portion of temporary migrants’ wages by undercutting minimum entitlements under Australian labour law.3
As of 2016, there were over 900,000 temporary migrants with work rights in Australia (excluding New Zealanders),4 comprising up to 11% of the Australian labour market.5 Intensified public attention to exploitation of this workforce has led to numerous legislative reforms, parliamentary inquiries, and government initiatives, including the establishment of the Migrant Workers’ Taskforce and expanded efforts by the federal workplace regulator, the Fair Work Ombudsman.
However, to date, much of the empirical research into temporary migrants’ working conditions has been qualitative or limited to single industries, visa categories, nationality groups or locations. As a result, service providers and policy makers have not had access to an evidence-based big picture of the context and extent of wage theft among temporary migrants nationally. Though presumptions abound, little has been known about temporary migrants’ knowledge of Australian labour standards or their perceptions of the labour market. Nor has data been available on how experiences vary for different cohorts or how the features of low paid jobs coincide for temporary migrants.
This study begins to fill each of these gaps. It addresses the characteristics of temporary migrants’ lowest paid job, rates and method of pay, working conditions, how they find low paid work, and their relevant knowledge and perceptions. It also reports on how these experiences and perceptions differ among different visa holders and within visa cohorts, as well as differences between nationality groups and temporary migrants working in different types of jobs.
Most survey participants held one of the three dominant visas among temporary migrants working in Australia: international students who may work up to 40 hours per fortnight while their course is in session and unlimited hours during breaks; Working Holiday Makers – young travellers from certain countries with which Australia has a reciprocal relationship – who may work up to six months with any one employer during their year-long stay in Australia; and skilled employees working for a sponsoring employer.6 International students included participants studying at universities, and vocational and English language colleges. Most participants reported on recent experiences, with the substantial majority having arrived in Australia within 3 years of the survey.
The survey has a number of methodological limitations as discussed in the Method section below. Most significantly, it is not possible to know whether participants’ responses accurately reflect their experiences or whether this data truly represents the experiences of the cohorts to which participants belong. Though the report presents detailed data on the intersections between different aspects of working conditions and features of temporary migrant cohorts, it does not enable definitive conclusions on what causes wage theft or other forms of
2 A second part of the survey asked participants about whether they had complained about underpayment and their reasons for not doing so. The findings on that part of the survey will be released in 2018 in a report on temporary migrants’ access to justice in Australia.
3 Minimum wage rates apply to all workers in Australia regardless of migration status.
4 Department of Immigration and Border Protection (‘DIBP’), Temporary Entrants and New Zealand Citizens in Australia: As at 30 June 2016 (2016) 3.
5 Senate Education and Employment References Committee, A National Disgrace: The Exploitation of Temporary Work Visa Holders (2016) 15.
6 At the time of the survey these temporary migrants held 457 visas.
9
exploitation.7 It does not address all forms of exploitation experienced by temporary migrants, nor does it address the extent to which the problems identified are experienced by other groups of vulnerable workers including permanent migrants and young workers.
Nevertheless, as the most extensive and detailed survey of its kind to date, it is the broadest representation of temporary migrants’ own accounts of their experiences, which could not be collected at this scale through other methods. Information obtained directly from temporary migrants on their workplace experiences is especially important given that the number of officially reported complaints each year vastly under-represents the depth and scope of temporary migrant underpayment in Australia.8 Indeed, with notable exceptions, temporary migrants do not often have a voice in public debate and policy formulation concerning them. This is in part because they are often in Australia for short periods of time, live and work on the fringes of Australian society, are often not native English speakers, are young and, for many, are fearful of losing their job or jeopardising their visa if they speak out about working conditions. In undertaking the National Temporary Migrant Work Survey in late 2016, the authors sought to provide a platform for a large number of temporary migrants across the country to voice their experiences at work and related perspectives, in order to promote development of policies and services that are more responsive to their diverse experiences and needs.
It is our hope that this research will contribute to a broader public understanding of the systemic wage theft it reveals among temporary migrants in Australia. The study raises a range of urgent and challenging questions. These include immediate concerns about the steps that government, business and educational institutions should take to prevent and remedy wage theft among temporary workers. This is essential both to safeguard the lawful entitlements of temporary migrants and also to avoid the knock-on effect of driving wages below the lawful minimum for other workers in industries in which temporary migrants work. For government, the findings demand examination of levels of resourcing required to address the scale of non-compliance, and consideration of specialised programs and infrastructure to prevent and remedy wage theft among temporary migrants. The study also raises a further set of questions around the beneficiaries of wage theft and where levers for reform may be found. For example, the findings invite scrutiny of how employers and businesses within supply chains profit from wage theft and gain advantage over others that pay workers in compliance with Australian labour law. At the least, this report highlights the responsibilities of employers, franchisors and businesses at the peak of supply chains to employ effective methods to detect wage theft in the knowledge that it is widespread. It also presents confronting data for educational institutions regarding their international students, and raises questions as to the support services those institutions should provide. Finally, the findings raise challenging questions regarding the benefits that consumers may derive from wage theft in the form of lower-priced food, goods and services -- questions which have yet to receive sustained attention in Australia.
7 For the purpose of this report, exploitation means an employer’s use of workplace practices that are coercive, criminal, or constitute serious breaches of Australian labour law, in order to benefit the employer.
8 The forthcoming 2018 report on temporary migrants’ access to justice in Australia will present data from the survey on the exceptionally low rates of complaints among participants who were underpaid.
10
About the survey
The National Temporary Migrant Work Survey was an online survey conducted by Laurie Berg (UTS), Bassina Farbenblum (UNSW) and Stephen Clibborn (University of Sydney) between September and December 2016. It yielded 4,322 valid responses.9 The survey was anonymous and was open to any individual who had worked in Australia on a temporary visa. It was available in twelve languages in addition to English.10 Each translation was checked by a different native speaker of that language, however it remains possible that certain words or phrases may have been understood differently in different languages.
The survey contained 32 multiple choice questions, in addition to a number of follow-up questions. A small number of questions allowed open answers, mostly where respondents selected “Other” among multiple choice options.
There were four sets of questions in the survey, on which this report is based:
1. Participants’ personal characteristics including nationality, year of arrival and gender.
2. Features of participants’ lowest paid job in Australia, including their hourly rate of pay in that job, type of job, visa while in that job (and for students, name of educational institution), average weekly hours, method of finding the job, geographic location of that job, whether they were paid by cash or bank transfer and whether they received pay slips.
3. Participants’ experience of some other indicators of exploitation, at any stage during their time in Australia. These include payments for the job up-front, passport confiscation, payment of cash back to an employer, and immigration-reporting threats.
4. Participants’ knowledge and perceptions, such as their knowledge of the minimum wage and their perception of the proportion of people on their visa who are underpaid.
The survey also included several questions on participants’ experience in Australia generally, as well as their access to remedies for underpayment, which will be covered in a future report.
There were two reasons why questions on features of employment focused on participants’ lowest paid job. First, it was necessary to confine questions about different aspects of employment to a single job in order to analyse the extent to which those factors coincide under different employment circumstances. Second, the survey focused on participants’ lowest paid job (as opposed to any job) in order to enable analysis of the largest possible dataset on features of poorly paid jobs in which temporary migrants work, and the factors that coincide with underpayment. As a result, the survey presents participants’ worst experiences in Australia and does not capture participants’ other experiences which might have been more positive for some.
9 All analysis in this report includes valid responses only and has been conducted using SPSS V23 and V24.
10 The survey was available in Arabic, Bahasa Indonesia, Chinese (Traditional), Chinese (Simplified), French, German, Italian, Japanese, Korean, Nepali, Spanish and Vietnamese.
11
Method
The survey was publicly available on a website hosted by the University of Sydney.11 Before commencing the survey, participants were provided with information about the survey and how their data would be used to which they could notify consent through their participation.12 Participants were free to stop the survey at any time. As some participants exited the survey at different points before the end, the number of respondents varied between questions. In addition, some follow-up questions were only shown to participants who selected particular responses. The number of valid responses for each analysis is set out in Annex 3.
After completing the survey, participants were invited to enter a separate prize draw to win a $500 voucher or one of ten $100 vouchers from Amazon.com. They were asked for their phone number for the purpose of advising winners of the prizes. As these two components were separate there was no way to connect the phone number provided in the prize survey with answers provided to the temporary work survey which remained strictly anonymous.
Participants were recruited through various channels including emails, social media, websites and flyers/posters at various locations and events. Social media recruitment included regular posting on a range of nationality-based, location-based, visa category-based and other Facebook groups, as well as a dedicated Facebook page for the survey. Email distribution was conducted through a range of organisations, educational institutions, unions, consulates and individuals throughout Australia (see Acknowledgements). The survey also received coverage, with a link, via a number of news outlets.
The survey has a number of methodological limitations. Because the survey was anonymous it is not possible to know whether any participant completed the survey more than once from different devices. It is also not possible to verify the accuracy of information provided by participants. However, there were not strong incentives for participants to provide inaccurate information or to repeat the survey multiple times; if this occurred it is likely to have involved only a small number of participants.
A further limitation may have arisen from a key method of distribution of the survey. Heavy reliance on promotion through social media may have contributed to underrepresentation of temporary migrants who are less likely to access Australia-based social media groups or are less networked in Australia in general. This includes seasonal workers, asylum seekers on Bridging visas and unauthorised workers (for instance on tourist visas). However it is also possible that these groups did not participate for other reasons such as lack of trust or greater fear of negative consequences of participation, despite the assurance of anonymity. The authors sought to mitigate potential lack of trust through safeguarding participants’ anonymity. Concerns about weak English-language skills were mitigated by translating the survey into twelve languages commonly spoken by temporary migrants in Australia, though this did not cover all languages spoken by potential participants.
It is also possible that more of those who were willing to participate were temporary migrants who had a desire to share information on poor workplace experiences. The authors sought to limit this possibility by offering a number of substantial prizes to create a different incentive for participation among a broader group. At the same time, it is possible that the participants earning lower wages were more likely than higher income earners to be motivated to complete the survey by the possibility of receiving prizes. Finally, there was an over-representation among participants of international students at UNSW (and to a lesser degree UTS). This is likely to be a result of particularly effective institutional survey dissemination and potentially greater participant trust in or identification with the authors because of their affiliation with those institutions.
Taking these considerations into account, the authors determined that the survey and selected distribution methods remained the most effective way to access large numbers of diverse temporary migrants within populations that have historically been difficult to reach.
11 The survey was provided on the Qualtrics platform.
12 Ethics approval for this research was obtained from UTS Human Research Ethics Committee (ETH 16-0381) which was shared with UNSW Human Research Ethics and Compliance and University of Sydney Human Research Ethics Committee.
12
Section II: Demographic profile of survey participants
The survey was undertaken by 4,322 participants who indicated that they had worked in Australia on a temporary visa. Participants were asked their gender, nationality and year of arrival in Australia. They were also asked which visa they held while working in their lowest paid job in Australia. Those who indicated they were students were also asked to identify the educational institution where they were studying at that time. As this Section reflects, the overwhelming majority of participants were international students and Working Holiday Makers in their lowest paid job, and they arrived fairly recently in Australia. Participants came from 107 countries across every region of the world.
Visa cohorts
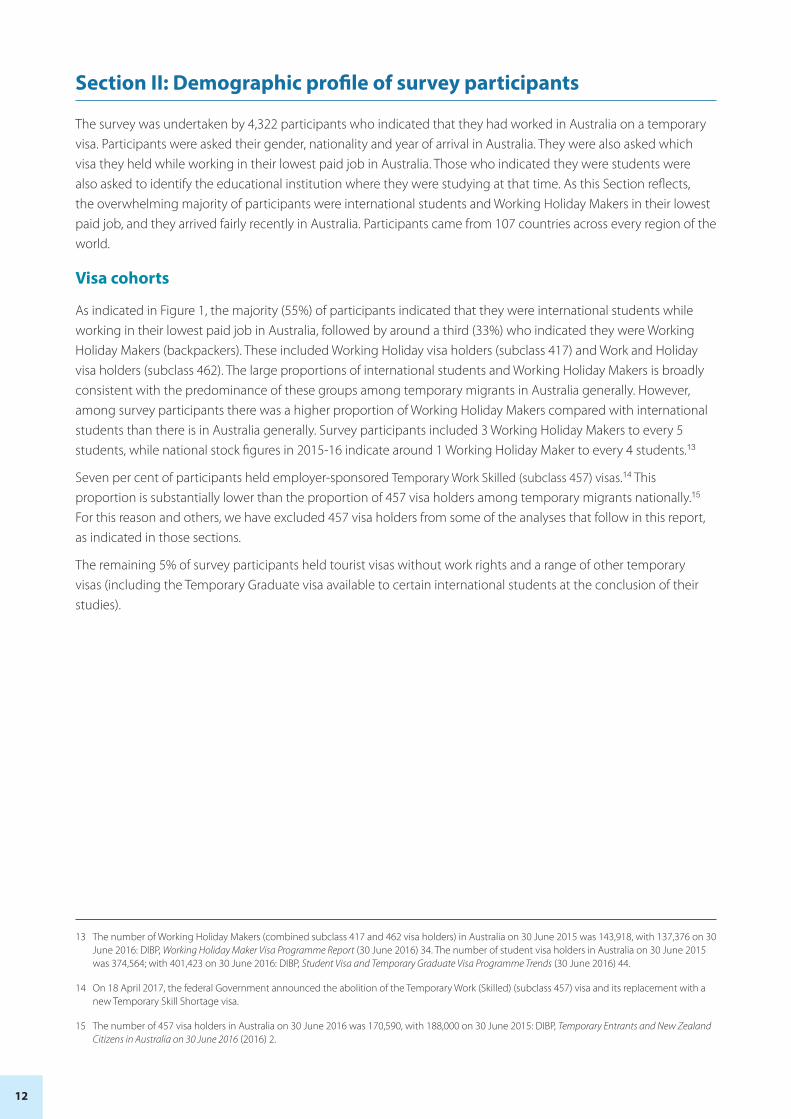
As indicated in Figure 1, the majority (55%) of participants indicated that they were international students while working in their lowest paid job in Australia, followed by around a third (33%) who indicated they were Working Holiday Makers (backpackers). These included Working Holiday visa holders (subclass 417) and Work and Holiday visa holders (subclass 462). The large proportions of international students and Working Holiday Makers is broadly consistent with the predominance of these groups among temporary migrants in Australia generally. However, among survey participants there was a higher proportion of Working Holiday Makers compared with international students than there is in Australia generally. Survey participants included 3 Working Holiday Makers to every 5 students, while national stock figures in 2015-16 indicate around 1 Working Holiday Maker to every 4 students.13
Seven per cent of participants held employer-sponsored Temporary Work Skilled (subclass 457) visas.14 This proportion is substantially lower than the proportion of 457 visa holders among temporary migrants nationally.15 For this reason and others, we have excluded 457 visa holders from some of the analyses that follow in this report, as indicated in those sections.
The remaining 5% of survey participants held tourist visas without work rights and a range of other temporary visas (including the Temporary Graduate visa available to certain international students at the conclusion of their studies).
13 The number of Working Holiday Makers (combined subclass 417 and 462 visa holders) in Australia on 30 June 2015 was 143,918, with 137,376 on 30 June 2016: DIBP, Working Holiday Maker Visa Programme Report (30 June 2016) 34. The number of student visa holders in Australia on 30 June 2015 was 374,564; with 401,423 on 30 June 2016: DIBP, Student Visa and Temporary Graduate Visa Programme Trends (30 June 2016) 44.
14 On 18 April 2017, the federal Government announced the abolition of the Temporary Work (Skilled) (subclass 457) visa and its replacement with a new Temporary Skill Shortage visa.
15 The number of 457 visa holders in Australia on 30 June 2016 was 170,590, with 188,000 on 30 June 2015: DIBP, Temporary Entrants and New Zealand Citizens in Australia on 30 June 2016 (2016) 2.
13
Figure 1. Visa held by participants during their lowest paid job
457 Visa7%
Other4%
Tourist Visa1%
Working Holiday Visa
33%
Student Visa55%
Table 1. Number of participants in each visa category
Visa category Number of survey participants
Proportion of survey participants
Student visas16 2,392 55%
Working Holiday Makers
(Working Holiday (417) visa and
Work and Holiday (462) visa)
1,440 33%
Skilled temporary work visa (457 visa) 301 7%
Tourist visa 34 1%
Other17 155 4%
Total 4,322 100%
16 Participants who indicated that they held a student visa may have held a secondary visa, as partners of international students and not themselves enrolled in an educational course in Australia.
17 These included the Temporary Graduate (subclass 485) visa, Occupational Trainee (subclass 442) visa, Partner (subclasses 820 or 309) visas, Prospective Marriage (subclass 300) visa, Temporary Work (International Relations) (subclass 403) visa, Special Program visa for the seasonal worker programme (subclass 416), Skilled Independent (subclass 189) visa, Australian Diplomatic (subclass 995) visa, Religious Worker (subclass 428) visa, Parent (subclass 103) visa, Temporary Protection (subclass 785) visa, and Special Category (subclass 444) visa for New Zealand citizens.
14
Students’ educational institution
Those participants who indicated that they held a student visa while working in their lowest paid job were asked the name of their educational institution at that time. Their open responses were coded as either universities or non-tertiary colleges. Colleges include vocational institutions (VET) and English language colleges (ELICOS).
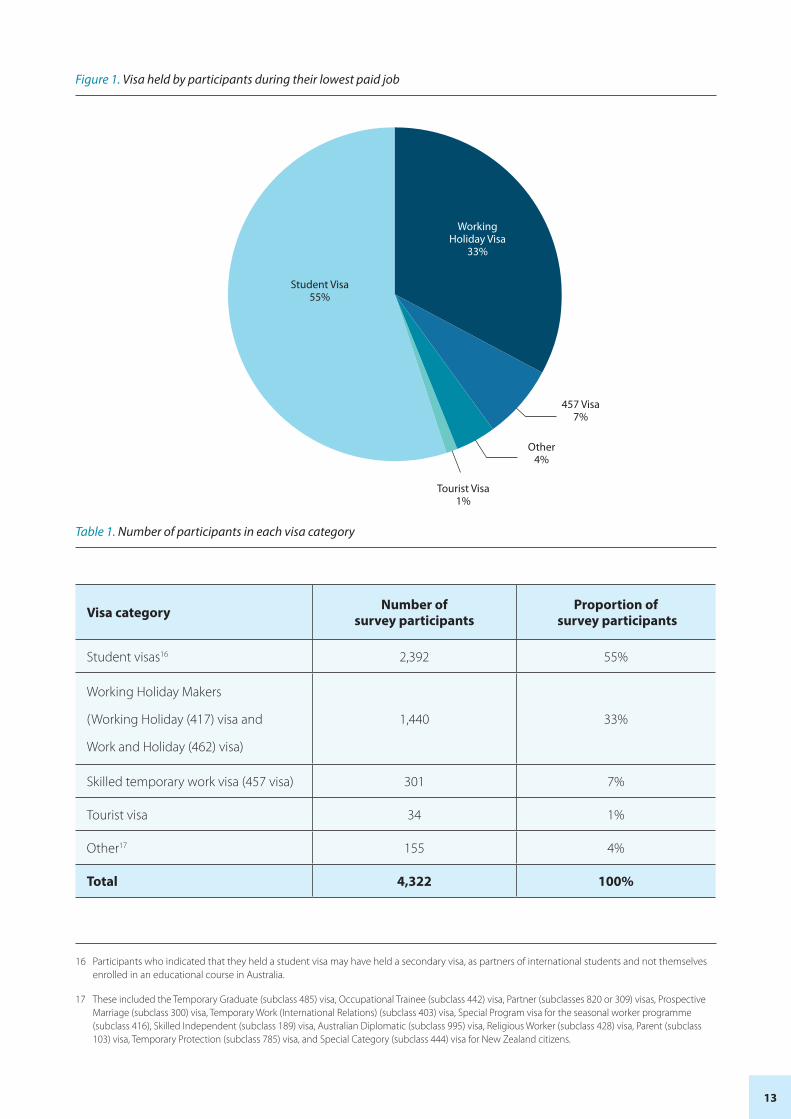
Among international students, three quarters (77%) indicated that they were enrolled at a university while working in their lowest paid job, as shown in Figure 2. They were primarily studying at universities in New South Wales, with 738 who were students at UNSW and 314 who were students at UTS when working in their lowest paid job.
One quarter of international students (23%) were studying at vocational or English language colleges. In contrast to a number of universities and individual faculties, no colleges agreed to the authors’ request to distribute the survey to their students. As a result, these students were more difficult to reach and were likely made aware of the survey through social media and other social or community contacts.
The proportion of university students to college students was substantially higher than the national figures, which indicate there is a larger proportion of international student enrolments in college courses compared with university courses.18 Nevertheless, the survey data on work experiences of 523 college students is by far the largest sample of data from this student body which is notoriously difficult to reach, and which was not covered by the two previous large-scale studies on working conditions of international students in Australia, which included only university students.19
Figure 2. International student participants’ type of educational institution
College23% (523)
University77% (1705)
18 In 2016, 43% of international student enrolments were at universities, 47% were at VET or ELICOS institutions and the rest were at secondary schools or non-award students: Department of Education and Training, End of Year Summary of International Student Enrolment Data - Australia - 2016 (December 2016). National figures may not, however, reflect absolute numbers of students as college students may enrol in multiple courses, which university students would be less likely to do.
19 Chris Nyland, Helen Forbes Mewett, Simon Marginson, Gaby Ramia, Erlenawati Sawir and Sharon Smith, ‘International Student-workers in Australia: A new vulnerable workforce’ (2009) 22(1) Journal of Education and Work 1; Stephen Clibborn, ‘7-Eleven: Amnesty Must Apply To All Exploited Workers’ The Sydney Morning Herald, 9 September 2015.
15
Year of arrival
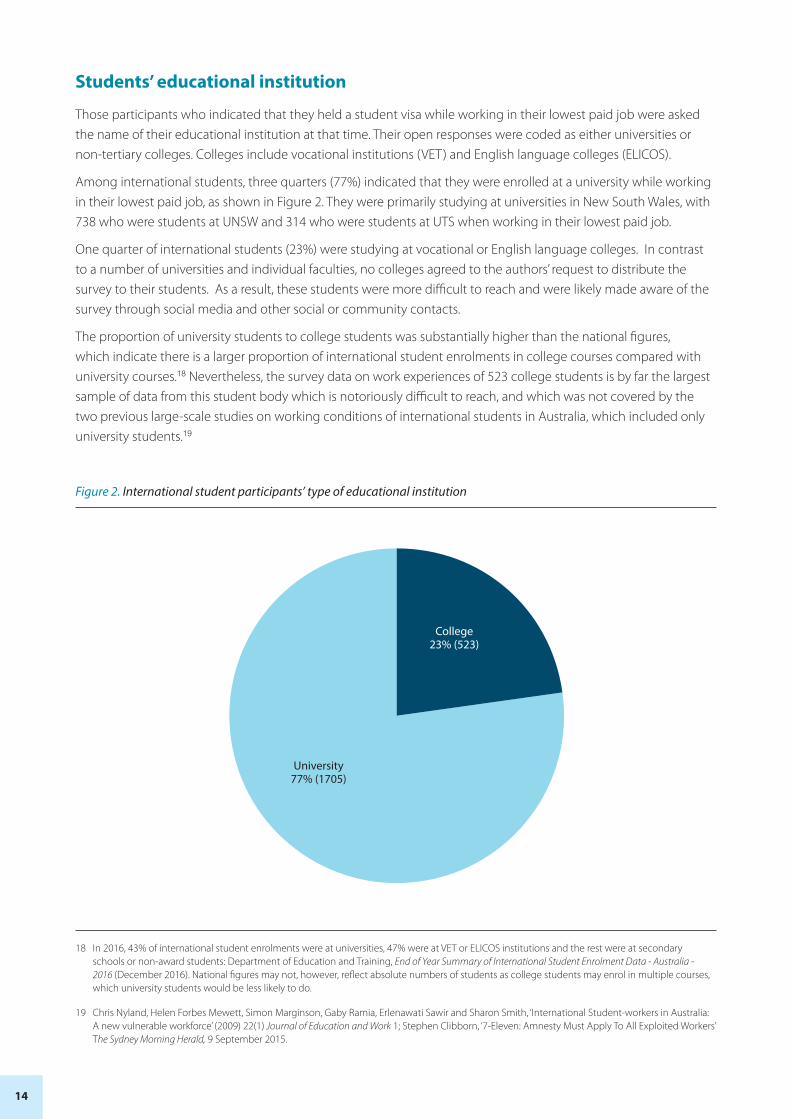
The vast majority of survey participants arrived in Australia relatively recently, with 69% having arrived since 2014 and 85% since 2012 (Figure 3). Participants’ experiences, therefore, likely broadly reflect current conditions, although there may have been some changes in recent years. Since former temporary migrants may have undertaken the survey after returning home, data is not available on period of time spent in Australia at the time of their lowest paid job or overall.
Figure 3. Participants’ year of arrival in Australia
31%
23%
15%
9%
7%
3%2%2%2%1% 1%1%0%0%0%0%1%
2000 2001 2002 2003 2004 2005 2006 2007 2008 2009 2010 2011 2012 2013 2014 2015 2016
The survey data on work experiences of 523 vocational and English-language college students is the largest sample ever collected from this group.
16
Nationality
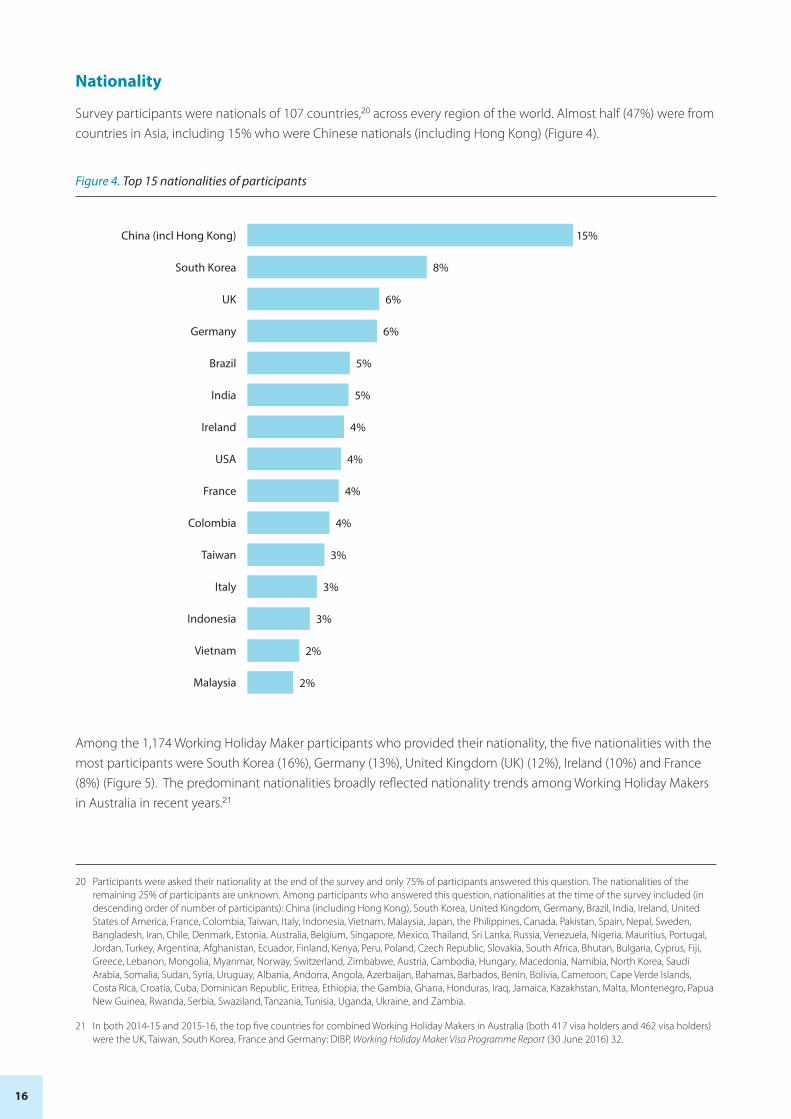
Survey participants were nationals of 107 countries,20 across every region of the world. Almost half (47%) were from countries in Asia, including 15% who were Chinese nationals (including Hong Kong) (Figure 4).
Figure 4. Top 15 nationalities of participants
China (incl Hong Kong)
South Korea
UK
Germany
Brazil
India
Ireland
USA
France
Colombia
Taiwan
Italy
Indonesia
Vietnam
Malaysia
15%
8%
6%
6%
5%
5%
4%
4%
4%
4%
3%
3%
3%
2%
2%
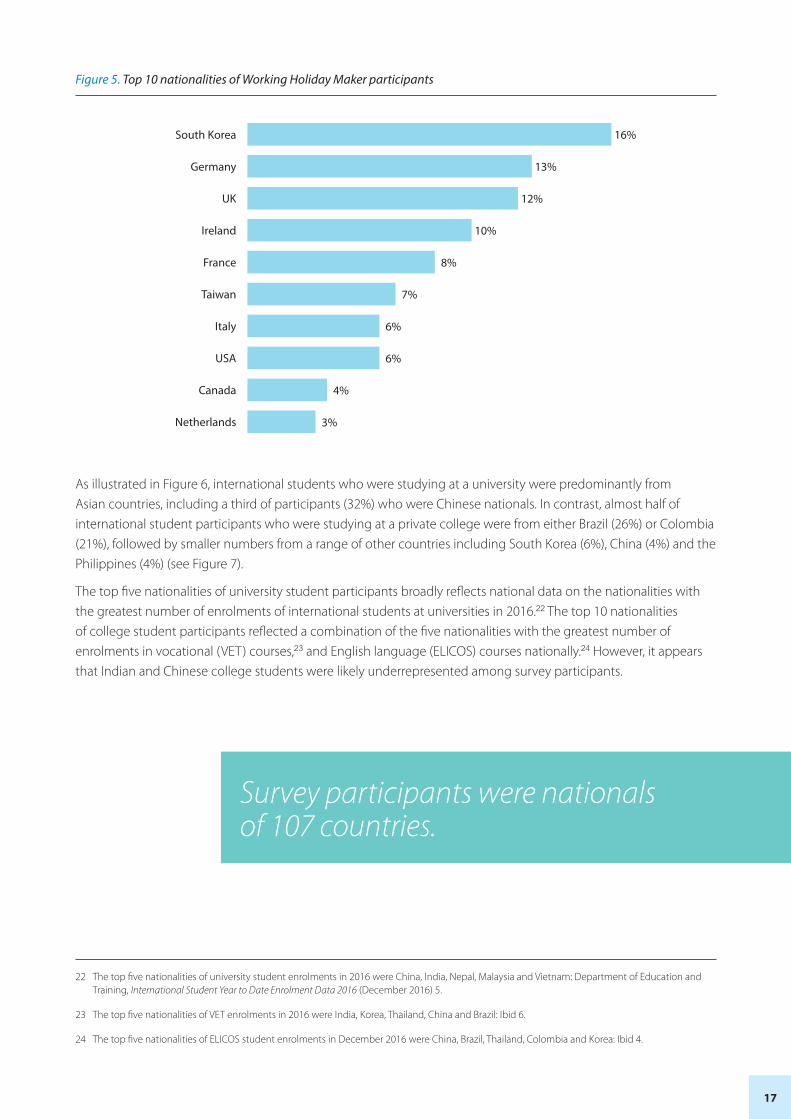
Among the 1,174 Working Holiday Maker participants who provided their nationality, the five nationalities with the most participants were South Korea (16%), Germany (13%), United Kingdom (UK) (12%), Ireland (10%) and France (8%) (Figure 5). The predominant nationalities broadly reflected nationality trends among Working Holiday Makers in Australia in recent years.21
20 Participants were asked their nationality at the end of the survey and only 75% of participants answered this question. The nationalities of the remaining 25% of participants are unknown. Among participants who answered this question, nationalities at the time of the survey included (in descending order of number of participants): China (including Hong Kong), South Korea, United Kingdom, Germany, Brazil, India, Ireland, United States of America, France, Colombia, Taiwan, Italy, Indonesia, Vietnam, Malaysia, Japan, the Philippines, Canada, Pakistan, Spain, Nepal, Sweden, Bangladesh, Iran, Chile, Denmark, Estonia, Australia, Belgium, Singapore, Mexico, Thailand, Sri Lanka, Russia, Venezuela, Nigeria, Mauritius, Portugal, Jordan, Turkey, Argentina, Afghanistan, Ecuador, Finland, Kenya, Peru, Poland, Czech Republic, Slovakia, South Africa, Bhutan, Bulgaria, Cyprus, Fiji, Greece, Lebanon, Mongolia, Myanmar, Norway, Switzerland, Zimbabwe, Austria, Cambodia, Hungary, Macedonia, Namibia, North Korea, Saudi Arabia, Somalia, Sudan, Syria, Uruguay, Albania, Andorra, Angola, Azerbaijan, Bahamas, Barbados, Benin, Bolivia, Cameroon, Cape Verde Islands, Costa Rica, Croatia, Cuba, Dominican Republic, Eritrea, Ethiopia, the Gambia, Ghana, Honduras, Iraq, Jamaica, Kazakhstan, Malta, Montenegro, Papua New Guinea, Rwanda, Serbia, Swaziland, Tanzania, Tunisia, Uganda, Ukraine, and Zambia.
21 In both 2014-15 and 2015-16, the top five countries for combined Working Holiday Makers in Australia (both 417 visa holders and 462 visa holders) were the UK, Taiwan, South Korea, France and Germany: DIBP, Working Holiday Maker Visa Programme Report (30 June 2016) 32.
17
Figure 5. Top 10 nationalities of Working Holiday Maker participants
South Korea
Germany
UK
Ireland
France
Taiwan
Italy
USA
Canada
Netherlands
16%
13%
12%
10%
8%
7%
6%
6%
4%
3%
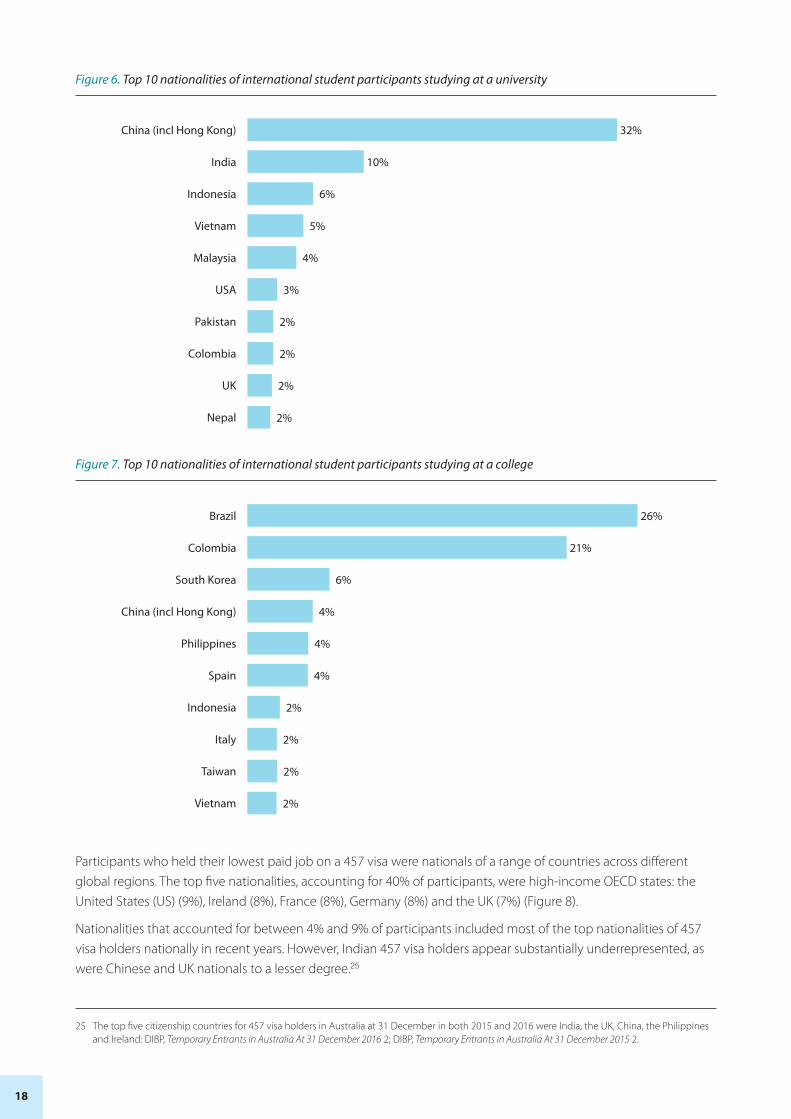
As illustrated in Figure 6, international students who were studying at a university were predominantly from Asian countries, including a third of participants (32%) who were Chinese nationals. In contrast, almost half of international student participants who were studying at a private college were from either Brazil (26%) or Colombia (21%), followed by smaller numbers from a range of other countries including South Korea (6%), China (4%) and the Philippines (4%) (see Figure 7).
The top five nationalities of university student participants broadly reflects national data on the nationalities with the greatest number of enrolments of international students at universities in 2016.22 The top 10 nationalities of college student participants reflected a combination of the five nationalities with the greatest number of enrolments in vocational (VET) courses,23 and English language (ELICOS) courses nationally.24 However, it appears that Indian and Chinese college students were likely underrepresented among survey participants.
22 The top five nationalities of university student enrolments in 2016 were China, India, Nepal, Malaysia and Vietnam: Department of Education and Training, International Student Year to Date Enrolment Data 2016 (December 2016) 5.
23 The top five nationalities of VET enrolments in 2016 were India, Korea, Thailand, China and Brazil: Ibid 6.
24 The top five nationalities of ELICOS student enrolments in December 2016 were China, Brazil, Thailand, Colombia and Korea: Ibid 4.
Survey participants were nationals of 107 countries.
18
Figure 6. Top 10 nationalities of international student participants studying at a university
China (incl Hong Kong)
India
Indonesia
Vietnam
Malaysia
USA
Pakistan
Colombia
UK
Nepal
32%
10%
6%
5%
4%
3%
2%
2%
2%
2%
Figure 7. Top 10 nationalities of international student participants studying at a college
Brazil
Colombia
South Korea
China (incl Hong Kong)
Philippines
Spain
Indonesia
Italy
Taiwan
Vietnam
26%
21%
6%
4%
4%
4%
2%
2%
2%
2%
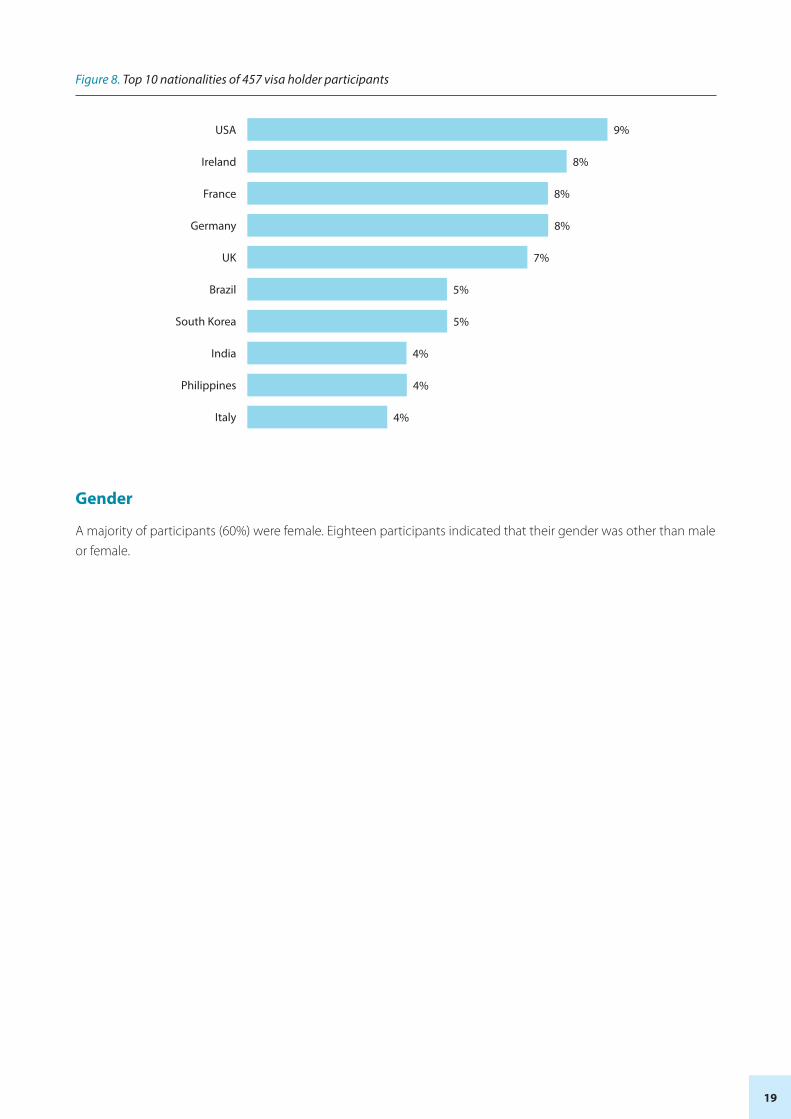
Participants who held their lowest paid job on a 457 visa were nationals of a range of countries across different global regions. The top five nationalities, accounting for 40% of participants, were high-income OECD states: the United States (US) (9%), Ireland (8%), France (8%), Germany (8%) and the UK (7%) (Figure 8).
Nationalities that accounted for between 4% and 9% of participants included most of the top nationalities of 457 visa holders nationally in recent years. However, Indian 457 visa holders appear substantially underrepresented, as were Chinese and UK nationals to a lesser degree.25
25 The top five citizenship countries for 457 visa holders in Australia at 31 December in both 2015 and 2016 were India, the UK, China, the Philippines and Ireland: DIBP, Temporary Entrants in Australia At 31 December 2016 2; DIBP, Temporary Entrants in Australia At 31 December 2015 2.
19
Figure 8. Top 10 nationalities of 457 visa holder participants
USA
Ireland
France
Germany
UK
Brazil
South Korea
India
Philippines
Italy
9%
8%
8%
8%
7%
5%
4%
5%
4%
4%
Gender
A majority of participants (60%) were female. Eighteen participants indicated that their gender was other than male or female.
20
Section III: Characteristics of low paid jobs undertaken by temporary migrants
Because participants are likely to have worked in more than one job in Australia, a portion of the survey related specifically to participants’ lowest paid job in Australia. This provides information on some of the poorest working conditions for temporary migrants as well as an opportunity to analyse the features of those poorly paid jobs and the factors that may correlate with underpayment.
This Section presents the industry, location and hours worked in participants’ lowest paid jobs. Sections IV, V and VII contain further analysis of participants’ pay and working conditions in those jobs and how they found those jobs.
Industry / job
Participants were asked to identify their lowest paid job. The survey presented participants with a number of simply described jobs commonly undertaken by temporary migrants as well an option for an open response for other jobs. Open responses were back-coded to existing categories or gathered into additional categories. This approach was adopted over formal industry and job classifications, or formal classifications in industrial Awards, to enable participants to better understand and accurately respond to the question, across 13 languages. As a result, the job descriptions are not legal terms or terms of art, and are assumed to have their meaning in everyday language.
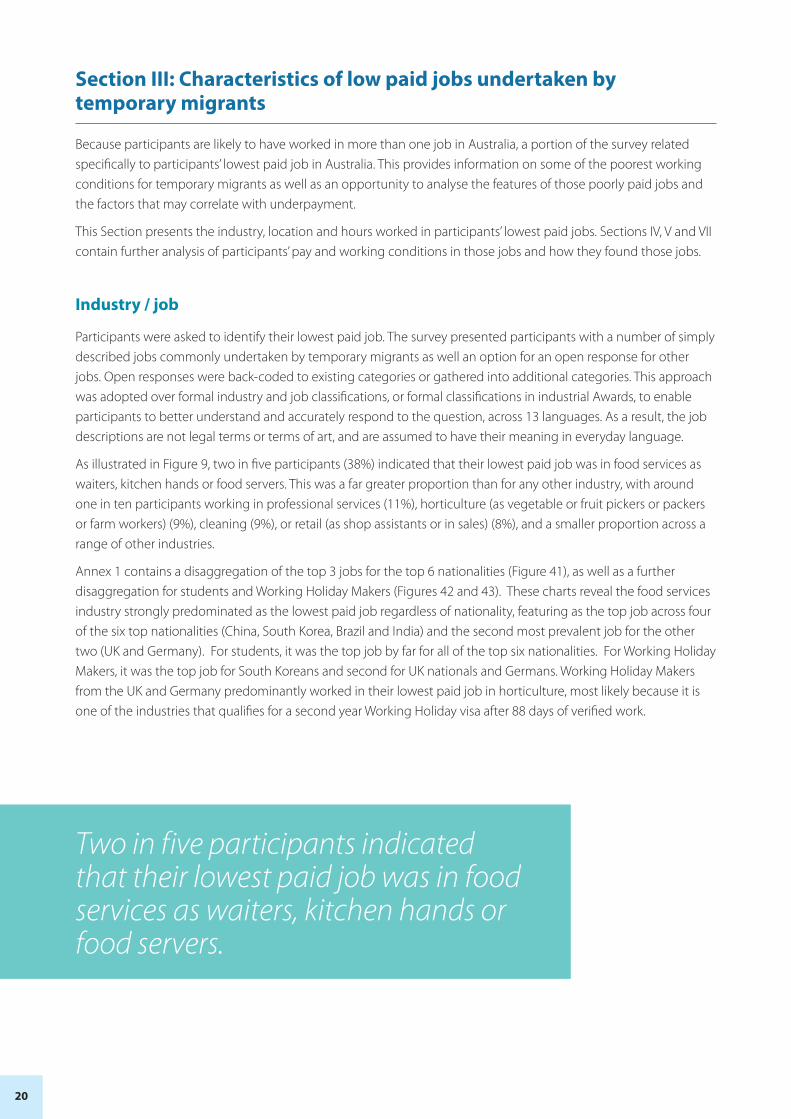
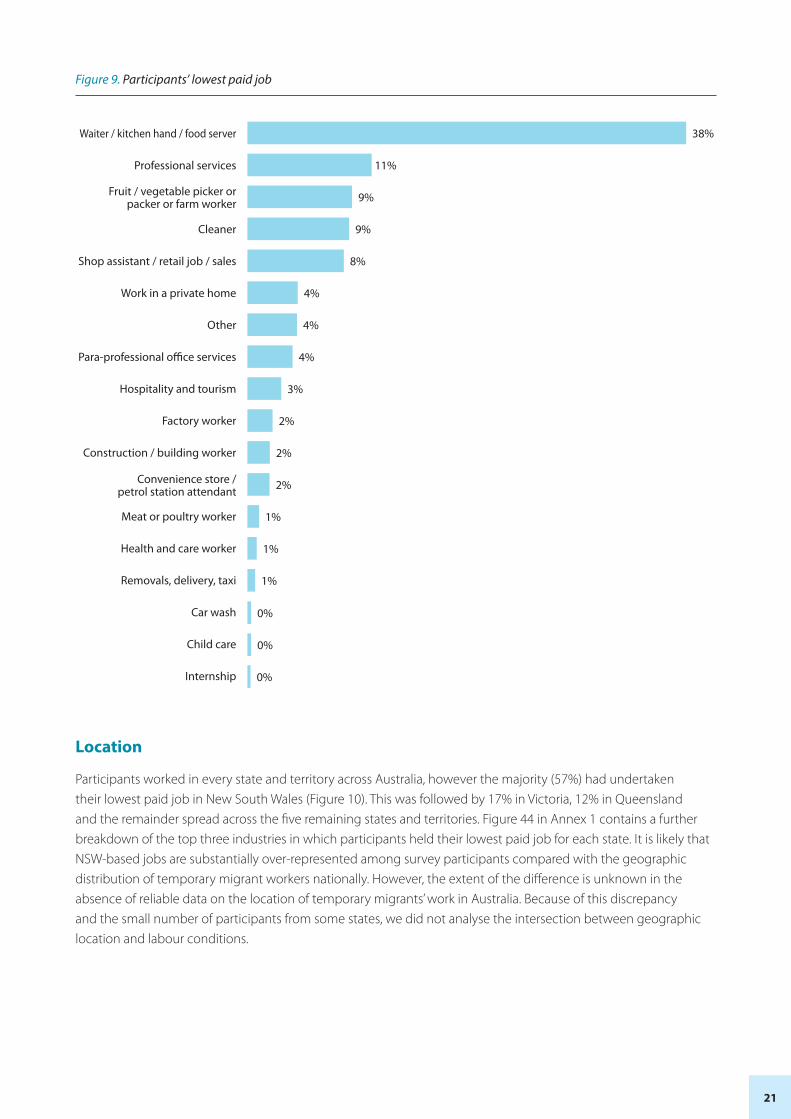
As illustrated in Figure 9, two in five participants (38%) indicated that their lowest paid job was in food services as waiters, kitchen hands or food servers. This was a far greater proportion than for any other industry, with around one in ten participants working in professional services (11%), horticulture (as vegetable or fruit pickers or packers or farm workers) (9%), cleaning (9%), or retail (as shop assistants or in sales) (8%), and a smaller proportion across a range of other industries.
Annex 1 contains a disaggregation of the top 3 jobs for the top 6 nationalities (Figure 41), as well as a further disaggregation for students and Working Holiday Makers (Figures 42 and 43). These charts reveal the food services industry strongly predominated as the lowest paid job regardless of nationality, featuring as the top job across four of the six top nationalities (China, South Korea, Brazil and India) and the second most prevalent job for the other two (UK and Germany). For students, it was the top job by far for all of the top six nationalities. For Working Holiday Makers, it was the top job for South Koreans and second for UK nationals and Germans. Working Holiday Makers from the UK and Germany predominantly worked in their lowest paid job in horticulture, most likely because it is one of the industries that qualifies for a second year Working Holiday visa after 88 days of verified work.
Two in five participants indicated that their lowest paid job was in food services as waiters, kitchen hands or food servers.
21
Figure 9. Participants’ lowest paid job
Waiter / kitchen hand / food server
Professional services
Cleaner
Shop assistant / retail job / sales
Work in a private home
Other
Para-professional office services
Hospitality and tourism
Factory worker
Construction / building worker
Meat or poultry worker
Health and care worker
Removals, delivery, taxi
Car wash
Child care
Internship
38%
11%
9%
9%
8%
4%
4%
4%
3%
2%
2%
2%
1%
0%
1%
0%
1%
0%
Fruit / vegetable picker or packer or farm worker
Convenience store / petrol station attendant
Location
Participants worked in every state and territory across Australia, however the majority (57%) had undertaken their lowest paid job in New South Wales (Figure 10). This was followed by 17% in Victoria, 12% in Queensland and the remainder spread across the five remaining states and territories. Figure 44 in Annex 1 contains a further breakdown of the top three industries in which participants held their lowest paid job for each state. It is likely that NSW-based jobs are substantially over-represented among survey participants compared with the geographic distribution of temporary migrant workers nationally. However, the extent of the difference is unknown in the absence of reliable data on the location of temporary migrants’ work in Australia. Because of this discrepancy and the small number of participants from some states, we did not analyse the intersection between geographic location and labour conditions.

22
Figure 10. State/territory in which participants worked in their lowest paid job
ACT
NSW
NT
QLD
SA
TAS
VIC
WA
4%, 129
57%, 1936
1%, 32
12%, 397
2%, 74
0.3%, 11
7%, 223
17%, 585
Weekly hours
Participants were asked how many hours they worked in an average week in their lowest paid job. For a substantial majority of temporary migrants, their worst paid job was not full-time employment (Figure 11). However, the overwhelming majority of temporary migrants worked a substantial number of hours in their lowest paid jobs. Almost two in five (37%) worked 21 hours per week or more and a further 45% worked between 9 and 20 hours per week. Less than one in five (18%) worked 8 hours or less per week.
Figure 11. Average hours worked per week in participants’ lowest paid job
8 hours or less 9-15 hours 16-20 hours 21 or more hours
18%
23% 22%
37%
These figures did not differ substantially based on participants’ hourly wage (see Figure 45, Annex 1). However there was a substantial difference between the reported work patterns of international students and Working Holiday Makers, as reflected in Figure 12. This indicates that Working Holiday Makers worked substantially more hours in an average week in their lowest paid job than international students. Almost three quarters (72%) of
23
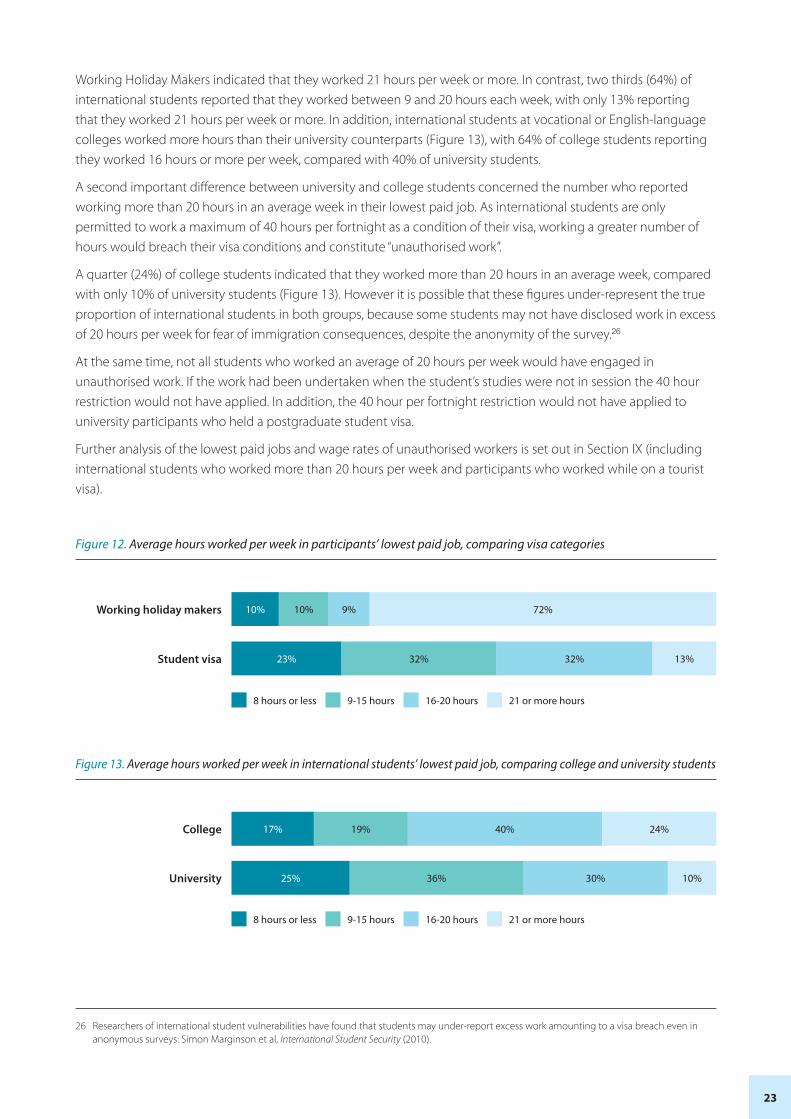
Working Holiday Makers indicated that they worked 21 hours per week or more. In contrast, two thirds (64%) of international students reported that they worked between 9 and 20 hours each week, with only 13% reporting that they worked 21 hours per week or more. In addition, international students at vocational or English-language colleges worked more hours than their university counterparts (Figure 13), with 64% of college students reporting they worked 16 hours or more per week, compared with 40% of university students.
A second important difference between university and college students concerned the number who reported working more than 20 hours in an average week in their lowest paid job. As international students are only permitted to work a maximum of 40 hours per fortnight as a condition of their visa, working a greater number of hours would breach their visa conditions and constitute “unauthorised work”.
A quarter (24%) of college students indicated that they worked more than 20 hours in an average week, compared with only 10% of university students (Figure 13). However it is possible that these figures under-represent the true proportion of international students in both groups, because some students may not have disclosed work in excess of 20 hours per week for fear of immigration consequences, despite the anonymity of the survey.26
At the same time, not all students who worked an average of 20 hours per week would have engaged in unauthorised work. If the work had been undertaken when the student’s studies were not in session the 40 hour restriction would not have applied. In addition, the 40 hour per fortnight restriction would not have applied to university participants who held a postgraduate student visa.
Further analysis of the lowest paid jobs and wage rates of unauthorised workers is set out in Section IX (including international students who worked more than 20 hours per week and participants who worked while on a tourist visa).
Figure 12. Average hours worked per week in participants’ lowest paid job, comparing visa categories
Working holiday makers 10% 10% 9% 72%
Student visa 23% 32% 32% 13%
8 hours or less 9-15 hours 16-20 hours 21 or more hours
Figure 13. Average hours worked per week in international students’ lowest paid job, comparing college and university students
College 17% 19% 40% 24%
University 25% 36% 30% 10%
8 hours or less 9-15 hours 16-20 hours 21 or more hours
26 Researchers of international student vulnerabilities have found that students may under-report excess work amounting to a visa breach even in anonymous surveys: Simon Marginson et al, International Student Security (2010).
24
Section IV: Underpayment among different groups of temporary migrants
Participants were asked how much they were paid per hour in their lowest paid job. Figure 14 indicates participants’ hourly wages grouped into several wage bands for ease of description.
Almost a third (30%) of participants earned $12 per hour or less. At least 46% earned $15 per hour or less.
How far below the legal wage were temporary migrants paid?
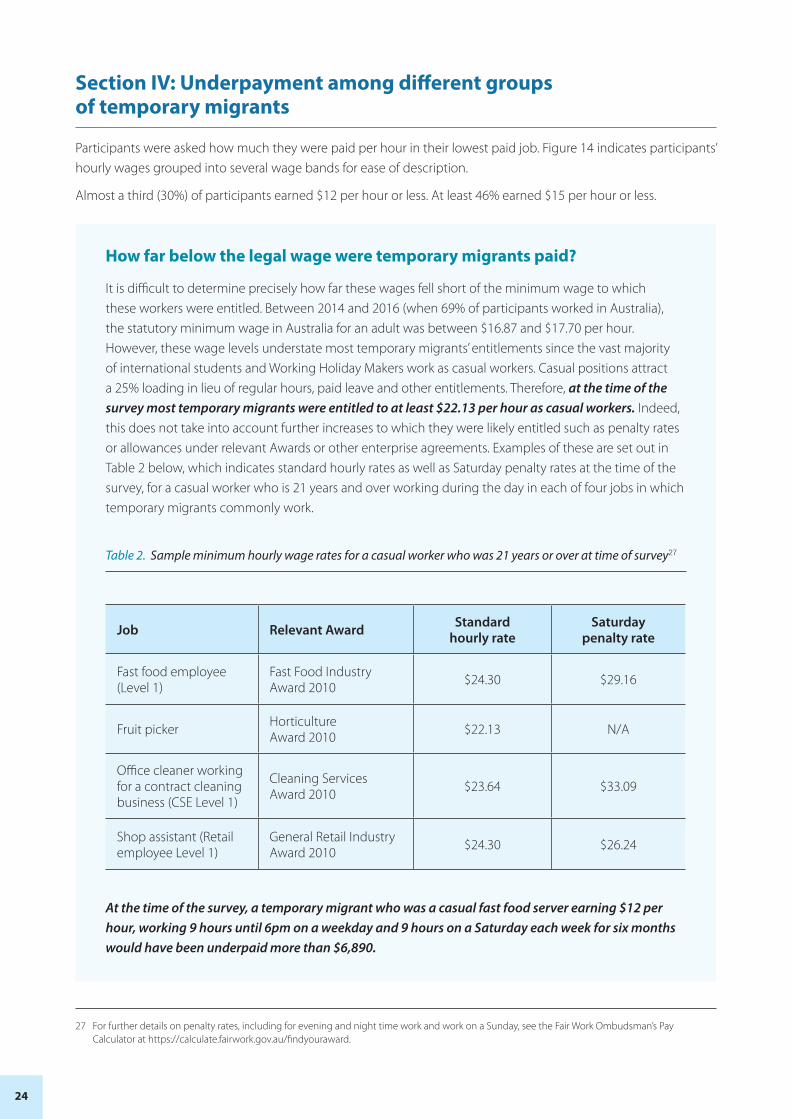
It is difficult to determine precisely how far these wages fell short of the minimum wage to which these workers were entitled. Between 2014 and 2016 (when 69% of participants worked in Australia), the statutory minimum wage in Australia for an adult was between $16.87 and $17.70 per hour. However, these wage levels understate most temporary migrants’ entitlements since the vast majority of international students and Working Holiday Makers work as casual workers. Casual positions attract a 25% loading in lieu of regular hours, paid leave and other entitlements. Therefore, at the time of the survey most temporary migrants were entitled to at least $22.13 per hour as casual workers. Indeed, this does not take into account further increases to which they were likely entitled such as penalty rates or allowances under relevant Awards or other enterprise agreements. Examples of these are set out in Table 2 below, which indicates standard hourly rates as well as Saturday penalty rates at the time of the survey, for a casual worker who is 21 years and over working during the day in each of four jobs in which temporary migrants commonly work.
Table 2. Sample minimum hourly wage rates for a casual worker who was 21 years or over at time of survey27
Job Relevant Award Standard hourly rate
Saturday penalty rate
Fast food employee (Level 1)
Fast Food Industry Award 2010 $24.30 $29.16
Fruit picker Horticulture Award 2010 $22.13 N/A
Office cleaner working for a contract cleaning business (CSE Level 1)
Cleaning Services Award 2010 $23.64 $33.09
Shop assistant (Retail employee Level 1)
General Retail Industry Award 2010 $24.30 $26.24
At the time of the survey, a temporary migrant who was a casual fast food server earning $12 per hour, working 9 hours until 6pm on a weekday and 9 hours on a Saturday each week for six months would have been underpaid more than $6,890.
27 For further details on penalty rates, including for evening and night time work and work on a Sunday, see the Fair Work Ombudsman’s Pay Calculator at https://calculate.fairwork.gov.au/findyouraward.

25
The results in this Section do not include participants on skilled 457 visas because they typically hold salaried positions rather than receiving hourly rates. Employer sponsors of 457 visa holders are required to meet a minimum income level, known as the Temporary Skilled Migration Income Threshold (TSMIT), which was $53,900 at the time of survey. Sponsors must also provide evidence that the salary is in accordance with market rates for the position. Although reports of underpayment of 457 visa holders are not uncommon, as Figure 15 below reveals, they were overall far more likely to work in a higher wage bracket than other temporary visa holders and inclusion of their data would mask the extent of underpayment of other temporary migrants.
Figure 14. Hourly wage rates in participants’ lowest paid job (excluding 457 visa holders)
$0-5 $6-10 $10-12 $15-17$13-15 $18+
3%
10%
17%
15%16%
38%
Almost a third (30%) of participants earned $12 per hour or less. At least 46% earned $15 per hour or less.

26
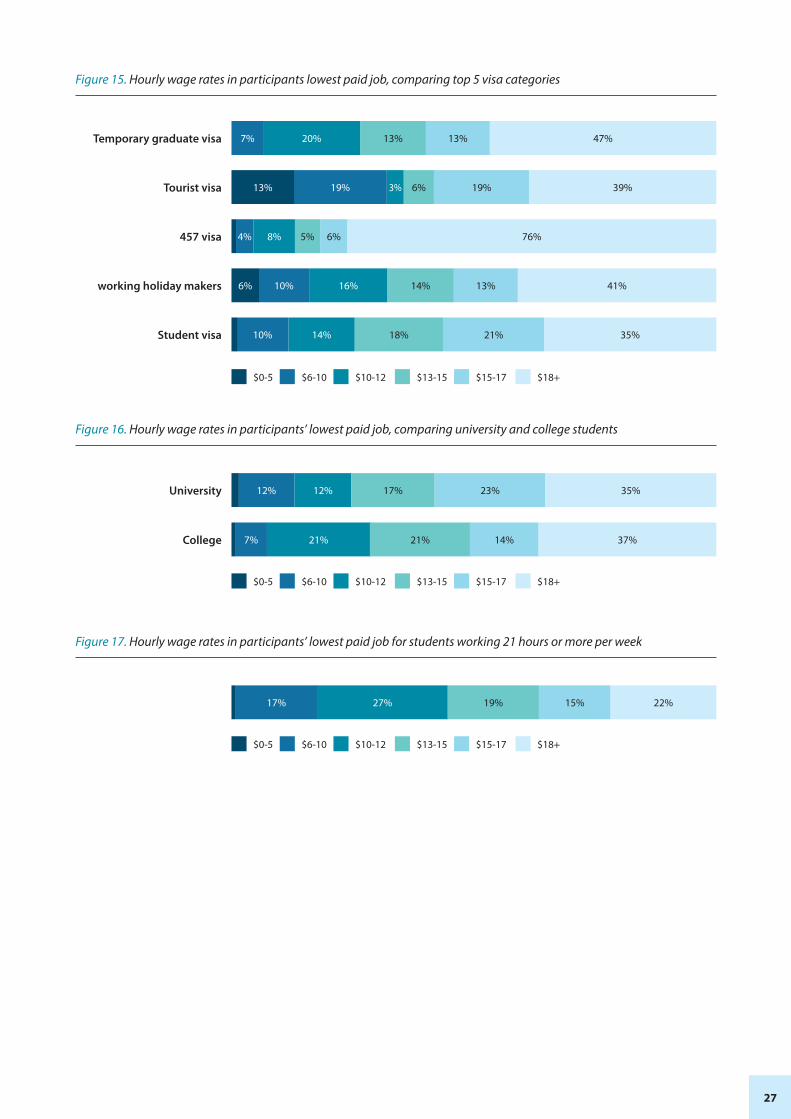
Wage rates by visa category
A quarter (25%) of all international students earned $12 per hour or less in their lowest paid job.
A third (32%) of all Working Holiday Makers earned $12 per hour or less in their lowest paid job.
A third (32%) of unauthorised workers on tourist visas earned $10 per hour or less in their lowest paid job (Figure 15).
University students did not earn substantially higher wages than students at vocational and English language colleges (Figure 16). Forty nine per cent of college students earned $15 per hour or less, compared with 42% of university students, however 7% of college students earned $10 per hour or less, compared with 13% of university students.
However, students who worked 21 hours or more per week earned substantially lower wages than other students (Figure 17). These students potentially worked in breach of their visa conditions (see discussion under Weekly Hours in Section III and in Section IX on Unauthorised Work). Among all students who worked 21 hours per week or more, 45% earned $12 per hour or less - almost double the proportion within the general student population (25%). Almost a fifth (18%) earned $10 per hour or less, compared with 11% of students overall.
University students did not earn substantially higher wages than students at vocational and English language colleges.
27
Figure 15. Hourly wage rates in participants lowest paid job, comparing top 5 visa categories
Temporary graduate visa 20% 13% 13% 47%7%
Tourist visa 3% 6% 19% 39%19%13%
working holiday makers 16% 14% 13% 41%10%6%
Student visa 14% 18% 21% 35%10%
457 visa 8% 5% 6% 76%4%
$0-5 $6-10 $10-12 $13-15 $15-17 $18+
Figure 16. Hourly wage rates in participants’ lowest paid job, comparing university and college students
University 12% 17% 23% 35%12%
College 21% 21% 14% 37%7%
$0-5 $6-10 $10-12 $13-15 $15-17 $18+
Figure 17. Hourly wage rates in participants’ lowest paid job for students working 21 hours or more per week
27% 19% 15% 22%17%
$0-5 $6-10 $10-12 $13-15 $15-17 $18+
28
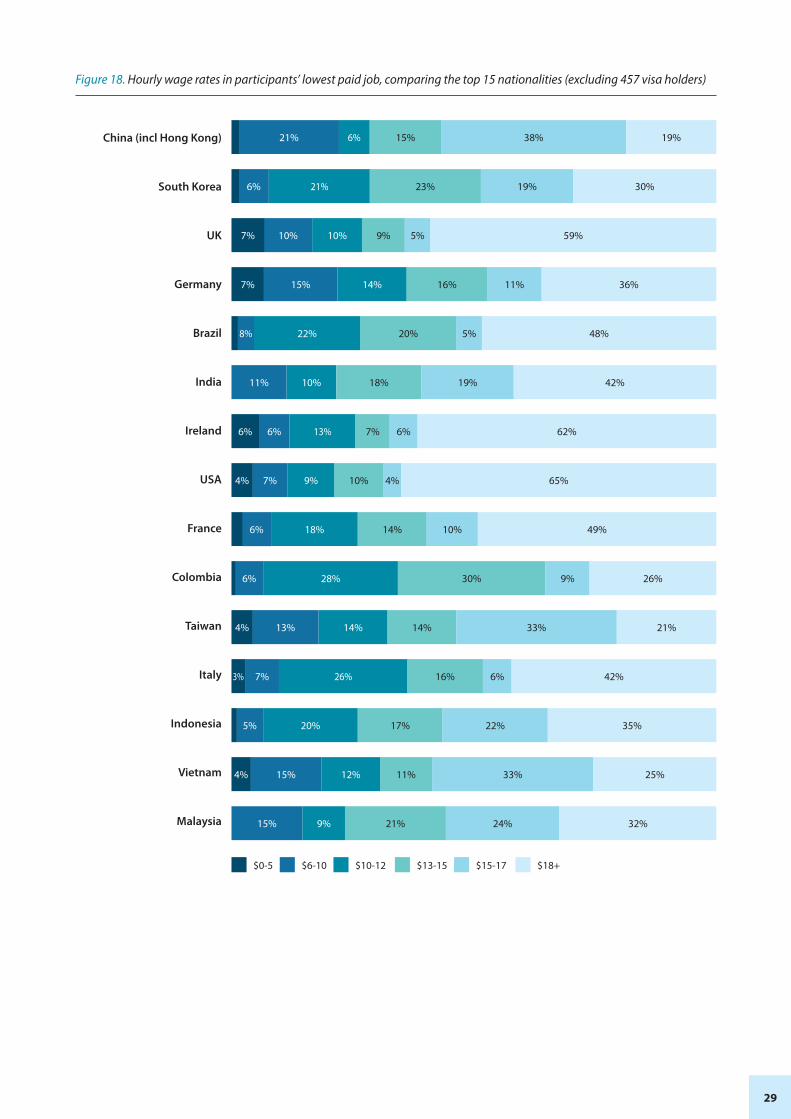
Wage rates by nationality
The most striking disparity between wages earned by participants of different nationalities was in the proportion of participants earning wages approaching the minimum casual hourly rate, as shown in Figure 18. Predominantly English-speaking countries (US, UK and Ireland) had the highest proportions of temporary migrants earning more than $17 per hour (65% of temporary migrants from the US, 62% from Ireland, and 59% from the UK). By contrast, several non-English speaking Asian countries had the lowest proportions of workers earning this wage rate (19% of Chinese temporary migrants, 21% of Taiwanese and 25% of Vietnamese).
Amongst those who were paid $17 per hour or less, wage patterns varied between nationalities. There were few clear discernible trends concerning the extent of underpayment and it is difficult to interpret these differences given the multiple visa classes within these cohorts. However, it is clear from Figure 18 that serious underpayment is not confined to any particular nationality or region, with at least a fifth of participants from every nationality earning $12 per hour or less.
At least a fifth of participants from every nationality earned $12 per hour or less.
29
Figure 18. Hourly wage rates in participants’ lowest paid job, comparing the top 15 nationalities (excluding 457 visa holders)
$0-5 $6-10 $10-12 $13-15 $15-17 $18+
10% 18% 19% 42%11%
26% 16% 6% 42%7%3%
13% 7% 6% 62%6%6%
6% 15% 38% 19%21%
12% 11% 33% 25%15%4%
18% 14% 10% 49%6%
14% 16% 11% 36%15%7%
28% 30% 9% 26%6%
14% 14% 33% 21%13%4%
22% 20% 5% 48%8%
20% 17% 22% 35%5%
9% 10% 4% 65%7%4%
10% 9% 5% 59%10%7%
China (incl Hong Kong)
South Korea
UK
Germany
Brazil
India
Ireland
USA
France
Colombia
Taiwan
Italy
Indonesia
Vietnam
Malaysia
21% 23% 19% 30%6%
9% 21% 24% 32%15%

30
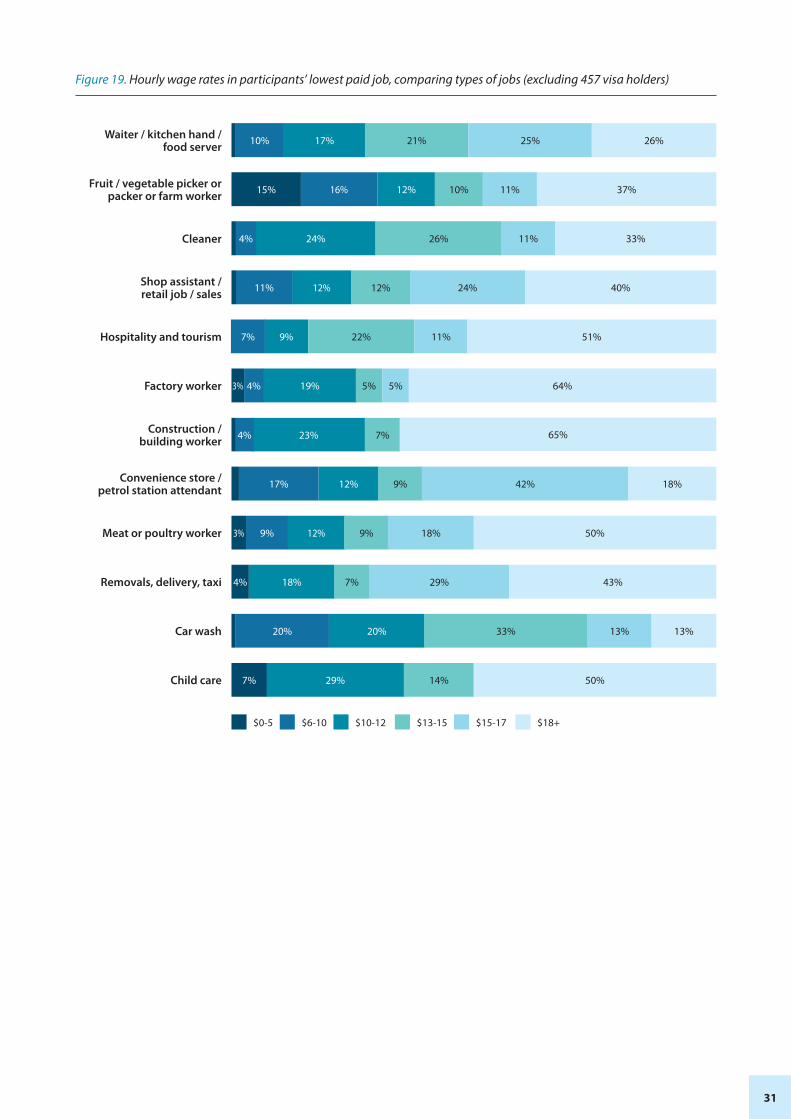
Wage rates by industry / job
Across at least 12 types of jobs in which temporary migrants commonly work, a substantial number of participants were paid well below minimum wage (Figure 19). This is the case regardless of whether the legal minimum is calculated at the national absolute minimum ($17.70 at the time of the survey), the absolute minimum rate for casual workers ($22.13 at the time of the survey), or the higher Award wages in various industries, indicated by the examples in Table 2.
Within the food services industry - in which the largest proportion of participants worked - over a quarter (28%) earned $12 per hour or less, and half (49%) earned $15 per hour or less. Among fruit and vegetable pickers, packers and farm workers, almost one in seven participants (15%) earned $5 per hour or less and almost a third (31%) earned $10 per hour or less.
Those who worked as cleaners and in retail also reported particularly low rates of pay. Among cleaners, over half (55%) received $15 per hour or less. Among participants who worked in retail, over a third (36%) received $15 per hour or less.
Although fewer participants worked in convenience stores/petrol stations and car washes, those who did reported especially low rates of pay, with a fifth of participants in both industries earning $10 per hour or less (19% and 20% respectively). Among the 66 participants who worked as a convenience store or petrol station attendant, the overwhelming majority (82%) were paid $17 per hour or less. Among the 15 participants who worked at a car wash, 87% were paid $17 per hour or less and two fifths (40%) were paid $12 per hour or less.
Across at least 12 types of jobs in which temporary migrants commonly work, a substantial number of participants were paid well below minimum wage.
31
Figure 19. Hourly wage rates in participants’ lowest paid job, comparing types of jobs (excluding 457 visa holders)
$0-5 $6-10 $10-12 $13-15 $15-17 $18+
17% 21% 25% 26%10%Waiter / kitchen hand / food server
23% 7% 65%4%Construction / building worker
12% 12% 24% 40%11%Shop assistant / retail job / sales
18% 7% 29% 43%4%Removals, delivery, taxi
12% 10% 11% 37%16%15%Fruit / vegetable picker or packer or farm worker
12% 9% 42% 18%17%Convenience store / petrol station attendant
20% 33% 13% 13%20%Car wash
12% 9% 18% 50%9%3%Meat or poultry worker
19% 5% 5% 64%4%3%Factory worker
29% 14% 50%7%Child care
24% 26% 11% 33%Cleaner 4%
Hospitality and tourism 9% 22% 11% 51%7%
32
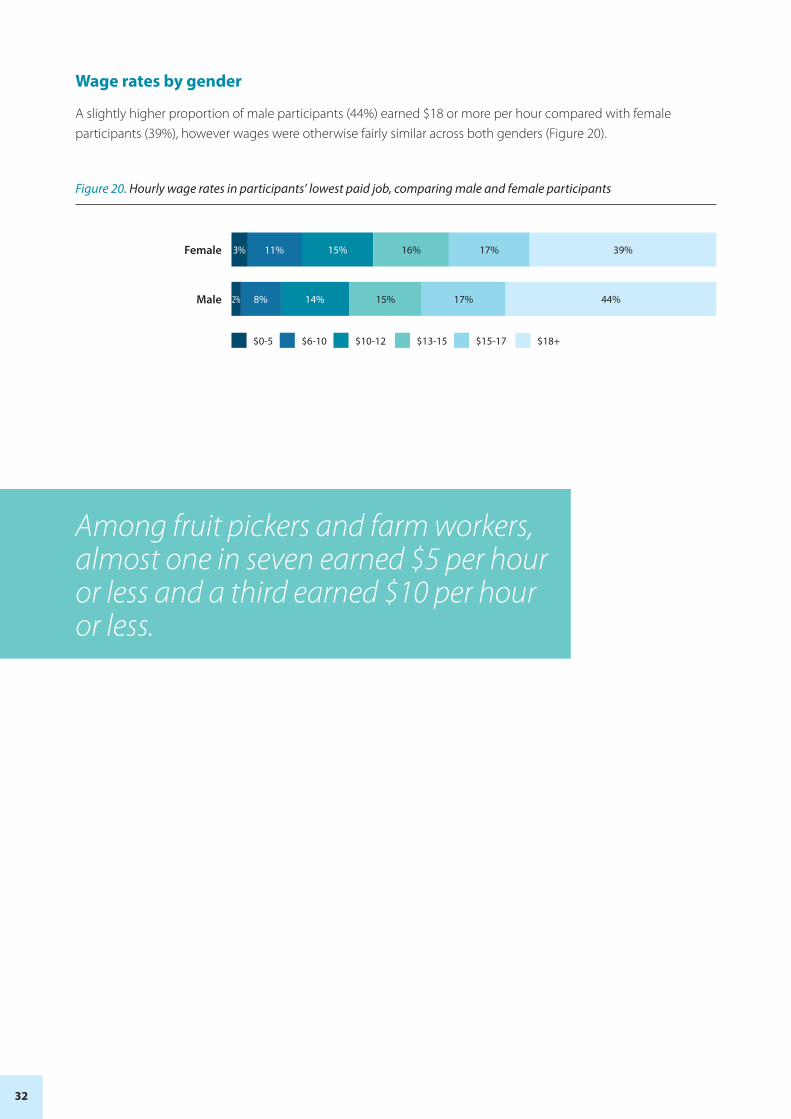
Wage rates by gender
A slightly higher proportion of male participants (44%) earned $18 or more per hour compared with female participants (39%), however wages were otherwise fairly similar across both genders (Figure 20).
Figure 20. Hourly wage rates in participants’ lowest paid job, comparing male and female participants
Female 15% 16% 17% 39%11%3%
Male 14% 15% 17% 44%8%2%
$0-5 $6-10 $10-12 $13-15 $15-17 $18+
Among fruit pickers and farm workers, almost one in seven earned $5 per hour or less and a third earned $10 per hour or less.

33
Section V: How temporary migrants find low paid jobs
The survey sought to identify how those participants who were paid particularly low rates in their lowest paid job found that job. As shown in Figure 21, among temporary migrants who earned between $6 and $12 per hour, close to a quarter (23%) found their job through a friend or family member. A further quarter of participants (24%) did so by contacting their employer directly, and 17% found their job on an English-language website such as Gumtree.
One in five participants (21%) who earned $6 to $12 per hour found their lowest paid job through an internet site in their own language. Korean nationals were most likely to find their job through this method, with 59% having done so. This was followed by almost half of Japanese nationals (48%), a third of Chinese nationals (33%), a third of Taiwanese nationals (32%) and a tenth of Vietnamese nationals (10%) (Figure 22).
Annex 2 contains further data on how temporary workers of different nationalities found jobs paying $12 per hour or less (Figure 46).
Figure 21. How participants earning $6-12 per hour found their lowest paid job
I contacted employer directly
A friend or family member
Internet site in my own language
Internet: English language site (eg Gumtree)
An agent in Australia
Advertisement in newspaper
An agent in my home country
Employer contacted me
Other
24%
23%
21%
17%
4%
3%
1%
2%
5%
Figure 22. Proportion of participants in each nationality who were paid $12 per hour or less and who found their lowest paid job through a website in their own language, for nationalities with at least 10% of participants finding their job in this way
South Korea
Japan
China (incl Hong Kong)
Taiwan
Vietnam
59%
48%
33%
32%
10%

34
Section VI: Temporary migrants’ perceptions of the minimum wage in Australia and prevalence of underpayment among peers
There are a number of widely held assumptions concerning why temporary migrants may accept unlawfully low wages. One view is that temporary migrants are not aware that they are being underpaid. Another is that they doubt that higher paying jobs are available to them and perceive that most temporary migrants in their situation are underpaid. This Section presents data from survey participants that relates to each theory.
Temporary migrants’ perception of the minimum wage in Australia
In order to obtain a rough indication of the extent to which particularly low paid temporary migrants are aware that they are being underpaid, the survey asked participants what they believed was the minimum legal hourly wage for their lowest paid job. Figure 23 presents data on the extent to which those who earned $15 or less per hour in their lowest paid job knew that the minimum wage was $16 per hour or higher. Because of the complexity of labour laws in Australia (see Section IV above), it was not practicable to determine participants’ precise minimum entitlements at the time of their lowest paid job or to compare their perception of minimum wage to their actual entitlements. The graphs in this Section therefore do not capture survey participants’ knowledge about their actual entitlements which were likely substantially higher than $16 per hour, and the extent to which they were underpaid.28
The vast majority of temporary migrants who earned $15 or less in their lowest paid job knew that the minimum wage was higher (Figure 23). This included around three quarters of international students (73%) and Working Holiday Makers (78%).
Perhaps counter-intuitively, among international students earning $15 per hour or less, 86% of those at vocational and English-language colleges were aware that the minimum wage was at least $16 per hour, compared with only 69% of those at universities (Figure 24).
Figure 23. Participants earning $15 per hour or less who knew the minimum wage in Australia is $16 per hour or more, comparing visa classes
Working holiday makers
Student visa
Tourist visa
78%
73%
50%
Figure 24. Proportion of college and university student participants earning $15 per hour or less who knew the minimum wage in Australia is $16 per hour or more
College
University
86%
69%
28 This data also likely underrepresents the proportion of temporary migrants who knew they were underpaid. It does not capture those who were paid less than $15 per hour and estimated the minimum wage at a rate higher than they were paid but less than $16 per hour.
35
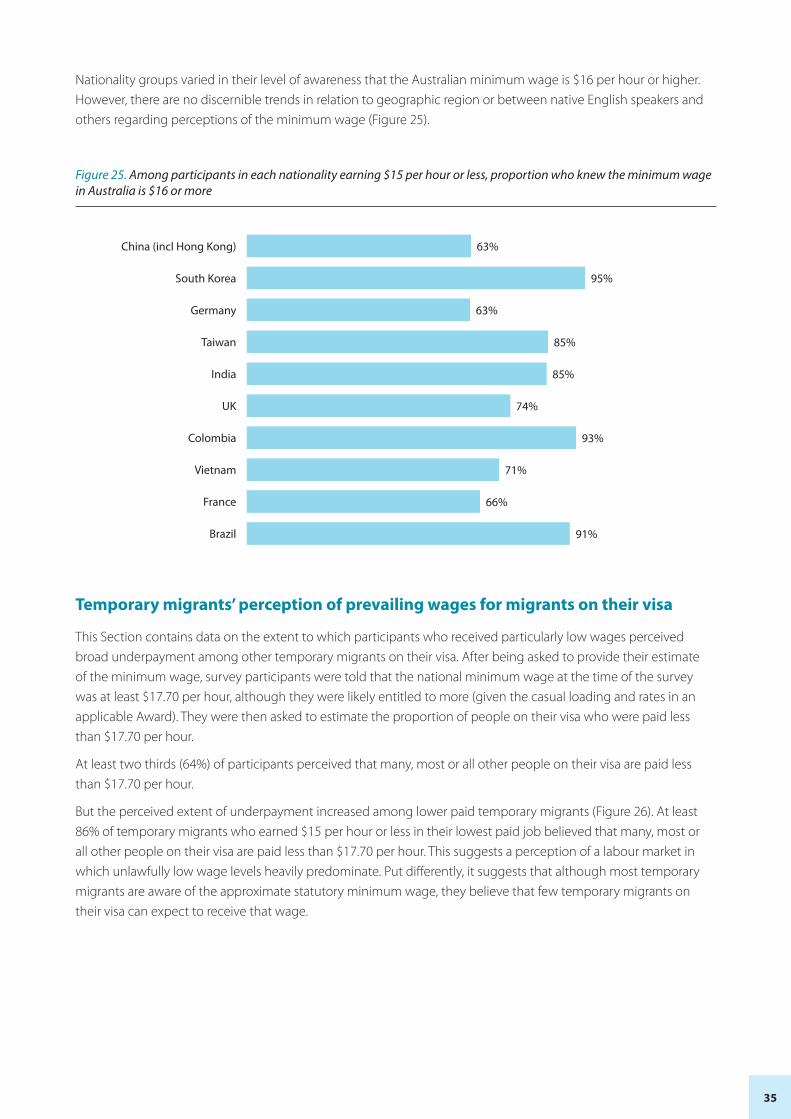
Nationality groups varied in their level of awareness that the Australian minimum wage is $16 per hour or higher. However, there are no discernible trends in relation to geographic region or between native English speakers and others regarding perceptions of the minimum wage (Figure 25).
Figure 25. Among participants in each nationality earning $15 per hour or less, proportion who knew the minimum wage in Australia is $16 or more
China (incl Hong Kong)
South Korea
Germany
Taiwan
India
UK
Colombia
Vietnam
France
Brazil
63%
95%
63%
85%
85%
74%
71%
93%
66%
91%
Temporary migrants’ perception of prevailing wages for migrants on their visa
This Section contains data on the extent to which participants who received particularly low wages perceived broad underpayment among other temporary migrants on their visa. After being asked to provide their estimate of the minimum wage, survey participants were told that the national minimum wage at the time of the survey was at least $17.70 per hour, although they were likely entitled to more (given the casual loading and rates in an applicable Award). They were then asked to estimate the proportion of people on their visa who were paid less than $17.70 per hour.
At least two thirds (64%) of participants perceived that many, most or all other people on their visa are paid less than $17.70 per hour.
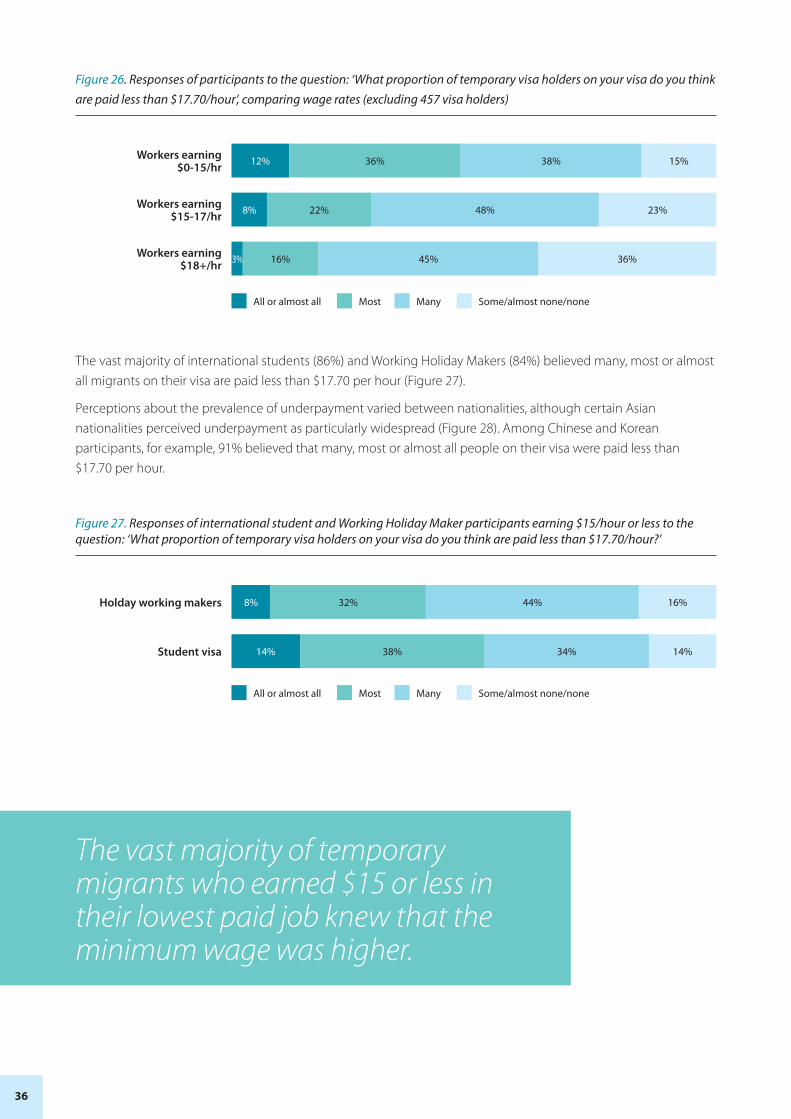
But the perceived extent of underpayment increased among lower paid temporary migrants (Figure 26). At least 86% of temporary migrants who earned $15 per hour or less in their lowest paid job believed that many, most or all other people on their visa are paid less than $17.70 per hour. This suggests a perception of a labour market in which unlawfully low wage levels heavily predominate. Put differently, it suggests that although most temporary migrants are aware of the approximate statutory minimum wage, they believe that few temporary migrants on their visa can expect to receive that wage.
36
Figure 26. Responses of participants to the question: ‘What proportion of temporary visa holders on your visa do you think are paid less than $17.70/hour’, comparing wage rates (excluding 457 visa holders)
Workers earning $15-17/hr 8% 22% 48% 23%
Workers earning $18+/hr 3% 16% 45% 36%
Workers earning $0-15/hr 12% 36% 38% 15%
All or almost all Most Many Some/almost none/none
The vast majority of international students (86%) and Working Holiday Makers (84%) believed many, most or almost all migrants on their visa are paid less than $17.70 per hour (Figure 27).
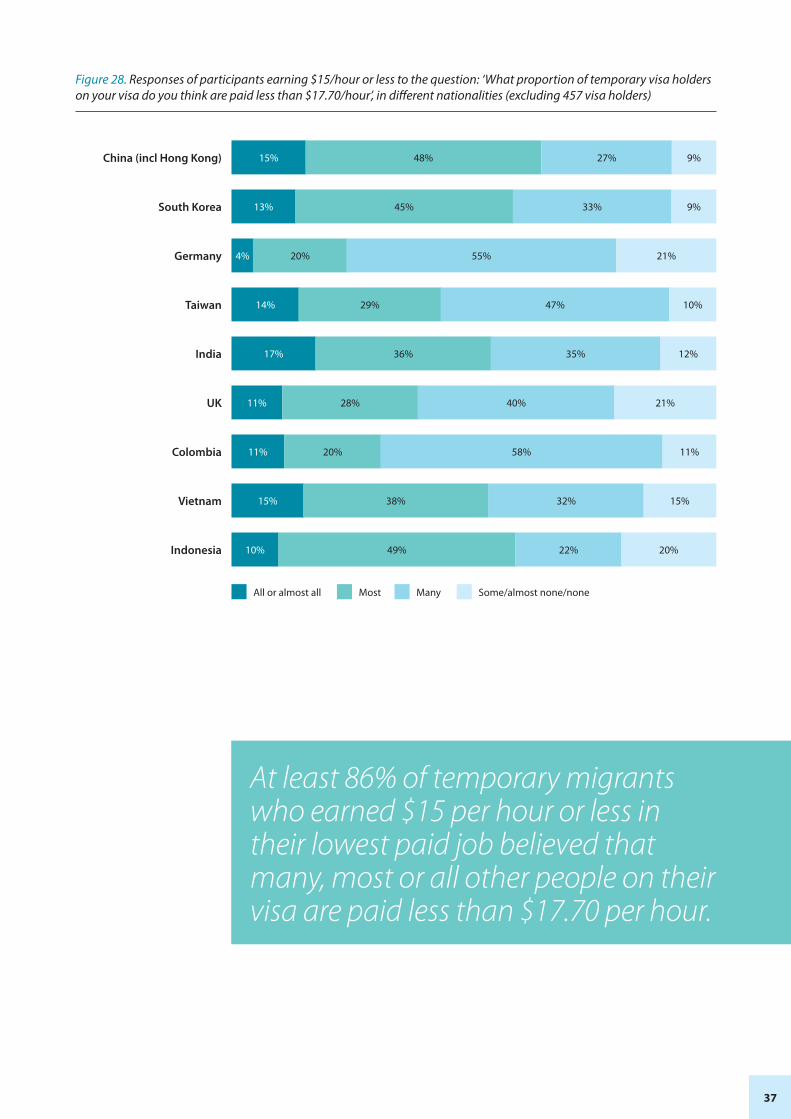
Perceptions about the prevalence of underpayment varied between nationalities, although certain Asian nationalities perceived underpayment as particularly widespread (Figure 28). Among Chinese and Korean participants, for example, 91% believed that many, most or almost all people on their visa were paid less than $17.70 per hour.
Figure 27. Responses of international student and Working Holiday Maker participants earning $15/hour or less to the question: ‘What proportion of temporary visa holders on your visa do you think are paid less than $17.70/hour?’
Holday working makers 8% 32% 44% 16%
Student visa 14% 38% 34% 14%
All or almost all Most Many Some/almost none/none
The vast majority of temporary migrants who earned $15 or less in their lowest paid job knew that the minimum wage was higher.
37
Figure 28. Responses of participants earning $15/hour or less to the question: ‘What proportion of temporary visa holders on your visa do you think are paid less than $17.70/hour’, in different nationalities (excluding 457 visa holders)
Vietnam 15% 38% 32% 15%
India 17% 36% 35% 12%
South Korea 13% 45% 33% 9%
Indonesia 10% 49% 22% 20%
UK 11% 28% 40% 21%
Germany 4% 20% 55% 21%
Colombia 11% 20% 58% 11%
Taiwan 14% 29% 47% 10%
China (incl Hong Kong) 15% 48% 27% 9%
All or almost all Most Many Some/almost none/none
At least 86% of temporary migrants who earned $15 per hour or less in their lowest paid job believed that many, most or all other people on their visa are paid less than $17.70 per hour.
38
Section VII: Payment of temporary migrants in cash and non-provision of pay slips
This Section considers data on two features of jobs held by temporary migrants which are anecdotally regarded as coinciding with wage theft: payment in cash and non-provision of pay slips. The data sheds light on the prevalence of each of these practices among temporary migrants and the extent to which each coincides with wage theft.
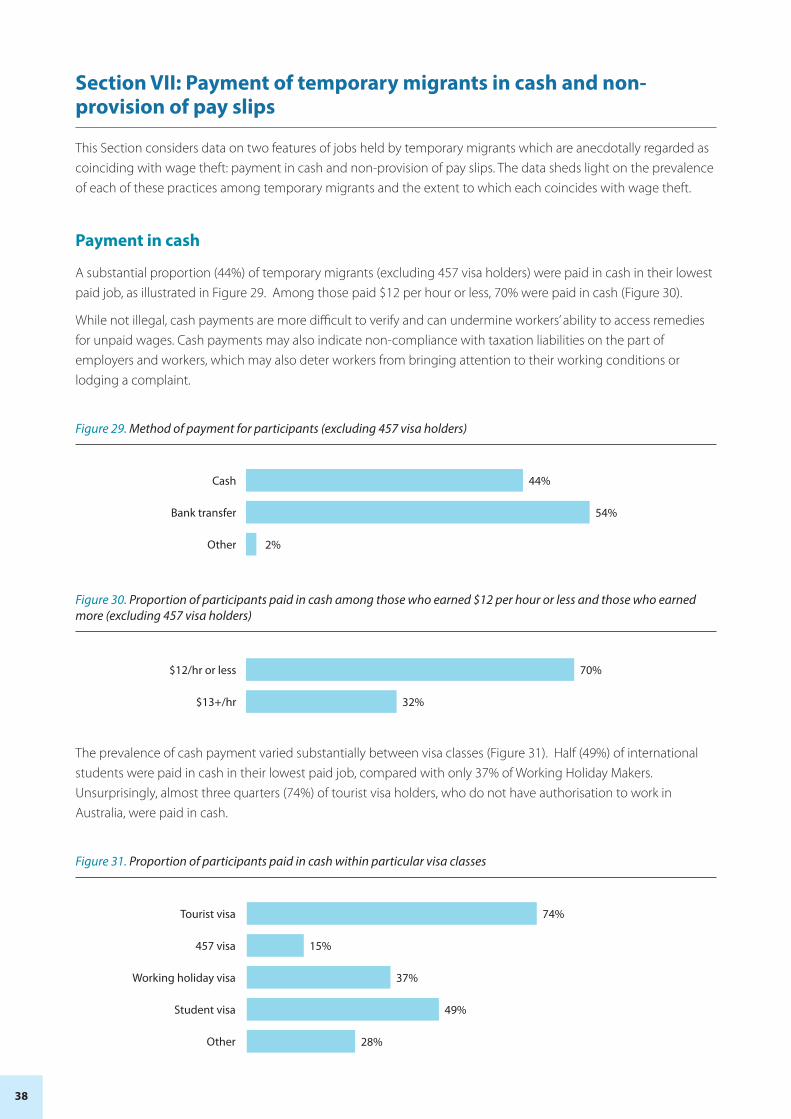
Payment in cash
A substantial proportion (44%) of temporary migrants (excluding 457 visa holders) were paid in cash in their lowest paid job, as illustrated in Figure 29. Among those paid $12 per hour or less, 70% were paid in cash (Figure 30).
While not illegal, cash payments are more difficult to verify and can undermine workers’ ability to access remedies for unpaid wages. Cash payments may also indicate non-compliance with taxation liabilities on the part of employers and workers, which may also deter workers from bringing attention to their working conditions or lodging a complaint.
Figure 29. Method of payment for participants (excluding 457 visa holders)
Cash
Bank transfer
Other
44%
54%
2%
Figure 30. Proportion of participants paid in cash among those who earned $12 per hour or less and those who earned more (excluding 457 visa holders)
$12/hr or less
$13+/hr
70%
32%
The prevalence of cash payment varied substantially between visa classes (Figure 31). Half (49%) of international students were paid in cash in their lowest paid job, compared with only 37% of Working Holiday Makers. Unsurprisingly, almost three quarters (74%) of tourist visa holders, who do not have authorisation to work in Australia, were paid in cash.
Figure 31. Proportion of participants paid in cash within particular visa classes
Tourist visa
457 visa
Working holiday visa
Student visa
Other
74%
15%
37%
49%
28%

39
As shown in Figure 32, Chinese participants were the most likely to be paid in cash in their lowest paid job, with two in three (65%) receiving cash payments. Over half (55%) of Koreans received cash payments in their lowest paid job, followed by Colombians (46%), Indians (38%) and Brazilians (38%). By contrast, only a quarter (26%) of participants from each of the UK and the US were paid in cash in their lowest paid job.
Figure 32. Proportion of participants paid in cash within particular nationalities (excluding 457 visa holders)
China (incl Hong Kong)
South Korea
UK
Germany
Brazil
India
Colombia
USA
65%
55%
26%
31%
38%
38%
26%
46%
The prevalence of cash payments also varied considerably between types of jobs (Figure 33). Waiters, kitchen hands and food servers were the most likely to be paid in cash, with 65% of this largest group of participants having received cash payments in their lowest paid job. A similar proportion of convenience store and petrol station attendants (58%) received cash payments, which is striking given that these are commonly part of larger franchises with formal payment systems. Around two in five participants were paid in cash among those working as shop assistants (45%) or as cleaners (41%). Only a quarter of participants (27%) working in horticulture in their lowest paid job were paid in cash.29
Figure 33. Proportion of participants paid in cash within particular jobs (excluding 457 visa holders)
Waiter / kitchen hand / food server
Fruit / vegetable picker or packer or farm worker
Cleaner
Shop assistant / retail job / sales
Convenience store / petrol station attendant
65%
27%
41%
45%
58%
29 This is consistent with the lower number of Working Holiday Makers paid in cash compared with international students (Figure 31) and may be explained by the fact that Working Holiday Makers are far more likely to work in horticulture (Figure 43 in Annex 1). These temporary migrants are likely seeking to obtain a second Working Holiday Visa on the basis of 88 days regional work in specified industries (including horticulture). The lower frequency of cash payment for these workers may be a result of regulatory changes introduced in August 2015 which required workers seeking to obtain a second visa to provide evidence of their work.
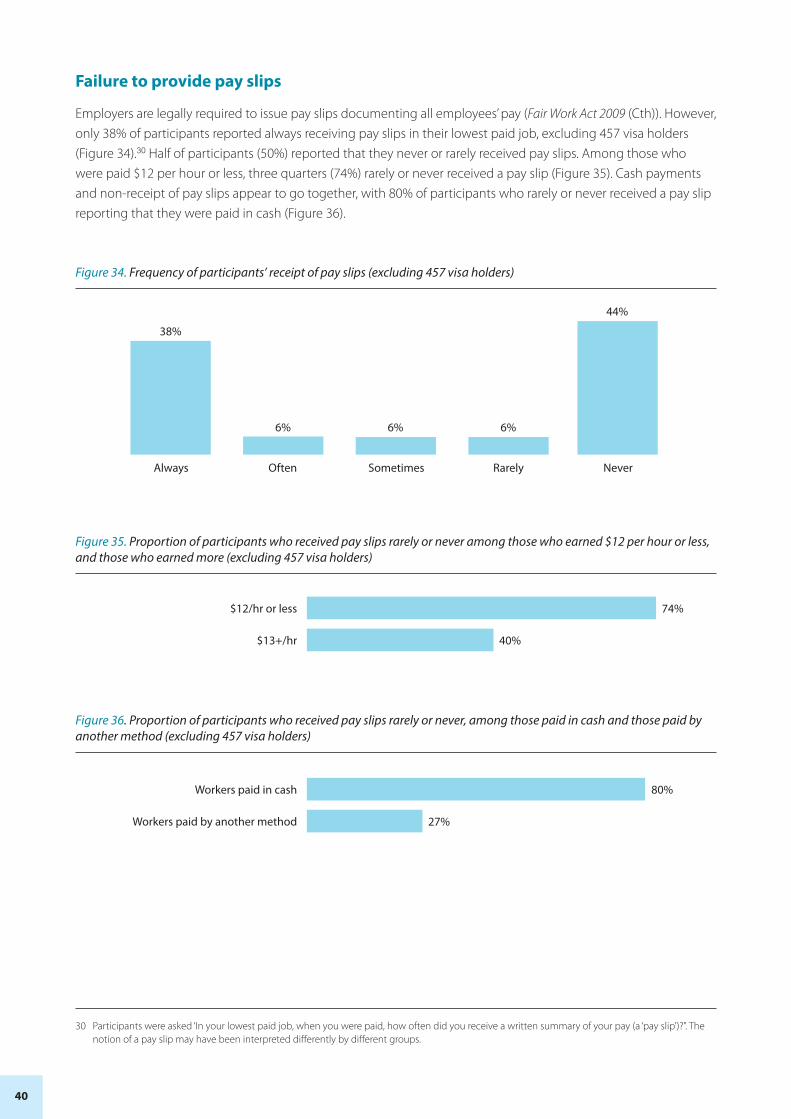
40
Failure to provide pay slips
Employers are legally required to issue pay slips documenting all employees’ pay (Fair Work Act 2009 (Cth)). However, only 38% of participants reported always receiving pay slips in their lowest paid job, excluding 457 visa holders (Figure 34).30 Half of participants (50%) reported that they never or rarely received pay slips. Among those who were paid $12 per hour or less, three quarters (74%) rarely or never received a pay slip (Figure 35). Cash payments and non-receipt of pay slips appear to go together, with 80% of participants who rarely or never received a pay slip reporting that they were paid in cash (Figure 36).
Figure 34. Frequency of participants’ receipt of pay slips (excluding 457 visa holders)
Always Often Sometimes NeverRarely
38%
6% 6%
44%
6%
Figure 35. Proportion of participants who received pay slips rarely or never among those who earned $12 per hour or less, and those who earned more (excluding 457 visa holders)
$12/hr or less
$13+/hr
74%
40%
Figure 36. Proportion of participants who received pay slips rarely or never, among those paid in cash and those paid by another method (excluding 457 visa holders)
Workers paid in cash
Workers paid by another method
80%
27%
30 Participants were asked ‘In your lowest paid job, when you were paid, how often did you receive a written summary of your pay (a ‘pay slip’)?”. The notion of a pay slip may have been interpreted differently by different groups.
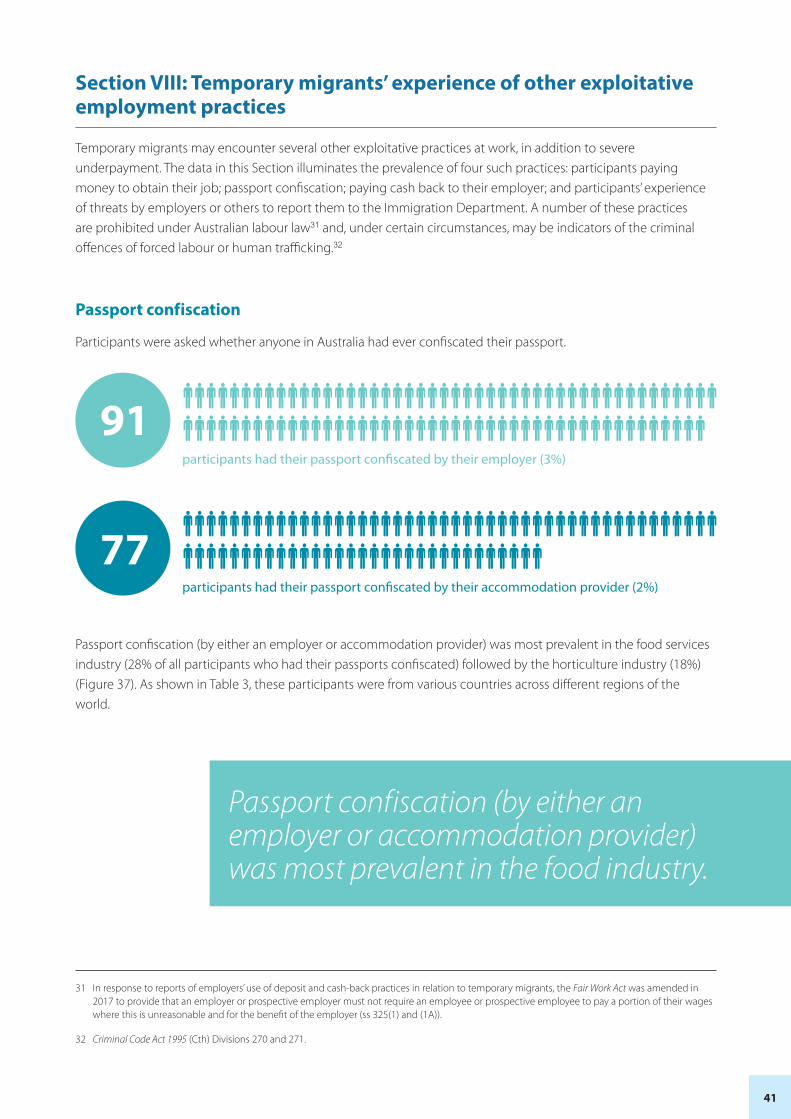
41
Section VIII: Temporary migrants’ experience of other exploitative employment practices
Temporary migrants may encounter several other exploitative practices at work, in addition to severe underpayment. The data in this Section illuminates the prevalence of four such practices: participants paying money to obtain their job; passport confiscation; paying cash back to their employer; and participants’ experience of threats by employers or others to report them to the Immigration Department. A number of these practices are prohibited under Australian labour law31 and, under certain circumstances, may be indicators of the criminal offences of forced labour or human trafficking.32
Passport confiscation
Participants were asked whether anyone in Australia had ever confiscated their passport.
participants had their passport confiscated by their employer (3%)
91
participants had their passport confiscated by their accommodation provider (2%)
77
Passport confiscation (by either an employer or accommodation provider) was most prevalent in the food services industry (28% of all participants who had their passports confiscated) followed by the horticulture industry (18%) (Figure 37). As shown in Table 3, these participants were from various countries across different regions of the world.
31 In response to reports of employers’ use of deposit and cash-back practices in relation to temporary migrants, the Fair Work Act was amended in 2017 to provide that an employer or prospective employer must not require an employee or prospective employee to pay a portion of their wages where this is unreasonable and for the benefit of the employer (ss 325(1) and (1A)).
32 Criminal Code Act 1995 (Cth) Divisions 270 and 271.
Passport confiscation (by either an employer or accommodation provider) was most prevalent in the food industry.
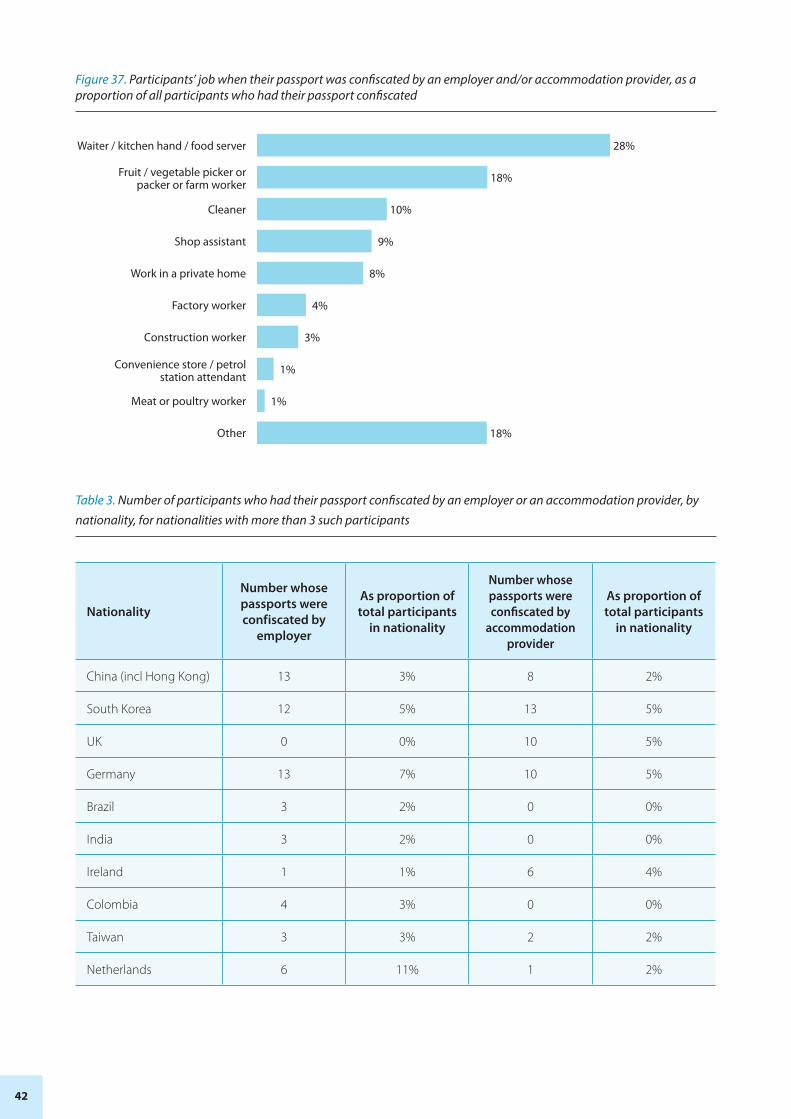
42
Figure 37. Participants’ job when their passport was confiscated by an employer and/or accommodation provider, as a proportion of all participants who had their passport confiscated
Waiter / kitchen hand / food server
Cleaner
Shop assistant
Work in a private home
Factory worker
Construction worker
Meat or poultry worker
Other
28%
18%
10%
9%
8%
4%
3%
1%
1%
18%
Fruit / vegetable picker or packer or farm worker
Convenience store / petrol station attendant
Table 3. Number of participants who had their passport confiscated by an employer or an accommodation provider, by nationality, for nationalities with more than 3 such participants
Nationality
Number whose passports were confiscated by
employer
As proportion of total participants
in nationality
Number whose passports were confiscated by
accommodation provider
As proportion of total participants
in nationality
China (incl Hong Kong) 13 3% 8 2%
South Korea 12 5% 13 5%
UK 0 0% 10 5%
Germany 13 7% 10 5%
Brazil 3 2% 0 0%
India 3 2% 0 0%
Ireland 1 1% 6 4%
Colombia 4 3% 0 0%
Taiwan 3 3% 2 2%
Netherlands 6 11% 1 2%
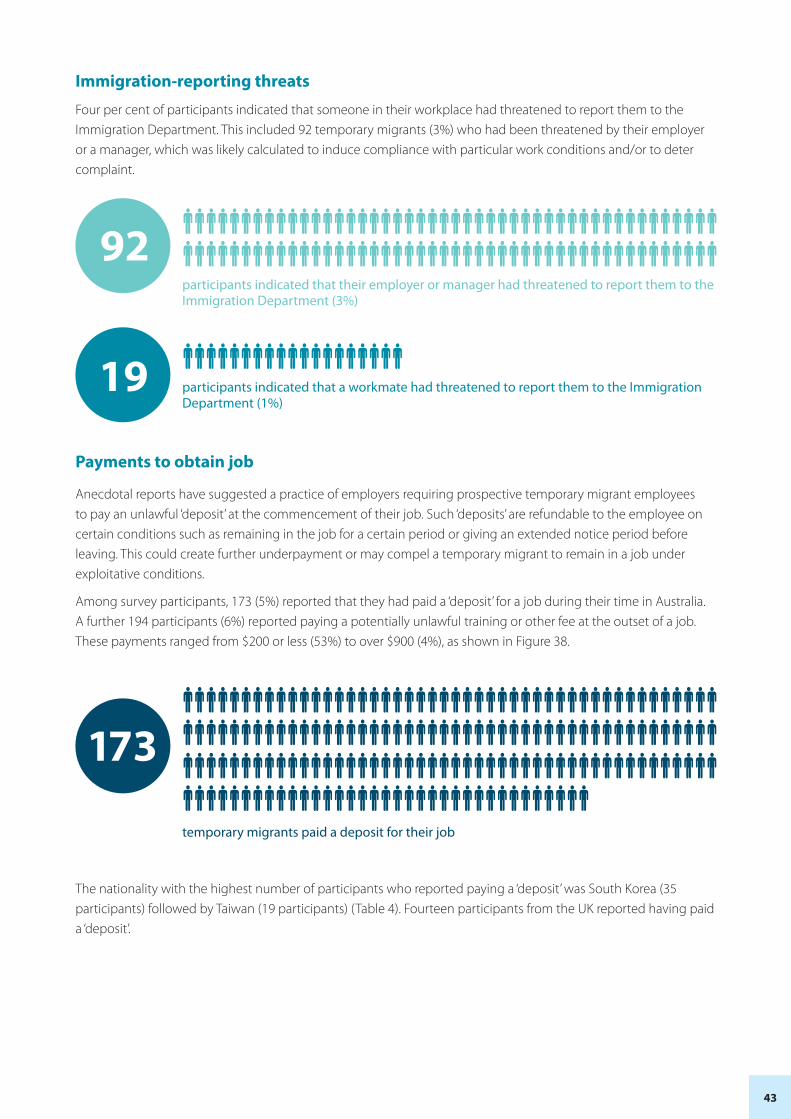
43
Immigration-reporting threats
Four per cent of participants indicated that someone in their workplace had threatened to report them to the Immigration Department. This included 92 temporary migrants (3%) who had been threatened by their employer or a manager, which was likely calculated to induce compliance with particular work conditions and/or to deter complaint.
participants indicated that their employer or manager had threatened to report them to the Immigration Department (3%)
92
participants indicated that a workmate had threatened to report them to the Immigration Department (1%)
19
Payments to obtain job
Anecdotal reports have suggested a practice of employers requiring prospective temporary migrant employees to pay an unlawful ‘deposit’ at the commencement of their job. Such ‘deposits’ are refundable to the employee on certain conditions such as remaining in the job for a certain period or giving an extended notice period before leaving. This could create further underpayment or may compel a temporary migrant to remain in a job under exploitative conditions.
Among survey participants, 173 (5%) reported that they had paid a ‘deposit’ for a job during their time in Australia. A further 194 participants (6%) reported paying a potentially unlawful training or other fee at the outset of a job. These payments ranged from $200 or less (53%) to over $900 (4%), as shown in Figure 38.
temporary migrants paid a deposit for their job
173
The nationality with the highest number of participants who reported paying a ‘deposit’ was South Korea (35 participants) followed by Taiwan (19 participants) (Table 4). Fourteen participants from the UK reported having paid a ‘deposit’.

44
Table 4. Number of participants who paid a ‘deposit’ for a job, by nationality, for nationalities with more than 5 individuals who paid a deposit
Proportion who paid deposit
Number of participants who paid deposit
Total number of participants in
nationality
Taiwan 17% 19 112
South Korea 13% 35 261
UK 7% 14 193
Germany 4% 8 188
India 4% 6 148
France 4% 5 134
China (incl Hong Kong) 4% 17 474
Ireland 4% 5 141
Brazil 3% 5 151
Figure 38. Amount paid by participants who paid a ‘deposit’
$0-100 $100-$200 $200-$300 $300-$400 $400-$500 $500-$600 $600-$700 $700-$800 $900-$1000 $1000+
31%
22%
14%
8%10%
7%
1% 2% 2% 2%
5% of respondents reported that they had paid a deposit for a job in Australia.
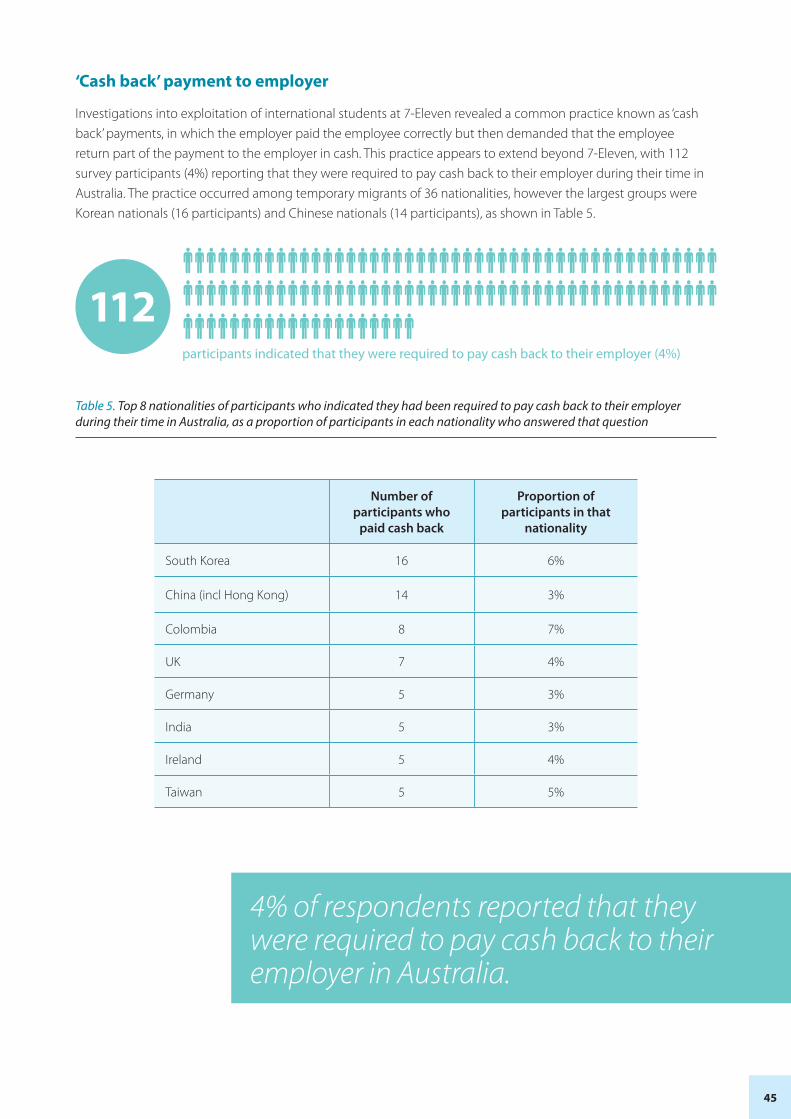
45
‘Cash back’ payment to employer
Investigations into exploitation of international students at 7-Eleven revealed a common practice known as ‘cash back’ payments, in which the employer paid the employee correctly but then demanded that the employee return part of the payment to the employer in cash. This practice appears to extend beyond 7-Eleven, with 112 survey participants (4%) reporting that they were required to pay cash back to their employer during their time in Australia. The practice occurred among temporary migrants of 36 nationalities, however the largest groups were Korean nationals (16 participants) and Chinese nationals (14 participants), as shown in Table 5.
participants indicated that they were required to pay cash back to their employer (4%)
112
Table 5. Top 8 nationalities of participants who indicated they had been required to pay cash back to their employer during their time in Australia, as a proportion of participants in each nationality who answered that question
Number of participants who
paid cash back
Proportion of participants in that
nationality
South Korea 16 6%
China (incl Hong Kong) 14 3%
Colombia 8 7%
UK 7 4%
Germany 5 3%
India 5 3%
Ireland 5 4%
Taiwan 5 5%
4% of respondents reported that they were required to pay cash back to their employer in Australia.
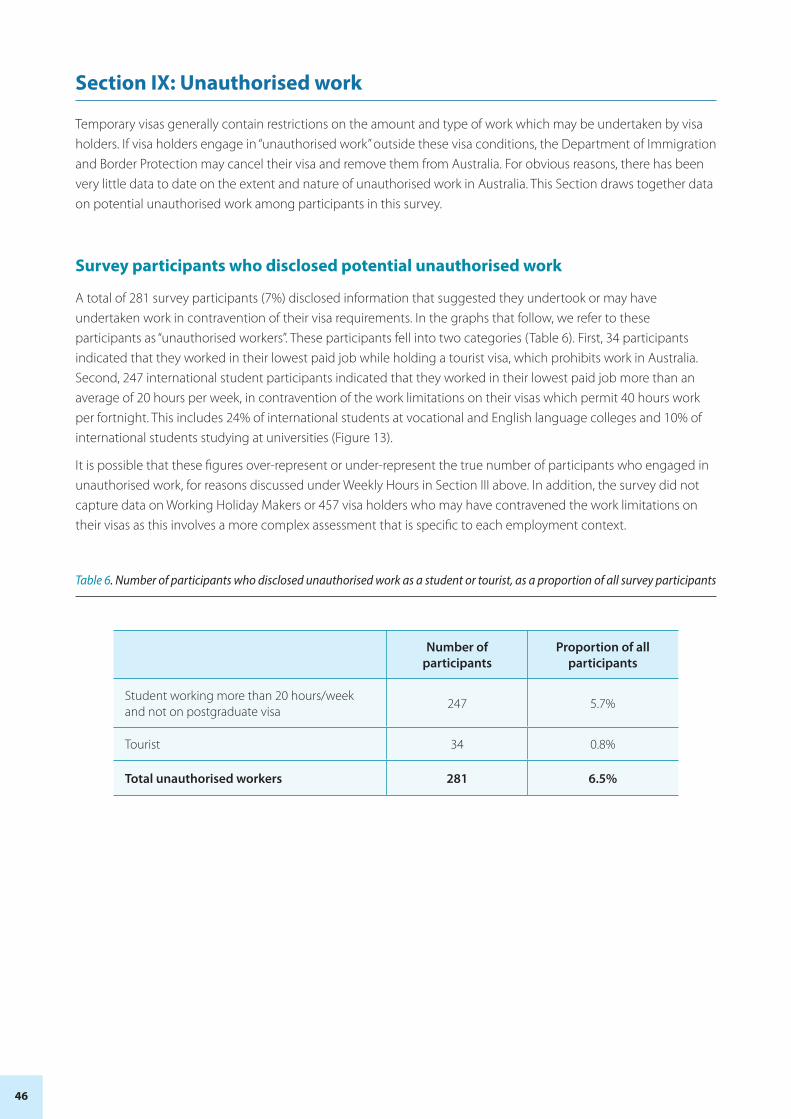
46
Section IX: Unauthorised work
Temporary visas generally contain restrictions on the amount and type of work which may be undertaken by visa holders. If visa holders engage in “unauthorised work” outside these visa conditions, the Department of Immigration and Border Protection may cancel their visa and remove them from Australia. For obvious reasons, there has been very little data to date on the extent and nature of unauthorised work in Australia. This Section draws together data on potential unauthorised work among participants in this survey.
Survey participants who disclosed potential unauthorised work
A total of 281 survey participants (7%) disclosed information that suggested they undertook or may have undertaken work in contravention of their visa requirements. In the graphs that follow, we refer to these participants as “unauthorised workers”. These participants fell into two categories (Table 6). First, 34 participants indicated that they worked in their lowest paid job while holding a tourist visa, which prohibits work in Australia. Second, 247 international student participants indicated that they worked in their lowest paid job more than an average of 20 hours per week, in contravention of the work limitations on their visas which permit 40 hours work per fortnight. This includes 24% of international students at vocational and English language colleges and 10% of international students studying at universities (Figure 13).
It is possible that these figures over-represent or under-represent the true number of participants who engaged in unauthorised work, for reasons discussed under Weekly Hours in Section III above. In addition, the survey did not capture data on Working Holiday Makers or 457 visa holders who may have contravened the work limitations on their visas as this involves a more complex assessment that is specific to each employment context.
Table 6. Number of participants who disclosed unauthorised work as a student or tourist, as a proportion of all survey participants
Number of participants
Proportion of all participants
Student working more than 20 hours/week and not on postgraduate visa
247 5.7%
Tourist 34 0.8%
Total unauthorised workers 281 6.5%
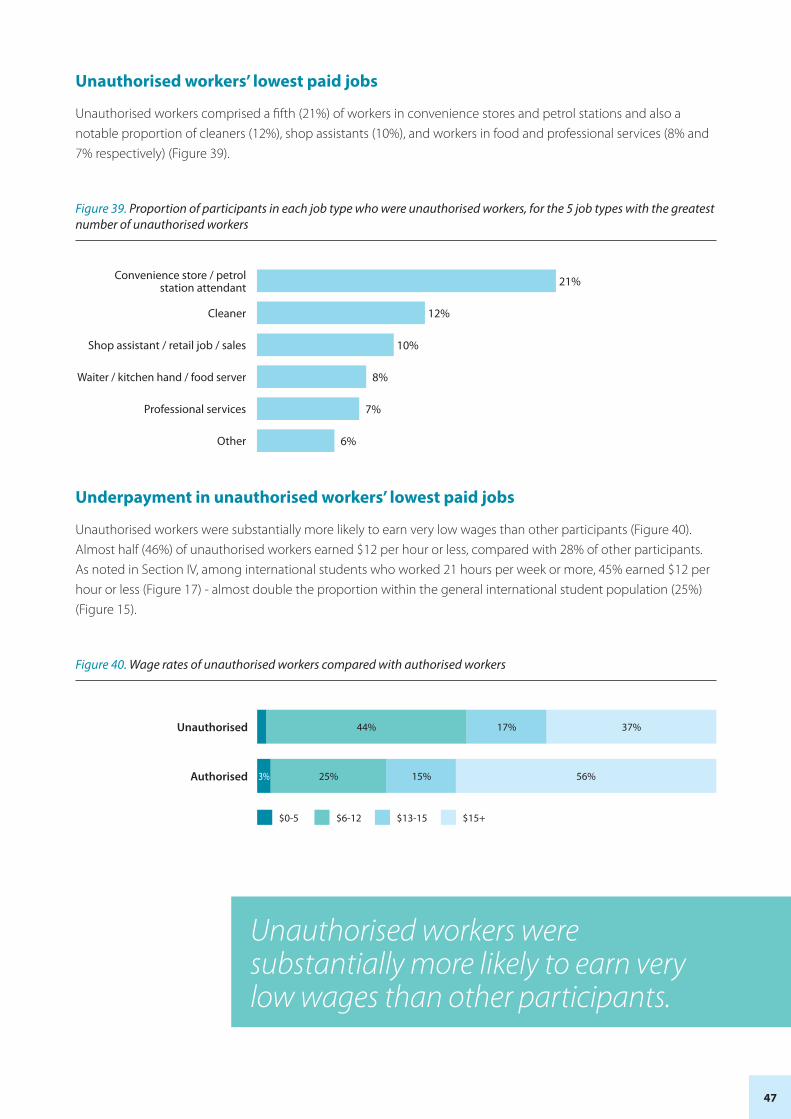
47
Unauthorised workers’ lowest paid jobs
Unauthorised workers comprised a fifth (21%) of workers in convenience stores and petrol stations and also a notable proportion of cleaners (12%), shop assistants (10%), and workers in food and professional services (8% and 7% respectively) (Figure 39).
Figure 39. Proportion of participants in each job type who were unauthorised workers, for the 5 job types with the greatest number of unauthorised workers
Cleaner
Shop assistant / retail job / sales
Waiter / kitchen hand / food server
Professional services
Other
21%
12%
10%
8%
7%
6%
Convenience store / petrol station attendant
Underpayment in unauthorised workers’ lowest paid jobs
Unauthorised workers were substantially more likely to earn very low wages than other participants (Figure 40). Almost half (46%) of unauthorised workers earned $12 per hour or less, compared with 28% of other participants. As noted in Section IV, among international students who worked 21 hours per week or more, 45% earned $12 per hour or less (Figure 17) - almost double the proportion within the general international student population (25%) (Figure 15).
Figure 40. Wage rates of unauthorised workers compared with authorised workers
Unauthorised 44% 17% 37%
Authorised 3% 25% 15% 56%
$0-5 $6-12 $13-15 $15+
Unauthorised workers were substantially more likely to earn very low wages than other participants.
48
Conclusion
Anecdotal reports about underpayment of temporary migrants have proliferated in recent years. Many advocates, reporters and policy makers have suspected that the problem is both broad and deep.
This study confirms that wage theft is endemic among international students, Working Holiday Makers and other temporary migrants in Australia. For a substantial number of temporary migrants, it is also severe. Almost a third (30%) of survey participants earned $12 per hour or less -- approximately half the minimum wage for a 21 year old casual employee in many of the jobs in which temporary migrants work. This included at least a fifth of participants of every nationality and up to 36% of some nationalities. Underpayment was prevalent across visa categories, with 32% of Working Holiday Makers and 25% of international students earning $12 per hour or less. Almost three quarters of those who earned $12 per hour or less were paid in cash (70%) and did not receive pay slips (74%).
The study reveals that wage theft is prevalent not only among fruit and vegetable pickers, as reported in multiple government inquiries, but even more so among waiters, kitchen hands and food servers. These jobs accounted for by far the largest number of participants’ lowest paid jobs (38%), including among most of the top 6 nationalities of international students and Working Holiday Makers. Twenty eight per cent of these jobs paid $12 per hour or less, and half (49%) paid $15 per hour or less. Two in three (65%) temporary migrants working in food services were paid in cash.
The worst paid jobs remained in fruit and vegetable picking and farm work. Almost one in seven participants (15%) earned $5 per hour or less and almost a third (31%) earned $10 per hour or less. Other cohorts also experienced wage theft with particular prevalence or severity. For example, temporary migrants working at petrol stations/convenience stores, car washes and in retail experienced particularly severe underpayment. International students who worked more than 20 hours per week (potentially breaching their visa conditions) earned substantially lower wages than other international students. And several Asian countries had the highest proportions of temporary migrants earning $17 per hour or less (81% of Chinese, 79% of Taiwanese and 75% of Vietnamese), compared with predominantly English-speaking countries that had the lowest proportions (35% of Americans, 38% of Irish and 41% of British). Two in three (65%) Chinese participants were paid in cash, far higher than proportions of US and UK participants (26% each).
Finally, the study dispelled the misconception that temporary migrants are underpaid because they are unaware of minimum wage rates in Australia. Though they may not have known their precise entitlements, the overwhelming majority who earned $15 or less knew that the legal minimum wage was higher (73% of international students and 78% of Working Holiday Makers). However, they perceived that few people on their visa can expect to receive minimum wages under Australian labour law, with at least 86% of believing that many, most or all other people on their visa are paid less than the basic legal minimum wage.
These findings present a bleak but much-needed overall picture of wage theft among international students, Working Holiday Makers and other temporary migrants in Australia. The findings also reveal new levels of detail about the jobs in which temporary migrants work, their conditions at work, and the cohorts for whom wage theft and other indicators of exploitation are most prevalent and severe. The findings demonstrate both the urgent need for action on the part of government, business, educational institutions and other service providers, and the complexity of the issues which demand multi-faceted structural and enforcement reforms. As stakeholders address these challenges, this study creates new opportunities for evidence-driven strategies that respond to temporary migrants’ diverse personal experiences of work in Australia.

49
Annex 1: Characteristics of temporary migrants’ lowest paid job: further graphs
Lowest paid job for temporary migrants of different nationalities and visa classes
Figure 41. Proportion of participants of each nationality who identified job type as their lowest paid job in Australia, for the 6 nationalities with the greatest number of participants
Waiter / kitchen hand / food server
Shop assistant / retail job / sales
Professional services
55%
13%
9%
China(incl Hong Kong)
Waiter / kitchen hand / food server
Cleaner
Fruit/vegetable picker or packer or farm worker
46%
10%
10%
South Korea
Fruit/vegetable picker or packer or farm worker
Waiter / kitchen hand / food server
Professional services
29%
27%
10%
United Kingdom
Fruit/vegetable picker or packer or farm worker
Waiter / kitchen hand / food server
Work in a private home
26%
19%
15%
Germany
Waiter / kitchen hand / food server
Cleaner
Shop assistant / retail job / sales
42%
19%
8%
Brazil
Waiter / kitchen hand / food server
Shop assistant / retail job / sales
Convenience store / petrol station attendant
46%
13%
10%
India
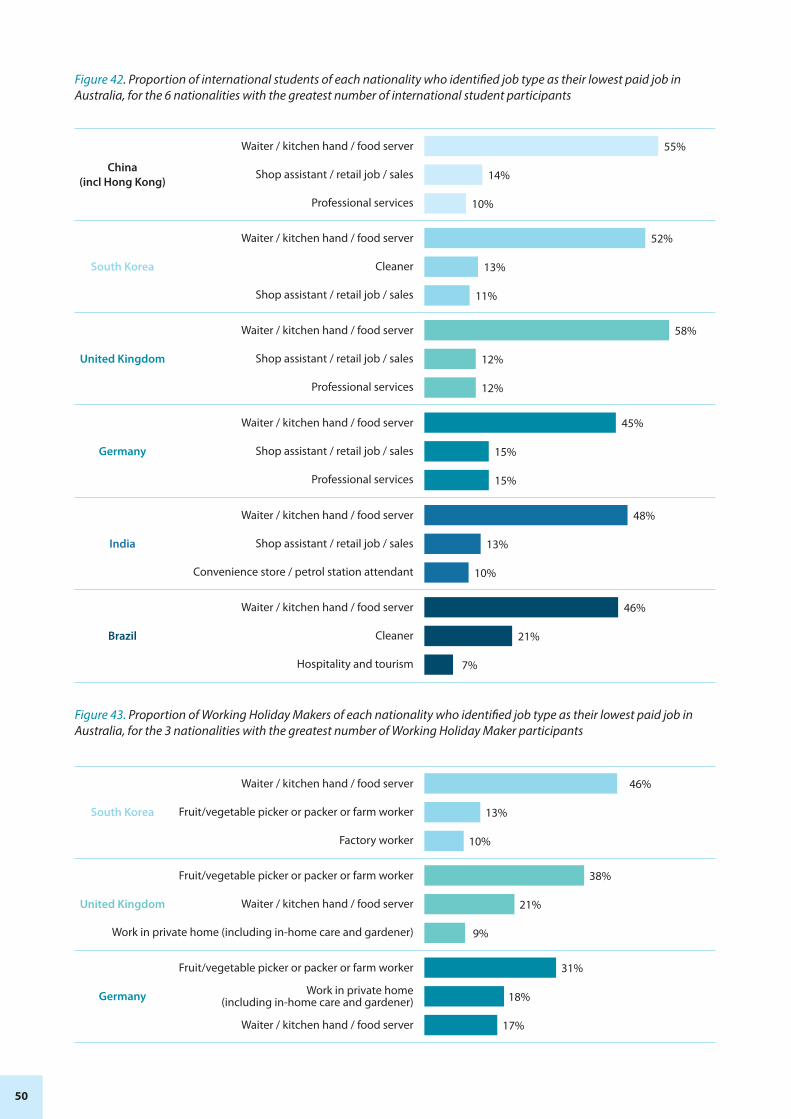
50
Figure 42. Proportion of international students of each nationality who identified job type as their lowest paid job in Australia, for the 6 nationalities with the greatest number of international student participants
Waiter / kitchen hand / food server
Shop assistant / retail job / sales
Professional services
55%
14%
10%
China(incl Hong Kong)
Waiter / kitchen hand / food server
Cleaner
Shop assistant / retail job / sales
52%
13%
11%
South Korea
Waiter / kitchen hand / food server
Shop assistant / retail job / sales
Professional services
58%
12%
12%
United Kingdom
Waiter / kitchen hand / food server
Shop assistant / retail job / sales
Professional services
45%
15%
15%
Germany
Waiter / kitchen hand / food server
Shop assistant / retail job / sales
Convenience store / petrol station attendant
48%
13%
10%
India
Waiter / kitchen hand / food server
Cleaner
Hospitality and tourism
46%
21%
7%
Brazil
Figure 43. Proportion of Working Holiday Makers of each nationality who identified job type as their lowest paid job in Australia, for the 3 nationalities with the greatest number of Working Holiday Maker participants
Waiter / kitchen hand / food server
Fruit/vegetable picker or packer or farm worker
Factory worker
46%
13%
10%
South Korea
Fruit/vegetable picker or packer or farm worker
Waiter / kitchen hand / food server
Work in private home (including in-home care and gardener)
38%
21%
9%
United Kingdom
Fruit/vegetable picker or packer or farm worker
Work in private home (including in-home care and gardener)
Waiter / kitchen hand / food server
31%
18%
17%
Germany
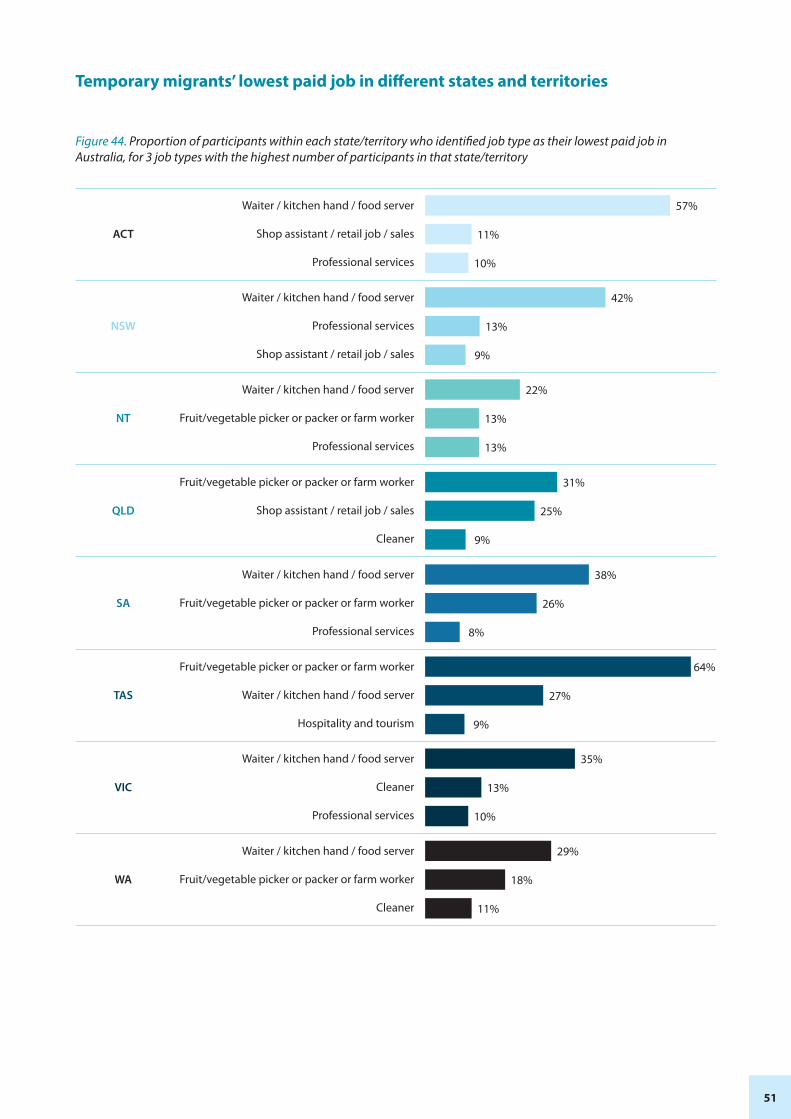
51
Temporary migrants’ lowest paid job in different states and territories
Figure 44. Proportion of participants within each state/territory who identified job type as their lowest paid job in Australia, for 3 job types with the highest number of participants in that state/territory
Waiter / kitchen hand / food server
Shop assistant / retail job / sales
Professional services
57%
11%
10%
ACT
Waiter / kitchen hand / food server
Professional services
Shop assistant / retail job / sales
42%
13%
9%
NSW
Waiter / kitchen hand / food server
Fruit/vegetable picker or packer or farm worker
Professional services
22%
13%
13%
NT
Fruit/vegetable picker or packer or farm worker
Shop assistant / retail job / sales
Cleaner
31%
25%
9%
QLD
Waiter / kitchen hand / food server
Fruit/vegetable picker or packer or farm worker
Professional services
38%
26%
8%
SA
Fruit/vegetable picker or packer or farm worker
Waiter / kitchen hand / food server
Hospitality and tourism
64%
27%
9%
TAS
Waiter / kitchen hand / food server
Cleaner
Professional services
35%
13%
10%
VIC
Waiter / kitchen hand / food server
Fruit/vegetable picker or packer or farm worker
Cleaner
29%
18%
11%
WA

52
Hours worked by temporary migrants in their lowest paid job
Figure 45. Average hours worked per week in participants’ lowest paid job, by hourly wage rate
$6-12 16% 27% 20% 36%
$13-15 19% 25% 26% 30%
$15+ 18% 20% 23% 38%
$0-5 14% 10% 9% 67%
8 hours or less 9-15 hours 16-20 hours 21 or more hours
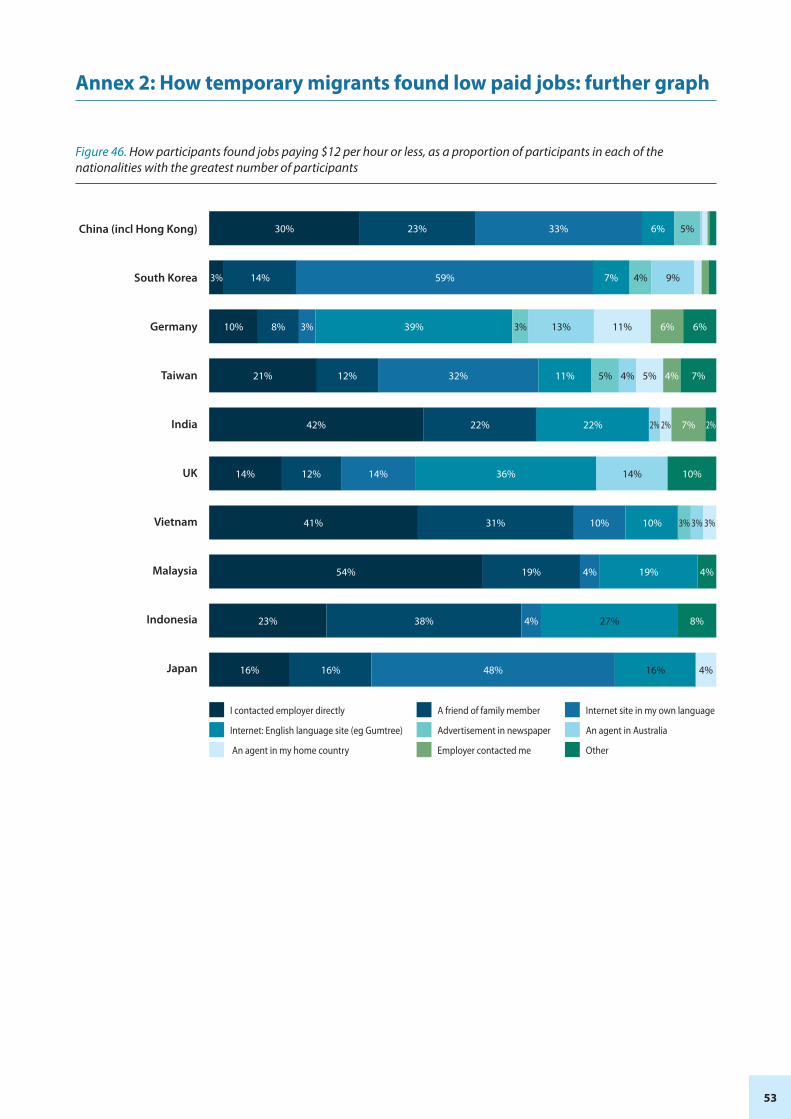
53
Annex 2: How temporary migrants found low paid jobs: further graph
Figure 46. How participants found jobs paying $12 per hour or less, as a proportion of participants in each of the nationalities with the greatest number of participants
I contacted employer directly
Internet: English language site (eg Gumtree)
An agent in my home country
A friend of family member
Advertisement in newspaper
Employer contacted me
China (incl Hong Kong)
South Korea
Germany
Taiwan
India
UK
Vietnam
Malaysia
Indonesia
Japan
Internet site in my own language
An agent in Australia
Other
23% 33% 6%30% 5%
14% 59% 7%3% 4% 9%
8% 3% 39%10% 3% 13% 11% 6% 6%
12% 32% 11%21% 5% 4% 5% 4% 7%
19% 4% 19%54% 4%
38% 4% 27%23% 8%
16% 48% 16%16% 4%
31% 10% 10%41% 3% 3% 3%
12% 14% 36%14% 14% 10%
22% 22%42% 2% 2% 7% 2%

54
Group n
Figure 1 All 4322
Figure 2 All 2228
Figure 3 All 3220
Figure 4 All 2398
Figure 5 All 986
Figure 6 All 895
Figure 7 All 306
Figure 8 All 121
Figure 9 All 3454
Figure 10 All 3387
Figure 11 All 3243
Figure 12 457 Visa 219
Working holiday visa 1237
Student visa 1868
Figure 13 College 451
University 1412
Figure 14 All 3782
Figure 15 Temporary graduate visa 15
Tourist visa 31
457 visa 283
Working holiday visa 1418
Student visa 2192
Figure 16 College 518
University 1662
Figure 17 All 248
Figure 18 China (incl Hong Kong) 474
South Korea 261
UK 193
Germany 188
Brazil 151
India 148
Ireland 141
USA 137
France 134
Colombia 122
Taiwan 112
Italy 102
Indonesia 92
Vietnam 75
Malaysia 68
Figure 19 Waiter/kitchen hand /food server 1272
Fruit/vegetable picker or packer or farm worker 303
Cleaner 294
Shop assistant/retail job/sales 275
Hospitality and tourism (includes food and food delivery)
96
Factory worker 71
Convenience store/petrol station attendant 66
Construction/building worker 65
Meat or poultry worker 33
Removals, delivery, taxi 26
Car wash 15
Child care 12
Figure 20 Female 1917
Male 1287
Figure 21 I contacted employer directly 744
A friend or family member 867
Internet site in my own language 395
Internet: English language site (e.g. Gumtree) 784
An agent in Australia 49
Advertisement in newspaper 84
An agent in my home country 190
Employer contacted me 138
Other 211
Figure 22 South Korea 41
Japan 12
China (incl Hong Kong) 94
Taiwan 18
Vietnam 4
Figure 23 Working holiday visa 399
Student visa 689
Tourist visa 7
Figure 24 College 163
University 514
Figure 25 China (incl Hong Kong) 225
South Korea 122
Germany 54
Taiwan 62
India 60
UK 43
Colombia 51
Vietnam 32
France 29
Brazil 40
Figure 26 Workers earning less than $15/hr 1482
Workers earning $15-17/hr 469
Workers earning $18+/hr 1322
Figure 27 Working holiday visa 511
Student visa 893
Figure 28 China (incl Hong Kong) 351
South Korea 129
Germany 92
Taiwan 72
India 69
UK 57
Colombia 55
Vietnam 47
Brazil 44
Indonesia 41
Figure 29 Cash 1395
Bank transfer 1765
Other 83
Figure 30 $12/hr or less 704
$13+/hr 714
Figure 31 Tourist visa 17
457 visa 32
Working holiday visa 453
Student visa 916
Other 32
Figure 32 China (incl Hong Kong) 303
South Korea 137
UK 47
Germany 53
Brazil 53
India 53
Colombia 56
USA 31
Figure 33 Waiter/kitchen hand /food server 824
Fruit/vegetable picker or packer or farm worker 81
Cleaner 121
Shop assistant/retail job/sales 122
Convenience store/petrol station attendant 38
Figure 34 All 3243
Figure 35 $12/hr or less 704
$13+/hr 714
Figure 36 Workers paid in cash 1134
Workers paid by another method 500
Figure 37 All 156
Figure 38 All 167
Figure 39 Waiter/kitchen hand /food server 102
Cleaner 36
Shop assistant/retail job/sales 28
Professional services 27
Convenience store/petrol station attendant 14
Other 62
Figure 40 Unauthorised 278
Authorised 3787
Figure 41 China (incl Hong Kong) 366
South Korea 171
UK 125
Germany 113
Brazil 105
India 100
Figure 42 China (incl Hong Kong) 366
South Korea 171
UK 125
Germany 113
Brazil 105
India 97
Figure 43 South Korea 130
UK 96
Germany 98
Figure 44 ACT 100
NSW 1228
NT 15
QLD 258
SA 53
TAS 11
VIC 337
WA 130
Figure 45 $0-5 96
$6-12 915
$13-15 527
Above $15 1705
Figure 46 China (incl Hong Kong) 286
South Korea 70
Germany 62
Taiwan 57
India 45
UK 42
Vietnam 39
Malaysia 26
Indonesia 26
Japan 25
Annex 3: Number of Participants (n) for each Figure in Report