wading bird colony timing, location, and size at...
TRANSCRIPT

Wading Bird Colony Timing, Location, and Size
at Lake Okeechobee, 2005–2007

ii
FINAL REPORT
to
National Park Service Everglades National Park
40001 SR 9336 Homestead, Florida 33034
for
Cooperative Agreement No. H5000 00 0494 South Florida/Caribbean Cooperative Ecosystem Studies Unit (CESU)
w/University of Miami (Host)
Cooperative Agreement No. H5000 02 0409 Cooperative Agreement w/Florida Atlantic University as a Partner to CESU
Task Order No. J5297 05 0083
by
Damion E. Marx Dale E. Gawlik
Department of Biological Sciences Florida Atlantic University
777 Glades Road Boca Raton, FL 33431-0991
561-297-3333 [email protected]
iii
EXECUTIVE SUMMARY The trophic hypothesis proposes that higher trophic level populations of organisms are limited by changes in hydrogeochemical properties of the environment that regulate lower trophic level resources. With reference to wading birds, this hypothesis states that if hydrology better mimics historic conditions then prey populations will proliferate during the wet season and wading birds will experience increased access to those prey during the breeding season. If wading birds experience enhanced foraging opportunities with improved water management strategies, then monitoring efforts will reflect short-term improvements in wading bird reproductive success which should lead to population recoveries over the long-term. Under monitoring and Assessment Pan (MAP) Activity Numbers 3.1.3.13 and 3.1.3.14 of the Greater Everglades Wetlands (GEW) module, breeding wading bird populations are identified as key performance measures that will gauge ecosystem recovery and guide water management decisions. With information on the location, timing, size, and success of wading bird colonies, stakeholders will be able to (1) evaluate predictions from trophic hypotheses in coordination with multi-disciplinary monitoring efforts, and (2) hone management recommendations as the Comprehensive Everglades Restoration Plan (CERP) continues to be implemented. Because wading birds are a guild of highly vagile species with widespread dispersal potential, monitoring populations throughout the entire GEW is necessary. This report focuses specifically on FAU’s 2005–2007 colony surveys at Lake Okeechobee. The 2006 nesting season was a banner year in the Okeechobee region with nest effort and productivity reaching toward historical highs. We suspect complete inundation of littoral zone marshes increased the carrying capacity of the lake by increasing the dispersion and productivity of prey communities and by increasing the spatial extent of highly suitable foraging habitat in the landscape. The extended recession acted to increase prey availability and to continually replenish the landscape with available foraging patches throughout the nesting season. This study supports the inference that wading birds can experience comparatively high reproductive success when extensive flooding of littoral zone marshes is followed by an extended recession. Analysis of the historical record showed that nonextreme January lake stages followed by at least three months recession during the breeding season tended to maximize nest effort. In January 2007, much of the littoral zone was waterless and remained dry throughout the nesting season, which negatively affected wading bird foraging habitat. In contrast, recession rates suggested that foraging conditions were good to fair throughout the breeding season, but drought conditions also reduced the spatial extent of suitable habitat for foraging and nesting wading birds. The poor nest effort and reproductive success during 2007 suggested that hydrological conditions associated with droughts produce poor quality foraging habitat. Again referring to the historical record, analysis demonstrated that when extreme low lake stages prevail to start the year, we can expect poor nest effort from wading birds in the Okeechobee region. Data also demonstrated that if recessions continue throughout the dry season following extremely low January lake stages, that wading bird nest effort will be lowest overall.

iv
In 2007, we also detected of a small Wood Stork colony in cypress trees on private land about 4km north of Harney Pond. During aerial reconnaissance in mid-April, we detected 12 nesting pairs with 22 young. We observed chicks weekly via aerial survey thereafter. During our last visit on June 26, we observed only 9 chicks left at the colony and expect that all nestlings eventually fledged following the postflight period of attachment to nest sites. Low nest effort has also been linked to prolonged high lake stages. In 1984, the only other year with extreme low wading bird nest effort (< 1,000 nests), lake stages had remained high since August 1982, and breeding season hydrology was characterized by periodic reversals and increasing lake levels. Thus, extended periods of extreme lake stage, whether high or low, appear to have negative impacts on wading bird populations. Additional research into the effects of different hydrological scenarios on habitat availability and wading bird reproduction is on-going. From this study to-date, we can offer coarse-grained recommendations for Lake Okeechobee management strategies designed to benefit wading birds. Wading birds apparently respond positively to moderate lake levels at the beginning of the year that fall within the long term interquartile range of lake stages for January (4.14–4.73 m NGVD29). These conditions promote productivity of their prey base and maximize the spatial extent of potential foraging habitat during extended recessions. Seasonal dry downs provide the mechanism that concentrates prey and enhances their availability during the breeding season when wading bird energetic demands are high. Thus, we also suggest that dry season recessions following inundation of the littoral zone are a necessary aspect of lake management to promote and sustain wading birds that nest at Lake Okeechobee. The importance of Lake Okeechobee to south Florida wading bird populations should not be underestimated. In 2006, if wading bird nest effort at Lake Okeechobee is included in system-wide estimates of nest effort, then Okeechobee colonies accounted for 17% of all nests in the GEW. Whether as a population source for wading birds that breed throughout the GEW, or as an important post-breeding dispersal stopover site for species of special management concern such as Roseate Spoonbills and Wood Storks, Lake Okeechobee continues to serve as a critical ecosystem component for wading birds that breed in the GEW.

v
ACKNOWLEDGEMENTS We would like to acknowledge the U.S. Army Corps of Engineers for funding this research as well as Sonny Bass and supporting staff at the National Park Service for facilitating the research grant. We also thank the South Florida Water Management District, the Florida Fish and Wildlife Commission, and Florida Atlantic University for additional support. We express our gratitude to field assistants Alegra Galle and Frank Marenghi. Lastly, we thank the following individuals who volunteered their time and resources to support us in the field: Tyler Beck, Bryan Botson, Dr. Nate Dorn, Sam Lantz, Garth Herring, Phil Heidemann, Nina Hill, Rebecca Imdieke, Juliet Lamb, and Kristen Simpson.

vi
TABLE OF CONTENTS
Page EXECUTIVE SUMMARY.............................................................................................. iii ACKNOWLEDGEMENTS ............................................................................................ v TABLE OF CONTENTS ............................................................................................... vi LIST OF TABLES......................................................................................................... vii LIST OF FIGURES....................................................................................................... viii LIST OF APPENDICES................................................................................................ x ACRONYMS AND ABBREVIATIONS .......................................................................... xi INTRODUCTION.......................................................................................................... 1 Historical Wading Bird Nest Effort at Lake Okeechobee......................................... 1 Restoration and the Trophic Hypothesis ................................................................. 3 Current Monitoring Effort......................................................................................... 4 METHODS ................................................................................................................... 5 Colony Survey......................................................................................................... 5 Hydrology and Nest Effort....................................................................................... 7 RESULTS..................................................................................................................... 8 Hydrology 2006–2007............................................................................................. 8 Colony Timing, Location, and Size.......................................................................... 10 Wood Stork Reproductive Success......................................................................... 16 Historical Wading Bird Nest Effort and Hydrology................................................... 16 DISCUSSION............................................................................................................... 19 2006 Nesting Season.............................................................................................. 19 2007 Nesting Season.............................................................................................. 21 Management Implications ....................................................................................... 23 LITERATURE CITED ................................................................................................... 24

vii
LIST OF TABLES TABLE Page 1 Comparison of 2005–2007 partial nest counts with the long term mean (1957–
1960, 1971–1972, 1974–1975, 1977–1990) nest effort, standard error (SE), and interquartile (IQ) range. .................................................................................... 12
2 Comparison of total nest effort by wading birds at Lake Okeechobee, FL during
the 2006 and 2007 breeding seasons .............................................................. 14 3 ANOVA results for the effects of average January lake stage and recession
continuity across the breeding season on wading bird nest effort at Lake Okeechobee, FL............................................................................................... 18
viii
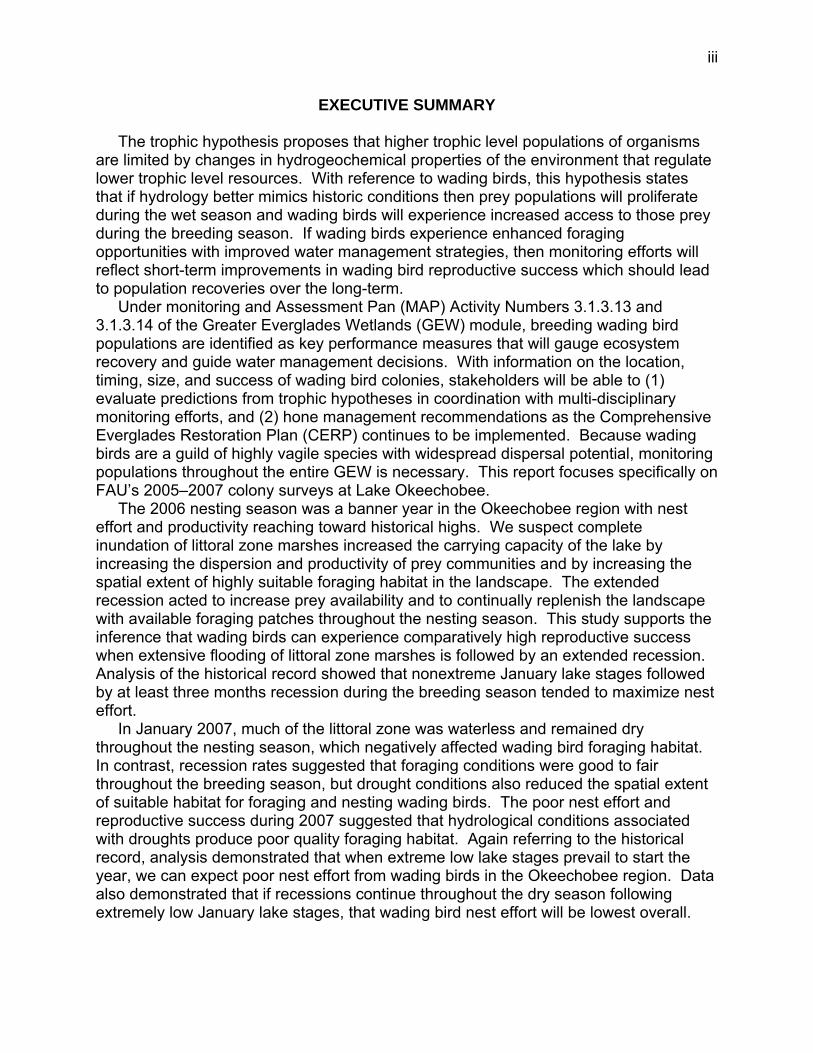
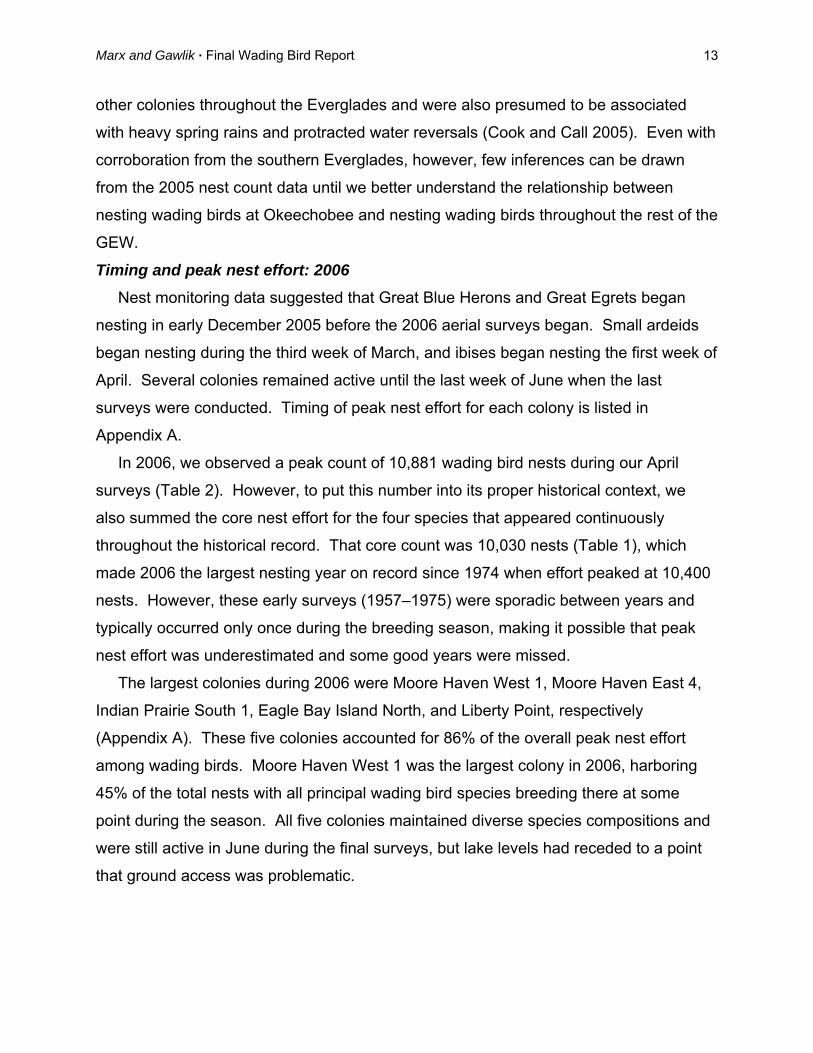
LIST OF FIGURES FIGURE Page 1 Historical record of wading bird nest effort from 1957–2007 for Lake
Okeechobee, FL. Data were collated from David 1994a, Smith and Collopy 1995, and the current Florida Atlantic University monitoring effort. Trend line based on 3-yr moving averages from 1971–1992, which were the most reliable and continuous survey results on record. Missing columns indicate no survey data for the given year........................................................................................ 2
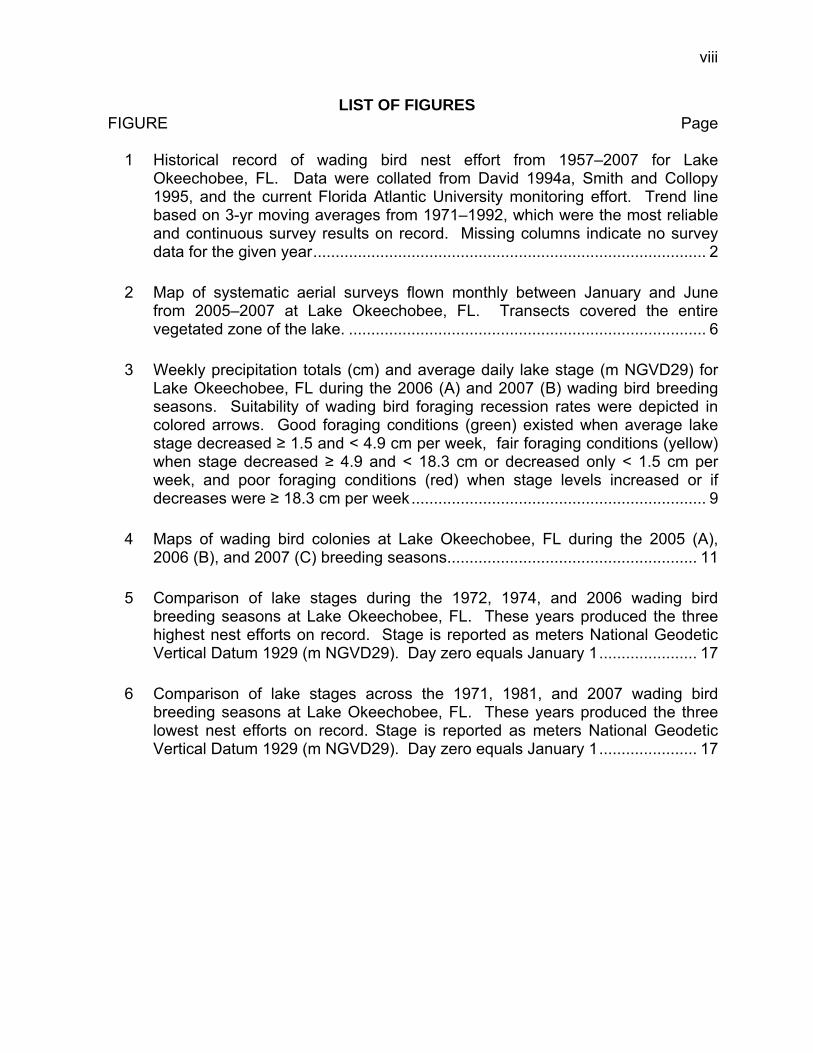
2 Map of systematic aerial surveys flown monthly between January and June
from 2005–2007 at Lake Okeechobee, FL. Transects covered the entire vegetated zone of the lake. ................................................................................ 6
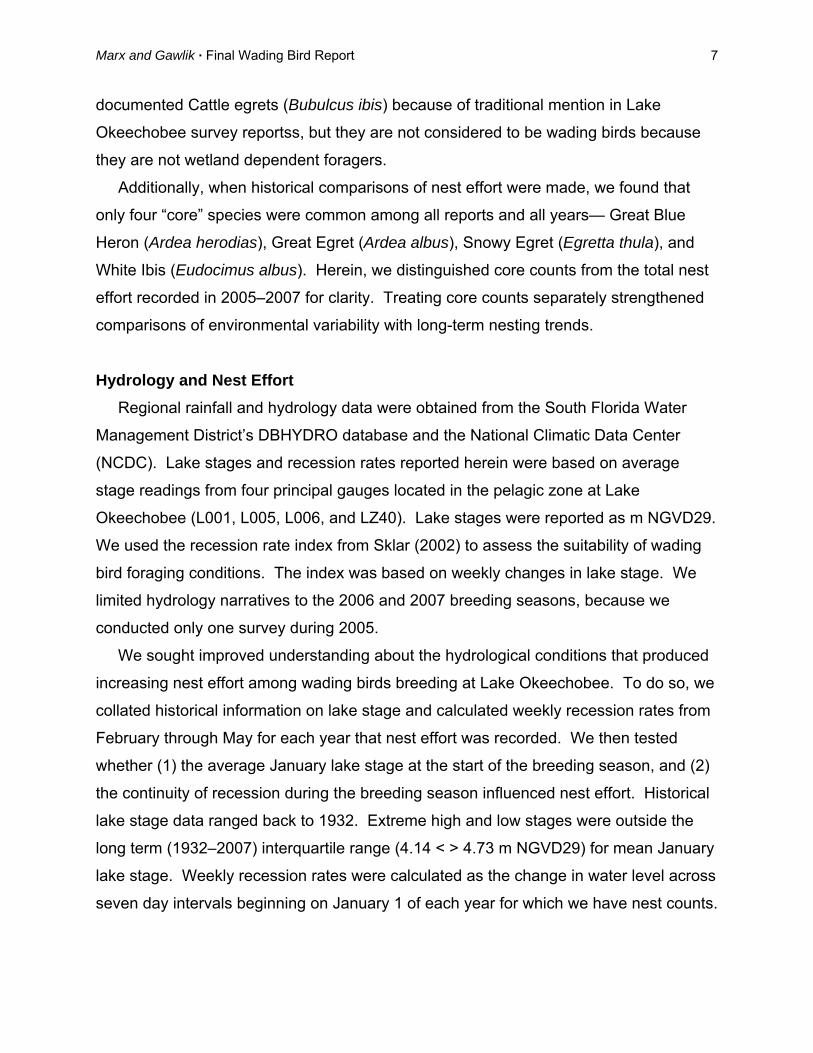
3 Weekly precipitation totals (cm) and average daily lake stage (m NGVD29) for
Lake Okeechobee, FL during the 2006 (A) and 2007 (B) wading bird breeding seasons. Suitability of wading bird foraging recession rates were depicted in colored arrows. Good foraging conditions (green) existed when average lake stage decreased ≥ 1.5 and < 4.9 cm per week, fair foraging conditions (yellow) when stage decreased ≥ 4.9 and < 18.3 cm or decreased only < 1.5 cm per week, and poor foraging conditions (red) when stage levels increased or if decreases were ≥ 18.3 cm per week.................................................................. 9
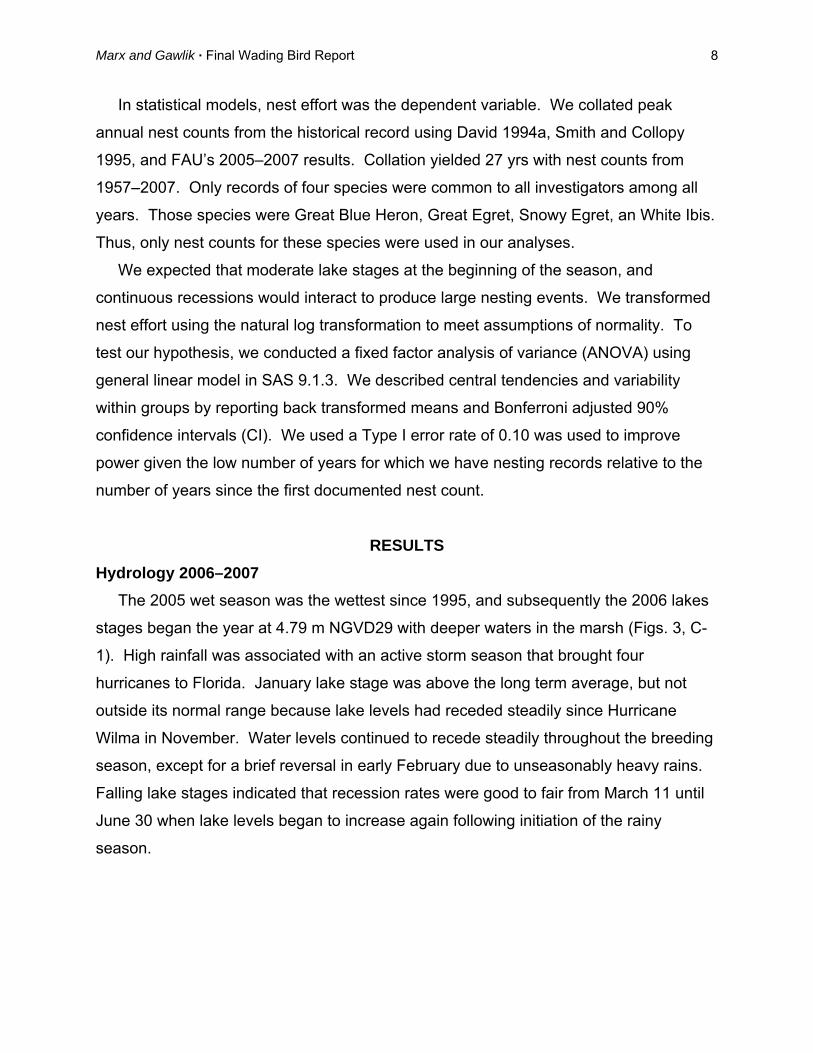
4 Maps of wading bird colonies at Lake Okeechobee, FL during the 2005 (A),
2006 (B), and 2007 (C) breeding seasons........................................................ 11 5 Comparison of lake stages during the 1972, 1974, and 2006 wading bird
breeding seasons at Lake Okeechobee, FL. These years produced the three highest nest efforts on record. Stage is reported as meters National Geodetic Vertical Datum 1929 (m NGVD29). Day zero equals January 1...................... 17
6 Comparison of lake stages across the 1971, 1981, and 2007 wading bird
breeding seasons at Lake Okeechobee, FL. These years produced the three lowest nest efforts on record. Stage is reported as meters National Geodetic Vertical Datum 1929 (m NGVD29). Day zero equals January 1...................... 17

ix
7 Contrasts of mean historical nest effort (1957–2007) among different hydrological conditions at Lake Okeechobee, FL. We compared years with extended and interrupted recessions among high, normal, and low January lake stages at the beginning of each nesting season. Means and 90%CIs were back transformed from analyses that used natural log transformed data to stabilize and homogenize variances. Extended recessions were continuous drops in water levels for at least 3 months from February to May. Interrupted recessions were breeding seasons characterized by recession reversals due to unseasonal rainfall when continuous recession never exceeded 2 months. Extreme high and low stages were outside the long term (1932–2007) interquartile range (4.14 < > 4.73 m NGVD29) for mean January lake stage ................................ 19
8 Landscape and zoomed views of foraging wading birds at Lake Okeechobee,
FL during the 2007 nesting season. Figs. 4A & 4B depict wading birds foraging in grass beds along littoral zone fringes in February. Figs. 4C & 4D depict wading birds foraging in shallow, wide-open, nearshore areas in May. Notice both foraging areas were still hydrologically connected to the pelagic zone. Yellow arrows mark foraging flock locations in landscape views...................... 22

x
LIST OF APPENDICES
APPENDIX Page A 2005–2007 Colony Coordinates and Total Peak Nest Effort. ........................... 28 B Species-specific Nest Histories ........................................................................ 30 C Available Wading Bird Foraging Habitat. .......................................................... 31

xi
ACRONYMS AND ABBREVIATIONS ARDsp – Ardeid species, reserved for characterization of Snowy Egret, Little Blue and Tricolored Heron reproductive indices because their nests and eggs are difficult to distinguish before chicks hatch C&SFP – Central and Southern Florida Project for Flood Control CAEG – Cattle Egret CERP – Comprehensive Everglades Restoration Plan DBHYDRO – the South Florida Water Management District's corporate environmental database which stores hydrologic, meteorologic, hydrogeologic and water quality data DOQQ – Digital Orthophotoquarterquadrangles DSR –Daily Survival Rate FAA – Federal Aviation Administration FAU – Florida Atlantic University GBHE – Great Blue Heron GEW – Greater Everglades Wetlands ecosystem, which includes the Kissimmee River, Lake Okeechobee, the Everglades, and Florida Bay GLIB – Glossy Ibis GREG – Great Egret HSI – Habitat Suitability Index LBHE – Little Blue Heron LOPP – Lake Okeechobee Protection Plan m NGVD29 – meters National Geodetic Vertical Datum 1929 MAP – Monitoring and Assessment Plan NCDC – National Climatic Data Center RECOVER – Restoration, Coordination and Verification program SFWMD – South Florida Water Management District SNEG – Snowy Egret TRHE – Tricolored Heron USACE – United States Army Corps of Engineers WHIB – White Ibis WOST – Wood Stork WRDA 2000 – Water Resources Development Act of 2000 WSE – Water Supply and Environment

Marx and Gawlik · Final Wading Bird Report 1
INTRODUCTION Historical Wading Bird Nest Effort at Lake Okeechobee Wildlife biologists recognized as early as the 1930’s that Lake Okeechobee was an
important nesting ground for many of South Florida’s wading birds (David 1994a). An
historically expansive freshwater marsh that was hydrologically connected to the lake
provided quality nesting and foraging habitat for colonially breeding wading birds during
dry season recessions. Wading bird reproduction coincided with the timing of these dry-
downs, because when water levels receded, the expansive freshwater marshes
supplied high concentrations of vulnerable prey in shallow pools that lingered within
topographic depressions (Kushlan 1976a, Kushlan 1986, Frederick and Collopy 1989a,
Loftus and Eklund 1994, Gawlik 2002). Today, Okeechobee’s littoral zone harbors the
last remnants of freshwater marsh still hydrologically connected to the lake basin.
In 1978, water managers proposed increasing the regulation schedule from 3.96–
4.72 to 4.72–5.33 m National Geodetic Vertical Datum 1929 (NGVD29). At the time,
regulation schedules represented a management envelope whereby the minimum water
level represented a desired lake stage at the beginning of the wet season to allow for
flood protection and water storage, while the maximum water level represented a
desirable lake stage at the beginning of the dry season for water supply releases. From
1978–2000, managers operated under this elevated regulation schedule, which
increased water storage capacity but also tended to increase the frequency of years
with prolonged high water levels in littoral zone marshes (Zaffke 1984, David 1994a).
Similar to the Everglades, declines in the use of Okeechobee by foraging and
nesting wading birds reflected management impacts that disrupted the natural
hydrology of the lake (Zaffke 1984, David 1994b, Smith and Collopy 1995). To discern
effects of the proposed increase in lake levels, the SFWMD began monthly aerial
surveys of breeding wading birds (Zaffke 1984, David 1994b, Smith and Collopy 1995).
These surveys were conducted throughout the breeding season from 1978–1992. The
historical record provided results of surveys that were conducted from 1957–60, in
1971–72, in 1974–75, and in 1977 for comparison of pre- and post-management
changes following the increased regulation schedule.

Marx and Gawlik · Final Wading Bird Report 2
When compared to the historical record, David (1994a) showed that mean wading
bird nest effort at Lake Okeechobee declined by 60% in the ten years following the 1978
changes in the regulation schedule (Fig. 1, Appendix B). In general, researchers
concluded that disruptions to the timing, duration, and depth of wetland inundation
reduced the availability of littoral zone wetland habitats for wading birds and caused
declines in the nest effort and abundance among wading birds that depend on the lake
(Zaffke 1984, David 1994a, b, Smith and Collopy 1995, Havens and Gawlik 2005).
Prolonged high lake stages increased water depths in the littoral zone during the
breeding season, which likely reduced foraging habitat suitability and limited prey
availability (David 1994b). Moreover, these hydrological changes negatively impacted
the extent of willow (Salix caroliniana), which is the preferred nest substrate of wading
birds (Frederick and Collopy 1989b, David 1994b).
Lake experts currently recognize the need to operate under a regulation schedule
that minimizes the frequency and duration of high water levels and reintroduces natural
hydrological variability to restore lake health and the vitality of its wetland communities
Figure 1. Historical record of wading bird nest effort from 1957–2007 for Lake Okeechobee, FL. Datawere collated from David 1994a, Smith and Collopy 1995, and the current Florida Atlantic Universitymonitoring effort. Trend line based on 3-yr moving averages from 1971–1992, which were the mostreliable and continuous survey results on record. Missing columns indicate no survey data for the givenyear.
0
2000
4000
6000
8000
10000
12000
1957
1960
1963
1966
1969
1972
1975
1978
1981
1984
1987
1990
1993
1996
1999
2002
2005
Year
Nes
t Effo
rt

Marx and Gawlik · Final Wading Bird Report 3
(Steinman et al. 2002, USACE 2004, Havens and Gawlik 2005). The Water Supply and
Environment (WSE) regulation schedule was organized under an adaptive framework
that allows for periodic managed recessions of lake levels during dry season (Steinman
et al. 2002), which is significant for wading birds because management coincides with
the onset of the wading bird colony formation. Recessions are deemed necessary to
maintain the diverse aquatic vegetation, invertebrate, and fish communities which
inhabit the lake, but may also sustain regional wading bird populations (SFWMD 2004,
Havens and Gawlik 2005). Following from the trophic level hypothesis for Everglades
wading birds, the new regulation schedule authorized under the Lake Okeechobee
Protection Plan (LOPP) should benefit wading birds, and continued documentation of
wading bird breeding effort in coordination with other monitoring programs should help
lake experts evaluate the effectiveness of water management procedures.
Restoration and the Trophic Hypothesis In response to concern about the integrity of South Florida ecosystems, the United
States Congress mandated the Water Resources Development Act of 2000 (WRDA
2000). Legislation authorized the Comprehensive Everglades Restoration Plan
(CERP), which serves as a framework for developing modifications and operational
changes to the Central and Southern Florida Project for Flood Control (C&SFP) that will
attempt to balance restoration goals with other ecosystem services (USACE 2000).
Provisions within WRDA 2000 also authorized creation of an adaptive Monitoring and
Assessment Program (MAP). The MAP outlines performance measures that are
representative of healthy South Florida ecosystems that will be used to evaluate the
success of CERP. Under MAP Activity Numbers 3.1.3.13 and 3.1.3.14 of the Greater
Everglades Wetlands module, breeding wading bird populations are identified as key
performance measures that should be monitored to gauge ecosystem recovery and
guide water management decisions (Jacobs 2005).
Wading birds are top predators in the GEW ecosystem, and healthy populations are
emblematic of a robust South Florida wetland complex. Thus, healthy wading bird
populations are central to evaluating the trophic hypothesis upon which restoration is
centered. With information on the location, timing, size, and success of wading bird

Marx and Gawlik · Final Wading Bird Report 4
colonies, stakeholders will be able to (1) evaluate predictions from trophic hypotheses in
coordination with multi-disciplinary monitoring efforts, and (2) hone management
recommendations as CERP continues to be implemented.
The trophic hypothesis proposes that higher trophic level populations of organisms
are limited by changes in the hydrogeochemical properties of the environment that
regulate lower trophic level resources (DeAngelis et al. 1998, Curnutt et al. 2000). With
reference to wading birds, this hypothesis states that if hydrology better mimics historic
conditions then (1) increases in fish and macroinvertebrate populations will result, and
(2) wading bird access to those prey will be enhanced during the breeding season
(Fleming et al. 1994). More generally, if wading birds experience enhanced foraging
opportunities with improved water management strategies, then monitoring efforts will
reflect short-term improvements in wading bird reproductive success which will lead to
population recoveries over the long-term.
Because wading birds are a guild of highly vagile species with widespread dispersal
potential, monitoring populations throughout the entire GEW is necessary. Multiple
components of the MAP wading bird monitoring are being conducted concurrently in
Florida Bay by National Audubon Society, in the southern Everglades by National Park
Service staff, in the central and northern Everglades by University of Florida, and at
Lake Okeechobee by Florida Atlantic University. This report focuses specifically on
breeding wading bird populations in the Lake Okeechobee region. Results will expand
upon the historical wading bird dataset that has already served as an early warning of
ecological degradation throughout the GEW (Kushlan 1993, David 1994a, Ogden 1994,
Weller 1995, Crozier and Gawlik 2003, Frederick and Ogden 2003).
Current Monitoring Effort In May of 2005, Florida Atlantic University received funding to document the timing,
size and location of wading bird colonies at Lake Okeechobee as part of CERP
monitoring for the GEW. On June 3, 2005, we conducted a single aerial survey just as
the rainy season was beginning and lake levels were rising. Then from 2006–2007,
Florida Atlantic University (FAU) conducted monthly aerial surveys of breeding wading

Marx and Gawlik · Final Wading Bird Report 5
birds. To our knowledge, these efforts represent the first systematic aerial surveys at
Okeechobee since 1992.
Herein, we report results from the 2005–2007 colony surveys. Because of the late
project start in 2005, it is possible that some colonies had already abandoned their
nests, as they had done in the Everglades. While locations may be representative, we
could make no comparison of 2005 colony timing or size with 2006–2007 data. Thus,
we focused discussion of results on comparison of 2006–2007 nest data with ambient
environmental conditions during those years. Contrasting environmental conditions
respectively produced one of the best and one of the worst nesting years on record for
the Lake Okeechobee region.
METHODS Colony Surveys In June 2005, and monthly from January through June 2006–2007, observers
surveyed wading bird nests along systematic aerial transects (Fig. 2). Given the
inherent risk in low altitude aerial surveys, we maintained minimum safe altitude
guidelines outlined in Section 91.119 of Federal Aviation Administration (FAA)
Regulations. We flew transects in a Cessna 172 at an altitude of 244 m and a speed of
185 km/hr. One transect paralleled the eastern rim of the lake from Eagle Bay Island to
the Clewiston Lock. Remaining transects were oriented East-West, spaced at an
interval of 3 km, and traversed the littoral zone. Two observers searched for colonies,
one from each side of the plane.
When a colony was located, the colony was circled several times while we
documented species composition and counted nests. To maintain consistency with
past wading bird reports for Lake Okeechobee (e.g. Zaffke 1984, David 1994a, Smith
and Collopy 1995), we counted all birds sighted and categorized them as “nesting” if
nests were visible or known assemblages of nests existed for a species. At the largest,
most diverse, and accessible colonies, we followed aerial surveys with ground
monitoring to improve count accuracy (Frederick et al. 1996). Even so, despite
combined ground surveys and photographs, small dark-colored wading birds are difficult
to census, which diminishes our confidence in their observed nest numbers.

Marx and Gawlik · Final Wading Bird Report 6
We also recorded photographs and geographic coordinates with each visit and then
mapped colonies to specific stands of vegetation or islands onto 1-m resolution digital
orthophotoquarterquadrangles (DOQQ). Colonies were defined post-hoc as any
assemblage of ≥ 2 nests that were separated by ≥ 200 m (Erwin et al. 1981, Smith and
Collopy 1995). We calculated intercolony distances using ArcGIS.
Colony locations were documented on maps, and their coordinates were listed in
tables of peak nest effort. We compared colony locations to published maps of past
wading bird colony survey results from David (1994a) and Smith and Collopy (1995) to
determine whether a colony site was undocumented or previously occupied. We also
documented the timing of nest initiation and peak effort for each colony and species.
We defined “peak nest effort” as the peak seasonal nest count from monthly surveys to
maintain consistency with the historical record. Total nest effort summed the size of all
wading bird colonies each month, including Tricolored Herons (Egretta tricolor), Little
Blue Herons (Egretta caerulea), and Glossy Ibis (Plegadis falcinellus). We also
Figure 2. Map of systematic aerial surveys flown monthly between January and June from 2005–2007at Lake Okeechobee, FL. Transects covered the entire vegetated zone of the lake.
Marx and Gawlik · Final Wading Bird Report 7
documented Cattle egrets (Bubulcus ibis) because of traditional mention in Lake
Okeechobee survey reportss, but they are not considered to be wading birds because
they are not wetland dependent foragers.
Additionally, when historical comparisons of nest effort were made, we found that
only four “core” species were common among all reports and all years— Great Blue
Heron (Ardea herodias), Great Egret (Ardea albus), Snowy Egret (Egretta thula), and
White Ibis (Eudocimus albus). Herein, we distinguished core counts from the total nest
effort recorded in 2005–2007 for clarity. Treating core counts separately strengthened
comparisons of environmental variability with long-term nesting trends.
Hydrology and Nest Effort Regional rainfall and hydrology data were obtained from the South Florida Water
Management District’s DBHYDRO database and the National Climatic Data Center
(NCDC). Lake stages and recession rates reported herein were based on average
stage readings from four principal gauges located in the pelagic zone at Lake
Okeechobee (L001, L005, L006, and LZ40). Lake stages were reported as m NGVD29.
We used the recession rate index from Sklar (2002) to assess the suitability of wading
bird foraging conditions. The index was based on weekly changes in lake stage. We
limited hydrology narratives to the 2006 and 2007 breeding seasons, because we
conducted only one survey during 2005.
We sought improved understanding about the hydrological conditions that produced
increasing nest effort among wading birds breeding at Lake Okeechobee. To do so, we
collated historical information on lake stage and calculated weekly recession rates from
February through May for each year that nest effort was recorded. We then tested
whether (1) the average January lake stage at the start of the breeding season, and (2)
the continuity of recession during the breeding season influenced nest effort. Historical
lake stage data ranged back to 1932. Extreme high and low stages were outside the
long term (1932–2007) interquartile range (4.14 < > 4.73 m NGVD29) for mean January
lake stage. Weekly recession rates were calculated as the change in water level across
seven day intervals beginning on January 1 of each year for which we have nest counts.
Marx and Gawlik · Final Wading Bird Report 8
In statistical models, nest effort was the dependent variable. We collated peak
annual nest counts from the historical record using David 1994a, Smith and Collopy
1995, and FAU’s 2005–2007 results. Collation yielded 27 yrs with nest counts from
1957–2007. Only records of four species were common to all investigators among all
years. Those species were Great Blue Heron, Great Egret, Snowy Egret, an White Ibis.
Thus, only nest counts for these species were used in our analyses.
We expected that moderate lake stages at the beginning of the season, and
continuous recessions would interact to produce large nesting events. We transformed
nest effort using the natural log transformation to meet assumptions of normality. To
test our hypothesis, we conducted a fixed factor analysis of variance (ANOVA) using
general linear model in SAS 9.1.3. We described central tendencies and variability
within groups by reporting back transformed means and Bonferroni adjusted 90%
confidence intervals (CI). We used a Type I error rate of 0.10 was used to improve
power given the low number of years for which we have nesting records relative to the
number of years since the first documented nest count.
RESULTS Hydrology 2006–2007 The 2005 wet season was the wettest since 1995, and subsequently the 2006 lakes
stages began the year at 4.79 m NGVD29 with deeper waters in the marsh (Figs. 3, C-
1). High rainfall was associated with an active storm season that brought four
hurricanes to Florida. January lake stage was above the long term average, but not
outside its normal range because lake levels had receded steadily since Hurricane
Wilma in November. Water levels continued to recede steadily throughout the breeding
season, except for a brief reversal in early February due to unseasonably heavy rains.
Falling lake stages indicated that recession rates were good to fair from March 11 until
June 30 when lake levels began to increase again following initiation of the rainy
season.

Marx and Gawlik · Final Wading Bird Report 9
Figure 3. Weekly precipitation totals (cm) and average daily lake stage (m NGVD29) for Lake Okeechobee, FLduring the 2006 (A) and 2007 (B) wading bird breeding seasons. Suitability of wading bird foraging recessionrates were depicted in colored arrows. Good foraging conditions (green) existed when average lake stagedecreased ≥ 1.5 and < 4.9 cm per week, fair foraging conditions (yellow) when stage decreased ≥ 4.9 and < 18.3cm or decreased only < 1.5 cm per week, and poor foraging conditions (red) when stage levels increased or ifdecreases were ≥ 18.3 cm per week.
0.0
1.0
2.0
3.0
4.0
5.0
6.001
/01/
06
01/1
5/06
01/2
9/06
02/1
2/06
02/2
6/06
03/1
2/06
03/2
6/06
04/0
9/06
04/2
3/06
05/0
7/06
05/2
1/06
06/0
4/06
06/1
8/06
2
3
4
5
6
Weekly rainfall Daily lake stage
0.0
1.0
2.0
3.0
4.0
5.0
6.0
01/0
1/07
01/1
5/07
01/2
9/07
02/1
2/07
02/2
6/07
03/1
2/07
03/2
6/07
04/0
9/07
04/2
3/07
05/0
7/07
05/2
1/07
06/0
4/07
06/1
8/07
2
3
4
5
6
cent
imet
ers
met
ers
NG
VD29
(A)
(B)

Marx and Gawlik · Final Wading Bird Report 10
In 2007, hydrological conditions for the Lake Okeechobee region contrasted with
those of 2006 (Fig. 3). From June to December 2006, the Lake Okeechobee region
received its lowest wet-season rainfall accumulation over the last twelve years. The
SFWMD reported the drought was the third most severe on record. Lake levels began
the 2007 season 1.05 m lower than in 2006, extremely low for that time of year and
because lake levels never recovered from the previous dry season, the littoral zone had
remained waterless since May 2006. Average lake stage began at 3.74 m on January
1, 2007, and steadily receded throughout the breeding season, eventually reaching a
record low of 2.70 m on June 30, 2007. With little rainfall throughout the breeding
season, recession rates remained beneficial to foraging wading birds from January–
June.
Colony Locations, Timing, and Size Locations: 2005–2007
We located 8 colonies with nesting wading birds in June 2005 (Fig. 4), and 27
colonies in 2006. All detected colonies were on-lake during these years. We located 6
colonies in the Okeechobee region during 2007—four on-lake and two off-lake. Across
years, colony sites included both traditional sites recorded in the recent literature and
two novel sites (David 1994a and Smith and Collopy 1995). The most prominent
traditional sites included Clewiston Spit, Liberty Point, Moore Haven East 4, Indian
Prairie North 1, and Eagle Bay Island North (Appendix A). Only Indian Prairie South
and Torry Island in 2006 and Little Bear Beach and two off-lake colonies in 2007 were
previously undocumented sites.
In contrast to historical nesting reports, we did not observe any on-lake nesting
activity at either King’s Bar, Okeetantie, Harney Pond/Twin Palms, or Observation
Island. We also observed no activity at either Lake Hicpochee or in Cowpen Marsh, two
former colony sites outside of the lake levee (Smith and Collopy 1995). The five largest
colonies during 2006 were Moore Haven West 1, Moore Haven East 4, Indian Prairie
South 1, Eagle Bay Island North, and Liberty Point, respectively (Appendix A). We
grouped Moore Haven Marsh colonies into East and West because the marsh is split by
a canal that runs north-south. Moore Haven West 1 was a traditional colony site whose
Marx and Gawlik · Final Wading Bird Report 11
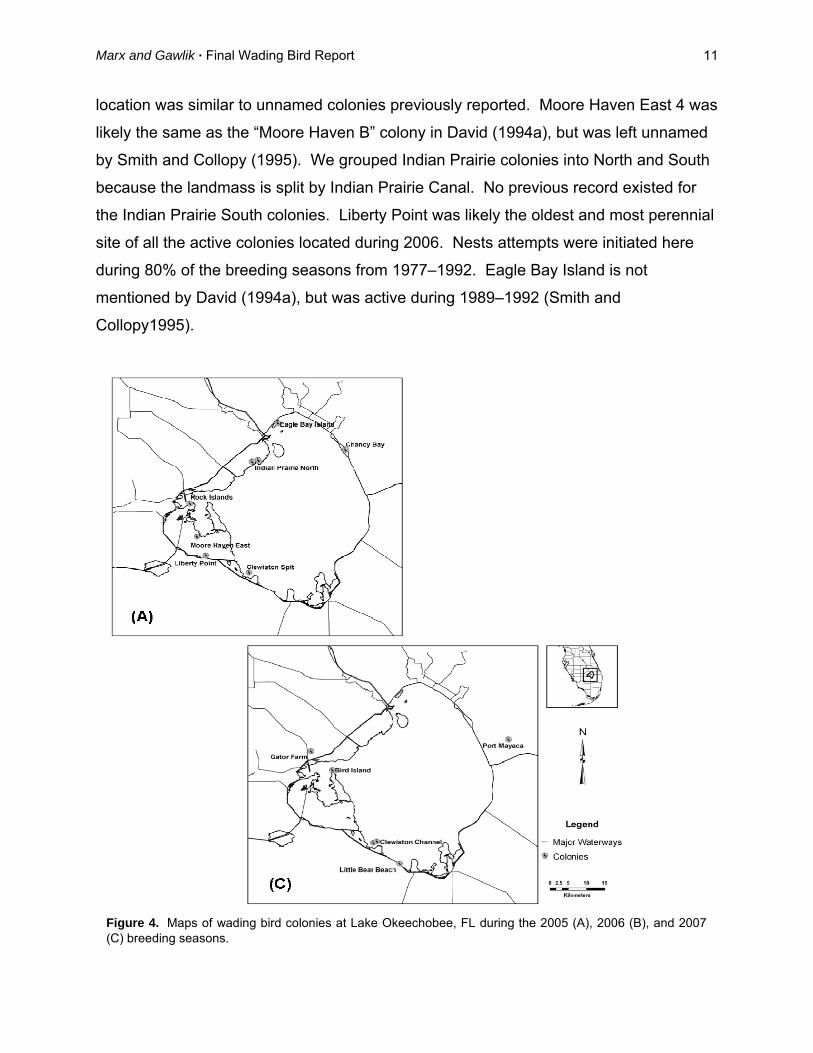
location was similar to unnamed colonies previously reported. Moore Haven East 4 was
likely the same as the “Moore Haven B” colony in David (1994a), but was left unnamed
by Smith and Collopy (1995). We grouped Indian Prairie colonies into North and South
because the landmass is split by Indian Prairie Canal. No previous record existed for
the Indian Prairie South colonies. Liberty Point was likely the oldest and most perennial
site of all the active colonies located during 2006. Nests attempts were initiated here
during 80% of the breeding seasons from 1977–1992. Eagle Bay Island is not
mentioned by David (1994a), but was active during 1989–1992 (Smith and
Collopy1995).
Figure 4. Maps of wading bird colonies at Lake Okeechobee, FL during the 2005 (A), 2006 (B), and 2007(C) breeding seasons.

Marx and Gawlik · Final Wading Bird Report 12
In 2007, the largest colony was Clewiston Spit. This colony was also consistently
mentioned in the historic literature and is the only site perennially occupied during the
study (Appendix A). Bird Island was the second colony site with significant nest effort in
2007. Smith and Collopy (1995) reported that Bird Island was occupied from 1989–
1992, but we did not detect a colony there until this year. Additionally, we located
another small colony on another spoil island along Clewiston Channel, ca. 800 m ENE
from Clewiston Spit; and another along the rim canal levee near Little Bear Beach. We
also detected two colonies off-lake during foraging wading bird reconnaissance—one on
an alligator farm near Lakeport and another at the Martin County Florida Power and
Light Reservoir near Port Mayaca. The last four mentioned colonies were previously
undocumented.
Nest effort: 2005
In 2005, the total number of nesting wading birds was below average (Table 1).
Recorded nest numbers were likely below the seasonal peak, because the count was
conducted at the end of the breeding season. It is possible that nest effort would have
been low anyway due to abandonment that is often linked with water reversals
associated with unseasonable rainfall (Frederick and Collopy 1989a). Stage
hydrographs reflected that average water depth steadily increased 26 cm from February
25–March 28, more than a month of rising water levels. Nest failures were observed in
2005 0 1,590 0 0 1,590
2006 55 1,782 2,393 5,800 10,030
2007 0 7 543 0 550
Mean 126 1,184 526 1,639 3,140
SE 38 163 108 440 557
IQ Range 8–192 200–1,240 145–664 200–2,100 1,326–4,000
White Ibis TotalYear Great Blue Heron Great Egret Snowy Egret
Table 1. Comparison of 2005–2007 core nest counts with long term (1957–1960,1971–1972, 1974–1975, 1977–1990) mean nest effort, standard error (SE), andinterquartile (IQ) range.
Marx and Gawlik · Final Wading Bird Report 13
other colonies throughout the Everglades and were also presumed to be associated
with heavy spring rains and protracted water reversals (Cook and Call 2005). Even with
corroboration from the southern Everglades, however, few inferences can be drawn
from the 2005 nest count data until we better understand the relationship between
nesting wading birds at Okeechobee and nesting wading birds throughout the rest of the
GEW.
Timing and peak nest effort: 2006
Nest monitoring data suggested that Great Blue Herons and Great Egrets began
nesting in early December 2005 before the 2006 aerial surveys began. Small ardeids
began nesting during the third week of March, and ibises began nesting the first week of
April. Several colonies remained active until the last week of June when the last
surveys were conducted. Timing of peak nest effort for each colony is listed in
Appendix A.
In 2006, we observed a peak count of 10,881 wading bird nests during our April
surveys (Table 2). However, to put this number into its proper historical context, we
also summed the core nest effort for the four species that appeared continuously
throughout the historical record. That core count was 10,030 nests (Table 1), which
made 2006 the largest nesting year on record since 1974 when effort peaked at 10,400
nests. However, these early surveys (1957–1975) were sporadic between years and
typically occurred only once during the breeding season, making it possible that peak
nest effort was underestimated and some good years were missed.
The largest colonies during 2006 were Moore Haven West 1, Moore Haven East 4,
Indian Prairie South 1, Eagle Bay Island North, and Liberty Point, respectively
(Appendix A). These five colonies accounted for 86% of the overall peak nest effort
among wading birds. Moore Haven West 1 was the largest colony in 2006, harboring
45% of the total nests with all principal wading bird species breeding there at some
point during the season. All five colonies maintained diverse species compositions and
were still active in June during the final surveys, but lake levels had receded to a point
that ground access was problematic.

Marx and Gawlik · Final Wading Bird Report 14
Janu
ary
3450
2 0
00
00
00
840
00
00
00
00
Febr
uary
3
9848
00
00
00
00
578
00
00
00
00
0
Mar
ch72
1,79
620
363
250
400
800
2,63
90
00
00
00
00
April
551,
782
2,39
323
418
265
05,
800
435
010
,881
07
543
157
015
041
127 6
May
221,
067
2,58
013
715
81,
530
2,98
062
00
7,56
40
713
710
714
886
05
111,
15
June
1565
51,
764
8382
1,21
517
030
50
3,07
43
00
04
1,26
00
011
1,26
2 Spe
cies
und
etec
ted
durin
g th
e su
rvey
1 Mon
thly
tota
ls e
xclu
ded
Cat
tle E
gret
s
Mon
thly
Tota
ls
CAE
GG
LIB
WH
IBLB
HE
TRH
ESN
EGG
REG
WO
STG
BH
EG
REG
SNEG
TRH
ELB
HE
WH
IB
2007
3 Ital
ics
deno
ted
annu
al p
eak
nest
effo
rt fo
r eac
h w
adin
g bi
rd s
peci
es
Tabl
e 2.
Com
paris
on o
f tot
al n
est e
ffort
by w
adin
g bi
rds
at L
ake
Oke
echo
bee,
FL
durin
g th
e 20
06 a
nd 2
007
bree
ding
sea
sons
.
GLI
BC
AEG
Mon
thly
To
tals
1
2006
GB
HE
WO
STM
onth

Marx and Gawlik · Final Wading Bird Report 15
Timing and peak nest effort: 2007
No wading bird nesting was detected via aerial surveys until April 2007 when we
detected colonies at Clewiston Spit and Bird Island. We suspect these colonies initiated
nesting earlier than aerial surveys would suggest because we observed Snowy Egrets
and Tricolored Herons carrying nest material into phragmites beds (Phragmites
australis) on April 3 via ground surveys. Initial nest monitoring efforts suggested that
courtship and nest building began during the third week of March, which was similar to
the timing of small ardeid nest initiation in 2006. Clewiston Spit and Bird Island grew
into the largest wading bird colonies for 2007. By mid-April wading bird nests peaked at
635 and 96 wading bird nests, respectively. However, the Clewiston Spit colony was
abandoned in May.
Two upstart colonies and one previously undetected colony were detected in May.
The upstart colonies were at Little Bear Beach and in Port Mayaca. The effort at Little
Bear Beach was short-lived and birds abandoned the colony by June surveys. The Port
Mayaca colony was located in the middle of the Martin County Florida Power and Light
Reservoir and was still active in June, but due its proximity to the power plant we were
unable to survey the area effectively. The previously undetected Gator Farm colony
contained 11 Wood Stork (Mycteria americana) nests along with 73 other wading bird
nests when it was detected in May (Appendix A). We monitored the Wood Stork nests
from the air (see below), but we were unable to monitor other wading bird nests
because the colony was on private land.
In 2007, season-wide nest effort for all wading birds breeding in the Okeechobee
region peaked in April at 760 nests (Table 2). By comparison, a partial count of nest
effort was 553 nests, far below average and ranking the third lowest on record (Table
1). Only counts from 1971 and 1981 ranked lower. In 2007, we observed no on-lake
nesting among Great Blue Herons, Great Egrets, Little Blue Herons, or White Ibis.
Similar to 1971, no Great Egrets and no Great Blue Herons were detected, and in 1981,
some Great Egrets nested but not Great Blue Herons or Glossy Ibis (David 1994a).

Marx and Gawlik · Final Wading Bird Report 16
Wood Stork Reproductive Success In 2007, we detected of a small Wood Stork colony in cypress trees on an alligator
farm about 4 km north of Harney Pond along Highway 721. During aerial
reconnaissance, we detected 12 Wood Stork pairs nesting on April 19. Maturity of
Wood Stork chicks at the time suggested that storks began nesting between the first
and second weeks of March.
Despite getting a late start, the colony fledged 22 young at the end of June. On June
14, plumage condition and movement away from the nest to adjacent branches
suggested that chicks were 55-60 days old (Coulter et al. 1999). During our last visit on
June 26, we observed only 9 chicks left at the colony and expect that all nestlings
eventually fledged following the postflight period of attachment to nest sites (Kahl 1964,
Coulter et al. 1999).
Historical Wading Bird Nest Effort and Hydrology Favorable conditions, such as average to above average lake stages at the start of
the nesting season followed by a protracted hydrologic recession, were observed at
Lake Okeechobee during 2006. Given research from the Everglades, which indicated
(1) the importance of prolonged hydroperiods for increasing fish and invertebrate
populations and (2) the benefit of dry season recessions that concentrate those prey to
wading bird foraging strategies (Kushlan 1976a,b, 1979, 1980,1986; Powell 1987,
Frederick and Collopy 1989a, Loftus and Eklund 1994, Gawlik 2002), we expect
similarly favorable hydrological conditions at Lake Okeechobee contributed to the high
reproductive effort observed during 2006. Additionally, data suggested that conditions
were qualitatively similar in 1972 and 1974, years with similarly high nest counts, when
lake stage began the year within the long term interquartile range and then experienced
an extended recession throughout the breeding season (Fig. 5). In 1972, however,
spring rains slowed recession rates and the rainy season began a few weeks earlier
than the other comparable seasons.

Marx and Gawlik · Final Wading Bird Report 17
Figure 5. Comparison of lake stages during the 1972, 1974, and 2006 wading bird breeding seasons at LakeOkeechobee, FL. These years produced the three highest nest efforts on record. Stage is reported as metersNational Geodetic Vertical Datum 1929 (m NGVD29). Day zero equals January 1.
Figure 6. Comparison of lake stages across the 1971, 1981, and 2007 wading bird breeding seasons at LakeOkeechobee, FL. These years produced the three lowest nest efforts on record. Stage is reported as metersNational Geodetic Vertical Datum 1929 (m NGVD29). Day zero equals January 1.
2.50
3.00
3.50
4.00
4.50
5.00
0 15 30 45 60 75 90 105
120
135
150
165
180
Days of the Breeding Season
m N
GVD
29
1971
1981
2007
2.50
3.00
3.50
4.00
4.50
5.00
0 15 30 45 60 75 90 105
120
135
150
165
180
Days of the Breeding Season
m N
GVD
291972
1974
2006

Marx and Gawlik · Final Wading Bird Report 18
In contrast, 2007 was one of the worst nesting years on record. Again, similar
counts in 1971 and 1981 had qualitatively similar hydrology. The three seasons were
characterized by low lake stages to start the breeding season and below average
rainfall during the preceding wet season (Fig. 6). Data suggested that extreme low lake
stages followed by a steady recession may limit wading bird nest effort at Lake
Okeechobee and that these conditions likely contributed to the poor reproductive
performance of wading birds at Okeechobee despite a favorable recession throughout
the breeding season.
To better understand the dynamic interaction between lake stage and recessions, we
sought to quantitatively characterize the relationship between hydrological conditions
and nest effort. Mean January lake stage and recession type produced significant
effects on wading bird nest effort (Table 3). Extremely low or high initial lake stages
tended to reduce peak nest effort (Fig. 7). Recession per se was not significant, but the
interaction of recession type with initial lake stage was. Normal initial lake stages in
January followed by a continuous recession produced the highest nest effort among
wading birds that breed at Lake Okeechobee (Fig. 7). Data also showed that nest effort
is lowest when extreme low initial lake stages are followed by steady recessions.
Corrected Model 14.4 5 2.9 5.2 0.003Intercept 948.4 1 948.4 1712.2 > 0.001Stage 8.7 2 4.4 7.9 0.003Recession 0.3 1 0.3 0.5 0.498Stage * Recession 4.8 2 2.4 4.3 0.027Error 11.6 21 0.6Corrected Total 26.0 26
M.S.E.
Table 3. ANOVA results (adj.-R2 = 0.45) for the effects of average January lake stage andrecession continuity across the breeding season on wading bird nest effort at LakeOkeechobee, FL.
PFSource Type III Sum of Squares d.f.

Marx and Gawlik · Final Wading Bird Report 19
DISCUSSION
2006 Nesting Season As the result of an active 2005 storm season that included Hurricane Wilma in
October, lake stages began the dry period extremely high. But a managed recession of
Lake Okeechobee immediately following the storm season dropped lake levels from
extremely high levels (5.22 m) in November back to normal levels (< 4.73 m) by January
2006. During heavy wet seasons, high lake levels will flood the littoral zone as water
piles up against the Hoover Dike. Early in the season then, extensive inundation can
engender low quality foraging habitat for wading birds due to deeper waters (> 30 cm) in
freshwater marshes. Despite reduced foraging opportunities, the flooding process
enhances marsh colonization and productivity among prey fishes and aquatic
macroinvertebrates (Kushlan 1976b, Chick and Mclvor 1994, Loftus and Eklund 1994,
Figure 7. Contrasts of mean historical nest effort (1957–2007) among different hydrologicalconditions at Lake Okeechobee, FL. We compared years with extended and interruptedrecessions among high, normal, and low January lake stages at the beginning of each nestingseason. Means and 90%CIs were back transformed from analyses that used natural logtransformed data to stabilize and homogenize variances. Extended recessions werecontinuous drops in water levels for at least 3 months from February to May. Interruptedrecessions were breeding seasons characterized by recession reversals due to unseasonalrainfall when continuous recession never exceeded 2 months. Extreme high and low stageswere outside the long term (1932–2007) interquartile range (4.14 < > 4.73 m NGVD29) formean January lake stage.
0
2000
4000
6000
8000
high moderate low
January Lake Stage
Nes
t Effo
rtextendedinterrupted

Marx and Gawlik · Final Wading Bird Report 20
Smith et al. 1995, Johnson et al. 2007), which in turn increases the energetic potential
of foraging patches that become exposed during the dry season recession (Smith
1995a, Smith and Collopy 1995, Smith et al. 1995).
Observations suggested that wading birds began concentrating foraging efforts on-
lake once the average lake stage dropped below 4.7 m in March and water depths in
the marsh became suitable (Marx and Gawlik 2006). Thereafter, a steady protracted
recession with no major reversals in the receding water pattern provided good to fair
foraging conditions for several months during the breeding season. The recession likely
exposed new foraging patches regularly throughout the season and gave wading birds
time to complete their nest cycle (Frederick and Collopy 1989a, Smith and Collopy
1995). Moreover, as water levels continued to fall, abundant prey communities that
proliferated during the wet season were likely concentrated among isolated pools that
lingered in longer hydroperiod areas of the littoral zone, similar to slough habitats in the
Everglades (Kushlan 1976b, Smith et al. 1995).
We expect the favorable hydrological conditions increased Okeechobee’s carrying
capacity for wading birds, which led to high reproductive effort and success. The 2006
nesting season was a banner year in the Okeechobee region with nest effort and
productivity reaching toward historical highs. We expect complete inundation of the
littoral zone marshes increased the carrying capacity of the lake (1) by increasing the
dispersion and productivity of prey communities, and (2) by increasing the available
pool of potential of highly suitable foraging habitat (Fig. C-1). The extended recession
acted to increase prey availability and to continually replenish the landscape with
available foraging patches throughout the nesting season (Frederick and Collopy
1989a, Smith et al. 1995, Gawlik et al. 2004).
Powell and Powell (1986) suggested that reproductive success of wading birds and
foraging habitat quality are positively correlated. Given the similarity of hydrological
conditions among years with similarly high wading bird nest effort, data provided some
guidance for the hydrologic conditions that might increase the quality of wading bird
foraging habitats on-lake. This study supports the inference that wading birds can
experience comparatively high reproductive success when extensive flooding of littoral
zone marshes is followed by an extended recession, which in turn suggests these

Marx and Gawlik · Final Wading Bird Report 21
conditions provide quality foraging habitat (Powell 1987, Frederick and Collopy 1989a,
Smith 1995a, Smith et al. 1995). Thus, we suggest that on-lake habitat quality for
breeding wading birds at Okeechobee is optimized when extensive inundation of the
littoral zone during the wet season is followed by an extended recession during the
spring dry down. Analysis of the historical record corroborated our conclusion when
data showed that nonextreme January lake stages followed by at least three months
recession during the breeding season tended to maximize nest effort.
2007 Nesting Season In January 2007, much of the littoral zone was waterless and remained dry
throughout the nesting season, which negatively affected wading bird foraging habitat.
In contrast, recession rates suggested that foraging conditions were good to fair
throughout the breeding season (Fig. 3). Still, by the start of the year, only the edges of
the littoral zone remained inundated, and habitats with suitable water depths were still
connected to the pelagic zone where fish could disperse into lower densities (Chick and
Mclvor 1994). Lake Okeechobee is a shallow lake—shallow enough that plenty of
suitable foraging habitat existed in 2007 if water levels and recession rates were
considered in isolation. However, the interaction of hydrology with local floristic and
microtopographic pattern is a fundamental mechanism for enhancing prey availability,
and observations suggested that extensive hydrologic connectivity among available
foraging patches and the lake’s basin prevented recession mechanisms from
concentrating prey into shallow isolated pools, possibly making prey less vulnerable to
capture (Kushlan 1976a, Frederick and Collopy 1989a, Smith 1995a, Smith et al. 1995).
In complement, drought conditions also reduced the spatial extent of suitable
habitats for foraging and nesting wading birds (Smith and Collopy 1995). On-lake
foraging observations indicated that wading birds were limited to feeding in grass (e.g.
Panicum hemitomon and P. repens) and bulrush (Scirpus californicus) beds along the
margin of the littoral and nearshore zones to start the season. These beds completely
dried down by May, leaving wading birds to forage in shallow, wide-open-water,
nearshore and pelagic zones (Figs. 8, C-2). Additionally, nesting wading birds prefer
woody islands, especially willow heads, surrounded by water for colony sites (Frederick

Marx and Gawlik · Final Wading Bird Report 22
and Collopy 1989b, Smith and Collopy 1995). By January 2007, however, lake levels
were low enough that traditional colony sites in the littoral zone were waterless. Birds
were left to nest in phragmites stands on spoils islands. Then, early in May as the
drought continued, the lake bed surrounding the Clewiston Spit colony became
completely exposed, which might have been one of the factors that contributed to
abandonment.
Hydrological conditions between 2007 and other correspondingly weak nesting years
exhibited a similar pattern. For each of these years, drought precluded inundation of
the littoral zone during preceding wet season months, low lake stages (≤ 4.14 m)
prevailed to begin the year, and a steady recession brought lake stages below 3.35 m.
Figure 8. Landscape and zoomed views of foraging wading birds at Lake Okeechobee, FL during the2007 nesting season. Figs. 4A & 4B depict wading birds foraging in grass beds along littoral zonefringes in February. Figs. 4C & 4D depict wading birds foraging in shallow, wide-open, nearshoreareas in May. Notice both foraging areas were still hydrologically connected to the pelagic zone.Yellow arrows mark foraging flock locations in landscape views.

Marx and Gawlik · Final Wading Bird Report 23
We observed a 93% reduction in nest effort from the 2006 to the 2007 breeding
seasons and suspect that this year’s poor reproductive effort was associated with
drought conditions that persisted throughout the breeding season. Low lake stages
associated with prolonged drought likely limited littoral zone prey production and
foraging habitat availability for wading birds (Fig. C-2), which would combine to diminish
the carrying capacity of Lake Okeechobee for colonially breeding wading birds (Smith et
al. 1995). Poor reproductive success suggests that the hydrological conditions
associated with droughts produce poor quality foraging habitat. Analysis of the
historical nest record showed that when extreme low lake stages prevail to start the
year, we can expect poor nest effort from wading birds in the Okeechobee region. Data
also demonstrated that if recessions continue throughout the dry season with low
starting stages, then wading bird nest effort will be lowest overall.
We should also note that low nest effort has also been linked to prolonged high lake
stages. David (1994) reported that prolonged high water levels during the late 1970s
and early 1980s coincided with declines in wading bird nest effort. And in 1984, the
only other year with extreme low wading bird nest effort (< 1,000 nests), lake stages had
remained high since August 1982, and breeding season hydrology was characterized
by periodic reversals and increasing lake levels. Thus, extended periods of extreme
lake stage, whether high or low, appear to have similarly negative impacts on wading
bird populations (David 1994a, Smith et al. 1995, Frederick and Ogden 2001).
Additional research into the effects of different hydrological scenarios on habitat
availability and wading bird reproduction is on-going.
Management Implications The importance of Lake Okeechobee to south Florida wading bird populations
should not be underestimated. In 2006, if wading bird nest effort at Lake Okeechobee
is included in system-wide estimates of nest effort, then Okeechobee colonies
accounted for 17% of all nests in the GEW. Whether as a population source for wading
birds that breed throughout the GEW, or as an important post-breeding dispersal
stopover site for species of special management concern such as Roseate Spoonbills
and Wood Storks, Lake Okeechobee continues to serve as a critical ecosystem

Marx and Gawlik · Final Wading Bird Report 24
component for wading birds that breed in the GEW (Zaffke 1984, David 1994a, Smith
and Collopy 1995, Havens and Gawlik 2005).
From this study to-date, we can offer coarse-grained recommendations for Lake
Okeechobee management strategies that will benefit wading birds. Analysis of the
historical record supported Gawlik and Crozier’s (2007) assertion that water levels may
provide the cue that wading birds respond to when selecting foraging habitats while
recession provides the mechanism driving prey availability and thereby quality of the
foraging habitat once it has been selected by the individual. Wading birds apparently
respond positively to moderate lake levels at the beginning of the year that fall within the
long term interquartile range of lake stages for January (4.73 < > 4.14 m NGVD29).
These conditions promote productivity of their prey base and maximize the spatial
extent of potential foraging habitat during extended recessions (Smith et al. 1995).
While seasonal dry downs concentrate prey communities and enhance their availability
to wading birds during the breeding season when energetic demands are high. Thus,
we also suggest that dry season recessions following inundation of the littoral zone are
a necessary aspect of lake management to promote and sustain wading birds that
breed at Lake Okeechobee.
LITERATURE CITED Chick, J. H., and C. C. Mclvor. 1994. Patterns in the abundance and composition of
fishes among beds of different macrophytes: viewing a littoral zone as a landscape. Canadian Journal of Fisheries and Aquatic Sciences 51:2873-2882.
Cook, M. I., and E. M. Caul. 2005. System-wide summary. 2005 South Florida Wading Bird Report, West Palm Beach, FL.
Coulter, M. C., J. A. Rodgers, J. C. Ogden, and F. C. Depkin. 1999. Wood Stork (Mycteria americana). In A. Poole, and F. Gill, editors. The Birds of North America, No. 409. The Birds of North America, Inc., Philadelphia, PA.
Crozier, G. E., and D. E. Gawlik. 2003. Wading bird nesting effort as an index to wetland ecosystem integrity. Waterbirds 26:303-324.
Curnutt, J. L., J. Comiskey, M. P. Nott, and L. J. Gross. 2000. Landscape-based spatially explicit species index models for Everglades restoration. Ecological Applications 10:1849-1860.
David, P. G. 1994a. Wading bird nesting at Lake Okeechobee, Florida: an historic perspective. Colonial Waterbirds 17:69-77.
David, P. G. 1994b. Wading bird use of Lake Okeechobee relative to fluctuating water levels. Wilson Bulletin 106:719-732.

Marx and Gawlik · Final Wading Bird Report 25
DeAngelis, D. L., L. J. Gross, M. A. Huston, W. F. Wolff, D. M. Fleming, E. J. Comiskey, and S. M. Sylvester. 1998. Landscape modeling for everglades ecosystem restoration. Ecosystems 1:64-75.
Erwin, R. M., J. Galli, and J. Burger. 1981. Colony site dynamics and habitat use in Atlantic Coast seabirds. Auk 98:550-561.
Fleming, D. M., W. F. Wolff, and D. L. Deangelis. 1994. Importance of Landscape Heterogeneity to Wood Storks in Florida Everglades. Environmental Management 18:743-757.
Frederick, P. C., and M. W. Collopy. 1989a. Nesting success of five Ciconiiform species in relation to water conditions in the Florida Everglades. Auk 106:625-634.
Frederick, P. C., and M. W. Collopy. 1989b. The Role of Predation in Determining Reproductive Success of Colonially Nesting Wading Birds in the Florida Everglades. Condor 91:860-867.
Frederick, P. C. 1995. Wading bird nesting success studies in the Water Conservation Areas of the Everglades, 1992-1995, Final Report. South Florida Water Management District, West Palm Beach, FL.
Frederick, P. C., T. Towles, R. J. Sawicki, and G. T. Bancroft. 1996. Comparison of aerial and ground techniques for discovery and census of wading bird (Ciconiiformes) nesting colonies. Condor 98:837-841.
Frederick, P. C., and J. C. Ogden. 2001. Pulsed breeding of long-legged wading birds and the importance of infrequent severe drought conditions in the Florida Everglades. Wetlands 21:484-491.
Frederick, P. C., and J. C. Ogden. 2003. Monitoring wetland ecosystems using avian populations: seventy years of surveys in the Everglades. In D. E. Busch, and J. C. Trexler, editors. Monitoring Ecosystems: Interdisciplinary Approaches for Evaluating Ecoregional Initiatives. Island Press, Washington, D.C.
Gawlik, D. E. 2002. The effects of prey availability on the numerical response of wading birds. Ecological Monographs 72:329-346.
Gawlik, D. E., G. Crozier, and K. C. Tarboton. 2004. Wading bird habitat suitability index. In K. C. Tarboton, M. M. Irizarry-Ortiz, D. P. Loucks, S. M. Davis, and J. T. Obeysekera, editors. Report: Habitat Suitability Indices for Evaluating Water Management Alternatives. West Palm Beach, FL, South Florida Water Management District.
Havens, K. E., and D. E. Gawlik. 2005. Lake Okeechobee conceptual ecological model. Wetlands 25:908-925.
Jacobs, K. 2005. Summary of CERP systemwide assessment performance measures, Appendix 7-1, 2005 South Florida Environmental Report. 1-11 p. South Florida Water Management District, West Palm Beach, FL.
Johnson, K. G., M. S. Allen, and K. E. Havens. 2007. A review of littoral vegetation, fisheries, and wildlife responses to hydrologic variation at Lake Okeechobee. Wetlands 27:110-126.
Kahl, M. P., Jr. 1964. Food ecology of the Wood Stork (Mycteria americana) in Florida. Ecological Monographs 34:97-117.
Kushlan, J. A. 1976a. Wading bird predation in a seasonally fluctuating pond. Auk 93:464-476.

Marx and Gawlik · Final Wading Bird Report 26
Kushlan, J. A. 1976b. Environmental stability and fish community diversity. Ecology 57:821-825.
Kushlan, J. A. 1979. Feeding ecology and prey selection in the white ibis. Condor 81:376-389.
Kushlan, J. A. 1980. Population fluctuations of Everglades fishes. Copeia 4:870-874. Kushlan, J. A. 1981. Resource use strategies of wading birds. Wilson Bulletin 93:145-
163. Kushlan, J. A. 1986. Responses of wading birds to seasonally fluctuating water levels:
strategies and their limits. Colonial Waterbirds 9:155-162. Kushlan, J. A. 1993. Colonial waterbirds as indicators of environmental change.
Colonial Waterbirds 16:223-251. Lodge, T. E. 2004. The Everglades handbook: understanding the ecosystem. CRC
Press, Boca Raton, FL. Loftus, W. F., and A. M. Eklund. 1994. Long-term dynamics of an Everglades small-
fish assemblage. In S. M. Davis, and J. C. Ogden, editors. Everglades: The Ecosystem and Its Restoration. St. Lucie Press, Delray Beach, FL.
Marx, D. E., and D. E. Gawlik. 2006. Wading bird colony location and size at Lake Okeechobee. In M. I. Cook, and E. M. Caul, editors. South Florida Wading Bird Report. South Florida Water Management District, West Palm Beach, FL.
Ogden, J. C. 1994. A comparison of wading bird nesting colony dynamics (1931-1946 and 1974-1989) as an indication of ecosystem conditions in the southern everglades. In S. Davis, editor. Everglades: the ecosystem and its restoration. St. Lucie Press, Delray Beach, FL.
Powell, G. V. N., and A. H. Powell. 1986. Reproduction by Great White Herons Ardea-Herodias in Florida Bay as an Indicator of Habitat Quality. Biological Conservation 36:101-113.
Powell, G. V. N. 1987. Habitat use by wading birds in a subtropical estuary: implications of hydrography. Auk 104:740-749.
SFWMD. 2004. Lake Okeechobee Protection Plan. South Florida Water Management District, West Palm Beach, FL.
Sklar, F. H., C. McVoy, R. VanZee, D. E. Gawlik, K. C. Tarboton, D. Rudnick, S. Miao, and T. Armentano. 2002. The effects of altered hydrology on the ecology of the Everglades. In J. W. Porter, and K. G. Porter, editors. The Everglades, Florida Bay, and Coral Reefs of the Florida Keys: An Ecosystem Sourcebook. CRC Press, Boca Raton, FL.
Smith, D. H., R. M. Smart, and C. G. Hanlon. 2004. Influence of water level on torpedograss establishment in Lake Okeechobee, Florida. Lake and Reservoir Management 20:1-13.
Smith, J. P. 1995a. Foraging flights and habitat use of nesting wading birds (Ciconiiformes) at Lake Okeechobee, Florida. Colonial Waterbirds 18:139-158.
Smith, J. P. 1995b. Foraging sociability of nesting wading birds (Ciconiiformes) at Lake Okeechobee, Florida. Wilson Bulletin 107:437-451.
Smith, J. P., and M. W. Collopy. 1995. Colony turnover, nest success and productivity, and causes of nest failure among wading birds (Ciconiiformes) at Lake Okeechobee, Florida (1989-1992). Archiv fur Hydrobiologie, Advances in Limnology 45:287-316.

Marx and Gawlik · Final Wading Bird Report 27
Smith, J. P., J. R. Richardson, and M. W. Collopy. 1995. Foraging habitat selection among wading birds (Ciconiiformes) at Lake Okeechobee, Florida, in relation to hydrology and vegetative cover. Archiv fur Hydrobiologie, Advances in Limnology 45:247-285.
Steinman, A., K. Havens, and L. Hornung. 2002. The managed recession of Lake Okeechobee, Florida: integrating science and natural resource management. Conservation Ecology 6:17-31.
USACE. 2000. Water control plan for Lake Okeechobee and Everglades Agricultural Area. United States Army Corps of Engineers, Department of the Army, Jacksonville, FL.
USACE. 2004. Environmental assessment: Lake Okeechobee regulation schedule, water supply and environment, Lake Okeechobee, Florida. United States Army Corps of Engineers, Department of the Army, Jacksonville, FL.
Weller, M. W. 1995. Use of two waterbird guilds as evaluation tools for the Kissimmee River Restoration. Restoration Ecology 3:211-224.
Zaffke, M. 1984. Wading bird utilization of Lake Okeechobee marshes 1977-1981, Technical Publication 84-9. South Florida Water Management District, West Palm Beach, FL.

Marx and Gawlik · Final Wading Bird Report 28
APPENDIX A 2005–2007 Colony Coordinates and Total Peak Nest Effort
Long
itude
Latit
ude
2005
Cle
wis
ton
Spi
t 5 n
/a 2
80°
54'
31"
W 2
6° 4
6' 4
0"N
3 0
300
00
200
00
50
2005
Libe
rty P
oint
4n/
a 8
1° 0
0' 5
3"W
26°
49'
25"
N0
850
50
200
00
110
2005
Moo
re H
aven
Eas
t 4 4
n/a
81°
02'
11"
W 2
6° 5
2' 2
8"N
060
00
158
250
00
648
2005
Roc
k Is
land
s 4n/
a 8
1° 0
3' 1
5"W
26°
57'
45"
N0
655
02
030
00
00
957
2005
Indi
an P
rairi
e N
orth
1 4
n/a
80°
53'
06"
W 2
7° 0
4' 4
6"N
090
00
074
00
00
830
2005
Indi
an P
rairi
e N
orth
2 4
n/a
80°
54'
04"
W 2
7° 0
4' 3
2"N
020
06
10
00
027
2005
Eagl
e B
ay Is
land
Nor
th 5
n/a
80°
50'
14"
W 2
7° 1
0' 4
5"N
011
00
00
1200
00
01,
310
2005
Cha
ncy
Bay
4n/
a 8
0° 4
0' 1
5"W
27°
06'
29"
N0
00
00
700
00
070
0
2006
Cha
ncy
Bay
4M
AY80
° 39
' 58"
W27
° 06
' 14"
N3
00
02
220
00
022
5
2006
Cle
wis
ton 5
FEB
80°
53' 2
9"W
26°
45' 4
8"N
50
00
00
00
05
2006
Cle
wis
ton
Spi
t 5AP
R80
° 54
' 33"
W26
° 46
' 33"
N2
220
01
00
00
022
3
2006
Eagl
e B
ay Is
land
Nor
th 5
MA
Y80
° 50
' 11"
W27
° 11
' 04"
N0
5518
040
2048
048
025
00
1,50
5
2006
Eagl
e B
ay Is
land
Sou
th 5
MAR
80°
50' 4
7"W
27°
10' 1
4"N
1280
00
00
00
092
2006
Indi
an P
rairi
e N
orth
1 4
FEB
80°
53' 5
3"W
27°
05' 1
1"N
60
00
00
00
06
2006
Indi
an P
rairi
e N
orth
2 4
MAR
80°
53' 1
0"W
27°
05' 0
5"N
195
00
00
00
096
2006
Indi
an P
rairi
e N
orth
3 4
MAR
80°
53' 0
4"W
27°
04' 5
5"N
368
00
00
00
071
2006
Indi
an P
rairi
e S
outh
1AP
R80
° 57
' 47"
W27
° 01
' 53"
N2
160
800
8080
480
00
01,
602
2006
Indi
an P
rairi
e S
outh
2M
AR80
° 58
' 06"
W27
° 01
' 33"
N4
370
00
00
00
41
2006
Torr
y Is
land
FEB
80°
45' 5
8"W
26°
41' 5
1"N
70
00
00
00
07
2006
Ritt
a Is
land
5FE
B80
° 48
' 02"
W26
° 43
' 10"
N8
20
00
00
00
10
2006
Libe
rty P
oint
4M
AY
81°
00' 3
8"W
26°
49' 3
2"N
026
055
02
120
150
100
01,
074
2006
Moo
re H
aven
Eas
t 1 4
APR
81°
00' 2
5"W
26°
51' 4
4"N
417
00
00
00
00
174
2006
Moo
re H
aven
Eas
t 2 4
MAR
81°
00' 3
9"W
26°
51' 5
5"N
30
00
00
00
03
GB
HE
GR
EGSN
EGTR
HE
WH
IBG
LIB
WO
ST T
otal
s 1
Tabl
eA-
1.G
eogr
aphi
cco
ordi
nate
s(d
dmm
ss,N
AD
83),
spec
ies
com
posi
tion,
and
timin
gof
peak
nest
effo
rtfo
reac
hco
lony
dete
cted
durin
gth
e20
05, 2
006,
and
200
7 br
eedi
ng s
easo
ns a
t Lak
e O
keec
hobe
e, F
L.
LBH
EC
AEG
Geo
grap
hic
Loca
tion
Year
Col
ony
nam
ePe
ak
nest
ing
mon
th

Marx and Gawlik · Final Wading Bird Report 29
APPENDIX A 2005–2007 Colony Coordinates and Total Peak Nest Effort
Long
itude
Latit
ude
2006
Moo
re H
aven
Eas
t 3 4
APR
81°
03' 0
8"W
26°
53' 0
2"N
030
020
02
200
150
50
677
2006
Moo
re H
aven
Eas
t 4 4
MAY
81°
02' 1
0"W
26°
52' 4
3"N
010
090
030
600
1,20
015
00
2,44
0
2006
Moo
re H
aven
Eas
t 5 4
MAR
81°
01' 0
6"W
26°
52' 1
7"N
246
00
00
00
048
2006
Moo
re H
aven
Wes
t 1 4
APR
81°
05' 1
8"W
26°
53' 5
3"N
430
085
030
1820
5,00
040
06,
262
2006
Moo
re H
aven
Wes
t 2 4
MAR
81°
05' 4
2"W
26°
53' 0
6"N
190
00
00
00
091
2006
Roc
k Is
land
s 1 4
APR
81°
03' 0
4"W
26°
57' 4
8"N
170
130
21
500
00
254
2006
Roc
k Is
land
s 2 4
APR
81°
02' 4
8"W
26°
58' 0
1"N
030
9016
020
00
015
6
2006
Roc
k Is
land
s 3 4
APR
81°
02' 5
7"W
26°
57' 5
4"N
00
00
035
00
035
2006
Roc
k Is
land
s 4 4
MAY
81°
02' 1
2"W
26°
58' 2
0"N
00
00
014
00
00
140
2006
Sout
h Ba
y 1
MAR
80°
43' 3
0"W
26°
41' 3
7"N
20
00
00
00
02
2006
Sout
h Ba
y 2
MAY
80°
44' 0
5"W
26°
41' 2
3"N
126
00
10
00
028
2006
Sout
h Ba
y 3
MAY
80°
43' 4
1"W
26°
42' 3
3"N
08
00
040
00
048
2007
Cle
wis
ton
Spit 5
APR
80°
54' 2
7" W
26°
46' 3
6" N
00
485
115
00
035
063
5
2007
Bird
Isla
nd 4
JUN
81°
00' 3
1" W
26°
58' 2
0" N
00
00
035
00
00
350
2007
Gat
or F
arm
MAY
81°
03' 3
9" W
27°
01' 2
2" N
07
2537
1434
00
012
435
2007
Cle
wis
ton
Cha
nnel
5M
AY80
° 53
' 53"
W26
° 46
' 50"
N0
033
018
00
30
54
2007
Littl
e Be
ar B
each
MAY
80°
50' 3
2" W
26°
43' 1
7" N
00
7040
00
00
011
0
2007
Port
May
aca
JUN
80°
34' 2
8" W
27°
03' 1
7" N
30
m 6
mm
640
00
064
3
WO
ST T
otal
s 1
LBH
EC
AEG
WH
IBG
LIB
GB
HE
GR
EGSN
EGTR
HE
Year
Col
ony
nam
ePe
ak
nest
ing
mon
th
Geo
grap
hic
Loca
tion
Tabl
e A-
1. C
ontin
ued.
6 M
issi
ng d
ata.
Una
ble
to fi
nish
cou
nts
due
to p
roxi
mity
of c
olon
y to
the
Mar
tin C
ount
y Fl
orid
a P
ower
and
Lig
ht p
ower
pla
nt (m
= m
issi
ng v
alue
).
5 R
epor
ted
in S
mith
and
Col
lopy
199
5.
4 R
epor
ted
in D
avid
199
4a a
nd S
mith
and
Col
lopy
199
5.
3 Spe
cies
und
etec
ted
durin
g su
rvey
effo
rt.
2 N
ot a
pplic
able
, bec
ause
onl
y on
e su
rvey
was
con
duct
ed d
urin
g 20
05 o
n Ju
ne 3
at t
he e
nd o
f the
bre
edin
g se
ason
.
1 C
olon
y to
tal i
nclu
ded
all s
peci
es p
rese
nt.
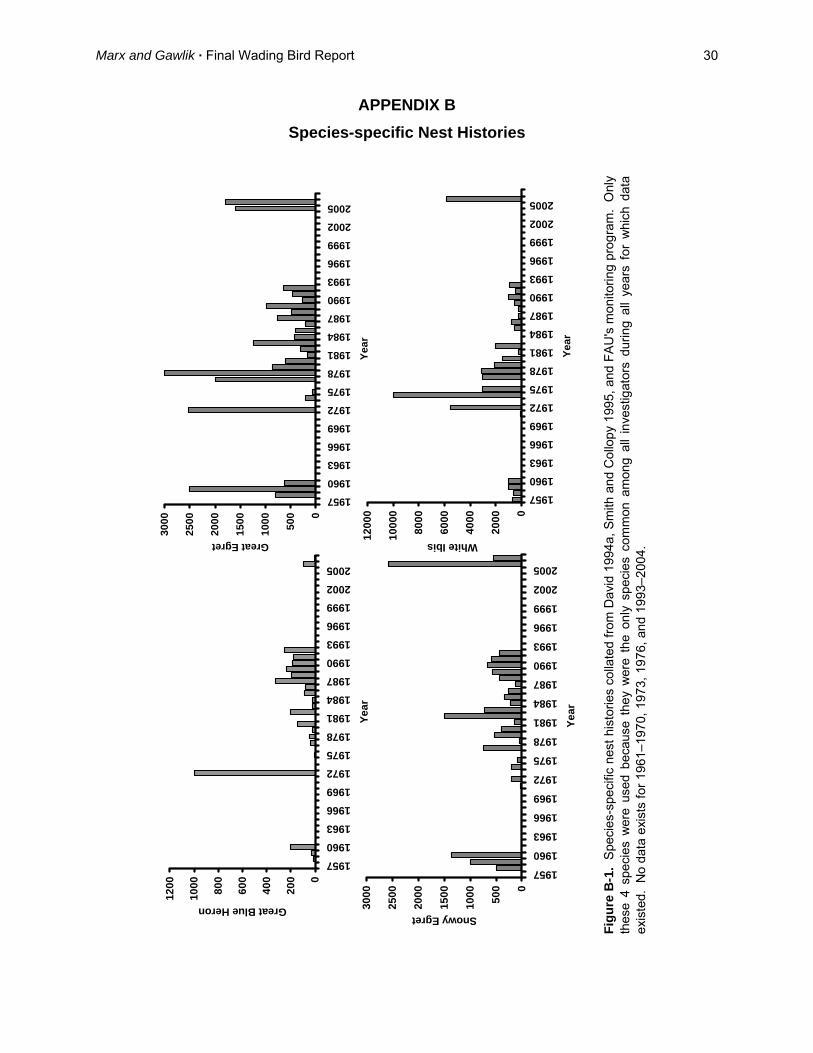
Marx and Gawlik · Final Wading Bird Report 30
APPENDIX B Species-specific Nest Histories
Figu
reB
-1.
Spe
cies
-spe
cific
nest
hist
orie
sco
llate
dfro
mD
avid
1994
a,Sm
ithan
dC
ollo
py19
95,a
ndFA
U's
mon
itorin
gpr
ogra
m.
Onl
yth
ese
4sp
ecie
sw
ere
used
beca
use
they
wer
eth
eon
lysp
ecie
sco
mm
onam
ong
alli
nves
tigat
ors
durin
gal
lye
ars
for
whi
chda
taex
iste
d. N
o da
ta e
xist
s fo
r 196
1–19
70, 1
973,
197
6, a
nd 1
993–
2004
.
0
200
400
600
800
1000
1200
19571960196319661969197219751978198119841987199019931996199920022005
Year
Great Blue Heron
0
500
1000
1500
2000
2500
3000
1957
1960
1963
1966
1969
1972
1975
1978
1981
1984
1987
1990
1993
1996
1999
2002
2005
Year
Snowy Egret
0
2000
4000
6000
8000
1000
0
1200
0
19571960196319661969197219751978198119841987199019931996199920022005
Year
White Ibis
0
500
1000
1500
2000
2500
3000
1957
1960
1963
1966
1969
1972
1975
1978
1981
1984
1987
1990
1993
1996
1999
2002
2005
Year
Great Egret

Marx and Gawlik · Final Wading Bird Report 31
APPENDIX C Available Wading Bird Foraging Habitat
Maps represent a coarse-grained analysis of foraging habitat availability at different
times during the breeding season for 2006 and 2007 at Lake Okeechobee, FL. The
habitat suitability index (HSI) was a function of water levels similar to Gawlik et al.
(2004). We interpolated lake surface elevation from mean daily lake stage reports
provided via DBHYDRO and then subtracted lake surface elevation from bathymetry
data provided by the SFWMD. The minimum mapping unit was Water depths of < -10
cm were assumed to dry ground and > 40 cm were too deep. If water depths were 0–
10 cm, then HSI = 1.0; if between -10–0 cm or between10–20 cm, then HSI = 0.75; if
between 20–30 cm, then HSI = 0.5; and if between 30–40 cm, then HSI = 0.25. We
used 40 cm for the upper margin of suitable water depths, because wading bird
behavior is highly plastic, and at Lake Okeechobee, researchers have noted that
wading birds will use vegetation to stabilize themselves while they forage over deeper
waters (Smith 1995a, b, Smith et al. 1995). See Figures C-1 and C-2 below.

Marx and Gawlik · Final Wading Bird Report 32
APPENDIX C Available Wading Bird Foraging Habitat
Figure C-1. Maps of available wading bird foraging habitat at Lake Okeechobee, FL during January, March, andMay 2006. Suitability indices follow Gawlik et al. (2004) for water depth. Water depth was modeled from averagelake stage and bathymetric data provided by the SFWMD.
January March
May

Marx and Gawlik · Final Wading Bird Report 33
APPENDIX C Available Wading Bird Foraging Habitat
Figure C-2. Maps of available wading bird foraging habitat at Lake Okeechobee, FL during January, March, andMay 2007. Suitability indices follow Gawlik et al. (2004) for water depth. Water depth was modeled from averagelake stage and bathymetric data provided by the SFWMD.
January March
May