wacker neuson se capital market day & analyst and investor...
TRANSCRIPT
1
Cem Peksaglam (CEO), Wilfried Trepels (CFO)
May 11, 2017
Wacker Neuson SE
Capital Market Day & Analyst and Investor Conference – Results Q1/17
2
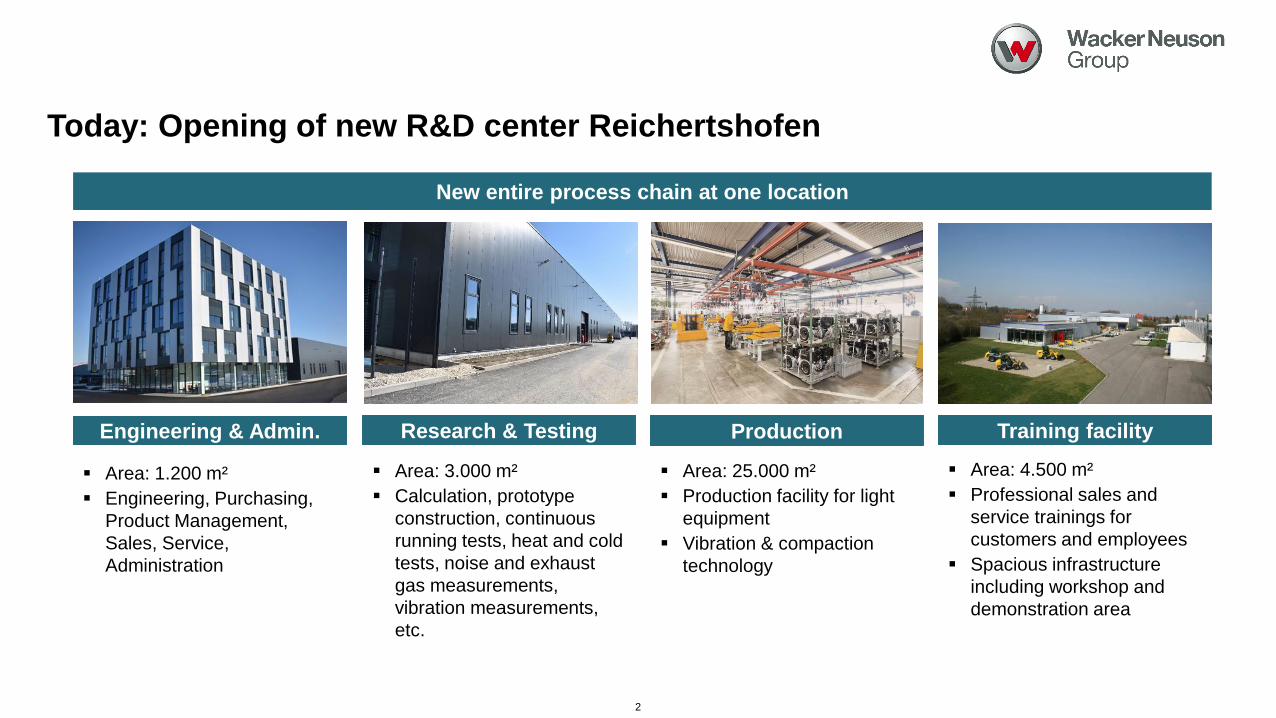
New entire process chain at one location
Today: Opening of new R&D center Reichertshofen
Research & TestingEngineering & Admin. Training facilityProduction
Area: 25.000 m²
Production facility for light
equipment
Vibration & compaction
technology
Area: 4.500 m²
Professional sales and
service trainings for
customers and employees
Spacious infrastructure
including workshop and
demonstration area
Area: 3.000 m²
Calculation, prototype
construction, continuous
running tests, heat and cold
tests, noise and exhaust
gas measurements,
vibration measurements,
etc.
Area: 1.200 m²
Engineering, Purchasing,
Product Management,
Sales, Service,
Administration
Agenda
Outlook
Review Q1/17
3
Financial Information
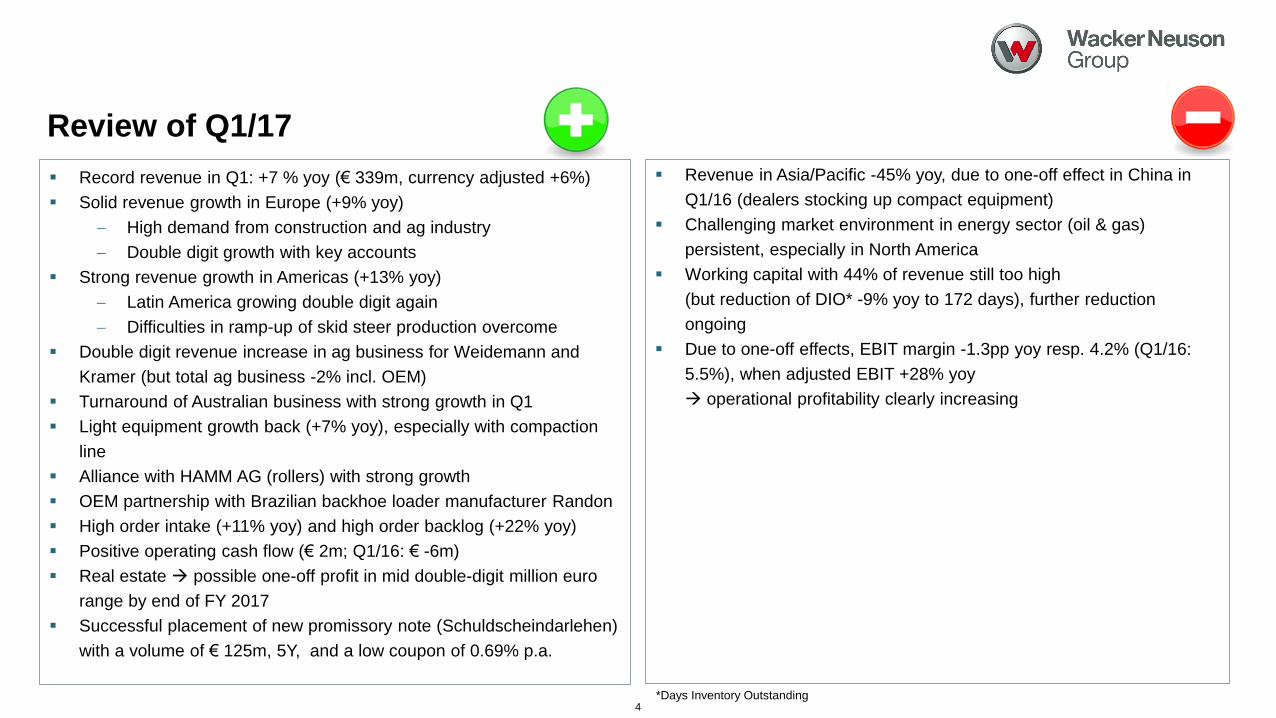
Record revenue in Q1: +7 % yoy (€ 339m, currency adjusted +6%)
Solid revenue growth in Europe (+9% yoy)
High demand from construction and ag industry
Double digit growth with key accounts
Strong revenue growth in Americas (+13% yoy)
Latin America growing double digit again
Difficulties in ramp-up of skid steer production overcome
Double digit revenue increase in ag business for Weidemann and
Kramer (but total ag business -2% incl. OEM)
Turnaround of Australian business with strong growth in Q1
Light equipment growth back (+7% yoy), especially with compaction
line
Alliance with HAMM AG (rollers) with strong growth
OEM partnership with Brazilian backhoe loader manufacturer Randon
High order intake (+11% yoy) and high order backlog (+22% yoy)
Positive operating cash flow (€ 2m; Q1/16: € -6m)
Real estate possible one-off profit in mid double-digit million euro
range by end of FY 2017
Successful placement of new promissory note (Schuldscheindarlehen)
with a volume of € 125m, 5Y, and a low coupon of 0.69% p.a.
4
Revenue in Asia/Pacific -45% yoy, due to one-off effect in China in
Q1/16 (dealers stocking up compact equipment)
Challenging market environment in energy sector (oil & gas)
persistent, especially in North America
Working capital with 44% of revenue still too high
(but reduction of DIO* -9% yoy to 172 days), further reduction
ongoing
Due to one-off effects, EBIT margin -1.3pp yoy resp. 4.2% (Q1/16:
5.5%), when adjusted EBIT +28% yoy
operational profitability clearly increasing
Review of Q1/17
*Days Inventory Outstanding
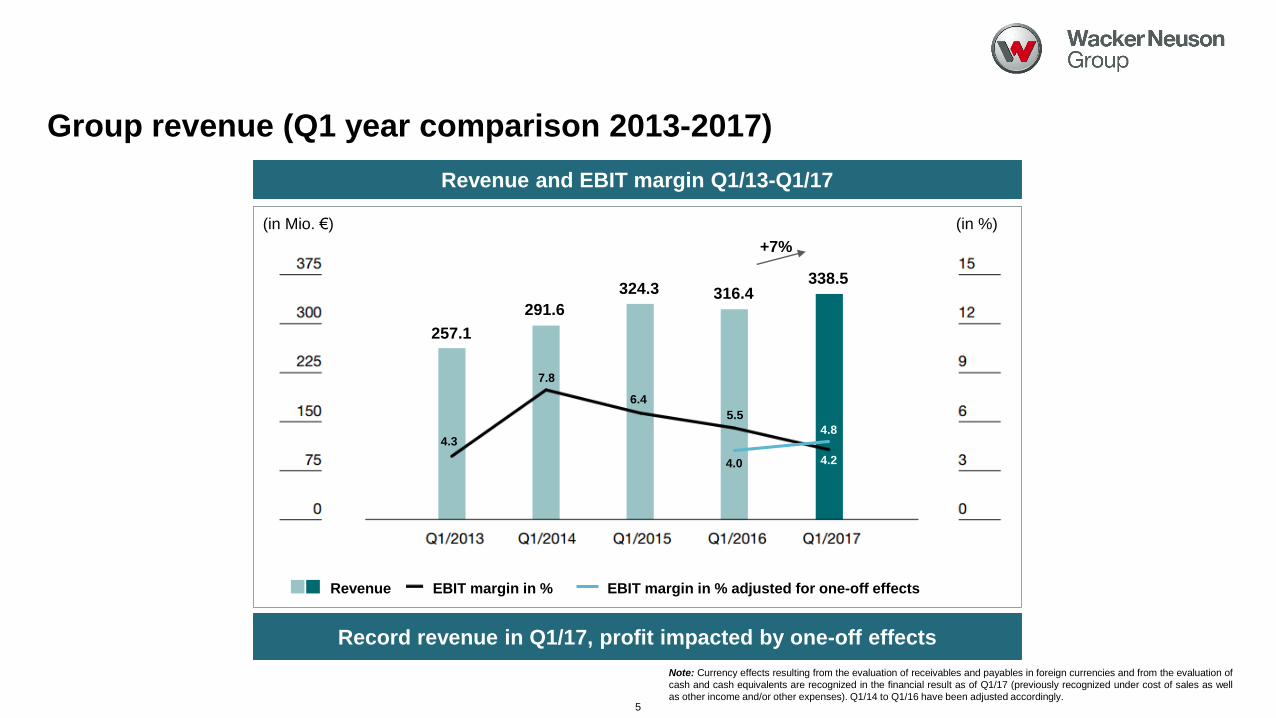
Group revenue (Q1 year comparison 2013-2017)
5
Revenue and EBIT margin Q1/13-Q1/17
Record revenue in Q1/17, profit impacted by one-off effects
(in Mio. €) (in %)
4.2
5.5
6.4
7.8
4.3
Note: Currency effects resulting from the evaluation of receivables and payables in foreign currencies and from the evaluation of
cash and cash equivalents are recognized in the financial result as of Q1/17 (previously recognized under cost of sales as well
as other income and/or other expenses). Q1/14 to Q1/16 have been adjusted accordingly.
EBIT margin in % Revenue
257.1
291.6
324.3 316.4338.5
4.8
EBIT margin in % adjusted for one-off effects
4.0
+7%
Agenda
Outlook
Review Q1/17
6
Financial Information
227248
72
8117
10
Q1/2016 Q1/2017
Europe Americas Asia-Pacific
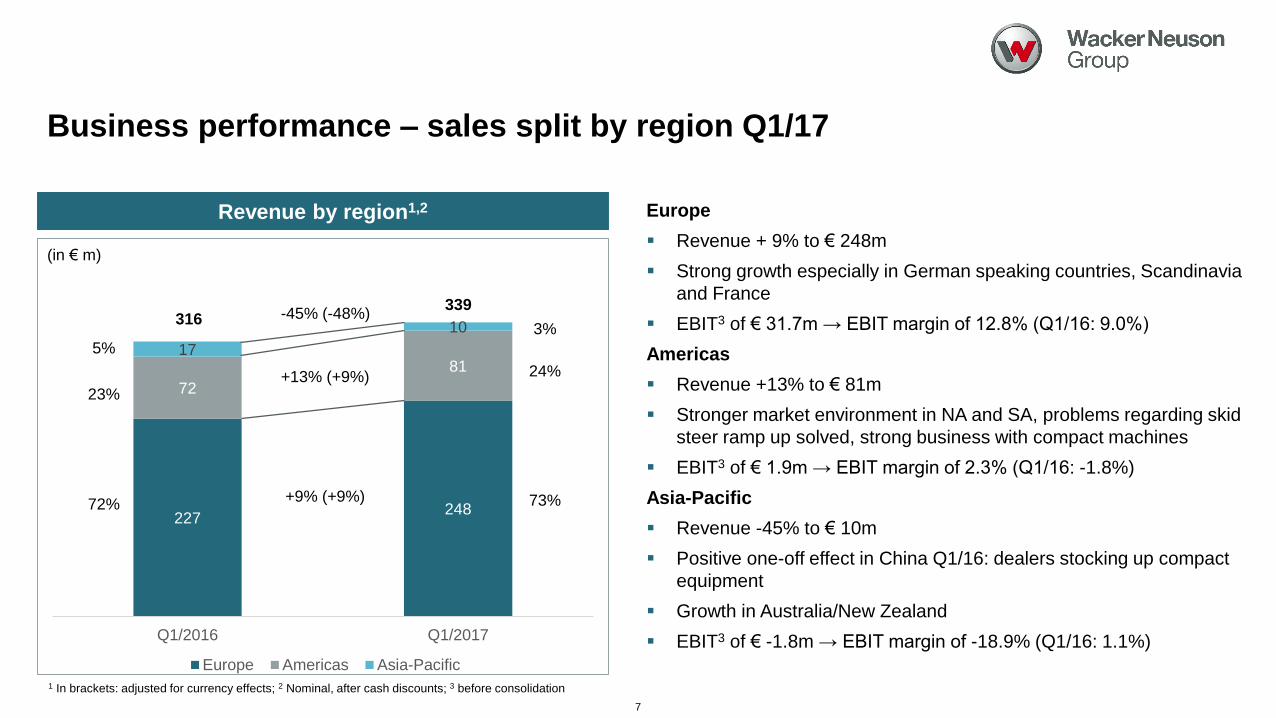
Business performance – sales split by region Q1/17
7
Revenue by region1,2
(in € m)
73%72%
24%
23%
3%
5%
316339
Europe
Revenue + 9% to € 248m
Strong growth especially in German speaking countries, Scandinavia
and France
EBIT3 of € 31.7m → EBIT margin of 12.8% (Q1/16: 9.0%)
Americas
Revenue +13% to € 81m
Stronger market environment in NA and SA, problems regarding skid
steer ramp up solved, strong business with compact machines
EBIT3 of € 1.9m → EBIT margin of 2.3% (Q1/16: -1.8%)
Asia-Pacific
Revenue -45% to € 10m
Positive one-off effect in China Q1/16: dealers stocking up compact
equipment
Growth in Australia/New Zealand
EBIT3 of € -1.8m → EBIT margin of -18.9% (Q1/16: 1.1%)
+9% (+9%)
+13% (+9%)
-45% (-48%)
1 In brackets: adjusted for currency effects; 2 Nominal, after cash discounts; 3 before consolidation
92 98
165176
6469
Q1/2016 Q1/2017
Light equipment Compact equipment Services
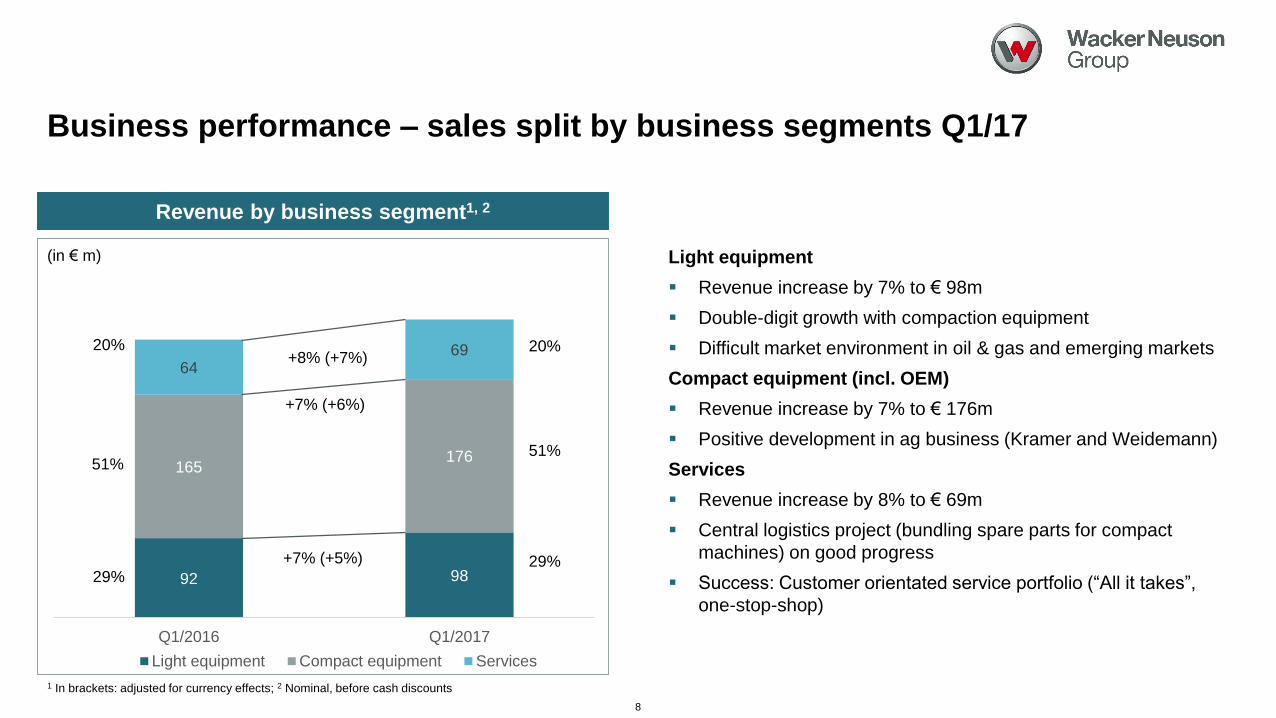
Business performance – sales split by business segments Q1/17
8
Revenue by business segment1, 2
(in € m)
29%29%
51%51%
20%20%
1 In brackets: adjusted for currency effects; 2 Nominal, before cash discounts
+7% (+5%)
+7% (+6%)
+8% (+7%)
Light equipment
Revenue increase by 7% to € 98m
Double-digit growth with compaction equipment
Difficult market environment in oil & gas and emerging markets
Compact equipment (incl. OEM)
Revenue increase by 7% to € 176m
Positive development in ag business (Kramer and Weidemann)
Services
Revenue increase by 8% to € 69m
Central logistics project (bundling spare parts for compact
machines) on good progress
Success: Customer orientated service portfolio (“All it takes”,
one-stop-shop)
Development of revenue and profitability Q1/17
9
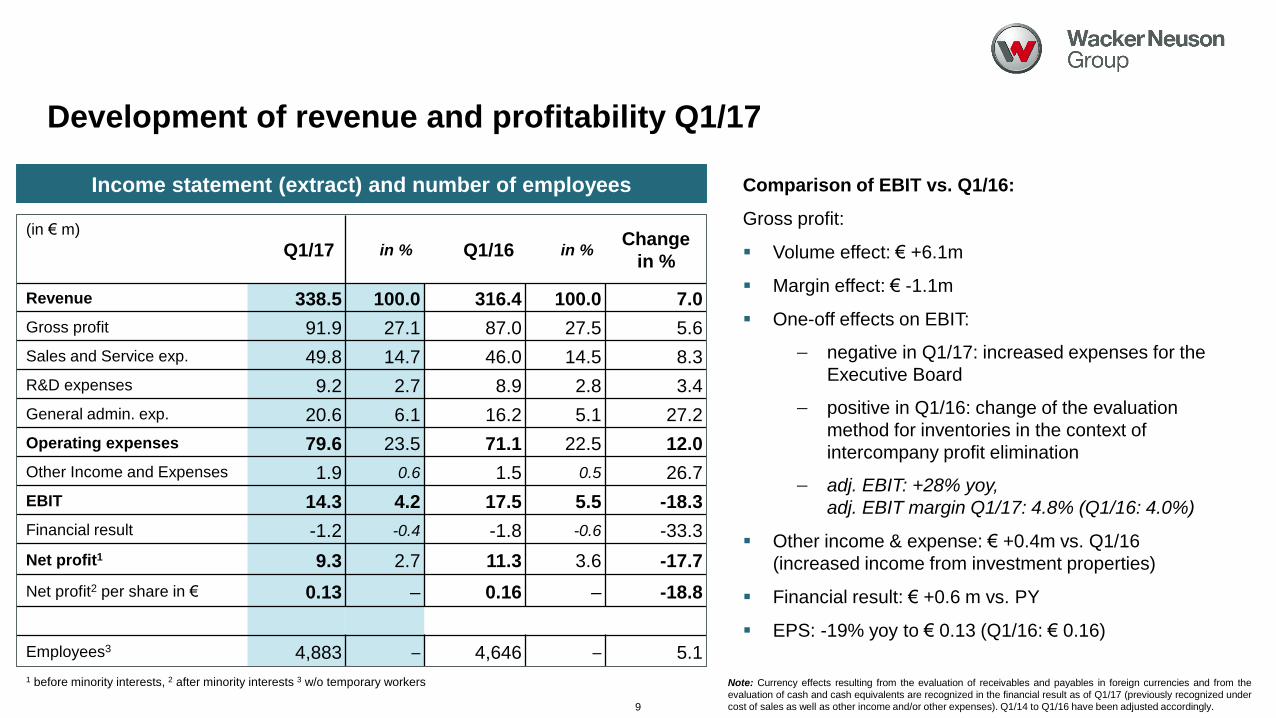
Q1/17 in % Q1/16 in % Change
in %
Revenue 338.5 100.0 316.4 100.0 7.0
Gross profit 91.9 27.1 87.0 27.5 5.6
Sales and Service exp. 49.8 14.7 46.0 14.5 8.3
R&D expenses 9.2 2.7 8.9 2.8 3.4
General admin. exp. 20.6 6.1 16.2 5.1 27.2
Operating expenses 79.6 23.5 71.1 22.5 12.0
Other Income and Expenses 1.9 0.6 1.5 0.5 26.7
EBIT 14.3 4.2 17.5 5.5 -18.3
Financial result -1.2 -0.4 -1.8 -0.6 -33.3
Net profit1 9.3 2.7 11.3 3.6 -17.7
Net profit2 per share in € 0.13 – 0.16 – -18.8
Employees3 4,883 – 4,646 – 5.1
Income statement (extract) and number of employees
1 before minority interests, 2 after minority interests 3 w/o temporary workers
(in € m)
Comparison of EBIT vs. Q1/16:
Gross profit:
Volume effect: € +6.1m
Margin effect: € -1.1m
One-off effects on EBIT:
negative in Q1/17: increased expenses for the
Executive Board
positive in Q1/16: change of the evaluation
method for inventories in the context of
intercompany profit elimination
adj. EBIT: +28% yoy,
adj. EBIT margin Q1/17: 4.8% (Q1/16: 4.0%)
Other income & expense: € +0.4m vs. Q1/16
(increased income from investment properties)
Financial result: € +0.6 m vs. PY
EPS: -19% yoy to € 0.13 (Q1/16: € 0.16)
Note: Currency effects resulting from the evaluation of receivables and payables in foreign currencies and from the
evaluation of cash and cash equivalents are recognized in the financial result as of Q1/17 (previously recognized under
cost of sales as well as other income and/or other expenses). Q1/14 to Q1/16 have been adjusted accordingly.
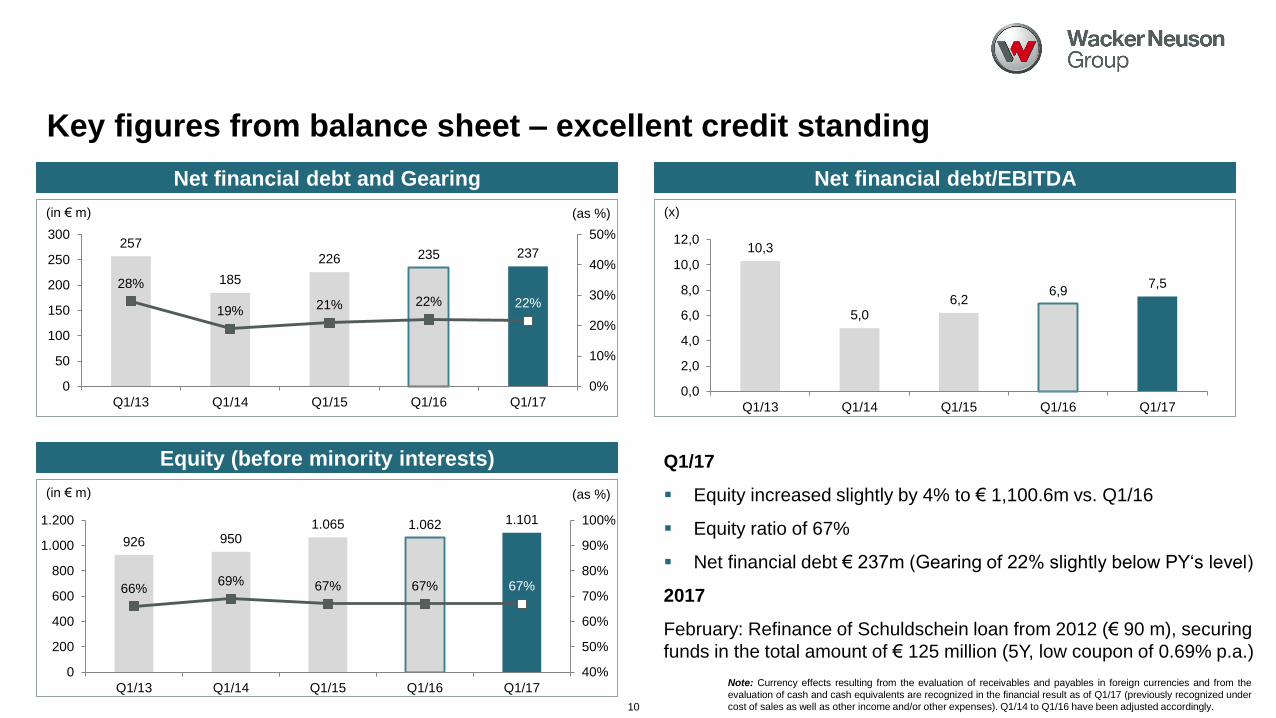
257
185
226 235 237
28%
19% 21% 22% 22%
0%
10%
20%
30%
40%
50%
0
50
100
150
200
250
300
Q1/13 Q1/14 Q1/15 Q1/16 Q1/17
(in € m)
Net financial debt and Gearing
Key figures from balance sheet – excellent credit standing
10
926 9501.065 1.062 1.101
66%69% 67% 67% 67%
40%
50%
60%
70%
80%
90%
100%
0
200
400
600
800
1.000
1.200
Q1/13 Q1/14 Q1/15 Q1/16 Q1/17
(in € m)
Equity (before minority interests)
(as %)
10,3
5,06,2
6,97,5
0,0
2,0
4,0
6,0
8,0
10,0
12,0
Q1/13 Q1/14 Q1/15 Q1/16 Q1/17
(x)
Net financial debt/EBITDA
Q1/17
Equity increased slightly by 4% to € 1,100.6m vs. Q1/16
Equity ratio of 67%
Net financial debt € 237m (Gearing of 22% slightly below PY‘s level)
2017
February: Refinance of Schuldschein loan from 2012 (€ 90 m), securing
funds in the total amount of € 125 million (5Y, low coupon of 0.69% p.a.)
(as %)
Note: Currency effects resulting from the evaluation of receivables and payables in foreign currencies and from the
evaluation of cash and cash equivalents are recognized in the financial result as of Q1/17 (previously recognized under
cost of sales as well as other income and/or other expenses). Q1/14 to Q1/16 have been adjusted accordingly.
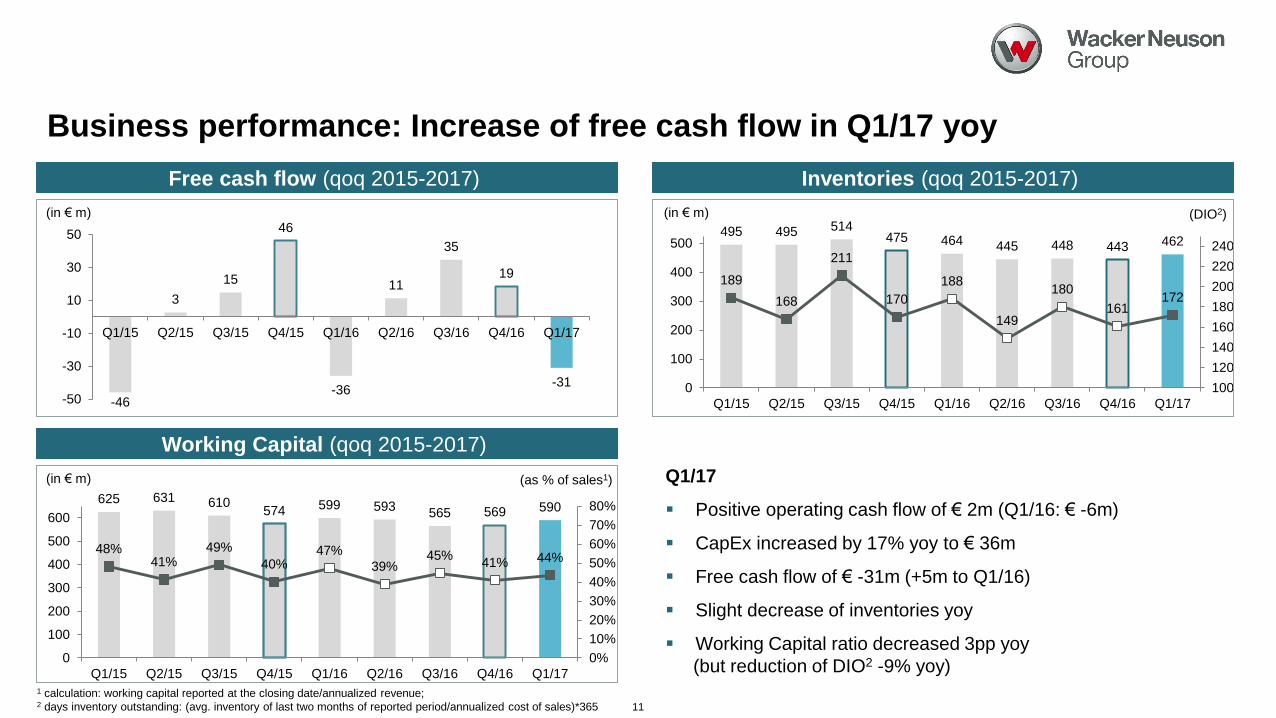
495 495 514475 464 445 448 443 462
189
168
211
170
188
149
180
161172
100
120
140
160
180
200
220
240
0
100
200
300
400
500
Q1/15 Q2/15 Q3/15 Q4/15 Q1/16 Q2/16 Q3/16 Q4/16 Q1/17-46
3
15
46
-36
11
35
19
-31
-50
-30
-10
10
30
50
Q1/15 Q2/15 Q3/15 Q4/15 Q1/16 Q2/16 Q3/16 Q4/16 Q1/17
(in € m)
Free cash flow (qoq 2015-2017)
Business performance: Increase of free cash flow in Q1/17 yoy
625 631 610574 599 593
565 569 590
48%41%
49%
40%47%
39%45%
41% 44%
0%
10%
20%
30%
40%
50%
60%
70%
80%
0
100
200
300
400
500
600
Q1/15 Q2/15 Q3/15 Q4/15 Q1/16 Q2/16 Q3/16 Q4/16 Q1/17
(in € m)
Working Capital (qoq 2015-2017)
(as % of sales1)
(in € m)
Inventories (qoq 2015-2017)
(DIO2)
Q1/17
Positive operating cash flow of € 2m (Q1/16: € -6m)
CapEx increased by 17% yoy to € 36m
Free cash flow of € -31m (+5m to Q1/16)
Slight decrease of inventories yoy
Working Capital ratio decreased 3pp yoy
(but reduction of DIO2 -9% yoy)1 calculation: working capital reported at the closing date/annualized revenue;2 days inventory outstanding: (avg. inventory of last two months of reported period/annualized cost of sales)*365 11
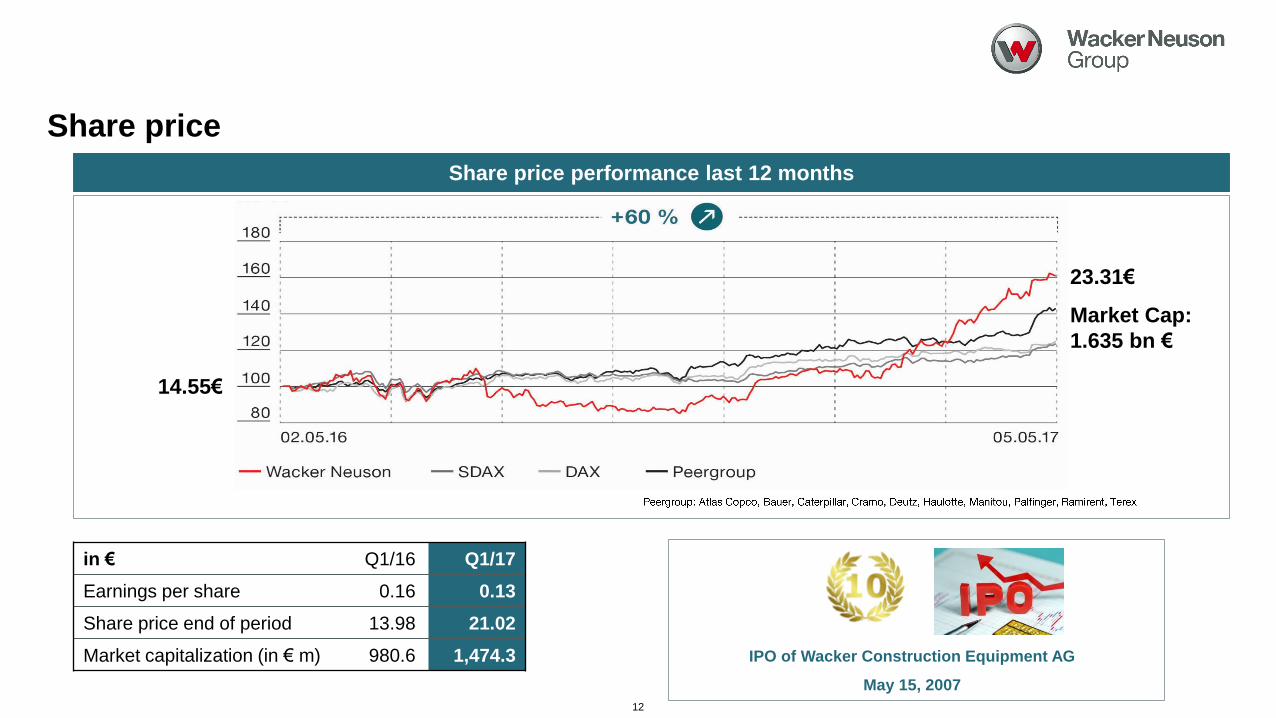
Share price
12
Share price performance last 12 months
in € Q1/16 Q1/17
Earnings per share 0.16 0.13
Share price end of period 13.98 21.02
Market capitalization (in € m) 980.6 1,474.3 IPO of Wacker Construction Equipment AG
May 15, 2007
14.55€
23.31€
Market Cap:
1.635 bn €
Agenda
Outlook
Review Q1/17
13
Financial Information
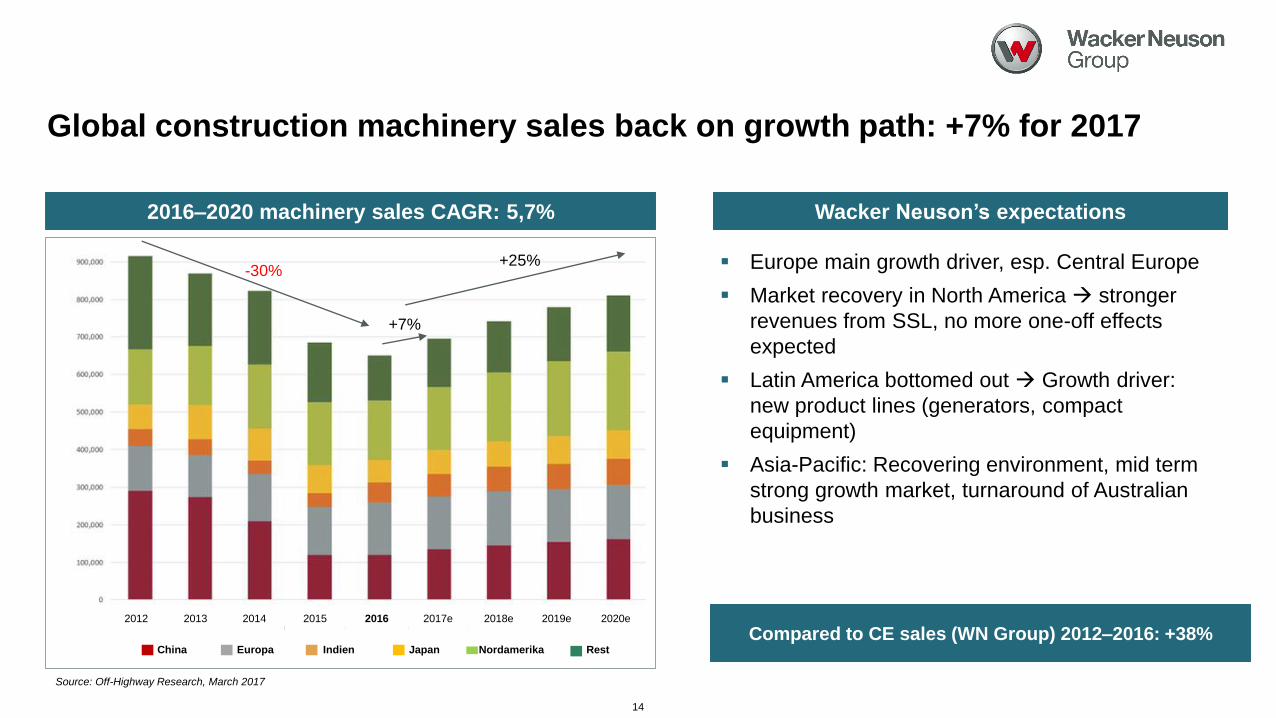
Global construction machinery sales back on growth path: +7% for 2017
14
2012 2013 2014 2015 2016 2017e 2018e 2019e 2020e 2021e
China Europa Indien Japan Nordamerika Rest
2016–2020 machinery sales CAGR: 5,7%
Source: Off-Highway Research, March 2017
-30%+25%
Wacker Neuson’s expectations
Europe main growth driver, esp. Central Europe
Market recovery in North America stronger
revenues from SSL, no more one-off effects
expected
Latin America bottomed out Growth driver:
new product lines (generators, compact
equipment)
Asia-Pacific: Recovering environment, mid term
strong growth market, turnaround of Australian
business
+7%
Compared to CE sales (WN Group) 2012–2016: +38%
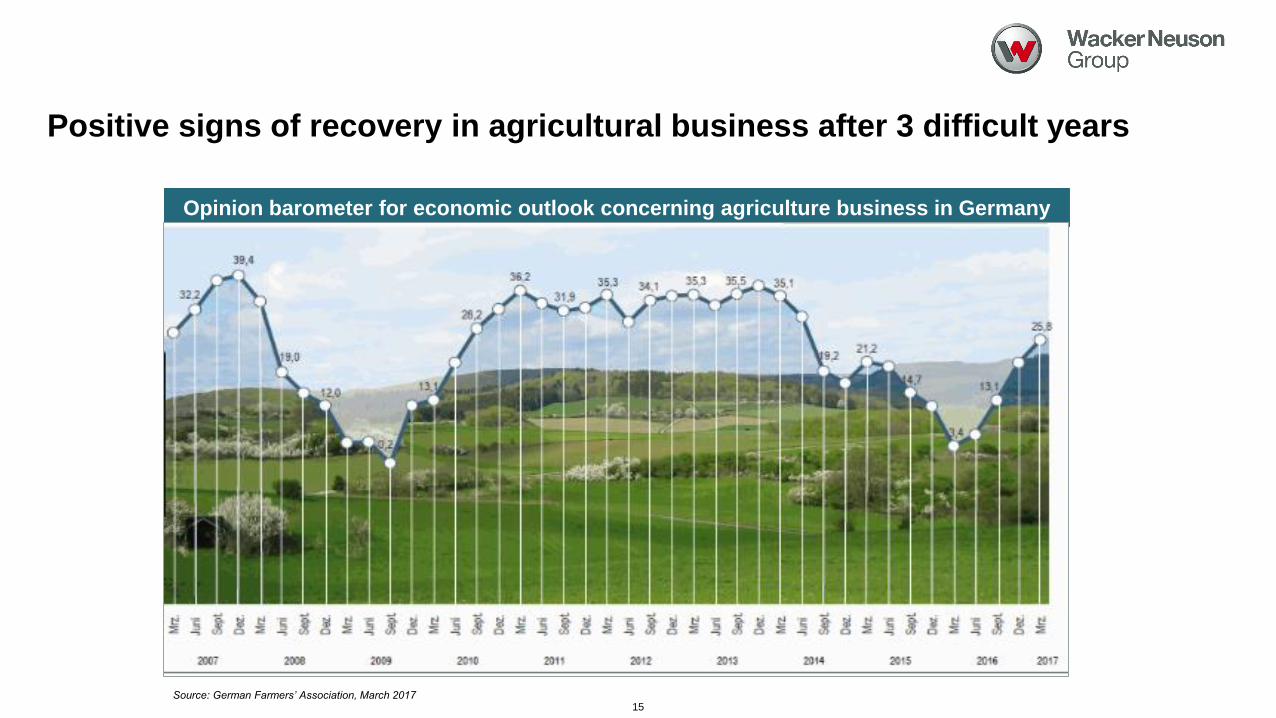
Positive signs of recovery in agricultural business after 3 difficult years
15Source: German Farmers’ Association, March 2017
Opinion barometer for economic outlook concerning agriculture business in Germany
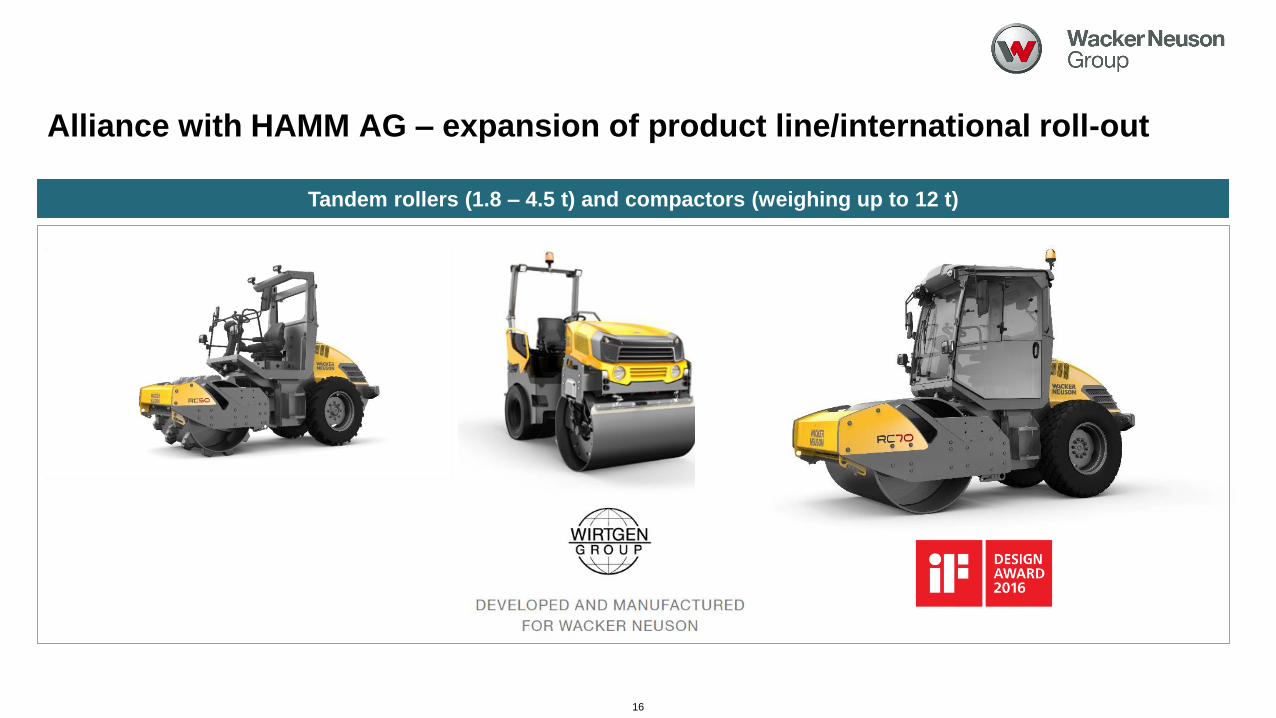
Alliance with HAMM AG – expansion of product line/international roll-out
16
Tandem rollers (1.8 – 4.5 t) and compactors (weighing up to 12 t)
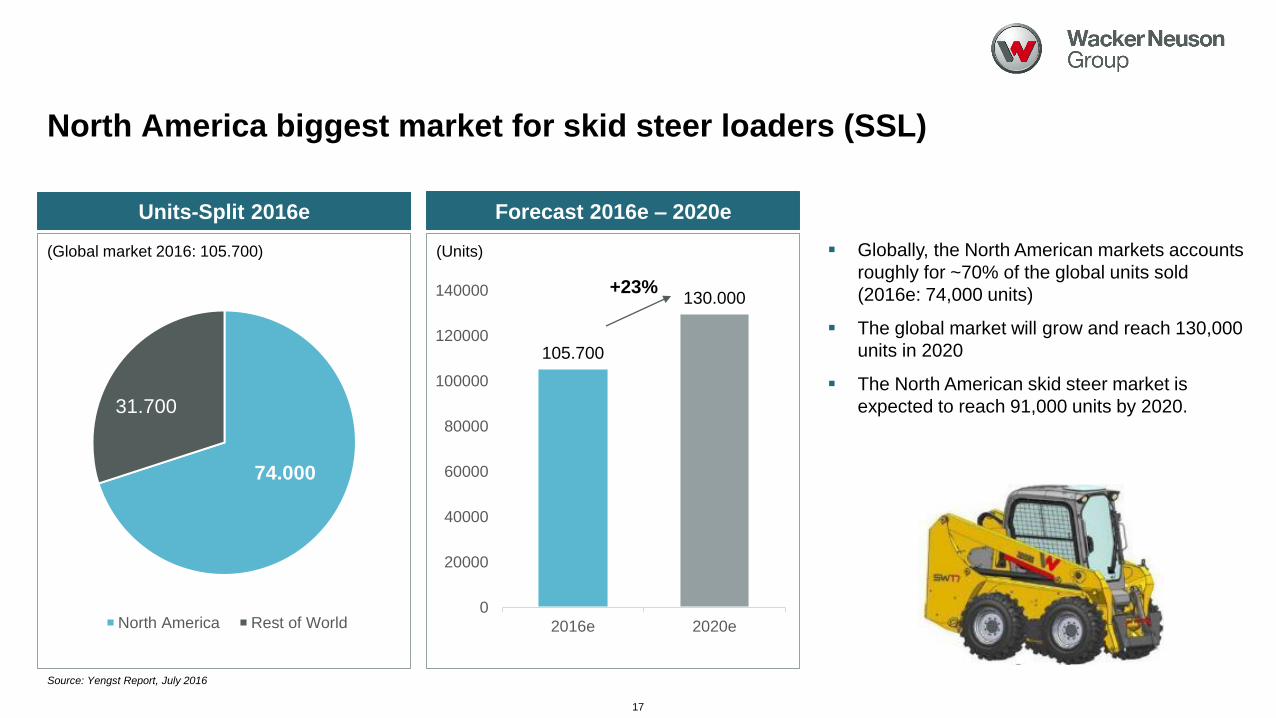
North America biggest market for skid steer loaders (SSL)
17
Units-Split 2016e
Globally, the North American markets accounts
roughly for ~70% of the global units sold
(2016e: 74,000 units)
The global market will grow and reach 130,000
units in 2020
The North American skid steer market is
expected to reach 91,000 units by 2020.
74.000
31.700
North America Rest of World
Forecast 2016e – 2020e
105.700
130.000
0
20000
40000
60000
80000
100000
120000
140000
2016e 2020e
(Units)
+23%
Source: Yengst Report, July 2016
(Global market 2016: 105.700)
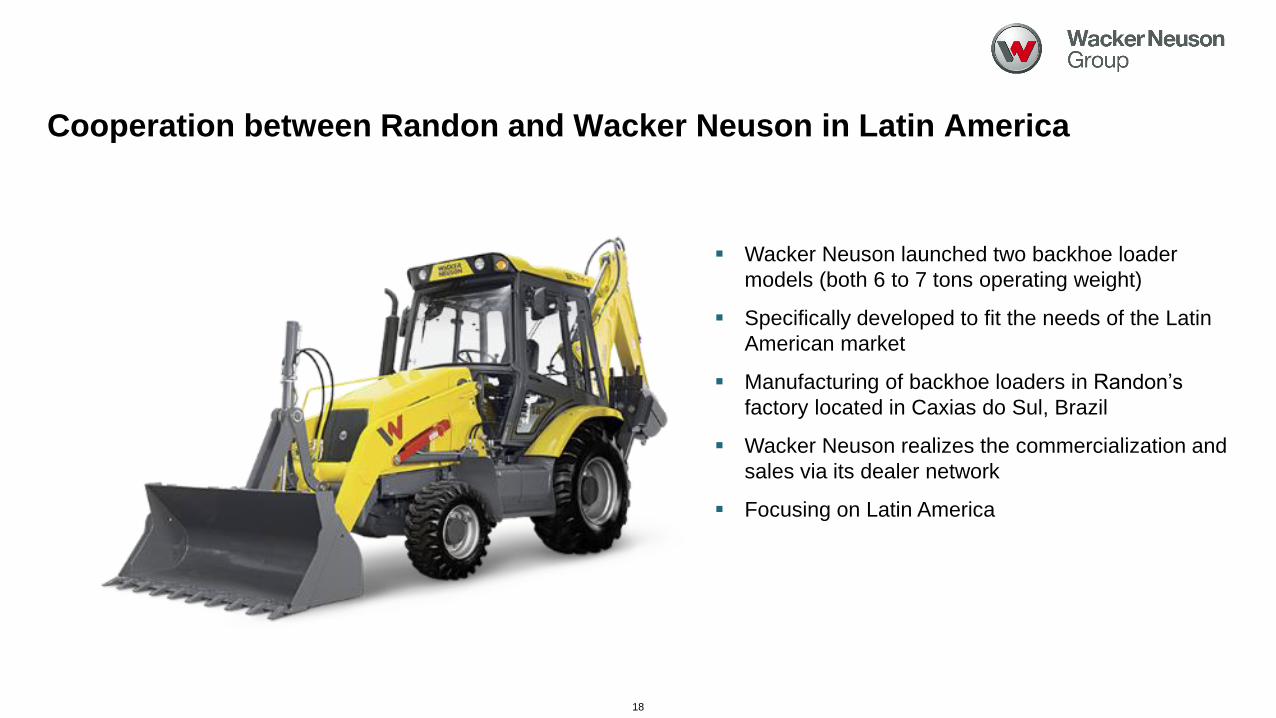
Cooperation between Randon and Wacker Neuson in Latin America
18
Wacker Neuson launched two backhoe loader
models (both 6 to 7 tons operating weight)
Specifically developed to fit the needs of the Latin
American market
Manufacturing of backhoe loaders in Randon’s
factory located in Caxias do Sul, Brazil
Wacker Neuson realizes the commercialization and
sales via its dealer network
Focusing on Latin America
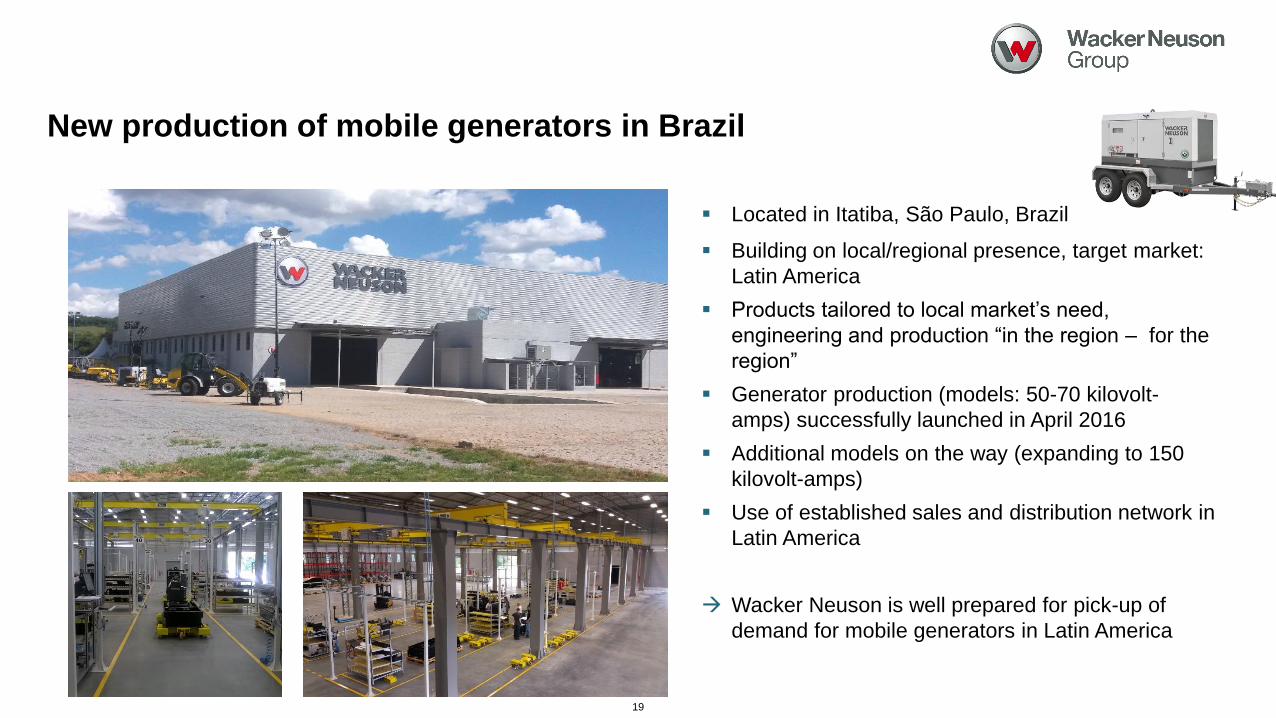
New production of mobile generators in Brazil
19
Located in Itatiba, São Paulo, Brazil
Building on local/regional presence, target market:
Latin America
Products tailored to local market’s need,
engineering and production “in the region – for the
region”
Generator production (models: 50-70 kilovolt-
amps) successfully launched in April 2016
Additional models on the way (expanding to 150
kilovolt-amps)
Use of established sales and distribution network in
Latin America
Wacker Neuson is well prepared for pick-up of
demand for mobile generators in Latin America
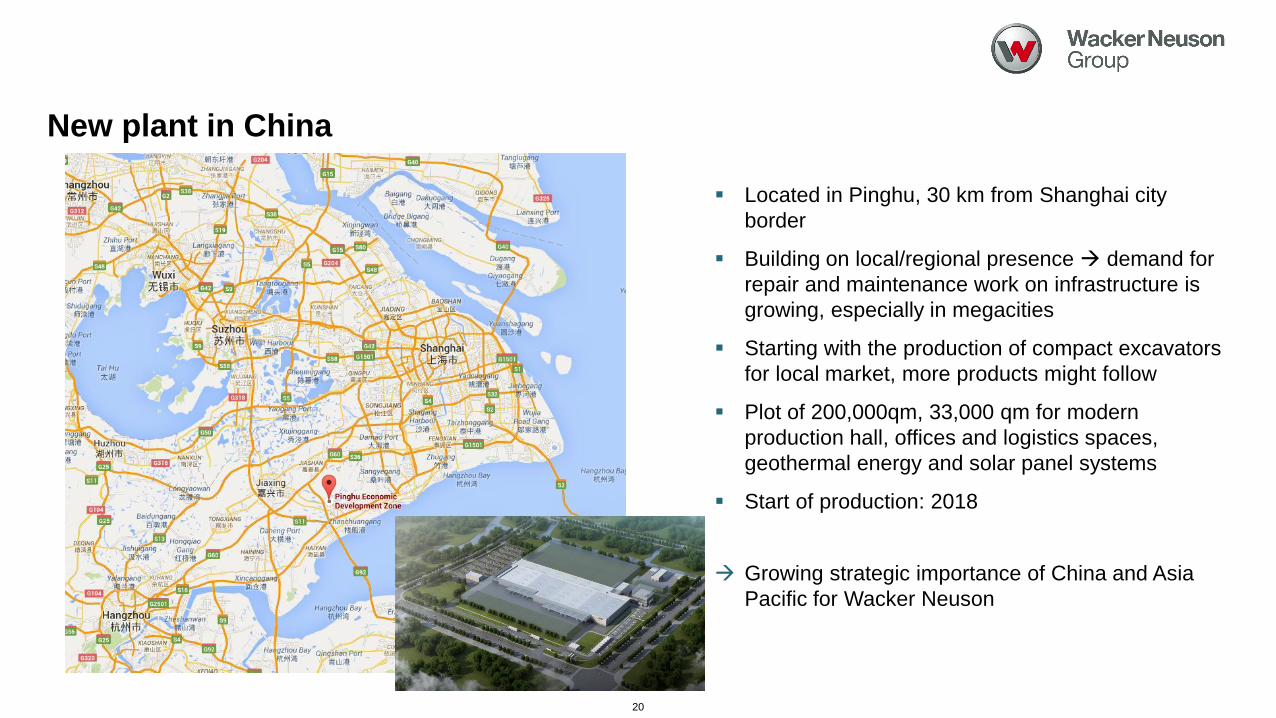
New plant in China
20
Located in Pinghu, 30 km from Shanghai city
border
Building on local/regional presence demand for
repair and maintenance work on infrastructure is
growing, especially in megacities
Starting with the production of compact excavators
for local market, more products might follow
Plot of 200,000qm, 33,000 qm for modern
production hall, offices and logistics spaces,
geothermal energy and solar panel systems
Start of production: 2018
Growing strategic importance of China and Asia
Pacific for Wacker Neuson
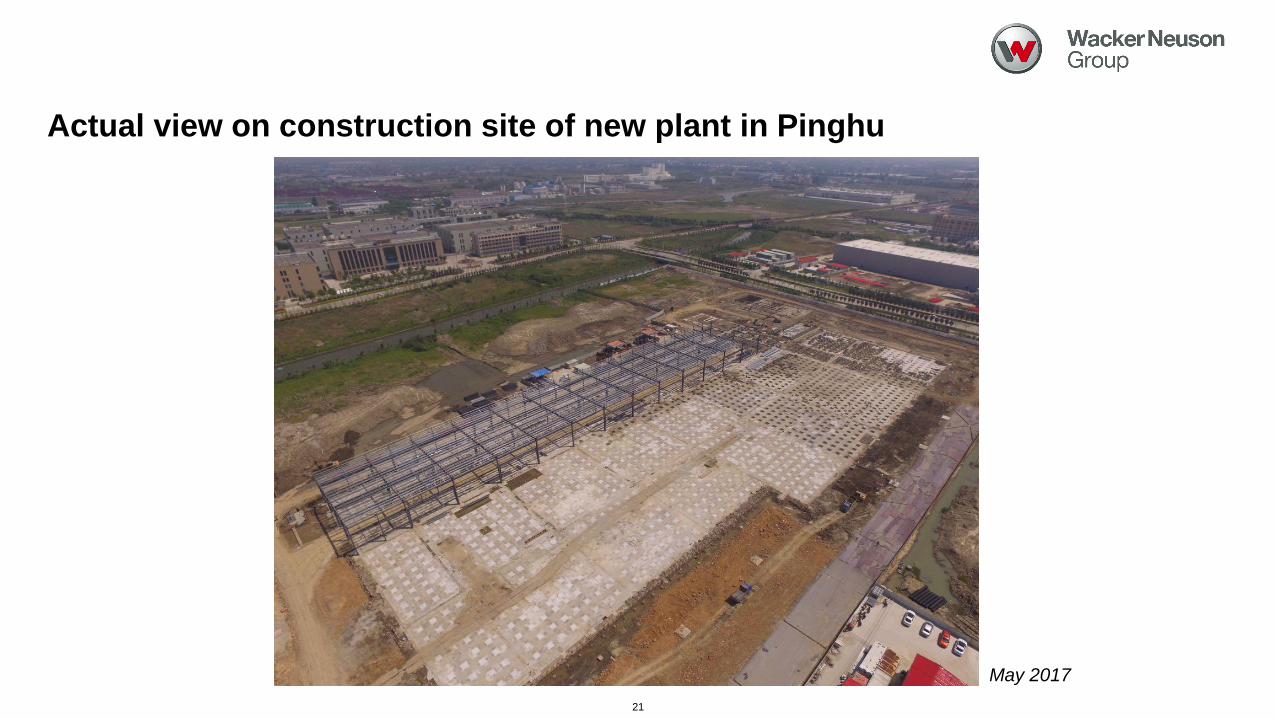
Actual view on construction site of new plant in Pinghu
21
May 2017
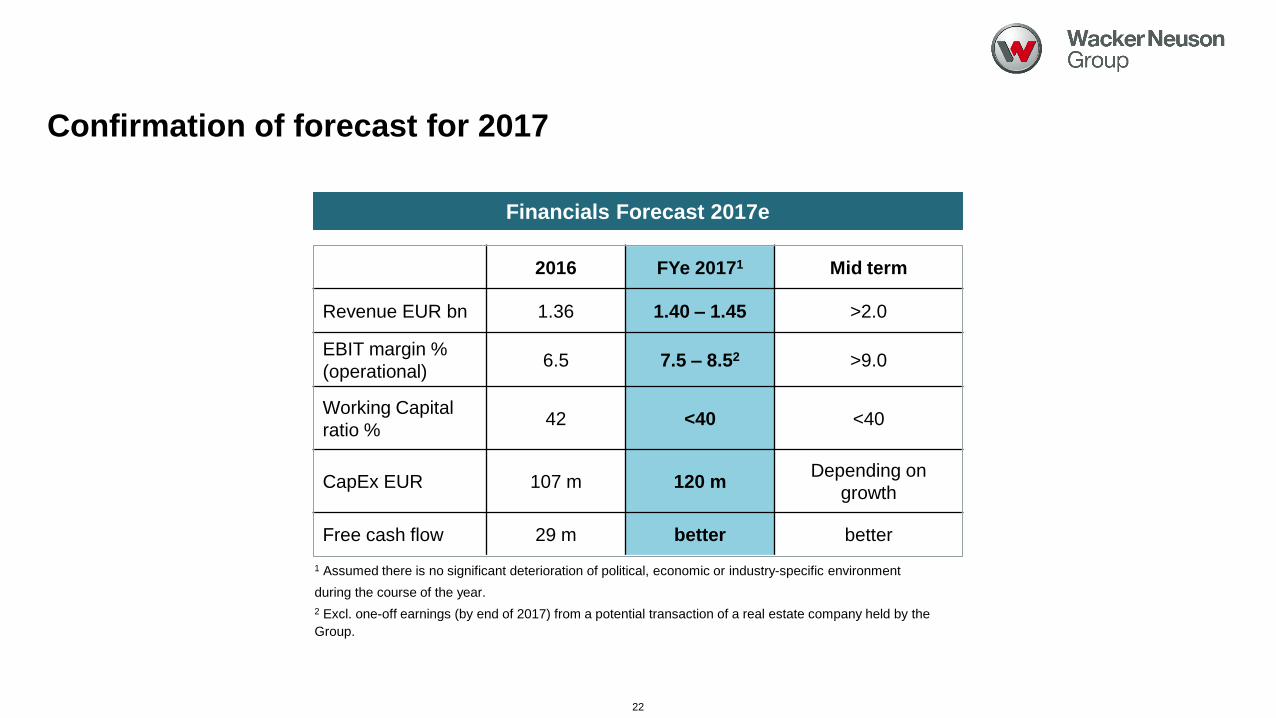
Confirmation of forecast for 2017
22
1 Assumed there is no significant deterioration of political, economic or industry-specific environment
during the course of the year.
2 Excl. one-off earnings (by end of 2017) from a potential transaction of a real estate company held by the
Group.
2016 FYe 20171 Mid term
Revenue EUR bn 1.36 1.40 – 1.45 >2.0
EBIT margin %
(operational)6.5 7.5 – 8.52 >9.0
Working Capital
ratio %42 <40 <40
CapEx EUR 107 m 120 mDepending on
growth
Free cash flow 29 m better better
Financials Forecast 2017e
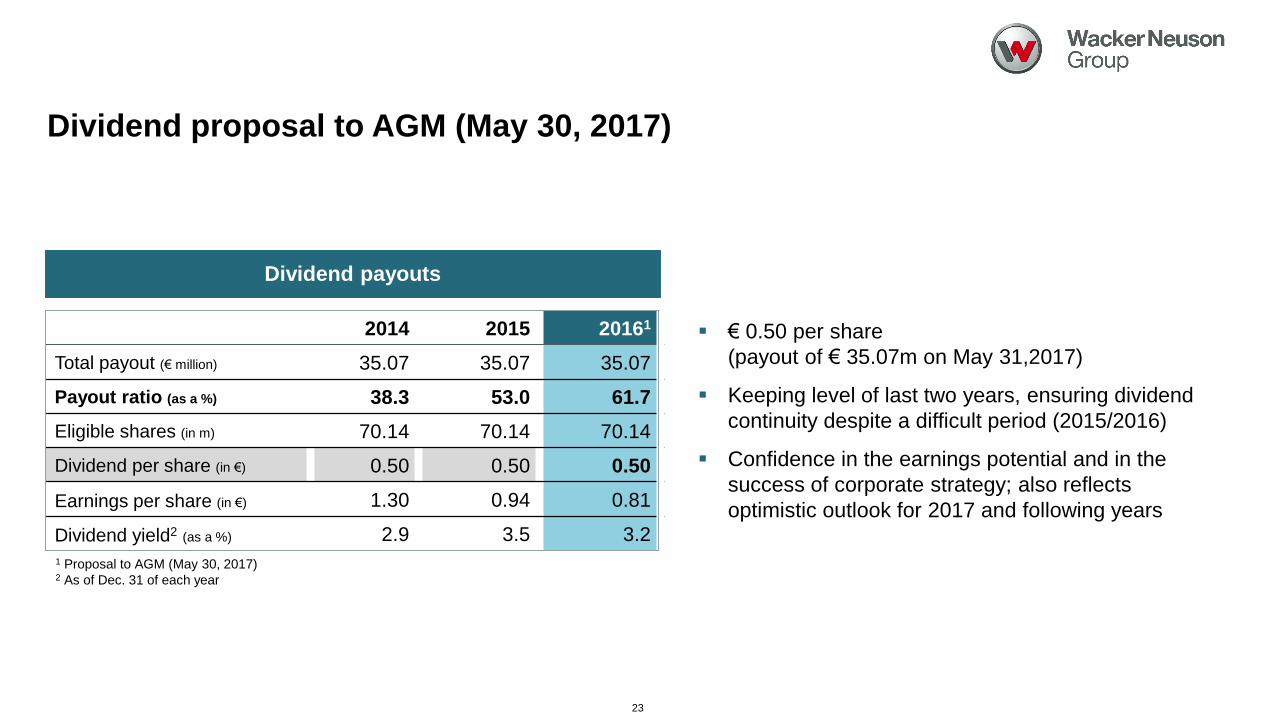
Dividend proposal to AGM (May 30, 2017)
2014 2015 20161
Total payout (€ million) 35.07 35.07 35.07
Payout ratio (as a %) 38.3 53.0 61.7
Eligible shares (in m) 70.14 70.14 70.14
Dividend per share (in €) 0.50 0.50 0.50
Earnings per share (in €) 1.30 0.94 0.81
Dividend yield2 (as a %) 2.9 3.5 3.2
23
Dividend payouts
1 Proposal to AGM (May 30, 2017)2 As of Dec. 31 of each year
€ 0.50 per share
(payout of € 35.07m on May 31,2017)
Keeping level of last two years, ensuring dividend
continuity despite a difficult period (2015/2016)
Confidence in the earnings potential and in the
success of corporate strategy; also reflects
optimistic outlook for 2017 and following years
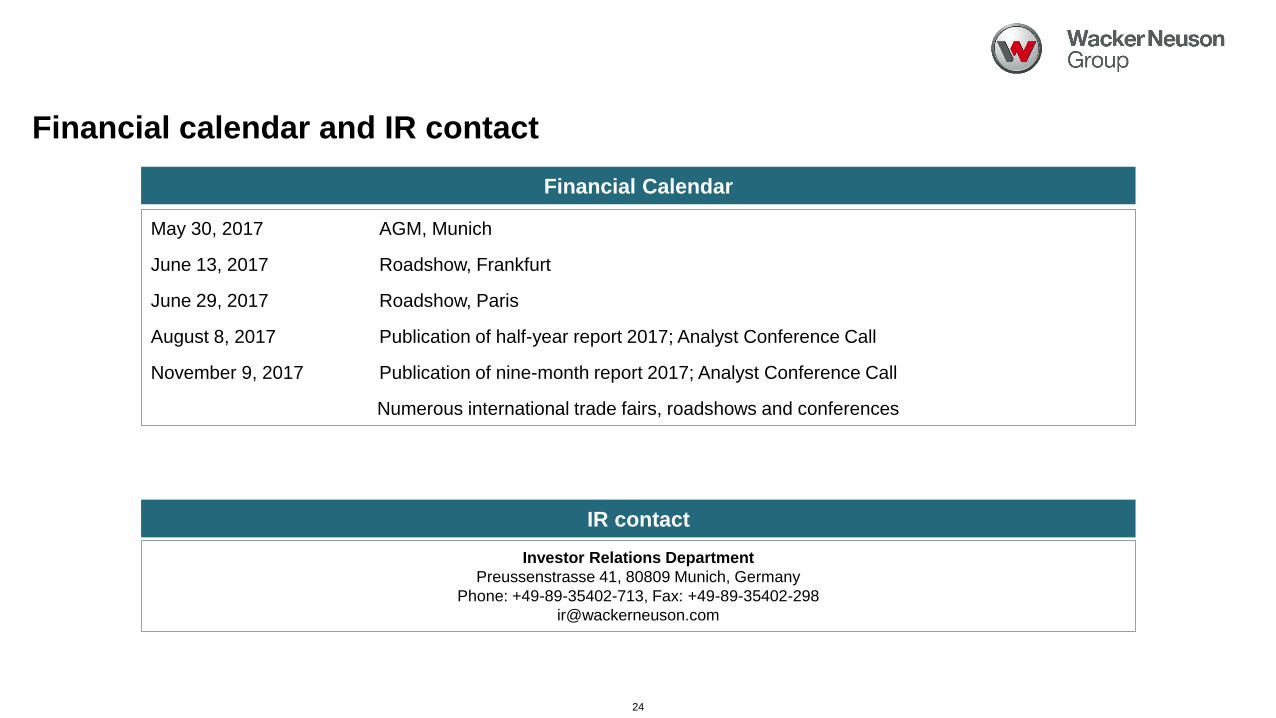
May 30, 2017 AGM, Munich
June 13, 2017 Roadshow, Frankfurt
June 29, 2017 Roadshow, Paris
August 8, 2017 Publication of half-year report 2017; Analyst Conference Call
November 9, 2017 Publication of nine-month report 2017; Analyst Conference Call
Numerous international trade fairs, roadshows and conferences
Financial calendar and IR contact
Financial Calendar
IR contact
Investor Relations Department
Preussenstrasse 41, 80809 Munich, Germany
Phone: +49-89-35402-713, Fax: +49-89-35402-298
24
DisclaimerCautionary note regarding forward-looking statements
The information contained in this document has not been independently verified and no representation or warranty expressed or
implied is made as to, and no reliance should be placed on, the fairness, accuracy, completeness or correctness of this information
or opinions contained herein.
Certain statements contained in this document may be statements of future expectations and other forward looking statements that
are based on management‘s current view and assumptions and involve known and unknown risks and uncertainties that could
cause actual results, performance or events to differ materially from those expressed or implied in such statements.
None of Wacker Neuson SE or any of its affiliates, advisors or representatives shall have any liability whatsoever (in negligence or
otherwise) for any loss howsoever arising from any use of this document or its content or otherwise arising in connection with this
document.
This document does not constitute an offer or invitation to purchase or subscribe for any securities and neither it nor any part of it
shall form the basis of or be relied upon in connection with any contract or commitment whatsoever.
25