w15054
DESCRIPTION
taxTRANSCRIPT
NBER WORKING PAPER SERIES
TAX POLICIES FOR LOW-CARBON TECHNOLOGIES
Gilbert E. Metcalf
Working Paper 15054http://www.nber.org/papers/w15054
NATIONAL BUREAU OF ECONOMIC RESEARCH1050 Massachusetts Avenue
Cambridge, MA 02138June 2009
¸˛I thank Frank Sammartino for helpful comments on a previous draft of this paper. The views expressedherein are those of the author(s) and do not necessarily reflect the views of the National Bureau ofEconomic Research.
NBER working papers are circulated for discussion and comment purposes. They have not been peer-reviewed or been subject to the review by the NBER Board of Directors that accompanies officialNBER publications.
© 2009 by Gilbert E. Metcalf. All rights reserved. Short sections of text, not to exceed two paragraphs,may be quoted without explicit permission provided that full credit, including © notice, is given tothe source.

Tax Policies for Low-Carbon TechnologiesGilbert E. MetcalfNBER Working Paper No. 15054June 2009JEL No. H23,Q48
ABSTRACT
The U.S. tax code provides a number of subsidies for low-carbon technologies. I discuss the difficultiesof achieving key policy goals with subsidies as opposed to using taxes to raise the price of pollution-relatedactivities. In particular, subsidies lower the cost of energy (on average) rather than raising it. Thusconsumer demand responses work at cross purposes to the goal of reducing emissions (especially asaverage cost pricing is used for electricity). Second, it is difficult to achieve technology neutralitywith subsidies – here defined as an equal subsidy cost per ton of CO2 avoided. Third, many subsidiesare inframarginal. Finally, subsidies often suffer from unintended interactions with other policies.
I conclude with some observations on the use of price-based instruments. In particular I discuss howa carbon tax could be designed to achieve environmental goals of emission caps over a control period.
Gilbert E. MetcalfDepartment of EconomicsTufts UniversityMedford, MA 02155and [email protected]
p. 1
Tax Policies for Low-Carbon Technologies
I. Introduction The U.S. tax code provides a number of subsidies for low-carbon technologies. I
discuss the difficulties of achieving key policy goals with subsidies as opposed to using
taxes to raise the price of pollution-related activities. In particular, subsidies lower the
cost of energy (on average) rather than raising it. Thus consumer demand responses
work at cross purposes to the goal of reducing emissions (especially as average cost
pricing is used for electricity). Second, it is difficult to achieve technology neutrality
with subsidies – here defined as an equal subsidy cost per ton of CO2 avoided. Third,
many subsidies are inframarginal. Finally, subsidies often suffer from unintended
interactions with other policies.
The next section describes current tax policies to support low-carbon energy
sources. In section III I discuss the issue of technology neutrality and some other
problems with a subsidy-based approach to energy policy. The next section focuses on
taxes versus production tax credits for wind generation, currently the largest recipient of
tax subsidies in renewable electricity generation. I conclude with some observations on
the use of price-based instruments. In particular I discuss how a carbon tax could be
designed to achieve environmental goals of emission caps over a control period.
II. Current Policies Current tax policy includes a variety of tax preferences for low-carbon
technologies. I discuss the most important preferences in this section. While not
especially costly in terms of foregone tax revenue, I will argue that these preferences
have been important in shaping low-carbon energy investment over the past decade.

p. 2
A. Electricity Generation
A number of preferences in the tax code support the production of renewable
electricity.1 Section 45 of the tax code provides production tax credits over the first ten
years of electricity generation from wind, biomass, geothermal, municipal solid waste,
qualified hydropower, and marine and hydrokinetic energy sources. The credit,
originally enacted as part of the Energy Policy Act of 1992, provides a 2.1 cent per kWh
credit for production in 2008 over ten years.2 The credit phases out as the average
contract price of electricity exceeds 8 cents per kWh (in $1992) – currently 11.8 cents in
2008. The reference price for 2007 announced by the IRS was 3.29 cents per kWh (IRB
2007-21).
Facilities eligible to receive the production tax credit (or the section 48 investment
tax credit discussed below) are also eligible to write off these generation assets over a
five year period. In the absence of this provision, the assets would be written off over a
fifteen year period.
The production tax credit was most recently extended in the American Recovery
and Reinvestment Act of 2009 (ARRA 2009). Wind projects must be put in place before
Jan. 1, 2013; other projects in general before Jan. 1, 2014.
The Energy Policy Act of 2005 added a new production tax credit for new nuclear
power generation (section 45J). Qualifying plants are eligible for a 1.8¢ per kWh
production tax credit up to an annual limit of $125 million per 1,000 megawatts of
installed capacity. This limit will be binding for a nuclear power plant with a capacity
1 For a more detailed description of energy related tax provisions, see Joint Committee on Taxation (2009). 2 This assumes facilities are placed in service after August 8, 2005. Certain facilities placed in service before this date only receive the credit over five years. The credit rate is 1.0 cent for open-loop biomass, small irrigation power, municipal solid waste, qualified hydropower, and marine and hydrokinetic power. These last two sources were not eligible for the credit for facilities put in place prior to August 8, 2005.

p. 3
factor of 80 percent or higher. There is an aggregate limit of 6,000 megawatts of capacity
that is eligible for this credit. Qualifying facilities must be placed in service before the
end of 2020. To date no new plants have been built though combined license
applications for twenty-six units have been filed with the Nuclear Regulatory
Commission.3
Solar powered electricity is eligible for a 30 percent investment tax credit if put in
place prior to the end of 2016 (the credit falls to 10 percent after that date). Certain other
technologies are also eligible for this credit (residential solar projects, fuel cells and
microturbine power plants, geothermal heat pump property (at a 10 percent rate), wind
property no more than 100 kW of rated capacity, and certain combined heat and power
systems (at 10 percent)). In addition, ARRA 2009 allowed certain section 45 qualified
property to elect a 30 percent investment tax credit in lieu of the 2.1 cent per kWh
production tax credit for property put in place through 2013 (2012 for wind). ARRA
2009 also provided for an option to elect a cash grant from the Department of Treasury in
lieu of the production or investment tax credit for certain section 45 and 48 qualifying
investments. The grant covers 30 percent of the cost of the qualified project and in effect
extends the investment tax credit to firms that otherwise do not have sufficient tax
appetite to utilize the credits. This addressed a concern, particularly important for the
wind industry, that the financial crisis has dried up a major source of finance for the wind
industry.4
3 A list of the units is at http://www.nrc.gov/reactors/new-reactors/col.html. Website accessed on May 5, 2009. 4 See discussion in Chadbourne and Parke (January 2009). For an assessment of the relative merits of using the production versus the investment tax credit, see Bolinger et al. (2009).

p. 4
Other electricity related provisions include the exclusion for utility sponsored
conservation measures from taxable income from utility customers and the credit for
holding Clean Renewable Energy Bonds (CREBs). CREBs are designed to encourage
the production of renewable electricity from developers that do not pay federal income
taxes (e.g. municipal governments and municipally owned power companies) and would
otherwise not be eligible for production or investment tax credits. The Joint Committee
on Taxation reports that over 900 projects have received allocations from CREB in 2006
and 2008 with solar projects accounting for nearly two-thirds of the projects and wind
nearly one-quarter of the projects (see Table 1, Joint Committee on Taxation (2009)).
B. Transportation Fuels
Most of the tax provisions related to transport fuels are focused on reducing the
reliance of the transport sector on petroleum. But some – arguably – also reduce carbon
emissions.
The alternative motor vehicle credit (section 30B) provides investment tax credits
for certain fuel cell vehicles, hybrids, plug-in hybrids, and advanced lean burn technology
vehicles. Qualified fuel cell vehicles are eligible for base credits ranging from $8,000 to
$40,000 with additional credits based on fuel economy relative to base fuel economy.
Credits for hybrid automobiles and light trucks combine a fuel economy and a
conservation credit with the maximum possible credit equally $3,400 based on vehicle
characteristics. The credit phases out once the manufacturer's sales of hybrid vehicles
reaches 60,000. A similar phase out exists for the advanced lean burn technology
vehicles. Plug in hybrids become eligible for a base credit of $2,500 for the years 2009

p. 5
with a supplemental credit of $417 per kWh of battery capacity in excess of four kWhs.
The maximum credit ranges from $10,000 to $15,000 depending on vehicle weight.
The Volumetric Ethanol Excise Tax Credit (VEETC) currently provides a 45 cent
per gallon of ethanol exemption from the motor fuels excise tax. For ethanol blended at a
10 percent rate, this reduces the fuel tax by 4.5 cents per gallon of blended fuel. Whether
corn-based ethanol should be viewed as a low-carbon technology is a matter of some
controversy.5 In addition to VEETC, various other credits are provided including a $1.00
per gallon credit for biodiesel and a $.50 per gallon for alternative fuels and alternative
fuel mixtures. I discuss this latter credit further below.
C. Efficiency and Other
A variety of energy efficiency investment credits exist for nonbusiness
(residential) property. A credit equal to 30 percent of the cost of qualified investments
(windows, doors, insulation, burners, etc.) up to $1,500 is eligible for investments
through 2010.6 Manufacturer credits for energy efficient new homes range from $1,000
to $2,000 depending on the efficiency improvements and extend through this year.
Manufacturer credits are provided for appliances meeting higher efficiency standards
through 2010. Manufacturers are limited to maximum claims of $75 million in aggregate
with the exception of the credit for highest efficiency clothes washers and refrigerators.
D. Summary of Low-Carbon Energy Tax Benefits
Table 1 provides an estimate of the tax expenditures related to low-carbon fuels
from the President's latest budget submission.
5 See, for example, Searchinger et al. (2008) and responses to this article published subsequently in Science. 6 This was raised from $500 to $1,500 in ARRA 2009.

p. 6
Table 1. Low-Carbon Energy Tax Expenditures Item FY09 FY09-13
New Technology Credit (Sec. 45 and 48) 1,000 5,010 Alcohol Fuels and VEETC 5,190 12,930 Biodiesel 30 80 Clean-Fuel Burning Vehicles 130 -50 Exclusion of Utility Conservation Subsidies 120 560 CREBs 70 350 New Home Construction Efficiency Credit 20 30 Existing Home Efficiency Investment Credit - - Energy Efficient Appliance Credit - - Residential Solar/Fuel Cell Credit 10 10 Business Credit for Fuel Cells and Microturbine Power 50 10 Source: Office of Management and Budget (2009). Certain benefits are not counted as tax expenditures, for example the five year write-off of investments eligible for the new technology credits.
The tax expenditures associated with low-carbon energy are not that large in the
grand scheme but they are not insignificant. The largest by far is VEETC and other
alcohol fuel related credits totaling nearly $13 billion over five years. The New
Technology Credits (production and investment tax credits) are the second largest
category accounting for over $5 billion over five years.7 ARRA 2009 will likely drive up
the revenue costs of some of these measures. Joint Committee on Taxation estimates that
changes in the new technology tax credits will have a five year budget impact (FY2009 –
2013) of over $3 billion. The extension and more generous treatment of residential home
efficiency improvements will add another $2 billion in revenue costs over five years.
The five year revenue impact for all the energy provisions in ARRA 2009 amount to $6.2
billion. These legislative changes are all directed at low or zero carbon technologies.
7 Certain non-renewable fuels are eligible for the New Production Tax Credit. Analysis by Energy Information Administration (2008) suggests that nearly all of the credit in FY 2007 went to wind.

p. 7
I turn next to an analysis of these subsidies and relate them to larger policy goals.
In particular, I focus on the potential for using tax subsidies to achieve technology
neutrality among energy sources.
III. Technology Neutrality in Carbon Policy Economic theory provides clear prescriptions for situations where interventions
through the tax code can improve social welfare.8 Externalities provide the most relevant
rationale for the energy sector. If the production or consumption of energy has as a by-
product the creation of an externality (e.g. pollution) then social welfare can be improved
through government intervention. One way to do this is by taxing the externality. Thus a
tax on the sulfur content of fossil fuels, for example, would be an efficient response to
acid rain damages arising from fossil fuel consumption for electricity generation. This is
an example of a Pigouvian tax.9 It "internalizes the externality" by forcing firms to take
into account the social costs of pollution by raising their private costs by the amount of
the social damages that are generated by the pollutant. This approach implicitly makes
clear that pollution generating activities have social benefits as well as costs. Optimal
policy must balance those costs against the benefits; the tax is an efficient means of
effecting that balance.
Rather than taxing activities that create negative externalities, we can provide
subsidies to activities that are substitutes for externality generating activities. Put simply,
if fuel X generates pollution damages while fuel Y does not, we can raise the price of fuel
8 This section draws on testimony I provided to the Senate Finance Committee in a hearing focusing on Technology Neutrality in Energy Tax: Issues and Options held on April 23, 2009. 9 Named for the economist Arthur C. Pigou, an early proponent of this policy instrument in Pigou (1932). A comparable approach – and the one taken to address acid rain – is to create a cap-and-trade system for SO2. Either approach puts a price on emissions of SO2 and provides the appropriate price signal to electric utilities to reduce emissions.

p. 8
X relative to fuel Y to reflect the social damages from burning fuel X or we can reduce
the price of fuel Y. Either approach encourages firms to use less of fuel X and more of
fuel Y. This is the essential approach taken through federal energy tax policy. In large
measure, we subsidize energy activities that we would like to encourage rather than tax
activities that we would like to discourage.
What are the externalities that are of significant concern that drive federal tax
policy towards energy? Two concerns dominate the agenda. First is the concern with
global climate change arising from increasing concentrations of greenhouse gases in the
atmosphere. Fossil fuel combustion in the United States was responsible for eighty
percent of domestic greenhouse gas emissions in 2007.10 Any policy to reduce U.S.
greenhouse gas emissions must have as a key element incentives to shift from fossil to
renewable fuels consumption.
A second concern is our heavy reliance on petroleum products and the dominance
of this fuel in the transportation sector. In 2007 seventy percent of petroleum products
were used by the transportation sector. Conversely, petroleum accounted for over 95
percent of the fuel used in this sector. Our reliance on petroleum makes us vulnerable to
economic dislocations from sharply rising oil prices or supply disruptions.
Energy production and consumption are associated with negative externalities in
addition to climate change and oil dependence. I do not focus on those here because
many of these negative externalities are currently addressed through regulatory means.
For example, the Acid Rain Program run by the Environmental Protection Agency has
been a highly cost-effective response to the damages from releasing sulfur dioxide in
fossil fuel electric generation units. Moreover the current set of energy subsidies is 10 See Environmental Protection Agency (2009).

p. 9
arguably focused to a large extent on reducing greenhouse gas emissions and reducing
our consumption of oil.
An efficient energy policy should not favor one energy source over another after
taking into account any positive or negative externalities associated with its production or
consumption. This is the concept of technology neutrality. If our focus is on global
warming due to anthropogenic greenhouse gas emissions, a technology neutral policy
would raise the price of emissions per unit of carbon dioxide equivalent (CO2e) by the
same amount. A comprehensive carbon tax or cap and trade system does this.
It is trickier – as we shall see – to achieve technology neutrality when subsidies
are used instead of taxes. For the purposes of this analysis, I will measure technology
neutrality in terms of the cost of achieving a given amount of carbon dioxide reductions
as a result of the subsidy. The benefit of this approach is that it calibrates the measure of
the tax code's impact to the policy goals we care about (reducing greenhouse gas
emissions). If the tax subsidy per ton of avoided greenhouse gas emissions from
technology X is twice that of reducing emissions from technology Y then we can say that
our tax policy favors technology X over Y on this dimension.
This definition of technology neutrality is not the same as efficiency in abatement
of pollution. The latter requires that the marginal cost of pollution abatement be
equalized across energy sources. Unless subsidies are designed in terms of a payment
per unit of pollution reduced it is difficult if not impossible to achieve economic
efficiency across fuel types. Moreover, as I discuss below, even if subsidies are
constructed in this fashion, it is difficult to disentangle true emission reductions from
reductions that would have taken place in the absence of the tax subsidy.

p. 10
Using subsidies within the tax system to achieve energy policy goals has been a
time honored custom throughout the history of the U.S. income tax. It is important,
however, to recognize the limitations of subsidies in achieving efficient outcomes. First
note that a subsidy based approach achieves the important goal of adjusting relative
prices of polluting and non-polluting energy sources in the right direction. If fuel source
X causes pollution that is equal to 10 percent of its cost then we can provide the right
incentive to fuel users choosing between fuel sources X and Y by raising the price of X
by 10 percent or by lowering the cost of fuel source Y by 1/(1.10) or 9.1 percent. Either
way the relative cost of fuel source X to Y is now ten percent higher than it was prior to
the implementation of new energy policy. Either a tax or a subsidy can be effective on
the margin of choosing among fuel sources where some sources cause pollution.
This creates a problem, however, on a different margin. Efficiency requires that
consumers make decisions taking into account the full cost of using commodities –
including the pollution costs associated with using energy. Raising the cost of the
polluting fuel source X raises the overall cost of energy use and encourages a reduction in
energy consumption. More precisely, consumers shift away from consuming energy to
consuming other goods. This substitution is driven by the higher overall cost of energy.
Subsidizing the clean substitute undermines this consumer substitution effect as it leads
to a lower cost of energy overall. Consumers do not reduce energy consumption as much
as they would under a cost-raising policy.
Second, subsidies that appear to be technologically neutral may not be neutral at
all in the sense of equalizing the subsidy cost per unit of activity that Congress is trying
to discourage. Consider the tax credit for hybrid vehicles put in place in the Energy

p. 11
Policy Act of 2005. The credit ranges from zero to $3,000 per vehicle depending on
whether the vehicle meets the specific hybrid criteria and on how many vehicles have
been sold. The credit phases out as the vehicle hits certain sales targets over time. Table
2 shows the subsidy cost per gallon of gasoline saved through this credit for a number of
vehicles. The tax credit is for model 2009 vehicles. I measure the savings relative to a
vehicle that gets 20 miles per gallon assuming the vehicle is driven the average number
of miles currently driven by private vehicles in the United States.
Table 2. Hybrid Vehicle Tax Credit Model 2009 Values
Vehicle MPG Hybrid
Vehicle Tax Credit
Annualized Value of Credit
Annual Gasoline Savings
(Gallons)
Tax Credit per Gallon of
Gasoline Saved
Chrysler Aspen Hybrid 21 $2,200 $347 30 $11.68
Ford Escape Hybrid (2WD) 32 $3,000 $474 234 $2.02 Mazda Tribute Hybrid (2WD) 32 $3,000 $474 234 $2.02 Nissan Altima
Hybrid 34 $2,350 $371 257 $1.44 Toyota Corolla 31 $0 $0 222 $0 Toyota Prius 46 $0 $0 353 $0
Source: Author's calculations of savings relative to a vehicle that gets 20 miles per gallon and is driven 12,485 miles per year. Vehicles are assumed to be driven for ten years and savings are annualized with a ten percent discount rate.
The table illustrates several points. First, the tax credit per gallon of gasoline
saved varies from zero to over $11 per gallon. Second, certain hybrid vehicles that get
high mileage are excluded from the credit because they have been successful in the
market place. Third, certain high mileage vehicles are excluded from the subsidy
because they do not use specified technology. Note that the Corolla gets nearly the same

p. 12
mileage as the Tribute Hybrid. This is the most egregious violation of technology
neutrality. The tax credit provides no incentive to tinker with the internal combustion
engine to achieve increases in vehicle efficiency despite the many opportunities that exist
to make the internal combustion engine more efficient. Our tax policy should provide the
same incentives to improve mileage regardless of the technology put in place. Only in
this way is true technology neutrality achieved.11
The hybrid vehicle tax credit is a clear example of inefficient allocation of
resources across fuel saving capital investments. It is not the only example, however.
Inefficient allocations can occur even when policies appear to be technology neutral.
Consider the production tax credit for electricity generated from renewable sources.
Currently the tax credit is worth 2.1¢ per kWh for electricity over the first ten years of the
plant's life.12 This policy appears to be technology neutral (assuming all renewable
technologies are made eligible for the credit). Renewable in this context means carbon-
free. But consider Table 3 which compares the production tax credit for wind with that
for geothermal energy.
Table 3. Production Tax Credit
Renewable Source PTC Capacity Factor
Subsidy per ton CO2
Geothermal $ 0.021 73% $ 7.74 Wind $ 0.021 27% $ 12.28 Source: Author's calculations. Capacity factor based on electricity generation in 2006. CO2 emissions avoided assume geothermal replaces coal fired base load capacity while wind replaces natural gas shoulder or peaking capacity. Coal and natural gas emissions based on EIA estimates.
11 Others have noted the inconsistent treatment of different vehicles and provided calculations similar to those in Table 2 including Sullivan (2009) and Joint Committee on Taxation (2009). 12 As noted above, certain sources (e.g. municipal solid waste and open loop biomass) are eligible for a tax credit at half this rate.

p. 13
The subsidy per ton of carbon dioxide avoided critically depends on which power source
is displaced by the new renewable capacity addition. Geothermal power, for example,
has a capacity factor of over 70 percent – meaning that it is producing power on average
for 70 percent of the year – while wind's capacity factor is less than 30 percent.13
Geothermal power is more likely to displace base load coal units than natural gas while
the opposite is true for wind. Under the assumption that geothermal displaces coal and
wind displaces natural gas, the subsidy for the former is $7.74 per ton of carbon dioxide
avoided while the subsidy for wind is $12.28 per ton. The difference arises because coal
emits on average one ton of CO2 per MWh of electricity generation while natural gas
emits on average roughly two-thirds of a ton of CO2 per MWh.
The point here is not whether geothermal displaces coal and wind natural gas (or
even whether the displaced fuel is constant over time). Rather the point is that a
technology neutral policy focused on reducing greenhouse gas emissions should favor
technologies that are more likely to displace coal than natural gas. The current new
technology credits do not take this into account.
A related point is the lack of transparency in a subsidy-based policy. It is difficult
to identify the cost per ton of CO2 displaced with either of the policies discussed above.
The current proposal for a "cash for clunkers" program also illustrates this point. A
recent paper by Davis and Kahn (2008) suggests that the cars most likely to be candidates
for a cash for clunkers program would have emitted about 47 tons of carbon dioxide over
their remaining life had they not been scrapped. At a cost of $2,500 the cash for clunkers
13 The capacity factor for wind depends importantly on location and turbine design. Capacity factors as high as 40 percent are not out of the question. But even at higher capacity factors the point of this example is unaffected. The capacity factor cited in this table is the average over all existing and operating wind facilities in the United States.

p. 14
program costs over $50 per ton of CO2 saved. Once you factor in the possibility that very
old cars that have been already taken off the road but not scrapped are brought in for the
payment, the cost per ton rises dramatically. The current House cash for clunkers
proposal will provide vouchers for $3,500 or $4,500 depending on the mileage difference
between a traded in vehicle and its replacement (Herszenhorn (2009)). The cost of
saving a ton of carbon dioxide gets obscured in the details of the program
In summary, the current set of subsidies to encourage reductions in petroleum
consumption and greenhouse gas emissions have two drawbacks. First, they generate a
distortion on the margin between energy consumption and consumption of other non-
energy commodities. Second, they generate distortions among the externality-reducing
technologies in a way that raises the cost of achieving our policy goals while doing so in
a fairly opaque way.
In addition to the pricing issues discussed above, the current set of energy tax
initiatives have other issues that could fruitfully be addressed by lawmakers. The first
issue is that of stability and clarity in the policy. The historic pattern of two-year
authorization cycles for production tax credits has created great uncertainty in the wind
industry and led to boom and bust cycles that raise the cost of renewable energy
investment. Greater certainty over the production tax credit would smooth out
investment and reduce bottlenecks in turbine manufacture that delay projects and raise
costs. A related issue is the ability to use tax benefits. One casualty of the current
financial crisis is the reduced tax appetite of firms that historically have invested in wind
and other renewable projects. The provision of the cash rebate option in ARRA 2009
addresses this concern.

p. 15
A second key design issue is that of additionality. Does the policy lead to
incremental reductions in pollution or simply subsidies for emission reducing activities
that would have occurred in the absence of the policy? A good example of this is the
$.50 per gallon alternative fuels mixture credit. This credit is intended to encourage the
addition of biodiesel and other biomass based fuels to petroleum to reduce petroleum use.
Recently it has emerged that many paper firms are taking the credit for mixing diesel fuel
with black liquor, a biomass by-product of paper making that historically has been used
by the industry as a fuel source for their boilers. Controversy has arisen over whether
paper firms are adding diesel fuel to black liquor purely for the purpose of claiming the
tax credit biodiesel mixture tax credit.14 This is troubling on two levels. First, it may be
highly inefficient if credits are being provided for inframarginal activities. This is a
common problem with any subsidy. We want to provide the incentive to firms that
would not have undertaken the desirable activity in the absence of the subsidy. But we
don't want to provide the subsidy to firms that would have undertaken the activity
regardless of the subsidy. But the example from the paper industry is troubling beyond
the inframarginal nature of the subsidy. If the tax credit is raising the demand for diesel
fuel in order to make the biofuel eligible for the credit, then it is having the perverse
effect of raising rather than lowering demand for petroleum products.15
A third important design issue is the interaction between tax policy and other
policies. A simple example here is the interaction of the hybrid vehicle tax credit and the
Corporate Average Fuel Economy (CAFE) standards. Allowing tax credits for hybrids
14 See Mouawad and Krauss (2009). 15 The perverse impact of policy is not limited to the biodiesel mixing tax credit. Research by Holland, Hughes and Knittel (2009) suggest that low carbon fuel standards may have the perverse effect of increasing net carbon emissions.
p. 16
encourages the production and purchase of high mileage vehicles. But CAFE sets
minimum fleet mileage standards for automakers. Producing more hybrid vehicles
relaxes the CAFE mileage constraint for automakers and allows them to sell more low
mileage vehicles.16 One possible policy response to this would be to exclude credit
receiving hybrids from the fleet for purposes of meeting CAFE standards. Alternatively
one could eliminate the credit and simply let CAFE be the driving incentive for hybrid
production.
Two other examples illustrate the unintended consequences of policy interaction.
First, state renewable portfolio standards like California's 20 percent RPS program by
2010 are driving up the cost of the federal production tax credit. The most recent
Administration budget shows tax expenditures from the new technology tax credit rising
from $800 million in FY2008 to $1000 million in FY2009 to $1030 in FY2010. Part of
this increase is driven by requirements for renewable electricity at the state level.
Second, the ethanol tax credit of $.45 per gallon of ethanol is inframarginal to the
extent that other regulations mandate the use of ethanol in gasoline stocks. In Metcalf
(2008) I argue that ethanol mandates in the Energy Policy Act of 2005 along with other
pollution-required demands for ethanol in reformulated gasoline make the ethanol tax
credit largely inframarginal. With generous assumptions about carbon displacement from
ethanol relative to gasoline, I calculate that the subsidy through the ethanol tax credit
exceeds $1,700 per ton of CO2 displaced in 2005 and 2006.
16 Alternatively and equivalently, it leads to the substitution of hybrid vehicles for other high mileage vehicles that in the absence of hybrids the automakers market primarily to meet CAFE fleet standards.

p. 17
IV. Taxes versus Subsidies
Most if not all of the problems identified in the previous section disappear if we
replace the current system of tax subsidies for carbon free technologies with taxes on
fossil fuels. I begin by assessing the "carbon tax equivalent" for production tax credits
using a levelized cost framework.17 The levelized cost of an electricity generating project
is the constant amount of revenue per kilowatt-hour required to cover all the costs of an
investment project (including returns to equity investors).
I compare the levelized cost of an advanced combustion turbine for gas with a
wind project under the assumption that at the margin wind and natural gas are
competitive fuel sources. If investors are choosing between these two technologies on
the basis of levelized cost, I consider what tax incentives are required to make wind
competitive with natural gas. A number of factors affect the relative cost of wind and
natural gas powered generators. I focus on two in particular in this paper: the cost of
natural gas and the relative capital cost escalation for wind to gas.
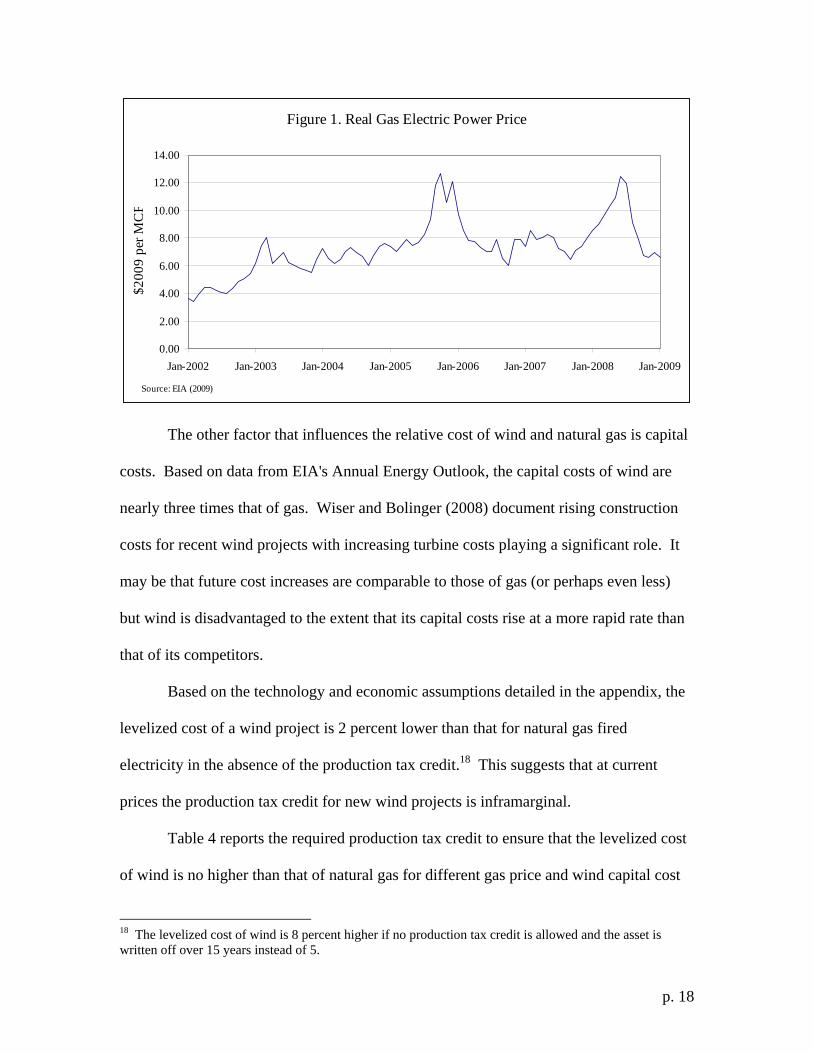
Figure 1 shows how natural gas prices paid by electric utilities have fluctuated
over the past seven years. They hit a (nominal) peak in June 2008 but since then have
fallen by nearly fifty percent. The decline in gas prices makes wind that much less
competitive against natural gas generation.
17 See Metcalf (2007) for a discussion of this methodology.
p. 18
Figure 1. Real Gas Electric Power Price
0.00
2.00
4.00
6.00
8.00
10.00
12.00
14.00
Jan-2002 Jan-2003 Jan-2004 Jan-2005 Jan-2006 Jan-2007 Jan-2008 Jan-2009
$200
9 pe
r MC
F
Source: EIA (2009)
The other factor that influences the relative cost of wind and natural gas is capital
costs. Based on data from EIA's Annual Energy Outlook, the capital costs of wind are
nearly three times that of gas. Wiser and Bolinger (2008) document rising construction
costs for recent wind projects with increasing turbine costs playing a significant role. It
may be that future cost increases are comparable to those of gas (or perhaps even less)
but wind is disadvantaged to the extent that its capital costs rise at a more rapid rate than
that of its competitors.
Based on the technology and economic assumptions detailed in the appendix, the
levelized cost of a wind project is 2 percent lower than that for natural gas fired
electricity in the absence of the production tax credit.18 This suggests that at current
prices the production tax credit for new wind projects is inframarginal.
Table 4 reports the required production tax credit to ensure that the levelized cost
of wind is no higher than that of natural gas for different gas price and wind capital cost
18 The levelized cost of wind is 8 percent higher if no production tax credit is allowed and the asset is written off over 15 years instead of 5.
p. 19
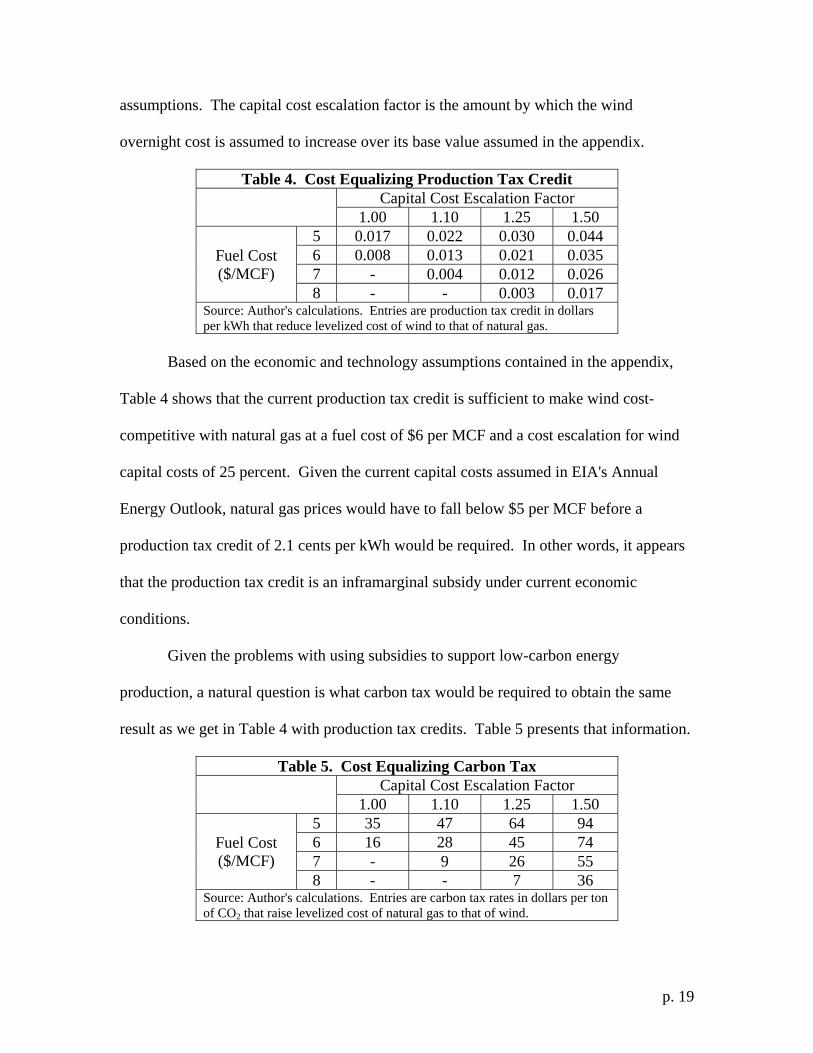
assumptions. The capital cost escalation factor is the amount by which the wind
overnight cost is assumed to increase over its base value assumed in the appendix.
Table 4. Cost Equalizing Production Tax Credit Capital Cost Escalation Factor 1.00 1.10 1.25 1.50
Fuel Cost ($/MCF)
5 0.017 0.022 0.030 0.044 6 0.008 0.013 0.021 0.035 7 - 0.004 0.012 0.026 8 - - 0.003 0.017
Source: Author's calculations. Entries are production tax credit in dollars per kWh that reduce levelized cost of wind to that of natural gas.
Based on the economic and technology assumptions contained in the appendix,
Table 4 shows that the current production tax credit is sufficient to make wind cost-
competitive with natural gas at a fuel cost of $6 per MCF and a cost escalation for wind
capital costs of 25 percent. Given the current capital costs assumed in EIA's Annual
Energy Outlook, natural gas prices would have to fall below $5 per MCF before a
production tax credit of 2.1 cents per kWh would be required. In other words, it appears
that the production tax credit is an inframarginal subsidy under current economic
conditions.
Given the problems with using subsidies to support low-carbon energy
production, a natural question is what carbon tax would be required to obtain the same
result as we get in Table 4 with production tax credits. Table 5 presents that information.
Table 5. Cost Equalizing Carbon Tax Capital Cost Escalation Factor 1.00 1.10 1.25 1.50
Fuel Cost ($/MCF)
5 35 47 64 94 6 16 28 45 74 7 - 9 26 55 8 - - 7 36
Source: Author's calculations. Entries are carbon tax rates in dollars per ton of CO2 that raise levelized cost of natural gas to that of wind.

p. 20
One striking fact about Table 5 in comparison to Table 4 is the magnitude of the
carbon tax required to be equalize the levelized costs of both technologies. Moreover,
Table 5 indicates that a carbon tax of $45 per metric ton of CO2 is comparable to the
current production tax credit of $0.021 per kWh. The high carbon price required to be
equivalent in impact to the production tax credit simply reflects the fact that wind in this
model is replacing a relatively low-carbon fuel (relative to coal). A carbon tax of only
$25 is comparable to a $.021 per kWh production tax credit for wind if wind is
substituting for coal.
In the previous section I argued that a technology neutral subsidy for low-carbon
energy would take into account the carbon content of the fuel that it displaced. If the
purpose of a production tax credit is simply to make wind cost competitive with fossil
fuel power sources, it should take into account the profitability of the wind project. The
higher the capacity factor of the project, ceteris paribus, the more profitable the project
is. Table 6 reports capacity factors for wind projects installed in 2006 averaged across
regions of the country. If our focus is on cost competitiveness Table 6 suggests that the
production tax credit should be highest in New England and lowest in the Midwest of the
United States. I'm not suggesting that the United States should implement this policy but
rather note this to illustrate the confused policy objectives behind this particular energy
tax subsidy.

p. 21
Table 6. Regional Wind Capacity Factors
Region Capacity Factor
Midwest 40.8%Texas 30.4%California 36.9%Northwest 31.3%Mountain 34.7%East 29.4%Hawaii 45.0%New England 22.1%Source: Wiser and Bolinger (2008)
What would a price based approach look like? The two competing options are
cap-and-trade programs and carbon taxes. Political momentum favors the former
approach while ease of administration and efficiency favors the latter. The interested
reader is referred to Metcalf and Weisbach (forthcoming) for details on how a carbon tax
could be implemented. Many of the design considerations also apply to cap-and-trade
programs.
Here I simply wish to note one argument against carbon taxes often raised by
environmentalists: that a cap-and-trade program provides certainty in the environmental
outcome while the carbon tax does not.19 In Metcalf (2009a) I describe a carbon tax that
meets long-term emission targets while providing the price certainty advantages of a tax.
The Responsive Emissions Autonomous Carbon Tax (REACT) sets an initial tax rate at
the beginning of the control period (say, 2012) and increases the tax at a standard rate of
four percent plus inflation. In benchmark years (perhaps every five years) cumulative
emissions since the beginning of the control period are compared to a target cumulative 19 See, for example, the posting by Gernot Wagner and Nathaniel Keohane, "The case for cap-and-trade: There's certainty in the environmental outcome" posted on the Bulletin of the Atomic Scientists Roundtable on Carbon tax versus cap and trade at http://www.thebulletin.org/web-edition/roundtables/carbon-tax-vs-cap-and-trade accessed on May 5, 2009.

p. 22
emissions goal for that year. If actual cumulative emissions exceed the target in the
benchmark year, the tax is increased at a "catch-up" rate of ten percent plus inflation until
the next benchmark year. If cumulative emissions in that year are below the target the
rate drops back to the standard rate. If not, it stays at the higher catch-up rate.20
This policy approach ensures that long-run targets are met while price stability is
achieved in the short run. Given the ability to predict emissions in the short run and the
transparent nature of the tax, firms would be able to predict with considerable certainty
what the growth rate of the tax will be in the near term thereby providing greater clarity
for their planning purposes. The REACT approach addresses the objection that a carbon
tax does not ensure a hard cap on greenhouse gas emissions over the control period. An
overall cap can be maintained while insulating consumers and businesses from short-run
fluctuations in carbon prices that add volatility to energy prices and undermine support
for climate change legislation. It does this with a transparent mechanism for adjusting
the price of emissions over the control period.
V. Conclusion The current tax code relies on a large number of subsidies through accelerated
depreciation, tax exemptions, production credits and investment credits to support low-
carbon technologies. This approach is flawed on a number of levels. First, it lowers the
price of consuming energy relative to other goods. Second, the subsidies are not cost
effective in that they do not equalize the subsidy cost per ton of CO2 that is not emitted.
Third, to the extent that the subsidy is inframarginal it raises the cost to the federal
government of achieving its policy objectives. Finally, subsidies interact in unexpected
20 This approach is similar in spirit to the managed price approach described in Elmendorf (2009).

p. 23
ways with other state and federal policies in ways that either undermine the effectiveness
of the subsidy or drive up the cost of the program.
An approach that improves in the area of economic efficiency is a market-based
approach such as a cap-and-trade system or a carbon tax. The Responsive Emissions
Autonomous Carbon Tax is one approach to implementing a carbon tax that addresses the
concern that a tax-based approach does not guarantee that emission goals are achieved.
If the United States does implement a carbon tax, an important question will be
whether it preserves or eliminates the various subsidies to low-carbon fuels that are in the
tax code. It is difficult to make a case for preserving them if carbon pricing comes into
effect.
p. 24
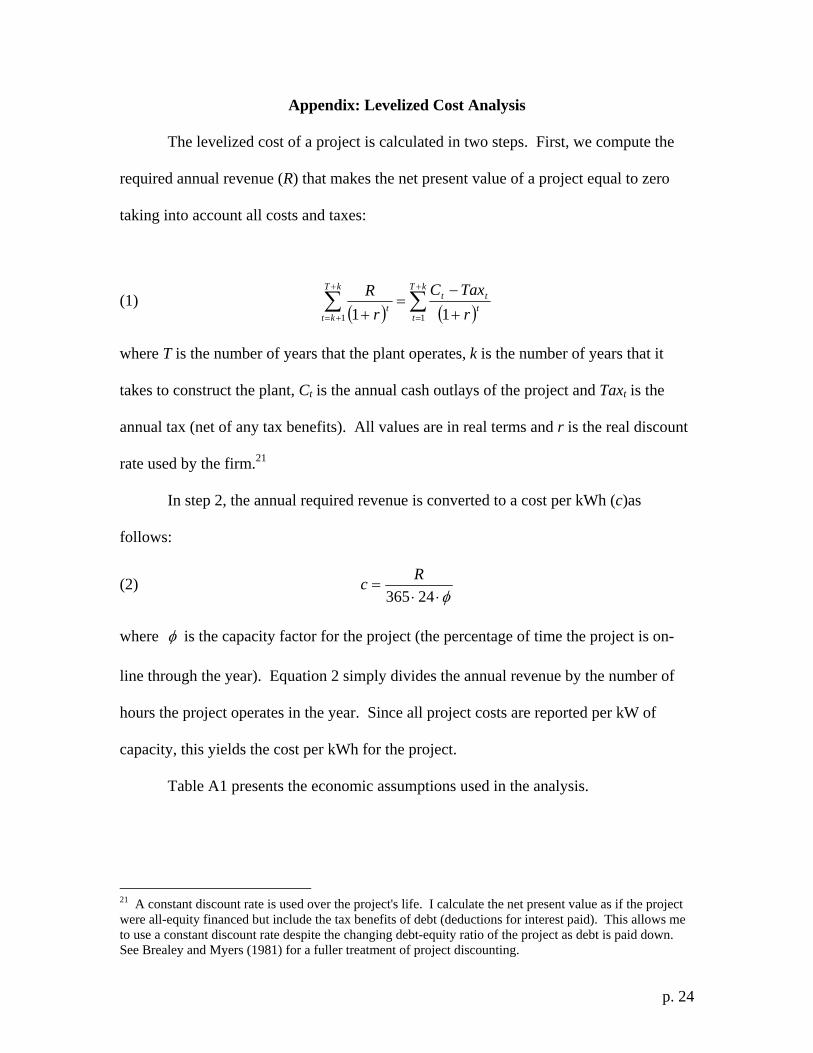
Appendix: Levelized Cost Analysis The levelized cost of a project is calculated in two steps. First, we compute the
required annual revenue (R) that makes the net present value of a project equal to zero
taking into account all costs and taxes:
(1) ( ) ( )∑∑
+
=
+
+= +
−=
+
kT
tt
ttkT
ktt r
TaxCr
R11 11
where T is the number of years that the plant operates, k is the number of years that it
takes to construct the plant, Ct is the annual cash outlays of the project and Taxt is the
annual tax (net of any tax benefits). All values are in real terms and r is the real discount
rate used by the firm.21
In step 2, the annual required revenue is converted to a cost per kWh (c)as
follows:
(2) φ⋅⋅
=24365
Rc
where φ is the capacity factor for the project (the percentage of time the project is on-
line through the year). Equation 2 simply divides the annual revenue by the number of
hours the project operates in the year. Since all project costs are reported per kW of
capacity, this yields the cost per kWh for the project.
Table A1 presents the economic assumptions used in the analysis.
21 A constant discount rate is used over the project's life. I calculate the net present value as if the project were all-equity financed but include the tax benefits of debt (deductions for interest paid). This allows me to use a constant discount rate despite the changing debt-equity ratio of the project as debt is paid down. See Brealey and Myers (1981) for a fuller treatment of project discounting.

p. 25
Table A1. Economic Assumptions for Analysis Real Required Return To Equity 10% Inflation Rate 3% Nominal Bond Rate 8.6% Federal Corporate Tax Rate 35% Average State Corporate Tax Rate 6.6% Combined Tax Rate 39.3% Depreciation Method MACRS
The nominal bond rate is based on the fifty year average of Baa bond yields as reported
in the Economic Report of the President. The average state corporate tax rate is taken
from Ernst & Young (2007). Table A2 gives my assumed technology and cost
assumptions for wind and natural gas projects.
Table A2. Technology and Cost Assumptions Natural Gas Wind
Capacity Factor 85% 35% Construction Time 2 3 Fuel Cost ($/MMbtu) 7.00 0 Heat rate (BTU/kWh) 9,289 na fuel escalation 0.00% 0.00% fixed O&M ($/kW/yr) 10.53 30.30 variable O&M ($/kWh) 0.00317 0.009 O&M escalation rate 0% 0% Capital Increment ($/kW) 8 0 K Increment (yrs 30+) 14 0 % Debt Finance 60% 60% % Equity Finance 40% 40% Discount Rate (nominal) 8.33% 8.33% Overnight cost ($/kW) 634 1,923 Economic Life 40 20 MACRS Life 15 5
The capacity factor for wind is based on the capacity factor for new wind projects
as documented in Wiser and Bolinger (2008). Other assumptions are taken from the
Electricity Market Module of Energy Information Administration (2009). For a
discussion of the tax treatment of energy investment, see Metcalf (2009b).

p. 26
References
Bolinger, Mark; Wiser, Ryan; Cory, Karlynn and James, Ted. 2009. "PTC, ITC, or Cash Grant?," Berkeley: Lawrence Berkeley National Laboratory LBNL-1642E. Brealey, Richard and Myers, Steward. 1981. Principles of Corporate Finance. New York: McGraw-Hill. Chadbourne and Parke, LLP."Trends in Tax Equity for Renewable Energy," New York, January 2009. Davis, Lucas W. and Kahn, Matthew E. 2008. "International Trade in Used Durable Goods: The Environmental Consequences of NAFTA," Cambridge MA: National Bureau of Economic Research Working Paper No. 14565. Elmendorf, Douglas W. 2009. "Flexibility in the Timing of Emission Reductions Under a Cap-and-Trade Program," Washington, DC: Congressional Budget Office. Energy Information Administration. 2008. "Federal Financial Interventions and Subsidies in Energy Markets 2007," Washington, DC: EIA SR/CNEAF/2008-01. ____. 2009. "Annual Energy Outlook 2009," Washington, DC: U.S. Energy Information Administration DOE/EIA-0383(2009). Environmental Protection Agency. 2009. "Inventory of U.S. Greenhouse Gas Emissions and Sinks: 1990 - 2007," Washington, DC: Environmental Protection Agency EPA 430-R-09-004. Ernst & Young. 2007. "International Comparison of Depreciation Rules and Tax Rates for Selected Energy Investments." Herszenhorn, David M."House Reaches a Deal on 'Cash for Clunkers' Program," New York Times, New York, May 5, 2009. Holland, Stephen P.; Hughes, Jonathan E. and Knittel, Christopher R. 2009. "Greenhouse Gas Reductions under Low Carbon Fuel Standards?" The American Economic Journal: Economic Policy, 1(1). 106-46. Joint Committee on Taxation. 2009. "Tax Expenditures for Energy Production and Conservation," Washington, DC: Joint Committee on Taxation JCX-25-09. Metcalf, Gilbert E. 2007. "Federal Tax Policy towards Energy." Tax Policy and the Economy, 21. 145-84.
p. 27
____. 2008. "Using Tax Expenditures to Achieve Energy Policy Goals." American Economic Review, 98(2). 90-94. ____. 2009a. "Reacting to Greenhouse Gas Emissions: A Carbon Tax to Meet Emission Targets," Medford, MA: Tufts University Department of Economics. ____. 2009b. "Taxing Energy in the United States: Which Fuels Does the Tax Code Favor?," New York: The Manhattan Institute. Metcalf, Gilbert E. and Weisbach, David. forthcoming. "The Design of a Carbon Tax." Harvard Environmental Law Review. Mouawad, Jad and Krauss, Clifford."Lawmakers May Limit Paper Mills' Windfall," New York Times, New York, p. B1, April 18, 2009. Office of Management and Budget. 2009. "Budget of the United States Government, Fiscal Year 2010," Washington, DC: U.S. Government Printing Office. Pigou, Arthur C. 1932. The Economics of Welfare. London: MacMillan and Co. Searchinger, Timothy; Heimlich, Ralph; Houghton, R.A.; Dong, Fengxia; Elobeid, Amani; Fabiosa, Jacinto; Tokgoz, Simla; Hayes, Dermot and Yu, Tun-Hsiang. 2008. "Use of U.S. Croplands for Biofuels Increases Greenhouse Gases Through Emissions from Land-Use Change." Science, 319(5687). 1238-40. Sullivan, Martin A. 2009. "Tech Neutrality, Tax Credits, and the Gas Tax." Tax Notes, 122(5). 619-24. Wiser, Ryan and Bolinger, Mark. 2008. "Annual Report on Wind Power Installation, Cost, and Performance Trends: 2007," Washington, DC: U.S. Department of Energy.