w. roger buck, fernando martinez 1, michael s. …buck/publications_files/1988bucketalpure... · w....
TRANSCRIPT

TECTONICS, VOL. 7, NO. 2, PAGES 213-234, APRIL 1988
THERMAL CONSEQUENCES OF LITHOSPHERIC EXTENSION: PURE AND SIMPLE
W. Roger Buck, Fernando Martinez 1, Michael S. Steckler and James R. Cochran
Lamont-Doherty Geological Observatory of Columbia University, Palisades NY
Abstract. Simple shear and pure shear extension of the lithosphere produce very different patterns of heat flow and topography. These differences are investigated using a numerical technique which solves for two-dimensional conductive and advective heat transport through time. Simple shear extension of the lithosphere is modeled as occurring along a straight shear zone. Two parameters define the simple shear model: the dip of the shear zone and its width. Likewise, the pure shear model is defined by two variables: the initial width of a vertical zone of pure shear extension and the rate of change of its width. These pairs of parameters are varied between calculations, as is the overall rate of extension. Each model results in distinct patterns of crustal thinning, lithospheric thermal structure, heat flow, thermal uplift, crustal subsidence, and topography. For the simple shear model, extension results in asymmetric uplift across the rift, while the total volume of uplift is limited by the total amount of extension. The peak heat flow and thermal uplift are centered over the intersection of the shear zone with the
surface. Isostatic response to simple shear extension results in successive, formerly active shear zones being rotated into listtic faults which sole into a subhorizontal detachment. The
pure shear results show that the surface heat flow is greater for smaller widths of the zone of extension. For the same overall
1Also at the Department of Geological Sciences, Columbia University.
Copyright 1988 by t,he American Geophysical Union.
Paper number 7T0883. 0278-7407/88/007T-0883 $10.00
extension rate, a pure shear model with a narrow zone of extension can result in pressure release melting of the mantle long before low angle simple shear models. These results are compared with topographic and heat flow data from the northem Red Sea rift, a Neogene continental rift which is close to initiating seafloor spreading. The long wavelength topographic asymmetry across the Red Sea, which has been cited as evidence for simple shear extension of the lithosphere, is not matched by any of the models. The observed high heat flow anomalies in the Red Sea require a large component of pure shear lithospheric extension centered under the region of maximum crustal extension. In contrast, at the plate separation rate of the northern Red Sea, simple shear extension of the lithosphere along a shallow (<30 ø) dip detachment is ineffective in reproducing the observed heat flow anomalies. Only a narrowing region of pure shear extension can satisfy the width of the rift, and the peak heat flow values and generate pressure release melting.
INTRODUCTION
Rifts have long been thought of as symmetrical structures [Vening Meinesz, 1950]. However, recent geological and geophysical observations have emphasized the importance of simple shear extension in the crust which gives rise to asymmetric structures. Normal faults having a consistent sense of dip are generally associated with simple shear deformation. Low angle normal faults exposed at the surface have been traced to mid crustal levels using seismic reflection techniques. COCORP seismic lines in the eastern Basin and Range show low angle normal faults which penetrate the upper and middle crust [Allmendinger et al., 1987]. The Bay of Biscay, which has been considered a classic example of a pure shear margin [deCharpal et al., 1978], is now interpreted by Le Pichon and Barbier [1987] to show evidence of crustal scale

214 Buck et al.: Lithospheric Extension: Pure and Simple
Pure Shear
Asthenosphere
Simple Shear
Mantle Lithosphere •,•X
Asthenosphere
Fig. 1. Schematic geologic m•eN depicting (a) •e she• exmnsion of a li•osphere com•• of a bdtfiely defoming up•r layer over a duc•ly alefoxing lower Nyer pr•ucing a symme•ic lithospheric cross-s•fion. (b) Simple she• extension •ong a •oughgoing low-•gle detachment [after Wemicke, 1985]. The demc•ent divides •e li•osphere into • "up•r plate" •d a "lower plate" or hanging w•l •d f••l. Thi•ing of •e Bwer li•o•here is offset •ong •e demc•ent from •inning of •e up•r li•ospMre, pr•uc•g • mymmeffic •osphefic c•s-•fion.
simple shear along a detachment. Metamorphic core complexes show that rocks can come up from mid crustal levels apparently in association with extensional shear zones [Davis, 1983]. The observation of synthetically dipping normal faults over broad areas (e.g., the southern Basin and Range) has been taken as evidence for simple shear [Wernicke, 1981]. Strong topographic and volcanic asymmetries exist across some rifts and conjugate passive margins, among them the Red Sea rift [Wernicke, 1985], East African Rift [Bosworth, 1987] and the Southeast Australian - Lord Howe Rise conjugate margin [Lister et al., work in preparation, 1988]. The direct observations of simple shear extension are confined to the crust. However, the observation of normal faults extending to great depth in the crust combined with observations of topographic asymmetries across rifts have led to the suggestion that normal faults and/or ductile shear zones may extend through the entire lithosphere [Wernicke, 1981; 1985; Lister et al., 1986]. Such lithospheric detachment models imply that much of the deformation in an extending region occurs as simple shear rather than pure shear (see Figure 1).
Structures within rifts and at passive margins are complex, however, models for their development are generally cast in terms of one of two general headings: pure shear or simple shear extension of the lithosphere. Considerable effort has been expended in recent years in quantifying the effects of pure shear extension, and thermomechanical models of several variants of pure shear extension have been produced [McKenzie, 1978; Royden and Keen, 1980; Steckler, 1981;
Beaumont et al., 1982]. In contrast, little has been done to test the qualitative predictions of the simple shear model. Simple shear extension leads to the maximum thinning of the crust being displaced laterally from the maximum thinning of the mantle lithosphere (Figure lb). This implies that simple shear rifts have asymmetric uplift, subsidence, and heat flow distributions. A one-dimensional numerical study of the simple shear model has been carried out by Furlong and Londe [1986] for a specific geometry and extension rate. Two-dimensional effects are important in this problem, and a variety of geometries need to be considered. We have therefore developed a numerical scheme which approximates the thermal effects of a two-dimensional lithosphere extending under both pure and simple shear conditions. The same finite difference technique is used to follow the thermal evolution of the lithosphere under different distributions of strain. This allows the computation and direct comparison of differences in geophysical observables, such as heat flow, uplift, subsidence, and crustal thickness produced by these two modes of extension.
In order to judge the model results, we compare them to topographic and heat flow data for the Red Sea area. The asymmetric uplift and volcanism bordering the Red Sea is well known and has been cited as evidence for a throughgoing lithospheric detachment [Wernicke, 1985]. This region has recently been the locus of extensive geophysical fieldwork [Cochran et al., 1986; Cochran and Martinez, 1988; Gaulier et al., 1988] which has provided excellent heat flow coverage of this area [Hobart et al., 1985; F. Martinez and J. R. Cochran, work in preparation, 1988]. The kinematic history of opening of the northern Red Sea is relatively well constrained by geological and geophysical data. Although rifting in the Red Sea began around the end of the Oligocene - Early Miocene [Cochran, 1983a], evidence from the Gulf of Suez and Gulf of Aqaba [Steckler et al., 1988] suggests that in the northern Red Sea most of the extension has occurred within the last 19 m.y. and that it continues to the present. The young age of this rift is particularly important for discriminating between models of its formation because many of the effects are transient and will not be observable tens of millions of years after rifting. The northern Red Sea is therefore the logical choice for a location to test quantitative numerical models of pure and simple shear extension.
PREVIOUS QUANTITATIVE MODELS
Models of extension of the crust and lithosphere were motivated by observations in the sedimentary record of passive margins. The sedimentary record showed that the subsidence of margins followed the exponential behavior characteristic of thermal cooling, such as is observed for the cooling of a mid-ocean ridge. Sleep [1971] was the first to point this out using data from the Atlantic margin of the United States. This required some mechanism to heat the lithosphere to allow it later to cool and subside. Active mantle heating causes initial uplift which then can thermally subside. Unless there is substantial erosion of the uplifted crust, the lithosphere can only isostatically subside to its original level. In many areas, evidence for an initial phase of uplift and erosion is lacking.
Several authors [Artemjev and Artyushkov, 1971; Salveson, 1978; McKenzie, 1978] suggested that thinning of
Buck et al.: Lithospheric Extension: Pure and Simple 215
the crust and mantle lithosphere by pure shear extension created the increased thermal input needed to explain the later thermal subsidence. Because there is no active asthenospheric heating of the lithosphere in these models, they are termed "passive." The crustal thinning allows subsidence below sea level, or the original level of the continent, and sediment accumulation. Mckenzie [1978] quantified the thermal effects of uniform pure shear extension of the entire lithosphere. In his one-dimensional model a unit vertical thickness of
lithosphere is uniformly stretched by a factor II and correspondingly thinned so that its final thickness is ll' 1. His analytic model neglects lateral heat flow and heat loss during the finite time duration of extension but matches the main
characteristics of the subsidence histories of many margins. The effects of two-dimensional heat conduction were added to
the instantaneous extension model by Steckler and Watts [1980, 1982] and Jarvis [1983], who found that this could produce faster subsidence in the parts of a basin close to its edge and lead to several hundred meters of uplift flanking the basin.
The instantaneous uniform pure shear extension model was further generalized by Jarvis and McKenzie [ 1980] to include the effects of vertical heat loss during a finite duration extension event. They were able to model the heat flow and subsidence through a finite period of lithospheric stretching and thinning and the subsequent evolution after the end of the extension event. They found that the heat flow and subsidence history differed little from the instantaneous extension model, provided the time during which extension occurs is not too long. For a lithosphere thinned to half of its original thickness, for example, they found good agreement with the instantaneous case provided the duration of extension is less than 15 Ma.
The model formulated by Jarvis and McKenzie [1980], however, neglects the effects of horizontal heat flow resulting from a finite width rift and/or from variations in the extension factor II within the rift. Cochran [1983b] and Alvarez et al. [1984] combined the effects of lateral heat conduction and finite duration of extension. Cochran found that there may be significant departures from the conclusions of Jarvis and McKenzie [ 1980] depending upon the width of the rift and the duration of the extension. In general, the synrift subsidence is augmented owing to the additional lateral heat loss, and the postrift subsidence is diminished compared to the one-dimensional model.
Many rifts appear to require more heating than can be achieved if the observed amount of crustal stretching is the same as the lithospheric stretching. This led to the proposal of a two-layer stretching model [Royden and Keen, 1980] in which the subcrustal lithosphere is decoupled from the crust and can be extended by a greater amount than the crust. Although this model provides a method for controlling the amount of lithospheric heating independently of the amount of crustal extension, it lacks a physical mechanism for this process and creates geometric incompatibilities between the crustal and subcrustal layer.
Several workers have shown that asthenospheric convection induced by the horizontal temperature gradients beneath a rift can be a source of additional heating and can have an important effect on the subsidence and uplift history of a rift [Keen, 1985; Buck, 1984, 1986]. Convective effects may be crucial to
explaining the magnitudes of uplift flanking some rifts [Buck, 1984, 1986; Steckler, 1985)] The magnitude of uplift produced by convection is related to the size of the lateral temperature gradients at the base of the lithosphere. Convection mainly tends to alter the magnitude of isostatic uplift and subsidence and does not cause a different topographic pattern from that of a conductive model with the same geometry. Thus we will discuss the ability of our models of passive rifting to produce large horizontal gradients in temperature in qualitative terms only.
In contrast to the substantial quantitative assessment of the consequences of pure shear extension afforded by the analytical and numerical models discussed, the consequences of simple shear extension have for the most part only been qualitatively inferred [Wernicke, 1981; Lister et al., 1986] or approximated using one-dimensional techniques [Furlong and Londe, 1986; England and Jackson, 1987] despite the inherent two- dimensional nature of the simple shear model. We have therefore developed a two-dimensional numerical technique in order to more adequately assess the consequences of simple shear.
FORMULATION OF CALCULATIONS
Our main goal is to model the principal consequences of simple shear, however, for comparison purposes we also calculate the thermal evolution for pure shear models. The models are idealizations which test a set of parameters which can be compared to geophysical data. The models follow through time the kinematic and thermal development of the lithosphere, surface heat flow, and the thermal uplift and subsidence. We also assess whether the lithospheric thermal structure generated by a model will lead to melting of mantle material and, if so, where the melting will occur. Mechanical and structural considerations are not taken into account. Thus
rheology, flexural rigidity, convection, etc. are not explicitly incorporated into the model, although their expected influence is discussed.
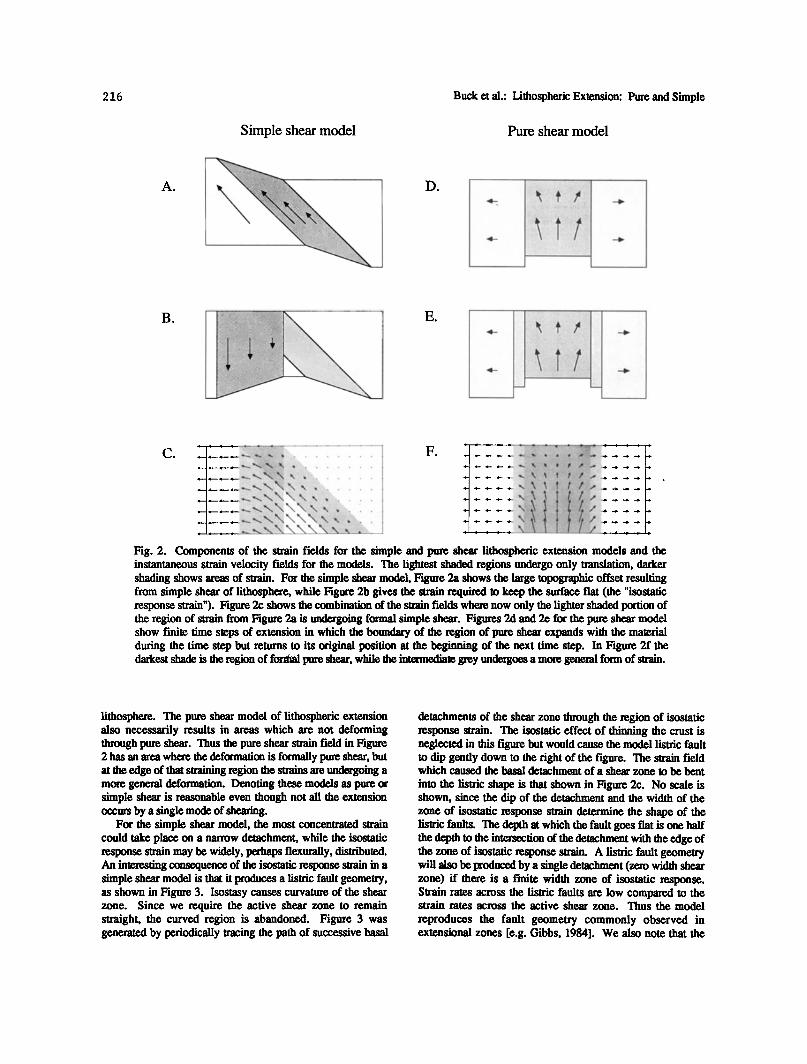
The idealized cases of strain distribution in an extending lithosphere are illustrated in Figure 2. Figure 2 shows that any pure or simple shear model of lithospheric extension must include regions of strain which cannot be categorized as just pure or just simple. Simple shear of the lithosphere produces large topographic offsets (i.e., tens of kilometers, for very large horizontal offsets), and therefore there must be some additional distributed strain. We call this response which keeps the topography from being unreasonably large the "isostatic response strain," and it may be controlled by the flexural strength of the lithosphere. Here, we take it to be controlled by local isostatic compensation for simplicity. In our model the isostatic response strain acts to produce a downward displacement in the vertical region beneath the shear zone-surface intersection which equals the upward component of displacement at each point on the top surface of the shear zone. The effect of this strain is to maintain the top surface of the model lithosphere horizontal, which is a first order approximation of true isostatic or flexural compensation at a lithospheric scale. The strain field indicated in Figure lb [from Wernicke, 1985] must also have a zone of distributed strain. In the model strain field shown for simple shear in Figure 2 there is formal simple shear in only part of the deforming
216 Buck et al.: Lithospheric Extension: Pure and Simple
mo
Simple shear model
De
Pure shear model
go Eo
Fig. 2. Components of the strain fields for the simple and pure shear lithospheric extension models and the instantaneous strain velocity fields for the models. The lightest shaded regions undergo only translation, darker shading shows areas of strain. For the simple shear model, Figure 2a shows the large topographic offset resulting from simple shear of lithosphere, while Figure 2b gives the strain required to keep the surface flat (the "isostatic response strain"). Figure 2c shows the combination of the strain fields where now only the lighter shaded portion of the region of strain from Figure 2a is undergoing formal simple shear. Figures 2d and 2e for the pure shear model show finite time steps of extension in which the boundary of the region of pure shear expands with the material during the time step but returns to its original position at the beginning of the next time step. In Figure 2f the darkest shade is the region of formal pure shear, while the intermediate grey undergoes a more general form of strain.
lithosphere. The pure shear model of lithospheric extension also necessarily results in areas which are not deforming through pure shear. Thus the pure shear strain field in Figure 2 has an area where the deformation is formally pure shear, but at the edge of that straining region the strains are undergoing a more general deformation. Denoting these models as pure or simple shear is reasonable even though not all the extension occurs by a single mode of shearing.
For the simple shear model, the most concentrated strain could take place on a narrow detachment, while the isostatic response strain may be widely, perhaps flexurally, distributed. An interesting consequence of the isostatic response swain in a simple shear model is that it produces a listtic fault geometry, as shown in Figure 3. Isostasy causes curvature of the shear zone. Since we require the active shear zone to remain straight, the curved region is abandoned. Figure 3 was generated by periodically tracing the path of successive basal
detachments of the shear zone through the region of isostatic response strain. The isostatic effect of thinning the crust is neglected in this figure but would cause the model listric fault to dip gently down to the right of the figure. The strain field which mused the basal detachment of a shear zone to be bent
into the listtic shape is that shown in Figure 2c. No scale is shown, since the dip of the detachment and the width of the zone of isostatic response strain determine the shape of the listric faults. The depth at which the fault goes flat is one half the depth to the intersection of the detachment with the edge of the zone of isostatic response strain. A listtic fault geometry will also be produced by a single detachment (zero width shear zone) if there is a finite width zone of isostatic response. Strain rates across the listric faults are low compared to the strain rates across the active shear zone. Thus the model
reproduces the fault geometry commonly observed in extensional zones [e.g. Gibbs, 1984]. We also note that the

Buck et al.: Lithospheric Extension: Pure and Simple 217
Fig. 3. Listric geometry generated for formerly active basal detachments of the shear zone produced by the strain field shown in Figure 2c for simple shear. WSS is the surface width of the shear zone and also corresponds to the region of isostatic response strain.
inferred strain in the Northern Snake Range Decollement [Lee et al., 1987] is what is predicted by our model.
Figure 4 shows the parameters which define our model strain fields for both simple and pure shear models along with
the approximate positions of the base of the crust and the material advected from the asthenosphere through time. Both models are defined by two parameters. For the simple shear model, they are the width of the shear zone, WSS, and the dip
Time = 0
Simple shear model w
Pure shear model
Time
Time
Fig. 4. Schematic diagrams of lithospheric sections showing the defining parameters of the models discussed and the shape of the crust (top layer) and the lithosphere-asthenosphere boundary (asthenosphere shown hatched). Parameters are dertreed in the text.

218 Buck et al.: Lithospheric Extension: Pure and Simple
TABLE 1. Model Physical Constants
Constant Value
Crustal thickness
Crustal density @ 0øC Lithospheric thickness Lithospheric density @ 0øC Thermal expansion coefficient Thermal conductivity Thermal diffusivity Surface temperature Bottom boundary temperature
32 km
2.8 gm cm-3 125 km
3.33 gm cm-3 3.4 x 10⁻⁵ øC-1 3.2 W m-1 øC-1 10-6 m-2 s-1 0øC
1300 øC
of the shear zone or detachment, O. The initial region of crustal subsidence has a width, W O, determined by the initial crustal thickness, D 0, and the detachment dip, O:
W 0 = D O / tan 0 + WSS (1).
For the simple shear model, the strain field does not change with time, although material moves through the strain field. The pure shear model is defined by the initial width of the vertical region of crustal and lithospheric thinning (W0) and the velocity at which the boundary of that region widens or narrows, %. Of course, both models are affected by the rate of seperation of one side of the rift from the other, Ur. Thus for both models the width of the zone of crustal thinning, Wr(0, at time, t, after the start of rifting is given by
Wr(0 = W 0 + urt (2).
For the pure shear model the horizontal gradient of horizontal velocity (i)u/i)x) is constant across the width of the extending region and, by the continuity condition, it is equal to the vertical gradient of vertical velocity (i)w/•z). For the general model of pure shear extension, the thickness of the crust within the extending region at time t, D(t), is given by
D(t) = D O exp[-(u r/U b) In (U b t/W 0 + 1)] (3)
where D O is the initial thickness of the crust. For certain end-member cases of pure shear extension, (3) simplifies. For fixed boundaries of the zone of extension (% = 0) the crustal thickness within the deforming pure shear region vary as exp(-u r t/W0). For a narrow separation this case is very similar to the strain field often envisioned for a mid-ocean
ridge [e.g., Jarvis, 1983]. Another extreme pure shear model has vertical boundaries of strain which move apart at the constant velocity of separation of the two sides of the rift (u b = ur). In this case a rectangular region of lithosphere which initially strains remains rectangular, but the ratio of the width to length of the rectangle changes with time. The thickness of the crust within the sheafing region varies as (Ubt/W 0 + 1)-1. This is the same case as was treated with a different numerical method by Cochran [1983b].
Once the velocity fields are prescribed, the two dimensional equation of advective and diffusive heat transport:
i•T/i•t + u i•T/i•x + w i•T/i•z = •c 02T/i•x 2 + i•2T/i•z 2) (4)
is solved. Here T is the temperature in øC, t is time in seconds, •c is diffusivity, x and z are the horizontal and vertical directions, and u and w are the horizontal and vertical velocities. The model parameters used in the calculations are given in Table 1. For simplicity, the conductivity of the crust and mantle are taken to be the same, except in one case discussed below. Since rifts are generally long, reasonably linear features, the two dimensional treatment 'is adequate. The boundary conditions for the temperatures are that T = 0øC on the top boundary (z = 0 kin) and T = 1300øC on the bottom boundary (z = 125 km). At the sides material is allowed to pass through if the velocity there is nonzero. At the side boundaries, dT2/dx 2 = 0. The temperature equation (4) is solved using a fmite difference method. A fixed (Eulerian) grid is superimposed on the area representing the lithosphere. The method is an explicit formulation which is conservative and • formally second order accurate in the approximation to the diffusion terms of the differential equation. The main concern is with artificial diffusion introduced by the advective terms of (4) [Roache, 1978]. Here the method is first order accurate in the limit that the grid spacing is small enough that the time for diffusion between points is much less than the time for advection between points.
The accuracy of the method was evaluated empirically by repeating calculations at three grid spacings and examining the rate of convergence. At the smallest grid spacing used in the calculations (1.7 km) the output results, such as vertically integrated temperature or surface heat flux, differed from the extrapolated value at zero grid size by less than 5%. In all calculations, except for the simple shear models with finite width shear zones, the distribution of crustal thickness in the models is calculated analytically as a function of position and time. For the cases with wide simple shear zones the position of the model Moho is numerically advected in the same way the temperature field is advected. The inaccuracy due to artificial diffusion causes the footwall uplift to be low by approximately 50 m for the wide shear zone cases.
The model results which we compare to geological observations depend only on the temperature structure of the model lithosphere and the distribution of crustal thickness. The surface heat flow is the product of the vertical derivative of temperature and the conductivity (from Table 1). Subsidence or uplift of the surface is calculated under the assumption of local isostatic compensation. This is the same assumption made by McKenzie [1978], Royden and Keen [1980], Jarvis and McKenzie [1980)], etc. It is certainly an oversimplifica- tion, since the flexural rigidity of the lithosphere will lead to some regional compensation of loads on the lithosphere. This assumption is made for several reasons. First, the values of flexural rigidity within a rifting area are poorly known and controversial, but in the parts of rifts which are hot and highly faulted the flexural rigidity should be low. Second, the major conclusions of this paper should not be altered by the inclusion of moderate flexural rigidity across the rift, although we will discuss the importance of flexural rigidity in explaining the broad topographic variation across the Red Sea. Flexural calculations can be superimposed on the results of the present calculations to get a model topography. Models and the
Buck et al.: Lithospheric Extension: Pure and Simple 219
strain fields are not affected by changing topography or stress through the calculations. If these were mechanical models of rifting, we could not ignore the strength of the lithosphere.
The elevation of a point depends on the average density of a column of material beneath that point. The density of the column depends on the thickness of low density crust and the average temperature of the column. The crustal density, mantle density, initial crustal thickness, initial lithospheric thickness, and the thermal expansion coefficient all affect the calculated topography. Table 1 gives the values assumed here. Moderate variation in these assumed parameters has little effect on the conclusions of this work, especially where we are comparing results from models with the same physical parameters.
Finally, we determine whether the thermal structure produced by a model calculation is likely to result in partial melting of the asthenosphere. We compare the temperature and depth of each point within the modeled rift to a melt relation and determine whether that point is above the solidus. We assume a linear solidus having a gradient of 4øC/km such that asthenosphere at 1300øC begins melting at 60 km depth. This depth for the first occurrence of partial melt is similar to that calculated by Foucher et al. [1982] for this temperature asthenosphere.
RESULTS
The different modes of extension modeled result in very different patterns of surface heat flow, topography, crustal thinning, and lithospheric heating. We will describe the evolution of these quantifies through time as functions of the variable parameters described in the preceding section. The calculations treat very simple strain patterns but allow us to make generalizations about how more complicated strain fields would affect the observable quantities.
Simple Shear Model
Simple shear extension creates asymmetries in the patterns of crustal thinning, heat flow, uplift, and subsidence and offsets between those patterns. Figures 5a and 5b illustrate the temporal development of two cases of the simple shear model. The figure shows the development through time of the crustal and lithospheric thinning, heat flow, thermal uplift, crustal subsidence, and topography at 4 m.y. intervals between 2 and 22 m.y. after the start of rifting. For both cases the dip of the shear zone, 0, is 15 ø, the upper plate is fixed, and the lower plate is moving to the left at a rate of 1 cm/yr. For the case shown in Figure 5a the shear zone has zero width and so is referred to as the detachment case. The other case (see Figure 5b) has a shear zone width at the surface, WSS, of 50 km.
The results show that for simple shear extension the maximum heat flow and thermal uplift are centered over the intersection of the shear zone with the surface, which is fixed with respect to the upper plate. The thermal uplift is broader than the region of high heat flow, since the uplift is a function of the vertically integrated temperature changes within the entire lithosphere, whereas the heat flow is only sensitive to the thermal gradient at the surface. On the hanging wall side, advected hot material replaces initially colder lithosphere below
the detachment, while the lithosphere above the shear zone remains cool until it is warmed by conduction. The widening of the rift occurs only in the direction of motion of the lower plate, resulting in the migration of the region of crustal subsidence relative to the heat flow and thermal uplift patterns. The peak heat flow values occur initially closer to the lower plate rift shoulder. With time, the heat flow increases, and the lower plate moves further away, bringing the peak values closer to the center of the physiographic rift. After a long enough period of extension the lower plate rift shoulders become located further from the peak heat flow values than the upper plate rift shoulders. The superposition of the thermal uplift pattern on the crustal subsidence pattern results initially in a broad, nearly level region of subsidence. With time, the subsiding region deepens and widens, while the area of nearly uniform depth of subsidence narrows. If the width of the rift becomes greater than 2W 0, then the region of roughly uniform maximum subsidence broadens with slightly deeper values on the lower plate side.
The rift shoulder uplifts develop a fundamental asymmetry from the beginning of rifting. The upper plate rift shoulder is supported by the heating from the advection of hotter lower plate lithosphere and asthenospheric material (which passively fills in the space created by the movement of the lower plate) and by diffusion of heat into the upper plate from the hotter material brought up along the detachment. The lower plate rift shoulder is supported only by the heat transported laterally by thermal diffusion from material that was originally beneath the detachment. The difference in components of heating and in the distribution of heat sources about the vertical columns
beneath the rift shoulders results in negligible uplift (=100 m at 14 m.y.) for the lower plate rift shoulder and significant uplift (>700 m at 14 m.y.) for the upper plate rift shoulder in the 15 ø dip detachment model. The lateral extent of the uplift in the two rift shoulders is also markedly different. On the lower plate side the uplifted area extends for only a few kilometers, limited by the extent of significant thermal diffusion driven by relatively low horizontal temperature gradients. On the upper plate side, uplift is coextensive with the subcrustal downdip horizontal dimension of the detachment which delimits the region of vertical advection. Figure 6a shows the isostatic hanging wall and footwall uplift as a function of time for detachment dips of 15 ø, 30 ø, and 45 ø at a total plate separation rate of 1 cm/yr. Footwall uplifts are much smaller than hanging wall uplifts. Another difference is that the footwall side thermally subsides back to its original elevation, since it is carried away from the site of heating by vertical advection, while the hanging wall uplift approaches a steady state value because it remains over the detachment region of active advective heating. Figure 6b shows similar results for a detachment dip of 15 ø and plate separation rates of 1, 5, and 10 cm/yr.
Peak heat flow variations as a function of time for
detachment dips of 15 ø, 30 ø, and 45 ø are shown in Figure 6c for the simple shear detachment model at a plate separation rate of 1 cm/yr. The dip angle controls the rate of increase and the asymptotic value reached by the heat flow high by determining the rate of vertical advection of material. For high dip angles the rate of vertical advection can be higher than the rate at which the advected material can significantly cool. This leads

2 2 0 Buck et al.: Lithospheric Extension: Pure and Simple
.
-6.
Topography
E
.
-6.
Crustal Subsidence
E
.
.
200.
O.
Thermal Uplift
Heat Flow
E
.
125. 0. Km 1000.
Fig. 5a. Model results at 2, 6, 10, 14, 18, e..nd 22 m.y. after the beginning of simple shear rifting with a detachment dip of 15 ø and an infinitesimally thin shear zone. Total plate separation rate is 1 cm/yr. Top panel depicts the Airy compensated topography. Crustal subsidence and thermal uplift components caused by the thinning of the crust and heating of the lithosphere are shown in the second and third panels, respectively. Surface heat flow and the geometry of the crust (in grey) and advected asthenosphere are shown in the lower two panels.
to a rapid, nearly linear increase in the heat flow as deeper lithospheric material is brought to the surface and an abrupt transition to more slowly increasing heat flow as steady-state is approached, with a balance between vertical advection of hot asthenosphere and diffusive cooling. For cases with more shallowly dipping detachments the rate of vertical advection is lower, allowing a longer time for cooling, producing lower heat flow and a slower transition to steady-state. Figure 6d shows similar results for a detachment dip of 15 ø and plate separation rates of 1, 5, and 10 cm/yr. Again the rate of vertical advection controls the form of the increase and the
steady state value approached. The rate of near surface vertical advection also controls the heat flo•v for the wide shear zone calculations. For the same plate separation rate and dip angle as for the detachment model the wide shear zone model has a
lower peak heat flow, as is shown in Figures 5a and 5b. Another set of calculations were run to investigate the
effects of varying the dip of the shear zone and its width. These cases had the same rifting velocity (1 cm/yr) and the same value of the initial rift width, W 0. The dip angle, 0, was varied between 15 ø and 45 ø , and the width of the shear zone, WSS, was varied between 0 and 78 km, keeping W 0 constant.

Buck et al.: Lithospheric Extension: Pure and Simple 221
. Topography
E ",' 0.
-6.
E
o
-6.
Crustal Subsidence
E
.
,
200.
,
Thermal Uplift
Heat Flow
E
.
125. 0. Km 1000.
Fig. 5b. Simple shear case with a 15 ø dip and a 50 km wide shear zone OVss ). Other parameters as in 5a.
It was found that the peak heat flow was nearly constant for all the cases, while the width of the zone of high heat flow increased with the width of the shear zone. Naturally, the distribution of uplift was very different for the different dip angles.
The simple shear models do not produce partial melting unless the plate separation rates are high or the shear zone has a steep dip. For plate separation rates of 1 cm/yr and dip angles less than 30 ø the simple shear models never produce partial melting.
Pure Shear Model
In contrast to the asymmetric patterns developed in simple shear extension the pure shear models investigated here produce
inherently symmetric patterns as a consequence of the symmetric strain conditions imposed. Three types of pure shear calculations are discussed. They depend on how the boundary of the region of pure shear moves.
In the first model the width of the region of pure shear extension remains fixed (% = 0) as the material on either side is pulled away at a fixed rate. Figure 5c shows the develop- ment through time of the crust and advected asthenosphere, heat flow, thermal uplift, crustal subsidence and topography for a total extension rate of 1 cm/yr and a width of the extending zone of 100 kin, although the general characteristics are true for other rates and widths. A heat flow high centered over the region of vertical advection develops quickly at first and then asymptotically approaches an equilibrium between the heat input through vertical advection and conductive cooling.
2 22 Buck et al.: Lithospheric Extension: Pure and Simple
.
E "," O.
-6.
Oo
-6.
.
Oo
200.
O.
O.
125.
Topography
Crustal Subsidence
Thermal Uplift
Heat Flow
O. 1000. Km
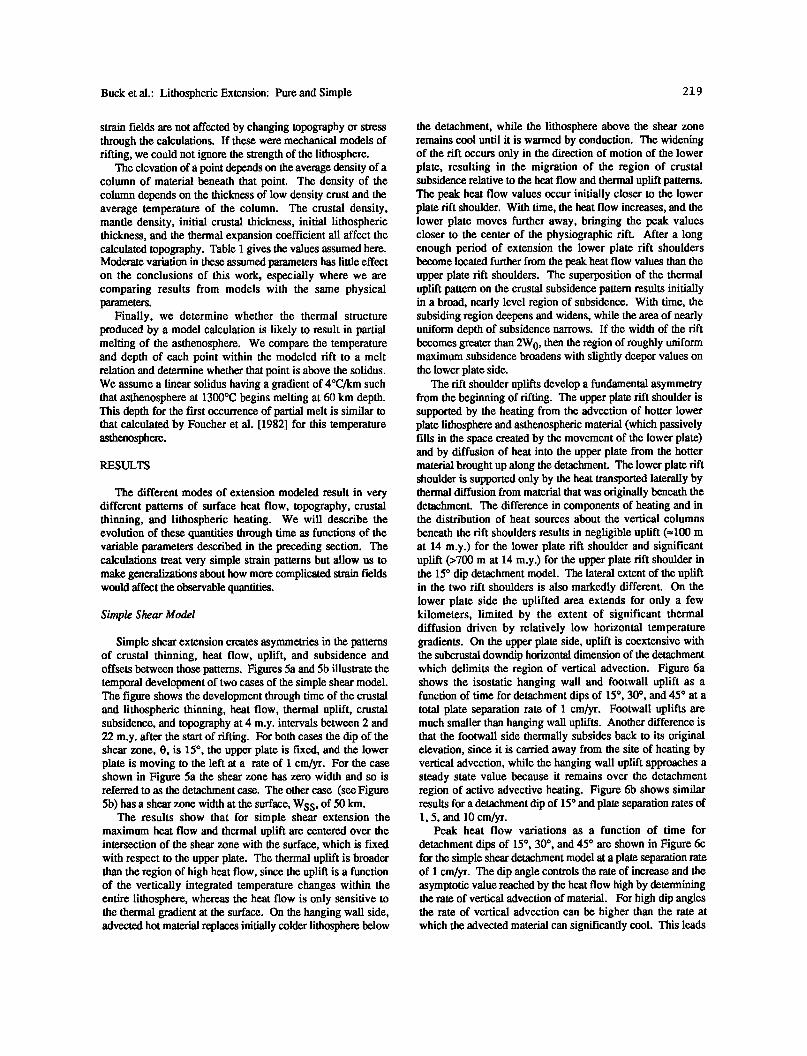
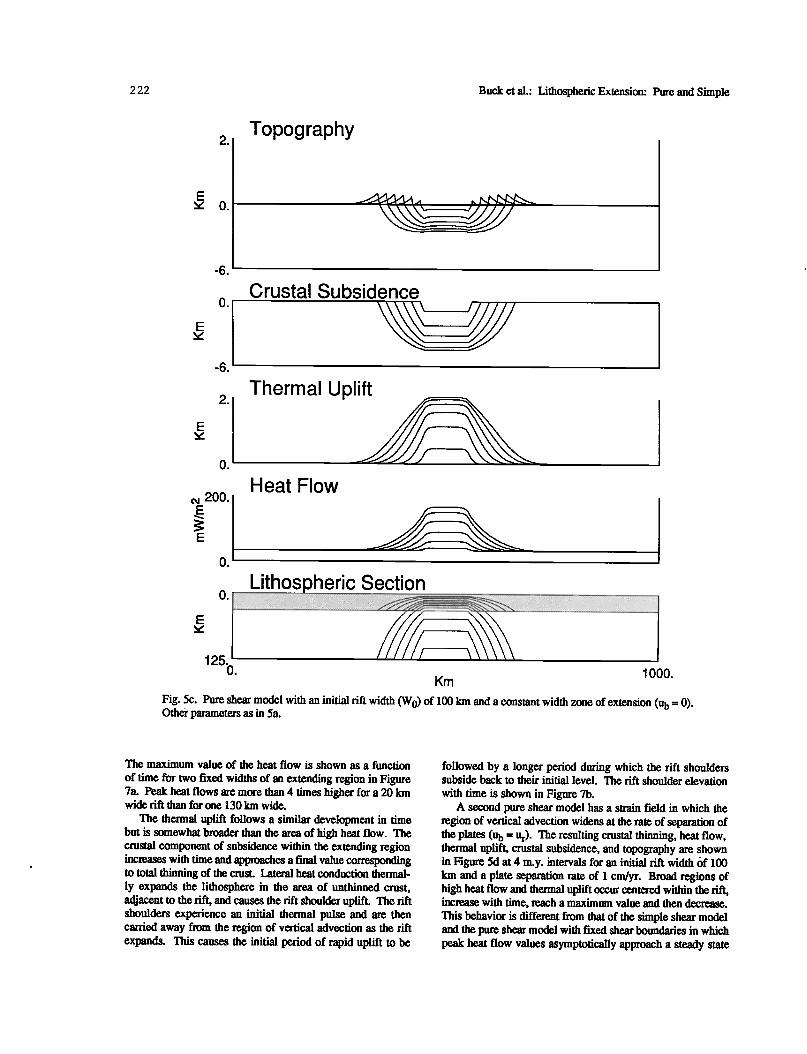
Fig. 5c. Pure shear model with an initial rift width (W0) of 100 km and a conslant width zone of extension (u b = 0). Other parameters as in 5a.
The maximum value of the heat flow is shown as a function
of time for two fixed widths of an extending region in Figure 7a. Peak heat flows are more than 4 times higher for a 20 km wide rift than for one 130 km wide.
The thermal uplift follows a similar development in time but is somewhat broader than the area of high heat flow. The crustal component of subsidence within the extending region increases with time and approaches a final value corresponding to total thinning of the crust. Lateral heat conduction thermal- ly expands the lithosphere in the area of unthinned crust, adjacent to the rift, and causes the rift shoulder uplift. The rift shoulders experience an initial thermal pulse and are then carded away from the region of vertical advection as the rift expands. This causes the initial period of rapid uplift to be
followed by a longer period during which the rift shoulders subside back to their initial level. The rift shoulder elevation with time is shown in Figure 7b.
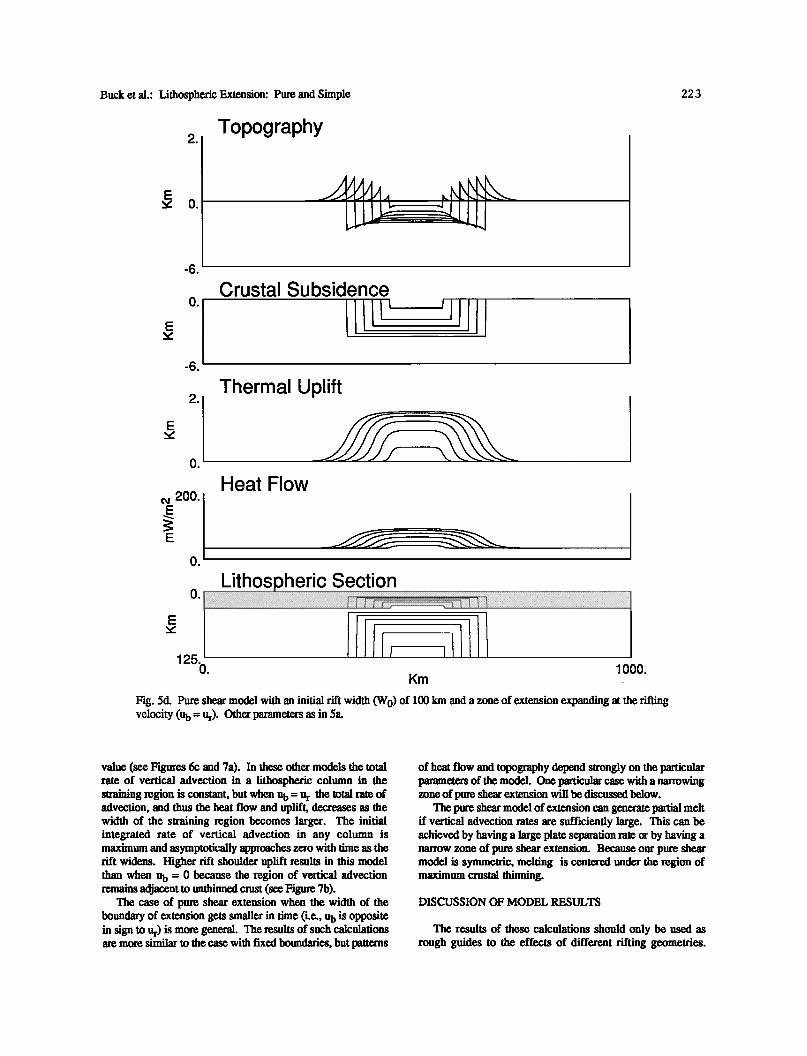
A second pure shear model has a strain field in which the region of vertical advection widens at the rate of separation of the plates (u b = ur). The resulting crustal thinning, heat flow, thermal uplift, crustal subsidence, and topography are shown in Figure 5d at 4 m.y. intervals for an initial rift width Of 100 km and a plate separation rate of 1 cm/yr. Broad regions of high heat flow and thermal uplift occur centered within the rift, increase with time, reach a maximum value and then decrease. This behavior is different from that of the simple shear model and the pure shear model with fixed shear boundaries in which peak heat flow values asymptotically approach a steady slate
Buck et al.: Lithospheric Extension: Pure and Simple 22 3
. Topography
-6.
E
.
-6.
Crustal Subsidence
.
E
.
200.
O.
Thermal Uplift
Heat Flow
E
125. 0. 1000.
Km
Fig. 5d. Pure shear model with an initial riff width (W0) of 100 km and a zone of extension expanding at the rifting velocity (u b = Ur). Other parameters as in 5a.
value (see Figures 6c and 7a). In these other models the total rate of vertical advection in a lithospheric column in the straining region is constant, but when u b = u r the total rate of advection, and thus the heat flow and uplift, decreases as the width of the straining region becomes larger. The initial integrated rate of vertical advection in any column is maximum and asymptotically approaches zero with time as the rift widens. Higher rift shoulder uplift results in this model than when u b = 0 because the region of vertical advection remains adjacent to unthinned crust (see Figure 7b).
The case of pure shear extension when the width of the boundary of extension gets smaller in time (i.e., u b is opposite in sign to u r) is more general. The results of such calculations are more similar to the case with fixed boundaries, but patterns
of heat flow and topography depend strongly on the particular parameters of the model. One particular case with a narrowing zone of pure shear extension will be discussed below.
The pure shear model of extension can generate partial melt if vertical advection rates are sufficiently large. This can be achieved by having a large plate separation rate or by having a narrow zone of pure shear extension. Because our pure shear model is symmetric, melting is centered under the region of maximum crustal thinning.
DISCUSSION OF MODEL RESULTS
The results of these calculations should only be used as rough guides to the effects of different rifting geometries.
2 2 4 Buck et al.: Lithospheric Extension: Pure and Simple
Hanging Wall and Footwall Uplift vs. Time 6OO
45 ø
2OO 30 ø
15 ø
.• 800 Ur• 400 __ 45 ø
................................ ./::::::_-i ................
0 /::::::::::- ..................................................... 15ø I
0 5 10 15 2o 25
Time (MY)
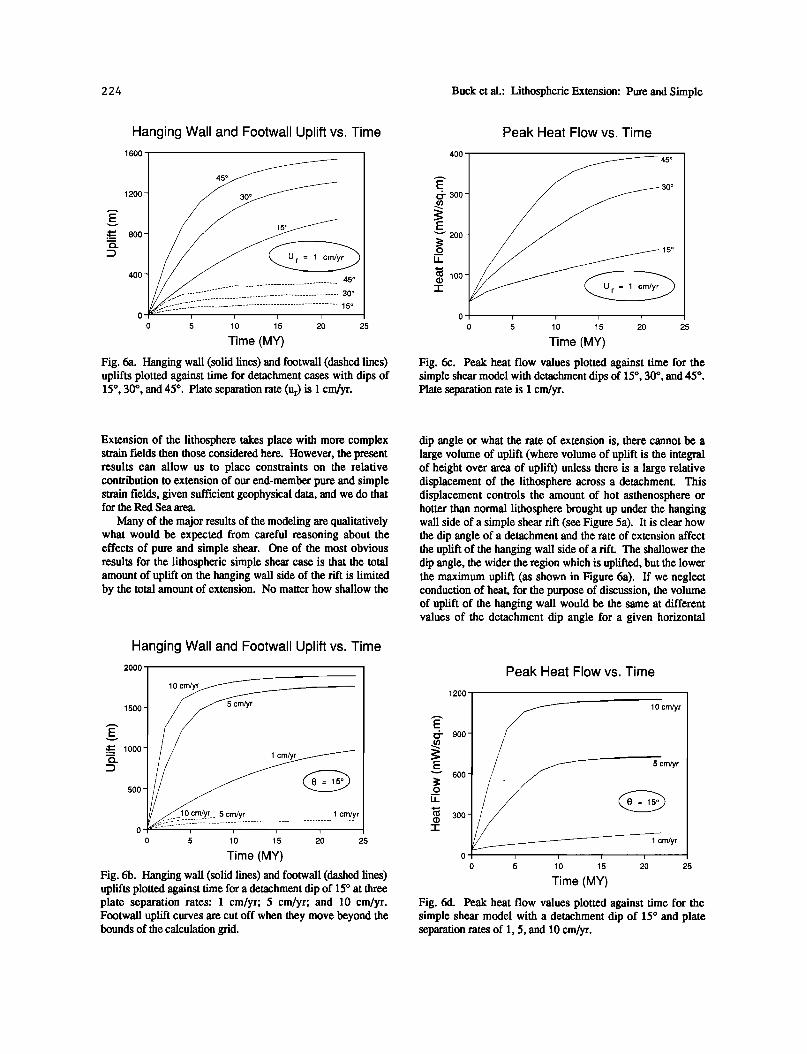
Fig. 6a. Hanging wall (solid fines) and footwall (dashed lines) uplifts plotted against time for detachment cases with dips of 15 ø, 30 ø, and 45 ø. Plate separation rate (Ur) is 1 cm/yr.
Peak Heat Flow vs. Time
400
• 300-
•" 200-
O
03 100-
45 ø
30 ø
i I i i
0 5 10 15 2o 25
Time (MY)
Fig. 6c. Peak heat flow values plotted against time for the simple shear model with detachment dips of 15 ø , 30 ø , and 45 ø . Plate separation rate is 1 cm/yr.
Extension of the lithosphere lakes place with more complex strain fields then those considered here. However, the present results can allow us to place constraints on the relative contribution to extension of our end-member pure and simple strain fields, given sufficient geophysical data, and we do that for the Red Sea area.
Many of the major results of the modeling are qualitatively what would be expected from careful reasoning about the effects of pure and simple shear. One of the most obvious results for the lithospheric simple shear case is that the total amount of uplift on the hanging wall side of the rift is limited by the total amount of extension. No matter how shallow the
Hanging Wall and Footwall Uplift vs. Time 2OOO
10 cm/y• _._------ 1500 -
• 1000-
•,. 1 cm/yr• 500 -
.............. _l__c__m__/_y r 0 i i i i
0 5 10 15 2o 25
Time (MY)
Fig. 6b. Hanging wall (solid lines) and footwall (dashed fines) uplifts plotted against time for a detachment dip of 15 ø at three plate separation rates: 1 cm/yr; 5 cm/yr; and 10 cm/yr. Footwall uplift curves are cut off when they move beyond the bounds of the calculation grid.
dip angle or what the rate of extension is, there cannot be a large volume of uplift (where volume of uplift is the integral of height over area of uplift) unless there is a large relative displacement of the lithosphere across a detachment. This displacement controls the amount of hot asthenosphere or hotter than normal lithosphere brought up under the hanging wall side of a simple shear rift (see Figure 5a). It is clear how the dip angle of a detachment and the rate of extension affect the uplift of the hanging wall side of a rift. The shallower the dip angle, the wider the region which is uplifted, but the lower the maximum uplift (as shown in Figure 6a). If we neglect conduction of heat, for the purpose of discussion, the volume of uplift of the hanging wall would be the same at different values of the detachment dip angle for a given horizontal
Peak Heat Flow vs. Time
1200
900 -
600 -
300
• 10 cm/yr
5 cm/yr
1 cm/yr
I I I I
0 5 10 15 20 25
Time (MY)
Fig. 6d. Peak heat flow values plotted against time for the simple shear model with a detachment dip of 15 ø and plate separation rates of 1, 5, and 10 cm/yr.

Buck et al.' Lithospheric Extension: Pure and Simple 22 5
displacement. The uplift is just distributed differently for different dips of the detachment.
Of course, conduction cannot be negl•ted for this problem and it controls the steady state value of hanging wall uplift for the simple shear model. To achieve steady state in uplift or heat flow there must be a balance between the cooling of the hanging wall side of the lithosphere and the vertical adv•tion of heat into that side. The vertical advection of heat depends on the vertical velocity of material in the model, which is a function of the dip angle and rate of extension. Figures 6a and 6b show that either a higher dip angle or a larger rate of horizontal extension leads to higher steady state (asymptotic) maximum uplift of the hanging wall side of the rift.
Neglecting the effects of horizontal heat conduction and adv•tion leads to predictions which are grossly different fom those of the two dimensional treatment done here. For
example, we can derive an analytic expression for one dimensional steady-state heat flow, assuming the vertical velocity and boundary conditions for the lithospheric column under the detachment-surface inters•tion. There the vertical
velocity, w, is constant at all depths, the temperature at the top surface is 0øC, and the temperature at infinite depth is T m. The steady-state heat flow, Qs, is then:
Q s = K T m w/•: (5)
where K is conductivity. Using the same values for the parameters in (5) as for the numerical models gives up to 3 times the heat flow predicted by the two dimensional calculations.
One of the results of the calculations of the eff•ts of
simple shear which contradicts previous authors is the location of the maximum thermal uplift and subsequent postrift thermal subsidence. For all dip angles and extension rates, the maximum thermal uplift is centered on the inters•tion of the shear zone with the surface, not well under the hanging wall side of the lithosphere as proposed by Wernicke [1985]. This
Peak Heat Flow vs. Time
400
•-- 300-
E v 200-
0
03 100-
W o = 20 km, U b = O.
/
.........• ...... -•0:130km' U b:u r 0
0 5 10 15 2O 25
Time (MY)
Fig. 7a. Peak heat flow values plotted against time for pure shear models with u b = 0 (solid line) and u b = u r (dashed line) with initial rift widths of 20 and 130 km.
1 ooo
Rift Shoulder Uplift vs. Time
750 ,,' ,,,' W o=20km, U b=O.
•)c'• 500 .....-"' W o = 130 km, U b = U r .
250 -
0 "'":'"""'•• W o = 130 km, U b = O. i i i
0 5 10 15 20 25
Time (MY)
Fig. 7b. Rift shoulder uplift values plotted against time for pure shear models with u b = 0 (solid line) and u b = u r (dashed line) with initial rift widths of 20 and 130 km.
is because it is under the intersection of the detachment with
the surface that the maximum amount of material is being vertically adv•ted, while further over on the hanging wall side there is less hot material moving with a vertical component of velocity. It is not the position of an ill-defined lithosphere asthenosphere boundary which controls uplift but the integral of vertical advection through the lithosphere and asthenosphere. The fact that material is advected close to the surface causes the maximum in heat flow to be centered on the
intersection of the shear zone with the surface. The effect of
crustal thinning outweighs that of thermal uplift, resulting in a net subsidence where the crust is thinned so that the
maximum total uplift is at the first point on the hanging wall side where the crust is not thinned by the extension.
The uplift of the footwall side in the simple shear model depends mainly on the dip angle of the detachment, or shear zone, although the rate of extension also enters into the problem (see Figures 6a and 6b). All of the uplift there depends on the conduction of heat laterally from the hot center of the rift to the region where the lithosphere and crust have not been thinned dir•tly by the mechanical extension. The dip angle and velocity of extension determine the horizontal temperature gradients which drive the conduction of heat to that area. Since the horizontal gradients produced by all except the most extremely large dip angles are relatively small, there is relatively little uplift on the footwall side of the simple shear rift.
For the pure shear models, the symmetric uplift of the sides of the rift is also produced by horizontal conduction of heat. However, these modes of extension produce much larger uplift than does the simple shear model for the footwall side of the rift. For any of the pure shear cases the uplift produced by a fixed rate of extension is greatest if the rift starts out narrow. This produces higher vertical flow rates, which bring up hotter material, thus generating large horizontal gradients in temperature. The case which has a widening zone of extension with u b = u r produces the highest uplift because it leads to

2 26 Buck et al.: Lithospheric Extension: Pure and Simple
25 ø 30 ø 35 ø 40 ø 45 ø 50 ø 55 ø 60 ø
30 ø 30 ø
25 ø
20 ø
15 ø
25 ø Meters
20 ø
15 ø
10 ø 25 ø
10 ø 30 ø 35 ø 40 ø 45 ø 50 ø 55 ø 60 ø
Fig. 8. Shaded topographic map of the area surrounding the Red Sea from a 10 minute x 10 minute gridded database (DBDB 10). Outlined box is centered about the R• Conrad marine heat flow survey in the northern Red Sea and also indicates the location of the topographic values shown projected in Figures 9 and 10.
continuously thinning lithosphere being juxtaposed with unthinned lithosphere and crust.
The heat flow asymptotic maximum is also a function of the rate of advection of material near the surface for both the
simple and pure shear models. For simple shear, the heat flow is controlled by the dip angle, as shown in Figure 6c, and the rate of extension, as shown in Figure 6d. For a given rift, if the extension rate is low, the only way for a simple shear model to give high heat flow is for the dip angle to be large. For pure shear rifting to produce high heat flow in the center of a rift either the extension rate has to be large or the zone of extension has to be narrow, as illustrated in Figure 7. Allowing the zone of pure shear rifting to narrow with time allows the heat flow to start out as a broad high and progressively become more highly peaked.
Simple shear extension is always less effective in producing partial melting than is pure shear extension for the same overall plate separation rates and rift widths. In order to produce partial melt, hot mantle material must be advected to a shallow enough depth to exceed the solidus. For detachments shallower than 45% material is advected horizontally more than vertically while conduction cools it. Planar detachment models lead to complete thinning of the continental crust before partial melting occurs. Since large amounts of partial melting are required to produce oceanic crust, this model predicts a period of time during which mantle is exposed at the surface before oceanic crust is produced. Although wide shear
zone models do not lead to complete thinning of the crust, the crust is extremely thin before partial melting commences.
Another result of our calculations which differs from the
prediction of other authors is the location of the region of melt generation within a lithosphere undergoing simple shear extension. Wernicke [1984] and Lister et al. [1986] predict partial melting to occur near the base of the shear zone, substantially displaced from the region of crustal thinning. However, most solidus estimates for "dry" manfie materials will not have melting occur until material has adiabatically risen to a depth of at least about 60 km [Foucher et al., 1982]. In a simple shear geometry the amount that material can rise for a given amount of total plate offset is determined by the dip of the shear zone. For shallow dip detachments this requires very large amounts of total extension before material reaches a shallow enough level to melt. Unless extension rates are sufficiently fast, material will cool so much on ascent that no partial melting will occur, no matter how much extension occurs. For simple shear model calculations run at high extension rates (>1 cm/yr), partial melting begins at 60 km depth under the region of thinnest crust within the rift.
COMPARISON TO THE NORTHERN RED SEA
Figure 8 shows a shaded surface elevation map of the Afro-Arabian region surrounding the Red Sea riff. Several major topographic features are obvious. In the southern Red
Buck et al.: Lithospheric Extension: Pure and Simple 22 7
.
E ',• O.
-6.
200.
O.
Topography
Heat Flow • o
o oOo
o
O.
125.
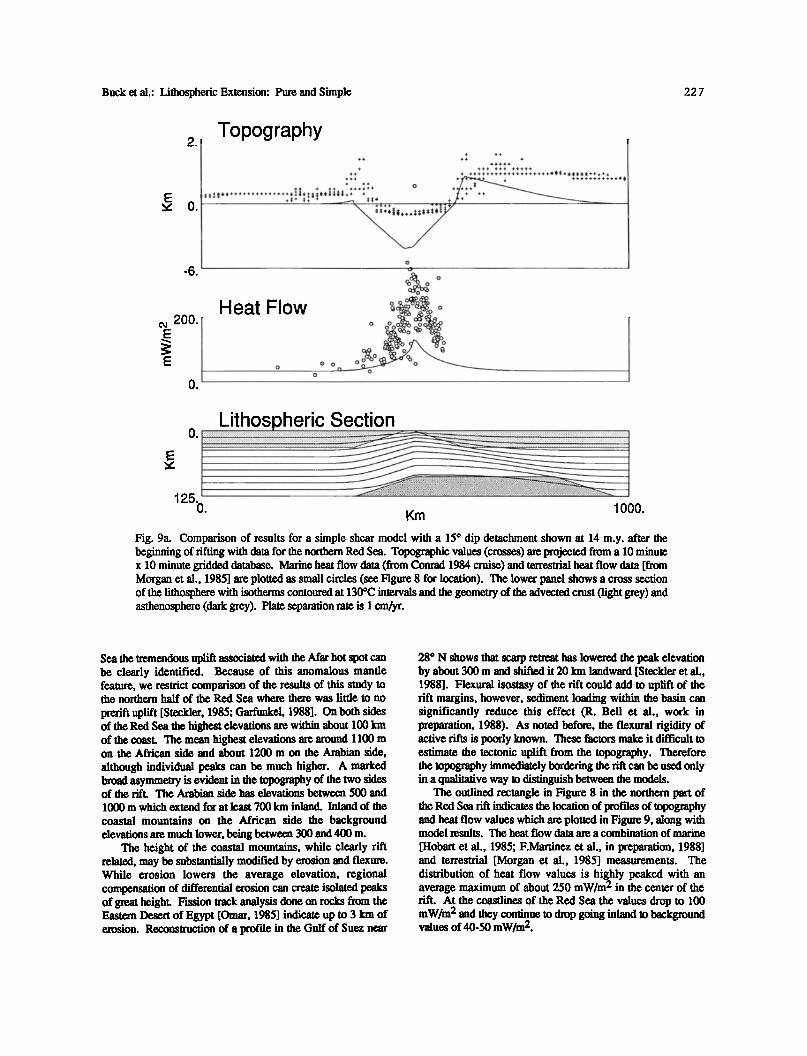
O. Km 1000. Fig. 9a. Comparison of results for a simple shear model with a 15 ø dip detachment shown at 14 m.y. after the beginning of firing with data for the northern Red Sea. Topographic values (crosses) are projected from a 10 minute x 10 minute gridder database. Marine heat flow data (from Conrad 1984 cruise) and terrestrial heat flow data [from Morgan et al., 1985] are plotted as small circles (see Figure 8 for location). The lower panel shows a cross section of the lithosphere with isotherms contoured at 130øC intervals and the geometry of the advected crust (light grey) and asthenosphere (dark grey). Plate separation rate is 1 cm/yr.
Sea the tremendous uplift associated with the Afar hot spot can be clearly identified. Because of this anomalous mantle feature, we restrict comparison of the results of this study to the northern half of the Red Sea where there was little to no
prerift uplift [Steelder, 1985; Gaffunkel, 1988]. On both sides of the Red Sea the highest elevations are within about 100 km of the coast. The mean highest elevations are around 1100 m on the African side and about 1200 m on the Arabian side,
although individual peaks can be much higher. A marked broad asymmetry is evident in the topography of the two sides of the rift. The Arabian side has elevations between 500 and 1000 m which extend for at least 700 km inland. Inland of the coastal mountains on the African side the background elevations are much lower, being between 300 and 400 m.
The height of the coastal mountains, while clearly rift related, may be substantially modified by erosion and flexure. While erosion lowers the average elevation, regional compensation of differential erosion can create isolated peaks of great height. Fission track analysis done on rocks from the Eastexn Desert of Egypt [Omar, 1985] indicate up to 3 km of erosion. Reconstruction of a profile in the Gulf of Suez near
28 ø N shows that scarp retreat has lowered the peak elevation by about 300 m and shifted it 20 km landward [Steckler et al., 1988]. Flexural isostasy of the rift could add to uplift of the rift margins, however, sediment loading within the basin can significantly reduce this effect (R. Bell et al., work in preparation, 1988). As noted before, the flexural rigidity of active rifts is poorly known. These factors make it difficult to estimate the tectonic uplift from the topography. Therefore the topography immediately bordering the rift can be used only in a qualitative way to distinguish between the models.
The outlined rectangle in Figure 8 in the northern part of the Red Sea rift indicates the location of profries of topography and heat flow values which are plotted in Figure 9, along with model results. The heat flow data are a combination of marine
[Hobart et al., 1985; F.Martinez et al., in preparation, 1988] and terrestrial [Morgan et al., 1985] measurements. The distribution of heat flow values is highly peaked with an average maximum of about 250 mW/m 2 in the center of the rift. At the coastlines of the Red Sea the values drop to 100 mW/m 2 and they continue to drop going inland to background values of 40-50 mW/m 2.
228 Buck et al.: Lithospheric Extension: Pure and Simple
.
E • O.
-6.
200.
O.
Topography
Heat Flow
o o
o
o
o o oo• oo •o ø
O7oO
, Lithospheric Section O.
E
125. O. 1000.
Km
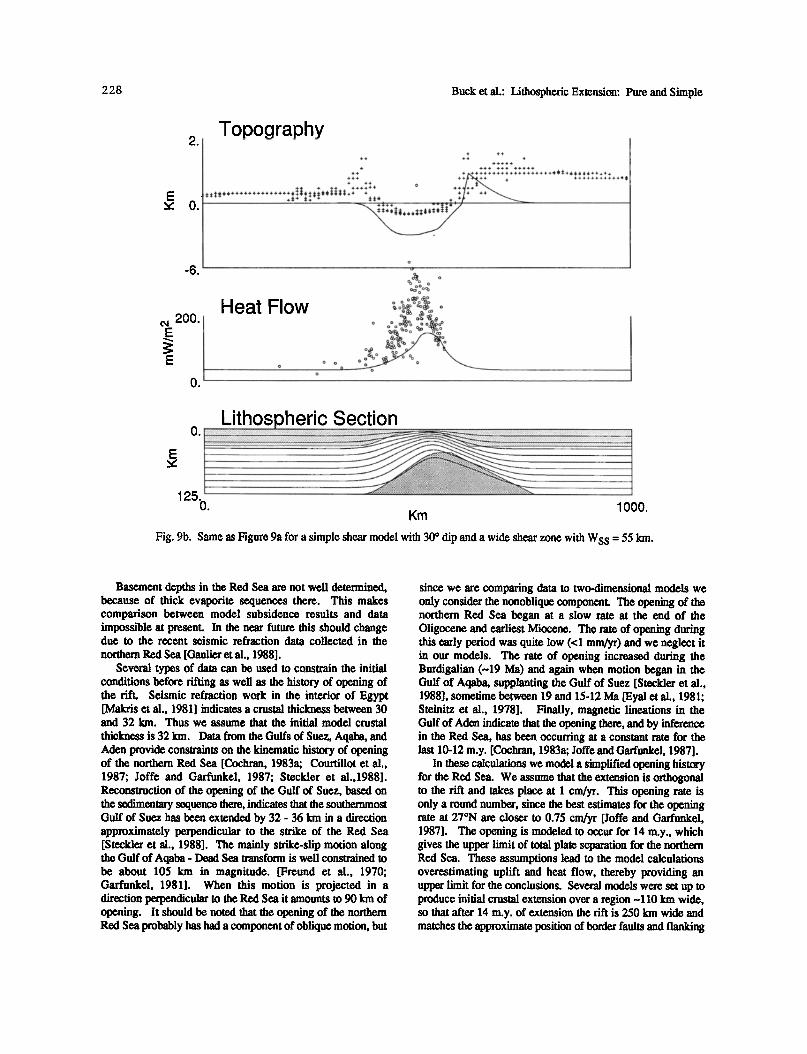
Fig. 9b. Same as Figure 9a for a simple shear model with 30 ø dip and a wide shear zone with WSS = 55 km.
Basement depths in the Red Sea are not well determined, because of thick evaporite sequences there. This makes comparison between model subsidence results and data impossible at present. In the near future this should change due to the recent seismic refraction data collected in the
northern Red Sea [Gaulier et al., 1988]. Several types of data can be used to constrain the initial
conditions before rifting as well as the history of opening of the rift. Seismic refraction work in the interior of Egypt [Makris et al., 1981] indicates a crustal thickness between 30 and 32 km. Thus we assume that the initial model crustal
thickness is 32 km. Data from the Guffs of Suez, Aqaba, and Aden provide constraints on the kinematic history of opening of the northern Red Sea [Cochran, 1983a; Courtillot et al., 1987; Joffe and Gaffunkel, 1987; Steckler et al.,1988]. Reconstruction of the opening of the Gulf of Suez, based on the sedimentary sequence there, indicates that the southernmost Gulf of Suez has been extended by 32 - 36 km in a direction approximately perpendicular to the strike of the Red Sea [Steckler et al., 1988]. The mainly strike-slip motion along the Gulf of Aqaba - Dead Sea transform is well constrained to be about 105 km in magnitude. [Freund et al., 1970; Garfunkel, 1981]. When this motion is projected in a direction perpendicular to the Red Sea it amounts to 90 km of opening. It should be noted that the opening of the northern Red Sea probably has had a component of oblique motion, but
since we are comparing data to two-dimensional models we only consider the nonoblique component. The opening of the northern Red Sea began at a slow rate at the end of the Oligocene and earliest Miocene. The rate of opening during this early period was quite low (<1 mm/yr) and we neglect it in our models. The rate of opening increased during the Burdigalian (.--19 Ma) and again when motion began in the Gulf of Aqaba, supplanting the Gulf of Suez [Steckler et al., 1988], sometime between 19 and 15-12 Ma [Eyal et al., 1981; Steinitz et al., 1978]. Finally, magnetic lineations in the Gulf of Aden indicate that the opening there, and by inference in the Red Sea, has been occurring at a constant rate for the last 10-12 m.y. [Cochran, 1983a; Joffe and Garfunkel, 1987].
In these calculations we model a simplified opening history for the Red Sea. We assume that the extension is orthogonal to the rift and takes place at 1 cm/yr. This opening rate is only a round number, since the best estimates for the opening rate at 27øN are closer to 0.75 cm/yr [Joffe and Garfunkel, 1987]. The opening is modeled to occur for 14 m.y., which gives the upper limit of total plate separation for the northern Red Sea. These assumptions lead to the model calculations overestimating uplift and heat flow, thereby providing an upper limit for the conclusions. Several models were set up to produce initial crustal extension over a region .--110 km wide, so that after 14 m.y. of extension the rift is 250 km wide and matches the approximate position of border faults and flanking
Buck et al.: Lithospheric Extension: Pure and Simple 22 9
.
E • 0.
-6.
200.
O.
Topography
Heat Flow
o o
o
O. Lithospheric Section
:•:.:.:.:•:•:••.:•••:•:.:•:•:•:•:.:.:.:.:.:.:.:.:.:.:.:.:•:.:•:.:•:•••:•:•••:•:•:•:•.•:•. :'":'":':'"": .......... '"'"'"": ........................................... i ....................... ":""'"'""" ..................................................
125b. lOO0. Km
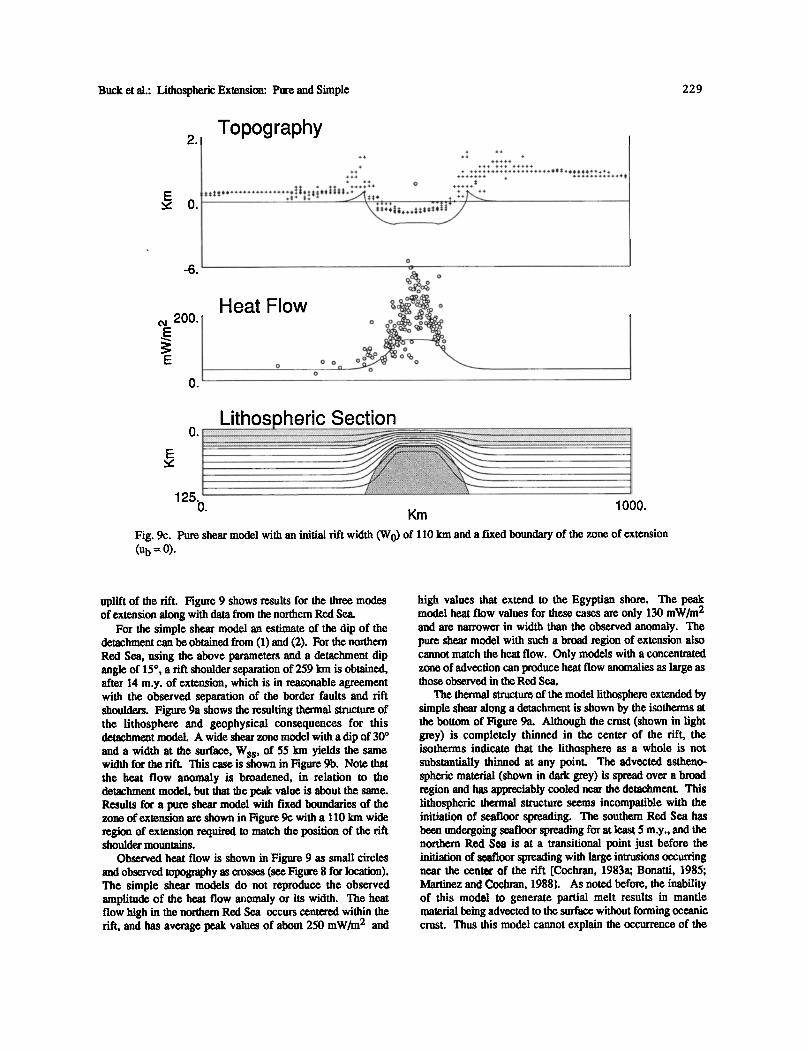
Fig. 9c. Pure shear model with an initial rift width (W0) of 110 km and a fixed boundary of the zone of extension (u b = 0).
uplift of the rift. Figure 9 shows results for the three modes of extension along with data from the northern Red Sea.
For the simple shear model an estimate of the dip of the detachment can be obtained from (1) and (2). For the northern Red Sea, using the above parameters and a detachment dip angle of 15 ø, a rift shoulder separation of 259 km is obtained, after 14 m.y. of extension, which is in reasonable agreement with the observed separation of the border faults and rift shoulders. Figure 9a shows the resulting thermal structure of the lithosphere and geophysical consequences for this detachment model. A wide shear zone model with a dip of 30 ø and a width at the surface, Wss, of 55 km yields the same width for the rift. This case is shown in Figure 9b. Note that the heat flow anomaly is broadened, in relation to the detachment model, but that the peak value is about the same. Results for a pure shear model with fixed boundaries of the zone of extension are shown in Figure 9c with a 110 km wide region of extension required to match the position of the rift shoulder mountains.
Observed heat flow is shoxvn in Figure 9 as small circles and observed topography as crosses (see Figure 8 for location). The simple shear models do not reproduce the observed amplitude of the heat flow anomaly or its width. The heat flow high in the northern Red Sea occurs centered within the rift, and has average peak values of about 250 mW/m 2 and
high values that extend to the Egyptian shore. The peak model heat flow values for these cases are only 130 mW/m 2 and are narrower in width than the observed anomaly. The pure shear model with such a broad region of extension also cannot match the heat flow. Only models with a concentrated zone of advection can produce heat flow anomalies as large as those observed in the Red Sea.
The thermal structure of the model lithosphere extended by simple shear along a detachment is shown by the isotherms at the bottom of Figure 9a. Although the crust (shown in light grey) is completely thinned in the center of the rift, the isotherms indicate that the lithosphere as a whole is not substantially thinned at any point. The advected astheno- spheric material (shown in dark grey) is spread over a broad region and has appreciably cooled near the detachment. This lithospheric thermal structure seems incompatible with the initiation of seafloor spreading. The southern Red Sea has been undergoing seafloor spreading for at least 5 m.y., and the northern Red Sea is at a transitional point just before the initiation of seafloor spreading with large intrusions occurring near the cent.at of the rift [Cochran, 1983a; Bonatti, 1985; Martinez and Cochran, 1988]. As noted before, the inability of this model to generate partial melt results in mantle material being advected to the surface without forming oceanic crust. Thus this model cannot explain the occurrence of the

2 30 Buck et al.: Lithospheric Extension: Pure and Simple
northern Red Sea intrusions. In fact, at this extension rate and dip, the model will never produce oceanic crust. The wide shear zone model illustrated in Figure 9b never totally thins the crust but also never produces partial melting.
An aditional feature of the Red Sea area is the line of volcanics which were formed within several hundred kilometers
of the Arabian coast before and during rifting [Bohannon, et al., submitted to Tectonics, 1987]. The trend of volcanic centers does not parallel the coast but runs nearly due north-south. Wernicke [1985] suggested that these volcanics are expressions of lithospheric thinning at depth brought about by simple shear extension. However, simple pressure release melting of normal temperature and composition asthenosphere, such as is thought to occur under mid-ocean ridges [Klein and Langmuir, 1987], will not occur for our simple shear models. This is because hot asthenosphere is not brought up to sufficiently shallow depths, in the models, for melting to occur. Furthermore, for simple shear models in which melting does occur, it takes place within the rift, not offset toward the hanging wall side. The volcanics may not be directly caused by the opening of the Red Sea, since they continue into Jordan and southern Syria, well north of the Red Sea. One sp•ulation we can offer is that the Afar hotspot passed under the Arabian plate and left a layer of anomalously hot mantle ponded or perched below the lithosphere. This partially molten mantle could not force its way to the surface until the stress state of the lithosphere changed to be extensional when rifting began. The absolute motion of the Arabian plate is only poorly constrained, but plate motion data are consistent with north-south motion of the Arabian plate at about 2 cm/yr from the Cretaceous to the present [Minster and Jordan, 1978].
Neither the pure shear nor the simple shear model matches the magnitude of the topography flanking the rift. The pure shear model only produces short wavelength rift topography, and this is too low in amplitude. The same conclusion is true for a calculation of a pure shear model with a widening zone of extension that matches the rift shoulder separation. This case does a somewhat better job of matching the topography, but because the zone of extension widens with time, it gives an even poorer match to the heat flow data.
Although the topographic asymmetry produced by the simple shear models matches the form of the Red Sea rift shoulder asymmetry, the amplitudes and widths of the uplifts do not agree. On the Egyptian (footwall) side the maximum uplift is just over 100 m for the model, while the actual topography rises to average highs of about 1100 m above sea level from a base level of around 300 m above sea level. The
model uplifts are also much narrower, particularly for the wide shear zone case. On the Arabian (hanging wall) side the model uplift reaches values of 750 m. Actual average high elevations are in the neighborhood of 1200 m above sea level. Even detachment models with more complicated curved geometries cannot match the amount of uplift of Arabia, since the amount of extension in the Red Sea is limited. Also, the more the uplift is pushed to the side by having a very low angle detachment, the lower the heat flow values within the model rift. The large width of the Arabian uplift suggests that it could not be rift related; rather, the rift shoulder uplift is superimposed on a base level between 500 and 800 m above sea level.
The initial lithospheric thickness could be different from that assumed in these models (125 km). The effect of a much thicker lithosphere, assuming the other parameters remained the same, would be to slow the rate at which steady state conditions are reached. For all the pure and simple cases of extension the uplift will be larger if the lithosphere is initially thicker. For the simple shear case the width of the region of hanging wall uplift is directly proportional to the thickness of lithosphere for a given detachment dip angle. To match the uplift of the Arabian side of the northern Red Sea would require a lithospheric thickness of over 300 km. However, thicker lithosphere would result in much lower heat flow in the center of the rift which would be many times too low to match the data for the northern Red Sea.
Other factors which could affect the uplift are flexure and induced mantle convection. The effects of local flexure driven
by the crustal unloading of the upper plate and loading of the lower plate plus thermal bouyancy are not clear. The loading would interact with the laterally varying strength of the lithosphere, which depends on its composition as well as its temperature structure. The flexural response to simple shear rifting may add to the uplift of the footwall side of the rift but will not be able to explain the long wavelength topography of Arabia. Induced convection driven by high lateral temperature gradients has been proposed as a mechanism for bringing in additional heat and amplifying rift shoulder uplift. This mech- anism may be effective in increasing the short wavelength uplift and heat flow at the rift flank in the pure shear models. However, the low angle detachment generates relatively low horizontal temperature gradients (see Figure 9a) at the base of the lithosphere, diminishing the effectiveness of this mechanism for the simple shear models.
The extremely broad uplift across Arabia is thus much larger in amplitude and width than uplift generated by any of the models. If the topographic differences across the Red Sea cannot be explained by a simple shear rifting model, then what can cause this broad scale asymmetry? We suggest that it may be related to flexural upwarping caused by the subruction and loading of the Arabian plate at the Zagros sulxluction zone. Snyder and Barazangi [1986] have analyzed gravity and topographic data for the Arabian plate within 400 km of the Zagros mountains and find that thick elastic plates (>60 km) are required to explain that data. Such plate thicknesses could produce a flexural response with a wavelength sufficiently large to explain some of the broad topographic uplift of Arabia. The rifting of the Red Sea should effectively break the Arabian Plate, leaving a free end, which leads to higher amplitudes of topography at the broken end than if the plate were continuous. Also, any underplating of the crust of western Arabia due to the passage of the Afar hotspot would contribute to the uplift there. Gravity data for northwestern Arabia are sparse, but are now being studied to address this question.
Although simple shear extension does not explain the heat flow and topography for the Red Sea rift, lithospheric simple shear cannot be ruled out for other areas. Wernicke [1985]
claimed that the uplift of the Sierra Nevada mountains was caused by simple shear extension which produced lithospheric thinning under the Sierra Nevada while crustal thinning was concentrated in the Death Valley area of the Basin and Range.
Buck et al.: Lithospheric Extension: Pure and Simple 2 31
.
E • O.
-6.
2OO.
O.
Topography + ++
++ +
+++++
+ ++++
+ +++++++++++++++++.++•+•+++++ + ++++++++++*
O.
125. O.
Lithospheric Section
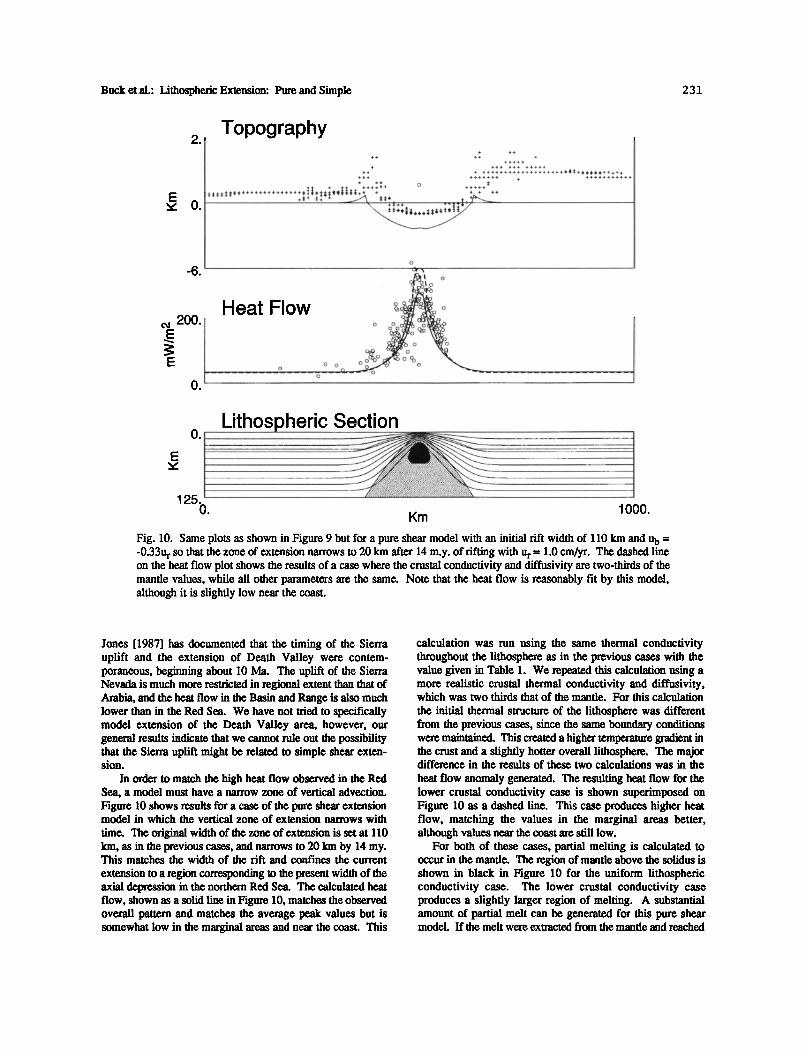
Km 1000. Fig. 10. Same plots as shown in Figure 9 but for a pure shear model with an initial rift width of 110 km and u b = -0.33u r so that the zone of extension narrows to 20 km after 14 m.y. of rifting with u r = 1.0 cm/yr. The dashed line on the heat flow plot shows the results of a case where the crustal conductivity and diffusivity are two-thirds of the mantle values, while all other parameters are the same. Note that the heat flow is reasonably fit by this model, although it is slightly low near the coast.
Jones [1987] has documented that the timing of the Sierra uplift and the extension of Death Valley were contem- poraneous, beginning about 10 Ma. The uplift of the Sierra Nevada is much more restricted in regional extent than that of Arabia, and the heat flow in the Basin and Range is also much lower than in the Red Sea. We have not tried to specifically model extension of the Death Valley area, however, our general results indicate that we cannot rule out the possibility that the Sierra uplift might be related to simple shear exten- sion.
In order to match the high heat flow observed in the Red Sea, a model must have a narrow zone of vertical advection. Figure 10 shows results for a case of the pure shear extension model in which the vertical zone of extension narrows with
time. The original width of the zone of extension is set at 110 km, as in the previous cases, and narrows to 20 km by 14 my. This matches the width of the rift and confines the current
extension to a region corresponding to the present width of the axial depression in the northern Red Sea. The calculated heat flow, shown as a solid line in Figure 10, matches the observed overall pattern and matches the average peak values but is somewhat low in the marginal areas and near the coast. This
calculation was run using the same thermal conductivity throughout the lithosphere as in the previous cases with the value given in Table 1. We repeated this calculation using a more realistic crustal thermal conductivity and diffusivity, which was two thirds that of the mantle. For this calculation
the initial thermal stracture of the lithosphere was different from the previous cases, since the same boundary conditions were maintained. This created a higher temperature gradient in the crust and a slightly hotter overall lithosphere. The major difference in the results of these two calculations was in the
heat flow anomaly generated. The resulting heat flow for the lower crustal conductivity case is shown superimposed on Figure 10 as a dashed line. This case produces higher heat flow, matching the values in the marginal areas better, although values near the coast are still low.
For both of these cases, partial melting is calculated to occur in the mantle. The region of mantle above the solidus is shown in black in Figure 10 for the uniform lithospheric conductivity case. The lower crustal conductivity case produces a slightly larger region of melting. A substantial amount of partial melt can be generated for this pure shear model. If the melt were extracted from the mantle and reached

2 32 Buck et al.: Lithospheric Extension: Pure and Simple
the surface, it could produce the intrusions observed in the northern Red Sea and possibly oceanic crust if extension is continued. Lachenbruch and Sass [1977] have shown that underplating or intrusion of melt can add a significant component to the surface heat flow in extensional areas. The magnitude of this effect depends on the volume of melt generated and on the depth at which it is emplaced. Since we cannot adequately assess how much melt would be extracted and at what depth it would be emplaced, we do not calculate the contribution of this mechanism to the surface heat flow.
However, it would be expected to be a factor in increasing the surface heat flow near the center of the rift of our
time-narowing pure shear model only after about 10 m.y. since no melt is generated before this time.
The production of a narrow zone of extension, required to fit the heat flow data, along with a wider zone of moderate crustal thinning, required to fit topographic data, could happen in other ways. The extension could have been concentrated to a narrow region from the start and erosion could have cut back many tens of kilometers from the original edge of the rift. Since there has been no more than the modeled 140 km of
perpendicular opening of the northern Red Sea, this requires massive erosion of 60 km of the rift edge on each side, an excessive amount. Another possibility is that the concentrated extension at the center of the rift is going on at the same time as the slower extensional thinning to the sides of the rift center. However, our preferred scenario is that the initial extension of the rift took place over a wide region, and then it progressively narrowed, as for the case shown in Figure 10, with a moderate amount of erosion contributing to the width of the rift. This is our favored mechanism because it is
consistent with the extension inferred for the Gulf of Suez to
the north and with structural and tectonic characteristics of the
northern Red Sea.
Seismic reflection data showing sediment deformation and earthquake epicenter locations suggest that tectonic de- formation in the marginal areas of the northern Red Sea is decreasing and that most of the active deformation is now occurring within the deeper waters of the axial depression [Martinez and Cochran, 1988]. A series of periodically spaced large intrusions having large dipolar magnetic anomalies and forming locally deeper bathymetry occurs along the axis of the northern Red Sea [Cochran et al., 1986; Pautot, 1983; Pautot et al., 1986; Guennoc et al., 1988] and adds support to the hypothesis that extension in the northern Red Sea is con- centrated in a narrow width zone that is very close to initiating seafloor spreading. Prior to the initiation of motion along the Gulf of Aqaba, the Gulf of Suez formed the northern end of the Red Sea. Moderate extension is distributed fairly uniformly over the --90 km width of the southern Gulf of Suez [Steclder et al., 1988]. The Red Sea is likely to have started with a broad zone of extension, as did the Gulf of Suez, and later ex- tension concentrated into the center.
Although the heat flow and elevation for the rift shoulder mountains are not matched by this model, they are compatible with a model with a narrowing zone of extension. This model would produce large lateral temperature gradients to drive manfie flow which would augment the uplift and heat flow in the rift shoulder mountains, as has previously been suggested [Buck, 1984, 1986; Steckler, 1985]. Although simple shear extension of the upper crust is observed in the form of half grabens structures in the Gulf of Suez and in the East African
Rift system, the heat flow observations from the northern Red Sea are incompatible with a significant component of lithospheric simple shear extension. In the northern Red Sea, the major component of lithospheric extension has to be due to pure shear in a narrow region close to the center of the rift.
Our preferred model for Red Sea rifting, of a narrowing of the zone of lithospheric extension, is physically what would be expected for pure shear rifting. The material in the center of a wide rift zone is cooled less than that at the edges of the rift. The effective strength of the lithosphere is thought to be highly temperature dependent with hotter material being weaker [e.g, Weertman and Weertman, 1975]. Thus, if extension occurs preferentially in the weakest part of the lithosphere the rift zone should narrow with time.
CONCLUSIONS
The main conclusions from the work on general rifting models are as follows:
1. The uplift of the hanging wall in the simple shear model is limited by the total amount of extension of a rdt.
2. The maximum thermal uplift and heat flow for the simple shear model are centered on the intersection of the detachment with the surface, which is within the region of overall subsidence, while the maximum total uplift (the combination of thermal uplift and crustal subsidence) occurs at the first point on the hanging wall side of the rift with full crustal thickness.
3. For simple shear rifting, the heat flow and uplift increase with increasing rate of extension and dip angle.
4. Because the thermal anomaly is distributed over a wide zone, lithospheric simple shear extension models are inefficient at generating melts, but if melting occurs, it is centered below the area of maximum crustal thinning in the rift.
5. If the isostatic response to the topography produced by simple shear is distributed over a wide area, including the hanging wall side of the detachment, then planar detachments will be bent into a listric geometry.
6. Heat flow, in the pure shear models of rifting, is greatest for narrow zones of extension and high rates of extension.
7. Uplift of the rift shoulders in a pure shear model is accomplished by lateral conduction of heat and depends on the magnitude of horizontal temperature gradients produced by the strain field.
Conclusions concerning the form of extension in the northern Red Sea area are as follows:
1. None of the rifting models can explain the broad uplift of the Arabian side of the rift; the total amount of opening of the Red Sea is several times too small to explain the uplift in terms of simple shear of the lithosphere.
2. Simple shear extension with a shallow detachment dip (< 30 ø) cannot match the heat flow measured in the northern Red Sea.
3. A concentrated narrow zone (<40 km) of pure shear extension is required to match the heat flow data for the northern Red Sea, and this will also produce p ,atrial melting of the asthenosphere.
4. In order to simultaneously match the observed rift shoulder separation and the heat flow, the initial extension must have occurred over a broader width and subsequently narrowed.
Buck et al.: Lithospheric Extension: Pure and Simple 23 3
Acknowledgements. Thanks to Marcus Langseth, Gary Karner, and Jeff Weissel for helpful discussions at the start of this work and for review of the manuscript. Reviews by Art Lachenbruch, Paul Morgan and an anonymous reviewer led to improvements in the paper, as did comments by Dan Davis. Support for R. Buck and M. Steckler provided by National Science Foundation grant OCE-86-10213. Support for F. Martinez, M. Steckler, and J. Cochran provided by National Science Foundation grant OCE-83-09983. Lamont-Doherty Geological Observatory contribution 4253.
REFERENCES
Allmendinger, R. W., T. A. Hauge, E. C. Hanser, J. C. Potter, S. L. Kemper, K. D. Nelson, P. Knuepfer, and J. Oliver, Overview of the COCORP 40 ø N transect, western United States: The fabric of an orogenic belt, Geol. Soc. Am. Bull., 98, 308-319, 1987.
Alvafez, F., J. Virieux, and X. Le Pichon, Thermal consequences of lithospheric extension over continental margins: The initial stretching phase, Geophys. J. R. Astron. Soc., 78, 389-411, 1984.
Artemjev, M. E. and E. V. Artyushkov, Structure and isostasy of the Baikal rift and the mechanism of rifting, J. Geophys. Res., 76, 1179-1211, 1971.
Beaumont, C., C. E. Keen and R. Boutilier, On the evolution of rifted continental margins: Comparison of models and observations of the Nova Scotia margin, Geophys. J. R. Astron. Soc., 70, 667-715, 1982.
Bosworth, W., Off-axis volcanism in the Gregory rift, east Africa: Implications for models of continental rifting, Geology, 15, 394-400, 1987.
Buck, W. R., Small-scale convection and the evolution of the lithosphere, Ph.D. thesis, 256 pp., Mass. Inst. of Technol., Cambridge, 1984.
Buck, W. R., Small-scale convection induced by passive rifting: The cause for uplift of rift shoulders, Earth Planet. Sci. Lett., 77, 362-372, 1986.
Cochran, J. R., A model for the development of the Red Sea, Am. Assoc. Pet. Geol. Bull., 67, 41-69, 1983a.
Cochran, J. R., Effects of finite rifting times on the development of sedimentary basins, Earth Planet. Sci. Lett., 66, 289-302, 1983b.
Cochran, J. R., and F. Martinez, Evidence from the Northern Red Sea on the transition from continental rifting to seafloor spreading, Tectonophysics, in press, 1988.
Cochran, J. R., F. Martinez, M. S. S teckler, and M. A. Hobart, Conrad Deep: A new Northern Red Sea deep. Origin and implications for continental rifting, Earth Planet. Sci. Lett., 78, 18-32, 1986.
Courtillot, V., R. Armijo, and P. Tapponnier, Kinematics of the Sinai triple junction and a two phase model of Arabia-Africa rifting, Geol. Soc. London Spec. Publ. 28, 559-573, 1987.
Davis, G. H., Shear zone model for the origin of metamorphic core complexes, Geology, 11,342-347, 1983.
deCharpal, O., P. Guennoc, L. Montadert, and D. G. Roberts, Rifting, crustal attenuation and subsidence in the Bay of Biscay, Nature, 275, 706-711, 1978.
England, P., and J. Jackson, Migration of the seismic- aseismic transition during uniform and nonuniform extension of the continental lithosphere, Geology, 15, 291-294, 1987.
Eyal, M., Y. Eyal, Y. Bartov, and G. Steinitz, The tectonic development of the western margin of the Gulf of Elat (Aqaba) rift, Tectonophysics, 80, 39-66, 1981.
Foucher, J.-P., X. Le Pichon, and J.-C. S ibuet, The ocean-continent transition in the uniform lithospheric stretching model: Role of partial melting in the mantle., in The Evolution of Sedimentary Basins, edited by P. Kent, M. H. P. Bott, D. P. McKenzie, and C. A. Williams, 27-43, The Royal Society of London, 1982.
Freund, R., Z. Garfunkel, I. Zak, M. Goldberg, T. Wissbrod and B. Derin, The shear along the Dead Sea Rift, Philos. Trans. R. Soc. London, Ser A, 267, 107-130, 1970.
Furlong, K. P. and M.D. Londe, Thermal-mechanical consequences of Basin and Range extension, Spec. Pap., Geol. Soc. Am. 208, 23-30, 1986.
Garfunkel, Z., Internal structure of the Dead Sea leaky transform (rift) in relation to plate kinematics, Tectono- physics, 80, 81-108, 1981.
Gaffunkel, Z., Relation between continental rifting and uplifting: Evidence from the Suez rift and northern Red Sea, Tectonophysics, in press, 1988.
Gaulier, J. M., X. LePichon, N. Lyberis, F. Avedik, L. Gely, I. Moretti, A. Deschamps, and S. Hafez, Seismic study of the crustal thickness, northern Red Sea and Gulf of Suez, Tectonophysics, in press, 1988.
Gibbs, A.D., Structural evolution of extensional basin margins, J. Geol. Soc. London, 141,609-620, 1984.
Guennoc, P., G. Pautot, and A. Coutelle, Surficial structures of the northern Red Sea axial valley from 23øN to 28øN: Time and space evolution of neooceanic structures, Tectonophysics, in press, 1988.
Hobart, M. A., J. R. Cochran, F. Martinez, and M. S. Steckler, The northem Red Sea, 3. Heat flow and thermal state of the lithosphere (abstrac0, Eos, Trans. AGU, 66, 365, 1985.
Jarvis, G. T., Submarine rifting at mid-ocean ridges, Tectonophysics, 94, 109-122, 1983.
Jarvis, G. T. and D. P. McKenzie, Sedimentary basin formation with finite extension rates, Earth Planet. Sci. Lett., 48, 42-52, 1980.
Joffe, S., and Z. Gaffunkel, Plate kinematics of the circum Red Sea-A re-evaluation, Tectonophysics, 14, 5-22, 1987.
Jones, C. H., Is extension in Death Valley accommodated by thinning of the mantle lithosphere beneath the Sierra Nevada, Califorrda?, Tectonics, 6, 449-473, 1987.
Keen, C. E., The dynamics of rifting: Deformation of the lithosphere by active and passive driving mechanisms, Geophys. J. R. Astron. Soc., 80, 95-120, 1985.
Klein, E. M. and C. H. Langmuir, Global correlations of ocean ridge basalt chemistry with axial depth and crustal thickness, J. Geophys. Res., 92, 8089-8115, 1987.
Lachenbruch, A. H., and J. H. Sass, Models of an extending lithosphere and heat flow in the Basin and Range province, Mem. Geol. Soc. Am. 152, 209-250, 1977.
Lee, J., E. L. Miller, and J. F. Sutter, Ductile strain and metamorphism in an extensional tectonic setting: A case study from the northern Snake Range, Nevada, USA, Geol. Soc. Lonon Spec. Publ. 28, 267-298, 1987.
Le Pichon, X., and F. Barbier, Passive margin formation by low-angle faulting within the upper crust: The northern Bay of Biscay margin, Tectonics, 6, 133-150, 1987.
Lister, G. S., M. A. Etheredge and P. A. S ymonds,

2 3/4 Buck et al.: Lithospheric Extension: Pure and Simple
Detachment faulting and the evolution of passive continental margins, Geology, 14, 246-250, 1986.
Makris, J., B. A. Allam, and L. M611er, Deep seismic studies in Egypt and their interpretation (abstract), Eos, Trans. AGU, 62, 230, 1981.
Martinez, F., and J. R. Cochran, Structure and tectonics of the Northern Red Sea: Catching a continental margin between rifting and drifting, Tectonophysics, in press, 1988.
McKenzie, D., Some remarks on the development of sedimentary basins, Earth Planet Sci. Lett., 40, 25-32, 1978.
Minster, J. B., and T. H. Jordan, Present day plate motions, J. Geophys. Res., 83, 5331-5354, 1978.
Morgan, P., F. K. Boulos, S. F. Hennin, A. A. El-Sheriff, A. A. E1-Sayed, N. Z. Basra, and Y. S. Melek, Heat flow in eastern Egypt: The thermal signature of a continental breakup, J. Geodyn. 4, 107-131, 1985.
Omar, G.I., Phanerozoic tectono-thermal history of the Nubian Massif, Eastern Desert, Egypt and its relationship to the opening of the Red Sea as revealed by fission track studies, Ph.D. thesis, Univ. of Pa., Philadelphia, 156 p., 1985.
Pautot, G., Les fosses de la Mer Rouge: Approach g6omorphologique d'un stade initial d'overture oc6anique r6alis6e h l'aide du Seabeam, Oceanol. Acta, 6, 235-244, 1983.
Pautot, G., P. Guennoc, A. Coutelle, and N. Lyberis, La d6pression axi• du segment nord mer Rouge (de 25øN h 28øN): Nouvelles donn6 g6ologiques et g6ophysiques obtenues au cours de la campagne Transmerou 83, Bull. Soc. Gdol. Fr. 8, 381-399, 1986.
Roache, P. J., Computational Fluid Dynamics, 446 pp., Hermosa, Albuquerque, N.M., 1982.
Royden, L. and C. E. Keen, Rifting processes and thermal evolution of the continental margin of eastern Canada determined from subsidence curves, Earth Planet. Sci. Lett., 51,343-361, 1980.
Salveson, J. O., Variations in the geology of rift basins-A tectonic model, paper presented at the Rio Grande Rift Symposium, Santa Fe, N.M., 1978.
Sleep, N.H., Thermal effects of formation of Atlantic continental margins by continental breakup, Geophys. J. R. Astron. Soc., 24, 325-350, 1971.
Snyder, D. B, and M. Barazangi, Deep crustal structure and flexure of the Arabian plate beneath the Zagros collisional mountain belt as inferred from gravity observations, Tectonics, 5,361-373, 1986.
Steckler, M. S., The thermal and mechanical evolution of Atlantic-type continental margins, Ph.D. Thesis, 261 pp., Columbia University, New York, 1981.
Steckler, M. S., Uplift and extension in the Gulf of Suez, indications of induced mantle convection, Nature, 317, 135-139, 1985.
Steckler, M. S. and U.S. ten Brink, Lithospheric strength variations as a control on new plate boundaries: Examples from the Northern Red Sea region, Earth Planet. Sci. Lett., 79, 120-132, 1986.
Steckler, M. S., and A. B. Watts, The Gulf of Lion: Subsidence of a young continental margin, Nature, 287, 425-429, 1980.
Steckler, M. S. and A. B. Watts, Subsidence history and tectonic evolution of Atlantic type continental margins, in Dynamics of Passive Margins, Geodyn. Set., Vol. 6, edited by R. A. Scrutton, 184-196, AGU, Washington, D.C., 1982.
Steckler, M. S., N. Lyberis, F. Berthelot, and X. Le Pichon, Tectonic evolution of the Gulf of Suez in a regional context, Tecwnophysics, in press, 1988.
Steinitz, G., Y. Bartov, J. C. Hunziker, K-Ar age determinations of some Miocene-Pliocene basalts in Israel:
Their significance to the tectonics of the Rift Valley, Geol. Mag., 115, 329-340, 1978
Vening Meinesz, F. A., Les graben africains resultat de compression ou de tension dans la croute terrestre?, Kol. Inst. Bull., 21,539-552, 1950.
Wemicke, B., Low-angle normal faults in the Basin and Range province: Nappe tectonics in an extending orogen, Nature, 291,645-648, 1981.
Wernicke, B., Uniform-sense normal simple shear of the continental lithosphere, Can. J. Earth Sci., 22, 108-125, 1985.
Weertman, J., and J. R. Weertman, High temperature creep of rock and manfie viscosity, Annu. Rev. Earth Planet. Sci., 3, 293-315, 1975.
W. R. Buck, J. R. Cochran, F. Martinez, and M.S. Steclder, Lamont-Doherty Geological Observatory of Columbia University, Palisades, NY 10964
(Received August 28, 1987; revised November 4, 1987; accepted November 6, 1987.)