vw master 16 h1 en - cw.volkswagenag.com · half-yearly financial report january–june 2016. 1...
TRANSCRIPT

Half-Yearly Financial ReportJanuary– June
2016

1 U PDATED I N FORMATION 7 I NTER IM MANAGEMENT R EPORT
23 B RAN DS AN D BUSI N ESS F I ELDS
27 I NTER IM CONSOLI DATED FI NANC IAL STATEMENTS (CON DENSED)
1 Key Facts
2 Key Events
7 Volkswagen Shares 8 Business Development 16 Results of Operations, Finan- cial Position and Net Assets 22 Outlook
27 Income Statement 28 Statement of Comprehensive Income 31 Balance Sheet 32 Statement of Changes in Equity 34 Cash Flow Statement 35 Notes to the Interim Consolidated Financial Statements 53 Responsibility Statement 54 Review Report
All figures shown in the Report are rounded, so minor discrepancies may arise from addition of these amounts. The figures from the previous fiscal year are shown in parentheses directly after the figures for the current reporting period.
VO L K SWA G E N G R O U P
Q 2 H 1
Volume Data1 2016 2015 % 2016 2015 %
Deliveries to customers (thousand units) 2,609 2,552 + 2.2 5,117 5,039 + 1.5
of which: in Germany 366 353 + 3.5 685 668 + 2.5
abroad 2,243 2,198 + 2.0 4,432 4,371 + 1.4
Vehicle sales (thousand units) 2,622 2,483 + 5.6 5,199 5,090 + 2.1
of which: in Germany 357 343 + 4.1 679 668 + 1.6
abroad 2,265 2,140 + 5.8 4,520 4,422 + 2.2
Production (thousand units) 2,713 2,593 + 4.6 5,268 5,314 – 0.9
of which: in Germany 722 693 + 4.1 1,405 1,395 + 0.8
abroad 1,991 1,900 + 4.8 3,863 3,919 – 1.4
Employees (thousand on June 30, 2016/Dec. 31, 2015) 613.6 610.1 + 0.6
of which: in Germany 278.1 278.7 – 0.2
abroad 335.5 331.4 + 1.3
Q 2 H 1
Financial Data (IFRSs), € million 2016 2015 % 2016 2015 %
Sales revenue 56,971 56,041 + 1.7 107,935 108,776 – 0.8
Operating profit before special items 4,386 3,662 + 19.8 7,517 6,990 + 7.5
as a percentage of sales revenue 7.7 6.5 7.0 6.4
Special items – 2,487 – 170 x – 2,178 – 170 x
Operating profit 1,899 3,492 – 45.6 5,339 6,820 – 21.7
as a percentage of sales revenue 3.3 6.2 4.9 6.3
Profit before tax 1,607 3,696 – 56.5 4,810 7,664 – 37.2
as a percentage of sales revenue 2.8 6.6 4.5 7.0
Profit after tax 1,214 2,731 – 55.6 3,579 5,663 – 36.8
Profit attributable to Volkswagen AG shareholders 1,155 2,671 – 56.7 3,461 5,558 – 37.7
Cash flows from operating activities2 3,757 4,086 – 8.0 5,111 7,447 – 31.4
Cash flows from investing activities attributable to operating activities 3,987 3,668 + 8.7 5,149 6,993 – 26.4
Automotive Division3
EBITDA4 4,904 6,019 – 18.5 10,974 11,859 – 7.5
Cash flows from operating activities2 7,334 6,800 + 7.5 9,736 11,234 – 13.3
Cash flows from investing activities attributable to operating activities5 3,484 3,572 – 2.5 4,601 6,761 – 31.9
of which: capex 2,395 2,581 – 7.2 4,515 4,652 – 2.9
as a percentage of sales revenue 4.9 5.3 4.9 4.9
capitalized development costs6 1,342 1,033 + 29.9 2,582 2,170 + 19.0
as a percentage of sales revenue 2.7 2.1 2.8 2.3
Net cash flow2 3,850 3,228 + 19.3 5,135 4,473 + 14.8
Net liquidity at June 30 28,778 21,489 + 33.9
1 Volume data including the unconsolidated Chinese joint ventures. These companies are accounted for using the equity method. 2015 deliveries updated to reflect subsequent statistical trends.
2 Prior-year figures adjusted. 3 Including allocation of consolidation adjustments between the Automotive and Financial Services divisions. 4 Operating profit plus net depreciation/amortization and impairment losses/reversals of impairment losses on property, plant and equipment, capitalized development costs, lease
assets, goodwill and financial assets as reported in the cash flow statement. 5 Excluding acquisition and disposal of equity investments: Q2 €3,646 (3,518) million, H1 €6,939 (6,672) million. 6 See table on page 38.
Key Figures

U P D AT E D I N F O R M AT I O N
Key Facts
1
> Volkswagen Group deliveries to customers up slightly on the previous year at 5.1 (5.0) million vehicles; increases particularly in Western and Central Europe and Asia-Pacific; further declines in South America and Eastern Europe
> Group sales revenue on a level with the previous year at €107.9 (108.8) billion; negative effect from exchange rates
> Operating profit amounts to €5.3 (6.8) billion; negative special items, particularly from legal risks, total €2.2 billion
> Operating profit before special items improves by €0.5 billion to €7.5 billion
> Earnings before tax decline to €4.8 (7.7) billion; negative impact from remeasurement in the financial result and lower equity-accounted profit from the Chinese joint ventures
> Automotive Division’s net cash flow increases to €5.1 (4.5) billion; ratio of capex to sales revenue remains on a level with the previous year at 4.9 (4.9)%
> Net liquidity in the Automotive Division rises to €28.8 billion; sale of shares in LeasePlan strengthens capital base
> Inspiring vehicles from the Group:
- Volkswagen Passenger Cars introduces the new Magotan at Auto China 2016; SUV study T-Prime Concept GTE offers a glimpse of the brand’s future flagship
- Audi celebrates the world premiere of the new A5 Coupé
- ŠKODA’s VisionS show car makes its debut appearance in China
- Successful market introduction for the SEAT Ateca
- Bentley launches the exclusive Mulsanne First Edition
- Following the 718 Boxster, Porsche presents the new 718 Cayman
- Lamborghini extends the Huracán family with three fascinating models
- Scania receives “Green Truck Future Innovation 2016” environmental accolade
- MAN showcases complete solutions for the construction industry at the bauma 2016 trade fair
Key Facts

U P D AT E D I N F O R M AT I O N
Key Events
2
M OTO R S H O W S A N D E V E N T S
The Volkswagen Group presented a wealth of new models and tech-
nologies at motor shows and events in the second quarter of 2016.
Auto China 2016
At Auto China 2016 in Beijing, the centerpiece of the Volkswagen
Passenger Cars brand’s showing was the unveiling of the T-Prime Concept GTE concept car. The premium-segment SUV is equipped
with plug-in hybrid and all-wheel drive, generating a power output
of 280 kW (381 PS). The vehicle is an automotive statement of
modernity, equipped with fully digitalized display and control
interfaces. All conventional interior switches have been replaced by
gesture and voice control, touchscreens and touch-sensitive sur-faces. The T-Prime Concept GTE features a Curved Interaction Area.
This curved infotainment console is a world debut, integrating various
display and control functions to create the cockpit of the future. In
place of the familiar shift lever, a glass scroll wheel controls the
concept car’s eight-speed automatic gearbox. The brand also pres-
ented the new Magotan, which has been completely redesigned. Based for the first time on the Modular Transverse Toolkit (MQB),
the saloon is impressive with its appealing proportions, unrivaled
space in the rear and a wide range of new assistance, convenience
and infotainment systems. The Magotan also offers a high-tech
drivetrain: three TSI engines are available with power outputs of
between 110 kW (150 PS) and 162 kW (220 PS), offering the utmost in efficiency and performance. The Phideon celebrated its Chinese
premiere in Beijing. The new premium saloon will launch on the
market in China in the third quarter of 2016. The Phideon 3.0 TSI
4MOTION all-wheel drive is equipped with a 220 kW (300 PS) V6
engine. A 2.0 TSI saloon with front-wheel drive will also be available,
and a plug-in hybrid model is planned. Volkswagen Passenger Cars rounded off its presentation at the motor show with the BUDD-e, a
show car whose appearance is inspired by the legendary VW Bus.
The vehicle was created based on a new technology matrix for
electric vehicles – the Modular Electrification Toolkit (MEB). The
BUDD-e has a range of more than 500 km. Just 30 minutes of
charging replenishes 80% of the battery power. Inside, touch and gesture control combine seamlessly to replace traditional switches
and buttons. Individual displays merge into large infotainment
panels and mirrors are replaced by digital screens.
Audi used Auto China 2016 to underscore its role as a leading
premium supplier, celebrating the world premiere of the new
Audi TT RS Coupé and the Audi TT RS Roadster in Beijing. The new five-cylinder engine in the TT RS generates an impressive 294 kW
(400 PS). Together with the quattro drive system, it ensures a fun,
sporty driving experience with maximum traction. The TT RS Coupé
can accelerate from 0 to 100 km/h in 3.7 seconds, and the Roadster
in 3.9 seconds – a super sports car-level performance. The TT RS is the first Audi production model to offer tail lights featuring matrix
OLED technology as an option. These emit a highly uniform, high-
contrast light. Another highlight was the presentation of the new
Audi A4 L with extended wheelbase. Passengers in the 4.81-meter-
long mid-class saloon travel in premium-level comfort in a spacious
interior. Audi has considerably reduced the vehicle’s kerb weight by up to 110 kg compared with its predecessor. The A4 L offers
intelligent technologies such as the Audi virtual cockpit, numerous
driver assistance systems and Matrix LED lights with dynamic
indicators. Alongside the production models, Audi also used Beijing
to showcase its innovative Audi connected mobility concept. The
vehicle is based on the new Q3, which will launch on the Chinese market this year. It is specially tailored to markets with growing
levels of urbanization such as China, and offers sporty, multi-
functional mobility for megacities. The rear bumper contains an
electric-powered, 1.05-meter longboard scooter. The infotainment
system connects to the user’s smartphone and calculates the fastest
mobility mix for the destination and planned arrival time using real-time traffic information. The system recommends that the driver
continues the journey by the electric longboard if this is the quickest
way to reach the destination.
ŠKODA’S VisionS SUV study celebrated its Chinese premiere in
Beijing. The vehicle’s expressive, modern and dynamic design offers
ŠKODA’s typical balance of rationality and aesthetics. In addition to revealing the brand’s future SUV design language, the VisionS
features the key technologies on which ŠKODA will be focusing in
the coming years: electromobility, connectivity and safety. The show
car was accompanied by six production models from the Czech
brand. ŠKODA will press ahead with its model rollout in China in
the coming years. Bentley attracted plenty of attention at the motor show, espe-
cially with the world premiere of the Mulsanne First Edition. The
Mulsanne family comprises three models. Bentley will produce just
50 First Edition cars, distinguished by highly exclusive features
including a Mulliner-styled picnic table and crafted English walnut
veneer. Just a few weeks after the premiere of the 718 Boxster, the
718 Cayman made its debut in Beijing. The fourth, newly developed
generation of Porsche’s mid-engined sports coupé is even more eye-
catching, sporty and efficient. The taut proportions, prominent air
intakes at the front and sides and low side profile highlight the
boost in performance and give the vehicle a muscular appearance. The 718 Cayman uses the same new flat four-cylinder, turbocharged
engines as the 718 Boxster. The entry model offers 221 kW (300 PS)
from a 2.0 l engine; the 2.5 l S model supplies 257 kW (350 PS).
Key Events

U P D AT E D I N F O R M AT I O N
Key Events
3
Lamborghini presented its expanded Huracán family. The Huracán
LP 580-2 has been engineered and tuned for an essential driving experience. Its naturally aspirated 5.2 l V10 engine sends 427 kW
(580 PS) to the rear axle. The vehicle weighs just 1,389 kg.
Alongside the rear-wheel drive version, Lamborghini exhibited the
Huracán LP 610-4 Avio, which is limited to a run of only 250 units.
Its lightweight chassis is made of aluminum and carbon fiber. The
naturally aspirated 5.2 l V10 engine delivers 449 kW (610 PS) and accelerates the LP 610-4 Avio from 0 to 100 km/h in just
3.2 seconds. The maximum speed is 325 km/h. The open top version
of the Huracán LP 610-4 combines the power and performance of
the coupé with the thrill of open-air driving. The Huracán Spyder
stands for inspiration, outstanding quality and breathtaking per-
formance. It is an icon of the super sports car manufacturer in its own right.
World premiere of the new Audi A5 Coupé
In June 2016, Audi celebrated the world premiere of the new Audi
A5 Coupé, which offers a chassis that has been newly developed
from scratch as well as innovative infotainment functions and driver assistance systems. Powerful six-cylinder engines with
outputs ranging between 140 kW (190 PS) and 210 kW (286 PS)
ensure greater driving pleasure and efficiency. Inside the vehicle,
the Audi virtual cockpit and the Audi connect module offering a fast
LTE Internet connection impress customers.
Wörthersee GTI Meet
The GTI fan community got together for the 35th GTI meet at
Wörthersee in Austria in May 2016, where they also celebrated the
40th birthday of Volkswagen’s cult sports car. The Golf GTI entered
the market in 1976 and democratized sporty driving. If all gener-
ations of the Golf GTI are counted together, the total number sold has long passed the two million mark. The star of the event in
Austria was the Golf GTI Clubsport S, of which just 400 cars will be
built. Delivering 228 kW (310 PS), this is the most powerful Golf that
Volkswagen has ever brought to market. The vehicle, equipped with
a heavily modified suspense, has already proven its potential on the
Nürburgring’s Nordschleife (North Loop), where it set a new record for a front-wheel-drive production car. Vocational trainees from
Volkswagen’s plants in Wolfsburg and Zwickau traditionally present
unique vehicles on stage at the GTI meet. This year, the Wolfsburg
team brought the 295 kW (400 PS) GTI Heartbeat. The vehicle
makes a strong impact thanks to its fantastic engine sound, con-
trasting color scheme with honeycomb design and heartbeat symbols, and a 1,360-watt sound system with seven speakers. The
trainees from Zwickau celebrated the 35th Wörthersee meet with
the 247 kW (350 PS) Golf R Estate Performance.
Vienna Motor Symposium
The 37th Vienna Motor Symposium saw Volkswagen present the EA 211 TSI evo – the latest generation of petrol engines. The first in
this series, released on the market in late 2016, will be the powerful
yet efficient 1.5 l TSI engine, available initially with power outputs of
96 kW (131 PS) and 110 kW (150 PS). A key innovation is the
exhaust gas turbocharger with variable turbine geometry; a first for
a mass-production petrol engine. The efficient powertrain also uses the Miller combustion cycle featuring a high compression ratio, the
common rail injection system with up to 350 bar pressure,
innovative thermal management, cylinder deactivation and specially coated cylinders so that the piston rings glide smoothly with low
friction and little wear.
bauma 2016
Scania presented numerous products from its Scania Trucks, Scania Mining and Scania Engines business divisions at bauma
2016 in Munich – the leading trade fair for construction machinery.
One focus was on efficient construction site vehicles, and a 6x6 all-
wheel-drive dump truck for use in underground and surface mining
was also on show. The Swedish commercial vehicle brand always
seeks to offer its customers intelligent vehicle solutions and the best possible value for money. It does so by combining robust products
with networked services.
The MAN brand showcased its expertise in construction sector
vehicles with a wide range of exhibits. One of the highlights was the
two-axle MAN TGS tractor for semitrailer with HydroDrive, an engage-
able, hydrostatic front-axle drive. MAN introduced this new type of drive technology to the market in 2005 in order to increase traction
when needed and improve braking performance on unsurfaced
slopes. It has constantly enhanced HydroDrive ever since. Other
advantages of MAN HydroDrive include a weight saving of
500-750 kg over conventional all-wheel drive as well as lower fuel
consumption.
AWA R D S
No fewer than four models from the Volkswagen Passenger Cars
brand took first place in the 2016 Plus X Award for innovation. The
new Tiguan and new Touran won the categories for high quality,
design, ease of use and functionality. The vehicles were chosen as Compact SUV and Compact MPV of the Year 2016/2017 respectively.
The Phideon was crowned Premium Saloon of the Year 2016/2017
and the T-Cross Breeze awarded Automotive Concept Vehicle of the
Year 2016/2017. The innovation awards go to technology, sport and
lifestyle products and the winners are chosen by an international
jury drawn from 25 industries. The Volkswagen Passenger Cars brand’s BUDD-e show car was
recognized at the Automotive Interiors Expo 2016 for its intuitive
controls and novel, lounge-style interior. The competition jury is
made up of 17 leading international automotive and design jour-
nalists.
For the seventh time in a row, the Audi brand took first prize in the International Engine of the Year Award in the 2 to 2.5 l engine
category. Among the qualities that impressed the jury were the
2.5 l TFSI engine’s top performance and its sound, which is remi-
niscent of the Group B rally car engines of the 1980s.
Several Volkswagen Group brands scored highly in the readers’
choice awards by the Auto Bild Allrad all-wheel-drive motoring magazine. Readers voted in a total of ten categories for the all-
wheel-drive car of the year. The Tiguan from the Volkswagen Pas-
senger Cars brand won the all-terrain and SUV category for vehicles
up to €30,000. Audi took the top spot in the all-wheel-drive cross-
over category with the Audi A4 allroad quattro. The brand’s A6 won
the category for all-wheel-drive cars priced at over €40,000. For the second time in a row, the ŠKODA Superb 4x4 won in the import
category for all-wheel-drive cars priced at up to €40,000. The

U P D AT E D I N F O R M AT I O N
Key Events
4
magazine’s readers chose the T6 Multivan from Volkswagen Com-
mercial Vehicles as the top MPV, while the SEAT Alhambra took the award in the import category. In the all-wheel-drive sports cars,
coupés and convertibles category, the Porsche 911 was the overall
winner, while Lamborghini’s Huracán was crowned top import.
Firmenauto magazine’s company car awards saw impressive
results for as many as four Volkswagen Group brands. Some 250
fleet managers tested 82 different models in 12 categories and completed 2,043 test drives covering a total of more than 50,000
km. Audi’s A3 was the winner in the compact class, the A4 in the
mid-size class and the A6 in the upper mid-size class. The Volks-
wagen Passat came a strong third in the mid-size class. In the
import rankings for minicars and minivans, the SEAT brand took
the first two places with the Mii and Alhambra. The Sharan from Volkswagen Passenger Cars won the overall ranking for large MPVs.
Audi was the top-ranked brand in the category of good service for
fleet customers. Volkswagen Financial Services AG was awarded
first prize for leasing and fleet management.
Two Volkswagen Group brands won accolades at the Auto-
motiveINNOVATIONS Award 2016. Volkswagen Passenger Cars was recognized as the most innovative high-volume brand in 2016. The
jury pointed, among other things, to the 89 innovations and 15
world debuts presented by Volkswagen during the award period.
They singled out the new Tiguan and Touran models and the
Sharan. Volkswagen also took the top spots in the conventional
drive systems and connected car categories. The Audi brand won the main prize for the most innovative premium brand as well as
further awards for innovations in the connected car and vehicle
concepts/body categories. The Center of Automotive Management
presents the accolades each year in cooperation with audit and
consulting firm, PricewaterhouseCoopers. It examined more than
1,400 innovations from 20 carmakers and 50 brands. Bentley’s Bentayga was the SUV of the year in this year’s Robb
Report. In their Best of the Best Awards, Robb Report’s editorial
team produce a ranking of luxury-segment products.
Scania received the “Green Truck Future Innovation 2016”
environmental award in the category of promising innovations for
its hybrid module for distribution trucks. The accolade is awarded by Verkehrsrundschau and Trucker magazines. The 320 PS hybrid
truck achieves fuel savings of up to 18% compared with normal
diesel-powered vehicles. It can operate in electric mode alone, or
the electric power can be combined with pure biodiesel.
This year’s dealer satisfaction survey conducted by the market
research institute Schwacke saw renewed success for ŠKODA. For the second time in a row, the brand came first in the major importer
category in Germany. The SchwackeMarkenMonitor survey is
based on almost 1,000 interviews conducted by puls Marktfor-
schung GmbH with owners and managers of authorised vehicle
dealerships. It includes 37 criteria such as used car guarantees, the
supply system for parts and accessories and the competence of sales representatives.
Audi’s “Actively tackling cancer” screening plan won this year’s
Felix Burda Award in the workplace health checks category. Health protection at Audi impressed the jury with its intelligent combi-
nation of campaigns, individual screening and the latest diagnosis
techniques.
A N N I V E R S A R I E S
The Czech brand ŠKODA celebrated two important anniversaries in the reporting period. Steeped in tradition, the automobile manu-
facturer has now been part of the Volkswagen Group for 25 years
and has transformed itself over this period from a regional market
leader into an internationally successful business. When the
collaboration between Volkswagen and ŠKODA began, the brand
sold just one model and approximately 170,000 vehicles a year. Today, that has grown to six model series with more than 40 variants.
These are produced at 14 locations and sold in over 100 markets.
They include the brand’s top-selling model, the ŠKODA Octavia,
which celebrated its 20th birthday in April 2016 and has now sold
more than 5 million vehicles.
Volkswagen Slovakia’s Bratislava site has been part of the Volkswagen Group’s production system for 25 years. The product
portfolio at the plant, which produces multiple brands, currently
includes SUV models from Volkswagen Passenger Cars, Audi and
Porsche, as well as Volkswagen Passenger Cars, SEAT and ŠKODA
vehicles based on the New Small Family platform. Since the facility
opened in 1991 it has produced more than 4.5 million vehicles and some 7 million gearboxes.
The Volkswagen plant in Kassel produced its 125 millionth
transmission in May 2016, a DQ500 dual clutch gearbox used in the
Tiguan, Passat, Audi Q3, Audi TT and other models. The trans-
mission plant in Kassel currently employs 6,500 staff. Customers
include 34 vehicle production plants in 14 countries. In June 2016, Volkswagen Commercial Vehicles celebrated 60
years of its headquarters in Hanover, where the Company has manu-
factured some 9.5 million vehicles since 1956. The Multivan/Trans-
porter and Amarok are currently rolling off the production line, and
the site also produces components. With more than 14,000 staff
members, it is one of the Hanover region’s largest employers.
VO L K SWA G E N G R O U P L AU N C H E S N E W V I S I O N :
TO G E T H E R – ST R AT E G Y 2 0 2 5
Volkswagen announced the first details of its new Group strategy
“TOGETHER – Strategy 2025” on June 16, 2016, ushering in the
greatest process of change the Company has ever seen. The major realignment is concentrated on transforming the core automotive
business and tapping potential new revenue sources. This will
involve developing further core competencies such as battery
technology, digitalization and autonomous driving, as well as
intensifying the focus on profitable growth. At the same time, the
Company will rely to a greater extent than before on partnerships and venture capital investments.

U P D AT E D I N F O R M AT I O N
Key Events
5
Transforming the core business for the new age of mobility is the
first pillar of TOGETHER – Strategy 2025. For this, Volkswagen will sharpen the positioning of the Group brands and optimize the
vehicle and drivetrain portfolio to reflect regional market and
customer requirements, concentrating on the most attractive and
fastest-growing market segments. One focus is on e-mobility, where
a broad-based initiative is planned. The regional growth strategy
will continue in particularly attractive automotive markets. Expan-sion and investment plans for North America and the expansion
program in China will remain in place. Collaboration with regional
partners is being sought in the economy segment, particularly in
Asia. The modular toolkits are being revised and streamlined to
reduce their complexity in development and production and
increase efficiency. Implementing a model line organization in the brands will lead to a stronger focus on results. The components
business will be realigned. This will improve competitiveness and
efficiency, making important contributions to future trends.
Another important lever of the strategy is to establish new core
competencies in forward-looking areas such as battery technology,
autonomous driving and artificial intelligence. The aim is to gain a license for a self-driving system developed in-house for fully auton-
omous vehicles. At three Volkswagen Group Future Centers in
Germany, the USA and China, designers and digital experts will
work together on the car of the future so that the Group can offer the
best possible customer experience and make optimum use of the
latest technologies. The Commercial Vehicles Business Area will also resolutely pursue future topics, developing into an intelligent
transport solution provider. Offering vehicles under several dif-
ferent brands, Volkswagen Truck & Bus is to become a global
industry champion with a significant presence in all key regions of
the world and an improved overall performance. Under the stra-
tegic realignment of the Volkswagen Group, the Financial Services Division will continue to support the brands’ business models and
remain an important source of revenue.
The second key pillar of the new Group strategy is the estab-
lishment of a new cross-brand mobility solutions business. The
cornerstone and starting point of the new business unit will be the
provision of on-demand mobility. The unit will subsequently develop and acquire further services tailored to customer require-
ments, such as robotaxis, carsharing, or on-demand transport for
the logistics industry.
By driving forward the digital transformation already underway,
the Group will further boost its power to innovate. This will involve
operational aspects such as Industry 4.0 in production and logistics or digitalization in sales. The Organization 4.0 initiative will also
create a modernized, more attractive work organization.
Funding for investments as part of the new Group strategy will
be achieved primarily through efficiency gains across all brands,
business areas and functions. In the automotive business, Volks-
wagen is aiming for a ratio of capex to sales revenue of 6% by 2025, and a similar ratio for research and development expenditure to
sales. The Group aims to reduce distribution and administrative
expenses to less than 12% of sales revenue. Additional funds for
future investments may also be generated by optimizing the existing portfolio of brands and equity investments. A sustained increase to
between 7% and 8% in the Group’s operating return on sales is
envisaged by 2025. A return on investment (ROI) of over 15% is
planned for the Automotive Division. The distribution ratio to
shareholders is to be sustained at around 30% of net profit.
CO O P E R AT I O N A N D I N V E STM E N T S
In April 2016, Volkswagen signed a cooperation agreement with
Singularity University in California’s Silicon Valley. The aim of the
collaboration is to make even better use of the opportunities of the
digital transformation by improving the connections between high-
tech start-ups, managers, researchers and inventors. In May 2016, Volkswagen agreed a strategic partnership with
the international ride-hailing service GETT, making a USD 300
million investment in that company. GETT is a leading provider of
on-demand mobility services in the European market and is active
in more than 60 cities worldwide including London, Moscow and
New York. In addition to passenger transportation, the company also offers innovative delivery and logistics services. The two partner
companies plan a further roll-out of these mobility services across
Europe as part of an expansion strategy. The technology deployed
uses big data, innovative forecasting algorithms and artificial
intelligence, and can also serve as a basis for developing further
mobility-related business models. The Volkswagen Group also acquired a stake in the German
Research Center for Artificial Intelligence (DFKI) in May 2016,
thereby intensifying its investment in research on digital tech-
nologies of the future. Artificial intelligence is a key technology for
autonomous driving and the digital factory. Together with the DFKI,
Volkswagen plans to redouble its efforts in this field in future and advance artificial intelligence outside the automotive industry, too.
The DFKI also specializes in robotics, Industry 4.0 and driver
assistance systems. Volkswagen will have a seat on the DFKI Super-
visory Board and actively help to shape the center’s technology and
research strategy.
MAN Truck & Bus AG invested in the logistics company FR8 Revolution Inc. in May 2016 in order to play an active part in the
digital transformation and integration of the logistics industry. The
US-based company has developed software that offers a standard-
ized and transparent platform for shippers, transport companies
and truck drivers to plan loads based on real-time data. The system
provides all parties with continuous information on the position of trucks, available capacity, drivers’ time behind the wheel and rest
periods, and up-to-date freight rates.
D I E S E L I S S U E
Volkswagen reaches certain settlement agreements
In June 2016, Volkswagen publicly announced that Volkswagen AG, Volkswagen Group of America, Inc. and certain affiliates had reached
settlement agreements in the USA with the U.S. Department of

U P D AT E D I N F O R M AT I O N
Key Events
6
Justice, the U.S. Environmental Protection Agency (EPA), the U.S.
Federal Trade Commission, the California Air Resources Board (CARB) and private plaintiffs represented by a Plaintiffs’ Steering
Committee (PSC) in the Multi-District Litigation pending in Cali-
fornia. The settlement agreements, if finally approved, will resolve
certain civil claims made in relation to affected diesel vehicles with
2.0 l TDI engines from the Volkswagen Passenger Cars and Audi
brands in the USA. The settlement agreements are subject to final court approval.
The proposed settlements provide affected customers with the
option of a buyback or, for leased vehicles, early lease termination or
a free technical modification of the vehicles, provided that EPA and
CARB approve the appropriate modification measures. Volkswagen
will also make cash payments to affected owners and lessees. Volkswagen also agreed to support environmental programs.
The company will pay USD 2.7 billion over three years into an
environmental trust, managed by a trustee appointed by the court,
to offset excess nitrogen oxide (NOx) emissions. Volkswagen will also
invest in total USD 2.0 billion over 10 years in zero emissions vehicle
infrastructure as well as corresponding access and awareness initiatives.
Volkswagen also reached separate settlement agreements with
the attorneys general of 44 US states, the District of Columbia and
Puerto Rico, to resolve their existing or potential consumer pro-
tection and unfair trade practices claims – in connection with both
2.0 l TDI and 3.0 l TDI vehicles in the USA – for a settlement amount of USD 603 million.
These settlements do not resolve the civil claims by the DOJ, FTC
and private plaintiffs represented by the PSC related to 3.0 l TDI
vehicles, civil penalties sought by the DOJ on behalf of the EPA,
potential state environmental claims related to the 2.0 l and 3.0 l TDI
vehicles, any criminal investigations by the DOJ, as well as certain other claims.
US lawsuits alleging claims for civil environmental penalties
On July 19, 2016, the US states Maryland, Massachusetts and New
York filed complaints in their respective state courts against Volks-
wagen AG, Volkswagen Group of America, Inc. and certain affiliates seeking civil penalties and injunctive relief for alleged violations of
environmental laws. Maryland, Massachusetts and New York par-
ticipated in the state settlements described above with respect to
consumer protection and unfair trade practices claims, but those
settlements did not include claims for environmental penalties.
German Federal Motor Transport Authority approves technical
solutions
In the first half of 2016, the Kraftfahrzeug-Bundesamt (KBA –Ger-
man Federal Motor Transport Authority) approved the technical
solutions for more than 3.7 million Volkswagen Group vehicles
fitted with EA 189 2.0 l TDI engines. For the Volkswagen Passenger Cars brand, modification of models in the Tiguan, Passat, Golf and
Touran series, among others, has now been approved. The recall
process has also begun at Audi. The KBA has issued approvals for a
series of model A4, A3, Q3 and Q5 vehicles. The SEAT, ŠKODA and
Volkswagen Commercial Vehicles brands have also begun modi-
fying vehicles. The KBA has issued unqualified confirmation, for the vehicles
approved so far, that fuel consumption, performance figures and
noise emissions are unaffected by the modifications. Following
implementation of the technical solutions, these vehicles will
therefore fulfill all legal requirements.
A N N UA L G E N E R A L M E E T I N G
The 56th Annual General Meeting of Volkswagen AG was held at the
Hanover Exhibition Center on June 22, 2016. The ordinary share-
holders of Volkswagen AG accepted the proposal of the Board of
Management and the Supervisory Board to pay a dividend of €0.11
per ordinary share and €0.17 per preferred share with a majority of 99.98%. With over 90% of the voting capital present, they formally
approved the actions of the Board of Management and Supervisory
Board.
The ordinary shareholders of Volkswagen AG also elected Price-
waterhouseCoopers AG Wirtschaftsprüfungsgesellschaft (PwC) as
the auditors for the single-entity and consolidated financial state-ments for fiscal year 2016 and as the auditors to review the
condensed consolidated financial statements and interim manage-
ment report for the first six months of 2016, for the period up to
September 30, 2016 and for the first quarter of fiscal year 2017.
The Annual General Meeting also rejected the motions added to
the agenda concerning the appointment of a special auditor in accordance with section 142(1) of the Aktiengesetz (AktG – German
Stock Corporation Act) as well as the further motions raised in the
course of the meeting.
Ms. Annika Falkengren’s scheduled term of office and the terms
of office of the court-appointed members of the Supervisory Board
– Dr. Louise Kiesling and Mr. Hans Dieter Pötsch – expired at the end of the Annual General Meeting. The Annual General Meeting
elected all three members to a full term of office in the Supervisory
Board. Mr. Akbar Al Baker, likewise a shareholder representative
on the Supervisory Board of Volkswagen AG, stepped down from his
office with effect from the end of the Annual General Meeting. The
Annual General Meeting elected Dr. Hessa Al-Jaber, representing the Qatar Investment Authority (QIA), to replace him for the
remainder of his term of office. With Ms. Al-Jaber, Ms. Falkengren
and Ms. Kiesling, three of the ten shareholder representative seats
on the supervisory body are filled by women.

I N T E R I M M A N A G E M E N T R E P O R T
Volkswagen Shares
7
Prices on the international stock markets continued their volatile sideways movement in the second quarter of 2016. The DAX
recorded a decrease.
Concerns about an appreciation of the euro and deteriorating
corporate data from Germany caused prices to decline at the
beginning of the second quarter. The German benchmark index
staged a temporary recovery in mid-April on the back of the rising oil price, which is usually regarded as a positive indicator for global
economic growth, and favorable economic data from China. May
saw prices move sideways before rising late in the month, buoyed by
further oil price increases. Despite uncertainty over the United
Kingdom’s continued membership of the European Union (EU), the
DAX was propped up for a time in June by hopes that the US Federal Reserve would continue its loose monetary policy. The referendum
at the end of June, which resulted in the British public voting to
leave the EU, led to sharp falls in stock prices.
The DAX closed the first half of 2016 at 9,680 points, down
9.9% on year-end 2015. The EURO STOXX Automobiles & Parts
stood at 406 points at the end of the reporting period, down 25.1% on the 2015 closing price.
In the period from April to June 2016, Volkswagen AG’s pre-
ferred and ordinary shares followed the market trend, which saw a
decline overall. This was due to speculation about the impact of the
emissions issue in addition to general economic data. In April,
prices stabilized following the news that an agreement in principle in connection with the diesel issue had been reached in the USA, as
well as the publication of the Volkswagen Group’s annual report. In
a market environment dominated by uncertainty, prices were
shored up in June by the presentation of the new “TOGETHER
Strategy 2025” at a press conference and the announcement that
Volkswagen had reached settlement agreements in the USA. On May 30, 2016, Volkswagen AG’s preferred shares hit their
highest daily closing price for the first six months of the year at
€137.95. They recorded their lowest closing price for the January to
June 2016 period of €94.00 on February 11, 2016. The preferred
shares ended the last day of trading in the first half of the year at
€108.30, down 19.0% on the 2015 closing price. Volkswagen’s ordinary shares registered their highest daily closing price for the
reporting period on April 28, 2016 at €141.85. Their lowest closing
price was €108.95 on February 11, 2016. On June 30, 2016, the
ordinary shares closed the period at €120.40, down 15.4% on the
2015 year-end price.
Information and explanations on earnings per share can be found in the notes to the interim consolidated financial statements.
Additional Volkswagen share data, plus corporate news, reports
and presentations can be downloaded from our website at
www.volkswagenag.com/ir.
50
80
110
140
D J F M A M J J A S O N D J F M A M J
50
80
110
140
Volkswagen ordinary sharesVolkswagen preferred shares
DAXEURO STOXX Automobiles & Parts
Volkswagen ordinary sharesVolkswagen preferred shares
DAXEURO STOXX Automobiles & Parts
S H A R E P R I C E D E V E L O P M E N T F R O M D E C E M B E R 2 0 1 4 T O J U N E 2 0 1 6
Index based on month-end prices: December 31, 2014 = 100
Volkswagen Shares

I N T E R I M M A N A G E M E N T R E P O R T
Business Development
8
G E N E R A L E CO N O M I C D E V E L O P M E N T
The global economy recorded moderate growth in the first six
months of 2016, although momentum slowed slightly in both the
industrialized nations and emerging economies compared with
2015 as a whole. The relatively low energy and commodity prices
weighed on the economies of individual exporting countries that
depend on them. In Western Europe, the economic recovery continued in the
reporting period. Whereas the Northern European countries
recorded solid economic growth overall, growth rates in Southern
Europe presented a more mixed picture. A drastic effect resulted from
the UK’s Brexit referendum in June 2016, when a small majority
voted to leave the EU. The direct consequences of this were uncer-tainty in the financial markets and dimmer economic prospects for
the United Kingdom and Europe as a whole.
The German economy continued to benefit from positive con-
sumer sentiment and the strong labor market, continuing its
growth trajectory in the first six months of 2016.
The positive economic trend in Central Europe continued in the reporting period. The ongoing conflict between Russia and
Ukraine and low energy prices had a generally negative effect on the
situation in Eastern Europe. Russian economic output continued to
decline year-on-year.
In the first six months of 2016, South Africa suffered from a severe drought, structural deficits and political upheaval; this had a
dampening effect on gross domestic product (GDP).
The US economy continued to expand between January and
June 2016, albeit more slowly. Significant stimulus was provided by
private consumer spending, whereas exports and private capital
investments recorded weak growth. In Canada, the rate of expan-sion reached the comparatively low level of the previous year; by
contrast, the Mexican economy grew at a faster pace than in the
preceding quarters.
Brazil’s economy remained in deep recession in the first six
months of 2016. Weak domestic demand, relatively low global
commodity prices and political uncertainty weighed on economic performance. Economic output in Argentina retreated in the face of
persistently high inflation.
The Chinese economy slowed slightly in the first six months of
2016, primarily as a result of ongoing structural changes, but
continued to see a high rate of expansion by global standards. The
Indian economy sustained its positive trend, growing at a somewhat stronger pace than in the previous year. Japanese GDP rose slightly,
and growth was largely stable in the ASEAN region.
E X C H A N G E R A T E M O V E M E N T S F R O M D E C E M B E R 2 0 1 4 T O J U N E 2 0 1 6
Index based on month-end prices: as of December 31, 2014 = 100
D J F M A M J J A S O N D J F M A M J
70
80
90
100
110
70
80
90
100
110
EUR to GBPEUR to USDEUR to CNYEUR to JPY
EUR to GBPEUR to USDEUR to CNYEUR to JPY
Business Development

I N T E R I M M A N A G E M E N T R E P O R T
Business Development
9
T R E N D S I N T H E PA S S E N G E R C A R M A R K E T S
Global new passenger car registrations were up 3.1% compared with the prior-year period in the first six months of 2016, although
market trends varied from region to region. Demand rose year-on-
year in the Asia-Pacific region, Western Europe, North America and
Central Europe, while new registrations in South America and
Eastern Europe, as well as the Middle East and Africa, were lower
than in the first six months of 2015. The Western European passenger car market continued to
recover between January and June 2016 and recorded significant
growth. The region continued to profit in particular from the posi-
tive macroeconomic environment, low interest rates, low fuel prices,
pent-up demand for replacement vehicles and manufacturers’
incentive programs. The Italian and Spanish markets saw double-digit growth rates. By contrast, the increase was less pronounced in
France and the United Kingdom.
The new passenger car business also recorded positive growth
in Germany in the first six months of 2016. Lifted by higher real
incomes and the strong labor market, new registrations for busi-
ness customers continued to increase, while purchases by private buyers rose for the first time in four years.
Demand for passenger cars in Central and Eastern Europe
declined in the reporting period, although trends in the individual
markets were very mixed. Whereas passenger car sales in the
Central European EU countries mainly recorded high growth rates,
demand continued to decline in Eastern Europe. As a result of the continuing weak economic and politically tense situation, the
Russian passenger car market in particular recorded further strong
losses.
The downward trend in new passenger car registrations
continued in South Africa. In addition to the weak macroeconomic
environment, this was due above all to low consumer confidence and high interest rates.
The North American automotive market recorded further year-
on-year growth between January and June 2016. Sales figures for
passenger cars and light commercial vehicles (up to 6.35 tonnes) in
the USA reached their highest level for a first half-year period since
2001. The primary drivers of the still stable unit sales were in particular strong consumer confidence, the sound employment
situation, financing conditions that continue to be attractive and
low fuel prices. Vehicles in the SUV, pickup and van segments were
the main beneficiaries of the favorable conditions. By contrast,
demand for notchback and hatchback saloons was again lower than
the year before. The automotive markets in Canada and Mexico also expanded, in each case reaching new highs for a first half-year
period.
The markets for passenger cars and light commercial vehicles
in the South American region continued to contract sharply overall
in the first six months of 2016. The main cause of this trend was the
collapse in demand in Brazil to its lowest level since 2006. The ongoing recession, coupled with high unemployment, falling real
incomes and restrictive lending policies were the main reasons
behind the continued crisis affecting unit sales. By contrast, new
vehicle registrations in Argentina increased compared with the
comparatively low prior-year level. This uptick in demand was
supported by rebates and attractive financing conditions offered by the manufacturers.
Overall passenger car market volumes in the Asia-Pacific region
recorded the strongest absolute growth in the first six months of
2016. By far the highest increase in sales was recorded in China.
The tax break introduced on October 1, 2015 on purchases of vehi-
cles with engine sizes of up to 1.6 l again had a positive effect, as did the sustained high demand for attractively priced entry-level
models in the SUV segment. Passenger car sales in India rose year-
on-year in the reporting period. The positive trend was attributable
in particular to ongoing economic growth, low oil prices and a large
number of new models. In Japan, the number of new passenger car
registrations declined further in the first six months of 2016. However, the downward trend diminished significantly in the
second quarter since the prior-year level was already weaker
because of the tax increase on mini vehicles (up to 660 cm³) that
took effect on April 1, 2015.
Malaysia, one of the largest markets in the ASEAN region,
recorded a year-on-year decline in the reporting period.
T R E N D S I N T H E M A R K E T S F O R CO M M E R C I A L V E H I C L E S
Global demand for light commercial vehicles was up slightly on the
previous year’s level in the first six months of 2016.
New registrations increased markedly year-on-year in Western
Europe on the back of the positive economic performance. Demand in Germany saw moderate growth in the reporting period com-
pared with the 2015 comparative period.
Registrations of light commercial vehicles in Central and East-
ern Europe recorded a noticeable increase compared with the
previous year. Sustained political and economic tensions in Russia
caused a moderate drop in registrations there in the period from January to June 2016.
In North and South America, the light vehicle market is reported
as part of the passenger car market, which includes both passenger
cars and light commercial vehicles.
In the Asia-Pacific region, demand for light commercial vehi-
cles was distinctly higher than in the previous year. Registration volumes in China, the region’s dominant market, were up year-on-
year. The number of new vehicle registrations in India recorded a
sharp increase compared with the year before. Japan saw a decline
in new registrations. Vehicle registrations in the ASEAN region were
on a level with the previous year.
Global demand for mid-sized and heavy trucks with a gross weight
of more than six tonnes increased year-on-year in the period from
January to June 2016.
The positive economic trend in Western Europe resulted in a
significant increase in demand; high growth rates in new regis-
trations were recorded in Italy, France and the Netherlands. New registrations in Germany, the largest market in Western Europe,
were up noticeably on the prior-year level in the first six months of
2016. Higher investments and a slight increase in exports had a
positive effect on the sector.

I N T E R I M M A N A G E M E N T R E P O R T
Business Development
10
In the Central and Eastern European markets, the number of new
vehicle registrations was up significantly year-on-year. While the region’s economic performance was positive on the whole, the
tense economic and political situation, the currency weakness and
difficult financing conditions in Russia resulted in a year-on-year
decline in demand.
The slowdown in US economic growth impacted the truck
market in North America: following high growth rates in 2015, vehicle registrations were down slightly on the previous year. Regis-
tration volumes in the US market were also down slightly on the
previous year’s level in the first six months of 2016.
New registrations declined substantially year-on-year in South
America. In Brazil, the region’s largest market, demand for trucks
was down considerably on the prior-year level as a result of the persistently weak economic performance and the high inflation
rates. The number of new vehicle registrations in Argentina fell
sharply between January and June 2016 because of pull-forward
effects in 2015 attributable to the introduction of the Euro 5 emis-
sion standard.
Demand for mid-sized and heavy trucks in the Asia-Pacific region (excluding the Chinese market) increased significantly year-
on-year. India saw a continuation of the positive economic trend in
the first six months of 2016. Demand for replacement vehicles and
an improvement in the investment climate led to a significant
increase in registration volumes there. Registrations in the world’s
largest truck market, China, rose appreciably compared with the weak prior-year level.
Demand for buses in the markets that are relevant for the
Volkswagen Group was down significantly on the previous year in
the first six months of 2016.
T R E N D S I N T H E M A R K E T S F O R P O W E R E N G I N E E R I N G
The markets for power engineering are subject to differing regional
and economic factors. Consequently, their business growth trends
are generally independent of each other.
In the first six months of 2016, the marine market saw an
intensification of the muted order activity that had already been
noticeable during the course of 2015. Due to the excess capacity in the market, which pushed down freight rates in the transport sector,
there was no sign of a recovery in the market segments affected:
container ships, tankers and bulk carriers. Demand for cruise ships,
passenger ferries and government vessels nevertheless continued
on a growth path. The slight increase in the oil price recently has
not yet had a positive effect on the offshore ship market. The market for power generation was stable at a low level
compared with the prior-year period. Demand for energy solutions
remained high, with a strong trend towards greater flexibility and
decentralized availability. The shift away from oil-fired power plants
towards dual-fuel and gas-fired power plants continued. Particu-
larly on larger projects, order placement is being delayed, in some
cases significantly, due to sustained muted economic growth in key emerging and developing countries and persistently difficult
financing conditions for customers.
Activity in the construction of turbomachinery is mainly domi-
nated by global investment projects in the oil, gas and processing
industry and in power generation. Compared with the prior-year
period, the turbomachinery market as a whole once again experi-enced marginal decline at a low level. Project volumes in the oil and
gas industry remained at a low level owing to the sharp falls in the
oil price. The moderate increase in the oil price over recent months
has not yet led to a recovery in the turbomachinery business either.
Demand in the processing industry and in power generation was
also weak overall in the first half of 2016. As a result, pressure through competition and pricing increased again.
The after-sales market performed positively overall. In partic-
ular, the marine and power plant after-sales business with diesel
engines benefited from an increased interest in long-term main-
tenance contracts.
D E M A N D F O R F I N A N C I A L S E RV I C E S
Demand for automotive financial services remained high in the
first six months of 2016, with the year-on-year expansion of the
overall market for passenger cars providing slight impetus for
growth.
In Europe, the market for automotive financial services bene-fited from the higher vehicle sales particularly in Western Europe.
This offset the negative effects from the continued decline in unit
sales volumes in Russia. The share of financed or leased new
vehicles remained at a high level; the positive trend in demand for
insurance and after-sales products such as inspection contracts,
maintenance and spare parts agreements also continued in the second quarter.
In Germany, demand for automotive financial services once
again exceeded the level in the prior-year period. The business
customer segment was the main driver; in particular, demand in
the after-sales area rose significantly for products such as
inspection contracts as well as maintenance and spare parts agree-ments.
In South Africa, demand for insurance and after-sales products
was stable.
Demand for automotive financial services products, particu-
larly leasing, remained high in the US market. In Mexico, demand
for financial services products rose compared with the previous year. The macroeconomic and political situation in Brazil remained
tense. The further deterioration in conditions there had a
correspondingly negative impact on the consumer credit business
for new vehicles and on sales of the country-specific financial
services product Consorcio, a lottery-style savings plan.

I N T E R I M M A N A G E M E N T R E P O R T
Business Development
11
Demand for automotive financial services across the Asia-Pacific
region was mixed. In China, the proportion of loan-financed vehicle purchases continued to rise. Despite increasing restrictions
on registrations in metropolitan areas, there is still considerable
potential to acquire new customers for automotive-related financial
services, particularly in the interior of the country. Demand for
financial services products stagnated in the markets in Japan and
South Korea, but rose slightly once more in Australia. The financial services market in the commercial vehicles
business area continued to perform positively in Europe. In Brazil,
on other hand, the difficult economic conditions led to a further
decline in the numbers of trucks and buses sold, which also
adversely affected the financial services market.
VO L K SWA G E N G R O U P D E L I V E R I E S
The Volkswagen Group handed over 5,116,819 vehicles to custom-
ers in the first six months of 2016, an increase of 77,531 units or
1.5% on the prior-year period. The chart on page 13 shows the
changes in deliveries worldwide by month compared with the
previous year. Separate details of deliveries of passenger cars and commercial vehicles are provided in the following.
VO L K SWA G E N G R O U P D E L I V E R I E S
F R O M J A N UA RY 1 TO J U N E 3 0 *
2016 2015 %
Passenger cars 4,788,354 4,729,262 + 1.2
Commercial vehicles 328,465 310,026 + 5.9
Total 5,116,819 5,039,288 + 1.5
* Deliveries for 2015 have been updated to reflect subsequent statistical trends. The figures include the Chinese joint ventures.
PA S S E N G E R C A R D E L I V E R I E S W O R L D W I D E
In the period from January to June 2016, the Volkswagen Group
delivered 4,788,354 passenger cars to customers worldwide,
exceeding the high seen in the previous year by 1.2%. The market as a whole grew by 3.1% in the same period. The Audi (+5.6%),
ŠKODA (+4.6%) and Porsche (+3.5%) brands recorded encour-
aging growth rates. Due to market-related declines especially in
Brazil and Russia and as a result of the emissions issue, the Volks-
wagen Passenger Cars brand delivered 0.7% fewer vehicles than in
the prior-year period. Demand for Volkswagen Group passenger cars was higher than in the previous year in the Western Europe,
Central and Eastern Europe, and Asia-Pacific regions.
The table on the next page provides an overview of passenger
car deliveries to customers by market in the reporting period.
Sales trends in the individual markets are as follows.
Deliveries in Europe/Other markets
Demand for Volkswagen Group vehicles in the growing passenger
car market in Western Europe rose by 2.5% to 1,660,194 units in
the first half of 2016. The number of Group models sold was up
year-on-year in nearly all markets in this region. The Audi Q7, Audi
R8 Coupé and ŠKODA Superb models achieved the highest growth rates. The new Touran also recorded strong increases. In addition,
the new Tiguan was very well received by the market, and the
Bentley Bentayga was the Group’s first luxury SUV to celebrate its
market debut. The Volkswagen Group’s share of the passenger car
market in Western Europe amounted to 23.2 (24.4)%.
We delivered 2.2% more passenger cars to customers in Ger-many from January to June of this year than in the prior-year period;
the market as a whole grew by 7.1% in the same period. The Polo,
Golf, Tiguan, Touran, Passat Estate, Audi A3 Sportback and ŠKODA
Octavia models were particularly popular. Eight Group models led
the Kraftfahrt-Bundesamt (KBA – German Federal Motor Transport
Authority) registration statistics in their respective segments: the up!, Polo, Golf, Tiguan, Touran, Passat, Audi A6 and Porsche 911.
Again, the Golf was the most popular passenger car in Germany
from January to June 2016 in terms of registrations.
Demand for Volkswagen Group vehicles in the overall declining
passenger car markets in Central and Eastern Europe was up 6.0%
year-on-year in the reporting period. While we recorded strong growth in the Czech Republic and Poland, our sales figures in
Russia declined as a result of the continuing weak economic and
politically tense situation. Demand for the Polo, ŠKODA Rapid and
ŠKODA Octavia increased. The Volkswagen Group’s share of the
market in this region rose to 22.3 (20.3)%.
Deliveries to Volkswagen Group customers in South Africa decreased by 7.0% in the first six months of this year; the con-
traction of the market as a whole was more pronounced at 10.4%.
Deliveries in North America
In the reporting period, the Volkswagen Group’s deliveries to cus-
tomers in North America decreased by 1.7% year-on-year amid a growing overall market for passenger cars and light commercial
vehicles. The Group’s share of the market amounted to 4.3 (4.5)%.
The Jetta remained the Group’s best-selling model in North
America.
The Volkswagen Group delivered 7.2% fewer vehicles to cus-
tomers in the USA in the first half of 2016 mainly as a consequence of the diesel issue. The market as a whole grew by 1.5% in the same
period. Demand was particularly strong for models in the SUV,
pickup and van segments. The Tiguan, Audi A3 Sportback, Audi Q3,
Audi Q7 and Porsche Macan models all registered increases in
demand.

I N T E R I M M A N A G E M E N T R E P O R T
Business Development
12
In a continuously growing overall Canadian market, the Volkswagen
Group sold 5.3% fewer vehicles in the reporting period than in the previous year, mainly as a consequence of the diesel issue. Demand
for the Golf, Audi TT Coupé, Audi Q3 and Audi Q7 models developed
encouragingly.
The strong momentum in the Mexican market as a whole continued
in the first six months of 2016, with the Volkswagen Group increasing its deliveries to local customers by 16.4% in this period. The Gol,
Vento, Jetta and SEAT Ibiza models were particularly popular.
PA S S E N G E R C A R D E L I V E R I E S TO C U STO M E R S B Y M A R K E T F R O M J A N UA RY 1 TO J U N E 3 0 *
D E L I V ER I E S ( U N I T S) C H A N G E
2016 2015 (%) Europe/Other markets 2,131,729 2,092,183 + 1.9
Western Europe 1,660,194 1,619,166 + 2.5
of which: Germany 607,437 594,274 + 2.2
United Kingdom 273,209 278,735 – 2.0
Spain 138,184 135,979 + 1.6
France 136,754 136,114 + 0.5
Italy 130,540 114,558 + 14.0
Central and Eastern Europe 293,875 277,349 + 6.0
of which: Russia 74,200 79,534 – 6.7
Czech Republic 68,742 63,595 + 8.1
Poland 62,595 54,197 + 15.5
Other markets 177,660 195,668 – 9.2
of which: Turkey 79,514 80,231 – 0.9
South Africa 40,448 43,509 – 7.0
North America 439,440 447,255 – 1.7
of which: USA 273,843 294,992 – 7.2
Mexico 114,800 98,609 + 16.4
Canada 50,797 53,654 – 5.3
South America 192,779 263,405 – 26.8
of which: Brazil 127,675 193,934 – 34.2
Argentina 47,911 51,861 – 7.6
Asia-Pacific 2,024,406 1,926,419 + 5.1
of which: China 1,859,353 1,739,903 + 6.9
Japan 42,894 48,740 – 12.0
India 30,422 36,585 – 16.8
Worldwide 4,788,354 4,729,262 + 1.2
Volkswagen Passenger Cars 2,924,953 2,945,708 – 0.7
Audi 953,218 902,272 + 5.6
ŠKODA 569,353 544,300 + 4.6
SEAT 216,843 216,460 + 0.2
Bentley 4,011 4,639 – 13.5
Lamborghini 2,013 1,882 + 7.0
Porsche 117,963 113,984 + 3.5
Bugatti – 17 x
* Deliveries for 2015 have been updated to reflect subsequent statistical trends. The figures include the Chinese joint ventures.

I N T E R I M M A N A G E M E N T R E P O R T
Business Development
13
Deliveries in South America
Conditions in the markets for passenger cars and light commercial
vehicles in South America remained very challenging and highly
competitive in the first half of 2016. Demand for Volkswagen Group
vehicles in the region’s generally sharply declining overall markets
in this period was down 26.8% on the already weak prior-year
figure. The Group’s share of the passenger car market in South America was 11.9 (13.2)%.
In the rapidly deteriorating Brazilian market, we handed over
34.2% fewer vehicles to customers in the reporting period than a
year earlier. The up!, Fox, Gol and Saveiro models witnessed the
strongest demand.
The Argentinian market recovered in the second quarter of 2016 and by the end of the first six months had surpassed the low
prior-year level. Volkswagen Group sales between January and June
2016 were down 7.6% year-on-year. The Gol and Suran saw the
highest demand of all Group models in Argentina.
Deliveries in the Asia-Pacific region
The Volkswagen Group delivered 5.1% more vehicles to customers
in the Asia-Pacific region in the first six months of this year than in
the prior-year period. The market as a whole grew at a slightly
stronger pace in the same period, giving the Group a market share
of 12.4 (12.5)% in this region.
The Chinese passenger car market performed better in the reporting period than in the previous year, remaining the growth
driver in the Asia-Pacific region. Demand for Group models in
China rose by 6.9% compared with the previous year’s period. The
Jetta, Lavida, Sagitar and Santana models were particularly popular.
The new versions of the Bora, Touran, Passat and Audi A6 L models
and the locally produced Golf Sportsvan were launched in the market.
Between January and June 2016, we delivered 16.8% fewer
vehicles to customers in the expanding Indian passenger car market
than in the previous year. The most sought-after Group model was
the Polo; the ŠKODA Rapid was also in high demand.
In the first half of 2016, we delivered 12.0% fewer vehicles to customers in Japan year-on-year in tandem with a contracting over-
all market. Demand for the Touran, Passat and Audi TT Coupé
models recorded positive growth.
V O L K S W A G E N G R O U P D E L I V E R I E S B Y M O N T H
Vehicles in thousands
J F M A M J J A S O N D
600
700
800
900
1,000
600
700
800
900
1,000
2016201520162015

I N T E R I M M A N A G E M E N T R E P O R T
Business Development
14
CO M M E R C I A L V E H I C L E D E L I V E R I E S
The Volkswagen Group delivered a total of 328,465 commercial vehicles worldwide in the first half of 2016, an increase of 5.9% on
the same period of the previous year. Sales of trucks rose to 82,074
units, 4.2% more than a year before. Bus delivery volumes declined
by 6.2% to 7,567 units. With 238,824 units sold, Volkswagen
Commercial Vehicles exceeded the prior-year figure by 7.0%.
Scania handed over 40,310 vehicles to customers in the reporting period (+9.0%). MAN sold 49,331 units, 1.1% fewer than in the
previous year.
In the period from January to June 2016, the Volkswagen
Group delivered 211,168 commercial vehicles in the Western
European markets, 10.1% more than in the previous year. Of the
vehicles delivered, 164,884 were light commercial vehicles, 44,102 were trucks and 2,182 were buses. This improvement is attri-
butable to the ongoing economic recovery. The Transporter and the
Caddy were the most sought-after Group models.
Demand for commercial vehicles in the Central and Eastern
European markets rose by 14.8% to 30,457 units, including 16,720
light commercial vehicles, 13,277 trucks and 460 buses. The Transporter and the Caddy witnessed the strongest demand. The
economic and political difficulties persisting in Russia led to a
decline in deliveries. A total of 4,358 units were sold there (–7.6%).
In the first six months of 2016, the Volkswagen Group sold 33,869
vehicles in the Other markets, a decrease of 7.9% compared with the figure for the prior-year period. Of the units handed over to
customers, 24,549 were light commercial vehicles, 8,137 were
trucks and 1,183 were buses.
Sales in North America climbed to 4,687 units, up 17.6% on
the previous year’s level. Of the units sold, 3,541 were light com-
mercial vehicles, 368 were trucks and 778 were buses, with a large share of these vehicles delivered in Mexico.
Demand for the Volkswagen Group’s commercial vehicles in
the South American markets fell by 8.5% to 30,979 units: 18,040
light commercial vehicles, 11,053 trucks and 1,886 buses. The
Amarok was particularly popular. Due to the continuing tough
macroeconomic environment and the more difficult financing conditions, deliveries in Brazil declined, falling 21.1% short of the
prior-year level to 14,093 units. This figure included 4,723 light
commercial vehicles, 8,414 trucks and 956 buses.
The Volkswagen Group delivered a total of 17,305 commercial
vehicles (+1.4%) in the Asia-Pacific region; 11,090 were light
commercial vehicles, 5,137 were trucks and 1,078 were buses. The Amarok and the Transporter witnessed the strongest demand.
CO M M E R C I A L V E H I C L E D E L I V E R I E S TO C U STO M E R S B Y M A R K E T F R O M J A N UA RY 1 TO J U N E 3 0 *
D E L I V ER I E S ( U N I T S) C H A N G E
2016 2015 (%)
Europe/Other markets 275,494 255,112 + 8.0
Western Europe 211,168 191,783 + 10.1
Central and Eastern Europe 30,457 26,540 + 14.8
Other markets 33,869 36,789 – 7.9
North America 4,687 3,986 + 17.6
South America 30,979 33,862 – 8.5
of which: Brazil 14,093 17,856 – 21.1
Asia-Pacific 17,305 17,066 + 1.4
of which: China 2,374 2,722 – 12.8
Worldwide 328,465 310,026 + 5.9
Volkswagen Commercial Vehicles 238,824 223,161 + 7.0
Scania 40,310 36,989 + 9.0
MAN 49,331 49,876 – 1.1
* Deliveries for 2015 have been updated to reflect subsequent statistical trends.

I N T E R I M M A N A G E M E N T R E P O R T
Business Development
15
D E L I V E R I E S I N T H E P O W E R E N G I N E E R I N G S E G M E N T
Orders in the Power Engineering segment are usually part of major investment projects. Lead times typically range from just under one
year to several years, and partial deliveries as construction prog-
resses are common. Accordingly, there is a time lag between
incoming orders and sales revenue from the new construction
business.
In the period from January to June 2016, sales revenue in the Power Engineering segment was largely driven by Engines & Marine
Systems and Turbomachinery, which together generated nearly
three-quarters of overall sales revenue.
G R O U P F I N A N C I A L S E RV I C E S
The Financial Services Division combines the Volkswagen Group’s dealer and customer financing, leasing, banking and insurance
activities, fleet management and mobility offerings. The division
comprises Volkswagen Financial Services and the financial services
activities of Scania, Porsche and Porsche Holding Salzburg.
Demand for the Financial Services Division’s products and
services remained strong in the first half of 2016. The number of new financing, leasing, service and insurance contracts signed rose
worldwide by 15.4% year-on-year to 3.5 million. The total number
of contracts as of June 30, 2016 was higher than the 2015 year-end
figure, at 16.7 million (+5.2%). The underlying contract types were
modified according to their significance. The ratio of leased or
financed vehicles to Group deliveries (penetration rate) in the Financial Services Division’s markets stood at 32.7 (29.7)% in the
reporting period.
In the Europe/Other markets region, 2.6 million new contracts
were signed in the period from January to June 2016, an increase of
18.4% on the prior-year figure. As of June 30, 2016, the total
number of contracts was 11.9 million, up 5.7% on the 2015 year-end figure. The Customer Financing/Leasing area accounted for
5.7 million contracts (+3.8%).
The number of contracts in North America amounted to 2.6 mil-
lion at the end of June 2016, up 5.4% on the figure as of Decem-
ber 31, 2015. This included 1.8 million contracts in the Customer
Financing/Leasing area, an increase of 3.8% on the 2015 year-end level. The number of new contracts signed amounted to 466 thou-
sand, 9.0% more than in the prior-year period.
In South America, 102 thousand new contracts were signed in
the first six months of 2016, a decrease of 25.0% year-on-year. The
total number of contracts amounted to 719 thousand as of June 30,
2016, 7.1% fewer than on December 31, 2015. The contracts mainly related to the Customer Financing/Leasing area.
The number of new contracts signed in the Asia-Pacific region rose
by 21.8% to 328 thousand. The total number of contracts amounted to 1.4 million at the end of the first half of 2016, up 7.0% on the
figure for December 31, 2015. The Customer Financing/Leasing
area accounted for 1.1 million contracts, an increase of 9.1% as
against year-end 2015.
S A L E S TO T H E D E A L E R O R G A N I Z AT I O N
In the first half of 2016, the Volkswagen Group’s unit sales to the
dealer organization (including the Chinese joint ventures) amounted
to 5,199,195 vehicles. This represents an increase of 2.1% on the
prior-year period, due primarily to higher demand in Western and
Central Europe as well as in China, which more than compensated
for the volume decreases particularly in Brazil. Unit sales outside Germany rose by 2.2% in the reporting period, while in the
German market they were up 1.6% year-on-year. Vehicles sold in
Germany as a proportion of overall sales were on a level with the
prior-year figure at 13.1 (13.1)%.
P R O D U C T I O N
The Volkswagen Group produced a total of 5,268,086 vehicles in the
period from January to June 2016, a decline of 0.9% year-on-year.
Production in Germany rose by 0.8% to 1,405,429 units. The pro-
portion of vehicles produced in Germany increased to 26.7 (26.3)%.
I N V E N TO R I E S
Global inventories at Group companies and in the dealer orga-
nization were higher on June 30, 2016 than at year-end 2015 and
also up on the June 30, 2015 level.
E M P L OY E E S
The Volkswagen Group had 591,867 active employees at the end of
the first half of 2016. A further 5,936 employees were in the passive
phase of their partial retirement. An additional 15,822 young
people were in vocational traineeships. At the end of the second
quarter of 2016, the Volkswagen Group had a total of 613,625
employees worldwide, up 0.6% on the number at December 31, 2015. Significant factors for the increase were the expansion of the
workforce in the new plants in Mexico and Poland, and the
recruitment of specialists. At 278,076, the number of employees in
Germany was down 0.2% on year-end 2015. The proportion of
employees in Germany declined to 45.3 (45.7)%.

I N T E R I M M A N A G E M E N T R E P O R T
Results of Operations, Financial Position and Net Assets
16
C H A N G E I N R E P O RT I N G ST R U C T U R E
The reorganization of the Volkswagen Group has resulted in slight
changes to our financial reporting. In the Automotive Division,
effective January 1, 2016 the former combined Commercial Vehi-
cles/Power Engineering Business Area is presented as two separate
business areas in accordance with the segment reporting: the
Commercial Vehicles Business Area and the Power Engineering Business Area. The Automotive Division thus has three business
areas: Passenger Cars, Commercial Vehicles and Power Engineer-
ing. The Financial Services Division, which corresponds to the
Financial Services segment, remains unchanged.
S A L E O F L E A S E P L A N
The final approvals for the sale of LeasePlan to an international
consortium of investors were issued by the competent authorities in
January 2016. Legal transfer of the LeasePlan shares to the con-
sortium was completed on March 21, 2016. In the reporting period,
the transaction had a positive effect of €2.2 billion on investing
activities attributable to operating activities and net liquidity and, taking into account the disposal of the equity-accounted investment,
resulted in income of €0.2 billion for the Volkswagen Group, which
is reported in the financial result.
S P E C I A L I T E M S
Special items relating to the diesel issue amounted to €–1.6 billion in the reporting period, mainly due to higher expenses attributable
to the recognition of provisions for legal risks.
Additional provisions had to be recognized because of the
expanded scope of the replacement of potentially faulty airbags
manufactured and supplied by Takata that had been imposed by the
competent authorities in the USA and Canada on all affected auto-mobile manufacturers. The resulting special items recognized in
operating profit in the period from January to June 2016 amounted
to €–0.2 billion.
Restructuring measures in the trucks business in South America,
which serve to sustainably enhance competitiveness (€–0.1 billion),
and provisions for legal risks relating to the commercial vehicles antitrust proceedings launched by the European Commission
(€–0.4 billion) resulted in total special items of €–0.5 billion in the
Commercial Vehicles Business Area in the reporting period.
Overall, negative special items recognized in operating profit
therefore amounted to €2.2 billion in the first six months of 2016.
R E S U LT S O F O P E R AT I O N S O F T H E G R O U P
At €107.9 (108.8) billion, the Volkswagen Group’s sales revenue in
the first six months of 2016 was on a level with the previous year.
Positive mix effects and the good business development in the
Financial Services Division were offset by negative exchange rate
trends and lower vehicle unit sales, excluding the Chinese joint
ventures. The Volkswagen Group generated 79.0 (79.2)% of its sales revenue outside Germany.
At €21.1 (21.7) billion, gross profit from January to June 2016
was down year-on-year. The gross margin amounted to 19.6 (19.9)%;
excluding special items it was 20.3%.
R E S U LT S O F O P E R AT I O N S I N T H E PA S S E N G E R C A R S , CO M M E R C I A L
V E H I C L E S A N D P O W E R E N G I N E E R I N G B U S I N E S S A R E A S F R O M
J A N UA RY 1 TO J U N E 3 0
€ million 2016 2015
Passenger Cars
Sales revenue 75,285 77,129
Gross profit 15,324 15,834
Operating result 3,895 5,346
Operating return on sales (%) 5.2 6.9
Commercial Vehicles
Sales revenue 15,589 15,151
Gross profit 2,613 2,484
Operating result 285 349
Operating return on sales (%) 1.8 2.3
Power Engineering
Sales revenue 1,673 1,813
Gross profit 321 348
Operating result – 18 5
Operating return on sales (%) – 1.1 0.3
Results of Operations, Financial Position and Net Assets

I N T E R I M M A N A G E M E N T R E P O R T
Results of Operations, Financial Position and Net Assets
17
At €7.5 (7.0) billion, operating profit before special items was
higher than in the previous year, and the operating return on sales
before special items was 7.0 (6.4)%. In addition to optimized prod-
uct costs, mix improvements had a positive effect, while exchange rate and volume effects had a negative impact. Special items of
€–2.2 (–0.2) billion – particularly for legal risks – weighed on
operating profit; of this total, €–1.7 billion is attributable to the
Passenger Cars Business Area and €–0.5 (–0.2) billion to the
Commercial Vehicles Business Area. As a result, at €5.3 billion, the
Volkswagen Group’s operating profit in the first six months of 2016 was €1.5 billion lower than the year before. The operating return on
sales declined to 4.9 (6.3)%.
The financial result decreased by €1.4 billion to €–0.5 billion;
the decrease was a result in particular of higher finance costs due to
remeasurement effects, a year-on-year decline in income from the
equity-accounted Chinese joint ventures and higher expenses from the measurement of derivative financial instruments at the
reporting date. The income from the sale of the LeasePlan shares
had a positive effect.
At €4.8 billion, the Group’s profit before tax was 37.2% lower
than in the previous year as a result of the special items. Profit after
tax declined by €2.1 billion to €3.6 billion.
Results of operations in the Automotive Division
The Automotive Division generated sales revenue of €92.5 (94.1) bil-
lion in the period from January to June 2016. The decrease was
attributable primarily to negative exchange rate and volume effects,
which were partly offset by positive mix developments. Sales revenue declined in the Passenger Cars and Power Engineering
Business Areas in the first six months of 2016, but grew slightly
year-on-year in the Commercial Vehicles Business Area. As our
Chinese joint ventures are accounted for using the equity method,
the Group’s business growth in the Chinese passenger car market is
primarily reflected in consolidated sales revenue only by deliveries of vehicles and vehicle parts.
Cost of sales declined year-on-year. Improved product costs and
currency translation effects were positive factors, while higher
depreciation and amortization charges resulting from high capital
expenditures and special items relating to the diesel issue and the
replacement of procured airbags were negative factors. Research and development costs were down slightly on the previous year.
Gross profit amounted to €18.3 (18.7) billion.
Distribution expenses rose in the reporting period, primarily
because of higher marketing expenses as a result of the emissions
issue; the ratio of distribution expenses to sales revenue also
increased slightly. Administrative expenses grew marginally, and the ratio of administrative expenses to sales revenue was close to the
previous year’s level. The other operating result fell to €– 1.1
(– 0.3) billion; it was negatively impacted by special items in
connection with the diesel issue and the Commercial Vehicles
Business Area.
At €4.2 billion, the Automotive Division’s operating profit in the first six months of 2016 was €1.5 billion lower than in the previous
year. The operating return on sales declined to 4.5 (6.1)%. Special
items contained in this figure amounted to €–2.2 (–0.2) billion. The
Automotive Division’s operating profit before special items was
€6.3 (5.9) billion, and its operating return on sales before special
items increased to 6.9 (6.2)%. Optimized product costs and favor-able mix developments were able to more than offset negative
exchange rate effects and declining vehicle unit sales, as well as
O P E R A T I N G P R O F I T B E F O R E S P E C I A L I T E M S B Y Q U A R T E R
Volkswagen Group in € million
Q1 Q2 Q3 Q4
0
1,000
2,000
3,000
4,000
20162015
0
1,000
2,000
3,000
4,000
20162015

I N T E R I M M A N A G E M E N T R E P O R T
Results of Operations, Financial Position and Net Assets
18
higher marketing costs. Since the profit recorded by the joint
ventures is accounted for in the financial result using the equity method, the business growth of our Chinese joint ventures is
primarily reflected in the Group’s operating result only by deliveries
of vehicles and vehicle parts, and license revenue.
At €–0.5 billion, the financial result was €1.3 billion lower year-
on-year; this figure contained higher finance costs due to remea-
surement effects, lower investment income from the Chinese joint ventures and increased expenses from the measurement of
derivative financial instruments at the reporting date, which were
partly offset by income from the sale of the LeasePlan shares.
Results of operations in the Financial Services Division
In the period from January to June 2016, the Financial Services Division generated sales revenue of €15.4 billion, thus exceeding
the 2015 comparative figure by 4.8%, largely because of growth in
business volumes.
At €2.9 (3.0) billion, gross profit was down slightly year-on-year
because of the sustained pressure on margins and higher depre-
ciation and amortization charges. Distribution expenses in the reporting period were on a level
with 2015, and the ratio of distribution expenses to sales revenue
was almost unchanged. Despite higher expenses for meeting regu-
latory requirements, administrative expenses declined by 3.2%,
and the ratio of administrative expenses to sales revenue decreased
slightly. Operating profit increased by 5.1% to €1.2 billion, and the
operating return on sales was 7.6 (7.6)%, as in the previous year.
F I N A N C I A L P O S I T I O N O F T H E G R O U P
In the first six months of 2016, the Volkswagen Group’s gross cash
flow amounted to €15.2 billion, representing a decline of 16.4% year-on-year. Funds tied up in working capital amounted to
€10.1 billion, down €0.7 billion on the previous year. As a result,
cash flows from operating activities decreased to €5.1 (7.4) billion.
Investing activities attributable to the Volkswagen Group’s
operating activities decreased by €1.8 billion to €5.1 billion in the
reporting period. Within investing activities, investments in property, plant and equipment, investment property and intangible
assets, excluding capitalized development costs (capex) were lower
than the previous year, while capitalized development costs
increased year-on-year. The “Acquisition and disposal of equity
investments” item was affected by the cash inflow from the sale of
the LeasePlan shares and the cash outflow for the investment in ride-hailing service GETT.
The Group recorded cash inflows from financing activities of
€8.2 (1.3) billion in the first six months of 2016. At €29.3 billion, the
Volkswagen Group’s cash and cash equivalents reported in the cash
flow statement increased significantly year-on-year.
The Volkswagen Group’s net liquidity at June 30, 2016 was €– 99.5 (– 100.5) billion and thus on a level with year-end 2015.
F I N A N C I A L P O S I T I O N I N T H E PA S S E N G E R C A R S, CO M M E R C I A L
V E H I C L E S A N D P O W E R E N G I N E E R I N G B U S I N E S S A R E A S F R O M
J A N UA RY 1 TO J U N E 3 0
€ million 2016 2015
Passenger Cars
Gross cash flow 9,101 12,506
Change in working capital* – 716 – 2,814
Cash flows from operating activities* 8,385 9,692
Cash flows from investing activities
attributable to operating activities – 3,659 – 5,757
Net cash flow* 4,727 3,935
Commercial Vehicles
Gross cash flow 1,254 1,310
Change in working capital 18 56
Cash flows from operating activities 1,272 1,366
Cash flows from investing activities
attributable to operating activities – 856 – 908
Net cash flow 416 458
Power Engineering
Gross cash flow 132 189
Change in working capital – 53 – 13
Cash flows from operating activities 79 175
Cash flows from investing activities
attributable to operating activities – 86 – 97
Net cash flow – 7 79
* Prior-year figures adjusted.
Financial position in the Automotive Division
In the first six months of 2016, the Automotive Division generated
gross cash flow of €10.5 billion; the €3.5 billion decline resulted primarily from the special items in the Passenger Cars and Com-
mercial Vehicles Business Areas, as well as from lower dividends
from the Chinese joint ventures. At €0.8 (2.8) billion, funds tied up
in working capital were down considerably on the previous year.
The new special items recognized in the first six months of 2016
had a negative impact overall on gross cash flow and a positive effect on the change in working capital. Cash flows from operating
activities decreased by €1.5 billion to €9.7 billion.
At €4.6 (6.8) billion, investing activities attributable to operating
activities were considerably lower year-on-year in the reporting
period. Capex decreased slightly compared with the previous year;
the ratio of capex to sales revenue was unchanged at 4.9 (4.9)%. Capitalized development costs increased by €0.4 billion to €2.6 bil-
lion. We invested primarily in our production facilities and in
models to be launched in 2016 and 2017, as well as in the ecological
focus of the model range, drivetrain electrification and modular
toolkits. The sale of the LeasePlan shares resulted in a cash inflow
of €2.2 billion.

I N T E R I M M A N A G E M E N T R E P O R T
Results of Operations, Financial Position and Net Assets
19
The Automotive Division’s net cash flow rose by €0.7 billion to
€5.1 billion in the period from January to June 2016. In financing activities, a capital increase carried out by Volks-
wagen AG at Volkswagen Financial Services AG in April 2016 to
finance the growth in business volumes and comply with the
increase in regulatory capital requirements resulted in outflows of
€0.5 billion. At the end of June, a total dividend of €0.1 (2.3) billion,
which was considerably lower than in the previous year, was distributed to the shareholders of Volkswagen AG. The Automotive
Division’s financing activities include the issuance and redemption
of bonds and other financial liabilities and amounted to
€2.5 (– 3.0) billion.
At €28.8 billion, the Automotive Division’s net liquidity at the
end of June 2016 exceeded the 2015 year-end figure by €4.3 billion.
Financial position in the Financial Services Division
The Financial Services Division’s gross cash flow improved by
12.5% year-on-year to €4.8 billion in the first six months of 2016. At
€9.4 (8.0) billion, funds tied up in working capital were higher than
in the first six months of 2015, due in particular to the growth in the volume of business. Investing activities attributable to operating
activities amounted to €0.5 (0.2) billion; this also includes the
acquisition of the interest in ride-hailing service GETT amounting
to €0.3 billion. Cash inflows from financing activities amounted to
€5.7 (4.3) billion.
At the end of the first half of 2016, the Financial Services Division’s negative net liquidity, which is common in the industry,
amounted to €– 128.3 billion, after €–125.1 billion at December 31,
2015.
CO N S O L I DAT E D B A L A N C E S H E E T ST R U C T U R E
At €401.4 billion, the Volkswagen Group’s total assets as of June 30, 2016 exceeded the year-end 2015 figure by 5.1%. The Group’s equity
was slightly higher than at December 31, 2015 at €88.9 (88.3) bil-
lion. The equity ratio was 22.1 (23.1)%.
Automotive Division balance sheet structure
Both intangible assets and property, plant and equipment were on a level with December 31, 2015 in the Automotive Division. Equity-
accounted investments decreased, mainly as a result of the sale of
the LeasePlan shares and the dividend resolutions by the Chinese
joint ventures. Overall, noncurrent assets were somewhat lower
than at year-end 2015. Current assets rose by 22.4%; inventories
contained in this item mainly rose due to production-related and exchange rate factors. Receivables increased significantly; they
include the still unpaid dividends of the Chinese joint ventures. At
€24.2 (15.7) billion, cash and cash equivalents in the Automotive
Division were significantly higher at the end of the reporting period
than at December 31, 2015.
As of June 30, 2016, the Automotive Division’s equity was on a level with the previous year at €66.9 (67.4) billion.
It was lifted by the good earnings growth before special items
and positive effects from the measurement of derivatives recog-
nized outside profit or loss. Expenses from special items, higher
actuarial losses from the measurement of pension provisions and
negative currency translation effects reduced the Automotive Division’s equity. The dividend distribution to the shareholders of
Volkswagen AG at the end of June was considerably lower than in
the previous year. The noncontrolling interests are mainly attri-
butable to RENK AG and AUDI AG. As these were lower overall than
the noncontrolling interests attributable to the Financial Services
Division, the figure for the Automotive Division, where the deduction was recognized, was negative.
Noncurrent liabilities rose by 7.7% compared with Decem-
ber 31, 2015. While the financial liabilities contained in this item
declined by €3.1 billion, pension provisions increased substantially
because of the change in the discount rate; other noncurrent pro-
visions rose because of the special items. At €74.7 billion, current liabilities were 13.3% higher than at the end of December 2015;
the current other provisions contained in this item increased
because of the special items. Current financial liabilities went up to
€2.3 (– 4.0) billion. The figures for the Automotive Division also
contain the elimination of intragroup transactions between the Auto-
motive and Financial Services divisions. As the current financial liabilities for the primary Automotive Division were lower than the
loans granted to the Financial Services Division, a negative amount
was disclosed for the prior-year period. The item “Put options and
compensation rights granted to noncontrolling interest share-
holders” primarily comprises the liability for the obligation to acquire
the shares held by the remaining free float shareholders of MAN. At €220.8 (206.8) billion, the Automotive Division’s total assets
as of June 30, 2016 were 6.8% higher than as of December 31,
2015.

I N T E R I M M A N A G E M E N T R E P O R T
Results of Operations, Financial Position and Net Assets
20
B A L A N C E S H E E T ST R U C T U R E I N T H E PA S S E N G E R C A R S,
CO M M E R C I A L V E H I C L E S A N D P O W E R E N G I N E E R I N G
B U S I N E S S A R E A S
€ million June 30, 2016 Dec. 31, 2015
Passenger Cars
Noncurrent assets 102,490 105,028
Current assets 70,914 57,289
Total assets 173,404 162,317
Equity 52,152 54,598
Noncurrent liabilities 66,019 61,195
Current liabilities 55,233 46,524
Commercial Vehicles
Noncurrent assets 24,795 24,749
Current assets 16,557 13,421
Total assets 41,352 38,170
Equity 11,692 9,512
Noncurrent liabilities 12,313 11,532
Current liabilities 17,347 17,126
Power Engineering
Noncurrent assets 2,925 3,035
Current assets 3,151 3,310
Total assets 6,077 6,345
Equity 3,103 3,255
Noncurrent liabilities 870 842
Current liabilities 2,104 2,248
Financial Services Division balance sheet structure
The Financial Services Division’s total assets amounted to €180.6 bil-
lion as of June 30, 2016, 3.1% higher than at the end of December
2015.
Noncurrent assets rose by 4.2% overall. The lease assets and noncurrent financial services receivables contained in this item
recorded a rise due to the growth in business. Equity-accounted
investments increased following the purchase of the interest in
GETT. Current assets were up slightly year-on-year because of
higher financial services receivables. Approximately 45.0 (45.8)%
of the Volkswagen Group’s assets were attributable to the Financial Services Division at the end of the first six months of 2016.
At €21.9 billion, the Financial Services Division’s equity at the
end of the reporting period was 5.0% higher than at the end of the
previous fiscal year. In addition to earnings growth, the increase
was attributable in particular to the capital increase implemented
by Volkswagen AG in April to finance the growth in business and
meet regulatory capital requirements. The equity ratio was 12.2 (11.9)%. Noncurrent liabilities were up slightly on year-end
2015 at 72.5 billion. Current liabilities rose by 4.3%. The increase
mainly resulted from the funding of volume growth.
At €32.0 (26.5) billion, deposits from direct banking business
were higher than at the end of 2015.
R E P O RT O N E X P E C T E D D E V E L O PM E N T S, R I S K S A N D
O P P O RT U N I T I E S
We have aligned our expected deliveries to customers to reflect the
stronger recovery of the European automotive markets.
Special items, in particular relating to legal risks, serve to
reduce the earnings forecast including special items for the Group and for the Passenger Cars and Commercial Vehicles business
areas.
Beyond this, the following changes were made in the reporting
period compared with the disclosures on the Volkswagen Group’s
expected development in fiscal year 2016 in the “Report on
Expected Developments” and “Report on Risks and Opportunities” chapters – including the “Risks from the emissions issue” and
“Litigation/Diesel issue” sections and the underlying description of
the issues in the chapter entitled “The Emissions Issue” – of the
combined management report in the 2015 Annual Report:
In June 2016, Volkswagen publicly announced that Volkswagen AG, Volkswagen Group of America, Inc. and certain affiliates had
reached settlement agreements in the USA with the U.S. Depart-
ment of Justice, the U.S. Environmental Protection Agency (EPA),
the U.S. Federal Trade Commission, the California Air Resources
Board (CARB) and private plaintiffs represented by a Plaintiffs’
Steering Committee (PSC) in the Multi-District Litigation pending in California. The settlement agreements, if finally approved, will
resolve certain civil claims made in relation to affected diesel
vehicles with 2.0 l TDI engines from the Volkswagen Passenger Cars
and Audi brands in the USA. The settlement agreements are subject
to final court approval.
The proposed settlements provide affected customers with the option of a buyback or, for leased vehicles, early lease termination or
a free technical modification of the vehicles, provided that EPA and
CARB approve the appropriate modification measures. Volkswagen
will also make cash payments to affected owners and lessees.
Volkswagen also agreed to support environmental programs.
The company will pay USD 2.7 billion over three years into an envi-ronmental trust, managed by a trustee appointed by the court, to
offset excess nitrogen oxide (NOx) emissions. Volkswagen will also
invest in total USD 2.0 billion over 10 years in zero emissions vehicle
infrastructure as well as corresponding access and awareness
initiatives.
I N T E R I M M A N A G E M E N T R E P O R T
Results of Operations, Financial Position and Net Assets
21
Volkswagen also reached separate settlement agreements with the
attorneys general of 44 US states, the District of Columbia and Puerto Rico, to resolve their existing or potential consumer pro-
tection and unfair trade practices claims – in connection with both
2.0 l TDI and 3.0 l TDI vehicles in the USA – for a settlement amount
of USD 603 million.
These settlements do not resolve the civil claims by the DOJ,
FTC and private plaintiffs represented by the PSC related to 3.0 l TDI vehicles, civil penalties sought by the DOJ on behalf of the
EPA, potential state environmental claims related to the 2.0 l and
3.0 l TDI vehicles, any criminal investigations by the DOJ, as well as
certain other claims.
On July 19, 2016, the US states of Maryland, Massachusetts and New York filed complaints in their respective state courts against
Volkswagen AG, Volkswagen Group of America, Inc. and certain
affiliates seeking civil penalties and injunctive relief for alleged
violations of environmental laws. Maryland, Massachusetts and
New York participated in the state settlements described above with
respect to consumer protection and unfair trade practices claims, but those settlements did not include claims for environmental
penalties.
In 2011, the European Commission opened antitrust proceedings
against European truck manufacturers concerning inappropriate exchange of information during the period 1997-2011 and sent a
statement of objections to MAN, Scania and the other truck
manufacturers concerned in November 2014.
With its decision as of July 19, 2016 the European Commission
has fined five European truck manufacturers excluding MAN and
Scania. MAN was not fined as the company had informed the EU Commission about the cartel as a key witness.
With regard to Scania, the antitrust proceedings will be con-
tinued. Scania has decided to fully exercise its rights of defense in
the ongoing investigation. A provision of €0.4 billion was recog-
nized in order to cover possible fines.
It is not possible at the present time to rule out a potential further
increase in the recalls of a range of models produced by various
manufacturers in which certain airbags manufactured by Takata
were installed. This could also affect Volkswagen Group models.
In addition, there are risks in connection with the decision by the UK to leave the EU following the outcome of the Brexit referendum
in June 2016. In light of this, we are monitoring potential
consequences for macroeconomic growth, effects on exchange
rates and reduced demand for Group products.
This report contains forward-looking statements on the business development of theVolkswagen Group. These statements are based on assumptions relating to thedevelopment of the economic and legal environment in individual countries andeconomic regions, and in particular for the automotive industry, which we have made on the basis of the information available to us and which we consider to be realistic at thetime of going to press. The estimates given entail a degree of risk, and actualdevelopments may differ from those forecast. Any changes in significant parameters
relating to our key sales markets, or any significant shifts in exchange rates relevant to the Volkswagen Group, will have a corresponding effect on the development of our business. In addition, expected business development may vary if the assessments of the factors influencing sustainable value enhancement, as well as risks and opportunities presented in the 2015 Annual Report develop in a way other than we are currently expecting, or additional risks and opportunities or other factors emerge that affect the development of our business.

I N T E R I M M A N A G E M E N T R E P O R T
Outlook
22
The global economy saw moderate growth in the first six months of 2016. Both in industrialized nations and in emerging economies,
momentum slowed slightly compared with 2015 as a whole. The
Volkswagen Group’s Board of Management expects the global eco-
nomy to record the same level of growth in 2016 as in the previous
year. Risks will arise from potential turbulence in the financial
markets – including as a result of a future Brexit from the EU – and structural deficits in individual countries. In addition, growth
prospects continue to be hurt by geopolitical tensions and conflicts.
We expect the positive economic trend in industrialized nations to
continue, with moderate rates of expansion overall. In all prob-
ability, growth in emerging economies will be at a similar level to
the previous year. We expect the strongest rates of expansion in Asia’s emerging economies.
Global demand for passenger cars continued to rise in the first
six months of 2016, although there was regional variation in the
markets. We expect trends in the passenger car markets in the
individual regions to be mixed over the year as a whole, too. Overall,
global demand for new vehicles will probably rise at a similar pace to 2015. We anticipate that demand volume in Western Europe and
the German passenger car market will be slightly higher than in the
previous year. In the Central and Eastern European markets,
demand for passenger cars is estimated to be slightly lower than the
weak prior-year figure. In North America, we expect last year’s
positive trend to continue at a slightly weaker pace. Volumes in the South American markets will probably fall noticeably short of the
prior-year figures. The passenger car markets in the Asia-Pacific
region look set to continue their growth path at a similar pace.
Global demand for light commercial vehicles will probably see a
slight increase in 2016. We expect trends to vary from region to
region. In the markets for mid-sized and heavy trucks that are relevant
for the Volkswagen Group, new registrations in 2016 will probably
be at the previous year’s level overall with performance varying
from region to region, while demand in the relevant bus markets
will decline noticeably.
We expect automotive financial services to continue to grow in importance worldwide in 2016.
The Volkswagen Group is well positioned to deal with the mixed
developments in the global automotive markets. Our broad,
selectively expanded product range featuring the latest generation
of engines as well as a variety of alternative drives puts us in a good
position globally compared with our competitors. The Group’s further strengths include in particular its unique brand portfolio,
its steadily growing presence in all major world markets and its wide selection of financial services. Our range of models spans from
motorcycles through compact, sports and luxury cars to heavy
trucks and buses, and covers almost all segments. The Volkswagen
Group’s brands will press ahead with their product initiative in
2016, modernizing and expanding their offering by introducing
new models. Our goal is to offer all customers the mobility and innovations they need, sustainably strengthening our competitive
position in the process.
We expect that, on the whole, deliveries to customers of the
Volkswagen Group in 2016 will be slightly higher than the previous
year amid persistently challenging market conditions, with a
growing volume in China. In addition to the emissions issue, the highly competitive
environment as well as interest rate and exchange rate volatility and
fluctuations in raw materials prices all pose challenges. We antic-
ipate positive effects from the efficiency programs implemented by
all brands and from the modular toolkits.
Depending on the economic conditions – particularly in South America and Russia – and exchange rate developments and in light
of the emissions issue, we expect 2016 sales revenue for the
Volkswagen Group to be down by as much as 5% on the prior-year
figure. In terms of the Group’s operating profit before special items,
we anticipate that the operating return on sales will be between
5.0% and 6.0% in 2016. In the Passenger Cars Business Area, we expect a noticeable
decrease in sales revenue, with an operating return on sales before
special items in the anticipated range of 5.5 – 6.5%. With sales
revenue in the Commercial Vehicles Business Area remaining
essentially unchanged, we assume that the operating return on
sales before special items will be between 2.0% and 4.0%. We expect sales revenue in the Power Engineering Business Area to be
perceptibly lower than the prior-year figure, with a significantly
reduced operating profit. For the Financial Services Division, we
are forecasting sales revenue and operating profit at the prior-year
level.
After special items we are expecting a clearly positive operating return on sales for the Group and the Passenger Cars Business Area,
and a slightly positive operating return on sales for the Commercial
Vehicles Business Area; however the respective target range will not
be reached.
Disciplined cost and investment management and the contin-
uous optimization of our processes remain integral elements of the Volkswagen Group’s strategy.
Outlook

B R A N D S A N D B U S I N E S S F I E L D S
23
S A L E S R E V E N U E A N D O P E R AT I N G P R O F I T B Y B R A N D A N D
B U S I N E S S F I E L D
The sales revenue of the Volkswagen Group amounted to €107.9
(108.8) billion in the first half of 2016. Operating profit declined by
€1.5 billion to €5.3 billion, weighted down by special items totaling
€–2.2 billion. Operating profit before special items rose to €7.5 (7.0)
billion.
The Volkswagen Passenger Cars brand’s unit sales of 2.2 (2.3) million vehicles in the first six months of 2016 matched the prior-
year level. This figure includes 1.6 (1.7) million Volkswagen models.
The Polo, Golf, Tiguan and Passat were especially popular among
customers. At €53.0 (53.6) billion, sales revenue almost reached the
previous year’s level. Operating profit before special items
decreased to €0.9 (1.4) billion. Negative impacts resulting from unfavorable exchange rates and mix effects, lower volumes and
higher marketing costs as a consequence of the emissions issue
were offset by cost savings. The diesel issue in particular gave rise to
special items of €–1.5 billion.
The Audi brand sold 799 (784) thousand vehicles worldwide in
the period from January to June 2016, 2.0% more than a year earlier. Our Chinese joint venture FAW-Volkswagen sold a further
276 (240) thousand Audi vehicles. There was strong demand for the
Q3 SUV model and the new generations of the A4, TT and Q7. Sales
revenue increased to €30.1 (29.8) billion. Operating profit before
special items came to €2.7 (2.9) billion. Exchange rate effects and
continuing high upfront expenditures for new products and technologies and for the expansion of the international production
network had a negative impact on earnings. The diesel issue and
the increased scope of the replacement of faulty airbags delivered
by Takata resulted in special items of €–0.3 billion. The financial
key performance indicators for the Audi brand also include the
Lamborghini and Ducati brands. Ducati sold 39 thousand motor-cycles in the reporting period (+9.8%).
The ŠKODA brand’s unit sales rose by 2.4% in the first half of
2016 to 431 thousand vehicles. The Fabia, Octavia and Superb
models in particular saw strong customer demand. At €7.1 billion,
sales revenue was up 10.8% year-on-year. Operating profit improved
by 31.2% to €685 million mainly on the back of positive volume and mix effects as well as optimized product costs.
The SEAT brand’s unit sales fell to 276 (286) thousand vehicles
in the first six months of 2016 largely due to the phasing out of the
Altea. This figure includes the Q3 manufactured for Audi. Demand
remained high for the Ibiza and the Leon, while the Ateca was very
well received by the market. Sales revenue maintained the 2015 level at €4.5 (4.5) billion. Operating profit climbed €40 million to
€93 million, with cost reductions and mix improvements compen-
sating for negative volume and exchange rate effects.
Unit sales by the Bentley brand in the period from January to
June 2016 fell by 3.1% year-on-year to 4,863 vehicles. The new
Bentayga enjoyed buoyant demand. Sales revenue was down 6.0% on the previous year at €883 million. Operating profit decreased by
€75 million to €–22 million mainly due to changed market con-
ditions and unfavorable exchange rates.
The Porsche brand lifted its vehicle sales by 7.2% in the
reporting period to 117 thousand units worldwide. Demand
increased for the Boxster, Cayman, 911 and Macan models. Sales revenue amounted to €10.9 (10.8) billion. Operating profit rose by
7.7% to €1.8 billion; alongside the increase in volumes, mainly
exchange rate effects had a positive impact.
VO L K SWA G E N G R O U P
Division Automotive Financial Services
Brand/ Business Field
Volkswagen Passenger Cars
Audi ŠKODA SEAT Bentley Porsche Volkswagen Commercial Vehicles
Scania MAN Others Dealer and customer financing Leasing Direct bank Insurance Fleet management Mobility offerings
Brands and Business Fields

B R A N D S A N D B U S I N E S S F I E L D S
24
Volkswagen Commercial Vehicles sold 231 (231) thousand vehicles
worldwide in the first half of 2016. The Multivan/Transporter and Caddy models were particularly popular. Sales revenue improved
by 3.5% year-on-year to €5.4 billion. Operating profit rose to
€299 (268) million as a result of mix effects.
Unit sales by the Scania brand increased to 41 (38) thousand
trucks and buses in the reporting period, with rising sales figures in
Europe making up for the decline in demand in South America, Turkey and Russia. Sales revenue increased by 7.6% to €5.6 billion.
Operating profit before special items improved to €550 (503) mil-
lion, as negative exchange rate effects were more than offset by
higher vehicle sales and an expansion of the service business. Legal
risks in connection with the commercial vehicle antitrust pro-
ceedings launched by the European Commission gave rise to special items of €–0.4 billion.
MAN Commercial Vehicles sold 49 (50) thousand units in the period
from January to June of this year. At €4.8 (4.9) billion, sales revenue fell slightly short of the prior-year figure. In spite of the persistently
difficult economic climate in South America, the operating profit
before special items rose to €186 (54) million. Alongside the higher
volumes and improved margins in Europe, the structural changes
introduced also had a positive effect here. Restructuring measures
in South America led to special items of €–0.1 billion; in the pre-vious year, special items of €–0.2 billion had been incurred for
restructuring measures in Europe.
MAN Power Engineering generated sales revenue of €1.7 bil-
lion in the first six months of 2016, a decrease of 7.7% year-on-year.
This reduced the operating profit by €32 million to €103 million.
At €995 million, the operating profit at Volkswagen Financial Services in the reporting period was 2.6% higher than in the pre-
vious year. Volume-related factors in particular had a positive effect.
K E Y F I G U R E S B Y B R A N D A N D B U S I N E S S F I E L D F R O M J A N UA RY 1 TO J U N E 3 0 1
V E H I C L E SA L E S S A L E S R E V EN U E
S A L E S T O T H I R D
P A R T I E S O P E R A T I N G R E S UL T
thousand units/€ million 2016 2015 2016 2015 2016 2015 2016 2015
Volkswagen Passenger Cars 2,232 2,251 53,006 53,578 34,644 36,426 881 1,428
Audi 799 784 30,134 29,784 19,452 19,775 2,666 2,914
ŠKODA 431 421 7,114 6,421 3,465 3,227 685 522
SEAT 276 286 4,485 4,469 1,912 1,873 93 52
Bentley 5 5 883 939 643 621 – 22 54
Porsche2 117 109 10,929 10,850 10,028 9,912 1,830 1,698
Volkswagen Commercial Vehicles 231 231 5,406 5,223 2,700 2,487 299 268
Scania2 41 38 5,575 5,182 5,575 5,182 550 503
MAN Commercial Vehicles 49 50 4,798 4,919 4,450 4,781 186 54
MAN Power Engineering – – 1,673 1,813 1,672 1,812 103 135
VW China3 1,867 1,743 – – – – – –
Other – 849 – 827 – 29,679 – 27,420 11,119 10,816 – 7494 – 1,6084
Volkswagen Financial Services – – 13,611 13,018 12,276 11,862 995 970
Volkswagen Group before special items – – – – – – 7,517 6,990
Special items – – – – – – – 2,178 – 170
Volkswagen Group 5,199 5,090 107,935 108,776 107,935 108,776 5,339 6,820
Automotive Division5 5,199 5,090 92,547 94,093 94,085 95,412 4,162 5,700
of which: Passenger Cars Business Area 4,879 4,772 75,285 77,129 80,004 81,449 3,895 5,346
Commercial Vehicles Business Area 320 318 15,589 15,151 12,410 12,150 285 349
Power Engineering Business Area – – 1,673 1,813 1,672 1,812 – 18 5
Financial Services Division – – 15,388 14,683 13,850 13,364 1,177 1,120
1 All figures shown are rounded, so minor discrepancies may arise from addition of these amounts. 2 Including financial services. 3 The sales revenue and operating profit of the joint venture companies in China are not included in the figures for the Group. The Chinese companies are accounted for using the equity
method and recorded a proportionate operating profit of €2,366 (2,744) million. 4 Mainly intragroup items recognized in profit or loss, in particular from the elimination of intercompany profits; the figure includes depreciation and amortization of identifiable assets
as part of purchase price allocation for Scania, Porsche Holding Salzburg, MAN and Porsche. 5 Including allocation of consolidation adjustments between the Automotive and Financial Services divisions.

B R A N D S A N D B U S I N E S S F I E L D S
25
U N I T S A L E S A N D S A L E S R E V E N U E B Y M A R K E T
At 2.4 million vehicles, the Volkswagen Group sold 3.1% more units in the first half of 2016 in the Europe/Other markets region than in
the previous year. Sales revenue rose to €69.9 (67.6) billion.
Buoyed by higher demand in Mexico, the Volkswagen Group
lifted unit sales in the North American market by 2.8% year-on-year
in the reporting period to 469 thousand vehicles. Sales revenue was
marginally below the prior-year level at €17.0 (17.4) billion. In the South American markets the economic conditions
remained difficult in the first six months of 2016, reducing the
Volkswagen Group’s unit sales in this region by 22.5% to 219 thou-
sand vehicles. Sales revenue was down 29.6% to €3.8 billion, attributable to lower volumes and the unfavorable exchange rate
trend.
In the Asia-Pacific region we sold a total of 2.1 million vehicles
between January and June of this year – including the Chinese joint
ventures; this represents an increase of 4.4% as against the
previous year. Sales revenue, which does not include our equity-accounted Chinese joint ventures, was down 6.4% on 2015 at
€17.3 billion as a result of volume and exchange rate effects.
K E Y F I G U R E S B Y M A R K E T F R O M J A N UA RY 1 TO J U N E 3 0 1
V E H I C L E SA L E S S A L E S R E V EN U E
thousand units/€ million 2016 2015 2016 2015
Europe/Other markets 2,392 2,321 69,861 67,568
North America 469 457 17,044 17,414
South America 219 283 3,777 5,365
Asia-Pacific2 2,119 2,030 17,254 18,429
Volkswagen Group2 5,199 5,090 107,935 108,776
1 All figures shown are rounded, so minor discrepancies may arise from addition of these amounts. 2 The sales revenue of the joint venture companies in China is not included in the figures for the Group and the Asia-Pacific market.
B R A N D S A N D B U S I N E S S F I E L D S
26
VO L K SWA G E N F I N A N C I A L S E RV I C E S
Volkswagen Financial Services supported the Volkswagen Group’s sales growth in the first half of 2016 with its innovative products
along the automotive value chain.
Volkswagen Bank GmbH was voted Best Brand in the Automotiv
Bank category by readers of auto motor sport magazine. This was
the tenth consecutive time that Volkswagen Bank GmbH received
this accolade, beating 25 competitors in the 2016 survey. Readers of Auto Bild magazine chose Volkswagen Bank GmbH
as Best Automotive Bank for the fifth time in succession, with over
60,000 readers participating in the poll.
The finals of the “Just Leasing – Play. Learn. Win” university
competition initiated by Volkswagen Financial Services AG took
place in April 2016. A total of 120 teams from 55 German third-level institutions took part in the leasing business game. The participants
took over management of their virtual leasing companies and in
different rounds of the game had to make practical decisions, for
example in the areas of Sales, Human Resources, or Finance.
In light of the growing digitalization, Volkswagen Financial
Services has established a new communications channel, “VWFS – News2Go”, on which Group-wide information can also be called up
in a flexible manner with the use of audio clips. The first pilot
broadcasts have been compiled for staff and executives from the
sales force.
The main refinancing sources for Volkswagen Financial Ser-
vices are money and capital market instruments, asset-backed
securities (ABS) transactions and customer deposits from the direct
banking business. The ABS program was successfully continued in the first half of 2016 with the placement of the 23rd transaction
involving collateralized financing contracts, VCL 23, with a volume
of around €750 million. Volkswagen Financial Services AG issued
its first bond denominated in Chinese renminbi in the reporting
period. The successfully placed three-year bond has a volume of
2 billion renminbi. The number of new financing, leasing, service and insurance
contracts signed in the first half of 2016 rose by 15.2% year-on-year
to 3.3 million. The total number of contracts amounted to 15.4 mil-
lion as of June 30, 2016, an increase of 5.1% on the figure for
December 31, 2015. In the Customer Financing/Leasing area, the
number of contracts rose slightly by 3.4% compared with the 2015 year-end figure to 8.6 million. The number of contracts in the
Service/Insurance area was up 7.4% year-on-year to 6.8 million.
The underlying contract types were modified according to their
significance. Based on unchanged credit eligibility criteria, the
penetration rate, expressed as the ratio of leased or financed vehi-
cles to relevant Group delivery volumes, increased to 32.5 (29.5)%. Volkswagen Bank’s direct banking business had approximately
1.5 (1.4) million accounts at the end of the first half of 2016.
Volkswagen Financial Services had a total of 13,151 employees
as of June 30, 2016, unchanged on the December 31, 2015 level.

I N T E R I M C O N S O L I D AT E D F I N A N C I A L STAT E M E N T S ( C O N D E N S E D )
Income Statement
27
I NCOME STATEMENT FOR TH E PERIOD JAN UARY 1 TO J UN E 30
V O L K S W A G E N G R OU P D I V I S I ON S
A U T OM O T I V E¹ F I N A N C I A L S E R V I C E S
€ million 2016 2015 2016 2015 2016 2015
Sales revenue 107,935 108,776 92,547 94,093 15,388 14,683
Cost of sales – 86,790 – 87,078 – 74,290 – 75,427 – 12,501 – 11,651
Gross profit 21,145 21,698 18,257 18,666 2,888 3,032
Distribution expenses – 10,751 – 10,431 – 10,139 – 9,819 – 612 – 613
Administrative expenses – 3,670 – 3,626 – 2,889 – 2,818 – 782 – 808
Other operating income/expense – 1,385 – 821 – 1,068 – 330 – 317 – 491
Operating profit 5,339 6,820 4,162 5,700 1,177 1,120
Share of profits and losses of equity-accounted investments 1,715 2,241 1,679 2,222 36 19
Other financial result – 2,243 – 1,397 – 2,174 – 1,437 – 69 39
Financial result – 528 843 – 495 785 – 34 58
Profit before tax 4,810 7,664 3,667 6,485 1,144 1,179
Income tax expense – 1,231 – 2,000 – 775 – 1,603 – 457 – 397
Profit after tax 3,579 5,663 2,892 4,882 687 781
of which attributable to
Noncontrolling interests 6 7 – 44 – 5 49 12
Volkswagen AG hybrid capital investors 112 99 112 99 – –
Volkswagen AG shareholders 3,461 5,558 2,824 4,789 638 770
Basic earnings per ordinary share (€)² 6.88 11.06
Diluted earnings per ordinary share (€)² 6.88 11.06
Basic earnings per preferred share (€)² 6.94 11.12
Diluted earnings per preferred share (€)² 6.94 11.12
1 Including allocation of consolidation adjustments between the Automotive and Financial Services divisions. 2 Explanatory information on earnings per share is presented in note 4. Prior-year figures restated to reflect application of IAS 33.26.
Interim Consolidated Financial Statements
(Condensed)

I N T E R I M C O N S O L I D AT E D F I N A N C I A L STAT E M E N T S ( C O N D E N S E D )
Statement of Comprehensive Income
28
STATEMENT OF COMPREH ENSIVE I NCOME FOR TH E PERIOD JAN UARY 1 TO J U N E 30
€ million 2016 2015
Profit after tax 3,579 5,663
Pension plan remeasurements recognized in other comprehensive income
Pension plan remeasurements recognized in other comprehensive income, before tax – 7,512 1,773
Deferred taxes relating to pension plan remeasurements recognized in other comprehensive income 2,219 – 523
Pension plan remeasurements recognized in other comprehensive income, net of tax – 5,293 1,250
Share of other comprehensive income of equity-accounted investments that will not be reclassified to profit or loss, net of tax – 1 – 3
Items that will not be reclassified to profit or loss – 5,294 1,248
Exchange differences on translating foreign operations
Unrealized currency translation gains/losses – 729 1,829
Transferred to profit or loss 0 0
Exchange differences on translating foreign operations, before tax – 729 1,829
Deferred taxes relating to exchange differences on translating foreign operations 0 0
Exchange differences on translating foreign operations, net of tax – 729 1,829
Cash flow hedges
Fair value changes recognized in other comprehensive income 3,912 – 7,589
Transferred to profit or loss 894 2,243
Cash flow hedges, before tax 4,806 – 5,346
Deferred taxes relating to cash flow hedges – 1,401 1,576
Cash flow hedges, net of tax 3,405 – 3,770
Available-for-sale financial assets
Fair value changes recognized in other comprehensive income 60 588
Transferred to profit or loss 16 – 182
Available-for-sale financial assets, before tax 76 406
Deferred taxes relating to available-for-sale financial assets – 20 50
Available-for-sale financial assets, net of tax 56 456
Share of other comprehensive income of equity-accounted investments that may be reclassified subsequently to profit or loss, net of tax – 172 473
Items that may be reclassified subsequently to profit or loss 2,560 – 1,011
Other comprehensive income, before tax – 3,531 – 867
Deferred taxes relating to other comprehensive income 798 1,104
Other comprehensive income, net of tax – 2,733 237
Total comprehensive income 846 5,900
of which attributable to
Noncontrolling interests 4 8
Volkswagen AG hybrid capital investors 112 99
Volkswagen AG shareholders 730 5,794

I N T E R I M C O N S O L I D AT E D F I N A N C I A L STAT E M E N T S ( C O N D E N S E D )
Income Statement
29
I NCOME STATEMENT FOR TH E PERIOD APRI L 1 TO J U N E 30
V O L K S W A G E N G R OU P D I V I S I ON S
A U T OM O T I V E¹ F I N A N C I A L S E R V I C E S
€ million 2016 2015 2016 2015 2016 2015
Sales revenue 56,971 56,041 49,017 48,287 7,954 7,754
Cost of sales – 46,124 – 44,652 – 39,565 – 38,454 – 6,559 – 6,198
Gross profit 10,847 11,389 9,452 9,832 1,395 1,557
Distribution expenses – 5,647 – 5,455 – 5,351 – 5,144 – 295 – 311
Administrative expenses – 1,890 – 1,811 – 1,513 – 1,399 – 377 – 412
Other operating income/expense – 1,412 – 631 – 1,275 – 446 – 137 – 186
Operating profit 1,899 3,492 1,312 2,844 587 648
Share of profits and losses of equity-accounted investments 601 1,095 585 1,086 16 8
Other financial result – 892 – 891 – 896 – 917 4 26
Financial result – 291 204 – 312 170 20 34
Profit before tax 1,607 3,696 1,000 3,014 607 682
Income tax expense – 393 – 965 – 197 – 687 – 197 – 278
Profit after tax 1,214 2,731 804 2,328 410 404
of which attributable to
Noncontrolling interests 3 5 0 – 1 3 6
Volkswagen AG hybrid capital investors 56 56 56 56 – –
Volkswagen AG shareholders 1,155 2,671 748 2,273 408 398
Basic earnings per ordinary share (€)² 2.30 5.33
Diluted earnings per ordinary share (€)² 2.30 5.33
Basic earnings per preferred share (€)² 2.30 5.33
Diluted earnings per preferred share (€)² 2.30 5.33
1 Including allocation of consolidation adjustments between the Automotive and Financial Services divisions. 2 Explanatory information on earnings per share is presented in note 4. Prior-year figures restated to reflect application of IAS 33.26.

I N T E R I M C O N S O L I D AT E D F I N A N C I A L STAT E M E N T S ( C O N D E N S E D )
Statement of Comprehensive Income
30
STATEMENT OF COMPREH ENSIVE I NCOME FOR TH E PERIOD APRI L 1 TO J UN E 30
€ million 2016 2015
Profit after tax 1,214 2,731
Pension plan remeasurements recognized in other comprehensive income
Pension plan remeasurements recognized in other comprehensive income, before tax – 3,201 7,281
Deferred taxes relating to pension plan remeasurements recognized in other comprehensive income 946 – 2,159
Pension plan remeasurements recognized in other comprehensive income, net of tax – 2,255 5,123
Share of other comprehensive income of equity-accounted investments that will not be reclassified to profit or loss, net of tax 0 0
Items that will not be reclassified to profit or loss – 2,255 5,123
Exchange differences on translating foreign operations
Unrealized currency translation gains/losses 153 – 697
Transferred to profit or loss – 0
Exchange differences on translating foreign operations, before tax 153 – 697
Deferred taxes relating to exchange differences on translating foreign operations 0 0
Exchange differences on translating foreign operations, net of tax 153 – 697
Cash flow hedges
Fair value changes recognized in other comprehensive income – 80 1,854
Transferred to profit or loss 467 1,100
Cash flow hedges, before tax 387 2,955
Deferred taxes relating to cash flow hedges – 115 – 845
Cash flow hedges, net of tax 272 2,110
Available-for-sale financial assets
Fair value changes recognized in other comprehensive income 38 168
Transferred to profit or loss – 16 – 142
Available-for-sale financial assets, before tax 22 26
Deferred taxes relating to available-for-sale financial assets – 7 61
Available-for-sale financial assets, net of tax 14 87
Share of other comprehensive income of equity-accounted investments that may be reclassified subsequently to profit or loss, net of tax – 2 – 158
Items that may be reclassified subsequently to profit or loss 438 1,342
Other comprehensive income, before tax – 2,641 9,406
Deferred taxes relating to other comprehensive income 824 – 2,942
Other comprehensive income, net of tax – 1,817 6,464
Total comprehensive income – 603 9,196
of which attributable to
Noncontrolling interests 2 6
Volkswagen AG hybrid capital investors 56 56
Volkswagen AG shareholders – 661 9,134

I N T E R I M C O N S O L I D AT E D F I N A N C I A L STAT E M E N T S ( C O N D E N S E D )
Balance Sheet
31
BALANCE SH EET AS OF J U N E 30, 2016 AN D DECEMBER 31, 2015
V O L K S WA G E N G R OU P D I V I S I ON S
A U T OM O T I V E * F I N A N C I A L S E R V I C E S
€ million 2016 2015 2016 2015 2016 2015
Assets
Noncurrent assets 238,320 236,548 130,210 132,812 108,110 103,736
Intangible assets 61,483 61,147 61,262 60,918 220 228
Property, plant and equipment 50,364 50,171 47,916 47,768 2,448 2,403
Lease assets 35,210 33,173 3,099 2,931 32,111 30,242
Financial services receivables 65,132 63,185 9 – 65,123 63,185
Investments, equity-accounted investments and other equity investments, other receivables and financial assets 26,132 28,873 17,924 21,195 8,207 7,678
Current assets 163,109 145,387 90,622 74,019 72,487 71,367
Inventories 37,716 35,048 33,739 31,369 3,977 3,679
Financial services receivables 47,805 46,888 – 678 – 614 48,482 47,502
Other receivables and financial assets 32,646 27,572 20,842 15,315 11,804 12,257
Marketable securities 15,252 15,007 12,486 12,261 2,766 2,747
Cash, cash equivalents and time deposits 29,691 20,871 24,233 15,688 5,457 5,183
Total assets 401,429 381,935 220,832 206,831 180,597 175,103
Equity and Liabilities
Equity 88,890 88,270 66,947 67,366 21,943 20,905
Equity attributable to Volkswagen AG shareholders 81,156 80,500 59,546 59,898 21,610 20,603
Equity attributable to Volkswagen AG hybrid capital investors 7,519 7,560 7,519 7,560 – –
Equity attributable to Volkswagen AG shareholders and hybrid capital investors 88,675 88,060 67,065 67,458 21,610 20,603
Noncontrolling interests 215 210 – 118 – 92 333 302
Noncurrent liabilities 151,713 145,175 79,201 73,568 72,512 71,607
Financial liabilities 70,499 73,292 6,468 9,557 64,031 63,735
Provisions for pensions 35,247 27,535 34,692 27,119 555 415
Other liabilities 45,967 44,349 38,041 36,892 7,926 7,457
Current liabilities 160,826 148,489 74,684 65,898 86,142 82,591
Put options and compensation rights granted to noncontrolling interest shareholders 3,689 3,933 3,689 3,933 – –
Financial liabilities 81,706 72,313 2,316 – 3,974 79,390 76,286
Trade payables 21,811 20,460 19,559 18,709 2,252 1,751
Other liabilities 53,621 51,783 49,121 47,229 4,499 4,554
Total equity and liabilities 401,429 381,935 220,832 206,831 180,597 175,103
* Including allocation of consolidation adjustments between the Automotive and Financial Services divisions, primarily intragroup loans.

I N T E R I M C O N S O L I D AT E D F I N A N C I A L STAT E M E N T S ( C O N D E N S E D )
Statement of Changes in Equity
32
STATEMENT OF CHANGES I N EQUITY
O T H ER R E S ER V E S
€ million Subscribed capital Capital reserves Retained earnings
Currency
translation reserve
Balance at Jan. 1, 2015 1,218 14,616 71,197 – 1,777
Profit after tax – – 5,558 –
Other comprehensive income, net of tax – – 1,250 1,828
Total comprehensive income – – 6,809 1,828
Capital increase* 0 0 – –
Dividend payment – – – 2,294 –
Capital transactions involving a change in ownership interest – – 0 –
Other changes – – – 7 –
Balance at June 30, 2015 1,218 14,616 75,704 51
Balance at Jan. 1, 2016 1,283 14,551 69,039 – 987
Profit after tax – – 3,461 –
Other comprehensive income, net of tax – – – 5,291 – 729
Total comprehensive income – – – 1,829 – 729
Capital increase – – – –
Dividend payment – – – 68 –
Capital transactions involving a change in ownership interest – – – –
Other changes – – – 13 –
Balance at June 30, 2016 1,283 14,551 67,130 – 1,716
* Volkswagen AG recorded an inflow of cash funds amounting to €2,500 million, less a discount of €29 million and transaction costs of €14 million, from the hybrid capital issued in March 2015. Additionally, there were noncash effects from the deferral of taxes amounting to €11 million. The hybrid capital is required to be classified as equity instruments granted.

I N T E R I M C O N S O L I D AT E D F I N A N C I A L STAT E M E N T S ( C O N D E N S E D )
Statement of Changes in Equity
33
Cash flow hedges
Available-for-sale
financial assets
Equity-accounted
investments
Equity attributable to
Volkswagen AG hybrid
capital investors
Equity attributable to
Volkswagen AG
shareholders and hybrid
capital investors
Noncontrolling
interests Total equity
– 1,715 1,263 148 5,041 89,991 198 90,189
– – – 99 5,657 7 5,663
– 3,769 456 470 – 235 1 237
– 3,769 456 470 99 5,892 8 5,900
– – – 2,469 2,469 – 2,469
– – – – 128 – 2,422 – 6 – 2,429
– – – – 0 0 0
– – – 32 25 7 32
– 5,485 1,719 618 7,513 95,955 207 96,162
– 3,912 – 16 542 7,560 88,060 210 88,270
– – – 112 3,573 6 3,579
3,405 56 – 173 – – 2,731 – 2 – 2,733
3,405 56 – 173 112 842 4 846
– – – – – – –
– – – – 204 – 272 – 5 – 277
– – – – – – –
– – 6 51 44 7 51
– 507 40 376 7,519 88,675 215 88,890

I N T E R I M C O N S O L I D AT E D F I N A N C I A L STAT E M E N T S ( C O N D E N S E D )
Cash flow statement
34
CASH FLOW STATEMENT FOR TH E PERIOD JAN UARY 1 TO J UN E 30
V O L K S WA G E N G R OU P D I V I S I ON S
A U T OM O T I V E¹ F I N A N C I A L S E R V I C E S
€ million 2016 2015² 2016 2015² 2016 2015
Cash and cash equivalents at beginning of period 20,462 18,634 15,294 16,010 5,168 2,624
Profit before tax 4,810 7,664 3,667 6,485 1,144 1,179
Income taxes paid – 1,724 – 1,924 – 2,138 – 1,841 414 – 83
Depreciation and amortization expense3 10,007 8,947 6,813 6,159 3,195 2,788
Change in pension provisions 169 209 165 200 3 9
Other noncash income/expense and reclassifications4 1,977 3, 334 1,981 3,002 – 4 332
Gross cash flow 15,239 18,230 10,487 14,005 4,752 4,225
Change in working capital – 10,128 – 10,783 – 751 – 2,771 – 9,377 – 8,012
Change in inventories – 2,835 – 2,797 – 2,516 – 2,967 – 319 170
Change in receivables – 4,545 – 3,824 – 4,486 – 3,864 – 59 40
Change in liabilities 4,488 3,376 3,650 2,964 838 412
Change in other provisions 3,159 1,425 3,092 1,412 67 12
Change in lease assets (excluding depreciation) – 6,078 – 4,845 – 567 – 391 – 5,511 – 4,454
Change in financial services receivables – 4,318 – 4,118 76 74 – 4,393 – 4,192
Cash flows from operating activities 5,111 7,447 9,736 11,234 – 4,625 – 3,787
Cash flows from investing activities attributable to operating activities – 5,149 – 6,993 – 4,601 – 6,761 – 548 – 231
of which: Investments in intangible assets (excluding capitalized development costs), property, plant and equipment, and investment property – 4,661 – 4,823 – 4,515 – 4,652 – 146 – 171
capitalized development costs – 2,582 – 2,170 – 2,582 – 2,170 – –
acquisition and disposal of equity investments 1,917 – 166 2,338 – 89 – 420 – 77
Net cash flow5 – 38 454 5,135 4,473 – 5,173 – 4,018
Change in investments in securities and loans 926 – 3,944 1,112 – 3,121 – 186 – 823
Cash flows from investing activities – 4,224 – 10,937 – 3,489 – 9,882 – 735 – 1,055
Cash flows from financing activities 8,169 1,318 2,502 – 2,964 5,667 4,282
Effect of exchange rate changes on cash and cash equivalents – 179 444 – 143 401 – 36 43
Net change in cash and cash equivalents 8,877 – 1,728 8,605 – 1,212 271 – 516
Cash and cash equivalents at June 30 29,338 16,906 23,899 14,798 5,439 2,108
Securities, loans and time deposits 23,328 23,166 13,663 14,765 9,665 8,401
Gross liquidity 52,666 40,072 37,561 29,563 15,104 10,509
Total third-party borrowings – 152,205 – 139,378 – 8,784 – 8,074 – 143,421 – 131,304
Net liquidity at June 30 – 99,539 – 99,306 28,778 21,489 – 128,317 – 120,796
For information purposes: at Jan. 1 – 100,530 – 96,453 24,522 17,639 – 125,052 – 114,092
1 Including allocation of consolidation adjustments between the Automotive and Financial Services divisions. 2 Prior-year figures adjusted. 3 Net of impairment reversals. 4 These relate mainly to the fair value measurement of financial instruments, application of the equity method and reclassification of gains/losses on disposal of
noncurrent assets and equity investments to investing activities. 5 Net cash flow: cash flows from operating activities, net of cash flows from investing activities attributable to operating activities.
Explanatory notes on the cash flow statement are presented in note 12.

I N T E R I M C O N S O L I D AT E D F I N A N C I A L STAT E M E N T S ( C O N D E N S E D )
Notes to the Interim Consolidated Financial Statements
35
Accounting in accordance with International Financial Reporting Standards (IFRSs)
In accordance with Regulation No. 1606/2002 of the European Parliament and of the Council, Volkswagen AG prepared its
consolidated financial statements for 2015 in compliance with the International Financial Reporting Standards (IFRS), as adopted by the European Union. These interim consolidated financial statements for the period ended June 30, 2016 were
therefore also prepared in accordance with IAS 34 and are condensed in scope compared with the consolidated financial
statements.
All figures shown are rounded, so minor discrepancies may arise from addition of these amounts.
In addition to the reportable segments, the Automotive and Financial Services divisions are presented in the
condensed interim group financial report for explanatory purposes alongside the income statement, balance sheet and cash flow statement for the Volkswagen Group. This supplemental presentation is not required by IFRSs. Eliminations of
intragroup transactions between the Automotive and Financial Services divisions are allocated to the Automotive Division.
The accompanying interim consolidated financial statements were reviewed by auditors in accordance with section
37w of the Wertpapierhandelsgesetz (WpHG – German Securities Trading Act).
Accounting policies
Volkswagen AG has applied all accounting pronouncements adopted by the EU and effective for periods beginning on or
after January 1, 2016.
A number of amendments to International Financial Reporting Standards resulting from the Annual Improvements
Project 2012 and the Annual Improvements Project 2014 became effective on January 1, 2016. Among others, these amendments included changes to IFRS 3, IFRS 7, IFRS 8, IFRS 13 and IAS 24. The changes to IFRS 8 Operating Segments
added a requirement to describe the criteria used to aggregate the operating segments. The segment disclosure require-
ments have therefore been clarified. Additional disclosure requirements have been included in IFRS 7 in relation to the
derecognition of financial instruments. These changes mainly relate to the presentation of ABS transactions.
Changes to IAS 19 also had to be applied from January 1, 2016 onward. These changes relate to the accounting treat-
ment of employee pension contributions. In the Volkswagen Group, employee contributions in which the amount is independent of the number of years of service (fixed percentage of salary) will in the future be deducted from the service
cost in the year the contributions are made.
The amendments to IAS 16 and IAS 38 clarified that, with effect from January 1, 2016, revenue-based methods for
measuring depreciation and amortization are not generally permitted.
The IFRS amendments described here do not materially affect the Volkswagen Group’s net assets, financial position
and results of operations. Amendments to IAS 1 introduced with effect from January 1, 2016 have clarified a large number of the concepts used
in IFRS reporting. The existing presentation in the Volkswagen interim group financial report is not affected by these
conceptual modifications and can be retained. The amendments also specified that disclosures are only required in an
interim report if the content is material.
The other financial reporting standards that have to be applied for the first time in fiscal year 2016 do not have any
significant impact on the presentation of net assets, financial position and results of operations in the Volkswagen interim group financial report. A detailed breakdown of these accounting pronouncements is provided in the “New and amended
IFRSs not applied” section of the notes to the consolidated financial statements in the 2015 Annual Report.
In addition, in the consolidated financial statements for the period ended December 31, 2015, the presentation of
hedges in the cash flow statement was adjusted so that cash flows from hedging transactions were allocated to those of the
underlying hedged items. As a result of the adjustment, during the prior-year period covered by the Volkswagen interim
Notes to the Interim Consolidated Financial
Statements

I N T E R I M C O N S O L I D AT E D F I N A N C I A L STAT E M E N T S ( C O N D E N S E D )
Notes to the Interim Consolidated Financial Statements
36
group financial report, cash flows from operating activities decreased by €319 million and cash flows from financing
activities increased by a corresponding amount.
Furthermore, changes within the scope of IFRS 7 were made to the financial statements for fiscal year 2015. The
changes were described in the section on “Accounting policies” in the 2015 consolidated financial statements. The prior-
year figures have been adjusted accordingly in the interim report of the Volkswagen Group.
A discount rate of 1.5% (December 31, 2015: 2.7%) was applied to German pension provisions in the accompanying interim consolidated financial statements. The reduction in the discount rate increased pension provisions and deferred
taxes attributable to pension provisions and also increased the actuarial losses for pension provisions that are recognized
in retained earnings.
The income tax expense for the interim reporting period was calculated on the basis of the average annual tax rate that
is expected for the entire fiscal year, in accordance with IAS 34, Interim Financial Reporting.
In other respects, the same accounting policies and consolidation methods that were used for the 2015 consolidated financial statements are generally applied to the preparation of the interim consolidated financial statements and the
measurement of the prior-year comparatives. A detailed description of the policies and methods applied is published in the
“Accounting policies” section of the notes to the 2015 consolidated financial statements. This can also be accessed on the
Internet at www.volkswagenag.com/ir.
Key events
On September 18, 2015, the U.S. Environmental Protection Agency (EPA) publicly announced in a “Notice of Violation”
that irregularities in relation to nitrogen oxide (NOx) emissions had been discovered in emissions tests on certain vehicles
with Volkswagen Group diesel engines. This was followed by further reports on the scope of the diesel issue. Detailed information can be found in the “Key events” section of the 2015 consolidated financial statements.
In this respect, additional provisions amounting to €1.6 billion were recognized in the first six months of 2016. These
additions resulted from an increase in the provisions for legal risks amounting to €1.7 billion, higher warranty costs
amounting to €0.1 billion, impairment losses on inventories amounting to €0.2 billion and impairment losses on
intangible assets, lease assets and property, plant and equipment amounting to €0.3 billion. The impairment losses
recognized on noncurrent assets resulted primarily from the lower value in use of various products in the Passenger Cars segment due to expected declines in volumes. Exchange rate-related reversals of provisions amounting to €0.3 billion and
unutilized provisions for legal risks and sales-related measures amounting to a total of €0.5 billion had an offsetting effect.
The Volkswagen Group has started entering into exchange rate hedges relating to the outstanding obligations
denominated in foreign currencies.
In addition, provisions were recognized for restructuring measures in the trucks business in South America
(€0.1 billion) and for the antitrust proceedings launched in 2011 by the European Commission against the European truck manufacturers, including MAN and Scania (€0.4 billion). Additional provisions amounting to €0.2 billion were recognized
in the reporting period in connection with the replacement of potentially faulty airbags, manufactured and supplied by
Takata, imposed by the competent authorities. Further information on the antitrust proceedings and the replacement of
airbags manufactured and supplied by Takata can be found in the “Litigation” and “Contingent assets and liabilities”
sections.
Basis of consolidation
In addition to Volkswagen AG, which is domiciled in Wolfsburg and entered in the commercial register at the
Braunschweig Local Court under No. HRB 100484, the consolidated financial statements comprise all significant German
and non-German subsidiaries, including structured entities, that are controlled directly or indirectly by Volkswagen AG. This is the case if Volkswagen AG obtains power over the potential subsidiaries directly or indirectly from voting rights or
similar rights, is exposed, or has rights to, positive or negative variable returns from its involvement with the subsidiaries,
and is able to influence those returns.

I N T E R I M C O N S O L I D AT E D F I N A N C I A L STAT E M E N T S ( C O N D E N S E D )
Notes to the Interim Consolidated Financial Statements
37
I N V E STM E N T S I N A S S O C I AT E S
On June 22, 2016, the Volkswagen Group acquired a 28.1% interest in on-demand mobility company GT Gettaxi Limited,
Limassol, Cyprus (GETT), via Volkswagen New Mobility Luxembourg S.A., Luxembourg, Luxembourg. With its subsidiaries,
GETT is active in more than 60 cities worldwide and is one of the strongest growing providers of ride hailing services.
These services are to be further expanded as part of a joint growth strategy. This strategic investment amounts to
€264 million. The investment in GETT is reported as an equity-accounted investment in the consolidated financial statements.
Audi, the BMW Group and Daimler AG each acquired a 33.3% interest in There Holding B.V., Rijswijk, the Netherlands,
which was formed in 2015. Effective December 4, 2015, There Holding B.V. acquired all shares in the HERE Group
through a wholly owned subsidiary, There Acquisition B.V., Rijswijk, the Netherlands. Audi’s share of the investment
amounts to €0.7 billion. On January 29, 2016, There Acquisition B.V. was renamed HERE International B.V. The equity
investment in There Holding B.V. is recognized as an equity-accounted investment in the consolidated financial statements. Purchase price allocation was completed in the first six months of the year.
I N T E R E ST S I N J O I N T V E N T U R E S
Through its 50% interest in the joint venture Global Mobility Holding B.V., Amsterdam, the Netherlands (GMH), the
Volkswagen Group held a 50% indirect stake in the joint venture’s subsidiary, LeasePlan Corporation N.V., Amsterdam, the Netherlands (LeasePlan). GMH’s business activity consisted of holding the interest in LeasePlan. LeasePlan is a Dutch
financial services group whose core business is leasing and fleet management. GMH’s principal place of business is in
Amsterdam, the Netherlands.
On July 23, 2015, GMH sold its 100% interest in LeasePlan to a consortium of international investors. The final
approvals for the sale of LeasePlan to an international consortium of investors were issued by the competent authorities in
January 2016. Legal transfer of the LeasePlan shares to the consortium was completed on March 21, 2016. The total value of the transaction was approximately €3.7 billion plus interest in the amount of €31.5 million. In 2016,
this had a positive effect of €2.2 billion on investing activities attributable to operating activities and net liquidity and,
taking into account the disposal of equity-accounted investment in GMH, resulted in an income amount of €0.2 billion for
the Volkswagen Group, which is reported in the financial result. On completion of the transaction, the existing credit line
of €1.3 billion provided by the Volkswagen Group was canceled.
OT H E R E Q U I T Y I N V E STM E N T S
On August 29, 2015, an arbitration ruling was delivered to the parties in the proceedings between Suzuki Motor
Corporation and Volkswagen AG. It found that Volkswagen had acted in accordance with the agreement. The arbitration
court also confirmed that Suzuki was in breach of contract and, on the merits of this case, acknowledged that Volkswagen
had a claim to damages. In addition, the arbitration court established that the parties had the right to give regular notice to
terminate the cooperation agreement. It said that Suzuki had exercised this right, ending the partnership. According to the court, the agreements had to be interpreted in such a way that Volkswagen had to sell its equity investment in Suzuki on
termination of the partnership. Volkswagen consequently sold its 19.9% equity investment to Suzuki on September 17,
2015 at the quoted market price of €3.1 billion. The sale of the shares generated income in the amount of €1.5 billion in
the third quarter of the previous year.
In February 2016, Volkswagen and Suzuki agreed a settlement regarding the claims for damages brought by Volkswagen.

I N T E R I M C O N S O L I D AT E D F I N A N C I A L STAT E M E N T S ( C O N D E N S E D )
Notes to the Interim Consolidated Financial Statements
38
DISCLOSURES ON TH E CONSOLI DATED FI NANCIAL STATEMENTS
1. Sales revenue
ST R U C T U R E O F G R O U P S A L E S R E V E N U E
H 1
€ million 2016 2015
Vehicles 68,890 71,823
Genuine parts 7,582 7,237
Used vehicles and third-party products 6,479 5,509
Engines, powertrains and parts deliveries 4,782 4,672
Power Engineering 1,672 1,812
Motorcycles 409 361
Leasing business 10,775 10,170
Interest and similar income 3,309 3,409
Other sales revenue 4,038 3,783
107,935 108,776
2. Cost of sales
Cost of sales includes interest expenses of €948 million (previous year: €972 million) attributable to the financial services
business.
In addition to depreciation and amortization expenses, cost of sales also includes impairment losses on intangible assets, items of property, plant and equipment, and lease assets. The impairment losses identified on the basis of updated
impairment tests amount to a total of €572 million (previous year: €260 million). The value in use of Volkswagen Group
products is used as the basis for calculating impairment losses. The increase in impairment losses is primarily a result of
the lower value in use of various products in the Passenger Cars segment due to expected declines in volumes (see also the
“Key events” section).
3. Research and development costs in the Automotive Division
H 1
€ million 2016 2015 %
Total research and development costs 6,619 6,648 – 0.4
of which: capitalized development costs 2,582 2,170 19.0
Capitalization ratio in % 39.0 32.6
Amortization of capitalized development costs 1,803 1,521 18.6
Research and development costs recognized in the income statement 5,840 5,999 – 2.6
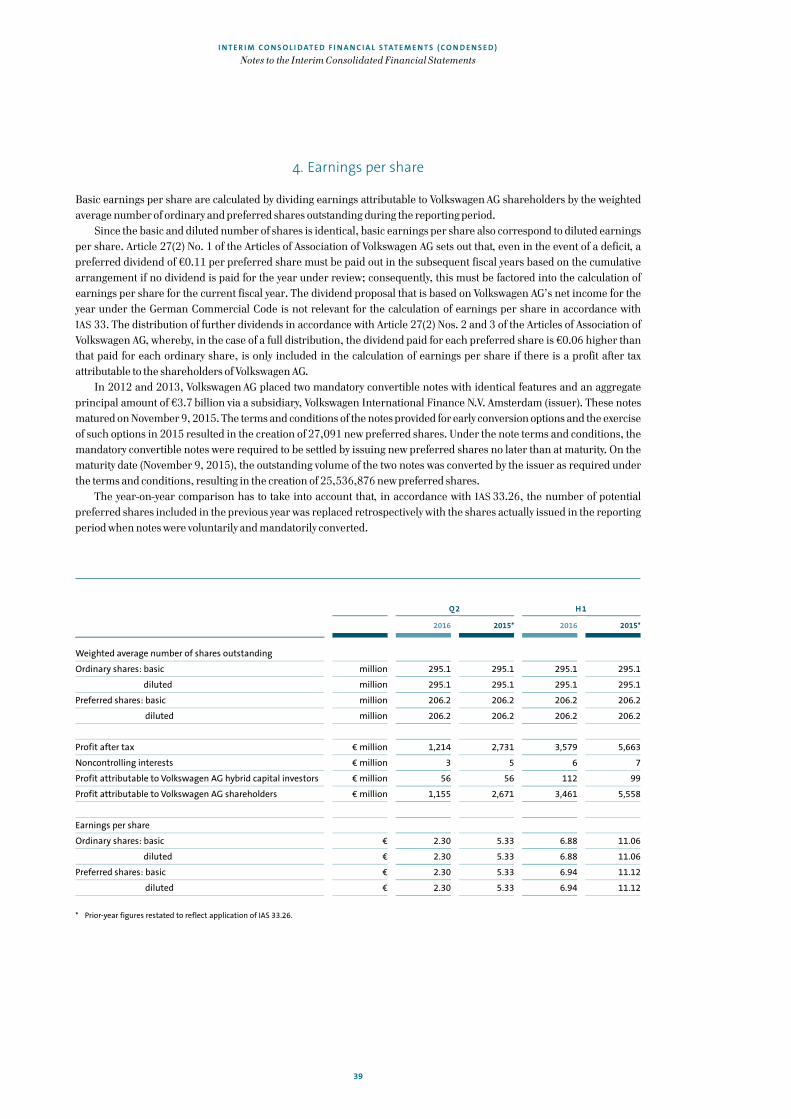
I N T E R I M C O N S O L I D AT E D F I N A N C I A L STAT E M E N T S ( C O N D E N S E D )
Notes to the Interim Consolidated Financial Statements
39
4. Earnings per share
Basic earnings per share are calculated by dividing earnings attributable to Volkswagen AG shareholders by the weighted
average number of ordinary and preferred shares outstanding during the reporting period.
Since the basic and diluted number of shares is identical, basic earnings per share also correspond to diluted earnings
per share. Article 27(2) No. 1 of the Articles of Association of Volkswagen AG sets out that, even in the event of a deficit, a preferred dividend of €0.11 per preferred share must be paid out in the subsequent fiscal years based on the cumulative
arrangement if no dividend is paid for the year under review; consequently, this must be factored into the calculation of
earnings per share for the current fiscal year. The dividend proposal that is based on Volkswagen AG’s net income for the
year under the German Commercial Code is not relevant for the calculation of earnings per share in accordance with
IAS 33. The distribution of further dividends in accordance with Article 27(2) Nos. 2 and 3 of the Articles of Association of
Volkswagen AG, whereby, in the case of a full distribution, the dividend paid for each preferred share is €0.06 higher than that paid for each ordinary share, is only included in the calculation of earnings per share if there is a profit after tax
attributable to the shareholders of Volkswagen AG.
In 2012 and 2013, Volkswagen AG placed two mandatory convertible notes with identical features and an aggregate
principal amount of €3.7 billion via a subsidiary, Volkswagen International Finance N.V. Amsterdam (issuer). These notes
matured on November 9, 2015. The terms and conditions of the notes provided for early conversion options and the exercise
of such options in 2015 resulted in the creation of 27,091 new preferred shares. Under the note terms and conditions, the mandatory convertible notes were required to be settled by issuing new preferred shares no later than at maturity. On the
maturity date (November 9, 2015), the outstanding volume of the two notes was converted by the issuer as required under
the terms and conditions, resulting in the creation of 25,536,876 new preferred shares.
The year-on-year comparison has to take into account that, in accordance with IAS 33.26, the number of potential
preferred shares included in the previous year was replaced retrospectively with the shares actually issued in the reporting
period when notes were voluntarily and mandatorily converted.
Q 2 H 1
2016 2015* 2016 2015*
Weighted average number of shares outstanding
Ordinary shares: basic million 295.1 295.1 295.1 295.1
diluted million 295.1 295.1 295.1 295.1
Preferred shares: basic million 206.2 206.2 206.2 206.2
diluted million 206.2 206.2 206.2 206.2
Profit after tax € million 1,214 2,731 3,579 5,663
Noncontrolling interests € million 3 5 6 7
Profit attributable to Volkswagen AG hybrid capital investors € million 56 56 112 99
Profit attributable to Volkswagen AG shareholders € million 1,155 2,671 3,461 5,558
Earnings per share
Ordinary shares: basic € 2.30 5.33 6.88 11.06
diluted € 2.30 5.33 6.88 11.06
Preferred shares: basic € 2.30 5.33 6.94 11.12
diluted € 2.30 5.33 6.94 11.12
* Prior-year figures restated to reflect application of IAS 33.26.

I N T E R I M C O N S O L I D AT E D F I N A N C I A L STAT E M E N T S ( C O N D E N S E D )
Notes to the Interim Consolidated Financial Statements
40
5. Noncurrent assets
C H A N G E S I N S E L E C T E D N O N C U R R E N T A S S E T S B E T W E E N J A N UA RY 1 A N D J U N E 3 0 , 2 0 1 6
€ million Carrying amount
at Jan. 1, 2016
Additions/
Changes in
consolidated
Group
Disposals/
Other changes
Depreciation
and amortization
Carrying amount
at June 30, 2016
Intangible assets 61,147 2,701 80 2,284 61,483
Property, plant and equipment 50,171 4,606 193 4,220 50,364
Lease assets 33,173 10,064 4,542 3,485 35,210
6. Inventories
€ million June 30, 2016 Dec. 31, 2015
Raw materials, consumables and supplies 4,155 4,021
Work in progress 3,891 3,927
Finished goods and purchased merchandise 24,778 23,083
Current lease assets 4,688 3,861
Prepayments 204 156
37,716 35,048
Impairment losses of €0.2 billion were recognized on inventories in connection with the diesel issue in the reporting
period. There was no requirement to recognize or reverse additional significant impairment losses on inventories.
7. Current other receivables and financial assets
€ million June 30, 2016 Dec. 31, 2015
Trade receivables 12,987 11,132
Miscellaneous other receivables and financial assets 19,660 16,440
32,646 27,572
In the period January 1 to June 30, 2016, impairment losses and reversals of impairment losses on noncurrent and
current financial assets reduced operating profit by €271 million (previous year: €386 million).

I N T E R I M C O N S O L I D AT E D F I N A N C I A L STAT E M E N T S ( C O N D E N S E D )
Notes to the Interim Consolidated Financial Statements
41
8. Equity
In March 2015, Volkswagen AG placed unsecured subordinated hybrid notes with an aggregate principal amount of
€2.5 billion via a subsidiary, Volkswagen International Finance N.V. Amsterdam (issuer). Under IAS 32, the hybrid notes
must be classified in their entirety as equity.
The subscribed capital is composed of 295,089,818 no-par value ordinary shares and 206,205,445 no-par-value pre-ferred shares, and amounts to €1,283 million (December 2015: €1,283 million).
Volkswagen AG distributed a dividend of €68 million (previous year: €2,294 million) in the reporting period.
€32 million (previous year: €1,416 million) of this amount was attributable to ordinary shares and €35 million (previous
year: €878 million) to preferred shares.
The noncontrolling interests are largely attributable to shareholders of RENK AG and AUDI AG.
9. Noncurrent financial liabilities
€ million June 30, 2016 Dec. 31, 2015
Bonds, commercial paper and notes 56,175 58,824
Liabilities to banks 9,686 11,101
Deposit business 2,544 1,141
Other financial liabilities 2,093 2,226
70,499 73,292
10. Current financial liabilities
€ million June 30, 2016 Dec. 31, 2015
Bonds, commercial paper and notes 33,799 30,319
Liabilities to banks 17,682 16,018
Deposit business 29,452 25,357
Other financial liabilities 772 618
81,706 72,313

I N T E R I M C O N S O L I D AT E D F I N A N C I A L STAT E M E N T S ( C O N D E N S E D )
Notes to the Interim Consolidated Financial Statements
42
11. Fair value disclosures
The principles and techniques used for fair value measurement remained unchanged year-on-year. Detailed explanations
of the measurement principles and techniques can be found in the “Accounting policies” section of the 2015 consolidated
financial statements.
Fair value generally corresponds to the market or quoted market price. If no active market exists, fair value is deter-mined using valuation techniques, such as by discounting the future cash flows at the market interest rate, or by using
recognized option pricing models.
Assets and liabilities measured at fair value through profit or loss consist of derivatives or components of derivatives
that are not included in hedge accounting. These relate primarily to the interest component of currency forwards used to
hedge sales revenue, commodity futures and currency forwards relating to commodity futures.
Available-for-sale financial assets (debt instruments) are carried at fair value. Changes in fair value are recognized directly in equity, net of deferred taxes.
Other equity investments (shares representing an ownership interest of less than 20% as a rule) are also classified as
available-for-sale financial assets. They are recognized at cost in the consolidated financial statements if there is no active
market for those shares and fair values cannot be reliably ascertained without undue cost or effort. The lower present value
of the estimated future cash flows is recognized if there are indications of impairment. There is currently no intention to
sell these financial assets. Uniform valuation techniques and inputs are used to measure fair value. The fair value of Level 2 and 3 financial
instruments is measured in the individual divisions on the basis of Group-wide specifications. The fair value of put options
and compensation rights granted to noncontrolling interest shareholders is calculated using a present value model based
on the contractually agreed cash settlement, including cash compensation, as well as the minimum statutory interest rate
and a risk-adjusted discount rate for a matching maturity.
Reconciliation of balance sheet items to classes of financial instruments
The following table shows the reconciliation of the balance sheet items to the relevant classes of financial instruments,
broken down by the carrying amount and fair value of the financial instruments.
The fair value of financial instruments measured at amortized cost, such as receivables and liabilities, is calculated by
discounting using a market rate of interest for a similar risk and matching maturity. For reasons of materiality, the fair
value of current balance sheet items is generally deemed to be their carrying amount. In the reconciliation presented in the following tables, equity instruments recognized at their carrying amount are allocated to Level 3 of the fair value hierarchy.

I N T E R I M C O N S O L I D AT E D F I N A N C I A L STAT E M E N T S ( C O N D E N S E D )
Notes to the Interim Consolidated Financial Statements
43
R E C O N C I L I AT I O N O F B A L A N C E S H E E T I T E M S TO C L A S S E S O F F I N A N C I A L I N ST R U M E N T S A S O F D E C E M B E R 3 1 , 2 0 1 5
M E A S UR ED
A T F A I R V A L U E
M E A S UR ED A T
A M OR T I Z ED C O S T
D E R I V A T I V E
F I N A N C I A L
I N S T R U M EN T S
W I T H I N
H E D G E
A C C O UN T I N G
N O T W I T H I N
S C O P E OF
I F R S 7
B A L A N C E
S H E E T I T EM A T
D E C . 3 1 ,
2 0 1 5
€ million Carrying
amount
Carrying
amount Fair value
Carrying
amount
Carrying
amount
Noncurrent assets
Equity-accounted investments – – – – 10,904 10,904
Other equity investments 211 – – – 763 974
Financial services receivables – 63,185 64,630 – – 63,185
Other financial assets 996 4,484 4,492 1,249 – 6,730
Current assets
Trade receivables – 11,132 11,132 – – 11,132
Financial services receivables – 46,888 46,888 – – 46,888
Other financial assets 885 7,963 7,963 1,196 – 10,043
Marketable securities 15,007 – – – – 15,007
Cash, cash equivalents and time deposits – 20,871 20,871 – – 20,871
Noncurrent liabilities
Noncurrent financial liabilities – 73,292 73,844 – – 73,292
Other noncurrent financial liabilities 1,325 1,996 1,998 2,580 – 5,901
Current liabilities
Put options and compensation rights granted to noncontrolling interest shareholders – 3,933 3,783 – – 3,933
Current financial liabilities – 72,313 72,313 – – 72,313
Trade payables – 20,460 20,460 – – 20,460
Other current financial liabilities 1,074 5,551 5,551 3,725 – 10,350

I N T E R I M C O N S O L I D AT E D F I N A N C I A L STAT E M E N T S ( C O N D E N S E D )
Notes to the Interim Consolidated Financial Statements
44
R E C O N C I L I AT I O N O F B A L A N C E S H E E T I T E M S TO C L A S S E S O F F I N A N C I A L I N ST R U M E N T S A S O F J U N E 3 0 , 2 0 1 6
M E A S UR ED
A T F A I R V A L U E
M E A S UR ED A T
A M OR T I Z ED C O S T
D E R I V A T I V E
F I N A N C I A L
I N S T R U M EN T S
W I T H I N
H E D G E
A C C O UN T I N G
N O T W I T H I N
S C O P E OF
I F R S 7
B A L A N C E
S H E E T I T EM
A T J U N E 3 0 ,
2 0 1 6
€ million Carrying
amount
Carrying
amount Fair value
Carrying
amount
Carrying
amount
Noncurrent assets
Equity-accounted investments – – – – 6,897 6,897
Other equity investments 181 – – – 746 927
Financial services receivables – 65,132 67,321 – – 65,132
Other financial assets 16 2,930 2,978 2,946 – 5,892
Current assets
Trade receivables – 12,987 12,987 – – 12,987
Financial services receivables – 47,805 47,805 – – 47,805
Other financial assets 748 9,904 9,904 1,553 – 12,205
Marketable securities 15,252 – – – – 15,252
Cash, cash equivalents and time deposits – 29,691 29,691 – – 29,691
Noncurrent liabilities
Noncurrent financial liabilities – 70,499 70,890 – – 70,499
Other noncurrent financial liabilities 1,049 2,039 2,043 1,454 – 4,542
Current liabilities
Put options and compensation rights granted to noncontrolling interest shareholders – 3,689 3,826 – – 3,689
Current financial liabilities – 81,706 81,706 – – 81,706
Trade payables – 21,811 21,811 – – 21,811
Other current financial liabilities 1,310 5,989 5,989 1,801 – 9,099
The following tables contain an overview of the financial assets and liabilities measured at fair value:

I N T E R I M C O N S O L I D AT E D F I N A N C I A L STAT E M E N T S ( C O N D E N S E D )
Notes to the Interim Consolidated Financial Statements
45
F I N A N C I A L A S S E T S A N D L I A B I L I T I E S M E A S U R E D AT FA I R VA L U E B Y L E V E L
€ million Dec. 31, 2015 Level 1 Level 2 Level 3
Noncurrent assets
Other equity investments 211 117 – 94
Other financial assets 996 – 976 20
Current assets
Other financial assets 885 – 879 6
Marketable securities 15,007 15,007 – –
Noncurrent liabilities
Other noncurrent financial liabilities 1,325 – 1,142 183
Current liabilities
Other current financial liabilities 1,074 – 778 296
€ million June 30, 2016 Level 1 Level 2 Level 3
Noncurrent assets
Other equity investments 181 89 – 92
Other financial assets 16 – – 10 26
Current assets
Other financial assets 748 – 741 7
Marketable securities 15,252 15,252 – –
Noncurrent liabilities
Other noncurrent financial liabilities 1,049 – 906 143
Current liabilities
Other current financial liabilities 1,310 – 1,244 65
D E R I VAT I V E F I N A N C I A L I N ST R U M E N T S W I T H I N H E D G E A C CO U N T I N G B Y L E V E L
€ million Dec. 31, 2015 Level 1 Level 2 Level 3
Noncurrent assets
Other financial assets 1,249 – 1,249 –
Current assets
Other financial assets 1,196 – 1,196 –
Noncurrent liabilities
Other noncurrent financial liabilities 2,580 – 2,573 7
Current liabilities
Other current financial liabilities 3,725 – 3,725 –

I N T E R I M C O N S O L I D AT E D F I N A N C I A L STAT E M E N T S ( C O N D E N S E D )
Notes to the Interim Consolidated Financial Statements
46
€ million June 30, 2016 Level 1 Level 2 Level 3
Noncurrent assets
Other financial assets 2,946 – 2,942 3
Current assets
Other financial assets 1,553 – 1,553 –
Noncurrent liabilities
Other noncurrent financial liabilities 1,454 – 1,453 1
Current liabilities
Other current financial liabilities 1,801 – 1,801 –
The allocation of fair values to the three levels in the fair value hierarchy is based on the availability of observable market
prices. Level 1 is used to report the fair value of financial instruments for which a price is directly available in an active
market. Examples include marketable securities and other equity investments measured at fair value. Fair values in Level 2,
for example of derivatives, are measured on the basis of market inputs using market-based valuation techniques. In particular, the inputs used include exchange rates, yield curves and commodity prices that are observable in the relevant
markets and obtained through pricing services. Level 3 fair values are calculated using valuation techniques that incor-
porate inputs that are not directly observable in active markets. In the Volkswagen Group, long-term commodity futures
are allocated to Level 3 because the prices available on the market must be extrapolated for measurement purposes. This is
done on the basis of observable inputs obtained for the different commodities through pricing services. Options on equity
instruments and residual value protection models are also reported in Level 3. Equity instruments are measured primarily using the relevant business plans and entity-specific discount rates. The significant inputs used to measure fair value for
the residual value protection models include forecasts and estimates of used vehicle residual values for the appropriate
models.
C H A N G E S I N B A L A N C E S H E E T I T E M S M E A S U R E D AT FA I R VA L U E B A S E D O N L E V E L 3
€ million Financial assets
measured at fair value
Financial liabilities
measured at fair value
Balance at Jan. 1, 2015* 178 249
Foreign exchange differences 6 0
Total comprehensive income 1 66
recognized in profit or loss 0 62
recognized in other comprehensive income 1 4
Additions (purchases) 0 –
Sales and settlements – 5 – 36
Transfers into Level 2 0 – 20
Balance at June 30, 2015* 181 259
Total gains or losses recognized in profit or loss 0 – 62
Net other operating expense/income – –
of which attributable to assets/liabilities held at the reporting date – –
Financial result 0 – 62
of which attributable to assets/liabilities held at the reporting date 1 – 10
* Prior-year figures adjusted.

I N T E R I M C O N S O L I D AT E D F I N A N C I A L STAT E M E N T S ( C O N D E N S E D )
Notes to the Interim Consolidated Financial Statements
47
€ million Financial assets
measured at fair value
Financial liabilities
measured at fair value
Balance at Jan. 1, 2016 119 251
Foreign exchange differences – 3 0
Total comprehensive income 9 16
recognized in profit or loss 5 19
recognized in other comprehensive income 3 – 3
Additions (purchases) 1 –
Sales and settlements – 1 – 36
Transfers into Level 2 0 – 23
Balance at June 30, 2016 125 208
Total gains or losses recognized in profit or loss 5 – 19
Net other operating expense/income – –
of which attributable to assets/liabilities held at the reporting date – –
Financial result 5 – 19
of which attributable to assets/liabilities held at the reporting date 5 1
The transfers between the levels of the fair value hierarchy are reported at the respective reporting dates. The transfers out
of Level 3 into Level 2 comprise commodity futures for which observable quoted prices are now available for measurement purposes due to the decline in their remaining maturities; consequently, no further extrapolation is required. There were
no transfers between other levels of the fair value hierarchy.
Commodity prices are the key risk variable for the fair value of commodity futures. Sensitivity analyses are used to
present the effect of changes in commodity prices on earnings after tax and equity.
If commodity prices for commodity futures classified as Level 3 had been 10% higher (lower) as of June 30, 2016,
profit after tax would have been €5 million higher (lower) and equity would have been €2 million higher (lower). The key risk variable for measuring options on equity instruments held by the Company is the relevant enterprise value.
Sensitivity analyses are used to present the effect of changes in risk variables on profit after tax.
If the assumed enterprise values had been 10% higher, profit after tax would have been €1 million higher. If the
assumed enterprise values had been 10% lower, profit after tax would have been €1 million lower.
Residual value risks result from hedging agreements with dealers under which earnings effects caused by market-
related fluctuations in residual values that arise from buy-back obligations under leases are borne in part by the Volks-wagen Group.
The key risk variable influencing the fair value of the options relating to residual value risks is used car prices.
Sensitivity analyses are used to quantify the effects of changes in used car prices on earnings after tax.
If the prices for the used cars covered by the residual value protection model had been 10% higher as of June 30, 2016,
earnings after tax would have been €244 million higher. If the prices for the used cars covered by the residual value
protection model had been 10% lower as of June 30, 2016, earnings after tax would have been €244 million lower.

I N T E R I M C O N S O L I D AT E D F I N A N C I A L STAT E M E N T S ( C O N D E N S E D )
Notes to the Interim Consolidated Financial Statements
48
12. Cash flow statement
The cash flow statement presents the cash inflows and outflows in the Volkswagen Group and in the Automotive and
Financial Services divisions. Cash and cash equivalents comprise cash at banks, checks, bills, cash-in-hand and call
deposits.
€ million June 30, 2016 June 30, 2015
Cash, cash equivalents and time deposits as reported in the balance sheet 29,691 17,598
Time deposits – 352 – 691
Cash and cash equivalents as reported in the cash flow statement 29,338 16,906
Cash inflows and outflows from financing activities are presented in the following table:
H 1
€ million 2016 2015*
Capital contributions – 2,457
Dividends paid – 277 – 2,429
Capital transactions with noncontrolling interest shareholders – 3 0
Other changes – 19 – 2
Proceeds from issuance of bonds 4,560 12,963
Repayment of bonds – 12,464 – 10,204
Change in other financial liabilities 16,394 – 1,452
Lease payments – 22 – 16
8,169 1,318
* Prior-year figures adjusted.
13. Segment reporting
Segments are identified on the basis of the Volkswagen Group’s internal management and reporting. In line with the
Group’s multibrand strategy, each of its brands (operating segments) is managed by its own board of management.
The Group targets and requirements laid down by the Board of Management of Volkswagen AG must be complied with.
Segment reporting comprises four reportable segments: Passenger Cars, Commercial Vehicles, Power Engineering and
Financial Services. The operating segments are combined into reportable segments based on similar economic character-istics (in particular the nature of the products or services, integration in the development, production and sales processes,
and similar customer groups).
The activities of the Passenger Cars segment cover the development of vehicles and engines, the production and sale of
passenger cars, and the corresponding genuine parts business. As a rule, the Volkswagen Group’s individual passenger car
brands are combined on a consolidated basis into a single reportable segment.
The Commercial Vehicles segment primarily comprises the development, production and sale of light commercial vehicles, trucks and buses, the corresponding genuine parts business and related services.
The activities of the Power Engineering segment consist of the development and production of large-bore diesel
engines, turbo compressors, industrial turbines and chemical reactor systems, as well as the production of gear units, pro-
pulsion components and testing systems.
The activities of the Financial Services segment comprise dealer and customer financing, leasing, banking and
insurance activities, fleet management and mobility services. Purchase price allocation for companies acquired is allocated directly to the corresponding segments.
At Volkswagen, segment profit or loss is measured on the basis of the operating result.
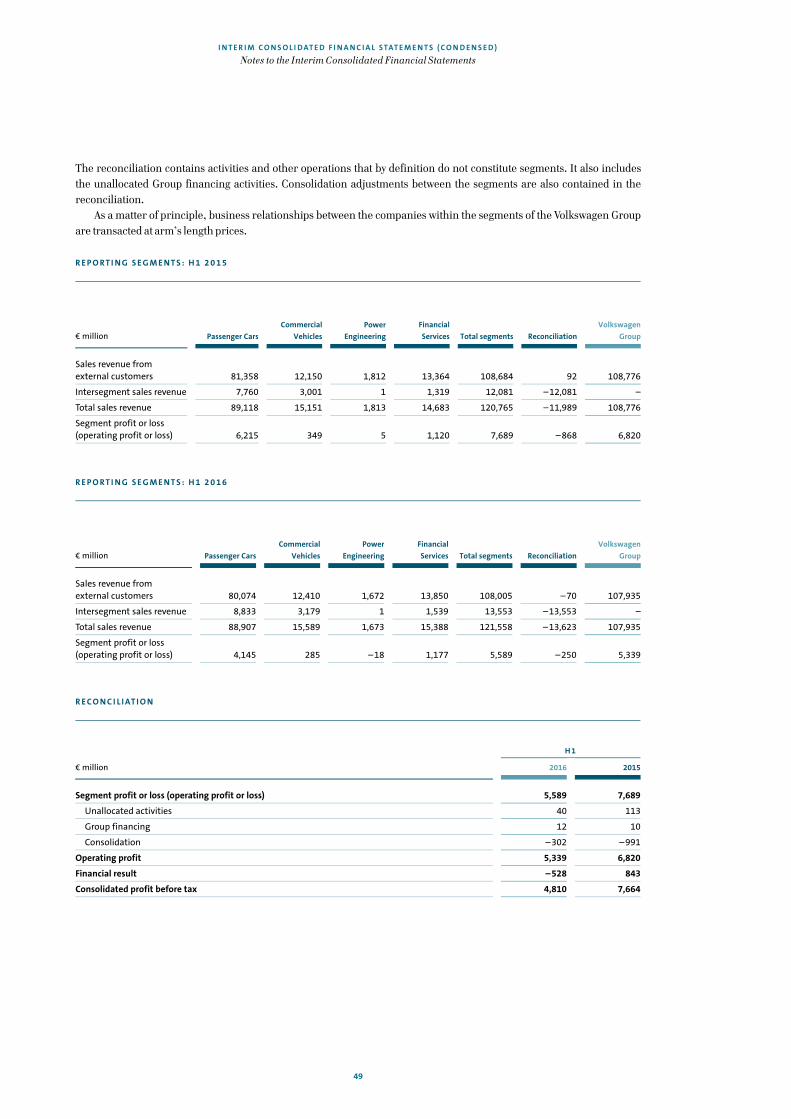
I N T E R I M C O N S O L I D AT E D F I N A N C I A L STAT E M E N T S ( C O N D E N S E D )
Notes to the Interim Consolidated Financial Statements
49
The reconciliation contains activities and other operations that by definition do not constitute segments. It also includes
the unallocated Group financing activities. Consolidation adjustments between the segments are also contained in the
reconciliation.
As a matter of principle, business relationships between the companies within the segments of the Volkswagen Group
are transacted at arm’s length prices.
R E P O RT I N G S E G M E N T S : H 1 2 0 1 5
€ million Passenger Cars
Commercial
Vehicles
Power
Engineering
Financial
Services Total segments
Reconciliation
Volkswagen
Group
Sales revenue from external customers 81,358 12,150 1,812 13,364 108,684 92 108,776
Intersegment sales revenue 7,760 3,001 1 1,319 12,081 – 12,081 –
Total sales revenue 89,118 15,151 1,813 14,683 120,765 – 11,989 108,776
Segment profit or loss (operating profit or loss) 6,215 349 5 1,120 7,689 – 868 6,820
R E P O RT I N G S E G M E N T S : H 1 2 0 1 6
€ million Passenger Cars
Commercial
Vehicles
Power
Engineering
Financial
Services Total segments
Reconciliation
Volkswagen
Group
Sales revenue from external customers 80,074 12,410 1,672 13,850 108,005 – 70 107,935
Intersegment sales revenue 8,833 3,179 1 1,539 13,553 – 13,553 –
Total sales revenue 88,907 15,589 1,673 15,388 121,558 – 13,623 107,935
Segment profit or loss (operating profit or loss) 4,145 285 – 18 1,177 5,589 – 250 5,339
R E C O N C I L I AT I O N
H 1
€ million 2016 2015
Segment profit or loss (operating profit or loss) 5,589 7,689
Unallocated activities 40 113
Group financing 12 10
Consolidation – 302 – 991
Operating profit 5,339 6,820
Financial result – 528 843
Consolidated profit before tax 4,810 7,664

I N T E R I M C O N S O L I D AT E D F I N A N C I A L STAT E M E N T S ( C O N D E N S E D )
Notes to the Interim Consolidated Financial Statements
50
14. Related party disclosures
Porsche SE reached an agreement with Suzuki Motor Corporation at the end of September 2015 to acquire 1.5% of
Volkswagen AG’s ordinary shares via an off-market transaction. At 52.2%, Porsche SE held the majority of the voting rights
in Volkswagen AG as of June 30, 2016.
The creation of rights of appointment for the State of Lower Saxony was resolved at the Extraordinary General Meeting of Volkswagen AG on December 3, 2009. As a result, Porsche SE cannot appoint the majority of the members of Volks-
wagen AG’s Supervisory Board for as long as the State of Lower Saxony holds at least 15% of Volkswagen AG’s ordinary
shares. However, Porsche SE has the power to participate in the operating policy decisions of the Volkswagen Group and is
therefore classified as a related party as defined by IAS 24.
S U P P L I E S A N D S E R V I C E S
R E N D E R ED
S U P P L I E S A N D S E R V I C E S
R E C EI V ED
H1 H1
€ million 2016 2015 2016 2015
Porsche SE 6 5 1 2
Supervisory Board members 1 3 2 2
Unconsolidated subsidiaries 419 571 340 353
Joint ventures and their majority interests 6,477 6,367 559 566
Associates and their majority interests 96 59 374 311
State of Lower Saxony, its majority interests and joint ventures 2 2 2 1
R E C EI V A B L E S
( I N C L U D I N G C OL L A T E R A L ) F R O M
L I A B I L I T I E S
( I N C L U D I N G O B L I G A T I ON S) T O
€ million June 30, 2016 Dec. 31, 2015 June 30, 2016 Dec. 31, 2015
Porsche SE 329 334 101 110
Supervisory Board members 0 0 278 165
Unconsolidated subsidiaries 1,146 1,015 1,022 1,418
Joint ventures and their majority interests 8,500 7,495 1,649 2,343
Associates and their majority interests 63 40 452 518
State of Lower Saxony, its majority interests and joint ventures 1 0 0 0
The supplies and services received from joint ventures and associates in the first six months do not include resolved
dividend distributions amounting to €3,488 million (previous year: €4,589 million).
The receivables from Porsche SE comprise a receivable under a loan agreement and receivables from land transfer
taxes. The obligations to Porsche SE consist mainly of term deposits.
Obligations to members of the Supervisory Board amounting to €278 million relate primarily to interest-bearing bank balances of Supervisory Board members that were invested at standard market terms and conditions at Volkswagen Group
companies.
In addition, the Volkswagen Group has furnished guarentees to external banks on behalf of related parties in the
amount of €115 million.

I N T E R I M C O N S O L I D AT E D F I N A N C I A L STAT E M E N T S ( C O N D E N S E D )
Notes to the Interim Consolidated Financial Statements
51
15. Virtual Shares
At its meeting on April 22, 2016, Volkswagen AG’s Supervisory Board accepted the offer made by the members of the Board
of Management to withhold 30% of the variable remuneration for fiscal year 2015 for the Board of Management members
active on the date of the resolution and to make its disposal subject to future share price performance by means of virtual
shares. For further details, please refer to our disclosures in the remuneration report in the 2015 Annual Report. In accordance with IFRS 2, the obligations relating to these virtual shares are accounted for as a cash-settled plan and
measured at fair value using a recognized valuation technique. The link between the original bonus (€5.7 million) and
future share price performance resulted in a gain of €1.5 million as of April 22, 2016. Expenses of €0.6 million were
recognized in the second quarter because of the share price performance in the period up to June 30, 2016. The fair value
of the obligation to members of the Board of Management as of June 30, 2016 amounts to €4.9 million. If all members of
the Board of Management had left as of June 30, 2016, the obligation (intrinsic value) would have amounted to a total of €4.9 million.
16. Litigation
Detailed information on litigation and other legal proceedings can be found in the “Litigation” section of Volkswagen AG’s 2015 consolidated financial statements.
Substantially, there have been the following changes compared with the situation described there:
VO L K SWA G E N R E A C H E S C E RTA I N S E T T L E M E N T A G R E E M E N T S
In June 2016, Volkswagen publicly announced that Volkswagen AG, Volkswagen Group of America, Inc. and certain affil-
iates had reached settlement agreements in the USA with the U.S. Department of Justice, the U.S. Environmental Pro-tection Agency (EPA), the U.S. Federal Trade Commission, the California Air Resources Board (CARB) and private plaintiffs
represented by a Plaintiffs’ Steering Committee (PSC) in the Multi-District Litigation pending in California. The settlement
agreements, if finally approved, will resolve certain civil claims made in relation to affected diesel vehicles with 2.0 l TDI
engines from the Volkswagen Passenger Cars and Audi brands in the USA. The settlement agreements are subject to final
court approval.
The proposed settlements provide affected customers with the option of a buyback or, for leased vehicles, early lease termination or a free technical modification of the vehicles, provided that EPA and CARB approve the appropriate
modification measures. Volkswagen will also make cash payments to affected owners and lessees.
Volkswagen also agreed to support environmental programs. The company will pay USD 2.7 billion over three years
into an environmental trust, managed by a trustee appointed by the court, to offset excess nitrogen oxide (NOx) emissions.
Volkswagen will also invest in total USD 2.0 billion over 10 years in zero emissions vehicle infrastructure as well as
corresponding access and awareness initiatives. Volkswagen also reached separate settlement agreements with the attorneys general of 44 US states, the District of
Columbia and Puerto Rico, to resolve their existing or potential consumer protection and unfair trade practices claims – in
connection with both 2.0 l TDI and 3.0 l TDI vehicles in the USA – for a settlement amount of USD 603 million.
These settlements do not resolve the civil claims by the DOJ, FTC and private plaintiffs represented by the PSC
related to 3.0 l TDI vehicles, civil penalties sought by the DOJ on behalf of the EPA, potential state environmental claims
related to the 2.0 l and 3.0 l TDI vehicles, any criminal investigations by the DOJ, as well as certain other claims.
U S L AW S U I T S A L L E G I N G C L A I M S F O R C I V I L E N V I R O N M E N TA L P E N A LT I E S
On July 19, 2016, the US states Maryland, Massachusetts and New York filed complaints in their respective state courts
against Volkswagen AG, Volkswagen Group of America, Inc. and certain affiliates seeking civil penalties and injunctive
relief for alleged violations of environmental laws. Maryland, Massachusetts and New York participated in the state settle-

I N T E R I M C O N S O L I D AT E D F I N A N C I A L STAT E M E N T S ( C O N D E N S E D )
Notes to the Interim Consolidated Financial Statements
52
ments described above with respect to consumer protection and unfair trade practices claims, but those settlements did
not include claims for environmental penalties.
To protect against the currently known legal risks, including suitable expenses for defense and legal advice related to
the diesel issue, the current information and assessments in the reporting period indicated a requirement to recognize
additional provisions of €1.7 billion. Unused provisions for legal risks amounting to €0.4 billion were reversed. There were
no material adjustments to the existing contingent liabilities in connection with the diesel issue. The provisions for legal risks recognized in connection with the diesel issue and the contingent liabilities disclosed
continue to be subject in part to substantial estimation risks in light of the complexity of the individual factors, the ongoing
approval process with the authorities and the fact that the comprehensive, exhaustive investigations have not yet been
completed.
A N T I R U ST P R O C E E D I N G S
In 2011, the European Commission opened antitrust proceedings against European truck manufacturers concerning
inappropriate exchange of information during the period 1997-2011 and sent a statement of objections to MAN, Scania
and the other truck manufacturers concerned in November 2014.
With its decision as of July 19, 2016 the European Commission has fined five European truck manufacturers excluding
MAN and Scania. MAN was not fined as the company had informed the EU Commission about the cartel as a key witness.
With regard to Scania, the antitrust proceedings will be continued. Scania has decided to fully exercise its rights of defense in the ongoing investigation. A provision of €0.4 billion was recognized in order to cover possible fines.
17. Contingent assets and liabilities
On May 5, 2016, the U.S. National Highway Traffic Safety Administration (NHTSA) announced, jointly with the Takata company, a further extension of the recall for various models from different manufacturers containing certain airbags
produced by the Takata company. Recalls were also ordered by the local authorities in Canada, Japan and South Korea. The recalls also included models manufactured by the Volkswagen Group. Appropriate provisions have been recognized.
Currently, the possibility of further extensions to the recalls that could also affect Volkswagen Group models cannot be
ruled out. It is not possible at the moment to provide further disclosures in accordance with IAS 37.86 in relation to this
matter because the technical investigations and consultations with the authorities are still being carried out. Contingent liabilities increased by €501 million to €4,001 million compared with the 2015 consolidated financial
statements, particularly because of exchange rate effects.
18. Other financial obligations
Other financial obligations remained essentially unchanged as against the 2015 consolidated financial statements. An
increase in the purchase order commitment for property, plant and equipment and services was partly offset by the
elimination of the obligations of €1.3 billion under an irrevocable credit commitment to LeasePlan.
German Corporate Governance Code
The current declarations in accordance with section 161 of the Aktiengesetz (AktG – German Stock Corporation Act) on the
German Corporate Governance Code by the Board of Management and Supervisory Board of Volkswagen AG, AUDI AG,
MAN SE and RENK AG are permanently available on the Internet at www.volkswagenag.com/ir, www.audi.com/cgk-
declaration, www.corporate.man.eu/en and www.renk.biz/corporated-governance.html respectively.
Significant events after the balance sheet date
There were no significant events after the end of the first six months of 2016.

I N T E R I M C O N S O L I D AT E D F I N A N C I A L STAT E M E N T S ( C O N D E N S E D )
Responsibility Statement
53
To the best of our knowledge, and in accordance with the applicable reporting principles for interim financial reporting,
the condensed consolidated interim financial statements give a true and fair view of the assets, liabilities, financial
position and profit or loss of the Group in accordance with German accepted accounting principles, and the interim
management report of the Group includes a fair review of the development and performance of the business and the
position of the Group, together with a description of the material opportunities and risks associated with the expected
development of the Group for the remaining months of the fiscal year.
Wolfsburg, July 28, 2016
Volkswagen Aktiengesellschaft
The Board of Management
Matthias Müller Karlheinz Blessing Herbert Diess
Francisco Javier Garcia Sanz Jochem Heizmann Christine Hohmann-Dennhardt
Andreas Renschler Rupert Stadler Frank Witter
Responsibility Statement

I N T E R I M C O N S O L I D AT E D F I N A N C I A L STAT E M E N T S ( C O N D E N S E D )
Review Report
54
On completion of our review, we issued the following unqualified auditors’ report dated July 28, 2016. This report was
originally prepared in German. In case of ambiguities the German version takes precedence:
To VOLKSWAGEN AKTIENGESELLSCHAFT, Wolfsburg
We have reviewed the condensed consolidated interim financial statements - comprising the condensed income statement
and condensed statement of comprehensive income, condensed balance sheet, condensed statement of changes in equity,
condensed statement of cash flows and selected explanatory notes - and the interim group management report of
VOLKSWAGEN AKTIENGESELLSCHAFT, Wolfsburg, for the period from January 1 to June 30, 2016, which are part of the
half-yearly financial report pursuant to § (Article) 37w WpHG ("Wertpapierhandelsgesetz": German Securities Trading Act). The preparation of the condensed consolidated interim financial statements in accordance with the IFRS applicable to
interim financial reporting as adopted by the EU and of the interim group management report in accordance with the
provisions of the German Securities Trading Act applicable to interim group management reports is the responsibility of
the parent Company's Board of Managing Directors. Our responsibility is to issue a review report on the condensed con-
solidated interim financial statements and on the interim group management report based on our review.
We conducted our review of the condensed consolidated interim financial statements and the interim group manage-ment report in accordance with German generally accepted standards for the review of financial statements promulgated
by the Institut der Wirtschaftsprüfer (Institute of Public Auditors in Germany) (IDW). Those standards require that we plan
and perform the review so that we can preclude through critical evaluation, with moderate assurance, that the condensed
consolidated interim financial statements have not been prepared, in all material respects, in accordance with the IFRS
applicable to interim financial reporting as adopted by the EU and that the interim group management report has not been
prepared, in all material respects, in accordance with the provisions of the German Securities Trading Act applicable to interim group management reports. A review is limited primarily to inquiries of company personnel and analytical
procedures and therefore does not provide the assurance attainable in a financial statement audit. Since, in accordance
with our engagement, we have not performed a financial statement audit, we cannot express an audit opinion.
Based on our review, no matters have come to our attention that cause us to presume that the condensed consolidated
interim financial statements have not been prepared, in all material respects, in accordance with the IFRS applicable to
interim financial reporting as adopted by the EU nor that the interim group management report has not been prepared, in all material respects, in accordance with the provisions of the German Securities Trading Act applicable to interim group
management reports.
Review Report

I N T E R I M C O N S O L I D AT E D F I N A N C I A L STAT E M E N T S ( C O N D E N S E D )
Review Report
55
Without qualifying our opinion, we draw attention to the updated information provided in section “Key events” of the notes
to the condensed consolidated interim financial statements and in chapter “Report on Expected Developments, Risks and
Opportunities” of the interim Group management report with regard to the emission issue, which essentially refer to the
information provided and statements made in the 2015 consolidated financial statements and in the combined manage-
ment report as of December 31, 2015.
Based on the presented first results of the various measures taken to investigate the issue, which underlie these financial statements, there is no validation that members of the board of management were aware of the deliberate manip-
ulation of engine management software before summer 2015. Nevertheless, should as a result of the ongoing investigation
new knowledge be obtained showing that members of the board of management were informed earlier, this could
eventually have an impact on the condensed consolidated interim financial statements as well as on the annual and
consolidated financial statements and on the combined management report for the fiscal year 2015 and the comparative
figures for 2014. The provisions for warranties and legal risks recorded up to now are based on the presented state of knowledge. Due to
the large number of the technical solutions necessary and the inevitable uncertainties associated with the current and
expected litigation it cannot be excluded that a future assessment of the risks may be different.
Hanover, July 28, 2016
PricewaterhouseCoopers
Aktiengesellschaft
Wirtschaftsprüfungsgesellschaft
Norbert Winkeljohann Frank Hübner
Wirtschaftsprüfer Wirtschaftsprüfer
(German Public Auditor) (German Public Auditor)

56
P U B L I S H E D B Y
Volkswagen AG
Financial Publications
Letterbox 1848-2
38436 Wolfsburg
Germany
Phone + 49 (0) 5361 9-0
Fax + 49 (0) 5361 9-28282
I N V E STO R R E L AT I O N S
Volkswagen AG
Investor Relations
Letterbox 1849
38436 Wolfsburg
Germany
Phone + 49 (0) 5361 9-0
Fax + 49 (0) 5361 9-30411
E-mail [email protected]
Internet www.volkswagenag.com/ir
F I N A N C I A L C A L E N DA R
October 27, 2016 Interim Report January – September 2016
This Interim Report is also available on the
Internet, in German and English, at:
www.volkswagenag.com/ir
This version of the Interim Report is a translation of the German original.
The German takes precedence.
Printed in Germany
658.809.568.20
Contact Information


HalbjahresfinanzberichtJanuar – Juni
2016