vulnerable groups indicator report 2016 - the south · pdf filestatistics south africa iv...
TRANSCRIPT

Vulnerable Groups
Indicator Report 2016
Report No. 03-19-02 (2016)
Vulnerable Groups Indicator Report
2016
Statistics South Africa
Pali Lehohla Statistician-General Report No. 03-19-02(2016)

STATISTICS SOUTH AFRICA ii
Vulnerable Groups Indicator Report, 2016 (Report 03-19-02(2016))
Vulnerable Groups Indicator Report, 2016 / Statistics South Africa Published by Statistics South Africa, Private Bag X44, Pretoria 0001 © Statistics South Africa, 2017 Users may apply or process this data, provided Statistics South Africa (Stats SA) is acknowledged as the original source of the data; that it is specified that the application and/or analysis is the result of the user's independent processing of the data; and that neither the basic data nor any reprocessed version or application thereof may be sold or offered for sale in any form whatsoever without prior permission from Stats SA. Stats SA Library Cataloguing-in-Publication (CIP) Data Vulnerable Groups Indicator Report, 2016 / Statistics South Africa, Pretoria: Statistics South Africa, 2017 Report number 03-19-02 112pp ISBN: 978-0-621-45745-2
A complete set of Stats SA publications is available at Stats SA Library and the following libraries: National Library of South Africa, Pretoria Division National Library of South Africa, Cape Town Division Library of Parliament, Cape Town Bloemfontein Public Library Natal Society Library, Pietermaritzburg Johannesburg Public Library Eastern Cape Library Services, King William's Town Central Regional Library, Polokwane Central Reference Library, Mbombela Central Reference Collection, Kimberley Central Reference Library, Mmabatho
This report is available on the Stats SA website: www.statssa.gov.za For technical enquiries, please contact: Xoliswa Ndamase Tel.: 012 310 2908 Email: [email protected]
STATISTICS SOUTH AFRICA iii
Vulnerable Groups Indicator Report, 2016 (Report 03-19-02(2016))
CONTENT
1.1 The Demography of Children ................................................................................................ 5
Table 1.1.1: Distribution of children, 2016 ...................................................................................... 5
Table 1.1.2: Percentage of children as a proportion of the overall population, 2016 ...................... 6
1.2 Children: Household characteristics ................................................................................... 7
Table 1.2.1: Children less than 18 years by orphan-hood status, 2016 .......................................... 7
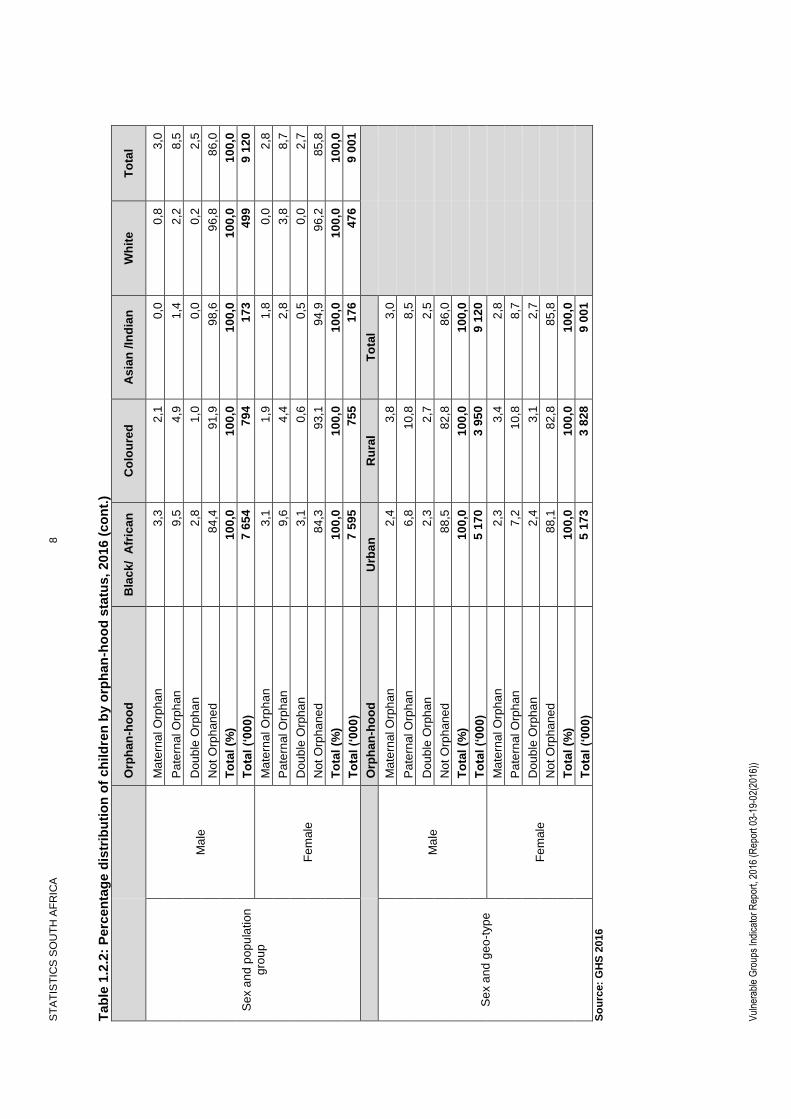
Table 1.2.2: Percentage distribution of children by orphan-hood status, 2016 ............................... 7
Table 1.2.3: Children by their parental living arrangements, 2016 .................................................. 9
Table 1.2.4: Percentage distribution of children by household composition, 2016 .......................... 9
Table 1.2.5: Child-headed households across intergenerational household type, 2016 ............... 10
1.3 Children: Income, poverty, economic activity and social grants .................................... 11
Table 1.3.1: Children living in households without an employed adult, 2016 ................................ 11
Table 1.3.2: Distribution of children living in households without an employed adult, 2016 .......... 11
Table 1.3.3: Percentage distribution of the main source of income for child-headed households, 2016 ...................................................................................................... 11
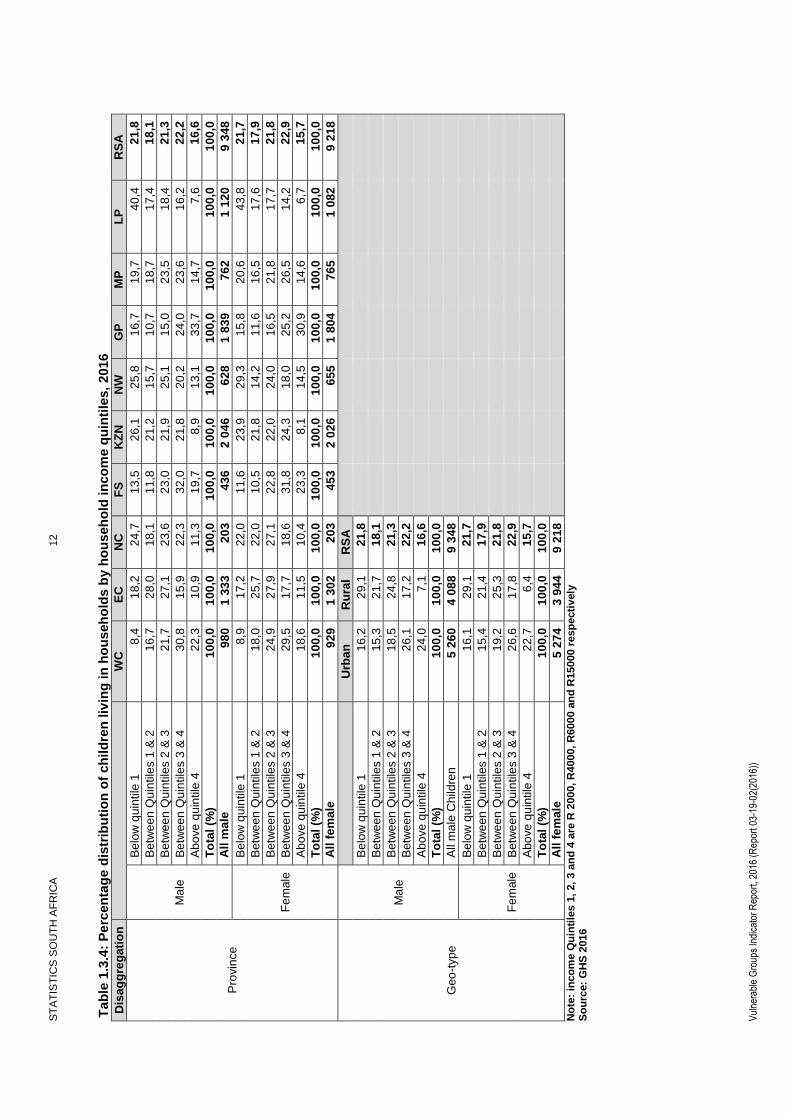
Table 1.3.4: Percentage distribution of children living in households by household income quintiles, 2016 ............................................................................................................ 12
1.4 Children: Health ..................................................................................................................... 14
Table 1.4.1: Children with access to medical aid, 2016 ................................................................. 14
Table 1.4.2: Percentage distribution of types of healthcare facilities visited by children, 2016 ..... 14
Table 1.4.3: Percentage of children living less than 30 minutes from the nearest health care facility, 2016 ............................................................................................................... 15
Table 1.4.4: Percentage of children who suffered from acute diseases compared to the overall population, 2016 ............................................................................................ 15
Table 1.4.5: Percentage of children who suffered from chronic diseases compared to the overall population, 2016 ............................................................................................ 16
1.5 Children: Vulnerability to hunger ......................................................................................... 17
Table 1.5.1: Children living in households by whether or not hunger was reported in the households, 2016 ...................................................................................................... 17
Table 1.5.2: Percentage of children living in households that reported hunger, 2016................... 17
Table 1.5.3: Percentage of child-inclusive households that reported hunger, 2016 ...................... 18
1.6 Children: Education ............................................................................................................... 19
Table 1.6.1: School attendance by children of compulsory school age (7-15 years) by sex, 2016 ........................................................................................................................... 19
Table 1.6.2: Levels of learners in public ordinary schools (POS) benefiting from the "No Fees School” policy, 2016 .................................................................................................. 19
Table 1.6.3: Percentage of children (5 years and older) who experienced corporal punishment in schools, 2016 ..................................................................................... 20
Table 1.6.4: Percentage of children aged 0-4 years that attend day care centre, 2016 ................ 20
Table 1.6.5: Percentage of children aged 7-13 years participating in educational institutions, 2016 ........................................................................................................................... 21
Table 1.6.6: Percentage of children aged 14-17 years participating in educational institution(s), 2016 ..................................................................................................... 22
Table 1.6.7: Percentage of children aged 15 years who have not completed grade 7, 2016 ....... 22
Table 1.6.8: Percentage of children aged 17 years who have not completed grade 9, 2016 ....... 23
Table 1.6.9: Percentage of children living more than 30 minutes away from the nearest school, 2016 .............................................................................................................. 24
Table 1.6.10: Percentage distribution of reasons for children aged 7-17 years who are not attending school 2016 ............................................................................................... 24

STATISTICS SOUTH AFRICA iv
Vulnerable Groups Indicator Report, 2016 (Report 03-19-02(2016))
Table 1.6.11: Experience of violence/ punishment/ abuse at school by learners aged 5 years and above attending school, 2016............................................................................. 25
Table 1.6.12: Experience of violence/ punishment/ abuse at school by learners aged 5 years and above attending school by sex and geo-type, 2016 ........................................... 26
1.7 Children: Housing and basic services ................................................................................ 27
Table 1.7.1: Percentage distribution of child-headed households by type of housing, 2016 ........ 27
Table 1.7.2: Percentage distribution of children by type of housing, 2016 .................................... 27
Table 1.7.3: Living condition indicators of children compared to those of the overall population, 2016 ........................................................................................................ 27
1.8 Children: Violence and crime victims .................................................................................. 28
Table 1.8.1: Percentage of children living in households where the households feel unsafe or very unsafe to walk alone in their area during the day, 2015/16 ............................... 28
Table 1.8.2: Percentage of children living in households where the households feel unsafe or very unsafe to walk alone in their area at night, 2015/16 .......................................... 28
Table 1.8.3: Percentage of children who live in households where the fear of crime prevents them from going to open spaces or parks in their area, 2015/16 .............................. 29
2.1 Demography of youth ............................................................................................................ 30
Table 2.1.1: Distribution of youth, 2016 ......................................................................................... 30
Table 2.1.2: Percentage of youth (15-34 years) as a proportion of the overall population, 2016 ........................................................................................................................... 31
2.2 Youth: Household characteristics ........................................................................................ 32
Table 2.2.1: Percentage of youth-headed Households, 2016 ....................................................... 32
Table 2.2.2: Percentage distribution of youth-headed households by age groups, 2016 ............. 33
Table 2.2.3: Percentage distribution of youth by household composition, 2016 ........................... 34
Table 2.2.4: Percentage distribution of youth headed households across intergenerational household type, 2016 ................................................................................................ 35
2.3 Youth: Income, poverty, economic activity and social grants .......................................... 37
Table 2.3.1: Percentage of youth who are beneficiaries of social grants, 2016 ............................ 37
Table 2.3.2: Percentage of youth living in households without an employed adult, 2016 ............. 37
Table 2.3.3: Percentage of youth-headed households without an employed adult, 2016 ............. 38
Table 2.3.4: Percentage of youth-headed households classified as low income households (at most household income quintile 1), 2016 ............................................................. 38
Table 2.3.5: Percentage distribution of main sources of income for youth-headed households, 2016 ...................................................................................................... 40
Table 2.3.6: Employed youth (in Thousands) by age group 2016 ................................................. 40
Table 2.3.7: Unemployed youth (in Thousands) by age group 2016 ............................................. 41
Table 2.3.8: Not economically active youth (in Thousands) by age group 2016 ........................... 42
Table 2.3.9: Youth labour force participation rate, 2016 ................................................................ 42
Table 2.3.10: Youth unemployment rate, 2016 .............................................................................. 43
Table 2.3.11: Youth labour absorption rate, 2016 ......................................................................... 43
Table 2.3.12: Youth economic inactivity rate, 2016 ....................................................................... 44
2.4 Youth: Health .......................................................................................................................... 45
Table 2.4.1: Percentage of youth who suffered from acute diseases compared to the overall population, 2016 ........................................................................................................ 45
Table 2.4.2: Percentage of youth who suffered from chronic diseases compared to the overall population, 2016 ............................................................................................ 46
2.5 Youth: Vulnerability to hunger ............................................................................................. 47
Table 2.5.1: Percentage of youth living in households that reported hunger, 2016 ...................... 47
Table 2.5.2: Percentage of youth-headed households that reported hunger, 2016 ...................... 48

STATISTICS SOUTH AFRICA v
Vulnerable Groups Indicator Report, 2016 (Report 03-19-02(2016))
2.6 Youth: Education ................................................................................................................... 49
Table 2.6.1: Percentage of youth who attend educational institutions, 2016 ................................ 49
Table 2.6.2: Percentage distribution of the types of educational institutions attended by youth aged 15-24 years, 2016 ............................................................................................. 49
Table 2.6.3: Percentage of youth aged 15-24 years who are not attending any educational institution and are also not employed, 2016 .............................................................. 50
Table 2.6.4: Percentage distribution of the highest levels of education attained by youth, 2016 ........................................................................................................................... 51
2.7 Youth: Housing and basic services ..................................................................................... 52
Table 2.7.1: Percentage distribution of households headed by youth living in formal, informal and traditional housing, 2016 .................................................................................... 52
Table 2.7.2: Percentage distribution of youth living in in households with formal, informal and traditional housing, 2016 ........................................................................................... 52
Table 2.7.3: Living condition indicators of the youth compared to those of the overall population, 2016 ........................................................................................................ 53
2.8 Youth: Violence and crime victims ...................................................................................... 54
Table 2.8.1: Percentage of youth living in households where the households feel unsafe or very unsafe to walk alone in their area during the day, 2015/16 ............................... 54
Table 2.8.2: Percentage of youth living in households where the households feel unsafe or very unsafe to walk alone in their area at night, 2015/16 .......................................... 54
Table 2.8.3: Percentage of Youth who live in households where the fear of crime prevent them from going to open spaces or parks in their area, 2015/16 .............................. 55
Table 2.8.4: Percentage of youth who have been victims of property crime during the past 5 years, 2015/16 ........................................................................................................... 55
Table 2.8.5: Percentage of youth who have been victims of assault during the past 5 years, 2015/16 ...................................................................................................................... 55
3.1 Demography of women ......................................................................................................... 56
Table 3.1.1: Percentage distribution of the female population, 2016 ............................................ 56
Table 3.1.2: Percentage distribution of women (18 years and above) by their marital status, 2016 ........................................................................................................................... 56
3.2 Women: Household characteristics ..................................................................................... 57
Table 3.2.1: Percentage of households headed by females aged 15 years and above, 2016 ...... 57
Table 3.2.2: Percentage distribution of male and female-headed households by household composition, 2016...................................................................................................... 58
Table 3.2.3: Mean household size by sex of the household head, 2016 ....................................... 60
3.3 Women: Income, poverty, economic activity and social grants ....................................... 61
Table 3.3.1: Dependency ratios by sex of the household head, 2016 .......................................... 61
Table 3.3.2: Percentage of households without an employed household member by sex of household head, 2016 ............................................................................................... 62
Table 3.3.3: Percentage of employed who are employers as a proportion of the overall employed, 2016 ......................................................................................................... 63
Table 3.3.4: Percentage of employed who are own-account workers as a proportion the employed, 2016 ......................................................................................................... 65
Table 3.3.5: Percentage of employed who are working as contributing family members as a proportion the employed, 2016 .................................................................................. 66
Table 3.3.6: Percentage distribution employed persons by sex, 2016 .......................................... 68
Table 3.3.7: Labour force participation rates for persons aged 15-64 years, 2016 ....................... 70
Table 3.3.8: Female unemployment rate, 2016 ............................................................................. 70
Table 3.3.9: Female labour absorption rate, 2016 ......................................................................... 71
Table 3.3.10: Female economic inactivity rate, 2016 .................................................................... 71
Table 3.3.11: Gender parity ratios in income earnings, 2016 ........................................................ 72

STATISTICS SOUTH AFRICA vi
Vulnerable Groups Indicator Report, 2016 (Report 03-19-02(2016))
3.4 Women: Health ...................................................................................................................... 73
Table 3.4.1: Percentage of persons with access to medical aid by sex, 2016 .............................. 73
3.5 Women: Vulnerability to hunger .......................................................................................... 74
Table 3.5.1: Percentage of Households that reported hunger by sex of household head, 2016 ........................................................................................................................... 74
3.6 Women: Education ................................................................................................................. 75
Table 3.6.1: Percentage of persons aged 20 and above who are functionally literate by sex, 2016 ........................................................................................................................... 75
Table 3.6.2: Percentage distribution of the highest level of education obtained by persons aged 25 years and above by sex, 2016 .................................................................... 76
3.7 Women: Housing and basic services .................................................................................. 78
Table 3.7.1: Type of housing by sex of the household head, 2016 ............................................... 78
Table 3.7.2: Living condition indicators of male and female-headed households, 2016 ............... 78
3.8 Women: Violence and crime victims .................................................................................... 79
Table 3.8.1: Percentage of women (16 yrs. and above) living in households where the households feel unsafe or very unsafe to walk alone in their area during the day, 2015/16 .............................................................................................................. 79
Table 3.8.2: Percentage of women (16 yrs. and above) living in households where the households feel unsafe or very unsafe to walk alone in their area at night, 2015/16 ...................................................................................................................... 79
Table 3.8.3: Percentage of women (16 yrs. and above) who live in households where the fear of crime prevent them from going to open spaces or parks in their area, 2015/16 ...................................................................................................................... 80
Table 3.8.4: Percentage of women aged 16 and above who have been victims of property crime during the past 5 years, 2015/16 ..................................................................... 80
Table 3.8.5: Percentage of women aged 16 and above who have been victims of Assault during the past 5 years, 2015/16 ............................................................................... 80
4.1 Demography of older persons .............................................................................................. 81
Table 4.1.1: Percentage distribution of the older persons by sex, 2016 ........................................ 81
Table 4.1.2: Percentage of older persons (60 years and older) as a proportion of the overall population by sex, 2016 ............................................................................................. 82
4.2 Older persons: Household characteristics ......................................................................... 83
Table 4.2.1: Percentage distribution of households headed by persons 60 years and older by sex of the household head, 2016 .............................................................................. 83
Table 4.2.2: Mean Ratio of Children to Older persons in older person-headed households by sex of the household head and province, 2016 ......................................................... 83
Table 4.2.3: Percentage distribution of persons aged 60 years and older living across different types of intergenerational households, 2016 .............................................. 84
4.3 Older persons: Income, poverty, economic activity and social grants ........................... 86
Table 4.3.1: Older persons living in households without an employed adult, 2016 ....................... 86
Table 4.3.2: Percentage of households headed by older persons that are classified as low income households (at most quintile 1 household income), 2016 ............................ 87
Table 4.3.3: Percentage distribution of the main source of income for households headed by older persons, 2016 ................................................................................................... 88
Table 4.3.4: Percentage of older persons who are beneficiaries of social grants, 2016 ............... 89
Table 4.3.5: Labour force participation rate of older persons, 2016 .............................................. 89
Table 4.3.6: Unemployment rate of older persons, 2016 ............................................................... 90
Table 4.3.7: Labour absorption rate of older persons, 2016 ......................................................... 90
Table 4.3.8: Economic inactivity rate of older persons, 2016 ........................................................ 91
4.4 Older persons: Health............................................................................................................ 92
Table 4.4.1: Percentage distribution of types of healthcare facilities visited by older persons, 2016 92

STATISTICS SOUTH AFRICA vii
Vulnerable Groups Indicator Report, 2016 (Report 03-19-02(2016))
Table 4.4.2: Percentage of older persons with access to medical aid, 2016 ................................. 93
Table 4.4.3: Percentage of persons 60 years and older who reported suffering from acute illnesses Compared to the overall population, 2016.................................................. 94
Table 4.4.4: Percentage of persons 60 years and older who reported suffering from chronic illnesses compared to the overall population, 2016 .................................................. 95
4.5 Older persons: Vulnerability to hunger ............................................................................... 96
Table 4.5.1: Percentage of persons 60 years and older living in households that reported hunger compared to persons 0-59 yrs, 2016 ............................................................ 96
4.6 Older persons: Education ..................................................................................................... 98
Table 4.6.1: Percentage of older persons who are functionally literate by sex, 2016 ................... 98
Table 4.6.2: Percentage distribution of the highest level of education obtained by older persons, 2016 ............................................................................................................ 99
4.7 Older persons: Housing and basic services ..................................................................... 100
Table 4.7.1: Percentage distribution of persons 60 years and older living in formal, informal and traditional housing, 2016 .................................................................................. 100
Table 4.7.2: Living condition indicators of persons 60 years and older compared to those of the overall population, 2016 .................................................................................... 100
4.8 Older persons: Violence and crime victims ...................................................................... 101
Table 4.8.1: Percentage of older persons living in households where the households feel unsafe or very unsafe to walk alone in their area during the day, 2015/16 ............. 101
Table 4.8.2: Percentage of older persons living in households where the households feel unsafe or very unsafe to walk alone in their area at night, 2015/16 ........................ 101
Table 4.8.3: Percentage of older persons who live in households where the fear of crime prevent them from going to open spaces or parks in their area, 2015/16 ............... 102
Table 4.8.4: Percentage of older persons who have been victims of property crime during the past 5 years, 2015/16 .............................................................................................. 102
Table 4.8.5: Percentage of older persons who have been victims of assault during the past 5 years, 2015/16 ......................................................................................................... 102
5.1 Demography of disabled persons ...................................................................................... 103
Table 5.1.1: Distribution of disabled persons, 2016 ..................................................................... 103
5.2 Disabled persons: Household characteristics ................................................................. 103
Table 5.2.1: Distribution of disabled households, 2016 ............................................................... 103
Table 5.2.2: Number of households with disabled household heads, 2016 ................................ 104
5.3 Disabled persons: Education ............................................................................................ 104
Table 5.3.1: Percentage distribution of the educational attainment of disabled persons aged 25 and above, 2016 ................................................................................................. 104
5.4 Disabled persons: Housing and basic services ............................................................... 105
Table 5.4.1: Living conditions indicators of disabled households compared to those of the overall households, 2016 ......................................................................................... 105

STATISTICS SOUTH AFRICA 1
INTRODUCTION A variety of interventions that seek to address challenges faced by different sectors of the population in the country such processes require adequate monitoring as well as information on key indicators that can be used for monitoring. The Vulnerable Groups sector is one of the most affected sectors of the population. Vulnerable Groups1 are defined as a part of the South African population that experience a higher risk of poverty and social exclusion than the general population. This sector requires particular effort to be made at all levels of policy planning and implementation to inform amongst other things resource allocation. Vulnerable Groups in this report are grouped as follows: Children – those aged 17 years and below; The youth – people aged between 15-34 years; Women – the female population; Older persons – people aged 60 years and older; and Persons with disabilities – those experiencing various levels of difficulties in functional domains such as seeing, hearing, walking, remembering and concentrating, self-care, communicating and social interaction One of the most effective ways of tracking progress made towards improving the lives of Vulnerable Groups in South Africa is through the monitoring of key indicators. This should ideally be done at a national, provincial and local level and should be reflected in various reports. The present report “Vulnerable Groups Indicator Report: 2016” is such a report. Its purpose is to present information on key vulnerable groups’ indicators by providing data relating to the socio-economic and demographic profile of vulnerable groups in South Africa using mainly secondary data from Stats SA. This report is the third report in the series and focuses on data collected during the year, 2016. It is envisaged that the data presented in this report will be useful in providing government, researchers, other sector key stakeholders and the general public as a whole with information required to inform policy, research and debate. The current report focuses mainly on presenting data collected in 2016. The main sources of statistics reported on household, demographic and social indicators in this report are largely based on the General Household Survey (GHS). Economic indicators on the labour market were tabulated using the Quarterly Labour Force Survey (QLFS), while crime related indicators were calculated using data from the Victims of Crime Survey (VOCS). GHS, QLFS and VOCS household surveys each covering approximately 30 000 households that are representative of all nine provinces. All data from the above-mentioned Stats SA surveys are weighted so as to make the results representative of the overall population of the country. Pali Lehohla
Statistician-General
1 SOURCE: Social protection and Social inclusion Glossary. DG Employment, Social Affairs and Inclusion
STATISTICS SOUTH AFRICA 2
Vulnerable Groups Indicator Report, 2016 (Report 03-19-02(2016))
Definitions
Sex Parity Ratio (GPR): Is calculated as the percentage/number of females divided by the percentage/number of males with a particular characteristic. Although these ratios are usually designed to measure the relative access to education of males and females, the ratios can also be generally applied to calculate sex disparities or gaps on different socio-economic indicators (Koronkiewicz, 20082).
Graduates: Individuals who have completed a university degree.
Geo-type: Census 2011 definitions for urban and rural have been applied. According to Stats SA, an urban area is defined as a continuously built-up area with characteristics such as type of economic activity and land use. Cities, towns, townships, suburbs, etc. are typical urban areas.
o An urban area is one which was proclaimed or classified as such (i.e. in an urban municipality under the old demarcation), or classified as such during census demarcation by Stats SA, based on its observation of aerial photographs or on other information.
o A rural area is defined as any area that is not classified as urban. Rural areas may comprise one or more of the following: tribal areas, commercial farms and rural formal areas.
Head of the household: There are many debates on what constitutes the term 'household head'. Arguments and discussions around the definition usually deal with the subjective assumptions carried by its interpretation, its implication and influence in socially constructed Sex roles (Hedman et al., 19963; Rosenhouse, 19894). Taking into account arguments for and against, Stats SA loosely defines the head of the household as the person (male or female) who assumes responsibility for the household. This person can be the chief economic provider, the chief decision-maker or the person designated by other members as the head. Survey officers are instructed to record this person as person '01', in the first column of the questionnaire during data collection. However, given that the definition used for households is based on the four-by-four rule5, some individuals, especially migrant workers, who may be considered the head of the household by the household, are often excluded from the data as a result of their limited presence within the household. In those cases the acting household head from the household perspective is indicated in the dataset as the household head.
Labour force participation rate: The proportion of the working-age population that is either employed or unemployed.
Employed persons: Those aged 15–64 years who, during the reference week, did any work for at least one hour, or had a job or business but were not at work (temporarily absent).
Employment-to-population ratio (labour absorption rate): The proportion of the working-age population that is employed.
Not economically active: Persons aged 15–64 years who are neither employed nor unemployed in the reference week.
Unemployment rate: The proportion of the labour force that is unemployed.
2 Koronkiewicz, M. 2008. Sex Parity Index, UNESCO, Bangkok. 3 Hedman, B., Perucci, F. and Sundstrom, P. 1996. EnSexing Statistics: A Tool for Change. Statistics Sweden: Orebro. 4 Rosenhouse, S. 1989. Identifying the Poor: Is 'Headship' a Useful Concept? LSMS Working Paper No 58, World Bank, Washington DC. 5 The person should have been present in the household for at least four nights per week for the past four weeks.

STATISTICS SOUTH AFRICA 3
Vulnerable Groups Indicator Report, 2016 (Report 03-19-02(2016))
Discouraged job-seeker: A person who was not employed during the reference period, wanted to work, was available to work/start a business but did not take active steps to find work during the last four weeks, provided that the main reason given for not seeking work was any of the following: No jobs available in the area; Unable to find work requiring his/her skills; Lost hope of finding any kind of work.
Household composition: Households have been categorised into the following household types:
o A single household is a one-person household o Nuclear households are defined as ‘households consisting of household heads, their
spouses and/or offspring’ o Extended households include other relatives in addition to the nucleus. o Complex households are all households with members who are not related to the
household head
Intergenerational households (Wolf and Folbre, 2012)6.
o A single generation household consists of people of the same age group: a married or cohabiting couple, a single person, siblings, or roommates.
o A double generation family household includes a parent or parents and their child or children under age 25.
o In more than three-generations households, the ages in the household can range from infancy to extreme old age.
o When grandparents and grandchildren whose parents are dead or unable to care for them form a household, this is defined as a skipped-generation household.
Formal dwelling refers to a structure built according to approved plans, i.e. house on a separate stand, flat or apartment, townhouse, room in backyard, rooms or flatlet elsewhere.
Informal dwelling is a makeshift structure not erected according to approved architectural plans, for example shacks or shanties in informal settlements or in backyards.
Traditional dwelling is a category of architecture based on local needs, construction materials and reflecting local traditions. Traditional dwellings tend to evolve over time to reflect the environmental, cultural, technological, economic, and historical context in which it exists.
An orphan is defined as a child whose mother, father or both biological parents have died:
A maternal orphan is a child whose mother has died but whose father is alive.
A paternal orphan is a child whose father has died but whose mother is alive;
A double orphan is a child whose biological mother and father have both passed away. Type of diseases:
In medicine, an acute disease is a disease, a short course, or both. Acute may be used to distinguish a disease from a chronic form, such as acute leukaemia and chronic leukaemia, or to highlight the sudden onset of a disease, such as acute myocardial infarction.
A chronic disease is one lasting 3 months or more. Chronic diseases generally cannot be prevented by vaccines or cured by medication, nor do they just disappear.
6 Wolf, D. & Folbre, N. 2012. Universal Coverage of Long Term care in the United States, Russel Sage Foundation: ISBN-13
/ ISBN-10 978-1-61044-799-7

STATISTICS SOUTH AFRICA 4
Vulnerable Groups Indicator Report, 2016 (Report 03-19-02(2016))
Access to basic household services:
Access to water - Refers to dwellings that have access to piped water source in the house or in the yard
Sanitation – Refers to dwellings with flushing toilets connected to a sewage system or a septic tank, pit toilet with ventilation pipe
Refuse/ Waste -refers to dwellings with rubbish removed by municipality
Electricity- refers to dwellings which are connected to main electricity suppliers
Solid fuels for cooking- refers to dwelling that use wood, coal, and animal dung as source of energy for cooking.

ST
AT
IST
ICS
SO
UT
H A
FR
ICA
5
Vul
nera
ble
Gro
ups
Indi
cato
r R
epor
t, 20
16 (
Rep
ort 0
3-19
-02(
2016
))
IND
ICA
TO
RS
: C
HIL
DR
EN
C
hild
ren
are
define
d a
s p
eople
ag
ed 1
7 y
ears
and b
elo
w.
1.1
T
he D
em
og
rap
hy o
f C
hild
ren
Tab
le 1
.1.1
: D
istr
ibu
tio
n o
f ch
ild
ren
, 201
6
Dis
ag
gre
gati
on
WC
E
C
NC
F
S
KZ
N
NW
G
P
MP
L
P
RS
A
Se
x a
nd
pro
vin
ce
Ma
le
N(‘
00
0)
9
80
1 3
33
20
3
43
6
2 0
46
62
8
1 8
39
76
2
1 1
20
9 3
48
%
51
,3
50
,6
50
,1
49
,1
50
,3
48
,9
50
,5
49
,9
50
,9
50
,4
Fe
ma
le
N(‘
00
0)
9
29
1 3
02
20
3
45
3
2 0
26
65
5
1 8
04
76
5
1 0
82
9 2
18
%
48
,7
49
,4
49
,9
51
,0
49
,8
51
,1
49
,5
50
,1
49
,1
49
,7
Bo
th
N(‘
00
0)
1
91
0
2 6
35
40
6
88
8
4 0
73
1 2
82
3 6
42
1 5
27
2 2
02
18
566
%
10
0,0
1
00
,0
10
0,0
1
00
,0
10
0,0
1
00
,0
10
0,0
1
00
,0
10
0,0
1
00
,0
Se
x a
nd
ge
o-t
yp
e
U
rba
n
Ru
ral
RS
A
Ma
le
N(‘
00
0)
5
26
0
4 0
88
9 3
48
%
49
,9
50
,9
50
,4
Fe
ma
le
N(‘
00
0)
5
27
4
3 9
44
9 2
18
%
50
,1
49
,1
49
,7
Bo
th
N(‘
00
0)
1
0 5
34
8 0
32
18
566
%
10
0,0
1
00
,0
10
0,0
Se
x a
nd
po
pu
lation
g
rou
p
Bla
ck
A
fric
an
C
olo
ure
d
Ind
ian
/ A
sia
n
Wh
ite
RS
A
Ma
le
N(‘
00
0)
7
87
1
79
6
17
7
50
4
9 3
48
%
50
,2
51
,1
49
,8
51
,3
50
,4
Fe
ma
le
N(‘
00
0)
7
80
1
76
1
17
8
47
8
9 2
18
%
49
,8
48
,9
50
,2
48
,7
49
,7
Bo
th
N(‘
00
0)
1
5 6
72
1 5
57
35
5
98
2
18
566
%
10
0,0
1
00
,0
10
0,0
1
00
,0
10
0,0
So
urc
e:
GH
S 2
016

ST
AT
IST
ICS
SO
UT
H A
FR
ICA
6
Vul
nera
ble
Gro
ups
Indi
cato
r R
epor
t, 20
16 (
Rep
ort 0
3-19
-02(
2016
))
Tab
le 1
.1.2
: P
erc
en
tag
e o
f ch
ild
ren
as a
pro
po
rtio
n o
f th
e o
vera
ll p
op
ula
tio
n,
201
6
Dis
ag
gre
gati
on
WC
E
C
NC
F
S
KZ
N
NW
G
P
MP
L
P
RS
A
Se
x a
nd
p
rovin
ce
Ma
le
N(‘
00
0)
9
80
1 3
33
20
3
43
6
2 0
46
62
8
1 8
39
76
2
1 1
20
9 3
48
%
31
,4
41
,5
34
,9
33
,3
39
,4
33
,4
26
,9
36
,3
40
,9
34
,7
Ma
le p
op
ula
tio
n (
'00
0)
3 1
27
3 2
13
58
4
1 3
10
5 1
92
1 8
77
6 8
34
2 1
00
2 7
39
26
975
Fe
ma
le
N(‘
00
0)
9
29
1 3
02
20
3
45
3
2 0
26
65
5
1 8
04
76
5
1 0
82
9 2
18
%
28
,7
37
,0
33
,3
31
,0
36
,1
34
,8
26
,9
34
,9
36
,2
32
,7
Fe
ma
le p
op
ula
tio
n
('0
00
) 3
23
6
3 5
18
60
9
1 4
59
5 6
14
1 8
81
6 7
09
2 1
90
2 9
86
28
202
Bo
th
N(‘
00
0)
1
91
0
2 6
35
40
6
88
8
4 0
73
1 2
82
3 6
42
1 5
27
2 2
02
18
566
%
30
,0
39
,1
34
,1
32
,1
37
,7
34
,1
26
,9
35
,6
38
,5
33
,7
Se
x a
nd
Geo
-ty
pe
U
rba
n
Ru
ral
RS
A
Ma
le
N(‘
00
0)
5
26
0
4 0
88
9 3
48
%
30
,1
42
,9
34
,7
Ma
le p
op
ula
tio
n (
'00
0)
17
449
9 5
26
26
975
Fe
ma
le
N(‘
00
0)
5
27
4
3 9
44
9 2
18
%
29
,4
38
,4
32
,7
Fe
ma
le p
op
ula
tio
n
('0
00
) 1
7 9
20
10
282
28
202
Bo
th
'00
0
10
534
8 0
32
18
566
%
29
,8
40
,6
33
,7
Se
x a
nd
p
op
ula
tio
n g
rou
p
Bla
ck
A
fric
an
C
olo
ur
ed
In
dia
n/
As
ian
W
hit
e
RS
A
Ma
le
N(‘
00
0)
7
87
1
79
6
17
7
50
4
9 3
48
%
36
,3
33
,6
25
,2
22
,9
34
,7
Ma
le p
op
ula
tio
n (
'00
0)
21
699
2 3
73
70
0
2 2
03
26
975
Fe
ma
le
N(‘
00
0)
7
80
1
76
1
17
8
47
8
9 2
18
%
34
,4
30
,1
26
,0
20
,5
32
,7
Fe
ma
le p
op
ula
tio
n
('0
00
) 2
2 6
48
2 5
33
68
4
2 3
37
28
202
Bo
th
'00
0
15
672
1 5
57
35
5
98
2
18
566
%
35
,3
31
,8
25
,6
21
,6
33
,7
S
ou
rce:
GH
S 2
016

ST
AT
IST
ICS
SO
UT
H A
FR
ICA
7
Vul
nera
ble
Gro
ups
Indi
cato
r R
epor
t, 20
16 (
Rep
ort 0
3-19
-02(
2016
))
1.2
C
hild
ren
: H
ou
seh
old
ch
ara
cte
risti
cs
Tab
le 1
.2.1
: C
hild
ren
less
th
an
18 y
ea
rs b
y o
rph
an
-ho
od
sta
tus,
20
16
Ge
nd
er
Ma
tern
al
Orp
ha
n
Pa
tern
al
Orp
ha
n
Do
ub
le O
rph
an
N
ot
Orp
ha
ne
d
To
tal
Ma
le
N(‘
00
0)
27
4
77
8
22
6
7 8
43
9 1
20
%
3,0
8
,5
2,5
8
6,0
1
00
,0
Fe
male
N(‘
00
0)
25
0
78
4
24
1
7 7
26
9 0
01
%
2,8
8
,7
2,7
8
5,8
1
00
,0
Bo
th
N(‘
00
0)
52
4
1 5
62
46
8
15
569
18
122
%
2,9
8
,6
2,6
8
5,9
1
00
,0
So
urc
e:
GH
S 2
016
Tab
le 1
.2.2
: P
erc
en
tag
e d
istr
ibu
tio
n o
f ch
ild
ren
by o
rph
an
-ho
od
sta
tus,
20
16
Dis
ag
gre
gati
on
Orp
ha
n-h
oo
d
WC
E
C
NC
F
S
KZ
N
NW
G
P
MP
L
P
RS
A
%
%
%
%
%
%
%
%
%
%
Se
x a
nd
P
rovin
ce
Ma
le
Ma
tern
al
Orp
ha
n
1,8
4
,5
4,1
3
,3
3,7
2
,1
2,2
3
,4
2,3
3
,0
Pa
tern
al
Orp
ha
n
3,8
9
,4
9,1
8
,6
12
,5
8,8
5
,8
10
,3
7,6
8
,5
Dou
ble
Orp
ha
n
1,1
3
,2
3,0
2
,3
3,1
3
,0
1,7
2
,5
2,6
2
,5
Not
Orp
ha
ne
d
93
,3
82
,9
83
,8
85
,8
80
,8
86
,1
90
,4
83
,8
87
,5
86
,0
To
tal
(%)
10
0,0
1
00
,0
10
0,0
1
00
,0
10
0,0
1
00
,0
10
0,0
1
00
,0
10
0,0
1
00
,0
To
tal
(‘00
0)
98
0
1 2
90
20
1
42
5
2 0
07
59
4
1 7
97
74
2
1 0
85
9 1
20
Fe
male
Ma
tern
al
Orp
ha
n
1,3
3
,8
2,8
2
,8
3,7
2
,3
2,0
4
,2
1,7
2
,8
Pa
tern
al
Orp
ha
n
4,9
1
0,9
8
,3
10
,4
11
,9
8,1
6
,2
8,5
7
,6
8,7
Dou
ble
Orp
ha
n
0,9
4
,1
2,0
3
,8
3,7
1
,4
1,8
3
,1
2,3
2
,7
Not
Orp
ha
ne
d
92
,9
81
,3
86
,9
83
,1
80
,6
88
,2
90
,1
84
,3
88
,4
85
,8
To
tal
(%)
10
0,0
1
00
,0
10
0,0
1
00
,0
10
0,0
1
00
,0
10
0,0
1
00
,0
10
0,0
1
00
,0
To
tal
(‘00
0)
91
9
1 2
68
19
9
43
2
1 9
92
63
4
1 7
71
73
7
1 0
50
9 0
01
So
urc
e:
GH
S 2
016
ST
AT
IST
ICS
SO
UT
H A
FR
ICA
8
Vul
nera
ble
Gro
ups
Indi
cato
r R
epor
t, 20
16 (
Rep
ort 0
3-19
-02(
2016
))
Tab
le 1
.2.2
: P
erc
en
tag
e d
istr
ibu
tio
n o
f ch
ild
ren
by o
rph
an
-ho
od
sta
tus,
20
16
(co
nt.
)
Orp
ha
n-h
oo
d
Bla
ck
/ A
fric
an
C
olo
ure
d
As
ian
/In
dia
n
Wh
ite
To
tal
Se
x a
nd
po
pu
lation
g
rou
p
Ma
le
Ma
tern
al O
rph
an
3
,3
2,1
0
,0
0,8
3
,0
Pa
tern
al O
rph
an
9,5
4
,9
1,4
2
,2
8,5
Dou
ble
Orp
ha
n
2,8
1
,0
0,0
0
,2
2,5
Not
Orp
ha
ne
d
84
,4
91
,9
98
,6
96
,8
86
,0
To
tal
(%)
10
0,0
1
00
,0
10
0,0
1
00
,0
10
0,0
To
tal
(‘00
0)
7 6
54
79
4
17
3
49
9
9 1
20
Fe
male
Ma
tern
al O
rph
an
3
,1
1,9
1
,8
0,0
2
,8
Pa
tern
al O
rph
an
9,6
4
,4
2,8
3
,8
8,7
Dou
ble
Orp
ha
n
3,1
0
,6
0,5
0
,0
2,7
Not
Orp
ha
ne
d
84
,3
93
,1
94
,9
96
,2
85
,8
To
tal
(%)
10
0,0
1
00
,0
10
0,0
1
00
,0
10
0,0
To
tal
(‘00
0)
7 5
95
75
5
17
6
47
6
9 0
01
Orp
ha
n-h
oo
d
Urb
an
R
ura
l T
ota
l
Se
x a
nd
ge
o-t
yp
e
Ma
le
Ma
tern
al O
rph
an
2
,4
3,8
3
,0
Pa
tern
al O
rph
an
6,8
1
0,8
8
,5
Dou
ble
Orp
ha
n
2,3
2
,7
2,5
Not
Orp
ha
ne
d
88
,5
82
,8
86
,0
To
tal
(%)
10
0,0
1
00
,0
10
0,0
To
tal
(‘00
0)
5 1
70
3 9
50
9 1
20
Fe
male
Ma
tern
al O
rph
an
2
,3
3,4
2
,8
Pa
tern
al O
rph
an
7,2
1
0,8
8
,7
Dou
ble
Orp
ha
n
2,4
3
,1
2,7
Not
Orp
ha
ne
d
88
,1
82
,8
85
,8
To
tal
(%)
10
0,0
1
00
,0
10
0,0
To
tal
(‘00
0)
5 1
73
3 8
28
9 0
01
So
urc
e:
GH
S 2
016

ST
AT
IST
ICS
SO
UT
H A
FR
ICA
9
Vul
nera
ble
Gro
ups
Indi
cato
r R
epor
t, 20
16 (
Rep
ort 0
3-19
-02(
2016
))
Tab
le 1
.2.3
: C
hild
ren
by t
heir
pa
ren
tal
liv
ing
arr
an
gem
en
ts, 2
016
G
en
de
r
Liv
es
wit
h m
oth
er
on
ly
Liv
es
wit
h f
ath
er
on
ly
Liv
es
wit
h b
oth
pa
ren
ts
Liv
es
wit
h n
eit
he
r p
are
nt
To
tal
Ma
le
N(‘
00
0)
3 6
51
30
5
3 1
88
1 9
56
9 1
00
%
40
,1
3,4
3
5,0
2
1,5
1
00
,0
Fe
male
N
(‘0
00
) 3
72
2
24
4
3 1
28
1 8
86
8 9
80
%
41
,4
2,7
3
4,8
2
1,0
1
00
,0
Bo
th
N(‘
00
0)
7 3
72
54
9
6 3
16
3 8
42
18
080
%
40
,8
3,0
3
4,9
2
1,3
1
00
,0
So
urc
e:
GH
S 2
016
Tab
le 1
.2.4
: P
erc
en
tag
e d
istr
ibu
tio
n o
f ch
ild
ren
by h
ou
seh
old
co
mp
osit
ion
, 2016
Dis
ag
gre
gati
on
HH
C
om
po
sit
ion
W
C
EC
N
C
FS
K
ZN
N
W
GP
M
P
LP
R
SA
%
%
%
%
%
%
%
%
%
%
Se
x a
nd
P
rovin
ce
Ma
le
Sin
gle
0
,0
0,3
0
,0
0,3
0
,1
0,0
0
,1
0,3
0
,4
0,2
N
ucle
ar
53
,6
24
,3
31
,2
41
,4
24
,6
35
,2
53
,5
36
,1
33
,3
36
,9
E
xte
nd
ed
41
,9
73
,3
64
,9
56
,0
74
,0
63
,2
44
,2
61
,0
65
,3
60
,8
C
om
ple
x
4,5
2
,1
3,9
2
,3
1,4
1
,6
2,2
2
,6
1,0
2
,1
T
ota
l (%
) 1
00
,0
10
0,0
1
00
,0
10
0,0
1
00
,0
10
0,0
1
00
,0
10
0,0
1
00
,0
10
0,0
T
ota
l (‘
00
0)
98
0
1 3
33
20
3
43
4
2 0
43
62
3
1 8
34
76
2
1 1
20
9 3
32
Fe
male
S
ing
le
0,1
0
,1
0,0
0
,1
0,0
0
,1
0,1
0
,0
0,2
0
,1
N
ucle
ar
51
,2
23
,9
32
,0
41
,1
24
,3
40
,1
52
,2
34
,8
33
,4
36
,5
E
xte
nd
ed
42
,5
71
,9
63
,3
55
,2
74
,1
55
,9
46
,1
63
,3
65
,9
60
,8
C
om
ple
x
6,3
4
,1
4,8
3
,6
1,7
4
,0
1,6
1
,9
0,5
2
,7
T
ota
l (%
) 1
00
,0
10
0,0
1
00
,0
10
0,0
1
00
,0
10
0,0
1
00
,0
10
0,0
1
00
,0
10
0,0
T
ota
l (‘
00
0)
92
9
1 3
02
20
3
45
1
2 0
23
65
3
1 8
01
76
4
1 0
81
9 2
07
Se
x a
nd
p
op
ula
tio
n
gro
up
H
H
Co
mp
os
itio
n
Bla
ck
/ A
fric
an
C
olo
ure
d
As
ian
/In
dia
n
Wh
ite
To
tal
Ma
le
Sin
gle
0
,2
0,1
0
,0
0,0
0
,2
N
ucle
ar
32
,9
45
,4
71
,9
74
,1
36
,9
E
xte
nd
ed
65
,2
49
,4
27
,6
21
,8
60
,8
C
om
ple
x
1,7
5
,2
0,6
4
,2
2,1
T
ota
l (%
) 1
00
,0
10
0,0
1
00
,0
10
0,0
1
00
,0
T
ota
l (‘
00
0)
7 8
57
79
6
17
7
50
2
9 3
32
Fe
male
S
ing
le
0,1
0
,0
0,0
0
,2
0,1
N
ucle
ar
32
,9
45
,3
60
,9
71
,8
36
,5
E
xte
nd
ed
64
,9
46
,6
37
,4
25
,1
60
,8
C
om
ple
x
2,2
8
,2
1,7
2
,9
2,7
T
ota
l (%
) 1
00
,0
10
0,0
1
00
,0
10
0,0
1
00
,0
T
ota
l (‘
00
0)
7 7
92
76
1
17
8
47
7
9 2
07
S
ou
rce:
GH
S 2
016

ST
AT
IST
ICS
SO
UT
H A
FR
ICA
10
Vul
nera
ble
Gro
ups
Indi
cato
r R
epor
t, 20
16 (
Rep
ort 0
3-19
-02(
2016
))
Tab
le 1
.2.4
: P
erc
en
tag
e d
istr
ibu
tio
n o
f ch
ild
ren
by h
ou
seh
old
co
mp
osit
ion
, 2016
(co
nt.
)
Se
x a
nd
g
eo
-typ
e
H
H C
om
po
sit
ion
U
rba
n
Ru
ral
To
tal
Ma
le
Sin
gle
0
,1
0,2
0
,2
N
ucle
ar
46
,6
24
,4
36
,9
E
xte
nd
ed
50
,6
73
,9
60
,8
C
om
ple
x
2,7
1
,5
2,1
T
ota
l (%
) 1
00
,0
10
0,0
1
00
,0
T
ota
l (‘
00
0)
5 2
54
4 0
79
9 3
32
Fe
male
S
ing
le
0,1
0
,1
0,1
N
ucle
ar
45
,5
24
,4
36
,5
E
xte
nd
ed
51
,3
73
,5
60
,8
C
om
ple
x
3,2
2
,0
2,7
T
ota
l (%
) 1
00
,0
10
0,0
1
00
,0
T
ota
l (‘
00
0)
5 2
68
3 9
40
9 2
07
So
urc
e:
GH
S 2
016
*
To
tal exclu
des m
issin
g c
ases
Tab
le 1
.2.5
: C
hild
-he
ad
ed
ho
useh
old
s a
cro
ss in
terg
en
era
tio
na
l h
ou
seh
old
typ
e,
2016
Ge
nd
er
S
ing
le g
en
era
tio
n
D
ou
ble
gen
era
tio
n
Tri
ple
or
mo
re g
en
era
tio
n
Oth
er
To
tal
Ma
le
N(‘
00
0)
21
4
* 2
4
48
%
4
2,5
7
,9
0,0
4
9,7
1
00
,0
Fe
male
N
(‘0
00
) 1
8
12
* 1
2
42
%
4
3,0
2
8,8
0
,0
28
,2
10
0,0
Bo
th
N(‘
00
0)
39
16
* 3
6
91
%
4
2,7
1
7,6
0
,0
39
,6
10
0,0
S
ou
rce:
GH
S 2
016
* N
ote
fig
ure
s le
ss t
han 1
000 a
re r
epre
sente
d b
y (
*)

ST
AT
IST
ICS
SO
UT
H A
FR
ICA
11
Vul
nera
ble
Gro
ups
Indi
cato
r R
epor
t, 20
16 (
Rep
ort 0
3-19
-02(
2016
))
1.3
C
hild
ren
: In
co
me, p
ov
ert
y, eco
no
mic
acti
vit
y a
nd
so
cia
l g
ran
ts
T
ab
le 1
.3.1
: C
hild
ren
liv
ing
in
ho
useh
old
s w
ith
ou
t an
em
plo
yed
ad
ult
, 2
016
Se
x
E
mp
loye
d a
du
lt(s
) in
h
ou
se
ho
ld
No
em
plo
ye
d a
du
lt i
n h
ou
seh
old
T
ota
l h
ou
se
ho
lds
Ma
le
N(‘
00
0)
6 5
23
2 8
25
9 3
48
%
6
9,8
3
0,2
1
00
,0
Fe
male
N
(‘0
00
) 6
52
3
2 7
63
9 2
18
%
7
0,0
3
0,0
1
00
,0
Bo
th
N(‘
00
0)
12
978
5 5
88
18
566
%
6
9,9
3
0,1
1
00
,0
So
urc
e:
GH
S 2
016
Tab
le 1
.3.2
: D
istr
ibu
tio
n o
f ch
ild
ren
liv
ing
in
ho
use
ho
lds w
ith
ou
t an
em
plo
ye
d a
du
lt,
201
6
Dis
ag
gre
ga
tio
n
W
C
EC
N
C
FS
K
ZN
N
W
GP
M
P
LP
R
SA
Se
x a
nd
p
rovin
ce
Ma
le
N(‘
00
0)
83
66
2
65
13
3
76
3
21
3
21
4
22
9
46
3
2 8
25
%
2,9
2
3,5
2
,3
4,7
2
7,0
7
,5
7,6
8
,1
16
,4
10
0,0
Fe
male
N(‘
00
0)
87
59
1
69
14
3
72
7
20
6
24
1
23
0
46
9
2 7
63
%
3,2
2
1,4
2
,5
5,2
2
6,3
7
,4
8,7
8
,3
17
,0
10
0,0
Bo
th
N(‘
00
0)
17
0
1 2
54
13
3
27
6
1 4
90
41
9
45
4
45
9
93
2
5 5
88
%
3,0
2
2,4
2
,4
5,0
2
6,7
7
,5
8,1
8
,2
16
,7
10
0,0
S
ou
rce:
GH
S 2
016
Tab
le 1
.3.3
: P
erc
en
tag
e d
istr
ibu
tio
n o
f th
e m
ain
so
urc
e o
f in
co
me f
or
ch
ild
-head
ed
ho
useh
old
s, 2
016
D
isa
gg
reg
ati
on
Sa
lari
es
/wag
es
/co
mm
iss
ion
R
em
itta
nce
s
So
cia
l G
ran
ts
Sa
les
of
farm
ing
p
rod
uc
ts a
nd
se
rvic
es
O
the
r n
on
-fa
rm i
nc
om
e
No
in
co
me
RS
A
Pe
r c
en
t T
ho
us
an
d
Hea
d s
ex
Ma
le
16
,8
75
,0
8,2
0
,0
0,0
0
,0
10
0,0
2
9
Fe
male
0
,0
68
,2
13
,5
4,3
1
3,9
0
,0
10
0,0
1
6
Bo
th
10
,7
72
,5
10
,2
1,6
5
,1
0,0
1
00
,0
45
Ge
o-t
yp
e
Urb
an
29
,9
55
,9
4,2
0
,0
10
,1
0,0
1
00
,0
16
Rura
l 0
,0
81
,8
13
,5
2,5
2
,3
0,0
1
00
,0
29
To
tal
10
,7
72
,5
10
,2
1,6
5
,1
0,0
1
00
,0
45
So
urc
e:
GH
S 2
016
ST
AT
IST
ICS
SO
UT
H A
FR
ICA
12
Vul
nera
ble
Gro
ups
Indi
cato
r R
epor
t, 20
16 (
Rep
ort 0
3-19
-02(
2016
))
Tab
le 1
.3.4
: P
erc
en
tag
e d
istr
ibu
tio
n o
f ch
ild
ren
liv
ing
in
ho
useh
old
s b
y h
ou
seh
old
in
co
me q
uin
tile
s,
2016
D
isa
gg
reg
ati
on
WC
E
C
NC
F
S
KZ
N
NW
G
P
MP
L
P
RS
A
Pro
vin
ce
Ma
le
Be
low
qu
intile
1
8,4
1
8,2
2
4,7
1
3,5
2
6,1
2
5,8
1
6,7
1
9,7
4
0,4
2
1,8
Be
twe
en
Quin
tile
s 1
& 2
1
6,7
2
8,0
1
8,1
1
1,8
2
1,2
1
5,7
1
0,7
1
8,7
1
7,4
1
8,1
Be
twe
en
Quin
tile
s 2
& 3
2
1,7
2
7,1
2
3,6
2
3,0
2
1,9
2
5,1
1
5,0
2
3,5
1
8,4
2
1,3
Be
twe
en
Quin
tile
s 3
& 4
3
0,8
1
5,9
2
2,3
3
2,0
2
1,8
2
0,2
2
4,0
2
3,6
1
6,2
2
2,2
Ab
ove
qu
intile
4
22
,3
10
,9
11
,3
19
,7
8,9
1
3,1
3
3,7
1
4,7
7
,6
16
,6
To
tal
(%)
10
0,0
1
00
,0
10
0,0
1
00
,0
10
0,0
1
00
,0
10
0,0
1
00
,0
10
0,0
1
00
,0
All
ma
le
Ch
ild
ren
(Th
ou
sa
nd
s)
98
0
1 3
33
20
3
43
6
2 0
46
62
8
1 8
39
76
2
1 1
20
9 3
48
Fe
male
Be
low
qu
intile
1
8,9
1
7,2
2
2,0
1
1,6
2
3,9
2
9,3
1
5,8
2
0,6
4
3,8
2
1,7
Be
twe
en
Quin
tile
s 1
& 2
1
8,0
2
5,7
2
2,0
1
0,5
2
1,8
1
4,2
1
1,6
1
6,5
1
7,6
1
7,9
Be
twe
en
Quin
tile
s 2
& 3
2
4,9
2
7,9
2
7,1
2
2,8
2
2,0
2
4,0
1
6,5
2
1,8
1
7,7
2
1,8
Be
twe
en
Quin
tile
s 3
& 4
2
9,5
1
7,7
1
8,6
3
1,8
2
4,3
1
8,0
2
5,2
2
6,5
1
4,2
2
2,9
Ab
ove
qu
intile
4
18
,6
11
,5
10
,4
23
,3
8,1
1
4,5
3
0,9
1
4,6
6
,7
15
,7
To
tal
(%)
10
0,0
1
00
,0
10
0,0
1
00
,0
10
0,0
1
00
,0
10
0,0
1
00
,0
10
0,0
1
00
,0
All
fe
ma
le
Ch
ild
ren
(Th
ou
sa
nd
s)
92
9
1 3
02
20
3
45
3
2 0
26
65
5
1 8
04
76
5
1 0
82
9 2
18
Ge
o-t
yp
e
Ma
le
U
rba
n
Ru
ral
RS
A
Be
low
qu
intile
1
16
,2
29
,1
21
,8
Be
twe
en
Qu
intile
s 1
& 2
1
5,3
2
1,7
1
8,1
Be
twe
en
Quin
tile
s 2
& 3
1
8,5
2
4,8
2
1,3
Be
twe
en
Quin
tile
s 3
& 4
2
6,1
1
7,2
2
2,2
Ab
ove
qu
intile
4
24
,0
7,1
1
6,6
To
tal
(%)
10
0,0
1
00
,0
10
0,0
All
ma
le C
hild
ren
(T
ho
usa
nds)
5 2
60
4 0
88
9 3
48
Fe
male
Be
low
qu
intile
1
16
,1
29
,1
21
,7
Be
twe
en
Quin
tile
s 1
& 2
1
5,4
2
1,4
1
7,9
Be
twe
en
Quin
tile
s 2
& 3
1
9,2
2
5,3
2
1,8
Be
twe
en
Quin
tile
s 3
& 4
2
6,6
1
7,8
2
2,9
Ab
ove
qu
intile
4
22
,7
6,4
1
5,7
To
tal
(%)
10
0,0
1
00
,0
10
0,0
All
fe
ma
le
Ch
ild
ren
(Th
ou
sa
nd
s)
5 2
74
3 9
44
9 2
18
N
ote
: in
co
me Q
uin
tile
s 1
, 2,
3 a
nd
4 a
re R
2000, R
4000,
R6000 a
nd
R15000 r
esp
ecti
vely
S
ou
rce:
GH
S 2
016

ST
AT
IST
ICS
SO
UT
H A
FR
ICA
13
Vul
nera
ble
Gro
ups
Indi
cato
r R
epor
t, 20
16 (
Rep
ort 0
3-19
-02(
2016
))
Tab
le 1
.3.4
: P
erc
en
tag
e d
istr
ibu
tio
n o
f ch
ild
ren
liv
ing
in
ho
useh
old
s b
y h
ou
seh
old
in
co
me
qu
inti
les,
2016
(co
nt.
)
Po
pu
lation
g
rou
p
Ma
le
B
lac
k A
fric
an
C
olo
ure
d
Ind
ian
/ A
sia
n
Wh
ite
RS
A
Be
low
qu
intile
1
24
,4
10
,7
8,0
4
,2
21
,8
Be
twe
en
Quin
tile
s 1
& 2
1
9,5
1
6,8
7
,7
1,6
1
8,1
Be
twe
en
Quin
tile
s 2
& 3
2
2,2
2
2,5
1
8,1
5
,7
21
,3
Be
twe
en
Quin
tile
s 3
& 4
2
1,3
3
1,0
1
8,9
2
3,1
2
2,2
Ab
ove
qu
intile
4
12
,6
19
,1
47
,3
65
,5
16
,6
Pe
r c
en
t 1
00
,0
10
0,0
1
00
,0
10
0,0
1
00
,0
All
ma
le c
hil
dre
n (
Th
ou
sa
nd
s)
7 8
71
79
6
17
7
50
4
9 3
48
Fe
male
Be
low
qu
intile
1
24
,3
10
,4
3,9
2
,7
21
,7
Be
twe
en
Quin
tile
s 1
& 2
1
8,9
2
0,3
9
,7
2,4
1
7,9
Be
twe
en
Quin
tile
s 2
& 3
2
2,5
2
6,3
1
4,6
5
,6
21
,8
Be
twe
en
Quin
tile
s 3
& 4
2
2,3
2
7,1
3
0,3
2
2,3
2
2,9
Ab
ove
qu
intile
4
12
,0
15
,9
41
,4
67
,0
15
,7
Pe
r c
en
t 1
00
,0
10
0,0
1
00
,0
10
0,0
1
00
,0
All
fe
ma
le c
hild
ren
(T
ho
usan
ds
) 7
80
1
76
1
17
8
47
8
9 2
18
No
te:
inc
om
e Q
uin
tile
s 1
, 2,
3 a
nd
4 a
re R
2000, R
4000,
R6000 a
nd
R15000 r
esp
ecti
vely
S
ou
rce:
GH
S 2
016

ST
AT
IST
ICS
SO
UT
H A
FR
ICA
14
Vul
nera
ble
Gro
ups
Indi
cato
r R
epor
t, 20
16 (
Rep
ort 0
3-19
-02(
2016
))
1.4
Ch
ild
ren
: H
ealt
h
Tab
le 1
.4.1
: C
hild
ren
wit
h a
cc
ess
to
med
ica
l aid
, 20
16
Dis
ag
gre
gati
on
Urb
an
R
ura
l R
SA
Me
dic
al
aid
No
m
ed
ica
l a
id
To
tal
Me
dic
al
aid
N
o m
ed
ica
l a
id
To
tal
Me
dic
al
aid
N
o m
ed
ica
l a
id
To
tal
Se
x a
n g
eo
-typ
e
Ma
le
N(‘
00
0)
1 1
97
4 0
12
5 2
09
22
6
3 8
11
4 0
36
1 4
23
7 8
22
9 2
46
%
23
,0
77
,0
10
0,0
5
,6
94
,4
10
0,0
1
5,4
8
4,6
1
00
,0
Fe
male
N
(‘0
00
) 1
14
1
4 0
80
5 2
21
17
6
3 7
18
3 8
93
1 3
17
7 7
97
9 1
14
%
21
,9
78
,1
10
0,0
4
,5
95
,5
10
0,0
1
4,5
8
5,6
1
00
,0
Bo
th
N(‘
00
0)
2 3
39
8 0
92
10
430
40
1
7 5
28
7 9
30
2 7
40
15
620
18
360
%
22
,4
77
,6
10
0,0
5
,1
94
,9
10
0,0
1
4,9
8
5,1
1
00
,0
So
urc
e:
GH
S 2
016
Ta
ble
1.4
.2:
Pe
rce
nta
ge
dis
trib
uti
on
of
typ
es
of
he
alt
hc
are
fa
cilit
ies
vis
ite
d b
y c
hil
dre
n,
20
16
Dis
ag
gre
gati
on
P
ub
lic
H
os
pit
al
Pu
bli
c
Cli
nic
P
ub
lic
O
the
r
Pri
va
te
Ho
sp
ita
l/C
lin
ic/D
oc
tor
Oth
er
fac
ilit
ies
Tra
dit
ion
al
he
ale
r
To
tal
Pe
r c
en
t T
ho
us
an
d
Se
x a
nd
ge
o-
typ
e
Ma
le
Urb
an
8,0
6
0,4
0
,3
30
,6
0,4
0
,3
10
0,0
5
24
4
Rura
l 5
,9
86
,7
0,9
6
,0
0,2
0
,4
10
0,0
4
08
2
Bo
th
7,1
7
1,9
0
,5
19
,8
0,3
0
,3
10
0,0
9
32
7
Fe
ma
le
Urb
an
7,5
6
2,7
0
,5
28
,4
0,5
0
,5
10
0,0
5
26
8
Rura
l 5
,5
87
,5
1,0
5
,4
0,1
0
,4
10
0,0
3
93
7
Bo
th
6,6
7
3,3
0
,7
18
,6
0,3
0
,5
10
0,0
9
20
4
Bo
th
Urb
an
7,7
4
61
,5
0,4
2
9,5
0
,5
0,4
1
00
,0
10
512
Rura
l 5
,7
87
,1
0,9
5
,7
0,2
0
,4
10
0,0
8
01
9
Bo
th
6,9
7
2,6
0
,6
19
,2
0,3
0
,4
10
0,0
1
8 5
31
So
urc
e:
GH
S 2
016

ST
AT
IST
ICS
SO
UT
H A
FR
ICA
15
Vul
nera
ble
Gro
ups
Indi
cato
r R
epor
t, 20
16 (
Rep
ort 0
3-19
-02(
2016
))
Tab
le 1
.4.3
: P
erc
en
tag
e o
f ch
ild
ren
liv
ing
less t
han
30 m
inu
tes
fro
m t
he n
eare
st
healt
h c
are
facil
ity,
20
16
D
isa
gg
reg
ati
on
W
C
EC
N
C
FS
K
ZN
N
W
GP
M
P
LP
R
SA
Se
x a
nd
p
rovin
ce
Ma
le
% s
ha
re
94
,4
72
,9
80
,4
80
,3
69
,3
72
,9
92
,8
80
,5
78
,6
80
,0
Ma
le c
hild
ren
liv
ing
le
ss th
an
3
0m
ins a
wa
y
92
3
97
1
16
3
34
8
1 4
15
45
5
1 6
78
60
8
87
8
7 4
40
All
ma
le C
hil
dre
n (
Th
ou
sa
nd
s)
97
8
1 3
33
20
3
43
4
2 0
42
62
4
1 8
08
75
6
1 1
18
9 2
96
Fe
ma
le
% s
ha
re
93
,8
75
,1
81
,4
83
,2
69
,8
75
,8
92
,3
77
,2
75
,4
80
,0
Fe
male
ch
ildre
n liv
ing
less t
han
3
0m
ins a
wa
y
87
1
97
6
16
4
37
5
1 4
07
49
3
1 6
56
58
2
81
3
7 3
38
All
fe
ma
le C
hil
dre
n
(Th
ou
san
ds
) 9
28
1 3
00
20
1
45
1
2 0
16
65
1
1 7
93
75
5
1 0
78
9 1
73
Bo
th
% s
ha
re
94
,1
74
,0
80
,9
81
,8
69
,6
74
,4
92
,6
78
,8
77
,0
80
,0
All
ch
ild
ren
liv
ing
les
s t
ha
n
30
min
s a
wa
y
1 7
94
1 9
48
32
7
72
3
2 8
22
94
8
3 3
34
1 1
91
1 6
91
14
7
78
All
C
hil
dre
n (
Th
ou
sa
nd
s)
1 9
06
2 6
32
40
4
88
5
4 0
58
1 2
75
3 6
02
1 5
10
2 1
96
18
4
69
Se
x a
nd
ge
o-
typ
e
Urb
an
R
ura
l R
SA
Ma
le
% s
ha
re
90
,8
66
,2
80
,0
Ma
le c
hild
ren
liv
ing
le
ss th
an
3
0m
ins a
wa
y
4 7
43
2 6
98
7 4
40
All
ma
le C
hil
dre
n (
Th
ou
sa
nd
s)
5 2
21
4 0
74
9 2
96
Fe
ma
le
% s
ha
re
90
,6
65
,8
80
,0
Fe
male
ch
ildre
n liv
ing
less t
han
3
0m
ins a
wa
y
4 7
61
2 5
77
7 3
38
All
fe
ma
le C
hil
dre
n
(Th
ou
san
ds
) 5
25
5
3 9
18
9 1
73
Bo
th
% s
ha
re
90
,7
66
,0
80
,0
All
ch
ildre
n liv
ing less th
an
3
0m
ins a
wa
y
9 5
03
5 2
75
14
778
All
C
hil
dre
n (
Th
ou
sa
nd
s)
10
476
7 9
93
18
469
S
ou
rce:
GH
S 2
016
Tab
le 1
.4.4
: P
erc
en
tag
e o
f ch
ild
ren
wh
o s
uff
ere
d f
rom
acu
te d
iseas
es c
om
pare
d t
o t
he o
vera
ll p
op
ula
tio
n,
2016
Dis
ag
gre
gati
on
WC
E
C
NC
F
S
KZ
N
NW
G
P
MP
L
P
RS
A
Pro
vin
ce
% s
ha
re o
f child
ren
su
fferi
ng
9,0
1
0,1
1
2,5
1
0,4
8
,0
9,6
1
7,6
1
2,5
8
,0
11
,0
To
tal child
ren
su
ffe
rin
g
17
2
26
7
51
92
32
4
12
4
64
2
19
1
17
6
2 0
38
Ch
ild
ren
(th
ou
sa
nd
) 1
91
0
2 6
35
40
6
88
8
4 0
73
1 2
82
3 6
42
1 5
27
2 2
02
18
566
% s
ha
re o
f p
ers
on
s s
uff
eri
ng
(A
ll)
8,2
1
0,1
1
1,6
1
0,4
7
,1
9,7
1
4,4
1
1,3
7
,3
10
,2
To
tal
nu
mb
er
of
pe
rso
ns
s
uff
eri
ng
5
23
67
7
13
9
28
9
76
3
36
5
1 9
53
48
6
41
5
5 6
10
Po
pu
lati
on
(th
ou
sa
nd
) 6
36
2
6 7
31
1 1
92
2 7
69
10
807
3 7
58
13
5
43
4 2
90
5 7
24
55
177
So
urc
e:
GH
S 2
016

ST
AT
IST
ICS
SO
UT
H A
FR
ICA
16
Vul
nera
ble
Gro
ups
Indi
cato
r R
epor
t, 20
16 (
Rep
ort 0
3-19
-02(
2016
))
Tab
le 1
.4.4
: P
erc
en
tag
e o
f ch
ild
ren
wh
o s
uff
ere
d f
rom
acu
te d
iseas
es c
om
pare
d t
o t
he o
vera
ll p
op
ula
tio
n, 2016
(co
nt.
)
Ge
o-t
yp
e
U
rba
n
Ru
ral
R
SA
% s
ha
re o
f child
ren
su
fferi
ng
1
3,1
8
,2
11
,0
To
tal child
ren
su
ffe
rin
g
1 3
82
65
6
2 0
38
All
ch
ild
ren
(th
ou
sa
nd
) 1
0 5
34
8 0
32
18
566
% s
ha
re o
f p
ers
on
s s
uff
eri
ng
(A
ll)
11
,4
8,1
1
0,2
To
tal
nu
mb
er
of
pe
rso
ns
su
ffe
rin
g
4 0
13
1 5
97
5 6
10
Po
pu
lati
on
(th
ou
sa
nd
) 3
5 3
69
19
807
55
177
Se
x
M
ale
F
em
ale
R
SA
% s
ha
re o
f child
ren
su
fferi
ng
1
0,9
1
1,1
1
1,0
To
tal child
ren
su
ffe
rin
g
1 0
18
1 0
20
2 0
38
All
ch
ild
ren
(th
ou
sa
nd
) 9
34
8
9 2
18
18
566
% s
ha
re o
f p
ers
on
s s
uff
eri
ng
(A
ll)
9,4
1
0,9
1
0,2
To
tal
nu
mb
er
of
pe
rso
ns
su
ffe
rin
g
2 5
27
3 0
82
5 6
10
Po
pu
lati
on
(th
ou
sa
nd
) 2
6 9
75
28
202
55
177
So
urc
e:
GH
S 2
016
Tab
le 1
.4.5
: P
erc
en
tag
e o
f ch
ild
ren
wh
o s
uff
ere
d f
rom
ch
ron
ic d
isea
ses
co
mp
are
d t
o t
he o
vera
ll p
op
ula
tio
n,
201
6
Dis
ag
gre
gati
on
WC
E
C
NC
F
S
KZ
N
NW
G
P
MP
L
P
RS
A
Pro
vin
ce
% s
ha
re o
f child
ren
su
fferi
ng
5
,0
2,5
4
,5
3,2
2
,4
2,7
3
,4
2,5
1
,3
2,9
To
tal child
ren
su
ffe
rin
g
95
67
18
28
98
34
12
3
38
28
53
0
All
ch
ild
ren
(T
ho
us
an
ds
) 1
91
0
2 6
35
40
6
88
8
4 0
73
1 2
82
3 6
42
1 5
27
2 2
02
18
566
% s
ha
re o
f p
ers
on
s s
uff
eri
ng
(A
ll)
19
,7
16
,7
21
,5
19
,6
14
,4
16
,9
15
,8
14
,1
8,4
1
5,6
To
tal
nu
mb
er
of
pe
rso
ns
s
uff
eri
ng
1
25
6
1 1
24
25
7
54
4
1 5
55
63
3
2 1
39
60
6
48
3
8 5
97
Po
pu
lati
on
(T
ho
us
an
ds
) 6
36
2
6 7
31
1 1
92
2 7
69
10
807
3 7
58
13
543
4 2
90
5 7
24
55
177
Ge
o-t
yp
e
U
rba
n
Ru
ral
RS
A
% s
ha
re o
f child
ren
su
fferi
ng
3
,4
2,1
2
,9
To
tal child
ren
su
ffe
rin
g
36
0
17
1
53
0
All
c
hil
dre
n (
Th
ou
sa
nd
s)
10
534
8 0
32
18
566
% s
ha
re o
f p
ers
on
s s
uff
eri
ng
(A
ll)
16
,7
13
,6
15
,6
To
tal
nu
mb
er
of
pe
rso
ns
s
uff
eri
ng
5
90
8
2 6
89
8 5
97
Po
pu
lati
on
(T
ho
us
an
ds
) 3
5 3
69
19
807
55
177
Se
x
M
ale
F
em
ale
B
oth
% s
ha
re o
f child
ren
su
fferi
ng
3
,2
2,5
2
,9
To
tal child
ren
su
ffe
rin
g
29
9
23
2
53
0
All
ch
ild
ren
(T
ho
us
an
ds
) 9
34
8
9 2
18
18
566
% s
ha
re o
f p
ers
on
s s
uff
eri
ng
(A
ll)
12
,0
19
,0
15
,6
To
tal
nu
mb
er
of
pe
rso
ns
s
uff
eri
ng
3
24
8
5 3
49
8 5
97
Po
pu
lati
on
(T
ho
us
an
ds
) 2
6 9
75
28
202
55
177
S
ou
rce:
GH
S 2
016

ST
AT
IST
ICS
SO
UT
H A
FR
ICA
17
Vul
nera
ble
Gro
ups
Indi
cato
r R
epor
t, 20
16 (
Rep
ort 0
3-19
-02(
2016
))
1.5
Ch
ild
ren
: V
uln
era
bilit
y t
o h
un
ger
Tab
le 1
.5.1
: C
hild
ren
liv
ing
in
ho
useh
old
s b
y w
heth
er
or
no
t h
un
ge
r w
as r
ep
ort
ed
in
th
e h
ou
seh
old
s,
2016
Rep
ort
ed
no
hu
ng
er
Rep
ort
ed
Hu
ng
er
To
tal
Ma
le
N(‘
00
0)
7 9
20
1 3
97
9 3
17
%
85
,0
15
,0
10
0,0
Fe
male
N
(‘0
00
) 7
75
3
1 4
29
9 1
82
%
84
,4
15
,6
10
0,0
Bo
th
N(‘
00
0)
15
673
2 8
26
18
499
%
84
,7
15
,3
10
0,0
S
ou
rce:
GH
S 2
01
Tab
le 1
.5.2
: P
erc
en
tag
e o
f ch
ild
ren
liv
ing
in
ho
use
ho
lds
th
at
rep
ort
ed
hu
ng
er,
2016
Sex a
nd
Pro
vin
ce
WC
E
C
NC
F
S
KZ
N
NW
G
P
MP
L
P
RS
A
Male
%
16,4
13,1
21,2
14,0
23,5
15,0
12,1
13,7
5,3
15,0
N(‘0
00)
161
175
43
61
479
94
221
104
59
1 3
97
All
ma
le c
hild
ren
980
1 3
29
202
436
2 0
42
627
1 8
23
758
1 1
20
9 3
17
Fe
male
%
21,1
14,1
22,3
16,8
22,8
18,0
11,3
12,0
5,3
15,6
N(‘0
00)
195
183
45
76
461
118
202
91
58
1 4
29
All
fem
ale
child
ren
927
1 2
97
201
453
2 0
22
655
1 7
89
759
1 0
81
9 1
82
Bo
th
%
18,7
13,6
21,7
15,4
23,1
16,5
11,7
12,9
5,3
15,3
N(‘
000)
356
358
88
137
941
212
423
195
117
2 8
26
All
ch
ild
ren
1 9
07
2 6
25
403
888
4 0
64
1 2
82
3 6
12
1 5
18
2 2
00
18 4
99
Sex a
nd
geo-t
ype
Urb
an
R
ura
l R
SA
Male
%
12,9
8
17,6
15,0
N(‘0
00)
680
717
1 3
97
All
ma
le c
hild
ren
5 2
36
4 0
81
9 3
17
Fe
male
%
13,5
1
18,3
15,6
N(‘0
00)
709
721
1 4
29
All
fem
ale
child
ren
5 2
45
3 9
37
9 1
82
Bo
th
%
13,2
5
17,9
15,3
N(‘
000)
1 3
89
1 4
38
2 8
26
All
ch
ild
ren
10 4
81
8 0
18
18 4
99
So
urc
e:
GH
S 2
016

ST
AT
IST
ICS
SO
UT
H A
FR
ICA
18
Vul
nera
ble
Gro
ups
Indi
cato
r R
epor
t, 20
16 (
Rep
ort 0
3-19
-02(
2016
))
Tab
le 1
.5.3
: P
erc
en
tag
e o
f ch
ild
-in
clu
siv
e h
ou
seh
old
s t
hat
rep
ort
ed
hu
ng
er,
2016
Dis
ag
gre
gati
on
WC
E
C
NC
F
S
KZ
N
NW
G
P
MP
L
P
RS
A
Pro
vin
ce
% s
ha
re
1
7,3
1
1,9
1
9,6
1
3,1
2
0,2
1
4,1
1
1,5
1
2,9
5
,0
13
,5
Ho
us
eh
old
s
ex
pe
rie
nc
ing
15
7
11
8
37
69
29
4
87
26
5
89
48
1 1
62
A
ll
Ch
ild
-in
clu
siv
e H
Hs (
‘000
) 9
07
98
5
18
7
52
6
1 4
59
61
8
2 3
04
69
0
94
6
8 6
22
U
rba
n
Ru
ral
RS
A
Ge
o-t
yp
e
% s
ha
re
1
2,2
1
5,8
1
3,5
Ho
us
eh
old
s
ex
pe
rie
nc
ing
66
9
49
3
1 1
62
A
ll
Ch
ild
-in
clu
siv
e H
Hs (
‘000
) 5
49
6
3 1
25
8 6
22
M
ale
F
em
ale
B
oth
Hea
d s
ex
% s
ha
re
1
0,6
1
6,4
1
3,5
Ho
us
eh
old
s
ex
pe
rie
nc
ing
45
7
70
5
1 1
62
A
ll
Ch
ild
-in
clu
siv
e H
Hs (
‘000
) 4
32
7
4 2
95
8 6
22
S
ou
rce:
GH
S 2
016

ST
AT
IST
ICS
SO
UT
H A
FR
ICA
19
Vul
nera
ble
Gro
ups
Indi
cato
r R
epor
t, 20
16 (
Rep
ort 0
3-19
-02(
2016
))
1.6
Ch
ild
ren
: E
du
cati
on
T
ab
le 1
.6.1
: S
ch
oo
l att
en
dan
ce
by c
hild
ren
of
co
mp
uls
ory
sch
oo
l ag
e (
7-1
5 y
ears
) b
y s
ex,
20
16
Se
x
No
t a
tte
nd
ing
A
tte
nd
ing
T
ota
l
Ma
le
N(‘
00
0)
58
4 5
80
46
38
%
1,2
9
8,8
1
00
,0
Fe
ma
le
N(‘
00
0)
47
4 5
28
45
75
%
1,0
9
9,0
1
00
,0
Bo
th
N(‘
00
0)
10
4
9 1
08
9 2
12
%
1,1
9
8,9
1
00
,0
Se
x a
nd
a
ge
gro
up
7-1
3
14
-17
No
t a
tte
nd
ing
A
tte
nd
ing
T
ota
l N
ot
att
en
din
g
Att
en
din
g
To
tal
Ma
le
N(‘
00
0)
28
3 6
59
3 6
87
30
92
1
95
1
%
0,8
9
9,2
1
00
,0
3,1
9
6,9
1
00
,0
Fe
male
N(‘
00
0)
20
3 6
33
3 6
53
27
89
5
92
1
%
0,6
9
9,5
1
00
,0
2,9
9
7,1
1
00
,0
Bo
th
N(‘
00
0)
48
7 2
92
7 3
40
56
1 8
16
1 8
72
%
1,2
9
8,8
1
00
,0
3,0
9
7,0
1
00
,0
So
urc
e:
GH
S 2
016
Tab
le 1
.6.2
: L
ev
els
of
lea
rners
in
pu
bli
c o
rdin
ary
sc
ho
ols
(P
OS
) b
en
efi
tin
g f
rom
th
e "
No
Fe
es S
ch
oo
l” p
olic
y,
201
6
Ma
le
Fe
ma
le
Bo
th
N(‘
00
0)
%
N(‘
00
0)
%
N(‘
00
0)
%
Ben
efi
cia
ry
3 6
69
95
,9
3 4
80
95
,6
7 1
49
95
,8
All
ch
ild
ren
att
en
din
g
PO
S
3 8
26
3
63
9
7
46
5
S
ou
rce:
GH
S 2
016
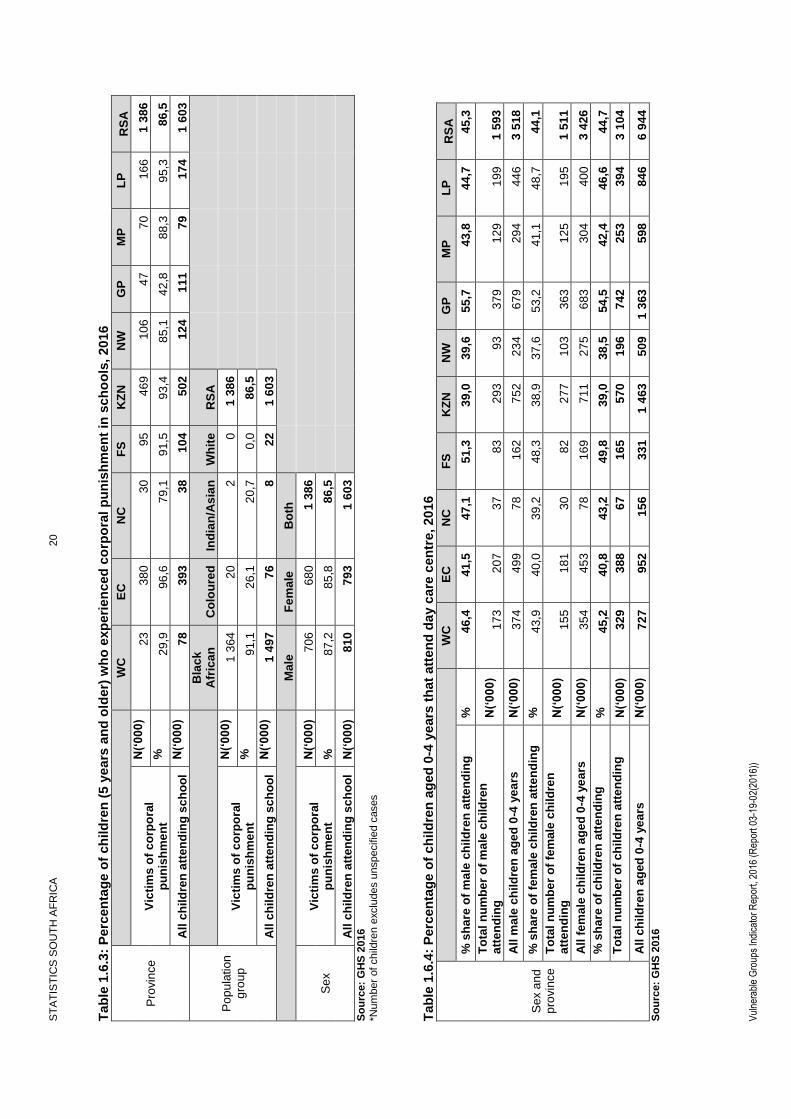
ST
AT
IST
ICS
SO
UT
H A
FR
ICA
20
Vul
nera
ble
Gro
ups
Indi
cato
r R
epor
t, 20
16 (
Rep
ort 0
3-19
-02(
2016
))
Tab
le 1
.6.3
: P
erc
en
tag
e o
f ch
ild
ren
(5 y
ears
an
d o
lder)
wh
o e
xp
eri
en
ced
co
rpo
ral
pu
nis
hm
en
t in
sch
oo
ls, 20
16
Pro
vin
ce
W
C
EC
N
C
FS
K
ZN
N
W
GP
M
P
LP
R
SA
Vic
tim
s o
f c
orp
ora
l p
un
ish
me
nt
N(‘
00
0)
23
38
0
30
95
46
9
10
6
47
70
16
6
1 3
86
%
29
,9
96
,6
79
,1
91
,5
93
,4
85
,1
42
,8
88
,3
95
,3
86
,5
All
ch
ild
ren
att
en
din
g s
ch
oo
l N
(‘0
00
) 7
8
39
3
38
10
4
50
2
12
4
11
1
79
17
4
1 6
03
Po
pu
lation
g
rou
p
Bla
ck
A
fric
an
C
olo
ure
d
Ind
ian
/As
ian
W
hit
e
RS
A
Vic
tim
s o
f c
orp
ora
l p
un
ish
me
nt
N(‘
00
0)
1 3
64
20
2
0
1 3
86
%
91
,1
26
,1
20
,7
0,0
8
6,5
All
ch
ild
ren
att
en
din
g s
ch
oo
l N
(‘0
00
) 1
49
7
76
8
22
1 6
03
M
ale
F
em
ale
B
oth
Se
x
Vic
tim
s o
f c
orp
ora
l p
un
ish
me
nt
N(‘
00
0)
70
6
68
0
1 3
86
%
87
,2
85
,8
86
,5
All
ch
ild
ren
att
en
din
g s
ch
oo
l N
(‘0
00
) 8
10
79
3
1 6
03
S
ou
rce:
GH
S 2
016
*Num
ber
of child
ren e
xclu
des u
nspecifie
d c
ases
Tab
le 1
.6.4
: P
erc
en
tag
e o
f ch
ild
ren
ag
ed
0-4
ye
ars
th
at
att
en
d d
ay c
are
cen
tre,
20
16
Se
x a
nd
p
rovin
ce
W
C
EC
N
C
FS
K
ZN
N
W
GP
M
P
LP
R
SA
% s
ha
re o
f m
ale
ch
ild
ren
att
en
din
g
%
46
,4
41
,5
47
,1
51
,3
39
,0
39
,6
55
,7
43
,8
44
,7
45
,3
To
tal
nu
mb
er
of
ma
le c
hild
ren
a
tte
nd
ing
N
(‘0
00
) 1
73
20
7
37
83
29
3
93
37
9
12
9
19
9
1 5
93
All
ma
le c
hil
dre
n a
ge
d 0
-4 y
ea
rs
N(‘
00
0)
37
4
49
9
78
16
2
75
2
23
4
67
9
29
4
44
6
3 5
18
% s
ha
re o
f fe
ma
le c
hil
dre
n a
tte
nd
ing
%
4
3,9
4
0,0
3
9,2
4
8,3
3
8,9
3
7,6
5
3,2
4
1,1
4
8,7
4
4,1
To
tal
nu
mb
er
of
fem
ale
ch
ild
ren
a
tte
nd
ing
N
(‘0
00
) 1
55
18
1
30
82
27
7
10
3
36
3
12
5
19
5
1 5
11
All
fe
ma
le c
hild
ren
ag
ed
0-4
ye
ars
N
(‘0
00
) 3
54
45
3
78
16
9
71
1
27
5
68
3
30
4
40
0
3 4
26
% s
ha
re o
f c
hil
dre
n a
tte
nd
ing
%
4
5,2
4
0,8
4
3,2
4
9,8
3
9,0
3
8,5
5
4,5
4
2,4
4
6,6
4
4,7
To
tal
nu
mb
er
of
ch
ild
ren
att
en
din
g
N(‘
00
0)
32
9
38
8
67
16
5
57
0
19
6
74
2
25
3
39
4
3 1
04
All
ch
ild
ren
ag
ed
0-4
ye
ars
N
(‘0
00
) 7
27
95
2
15
6
33
1
1 4
63
50
9
1 3
63
59
8
84
6
6 9
44
So
urc
e:
GH
S 2
016

ST
AT
IST
ICS
SO
UT
H A
FR
ICA
21
Vul
nera
ble
Gro
ups
Indi
cato
r R
epor
t, 20
16 (
Rep
ort 0
3-19
-02(
2016
))
Tab
le 1
.6.4
: P
erc
en
tag
e o
f ch
ild
ren
ag
ed
0-4
ye
ars
th
at
att
en
d d
ay c
are
cen
tre,
20
16 (
co
nt.
)
U
rba
n
Ru
ral
RS
A
Se
x a
nd
g
eo
-typ
e
% s
ha
re o
f m
ale
ch
ild
ren
att
en
din
g
%
50
,1
39
,0
45
,3
To
tal
nu
mb
er
of
ma
le c
hild
ren
att
en
din
g
N(‘
00
0)
99
8
59
4
1 5
93
All
ma
le c
hil
dre
n a
ge
d 0
-4 y
ea
rs
N(‘
00
0)
1 9
92
1 5
26
3 5
18
% s
ha
re o
f fe
ma
le c
hil
dre
n a
tte
nd
ing
%
4
8,7
3
7,9
4
4,1
To
tal
nu
mb
er
of
fem
ale
ch
ild
ren
att
en
din
g
N(‘
00
0)
95
9
55
2
1 5
11
All
fe
ma
le c
hild
ren
ag
ed
0-4
ye
ars
N
(‘0
00
) 1
97
0
1 4
56
3 4
26
% s
ha
re o
f c
hil
dre
n a
tte
nd
ing
%
4
9,4
3
8,4
4
4,7
To
tal
nu
mb
er
of
ch
ild
ren
att
en
din
g
N(‘
00
0)
1 9
58
1 1
46
3 1
04
All
ch
ild
ren
ag
ed
0-4
ye
ars
N
(‘0
00
) 3
96
2
2 9
82
6 9
44
So
urc
e:
GH
S 2
016
Tab
le 1
.6.5
: P
erc
en
tag
e o
f ch
ild
ren
ag
ed
7-1
3 y
ears
part
icip
ati
ng
in
ed
uc
ati
on
al in
sti
tuti
on
s,
2016
Se
x a
nd
p
rovin
ce
W
C
EC
N
C
FS
K
ZN
N
W
GP
M
P
LP
R
SA
% s
ha
re o
f m
ale
ch
ild
ren
pa
rtic
ipa
tin
g
%
99
,2
99
,2
97
,4
98
,2
99
,4
98
,9
99
,7
99
,3
99
,2
99
,2
To
tal
nu
mb
er
of
ma
le c
hild
ren
att
en
din
g
N(‘
00
0)
39
3
51
0
78
16
5
84
4
25
8
71
8
30
0
39
3
3 6
59
All
ma
le c
hil
dre
n a
ge
d 7
-13
ye
ars
N
(‘0
00
) 3
96
51
4
80
16
8
84
9
26
1
72
0
30
2
39
6
3 6
87
% s
ha
re o
f fe
ma
le c
hil
dre
n p
art
icip
ati
ng
%
9
9,6
9
9,5
1
00
,0
99
,7
99
,5
97
,8
99
,5
99
,2
10
0,0
9
9,5
To
tal
nu
mb
er
of
fem
ale
ch
ild
ren
att
en
din
g
N(‘
00
0)
36
7
53
7
77
16
8
83
7
23
0
71
9
29
0
40
8
3 6
33
All
fe
ma
le c
hild
ren
ag
ed
7-1
3 y
ea
rs
N(‘
00
0)
36
8
53
9
77
16
8
84
2
23
6
72
2
29
2
40
8
3 6
53
% s
ha
re o
f c
hil
dre
n p
art
icip
ati
ng
%
9
9,4
9
9,3
9
8,7
9
8,9
9
9,4
9
8,4
9
9,6
9
9,3
9
9,6
9
9,3
To
tal
nu
mb
er
of
ch
ild
ren
att
en
din
g
N(‘
00
0)
76
0
1 0
47
15
5
33
3
1 6
81
48
9
1 4
37
58
9
80
1
7 2
92
All
ch
ild
ren
ag
ed
7-1
3 y
ea
rs
N(‘
00
0)
76
4
1 0
54
15
7
33
7
1 6
91
49
7
1 4
42
59
4
80
4
7 3
40
U
rba
n
Ru
ral
RS
A
Se
x a
nd
g
eo
-typ
e
% s
ha
re o
f m
ale
ch
ild
ren
pa
rtic
ipa
tin
g
%
99
,3
99
,2
99
,2
To
tal
nu
mb
er
of
ma
le c
hild
ren
att
en
din
g
N(‘
00
0)
2 0
63
1 5
95
3 6
59
All
ma
le c
hil
dre
n a
ge
d 7
-13
ye
ars
N
(‘0
00
) 2
07
8
1 6
09
3 6
87
% s
ha
re o
f fe
ma
le c
hil
dre
n p
art
icip
ati
ng
%
9
9,5
9
9,4
9
9,5
To
tal
nu
mb
er
of
fem
ale
ch
ild
ren
att
en
din
g
N(‘
00
0)
2 0
88
1 5
45
3 6
33
All
fe
ma
le c
hild
ren
ag
ed
7-1
3 y
ea
rs
N(‘
00
0)
2 0
99
1 5
54
3 6
53
% s
ha
re o
f c
hil
dre
n p
art
icip
ati
ng
%
9
9,4
9
9,3
9
9,3
To
tal
nu
mb
er
of
ch
ild
ren
att
en
din
g
N(‘
00
0)
4 1
52
3 1
40
7 2
92
All
ch
ild
ren
ag
ed
7-1
3 y
ea
rs
N(‘
00
0)
4 1
77
3 1
63
7 3
40
S
ou
rce:
GH
S 2
016

ST
AT
IST
ICS
SO
UT
H A
FR
ICA
22
Vul
nera
ble
Gro
ups
Indi
cato
r R
epor
t, 20
16 (
Rep
ort 0
3-19
-02(
2016
))
Tab
le 1
.6.6
: P
erc
en
tag
e o
f ch
ild
ren
ag
ed
14
-17 y
ea
rs p
art
icip
ati
ng
in
ed
ucati
on
al in
sti
tuti
on
(s),
201
6
W
C
EC
N
C
FS
K
ZN
N
W
GP
M
P
LP
R
SA
Se
x a
nd
p
rovin
ce
% s
ha
re o
f m
ale
ch
ild
ren
pa
rtic
ipa
tin
g
%
90
,6
91
,7
90
,5
93
,1
93
,8
90
,1
92
,8
97
,4
98
,6
93
,5
To
tal
nu
mb
er
of
ma
le c
hild
ren
a
tte
nd
ing
N
(‘0
00
) 1
86
28
1
38
95
38
7
11
4
36
0
15
8
25
7
1 8
75
All
ma
le c
hil
dre
n a
ge
d 1
4-1
7 y
ea
rs
N(‘
00
0)
20
5
30
6
42
10
2
41
2
12
6
38
8
16
2
26
0
2 0
05
% s
ha
re o
f fe
ma
le c
hil
dre
n
pa
rtic
ipa
tin
g
%
90
,3
93
,1
87
,9
93
,8
93
,9
90
,9
94
,8
92
,8
97
,3
93
,6
To
tal
nu
mb
er
of
fem
ale
ch
ild
ren
a
tte
nd
ing
N
(‘0
00
) 1
83
27
5
39
10
3
41
0
12
4
34
4
15
0-
24
6
1 8
75
All
fe
ma
le c
hild
ren
ag
ed
14
-17
ye
ars
N
(‘0
00
) 2
03
29
5
45
10
9
43
7
13
7
36
2
16
2
25
3
2 0
03
% s
ha
re o
f c
hil
dre
n p
art
icip
ati
ng
%
9
0,5
9
2,4
8
9,2
9
3,4
9
3,8
9
0,5
9
3,8
9
5,1
9
7,9
9
3,6
To
tal
nu
mb
er
of
ch
ild
ren
att
en
din
g
N(‘
00
0)
36
9
55
6
78
19
8
79
7
23
8
70
4
30
9
50
3
3 7
50
All
ch
ild
ren
ag
ed
14
-17
ye
ars
N
(‘0
00
) 4
08
60
2
87
21
2
84
9
26
3
75
0
32
4
51
3
4 0
08
U
rba
n
Ru
ral
RS
A
Se
x a
nd
g
eo
-typ
e
% s
ha
re o
f m
ale
ch
ild
ren
pa
rtic
ipa
tin
g
%
92
,6
94
,6
93
,5
To
tal
nu
mb
er
of
ma
le c
hild
ren
a
tte
nd
ing
N
(‘0
00
) 1
02
1
85
4
1 8
75
All
ma
le c
hil
dre
n a
ge
d 1
4-1
7 y
ea
rs
N(‘
00
0)
1 1
02
90
3
2 0
05
% s
ha
re o
f fe
ma
le c
hil
dre
n
pa
rtic
ipa
tin
g
%
93
,6
93
,6
93
,6
To
tal
nu
mb
er
of
fem
ale
ch
ild
ren
a
tte
nd
ing
N
(‘0
00
) 1
05
7
81
8
1 8
75
All
fe
ma
le c
hild
ren
ag
ed
14
-17
ye
ars
N
(‘0
00
) 1
12
9
87
4
2 0
03
% s
ha
re o
f c
hil
dre
n p
art
icip
ati
ng
%
9
3,1
9
4,1
9
3,6
To
tal
nu
mb
er
of
ch
ild
ren
att
en
din
g
N(‘
00
0)
2 0
78
1 6
72
3 7
50
All
ch
ild
ren
ag
ed
14
-17
ye
ars
N
(‘0
00
) 2
23
1
1 7
77
4 0
08
S
ou
rce:
GH
S 2
016
Tab
le 1
.6.7
: P
erc
en
tag
e o
f ch
ild
ren
ag
ed
15 y
ears
wh
o h
av
e n
ot
co
mp
lete
d g
rad
e 7
, 20
16
Se
x a
nd
p
rovin
ce
WC
E
C
NC
F
S
KZ
N
NW
G
P
MP
L
P
RS
A
% o
f m
ale
ch
ild
ren
wh
o h
ave
no
t c
om
ple
ted
gra
de
7
%
10
,0
31
,3
28
,2
28
,9
19
,3
29
,1
13
,6
19
,5
18
,0
19
,7
Ma
le c
hil
dre
n a
ge
d 1
5 w
ho
ha
ve
no
t c
om
ple
ted
gra
de 7
N
(‘0
00
) 6
2
0
4
7
18
8
14
9
12
98
All
ma
le c
hil
dre
n a
ge
d 1
5 y
ea
rs
N(‘
00
0)
56
65
13
26
91
28
10
4
44
68
49
5
%
of
fem
ale
ch
ild
ren
ag
ed
15
wh
o h
ave
no
t c
om
ple
ted
gra
de
7
%
1
0,5
1
1,3
1
4,3
1
4,0
7
,4
14
,6
7,8
7
,0
5,3
9
,1
Fe
ma
le c
hild
ren
ag
ed
15
wh
o h
ave
no
t co
mp
lete
d g
rad
e 7
N
(‘0
00
) 4
8
2
4
7
4
6
3
3
4
0
All
fe
ma
le c
hild
ren
ag
ed
15
ye
ars
N
(‘0
00
) 3
8
70
13
26
92
29
83
38
57
44
6
% o
f c
hil
dre
n a
ge
d 1
5 w
ho
ha
ve
no
t c
om
ple
ted
gra
de 7
%
1
0,2
2
0,8
2
1,3
2
1,5
1
3,3
2
1,8
1
1,0
1
3,7
1
2,2
1
4,7
Ch
ild
ren
ag
ed
15
wh
o h
ave
no
t c
om
ple
ted
gra
de 7
N
(‘0
00
) 1
0
28
5
11
24
12
21
11
15
13
8
Ch
ild
ren
ag
ed
15
ye
ars
N
(‘0
00
) 9
5
13
5
25
51
18
3
57
18
8
82
12
5
94
2
So
urc
e:
GH
S 2
016

ST
AT
IST
ICS
SO
UT
H A
FR
ICA
23
Vul
nera
ble
Gro
ups
Indi
cato
r R
epor
t, 20
16 (
Rep
ort 0
3-19
-02(
2016
))
Tab
le 1
.6.7
: P
erc
en
tag
e o
f ch
ild
ren
ag
ed
15 y
ears
wh
o h
av
e n
ot
co
mp
lete
d g
rad
e 7
, 20
16(c
on
t.)
U
rba
n
Ru
ral
RS
A
Se
x a
nd
g
eo
-typ
e
% o
f m
ale
ch
ild
ren
wh
o h
ave
no
t c
om
ple
ted
gra
de
7
%
15
,9
24
,5
19
,7
Ma
le c
hil
dre
n a
ge
d 1
5 w
ho
ha
ve
no
t c
om
ple
ted
gra
de 7
N
(‘0
00
) 4
4
54
98
All
ma
le c
hil
dre
n a
ge
d 1
5 y
ea
rs
N(‘
00
0)
27
4
22
1
49
5
% o
f fe
ma
le c
hil
dre
n a
ge
d 1
5 w
ho
ha
ve
no
t c
om
ple
ted
g
rad
e 7
%
9
,0
9,2
9
,1
Fe
ma
le c
hild
ren
ag
ed
15
wh
o h
ave
no
t co
mp
lete
d g
rad
e 7
N
(‘0
00
) 2
2
18
40
All
fe
ma
le c
hild
ren
ag
ed
15
ye
ars
N
(‘0
00
) 2
45
20
1
44
6
% o
f c
hil
dre
n a
ge
d 1
5 w
ho
ha
ve
no
t c
om
ple
ted
gra
de 7
%
1
2,6
1
7,2
1
4,7
Ch
ild
ren
ag
ed
15
wh
o h
ave
no
t c
om
ple
ted
gra
de 7
N
(‘0
00
) 6
6
73
13
8
Ch
ild
ren
ag
ed
15
ye
ars
N
(‘0
00
) 5
19
42
3
94
2
So
urc
e:
GH
S 2
016
Tab
le 1
.6.8
: P
erc
en
tag
e o
f ch
ild
ren
ag
ed
17 y
ears
wh
o h
av
e n
ot
co
mp
lete
d g
rad
e 9
, 20
16
Se
x a
nd
p
rovin
ce
WC
E
C
NC
F
S
KZ
N
NW
G
P
MP
L
P
RS
A
%
of
ma
le c
hil
dre
n a
ged
17
wh
o h
ave
no
t c
om
ple
ted
g
rad
e 9
%
1
9,3
4
2,1
3
3,0
2
4,3
2
8,2
2
7,2
1
1,5
3
2,0
2
9,2
2
6,4
Ma
le c
hil
dre
n a
ge
d 1
7 w
ho
ha
ve
no
t c
om
ple
ted
gra
de 9
N
(‘0
00
) 8
3
6
3
6
31
9
13
11
19
13
7
All
ma
le c
hil
dre
n a
ge
d 1
7 y
ea
rs
N(‘
00
0)
43
85
8
24
11
2
33
11
0
36
67
51
7
% o
f fe
ma
le c
hil
dre
n a
ge
d 1
7 w
ho
ha
ve
no
t c
om
ple
ted
g
rad
e 9
%
1
2,1
2
2,4
3
4,0
1
9,2
1
5,4
1
7,7
5
,3
20
,0
18
,6
15
,8
Fe
ma
le c
hild
ren
ag
ed
17w
ho
ha
ve
no
t c
om
ple
ted
gra
de
9
N
(‘0
00
) 5
1
7
3
6
16
6
5
9
11
79
All
fe
ma
le c
hild
ren
ag
ed
17
ye
ars
N
(‘0
00
) 4
3
75
10
30
10
4
34
97
45
61
49
8
% o
f c
hil
dre
n a
ge
d 1
7 w
ho
ha
ve
no
t c
om
ple
ted
gra
de 9
%
1
5,7
3
2,9
3
3,5
2
1,5
2
2,0
2
2,4
8
,6
25
,3
24
,2
21
,2
Ch
ild
ren
ag
ed
17
wh
o h
ave
no
t c
om
ple
ted
gra
de 9
N
(‘0
00
) 1
3
53
6
12
47
15
18
20
31
21
5
All
ch
ild
ren
ag
ed
17 y
ea
rs
N(‘
00
0)
85
16
0
18
55
21
5
67
20
7
81
12
7
1 0
15
U
rba
n
Ru
ral
RS
A
Se
x a
nd
g
eo
-ty
pe
%
of
ma
le c
hil
dre
n a
ged
17
wh
o h
ave
no
t c
om
ple
ted
g
rad
e 9
%
1
7,4
3
7,1
2
6,4
Ma
le c
hil
dre
n a
ge
d 1
7 w
ho
ha
ve
no
t c
om
ple
ted
gra
de 9
N
(‘0
00
) 4
9
88
13
7
All
ma
le c
hil
dre
n a
ge
d 1
7 y
ea
rs
N(‘
00
0)
28
1
23
6
51
7
% o
f fe
ma
le c
hil
dre
n a
ge
d 1
7 w
ho
ha
ve
no
t c
om
ple
ted
g
rad
e 9
%
1
0,4
2
2,7
1
5,8
Fe
ma
le c
hild
ren
ag
ed
17w
ho
ha
ve
no
t c
om
ple
ted
gra
de
9
N
(‘0
00
) 2
9
49
79
All
fe
ma
le c
hild
ren
ag
ed
17
ye
ars
N
(‘0
00
) 2
82
21
7
49
8
% o
f c
hil
dre
n a
ge
d 1
7 w
ho
ha
ve
no
t c
om
ple
ted
gra
de 9
%
1
3,9
3
0,2
2
1,2
Ch
ild
ren
ag
ed
17
wh
o h
ave
no
t c
om
ple
ted
gra
de 9
N
(‘0
00
) 7
8
13
7
21
5
All
ch
ild
ren
ag
ed
17 y
ea
rs
N(‘
00
0)
56
2
45
3
1 0
15
S
ou
rce:
GH
S 2
016

ST
AT
IST
ICS
SO
UT
H A
FR
ICA
24
Vul
nera
ble
Gro
ups
Indi
cato
r R
epor
t, 20
16 (
Rep
ort 0
3-19
-02(
2016
))
Tab
le 1
.6.9
: P
erc
en
tag
e o
f ch
ild
ren
liv
ing
mo
re t
ha
n 3
0 m
inu
tes
aw
ay f
rom
th
e n
eare
st
sch
oo
l, 2
016
D
isa
gg
reg
ati
on
W
C
EC
N
C
FS
K
ZN
N
W
GP
M
P
LP
R
SA
Se
x a
nd
p
rovin
ce
Ma
le
%
5,0
1
2,2
6
,0
7,6
2
1,2
1
0,9
7
,4
7,2
1
1,2
1
1,8
Ma
le c
hild
ren
liv
ing
le
ss th
an
30
min
s
aw
ay
25
10
0
7
18
26
4
37
72
33
75
63
2
Ma
le C
hil
dre
n (
Th
ou
sa
nd
s)
49
6
82
2
11
9
23
7
1 2
50
34
1
97
7
44
9
67
2
5 3
64
Fe
male
%
3,6
1
0,6
6
,2
5,2
1
8,8
1
2,5
7
,0
10
,0
9,7
1
0,8
Fe
male
ch
ildre
n liv
ing
less t
han
30m
ins
aw
ay
17
85
7
13
23
5
42
67
44
65
57
6
Fe
ma
le C
hil
dre
n (
Th
ou
sa
nd
s)
46
3
80
8
11
8
25
9
1 2
51
33
9
96
2
43
6
67
8
5 3
13
Bo
th
%
4,3
1
1,4
6
,1
6,3
2
0,0
1
1,7
7
,2
8,6
1
0,4
1
1,3
Ch
ild
ren
liv
ing
le
ss
th
an
30m
ins
aw
ay
41
18
6
15
31
49
9
79
13
9
76
14
1
12
08
Ch
ild
ren
(T
ho
us
an
ds
) 9
59
1 6
30
23
7
49
6
2 5
01
68
0
1 9
40
88
5
1 3
50
10
678
Se
x a
nd
g
eo
-typ
e
Urb
an
R
ura
l R
SA
Ma
le
% s
ha
re
6,5
1
7,7
1
1,8
Ma
le c
hild
ren
liv
ing
le
ss th
an
30
min
s
aw
ay
18
1
45
1
63
2
Ma
le C
hil
dre
n (
Th
ou
sa
nd
s)
2 8
09
2 5
55
5 3
64
Fe
male
% s
ha
re
5,9
1
6,7
1
0,8
Fe
male
ch
ildre
n liv
ing
less t
han
30m
ins
aw
ay
16
8
40
8
57
6
Fe
ma
le C
hil
dre
n (
Th
ou
sa
nd
s)
2 8
68
2 4
45
5 3
13
Bo
th
% s
ha
re
6,2
1
7,2
1
1,3
Ch
ildre
n liv
ing
le
ss t
ha
n 3
0m
ins a
wa
y
34
9
85
9
1 2
08
Ch
ild
ren
(T
ho
us
an
ds
) c
hil
dre
n3
33
33
333
33
33
333
333
33
333
333
33
33
33
333
33
33
333
33
33
333
33
33
33
Ch
ild
ren
(T
ho
us
an
ds
)
5 6
77
5 0
01
10
678
S
ou
rce:
GH
S 2
016
*Tota
ls e
xclu
de u
nspecifie
d/n
one a
pplic
able
cases
Tab
le 1
.6.1
0:
Pe
rcen
tag
e d
istr
ibu
tio
n o
f re
aso
ns
fo
r ch
ild
ren
ag
ed
7-1
7 y
ears
wh
o a
re n
ot
att
en
din
g s
ch
oo
l 201
6
W
C
EC
N
C
FS
K
ZN
N
W
GP
M
P
LP
R
SA
T
oo
old
/yo
ung
2,2
1
,6
7,8
0
,0
2,1
0
,0
4,4
0
,0
0,0
2
,1
Has c
om
ple
ted
scho
ol/e
duca
tio
n
16
,3
12
,3
2,4
0
,0
5,4
3
,9
15
,8
3,2
0
,0
8,9
T
ran
sp
ort
difficultie
s
0,0
2
,5
0,0
0
,0
1,5
0
,0
0,0
0
,0
0,0
0
,7
No m
one
y f
or
fee
s
8,4
5
,9
16
,1
10
,1
17
,8
9,1
1
5,8
3
,3
13
,1
11
,4
Work
ing
, d
o n
ot
ha
ve
tim
e
2,1
0
,0
0,0
3
,4
2,3
2
,7
13
,3
0,0
0
,0
3,5
F
am
ily c
om
mitm
en
ts
4,6
1
3,3
5
,3
0,0
7
,3
5,3
3
,5
12
,9
5,4
6
,9
Ed
uca
tio
n n
ot u
se
ful
15
,7
12
,8
8,4
3
2,6
6
,1
5,7
0
,0
0,0
0
,0
8,5
P
oo
r aca
dem
ic p
erf
orm
ance
1
2,2
2
3,7
1
6,4
3
0,1
2
6,3
3
9,9
1
0,9
2
6,8
1
5,6
2
2,1
Illn
ess
0,0
6
,0
9,2
2
,3
4,8
2
,5
0,0
3
,2
11
,2
3,5
D
isa
bili
ty
17
,1
17
,6
12
,1
11
,2
9,6
6
,2
8,8
5
,0
33
,6
12
,5
Pre
gn
ancy
1,8
0
,0
2,3
1
0,3
4
,3
1,8
1
,0
15
,1
5,4
3
,4
Oth
er
19
,7
4,5
1
9,9
0
,0
12
,5
23
,1
26
,5
30
,5
15
,8
16
,6
Pe
r c
en
t
10
0,0
1
00
,0
10
0,0
1
00
,0
10
0,0
1
00
,0
10
0,0
1
00
,0
10
0,0
1
00
,0
To
tal
(Th
ou
san
ds
) 4
3
53
12
18
62
33
52
20
14
30
5
So
urc
e:
GH
S 2
016

ST
AT
IST
ICS
SO
UT
H A
FR
ICA
25
Vul
nera
ble
Gro
ups
Indi
cato
r R
epor
t, 20
16 (
Rep
ort 0
3-19
-02(
2016
))
Tab
le 1
.6.1
0:
Pe
rcen
tag
e d
istr
ibu
tio
n o
f re
aso
ns
fo
r ch
ild
ren
ag
ed
7-1
7 y
ears
wh
o a
re n
ot
att
en
din
g s
ch
oo
l 201
6 (
co
nt.
)
Urb
an
R
ura
l R
SA
To
o o
ld/y
ou
ng
3
,1
0,7
2
,1
Has
co
mp
lete
d s
ch
oo
l/ed
uca
tio
n
10
,2
7,1
8
,9
Tra
ns
po
rt d
iffi
cu
ltie
s
0,5
1
,0
0,7
No
mo
ne
y f
or
fee
s
14
,3
7,5
1
1,4
Wo
rkin
g, d
o n
ot
ha
ve
tim
e
5,2
1
,2
3,5
Fa
mil
y c
om
mit
me
nts
3
,8
11
,2
6,9
Ed
uc
ati
on
no
t u
se
ful
8,3
8
,7
8,5
Po
or
ac
ad
em
ic p
erf
orm
an
ce
2
1,3
2
3,3
2
2,1
Illn
ess
2,4
5
,0
3,5
Dis
ab
ilit
y
9,0
1
7,5
1
2,5
Pre
gn
an
cy
2,9
4
,2
3,4
Oth
er
19
,2
12
,8
16
,6
Pe
r c
en
t
10
0,0
1
00
,0
10
0,0
To
tal
(Th
ou
san
ds
) 1
78
12
7
30
5
So
urc
e:
GH
S 2
016
Tab
le 1
.6.1
1:
Exp
eri
en
ce o
f v
iole
nce/
pu
nis
hm
en
t/ a
bu
se a
t sch
oo
l b
y l
ea
rne
rs a
ged
5 y
ea
rs a
nd
ab
ov
e a
tten
din
g s
ch
oo
l, 2
016
As
a %
of
all
le
arn
ers
As
a %
of
lea
ne
rs
tha
t h
ave
e
xp
eri
en
ce
d
vio
len
ce
etc
.
Le
arn
ers
th
at
ex
pe
rie
nc
ed
vio
len
ce
/pu
nis
hm
en
t/
ab
us
e a
t s
ch
oo
l
Ex
pe
rie
nce
d s
om
e f
orm
of
vio
len
ce
, p
un
ish
me
nt,
or
ve
rba
l a
bu
se
Typ
e o
f vio
lence
e
xp
eri
en
ce
d
Corp
ora
l p
unis
hm
en
t b
y t
ea
che
r 9
,5
86
,5
13
86
Ph
ysic
al vio
len
ce
by t
ea
che
r 0
,5
4,1
6
5
Ve
rba
l a
buse
(be
ing
insulte
d, te
ased
or
ha
rassed
) b
y
tea
ch
er
0,7
6
,3
10
0
Ve
rba
l a
buse
(be
ing
insulte
d, te
ased
or
ha
rassed
) b
y
oth
er
lea
rne
rs
1,1
9
,9
15
9
Ph
ysic
al a
bu
se
(b
ein
g h
it o
r pu
nche
d)
by a
no
the
r le
arn
er
0,9
8
,1
12
9
Oth
er
0,1
1
,1
18
Ch
ild
ren
(th
ou
sa
nd
s)*
1
45
53
16
03
S
ou
rce:
GH
S 2
016
* T
ota
ls e
xclu
de u
nspecifie
d c
ases
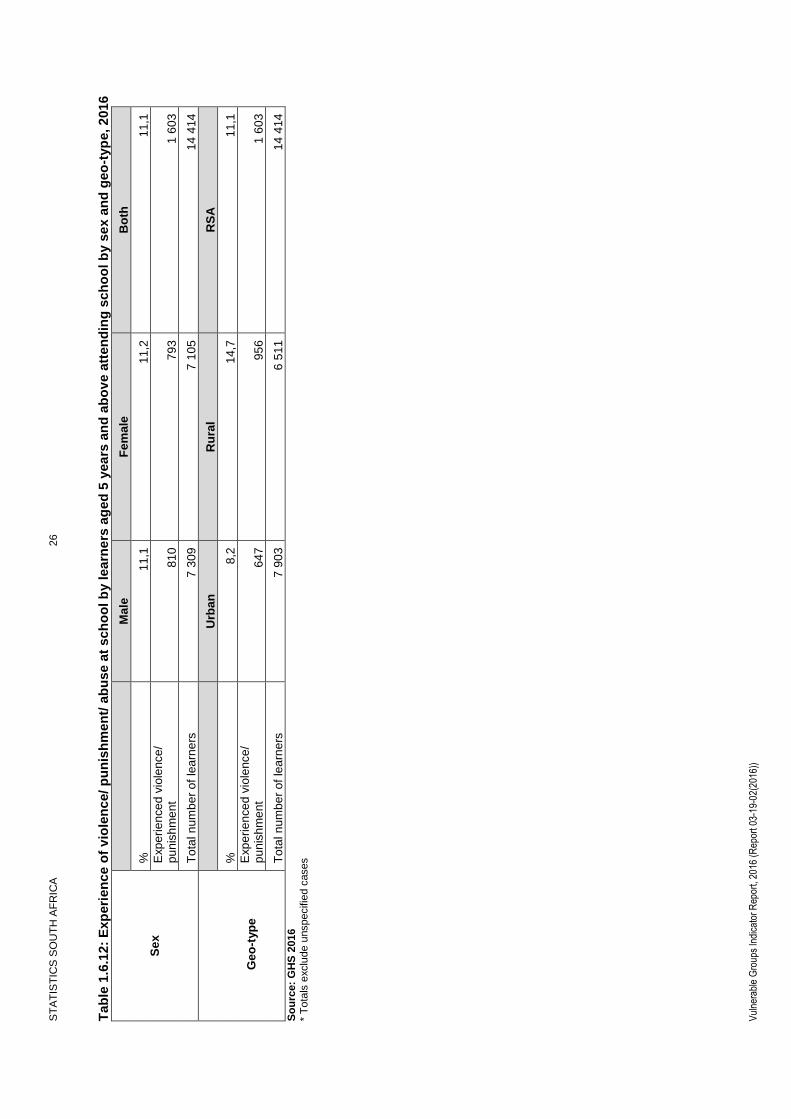
ST
AT
IST
ICS
SO
UT
H A
FR
ICA
26
Vul
nera
ble
Gro
ups
Indi
cato
r R
epor
t, 20
16 (
Rep
ort 0
3-19
-02(
2016
))
Tab
le 1
.6.1
2:
Exp
eri
en
ce o
f v
iole
nce/
pu
nis
hm
en
t/ a
bu
se a
t sch
oo
l b
y l
ea
rne
rs a
ged
5 y
ea
rs a
nd
ab
ov
e a
tten
din
g s
ch
oo
l b
y s
ex
an
d g
eo
-typ
e, 2
016
Se
x
M
ale
F
em
ale
B
oth
%
11
,1
11
,2
11
,1
Exp
eri
en
ce
d v
iole
nce
/ p
un
ish
me
nt
81
0
79
3
1 6
03
To
tal n
um
be
r o
f le
arn
ers
7
30
9
7 1
05
14
414
Urb
an
R
ura
l R
SA
Ge
o-t
yp
e
%
8,2
1
4,7
1
1,1
Exp
eri
en
ce
d v
iole
nce
/ p
un
ish
me
nt
64
7
95
6
1 6
03
To
tal n
um
be
r o
f le
arn
ers
7
90
3
6 5
11
14
414
So
urc
e:
GH
S 2
016
* T
ota
ls e
xclu
de u
nspecifie
d c
ases

ST
AT
IST
ICS
SO
UT
H A
FR
ICA
27
Vul
nera
ble
Gro
ups
Indi
cato
r R
epor
t, 20
16 (
Rep
ort 0
3-19
-02(
2016
))
1.7
Ch
ild
ren
: H
ou
sin
g a
nd
basic
serv
ices
T
ab
le 1
.7.1
: P
erc
en
tag
e d
istr
ibu
tio
n o
f ch
ild
-head
ed
ho
useh
old
s b
y t
yp
e o
f h
ou
sin
g,
201
6
Typ
e o
f h
ou
sin
g
an
d s
ex
of
the
h
ou
se
ho
ld h
ea
d
F
orm
al
Tra
dit
ion
al
Info
rma
l O
the
r T
ota
l
%
N(‘
00
0)
Ma
le
74
,6
13
,9
11
,5
0,0
1
00
,0
30
Fe
ma
le
95
,9
0,0
4
,1
0,0
1
00
,0
19
Bo
th
82
,9
8,4
8
,6
0,0
1
00
,0
49
Typ
e o
f h
ou
sin
g
an
d g
eo
-typ
e
F
orm
al
Tra
dit
ion
al
Info
rma
l O
the
r T
ota
l
%
N(‘
00
0)
Urb
an
7
2,8
4
,0
23
,3
0,0
1
00
,0
18
Ru
ral
88
,9
11
,1
0,0
0
,0
10
0,0
3
1
RS
A
82
,9
8,4
8
,6
0,0
1
00
,0
49
So
urc
e:
GH
S 2
016
Tab
le 1
.7.2
: P
erc
en
tag
e d
istr
ibu
tio
n o
f ch
ild
ren
by t
yp
e o
f h
ou
sin
g,
20
16
Typ
e o
f h
ou
sin
g
an
d s
ex
F
orm
al
Tra
dit
ion
al
Info
rma
l O
the
r T
ota
l
%
N(‘
00
0)
Ma
le
81
,2
10
,4
7,9
0
,5
10
0,0
9
34
8
Fe
ma
le
81
,3
10
,3
7,9
0
,5
10
0,0
9
21
8
Bo
th
81
,2
10
,3
7,9
0
,5
10
0,0
1
8 5
66
Typ
e o
f h
ou
sin
g
an
d g
eo
-typ
e
Urb
an
8
6,7
1
,1
11
,4
0,9
1
00
,0
10
534
Ru
ral
74
,1
22
,4
3,4
0
,1
10
0,0
8
03
2
RS
A
81
,2
10
,3
7,9
0
,5
10
0,0
1
8 5
66
So
urc
e:
GH
S 2
016
*Tota
ls e
xclu
de u
nspecifie
d c
ases.
Tab
le 1
.7.3
: L
ivin
g c
on
dit
ion
in
dic
ato
rs o
f ch
ild
ren
co
mp
are
d t
o t
ho
se o
f th
e o
vera
ll p
op
ula
tio
n,
2016
Ac
ce
ss
to
se
rvic
e in
dic
ato
r
Ac
ce
ss
to
wa
ter
Sa
nit
ati
on
R
efu
sa
l w
as
te
Ele
ctr
icit
y
So
lid
fu
els
fo
r co
ok
ing
%
%
%
%
%
Ch
ild
ren
wit
h
ac
ce
ss
65
,5
82
,2
56
,4
89
,9
17
,0
Po
pu
lati
on
7
1,2
8
3,8
6
3,2
8
9,1
1
3,2
S
ou
rce:
GH
S 2
016

ST
AT
IST
ICS
SO
UT
H A
FR
ICA
28
Vul
nera
ble
Gro
ups
Indi
cato
r R
epor
t, 20
16 (
Rep
ort 0
3-19
-02(
2016
))
1.8
Ch
ild
ren
: V
iole
nc
e a
nd
cri
me
vic
tim
s
Tab
le 1
.8.1
: P
erc
en
tag
e o
f ch
ild
ren
liv
ing
in
ho
use
ho
lds w
here
th
e h
ou
seh
old
s f
eel u
ns
afe
or
very
un
safe
to
walk
alo
ne i
n t
he
ir a
rea d
uri
ng
th
e
da
y,
2015/1
6
Dis
ag
gre
gati
on
WC
E
C
NC
F
S
KZ
N
NW
G
P
MP
L
P
RS
A
Pro
vin
ce
% s
ha
re
70
,7
85
,5
86
,0
91
,1
85
,0
86
,6
77
,1
90
,0
94
,9
84
,1
Child
ren
(t
ho
usa
nds)*
1
30
0
2 4
34
35
0
86
2
3 7
67
1 1
53
2 9
81
1 3
92
2 1
23
1 6
361
% s
ha
re
71
,6
85
,7
87
,6
90
,6
84
,4
87
,0
77
,5
89
,6
95
,3
83
,6
Po
pu
lati
on
(t
ho
us
an
ds
)*
4 3
77
5 8
89
1 0
32
2 6
01
9 1
56
3 3
02
10
383
3 7
78
5 3
59
45
876
Se
x
M
ale
F
em
ale
R
SA
% s
ha
re
84
,2
84
,0
84
,1
Child
ren
(t
ho
usa
nds)*
8
27
6
80
85
16
36
1
% s
ha
re
83
,8
83
,4
83
,6
Po
pu
lati
on
(t
ho
us
an
ds
)*
22
11
6
23
76
0
45
87
6
So
urc
e:
VO
CS
2015/1
6
*To
tals
exclu
de u
nspecifie
d c
ases
Tab
le 1
.8.2
: P
erc
en
tag
e o
f ch
ild
ren
liv
ing
in
ho
use
ho
lds w
here
th
e h
ou
seh
old
s f
eel u
ns
afe
or
very
un
safe
to
walk
alo
ne i
n t
he
ir a
rea a
t n
igh
t,
2015
/16
D
isa
gg
reg
ati
on
WC
E
C
NC
F
S
KZ
N
NW
G
P
MP
L
P
RS
A
Pro
vin
ce
% s
ha
re
32
,1
28
,4
24
,4
18
,6
35
,1
27
,5
22
,9
26
,0
52
,8
31
,2
Child
ren
(t
ho
usa
nds)*
5
90
81
0
99
17
6
1 5
52
36
6
88
3
40
4
1 1
85
6 0
65
% s
ha
re
31
,4
27
,1
28
,2
19
,0
35
,2
28
,4
24
,3
28
,2
52
,6
30
,9
Po
pu
lati
on
(t
ho
us
an
ds
)*
1 9
14
1 8
60
33
2
54
5
3 8
08
1 0
76
3 2
43
1 1
95
2 9
55
16
930
Se
x
M
ale
F
em
ale
R
SA
% s
ha
re
31
,0
31
,3
31
,2
Child
ren
(t
ho
usa
nds)*
3
04
9
3 0
16
6 0
65
% s
ha
re
31
,2
30
,5
30
,9
Po
pu
lati
on
(t
ho
us
an
ds
)*
8 2
38
8 6
92
16
930
So
urc
e:
VO
CS
2015/1
6
*Tota
ls e
xclu
de u
nspecifie
d c
ases

ST
AT
IST
ICS
SO
UT
H A
FR
ICA
29
Vul
nera
ble
Gro
ups
Indi
cato
r R
epor
t, 20
16 (
Rep
ort 0
3-19
-02(
2016
))
Tab
le 1
.8.3
: P
erc
en
tag
e o
f ch
ild
ren
wh
o liv
e in
ho
useh
old
s w
here
th
e f
ear
of
cri
me p
rev
en
ts t
hem
fro
m g
oin
g t
o o
pen
sp
ac
es o
r p
ark
s in
th
eir
are
a,
2015
/16
D
isa
gg
reg
ati
on
WC
E
C
NC
F
S
KZ
N
NW
G
P
MP
L
P
RS
A
Pro
vin
ce
% s
ha
re
48
,9
42
,5
60
,6
33
,0
20
,8
22
,7
44
,5
35
,8
13
,1
33
,1
Child
ren
(t
ho
usa
nds)*
8
61
1 1
98
24
3
30
6
90
7
30
0
1 6
55
54
2
29
1
6 3
01
% s
ha
re
47
,7
44
,4
56
,7
32
,7
21
,8
22
,7
41
,2
33
,4
13
,2
33
,5
Po
pu
lati
on
(t
ho
us
an
ds
)*
2 7
64
3 0
05
65
5
91
9
2 3
22
84
7
5 3
29
1 3
82
73
2
17
956
Se
x
M
ale
F
em
ale
R
SA
% s
ha
re
33
,4
32
,8
33
,1
Child
ren
(t
ho
usa
nds)*
3
21
2
3 0
90
6 3
01
% s
ha
re
32
,5
34
,5
33
,5
Po
pu
lati
on
(t
ho
us
an
ds
)*
8 3
71
9 5
85
17
956
So
urc
e:
VO
CS
2015/1
6
*Tota
ls e
xclu
de u
nspecifie
d c
ases

ST
AT
IST
ICS
SO
UT
H A
FR
ICA
30
Vul
nera
ble
Gro
ups
Indi
cato
r, 2
016
(Rep
ort 0
3-19
-02)
IND
ICA
TO
RS
: Y
OU
TH
T
he y
outh
are
define
d a
s p
eop
le a
ged
betw
ee
n 1
5-3
4 y
ears
2.1
Dem
og
rap
hy o
f yo
uth
T
ab
le 2
.1.1
: D
istr
ibu
tio
n o
f yo
uth
, 2
016
D
isa
gg
reg
ati
on
W
C
EC
N
C
FS
K
ZN
N
W
GP
M
P
LP
R
SA
Se
x a
nd
p
rovin
ce
Ma
le
N(‘
00
0)
1
05
4
1 2
34
21
1
51
2
1 9
81
68
0
2 4
66
80
9
1 1
30
10
078
%
49
,3
49
,7
50
,5
49
,6
49
,8
51
,1
52
,2
49
,6
51
,0
50
,5
Fe
male
N
(‘0
00
)
1 0
85
1 2
49
20
7
52
1
1 9
96
65
1
2 2
63
82
4
1 0
84
9 8
81
%
50
,7
50
,3
49
,6
50
,4
50
,2
48
,9
47
,9
50
,4
49
,0
49
,5
Bo
th
N(‘
00
0)
2
13
9
2 4
83
41
8
1 0
33
3 9
78
1 3
32
4 7
29
1 6
33
2 2
13
19
958
%
10
0,0
1
00
,0
10
0,0
1
00
,0
10
0,0
1
00
,0
10
0,0
1
00
,0
10
0,0
1
00
,0
Se
x a
nd
Ge
o-
typ
e
Urb
an
R
ura
l R
SA
Ma
le
N(‘
00
0)
6
38
2
3 6
96
10
078
%
50
,4
50
,7
50
,5
Fe
male
N
(‘0
00
)
6 2
89
3 5
91
9 8
81
%
49
,6
49
,3
49
,5
Bo
th
N(‘
00
0)
1
2 6
72
7 2
87
19
958
%
10
0,0
1
00
,0
10
0,0
Se
x a
nd
p
op
ula
tio
n
gro
up
Bla
ck
Afr
ica
n
Co
lou
red
In
dia
n/
As
ian
W
hit
e
RS
A
Ma
le
N(‘
00
0)
8
43
0
82
3
23
3
59
2
10
078
%
50
,5
49
,9
51
,8
50
,6
50
,5
Fe
male
N
(‘0
00
)
8 2
60
82
7
21
7
57
8
9 8
81
%
49
,5
50
,1
48
,2
49
,4
49
,5
Bo
th
N(‘
00
0)
1
6 6
90
1 6
49
45
0
1 1
69
19
958
%
10
0,0
1
00
,0
10
0,0
1
00
,0
10
0,0
Se
x a
nd
ag
e
gro
up
15
-24
25
-34
RS
A
Ma
le
N(‘
00
0)
5
17
4
4 9
03
10
078
%
50
,2
50
,8
50
,5
Fe
male
N
(‘0
00
)
5 1
37
4 7
43
9 8
81
%
49
,8
49
,2
49
,5
Bo
th
N(‘
00
0)
1
0 3
12
10
313
19
958
%
10
0,0
1
00
,0
10
0,0
So
urc
e:
GH
S 2
016
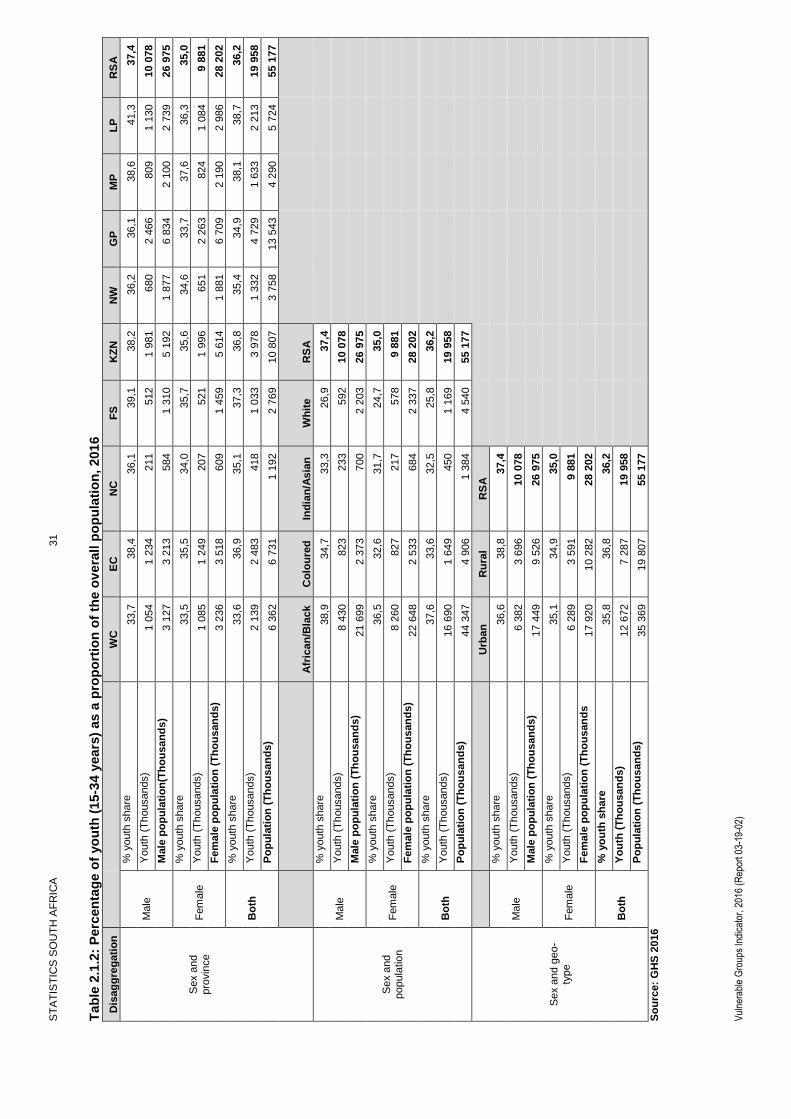
ST
AT
IST
ICS
SO
UT
H A
FR
ICA
31
Vul
nera
ble
Gro
ups
Indi
cato
r, 2
016
(Rep
ort 0
3-19
-02)
Tab
le 2
.1.2
: P
erc
en
tag
e o
f yo
uth
(15
-34 y
ears
) as
a p
rop
ort
ion
of
the o
vera
ll p
op
ula
tio
n,
201
6
Dis
ag
gre
gati
on
W
C
EC
N
C
FS
K
ZN
N
W
GP
M
P
LP
R
SA
Sex a
nd
pro
vin
ce
Male
% y
outh
share
33,7
38,4
36,1
39,1
38,2
36,2
36,1
38,6
41,3
37,4
Youth
(T
housands)
1 0
54
1 2
34
211
512
1 9
81
680
2 4
66
809
1 1
30
10 0
78
Male
po
pu
lati
on
(Th
ou
san
ds
) 3 1
27
3 2
13
584
1 3
10
5 1
92
1 8
77
6 8
34
2 1
00
2 7
39
26 9
75
Fem
ale
% y
outh
share
33,5
35,5
34,0
35,7
35,6
34,6
33,7
37,6
36,3
35,0
Youth
(T
housands)
1 0
85
1 2
49
207
521
1 9
96
651
2 2
63
824
1 0
84
9 8
81
Fe
male
po
pu
lati
on
(T
ho
us
an
ds
) 3 2
36
3 5
18
609
1 4
59
5 6
14
1 8
81
6 7
09
2 1
90
2 9
86
28 2
02
Bo
th
% y
outh
share
33,6
36,9
35,1
37,3
36,8
35,4
34,9
38,1
38,7
36,2
Youth
(T
housands)
2 1
39
2 4
83
418
1 0
33
3 9
78
1 3
32
4 7
29
1 6
33
2 2
13
19 9
58
Po
pu
lati
on
(T
ho
us
an
ds
) 6 3
62
6 7
31
1 1
92
2 7
69
10 8
07
3 7
58
13 5
43
4 2
90
5 7
24
55 1
77
Afr
ican
/Bla
ck
C
olo
ure
d
Ind
ian
/Asia
n
Wh
ite
RS
A
Sex a
nd
popula
tio
n
Male
% y
outh
share
38,9
34,7
33,3
26,9
37,4
Youth
(T
housands)
8 4
30
823
233
592
10 0
78
Male
po
pu
lati
on
(T
ho
us
an
ds
) 21 6
99
2 3
73
700
2 2
03
26 9
75
Fem
ale
% y
outh
share
36,5
32,6
31,7
24,7
35,0
Youth
(T
housands)
8 2
60
827
217
578
9 8
81
Fe
male
po
pu
lati
on
(T
ho
us
an
ds
) 22 6
48
2 5
33
684
2 3
37
28 2
02
Bo
th
% y
outh
share
37,6
33,6
32,5
25,8
36,2
Youth
(T
housands)
16 6
90
1 6
49
450
1 1
69
19 9
58
Po
pu
lati
on
(T
ho
us
an
ds
) 44 3
47
4 9
06
1 3
84
4 5
40
55 1
77
Sex a
nd g
eo
-ty
pe
Urb
an
R
ura
l R
SA
Male
% y
outh
share
36,6
38,8
37,4
Youth
(T
housands)
6 3
82
3 6
96
10 0
78
Male
po
pu
lati
on
(T
ho
us
an
ds
) 17 4
49
9 5
26
26 9
75
Fem
ale
% y
outh
share
35,1
34,9
35,0
Youth
(T
housands)
6 2
89
3 5
91
9 8
81
Fe
male
po
pu
lati
on
(T
ho
us
an
ds
17 9
20
10 2
82
28 2
02
Bo
th
% y
ou
th s
ha
re
35,8
36,8
36,2
Yo
uth
(T
ho
us
an
ds
) 12 6
72
7 2
87
19 9
58
Po
pu
lati
on
(T
ho
us
an
ds
) 35 3
69
19 8
07
55 1
77
So
urc
e:
GH
S 2
016
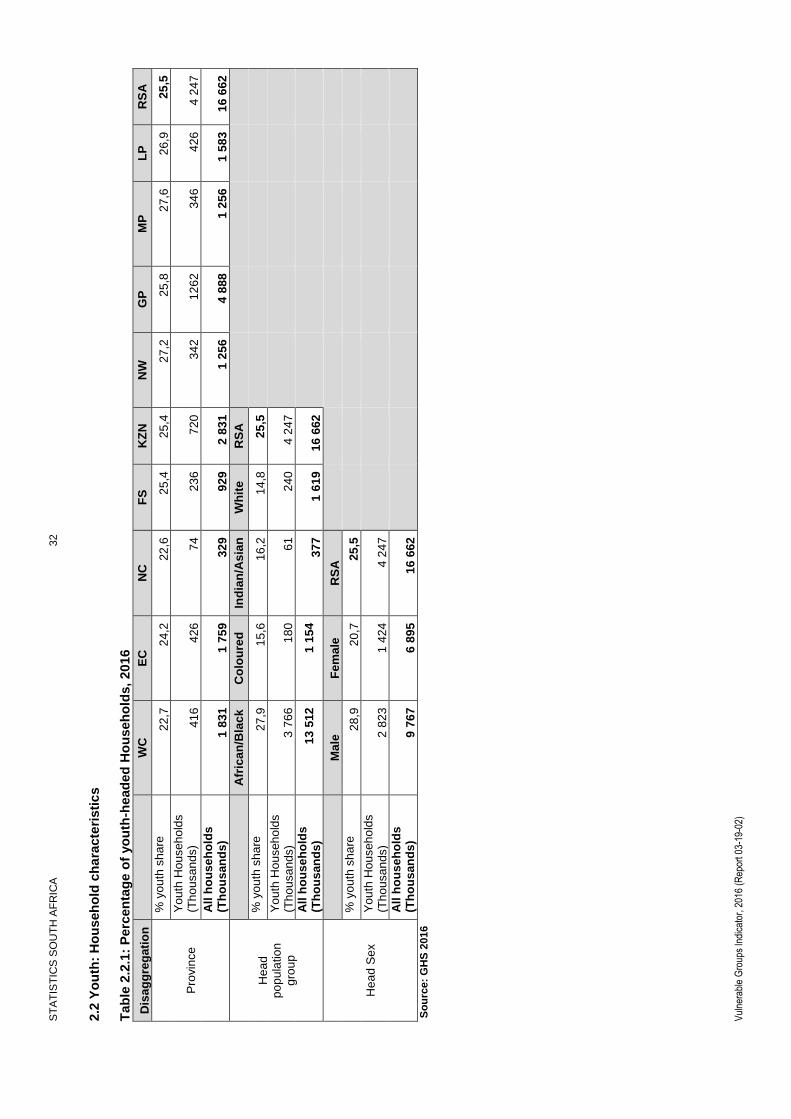
ST
AT
IST
ICS
SO
UT
H A
FR
ICA
32
Vul
nera
ble
Gro
ups
Indi
cato
r, 2
016
(Rep
ort 0
3-19
-02)
2.2
Yo
uth
: H
ou
seh
old
ch
ara
cte
risti
cs
T
ab
le 2
.2.1
: P
erc
en
tag
e o
f yo
uth
-head
ed
Ho
useh
old
s,
20
16
Dis
ag
gre
gati
on
WC
E
C
NC
F
S
KZ
N
NW
G
P
MP
L
P
RS
A
Pro
vin
ce
% y
ou
th s
ha
re
22
,7
24
,2
22
,6
25
,4
25
,4
27
,2
25
,8
27
,6
26
,9
25
,5
Yo
uth
Ho
useh
old
s
(Th
ou
sa
nds)
41
6
42
6
74
23
6
72
0
34
2
12
62
34
6
42
6
4 2
47
All
ho
us
eh
old
s
(Th
ou
san
ds
) 1
83
1
1 7
59
32
9
92
9
2 8
31
1 2
56
4 8
88
1 2
56
1 5
83
16
662
Hea
d
po
pu
latio
n
gro
up
A
fric
an
/Bla
ck
Co
lou
red
In
dia
n/A
sia
n
Wh
ite
RS
A
% y
ou
th s
ha
re
27
,9
15
,6
16
,2
14
,8
25
,5
Yo
uth
Ho
useh
old
s
(Th
ou
sa
nds)
3 7
66
18
0
61
24
0
4 2
47
All
ho
us
eh
old
s
(Th
ou
san
ds
) 1
3 5
12
1 1
54
37
7
1 6
19
16
662
Hea
d S
ex
M
ale
F
em
ale
R
SA
% y
ou
th s
ha
re
28
,9
20
,7
25
,5
Yo
uth
Ho
useh
old
s
(Th
ou
sa
nds)
2 8
23
1 4
24
4 2
47
All
ho
us
eh
old
s
(Th
ou
san
ds
) 9
76
7
6 8
95
16
662
S
ou
rce:
GH
S 2
016
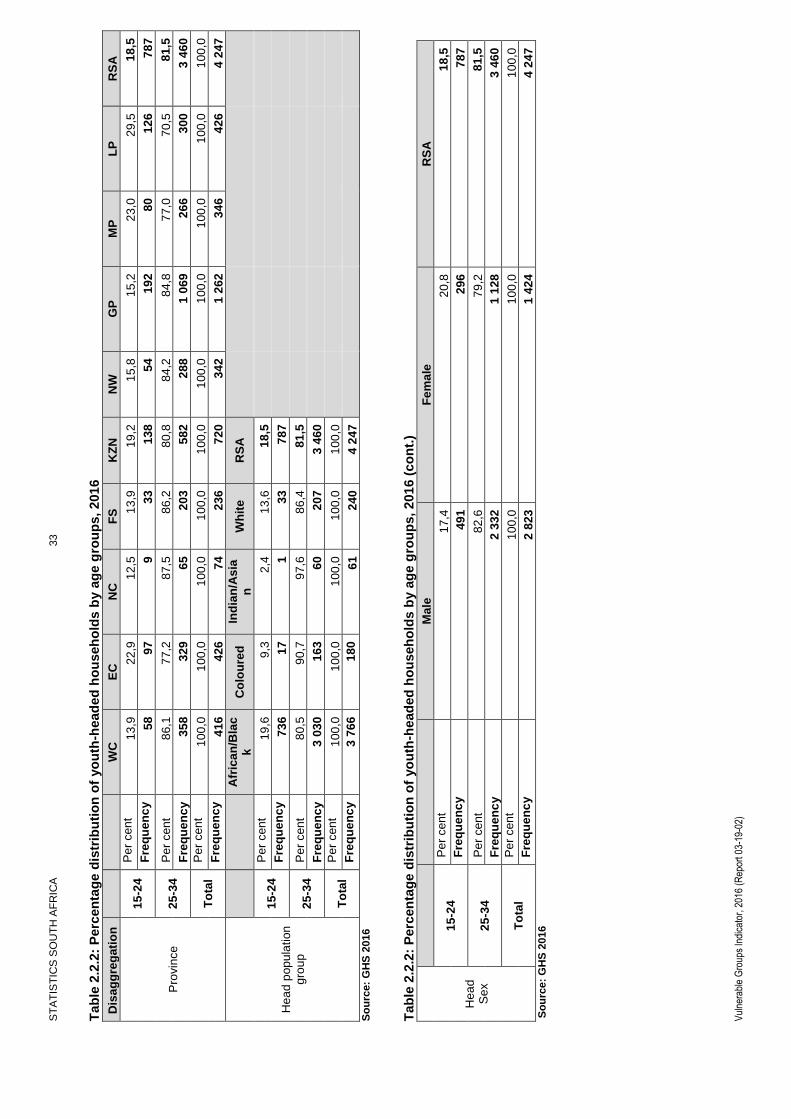
ST
AT
IST
ICS
SO
UT
H A
FR
ICA
33
Vul
nera
ble
Gro
ups
Indi
cato
r, 2
016
(Rep
ort 0
3-19
-02)
Tab
le 2
.2.2
: P
erc
en
tag
e d
istr
ibu
tio
n o
f yo
uth
-head
ed
ho
useh
old
s b
y a
ge g
rou
ps,
201
6
Dis
ag
gre
gati
on
W
C
EC
N
C
FS
K
ZN
N
W
GP
M
P
LP
R
SA
Pro
vin
ce
15
-24
Pe
r cen
t 1
3,9
2
2,9
1
2,5
1
3,9
1
9,2
1
5,8
1
5,2
2
3,0
2
9,5
1
8,5
Fre
qu
en
cy
58
97
9
33
13
8
54
19
2
80
12
6
78
7
25
-34
Pe
r cen
t 8
6,1
7
7,2
8
7,5
8
6,2
8
0,8
8
4,2
8
4,8
7
7,0
7
0,5
8
1,5
Fre
qu
en
cy
35
8
32
9
65
20
3
58
2
28
8
1 0
69
26
6
30
0
3 4
60
To
tal
Pe
r cen
t 1
00
,0
10
0,0
1
00
,0
10
0,0
1
00
,0
10
0,0
1
00
,0
10
0,0
1
00
,0
10
0,0
Fre
qu
en
cy
41
6
42
6
74
23
6
72
0
34
2
1 2
62
34
6
42
6
4 2
47
Hea
d p
op
ula
tion
g
rou
p
Afr
ica
n/B
lac
k
Co
lou
red
In
dia
n/A
sia
n
Wh
ite
RS
A
15
-24
Pe
r cen
t 1
9,6
9
,3
2,4
1
3,6
1
8,5
Fre
qu
en
cy
73
6
17
1
33
78
7
25
-34
Pe
r cen
t 8
0,5
9
0,7
9
7,6
8
6,4
8
1,5
Fre
qu
en
cy
3 0
30
16
3
60
20
7
3 4
60
To
tal
Pe
r cen
t 1
00
,0
10
0,0
1
00
,0
10
0,0
1
00
,0
Fre
qu
en
cy
3 7
66
18
0
61
24
0
4 2
47
S
ou
rce:
GH
S 2
016
Tab
le 2
.2.2
: P
erc
en
tag
e d
istr
ibu
tio
n o
f yo
uth
-head
ed
ho
useh
old
s b
y a
ge g
rou
ps,
201
6 (
co
nt.
)
Hea
d
Se
x
Ma
le
Fe
ma
le
RS
A
15
-24
Pe
r cen
t 1
7,4
2
0,8
1
8,5
Fre
qu
en
cy
49
1
29
6
78
7
25
-34
Pe
r cen
t 8
2,6
7
9,2
8
1,5
Fre
qu
en
cy
2 3
32
1 1
28
3 4
60
To
tal
Pe
r cen
t 1
00
,0
10
0,0
1
00
,0
Fre
qu
en
cy
2 8
23
1 4
24
4 2
47
So
urc
e:
GH
S 2
016
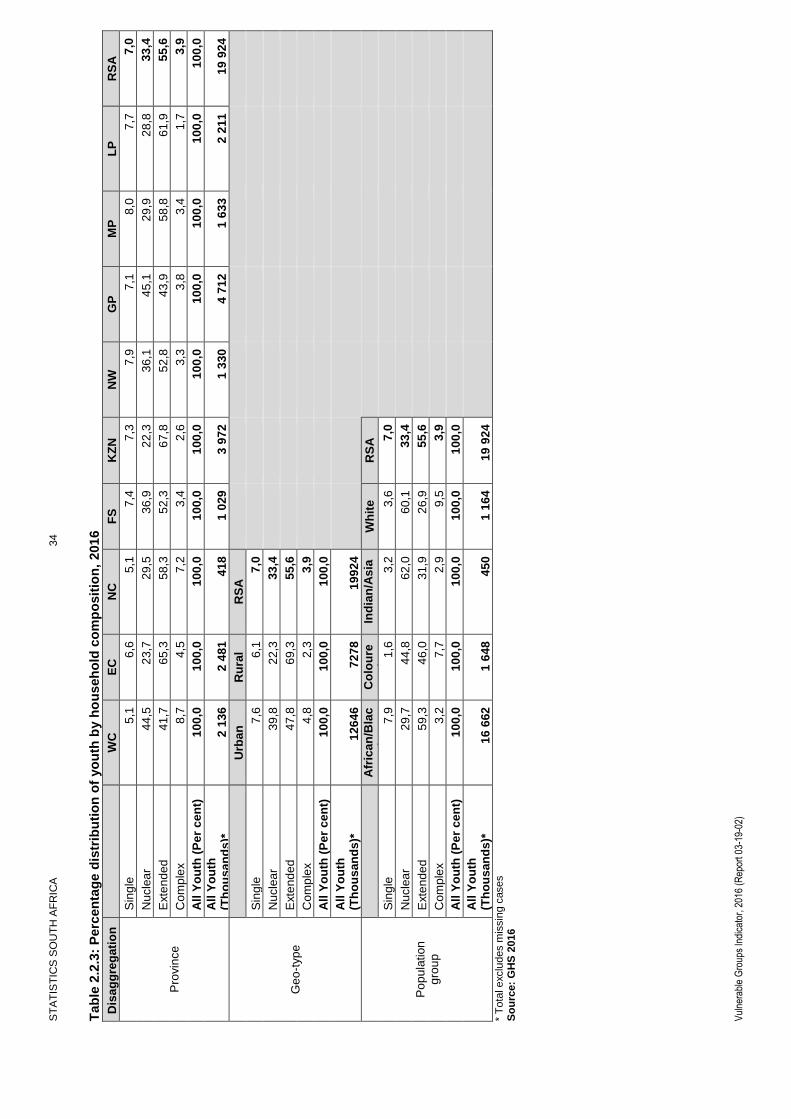
ST
AT
IST
ICS
SO
UT
H A
FR
ICA
34
Vul
nera
ble
Gro
ups
Indi
cato
r, 2
016
(Rep
ort 0
3-19
-02)
Tab
le 2
.2.3
: P
erc
en
tag
e d
istr
ibu
tio
n o
f yo
uth
by h
ou
seh
old
co
mp
osit
ion
, 201
6
Dis
ag
gre
gati
on
WC
E
C
NC
F
S
KZ
N
NW
G
P
MP
L
P
RS
A
Pro
vin
ce
Sin
gle
5
,1
6,6
5
,1
7,4
7
,3
7,9
7
,1
8,0
7
,7
7,0
Nucle
ar
44
,5
23
,7
29
,5
36
,9
22
,3
36
,1
45
,1
29
,9
28
,8
33
,4
Exte
nd
ed
41
,7
65
,3
58
,3
52
,3
67
,8
52
,8
43
,9
58
,8
61
,9
55
,6
Com
ple
x
8,7
4
,5
7,2
3
,4
2,6
3
,3
3,8
3
,4
1,7
3
,9
All
Yo
uth
(P
er
ce
nt)
1
00
,0
10
0,0
1
00
,0
10
0,0
1
00
,0
10
0,0
1
00
,0
10
0,0
1
00
,0
10
0,0
All
Yo
uth
(T
ho
us
an
ds
)*
2 1
36
2 4
81
41
8
1 0
29
3 9
72
1 3
30
4 7
12
1 6
33
2 2
11
19
924
Ge
o-t
yp
e
U
rba
n
Ru
ral
RS
A
Sin
gle
7
,6
6,1
7
,0
Nucle
ar
39
,8
22
,3
33
,4
Exte
nd
ed
47
,8
69
,3
55
,6
Com
ple
x
4,8
2
,3
3,9
All
Yo
uth
(P
er
ce
nt)
1
00
,0
10
0,0
1
00
,0
All
Yo
uth
(T
ho
us
an
ds
)*
12
64
6
72
78
19
92
4
Po
pu
lation
g
rou
p
A
fric
an
/Bla
ck
C
olo
ure
d
Ind
ian
/As
ian
W
hit
e
RS
A
Sin
gle
7
,9
1,6
3
,2
3,6
7
,0
Nucle
ar
29
,7
44
,8
62
,0
60
,1
33
,4
Exte
nd
ed
59
,3
46
,0
31
,9
26
,9
55
,6
Com
ple
x
3,2
7
,7
2,9
9
,5
3,9
All
Yo
uth
(P
er
ce
nt)
1
00
,0
10
0,0
1
00
,0
10
0,0
1
00
,0
All
Yo
uth
(T
ho
us
an
ds
)*
16
662
1 6
48
45
0
1 1
64
19
924
*
To
tal exclu
des m
issin
g c
ases
So
urc
e:
GH
S 2
016

ST
AT
IST
ICS
SO
UT
H A
FR
ICA
35
Vul
nera
ble
Gro
ups
Indi
cato
r, 2
016
(Rep
ort 0
3-19
-02)
Tab
le 2
.2.3
: P
erc
en
tag
e d
istr
ibu
tio
n o
f yo
uth
by h
ou
seh
old
co
mp
osit
ion
, 201
6 (
co
nt.
)
Ag
e g
rou
p
1
5-2
4
25
-34
R
SA
Sin
gle
3
,2
11
,1
7,0
Nucle
ar
31
,8
35
,2
33
,4
Exte
nd
ed
61
,0
50
,0
55
,6
Com
ple
x
4,0
3
,8
3,9
All
Yo
uth
(P
er
ce
nt)
1
00
,0
10
0,0
1
00
,0
All
Yo
uth
(T
ho
us
an
ds
)*
10
292
9 6
32
19
924
Se
x
M
ale
F
em
ale
R
SA
Sin
gle
1
0,3
3
,7
7,0
Nucle
ar
32
,0
34
,9
33
,4
Exte
nd
ed
53
,6
57
,8
55
,6
Com
ple
x
4,2
3
,7
3,9
All
Yo
uth
(P
er
ce
nt)
1
00
,0
10
0,0
1
00
,0
All
Yo
uth
(T
ho
us
an
ds
)*
10
060
9 8
64
19
924
* T
ota
l exclu
des m
issin
g c
ases
So
urc
e:
GH
S 2
016
Tab
le 2
.2.4
: P
erc
en
tag
e d
istr
ibu
tio
n o
f yo
uth
head
ed
ho
useh
old
s a
cro
ss in
terg
en
era
tio
nal h
ou
seh
old
typ
e,
2016
D
isa
gg
reg
ati
on
WC
E
C
NC
F
S
KZ
N
NW
G
P
MP
L
P
RS
A
Pro
vin
ce
Sin
gle
gen
era
tio
n
22
,8
14
,7
17
,2
13
,8
17
,0
19
,4
22
,2
19
,6
19
,2
19
,3
Dou
ble
ge
ne
ratio
n
38
,6
34
,6
45
,0
43
,2
28
,0
36
,1
35
,1
34
,6
32
,9
34
,6
Tri
ple
ge
ne
ratio
n
0,1
0
,4
0,0
0
,7
0,3
0
,8
0,4
0
,2
0,7
0
,4
Skip
ge
ne
ration
0,1
0
,4
0,9
0
,8
0,5
1
,1
0,6
0
,6
0,6
0
,6
Oth
er
38
,3
49
,9
36
,9
41
,5
54
,2
42
,7
41
,7
45
,0
46
,6
45
,1
All
Yo
uth
-he
ad
ed
H
Hs
(Pe
r c
en
t)
10
0,0
1
00
,0
10
0,0
1
00
,0
10
0,0
1
00
,0
10
0,0
1
00
,0
10
0,0
1
00
,0
All
Yo
uth
-he
ad
ed
HH
s
(Th
ou
san
ds
)*
41
6
42
6
74
23
6
71
9
34
2
1 2
60
34
6
42
5
4 2
43
Ge
o-t
yp
e
U
rba
n
Ru
ral
RS
A
Sin
gle
gen
era
tio
n
20
,6
16
,0
19
,3
Dou
ble
ge
ne
ratio
n
33
,9
36
,6
34
,6
Tri
ple
ge
ne
ratio
n
0,4
0
,6
0,4
Skip
ge
ne
ration
0,5
0
,6
0,6
Oth
er
44
,6
46
,3
45
,1
All
Yo
uth
-he
ad
ed
H
Hs
(Pe
r c
en
t)
10
0,0
1
00
,0
10
0,0
All
Yo
uth
-he
ad
ed
HH
s
(Th
ou
san
ds
)*
3 0
61
1 1
82
4 2
43
S
ou
rce:
GH
S 2
016

ST
AT
IST
ICS
SO
UT
H A
FR
ICA
36
Vul
nera
ble
Gro
ups
Indi
cato
r, 2
016
(Rep
ort 0
3-19
-02)
Tab
le 2
.2.4
: P
erc
en
tag
e d
istr
ibu
tio
n o
f yo
uth
head
ed
ho
useh
old
s a
cro
ss in
terg
en
era
tio
nal h
ou
seh
old
typ
e,
2016 (
co
nt.
)
Hea
d
Po
pu
lation
g
rou
p
A
fric
an
/Bla
ck
Co
lou
red
In
dia
n/A
sia
n
Wh
ite
RS
A
Sin
gle
gen
era
tio
n
18
,7
14
,9
27
,1
31
,0
19
,3
Dou
ble
ge
ne
ratio
n
33
,0
65
,5
36
,6
36
,5
34
,6
Tri
ple
ge
ne
ratio
n
0,4
0
,3
3,8
0
,4
0,4
Skip
ge
ne
ration
0,5
0
,7
0,0
1
,1
0,6
Oth
er
47
,4
18
,6
32
,6
31
,0
45
,1
All
Yo
uth
-he
ad
ed
HH
s(P
er
ce
nt)
1
00
,0
10
0,0
1
00
,0
10
0,0
1
00
,0
All
Yo
uth
-he
ad
ed
HH
s
(Th
ou
san
ds
)*
3 7
62
18
0
61
24
0
4 2
43
Ag
e g
rou
p
1
5-2
4
25
-34
R
SA
Sin
gle
gen
era
tio
n
19
,3
19
,4
19
,3
Dou
ble
ge
ne
ratio
n
17
,2
38
,6
34
,6
Tri
ple
ge
ne
ratio
n
0,1
0
,5
0,4
Skip
ge
ne
ration
0,6
0
,5
0,6
Oth
er
62
,8
41
,1
45
,1
All
Yo
uth
-he
ad
ed
HH
s(P
er
ce
nt)
1
00
,0
10
0,0
1
00
,0
All
Yo
uth
-he
ad
ed
HH
s
(Th
ou
san
ds
)*
78
5
3 4
58
4 2
43
Hea
d S
ex
M
ale
F
em
ale
R
SA
Sin
gle
gen
era
tio
n
23
,1
12
,0
19
,3
Dou
ble
ge
ne
ratio
n
27
,5
48
,7
34
,6
Tri
ple
ge
ne
ratio
n
0,2
0
,8
0,4
Skip
ge
ne
ration
0,6
0
,6
0,6
Oth
er
48
,7
38
,0
45
,1
All
Yo
uth
-he
ad
ed
HH
s(P
er
ce
nt)
1
00
,0
10
0,0
1
00
,0
All
Yo
uth
-he
ad
ed
HH
s
(Th
ou
san
ds
)*
2 8
20
1 4
23
4 2
43
* T
ota
l exclu
des m
issin
g c
ases
So
urc
e:
GH
S 2
016

ST
AT
IST
ICS
SO
UT
H A
FR
ICA
37
Vul
nera
ble
Gro
ups
Indi
cato
r, 2
016
(Rep
ort 0
3-19
-02)
2.3
Yo
uth
: In
co
me, p
ov
ert
y, eco
no
mic
acti
vit
y a
nd
so
cia
l g
ran
ts
Tab
le 2
.3.1
: P
erc
en
tag
e o
f yo
uth
wh
o a
re b
en
efi
cia
ries
of
so
cia
l g
ran
ts,
20
16
D
isa
gg
reg
ati
on
1
5-2
4
25
-34
RS
A
Ag
e g
rou
p
% s
ha
re
18
,2
1,6
1
0,2
Y
ou
th b
en
eficia
rie
s
1 8
75
15
1
2 0
26
All
Yo
uth
(T
ho
us
an
ds
) 1
0 3
12
9 6
47
19
958
Se
x
M
ale
F
em
ale
R
SA
%
sha
re
10
,1
10
,2
10
,2
Yo
uth
be
ne
ficia
rie
s
1 0
17
1 0
10
2 0
26
All
Yo
uth
(T
ho
us
an
ds
) 1
0 0
78
9 8
81
19
958
So
urc
e:
GH
S 2
016
Tab
le 2
.3.2
: P
erc
en
tag
e o
f yo
uth
liv
ing
in
ho
useh
old
s w
ith
ou
t an
em
plo
yed
ad
ult
, 2016
D
isa
gg
reg
ati
on
W
C
EC
N
C
FS
K
ZN
N
W
GP
M
P
LP
R
SA
Se
x a
nd
p
rovin
ce
Ma
le
% s
ha
re
9,1
4
1,3
2
6,8
2
9,6
2
7,5
2
7,7
1
1,9
2
5,5
3
3,7
2
4,1
M
ale
yo
uth
(T
ho
usa
nd
s)
95
51
0
56
15
2
54
4
18
8
29
3
20
6
38
1
2 4
27
All
ma
le Y
ou
th
(Th
ou
sa
nds)
1 0
54
1 2
34
21
1
51
2
1 9
81
68
0
2 4
66
80
9
1 1
30
10
078
Fe
ma
le
% s
ha
re
9,4
4
1,4
2
7,9
3
0,0
3
1,8
2
9,1
1
3,1
2
5,8
4
0,1
2
6,3
F
em
ale
yo
uth
(T
ho
usa
nds)
10
2
51
7
58
15
6
63
4
18
9
29
7
21
3
43
5
2 6
02
All
fem
ale
Yo
uth
(T
ho
usa
nds)
1 0
85
1 2
49
20
7
52
1
1 9
96
65
1
2 2
63
82
4
1 0
84
9 8
81
Bo
th
% s
ha
re
9,2
4
1,4
2
7,3
2
9,8
2
9,6
2
8,4
1
2,5
2
5,7
3
6,9
2
5,2
Y
ou
th (
Th
ou
sa
nd
s)
19
7
1 0
27
11
4
30
8
1 1
78
37
8
59
1
41
9
81
6
5 0
29
All
Yo
uth
(T
ho
us
an
ds
) 2
13
9
2 4
83
41
8
1 0
33
3 9
78
1 3
32
4 7
29
1 6
33
2 2
13
19
958
Se
x a
nd
ge
o-
typ
e
Urb
an
R
ura
l R
SA
Ma
le
% s
ha
re
15
,3
39
,3
24
,1
M
ale
yo
uth
(T
ho
usa
nd
s)
97
3
1 4
54
2 4
27
A
ll m
ale
Yo
uth
(T
ho
usa
nds)
6 3
82
3 6
96
10
078
Fe
ma
le
% s
ha
re
16
,3
43
,9
26
,3
F
em
ale
yo
uth
(T
ho
usa
nds)
1 0
25
1 5
77
2 6
02
A
ll fe
ma
le Y
ou
th
(Th
ou
sa
nds)
6 2
89
3 5
91
9 8
81
Bo
th
% s
ha
re
15
,8
41
,6
25
,2
Y
ou
th (
Th
ou
sa
nd
s)
1 9
98
3 0
30
5 0
29
A
ll Y
ou
th (
Th
ou
san
ds
) 1
2 6
72
7 2
87
19
958
Se
x a
nd
ag
e
gro
up
15
-24
2
5-3
4
RS
A
Ma
le
% s
ha
re
30
,0
17
,9
24
,1
M
ale
yo
uth
(T
ho
usa
nd
s)
1 5
50
87
7
2 4
27
A
ll m
ale
Yo
uth
(T
ho
usa
nds)
5 1
74
4 9
03
10
078
Fe
ma
le
% s
ha
re
30
,5
21
,8
26
,3
F
em
ale
yo
uth
(T
ho
usa
nds)
1 5
67
1 0
35
2 6
02
A
ll fe
ma
le Y
ou
th
(Th
ou
sa
nds)
5 1
37
4 7
43
9 8
81
Bo
th
% s
ha
re
30
,2
19
,8
25
,2
Y
ou
th (
Th
ou
sa
nd
s)
3 1
17
1 9
12
5 0
29
A
ll Y
ou
th (
Th
ou
san
ds
) 1
0 3
12
9 6
47
19
958
S
ou
rce:
GH
S 2
016
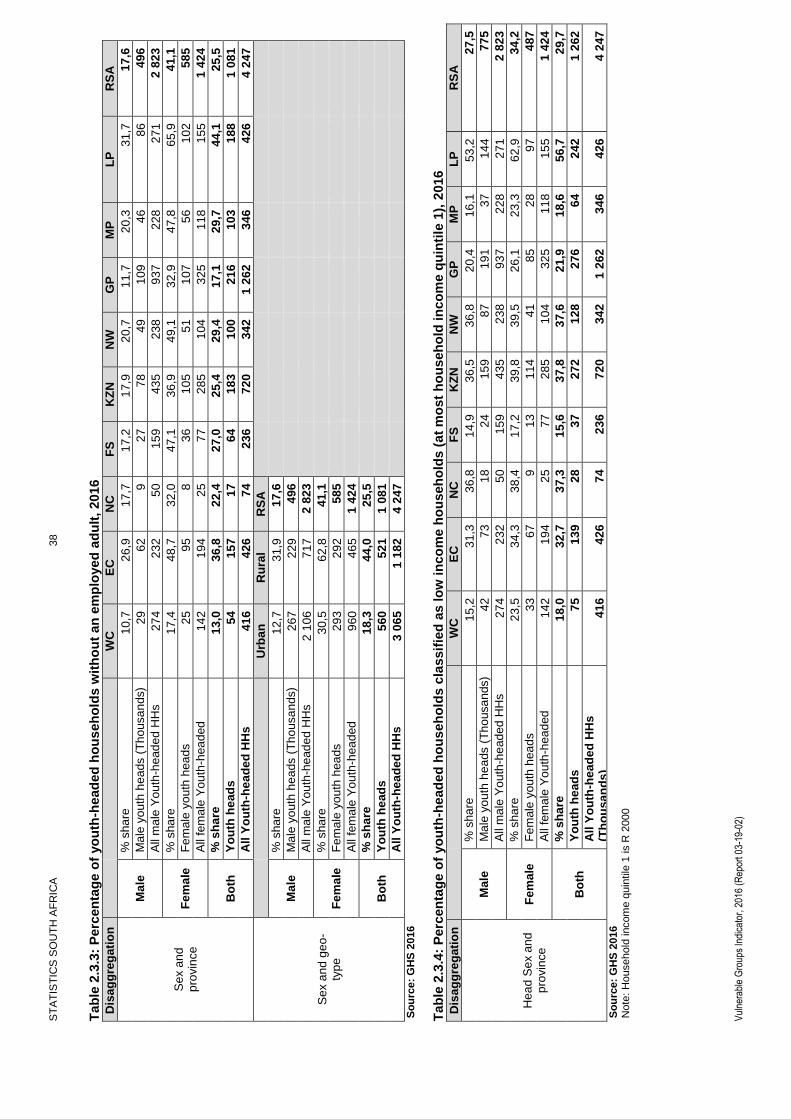
ST
AT
IST
ICS
SO
UT
H A
FR
ICA
38
Vul
nera
ble
Gro
ups
Indi
cato
r, 2
016
(Rep
ort 0
3-19
-02)
Tab
le 2
.3.3
: P
erc
en
tag
e o
f yo
uth
-head
ed
ho
us
eh
old
s w
ith
ou
t an
em
plo
yed
ad
ult
, 2016
D
isa
gg
reg
ati
on
W
C
EC
N
C
FS
K
ZN
N
W
GP
M
P
LP
R
SA
Se
x a
nd
p
rovin
ce
Ma
le
% s
ha
re
10
,7
26
,9
17
,7
17
,2
17
,9
20
,7
11
,7
20
,3
31
,7
17
,6
Ma
le y
ou
th h
ea
ds (
Th
ousa
nds)
29
62
9
27
78
49
10
9
46
86
49
6
All
ma
le Y
ou
th-h
ead
ed
HH
s
(Th
ou
sa
nds)
27
4
23
2
50
15
9
43
5
23
8
93
7
22
8
27
1
2 8
23
Fe
ma
le
% s
ha
re
17
,4
48
,7
32
,0
47
,1
36
,9
49
,1
32
,9
47
,8
65
,9
41
,1
Fe
male
yo
uth
hea
ds
(Th
ou
sa
nds)
25
95
8
36
10
5
51
10
7
56
10
2
58
5
All
fem
ale
Yo
uth
-hea
ded
H
Hs(T
ho
usa
nd
s)
14
2
19
4
25
77
28
5
10
4
32
5
11
8
15
5
1 4
24
Bo
th
% s
ha
re
13
,0
36
,8
22
,4
27
,0
25
,4
29
,4
17
,1
29
,7
44
,1
25
,5
Yo
uth
he
ad
s
54
15
7
17
64
18
3
10
0
21
6
10
3
18
8
1 0
81
All
Yo
uth
-he
ad
ed
HH
s
(Th
ou
san
ds
) 4
16
42
6
74
23
6
72
0
34
2
1 2
62
34
6
42
6
4 2
47
Se
x a
nd
ge
o-
typ
e
Urb
an
R
ura
l R
SA
Ma
le
% s
ha
re
12
,7
31
,9
17
,6
Ma
le y
ou
th h
ea
ds (
Th
ousa
nds)
26
7
22
9
49
6
All
ma
le Y
ou
th-h
ead
ed
HH
s
(Th
ou
sa
nds)
2 1
06
71
7
2 8
23
Fe
ma
le
% s
ha
re
30
,5
62
,8
41
,1
Fe
male
yo
uth
hea
ds
(Th
ou
sa
nds)
29
3
29
2
58
5
All
fem
ale
Yo
uth
-hea
ded
H
Hs(T
ho
usa
nd
s)
96
0
46
5
1 4
24
Bo
th
% s
ha
re
18
,3
44
,0
25
,5
Yo
uth
he
ad
s
56
0
52
1
1 0
81
All
Yo
uth
-he
ad
ed
HH
s
(Th
ou
san
ds
) 3
06
5
1 1
82
4 2
47
S
ou
rce:
GH
S 2
016
Tab
le 2
.3.4
: P
erc
en
tag
e o
f yo
uth
-head
ed
ho
us
eh
old
s c
lassif
ied
as lo
w in
co
me
ho
useh
old
s (
at
mo
st
ho
useh
old
in
co
me q
uin
tile
1),
2016
D
isa
gg
reg
ati
on
W
C
EC
N
C
FS
K
ZN
N
W
GP
M
P
LP
R
SA
Hea
d S
ex a
nd
p
rovin
ce
Ma
le
% s
ha
re
15
,2
31
,3
36
,8
14
,9
36
,5
36
,8
20
,4
16
,1
53
,2
27
,5
Ma
le y
ou
th h
ea
ds (
Th
ousa
nds)
42
73
18
24
15
9
87
19
1
37
14
4
77
5
All
ma
le Y
ou
th-h
ead
ed
HH
s
(Th
ou
sa
nds)
27
4
23
2
50
15
9
43
5
23
8
93
7
22
8
27
1
2 8
23
Fe
ma
le
% s
ha
re
23
,5
34
,3
38
,4
17
,2
39
,8
39
,5
26
,1
23
,3
62
,9
34
,2
Fe
male
yo
uth
hea
ds
(Th
ou
sa
nds)
33
67
9
13
11
4
41
85
28
97
48
7
All
fem
ale
Yo
uth
-hea
ded
H
Hs(T
ho
usa
nd
s)
14
2
19
4
25
77
28
5
10
4
32
5
11
8
15
5
1 4
24
Bo
th
% s
ha
re
18
,0
32
,7
37
,3
15
,6
37
,8
37
,6
21
,9
18
,6
56
,7
29
,7
Yo
uth
he
ad
s
75
13
9
28
37
27
2
12
8
27
6
64
24
2
1 2
62
All
Yo
uth
-he
ad
ed
HH
s
(Th
ou
san
ds
) 4
16
42
6
74
23
6
72
0
34
2
1 2
62
34
6
42
6
4 2
47
So
urc
e:
GH
S 2
016
Note
: H
ousehold
incom
e q
uin
tile
1 is R
2000

ST
AT
IST
ICS
SO
UT
H A
FR
ICA
39
Vul
nera
ble
Gro
ups
Indi
cato
r, 2
016
(Rep
ort 0
3-19
-02)
Tab
le 2
.3.4
: P
erc
en
tag
e o
f yo
uth
-head
ed
ho
us
eh
old
s c
lassif
ied
as lo
w in
co
me
ho
useh
old
s (
at
mo
st
ho
useh
old
in
co
me q
uin
tile
1),
2016.
(co
nt.
)
So
urc
e:
GH
S 2
016
Note
: H
ousehold
incom
e q
uin
tile
1 is R
2000
Hea
d s
ex a
nd
ra
ce
Bla
ck
Afr
ica
n
Co
lou
red
In
dia
n/
As
ian
W
hit
e
RS
A
Ma
le
% s
ha
re
29
,8
18
,4
13
,5
4,0
2
7,5
Ma
le y
ou
th h
ea
ds (
Th
ousa
nds)
74
0
21
6
7
77
5
All
ma
le Y
ou
th-h
ead
ed
HH
s
(Th
ou
sa
nds)
2 4
82
11
3
48
18
0
2 8
23
Fe
ma
le
% s
ha
re
36
,1
31
,9
0,0
3
,9
34
,2
Fe
male
yo
uth
hea
ds (
Th
ou
sand
s)
46
3
21
0
2
48
7
All
fem
ale
Yo
uth
-hea
ded
H
Hs(T
ho
usa
nd
s)
1 2
84
67
14
60
1 4
24
Bo
th
% s
ha
re
32
,0
23
,4
10
,5
3,9
2
9,7
Yo
uth
he
ad
s
1 2
04
42
6
9
1 2
62
All
Yo
uth
-he
ad
ed
HH
s
(Th
ou
san
ds
) 3
76
6
18
0
61
24
0
4 2
47
Hea
d S
ex a
nd
g
eo
-typ
e
Urb
an
R
ura
l R
SA
Ma
le
% s
ha
re
22
,8
41
,0
27
,5
Ma
le y
ou
th h
ea
ds (
Th
ousa
nds)
48
1
29
4
77
5
All
ma
le Y
ou
th-h
ead
ed
HH
s
(Th
ou
sa
nds)
2 1
06
71
7
2 8
23
Fe
ma
le
% s
ha
re
29
,2
44
,6
34
,2
Fe
male
yo
uth
hea
ds (
Th
ou
sand
s)
28
0
20
7
48
7
All
fem
ale
Yo
uth
-hea
ded
H
Hs(T
ho
usa
nd
s)
96
0
46
5
1 4
24
Bo
th
% s
ha
re
24
,8
42
,4
29
,7
Yo
uth
he
ad
s
76
1
50
1
1 2
62
All
Yo
uth
-he
ad
ed
HH
s
(Th
ou
san
ds
) 3
06
5
1 1
82
4 2
47
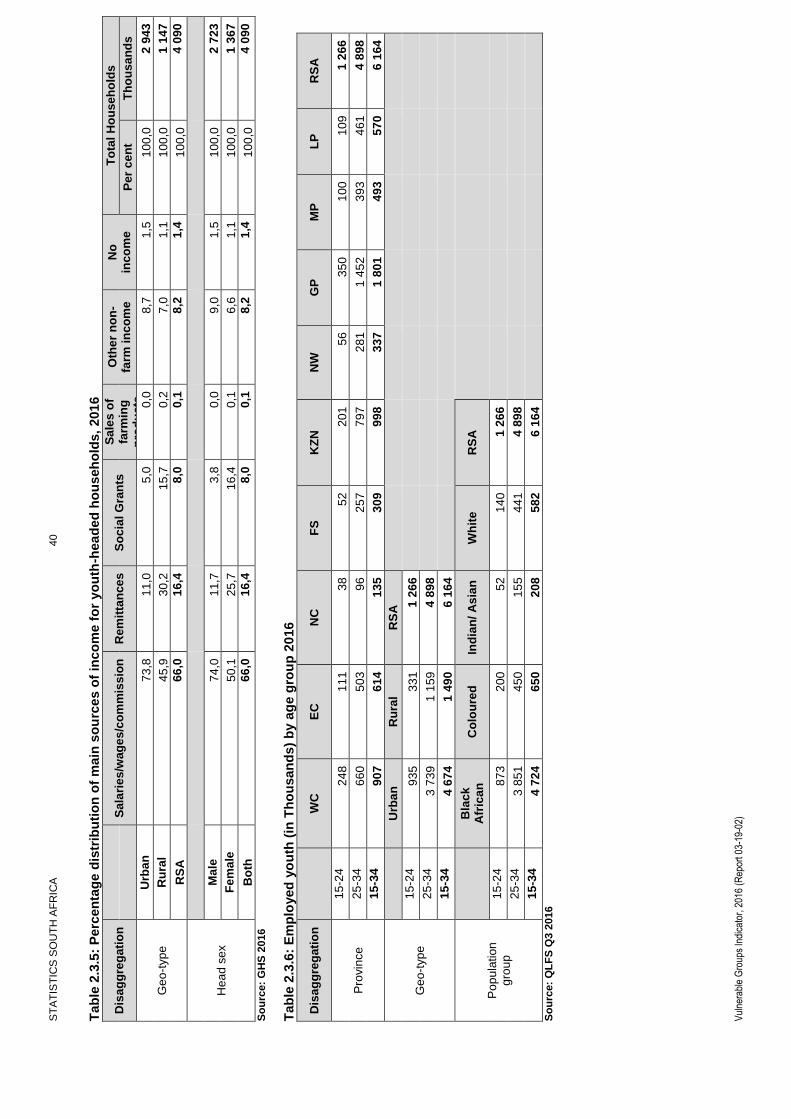
ST
AT
IST
ICS
SO
UT
H A
FR
ICA
40
Vul
nera
ble
Gro
ups
Indi
cato
r, 2
016
(Rep
ort 0
3-19
-02)
Tab
le 2
.3.5
: P
erc
en
tag
e d
istr
ibu
tio
n o
f m
ain
so
urc
es o
f in
co
me f
or
yo
uth
-hea
ded
ho
useh
old
s,
201
6
Dis
ag
gre
gati
on
Sa
lari
es
/wag
es
/co
mm
iss
ion
R
em
itta
nce
s
So
cia
l G
ran
ts
Sa
les
of
farm
ing
p
rod
uc
ts
an
d
se
rvic
es
Oth
er
no
n-
farm
in
co
me
No
in
co
me
To
tal
Ho
use
ho
lds
P
er
ce
nt
Th
ou
sa
nd
s
Ge
o-t
yp
e
Urb
an
7
3,8
1
1,0
5
,0
0,0
8
,7
1,5
1
00
,0
2 9
43
Ru
ral
45
,9
30
,2
15
,7
0,2
7
,0
1,1
1
00
,0
1 1
47
RS
A
66
,0
16
,4
8,0
0
,1
8,2
1
,4
10
0,0
4
09
0
Hea
d s
ex
Ma
le
74
,0
11
,7
3,8
0
,0
9,0
1
,5
10
0,0
2
72
3
Fe
ma
le
50
,1
25
,7
16
,4
0,1
6
,6
1,1
1
00
,0
1 3
67
Bo
th
66
,0
16
,4
8,0
0
,1
8,2
1
,4
10
0,0
4
09
0
So
urc
e:
GH
S 2
016
Tab
le 2
.3.6
: E
mp
loyed
yo
uth
(in
Th
ou
san
ds
) b
y a
ge g
rou
p 2
016
Dis
ag
gre
gati
on
WC
E
C
NC
F
S
KZ
N
NW
G
P
MP
L
P
RS
A
Pro
vin
ce
15
-24
24
8
11
1
38
52
20
1
56
35
0
10
0
10
9
1 2
66
25
-34
66
0
50
3
96
25
7
79
7
28
1
1 4
52
39
3
46
1
4 8
98
15
-34
90
7
61
4
13
5
30
9
99
8
33
7
1 8
01
49
3
57
0
6 1
64
Ge
o-t
yp
e
U
rba
n
Ru
ral
RS
A
15
-24
93
5
33
1
1 2
66
25
-34
3 7
39
1 1
59
4 8
98
15
-34
4 6
74
1 4
90
6 1
64
Po
pu
lation
g
rou
p
Bla
ck
A
fric
an
C
olo
ure
d
Ind
ian
/ A
sia
n
Wh
ite
RS
A
15
-24
87
3
20
0
52
14
0
1 2
66
25
-34
3 8
51
45
0
15
5
44
1
4 8
98
15
-34
4 7
24
65
0
20
8
58
2
6 1
64
S
ou
rce:
QL
FS
Q3 2
016

ST
AT
IST
ICS
SO
UT
H A
FR
ICA
41
Vul
nera
ble
Gro
ups
Indi
cato
r, 2
016
(Rep
ort 0
3-19
-02)
Tab
le 2
.3.7
: U
nem
plo
yed
yo
uth
(in
Th
ou
san
ds
) b
y a
ge g
rou
p 2
016
Dis
ag
gre
gati
on
WC
E
C
NC
F
S
KZ
N
NW
G
P
MP
L
P
RS
A
Pro
vin
ce
15
-24
19
8
12
9
39
10
4
20
9
10
3
47
1
14
9
91
1 4
94
25
-34
22
2
24
5
48
16
5
33
3
17
1
76
0
21
9
16
0
2 3
23
15
-34
41
9
37
4
87
26
9
54
2
27
5
1 2
32
36
8
25
1
3 8
17
Ge
o-t
yp
e
U
rba
n
Ru
ral
RS
A
15
-24
1 0
83
41
1
1 4
94
25
-34
1 6
83
64
0
2 3
23
15
-34
2 7
66
1 0
51
3 8
17
Po
pu
lation
g
rou
p
Bla
ck
A
fric
an
C
olo
ure
d
Ind
ian
/ A
sia
n
Wh
ite
RS
A
15
-24
1 2
62
17
6
27
29
1 4
94
25
-34
2 1
03
15
8
26
35
2 3
23
15
-34
3 3
65
33
5
53
64
3 8
17
S
ou
rce:
QL
FS
Q3 2
016
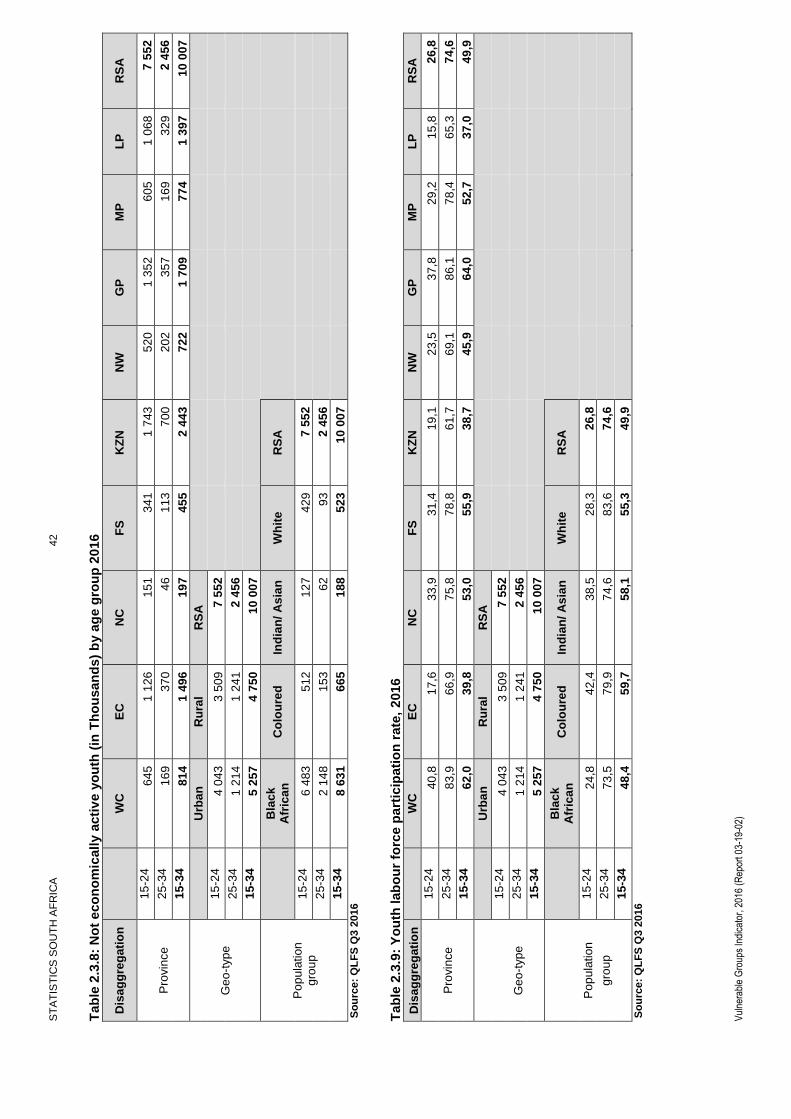
ST
AT
IST
ICS
SO
UT
H A
FR
ICA
42
Vul
nera
ble
Gro
ups
Indi
cato
r, 2
016
(Rep
ort 0
3-19
-02)
Tab
le 2
.3.8
: N
ot
eco
no
mic
all
y a
cti
ve y
ou
th (
in T
ho
usan
ds
) b
y a
ge g
rou
p 2
016
Dis
ag
gre
gati
on
WC
E
C
NC
F
S
KZ
N
NW
G
P
MP
L
P
RS
A
Pro
vin
ce
15
-24
64
5
1 1
26
15
1
34
1
1 7
43
52
0
1 3
52
60
5
1 0
68
7 5
52
25
-34
16
9
37
0
46
11
3
70
0
20
2
35
7
16
9
32
9
2 4
56
15
-34
81
4
1 4
96
19
7
45
5
2 4
43
72
2
1 7
09
77
4
1 3
97
10
007
Ge
o-t
yp
e
U
rba
n
Ru
ral
RS
A
15
-24
4 0
43
3 5
09
7 5
52
25
-34
1 2
14
1 2
41
2 4
56
15
-34
5 2
57
4 7
50
10
007
Po
pu
lation
g
rou
p
Bla
ck
A
fric
an
C
olo
ure
d
Ind
ian
/ A
sia
n
Wh
ite
RS
A
15
-24
6 4
83
51
2
12
7
42
9
7 5
52
25
-34
2 1
48
15
3
62
93
2 4
56
15
-34
8 6
31
66
5
18
8
52
3
10
007
S
ou
rce:
QL
FS
Q3 2
016
Tab
le 2
.3.9
: Y
ou
th lab
ou
r fo
rce p
art
icip
ati
on
rate
, 2
016
Dis
ag
gre
gati
on
WC
E
C
NC
F
S
KZ
N
NW
G
P
MP
L
P
RS
A
1
5-2
4
40
,8
17
,6
33
,9
31
,4
19
,1
23
,5
37
,8
29
,2
15
,8
26
,8
Pro
vin
ce
25
-34
83
,9
66
,9
75
,8
78
,8
61
,7
69
,1
86
,1
78
,4
65
,3
74
,6
1
5-3
4
62
,0
39
,8
53
,0
55
,9
38
,7
45
,9
64
,0
52
,7
37
,0
49
,9
Urb
an
R
ura
l R
SA
1
5-2
4
4 0
43
3 5
09
7 5
52
Ge
o-t
yp
e
25
-34
1 2
14
1 2
41
2 4
56
1
5-3
4
5 2
57
4 7
50
10
007
Bla
ck
A
fric
an
C
olo
ure
d
Ind
ian
/ A
sia
n
Wh
ite
RS
A
Po
pu
lation
15
-24
24
,8
42
,4
38
,5
28
,3
26
,8
gro
up
25
-34
73
,5
79
,9
74
,6
83
,6
74
,6
1
5-3
4
48
,4
59
,7
58
,1
55
,3
49
,9
S
ou
rce:
QL
FS
Q3 2
016

ST
AT
IST
ICS
SO
UT
H A
FR
ICA
43
Vul
nera
ble
Gro
ups
Indi
cato
r, 2
016
(Rep
ort 0
3-19
-02)
Tab
le 2
.3.1
0:
Yo
uth
un
em
plo
ym
en
t ra
te,
20
16
Dis
ag
gre
gati
on
WC
E
C
NC
F
S
KZ
N
NW
G
P
MP
L
P
RS
A
1
5-2
4
44
,4
53
,8
50
,5
66
,5
51
,0
64
,7
57
,4
59
,8
45
,6
54
,1
Pro
vin
ce
25
-34
25
,2
32
,7
33
,3
39
,1
29
,5
37
,9
34
,4
35
,8
25
,7
32
,2
1
5-3
4
31
,6
37
,9
39
,3
46
,5
35
,2
44
,9
40
,6
42
,7
30
,6
38
,2
Urb
an
R
ura
l R
SA
1
5-2
4
53
,7
55
,4
54
,1
Ge
o-t
yp
e
25
-34
31
,0
35
,6
32
,2
1
5-3
4
37
,2
41
,4
38
,2
Bla
ck
A
fric
an
C
olo
ure
d
Ind
ian
/ A
sia
n
Wh
ite
RS
A
Po
pu
lation
15
-24
59
,1
46
,9
33
,9
17
,3
54
,1
gro
up
25
-34
35
,3
26
,0
14
,5
7,3
3
2,2
1
5-3
4
41
,6
34
,0
20
,4
9,9
3
8,2
So
urc
e:
QL
FS
Q3 2
016
Tab
le 2
.3.1
1:
Yo
uth
lab
ou
r ab
so
rpti
on
rate
, 20
16
Dis
ag
gre
gati
on
WC
E
C
NC
F
S
KZ
N
NW
G
P
MP
L
P
RS
A
1
5-2
4
22
,7
8,1
1
6,8
1
0,5
9
,3
8,3
1
6,1
1
1,7
8
,6
12
,3
Pro
vin
ce
25
-34
62
,8
45
,0
50
,6
48
,0
43
,5
42
,9
56
,5
50
,3
48
,5
50
,6
1
5-3
4
42
,4
24
,7
32
,2
29
,9
25
,0
25
,3
38
,0
30
,2
25
,7
30
,8
Urb
an
R
ura
l R
SA
Ge
o-t
yp
e
15
-24
15
,4
7,8
1
2,3
2
5-3
4
56
,3
38
,1
50
,6
1
5-3
4
36
,8
20
,4
30
,8
Bla
ck
A
fric
an
C
olo
ure
d
Ind
ian
/ A
sia
n
Wh
ite
RS
A
Po
pu
lation
15
-24
10
,1
22
,5
25
,5
23
,4
12
,3
gro
up
25
-34
47
,5
59
,1
63
,8
77
,5
50
,6
1
5-3
4
28
,3
39
,4
46
,2
49
,8
30
,8
S
ou
rce:
QL
FS
Q3 2
016

ST
AT
IST
ICS
SO
UT
H A
FR
ICA
44
Vul
nera
ble
Gro
ups
Indi
cato
r, 2
016
(Rep
ort 0
3-19
-02)
Tab
le 2
.3.1
2:
Yo
uth
eco
no
mic
in
acti
vit
y r
ate
, 201
6
Dis
ag
gre
gati
on
WC
E
C
NC
F
S
KZ
N
NW
G
P
MP
L
P
RS
A
1
5-2
4
59
,2
82
,4
66
,1
68
,6
80
,9
76
,5
62
,2
70
,8
84
,2
73
,2
Pro
vin
ce
25
-34
16
,1
33
,1
24
,2
21
,2
38
,3
30
,9
13
,9
21
,6
34
,7
25
,4
1
5-3
4
38
,0
60
,2
47
,0
44
,1
61
,3
54
,1
36
,0
47
,3
63
,0
50
,1
Urb
an
R
ura
l R
SA
Ge
o-t
yp
e
15
-24
66
,7
82
,5
73
,2
2
5-3
4
18
,3
40
,8
25
,4
1
5-3
4
41
,4
65
,1
50
,1
Bla
ck
A
fric
an
C
olo
ure
d
Ind
ian
/ A
sia
n
Wh
ite
RS
A
Po
pu
lation
15
-24
75
,2
57
,6
61
,5
71
,7
73
,2
gro
up
25
-34
26
,5
20
,1
25
,4
16
,4
25
,4
1
5-3
4
51
,6
40
,3
41
,9
44
,7
50
,1
S
ou
rce:
QL
FS
Q3 2
016

ST
AT
IST
ICS
SO
UT
H A
FR
ICA
45
Vul
nera
ble
Gro
ups
Indi
cato
r, 2
016
(Rep
ort 0
3-19
-02)
2.4
Yo
uth
: H
ealt
h
Tab
le 2
.4.1
: P
erc
en
tag
e o
f yo
uth
wh
o s
uff
ere
d f
rom
acu
te d
isea
ses c
om
pare
d t
o t
he o
vera
ll p
op
ula
tio
n,
201
6
Dis
ag
gre
gati
on
WC
E
C
NC
F
S
KZ
N
NW
G
P
MP
L
P
RS
A
Pro
vin
ce
% y
ou
th s
ha
re
5,6
6
,7
9,2
8
,5
5,3
8
,1
11
,7
9,7
5
,5
7,8
Yo
uth
su
ffe
rin
g (
Th
ou
san
ds)
11
9
16
6
38
88
20
9
10
7
55
3
15
9
12
2
1 5
63
Yo
uth
(T
ho
us
an
ds
) 2
13
9
2 4
83
41
8
10
33
3 9
78
1 3
32
4 7
29
1 6
33
2 2
13
19
958
%
sha
re o
f to
tal po
pula
tio
n
8,2
1
0,1
1
1,6
1
0,4
7
,1
9,7
1
4,4
1
1,3
7
,3
10
,2
Po
pu
lation
suff
erin
g
52
3
67
7
13
9
28
9
76
3
36
5
1 9
53
48
6
41
5
5 6
10
Po
pu
lati
on
(T
ho
us
an
ds
) 6
36
2
6 7
31
1 1
92
2 7
69
10
807
3 7
58
13
543
4 2
90
5 7
24
55
177
Ge
o-t
yp
e
U
rba
n
Ru
ral
RS
A
% y
ou
th s
ha
re
8,8
6
,2
7,8
Yo
uth
su
ffe
rin
g
1 1
14
44
9
1 5
63
Yo
uth
(T
ho
us
an
ds
) 1
2 6
72
72
87
19
958
%
sha
re o
f to
tal po
pula
tio
n
11
,4
8,1
1
0,2
Po
pu
lation
suff
erin
g
4 0
13
1 5
97
5 6
10
Po
pu
lati
on
(T
ho
us
an
ds
) 3
5 3
69
19
807
55
177
Se
x
M
ale
F
em
ale
R
SA
% y
ou
th s
ha
re
6,7
9
,0
7,8
Yo
uth
su
ffe
rin
g (
Th
ou
san
ds)
67
9
88
4
1 5
63
Yo
uth
(T
ho
us
an
ds
) 1
0 0
78
9 8
81
19
958
%
sha
re o
f to
tal po
pula
tio
n
9,4
1
0,9
1
0,2
Po
pu
lation
suff
erin
g
2 5
27
3 0
82
56
10
Po
pu
lati
on
(T
ho
us
an
ds
) 2
6 9
75
28
202
55
177
Ag
e g
rou
p
1
5-2
4
25
-34
RS
A
% y
ou
th s
ha
re
7,0
8
,7
7,8
Yo
uth
su
ffe
rin
g (
Th
ou
san
ds)
72
5
83
8
1 5
63
Yo
uth
(T
ho
us
an
ds
) 1
0 3
12
9 6
47
19
958
%
sha
re o
f to
tal po
pula
tio
n
10
,2
Po
pu
lation
suff
erin
g
(Th
ou
sa
nds)
56
09
,6
Po
pu
lati
on
(T
ho
us
an
ds
)
5
5 1
77
S
ou
rce:
GH
S 2
016

ST
AT
IST
ICS
SO
UT
H A
FR
ICA
46
Vul
nera
ble
Gro
ups
Indi
cato
r, 2
016
(Rep
ort 0
3-19
-02)
Tab
le 2
.4.2
: P
erc
en
tag
e o
f yo
uth
wh
o s
uff
ere
d f
rom
ch
ron
ic d
ise
ase
s c
om
pare
d t
o t
he o
vera
ll p
op
ula
tio
n,
2016
Dis
ag
gre
gati
on
WC
E
C
NC
F
S
KZ
N
NW
G
P
MP
L
P
RS
A
Pro
vin
ce
% y
ou
th s
ha
re
7,1
6
,7
7,9
7
,1
6,0
7
,3
5,6
5
,9
2,8
5
,9
Yo
uth
su
ffe
rin
g
15
1
16
6
33
73
24
0
97
26
5
97
62
1 1
84
Yo
uth
(T
ho
us
an
ds
) 2
13
9
2 4
83
41
8
1 0
33
3 9
78
1 3
32
4 7
29
1 6
33
2 2
13
19
958
%
sha
re o
f to
tal
po
pu
latio
n
19
,0
16
,3
20
,8
19
,1
14
,2
16
,7
15
,1
13
,9
8,1
1
5,1
Po
pu
lation
suff
erin
g
1 2
11
1 0
98
24
8
52
9
1 5
36
62
8
2 0
39
59
6
46
5
8 3
49
Po
pu
lati
on
(T
ho
us
an
ds
) 6
36
2
6 7
31
1 1
92
2 7
69
10
807
3 7
58
13
543
4 2
90
5 7
24
55
177
Ge
o-t
yp
e
U
rba
n
Ru
ral
RS
A
% y
ou
th s
ha
re
6,1
5
,6
5,9
Yo
uth
su
ffe
rin
g
77
8
40
5
1 1
84
Yo
uth
(Th
ou
sa
nd
s)
12
672
7 2
87
19
958
%
sha
re o
f to
tal
po
pu
latio
n
16
,1
13
,4
15
,1
Po
pu
lation
suff
erin
g
5 6
99
2 6
51
8 3
49
Po
pu
lati
on
(T
ho
us
an
ds
) 3
5 3
69
19
807
55
177
Se
x
M
ale
F
em
ale
R
SA
% y
ou
th s
ha
re
4,5
7
,4
5,9
Yo
uth
su
ffe
rin
g
45
7
72
6
1 1
84
Yo
uth
(T
ho
us
an
ds
) 1
0 0
78
9 8
81
19
958
%
sha
re o
f to
tal
po
pu
latio
n
11
,7
18
,5
15
,1
Po
pu
lation
suff
erin
g
3 1
47
5 2
02
8 3
49
Po
pu
lati
on
(T
ho
us
an
ds
) 2
6 9
75
28
202
55
177
Ag
e g
rou
p
1
5-2
4
25
-34
RS
A
% y
ou
th s
ha
re
3,4
8
,6
5,9
Yo
uth
su
ffe
rin
g
35
3
83
0
1 1
84
Yo
uth
(T
ho
us
an
ds
) 1
0 3
12
9 6
47
19
958
%
sha
re o
f to
tal
po
pu
latio
n
15
,1
Po
pu
lation
suff
erin
g
8 3
49
Po
pu
lati
on
(T
ho
us
an
ds
)
5
5 1
77
S
ou
rce:
GH
S 2
016
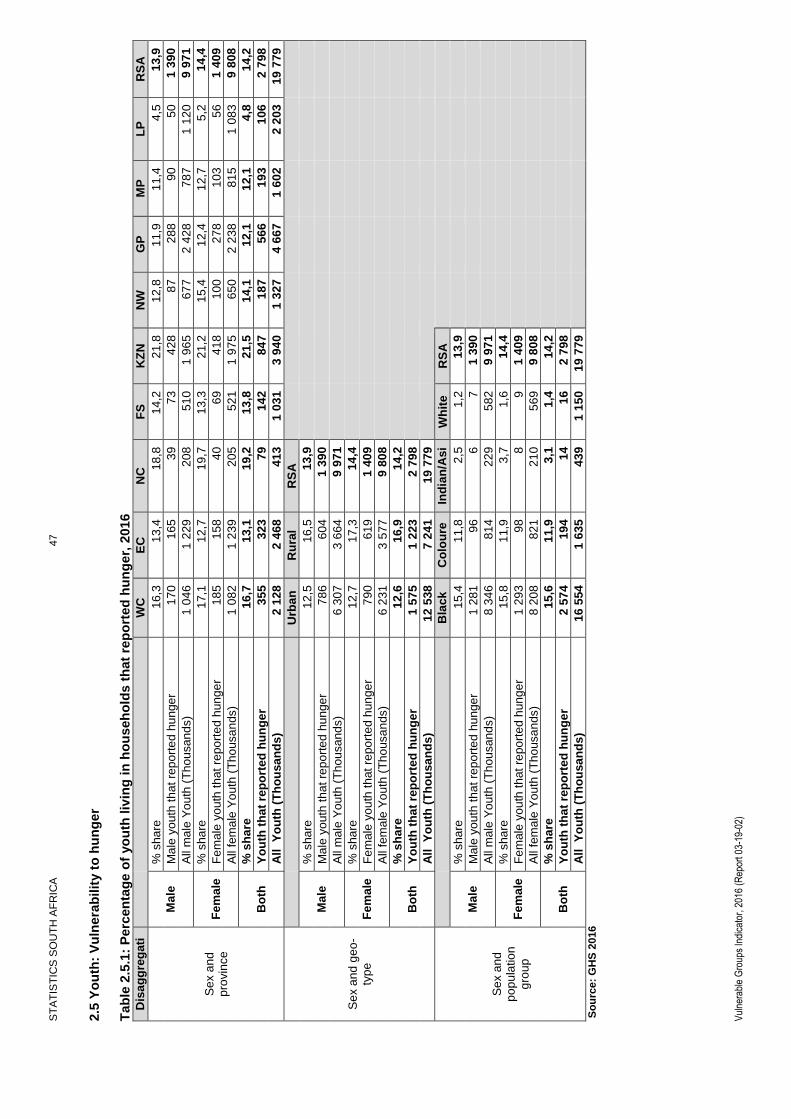
ST
AT
IST
ICS
SO
UT
H A
FR
ICA
47
Vul
nera
ble
Gro
ups
Indi
cato
r, 2
016
(Rep
ort 0
3-19
-02)
2.5
Yo
uth
: V
uln
era
bilit
y t
o h
un
ger
Tab
le 2
.5.1
: P
erc
en
tag
e o
f yo
uth
liv
ing
in
ho
useh
old
s t
hat
rep
ort
ed
hu
ng
er,
2016
D
isa
gg
reg
ati
on
W
C
EC
N
C
FS
K
ZN
N
W
GP
M
P
LP
R
SA
Se
x a
nd
p
rovin
ce
Ma
le
% s
ha
re
16
,3
13
,4
18
,8
14
,2
21
,8
12
,8
11
,9
11
,4
4,5
1
3,9
Ma
le y
ou
th t
ha
t re
po
rte
d h
un
ge
r 1
70
16
5
39
73
42
8
87
28
8
90
50
1 3
90
All
ma
le Y
ou
th (
Th
ou
san
ds)
1 0
46
1 2
29
20
8
51
0
1 9
65
67
7
2 4
28
78
7
1 1
20
9 9
71
Fe
ma
le
% s
ha
re
17
,1
12
,7
19
,7
13
,3
21
,2
15
,4
12
,4
12
,7
5,2
1
4,4
Fe
male
yo
uth
th
at
repo
rte
d h
un
ge
r 1
85
15
8
40
69
41
8
10
0
27
8
10
3
56
1 4
09
All
fem
ale
Yo
uth
(T
ho
usa
nds)
1 0
82
1 2
39
20
5
52
1
1 9
75
65
0
2 2
38
81
5
1 0
83
9 8
08
Bo
th
% s
ha
re
16
,7
13
,1
19
,2
13
,8
21
,5
14
,1
12
,1
12
,1
4,8
1
4,2
Yo
uth
th
at
rep
ort
ed
hu
ng
er
35
5
32
3
79
14
2
84
7
18
7
56
6
19
3
10
6
2 7
98
All
Y
ou
th (
Th
ou
sa
nd
s)
2 1
28
2 4
68
41
3
1 0
31
3 9
40
1 3
27
4 6
67
1 6
02
2 2
03
19
779
Se
x a
nd
ge
o-
typ
e
Urb
an
R
ura
l R
SA
Ma
le
% s
ha
re
12
,5
16
,5
13
,9
Ma
le y
ou
th t
ha
t re
po
rte
d h
un
ge
r 7
86
60
4
1 3
90
All
ma
le Y
ou
th (
Th
ou
san
ds)
6 3
07
3 6
64
9 9
71
Fe
ma
le
% s
ha
re
12
,7
17
,3
14
,4
Fe
male
yo
uth
th
at
repo
rte
d h
un
ge
r 7
90
61
9
1 4
09
All
fem
ale
Yo
uth
(T
ho
usa
nds)
6 2
31
3 5
77
9 8
08
Bo
th
% s
ha
re
12
,6
16
,9
14
,2
Yo
uth
th
at
rep
ort
ed
hu
ng
er
1 5
75
1 2
23
2 7
98
All
Y
ou
th (
Th
ou
sa
nd
s)
12
538
7 2
41
19
779
Se
x a
nd
p
op
ula
tio
n
gro
up
Bla
ck
A
fric
an
C
olo
ure
d
Ind
ian
/As
ia
n
Wh
ite
RS
A
Ma
le
% s
ha
re
15
,4
11
,8
2,5
1
,2
13
,9
Ma
le y
ou
th t
ha
t re
po
rte
d h
un
ge
r 1
28
1
96
6
7
1 3
90
All
ma
le Y
ou
th (
Th
ou
san
ds)
8 3
46
81
4
22
9
58
2
9 9
71
Fe
ma
le
% s
ha
re
15
,8
11
,9
3,7
1
,6
14
,4
Fe
male
yo
uth
th
at
repo
rte
d h
un
ge
r 1
29
3
98
8
9
1 4
09
All
fem
ale
Yo
uth
(T
ho
usa
nds)
8 2
08
82
1
21
0
56
9
9 8
08
Bo
th
% s
ha
re
15
,6
11
,9
3,1
1
,4
14
,2
Yo
uth
th
at
rep
ort
ed
hu
ng
er
2 5
74
19
4
14
16
2 7
98
All
Y
ou
th (
Th
ou
sa
nd
s)
16
554
1 6
35
43
9
1 1
50
19
779
S
ou
rce:
GH
S 2
016

ST
AT
IST
ICS
SO
UT
H A
FR
ICA
48
Vul
nera
ble
Gro
ups
Indi
cato
r, 2
016
(Rep
ort 0
3-19
-02)
Tab
le 2
.5.1
: P
erc
en
tag
e o
f yo
uth
liv
ing
in
ho
useh
old
s t
hat
rep
ort
ed
hu
ng
er,
2016(c
on
t.)
Se
x
an
d
ag
e
gro
up
15
-24
2
5-3
4
RS
A
Ma
le
% s
ha
re
14
,8
13
,0
13
,9
Ma
le y
ou
th t
ha
t re
po
rte
d h
un
ge
r 7
61
62
9
1 3
90
All
ma
le Y
ou
th (
Th
ou
san
ds)
5 1
30
4 8
41
9 9
71
Fe
ma
le
% s
ha
re
15
,1
13
,6
14
,4
Fe
male
yo
uth
th
at
repo
rte
d h
un
ge
r 7
68
64
0
1 4
09
All
fem
ale
Yo
uth
(T
ho
usa
nds)
5 0
99
4 7
09
9 8
08
Bo
th
% s
ha
re
15
,0
13
,3
14
,2
Yo
uth
th
at
rep
ort
ed
hu
ng
er
1 5
29
1 2
69
2 7
98
All
Y
ou
th (
Th
ou
sa
nd
s)
10
229
9 5
50
19
779
So
urc
e:
GH
S 2
016
Tab
le 2
.5.2
: P
erc
en
tag
e o
f yo
uth
-head
ed
ho
us
eh
old
s t
hat
rep
ort
ed
hu
ng
er,
2016
Dis
ag
gre
gati
on
W
C
EC
N
C
FS
K
ZN
N
W
GP
M
P
LP
R
SA
Head s
ex a
nd
pro
vin
ce
Male
% s
hare
18,2
12,0
15,9
13,5
13,0
13,1
9,3
9,5
4,7
11,2
Male
youth
headed h
hs that re
port
ed h
unger
49
28
8
21
56
31
85
21
13
311
Male
yo
uth
-he
ad
ed
HH
s (
Th
ou
san
ds
) 270
230
49
158
428
236
913
219
265
2 7
69
Fe
male
% s
hare
18,8
10,8
19,4
14,9
11,8
15,1
15,6
16,3
4,0
13,3
Fem
ale
youth
headed h
hs t
hat re
port
ed
hunger
26
21
5
12
34
16
50
19
6
187
Fe
male
yo
uth
-he
ad
ed
HH
s (
Th
ou
san
ds
) 141
191
24
77
283
103
319
117
155
1 4
11
Bo
th
% s
ha
re
18,4
11,4
17,0
14,0
12,5
13,7
10,9
11,9
4,5
11,9
Yo
uth
he
ad
ed
hh
s t
ha
t re
po
rted
hu
ng
er
76
48
12
33
89
46
135
40
19
498
Yo
uth
-he
ad
ed
HH
s (
Th
ou
san
ds)
411
421
73
235
711
339
1 2
32
337
420
4 1
80
Head s
ex a
nd
geo-t
ype
Urb
an
R
ura
l R
SA
Male
% s
hare
10,9
12,2
11,2
Male
youth
headed h
hs that re
port
ed h
unger
225
85
311
Male
yo
uth
-he
ad
ed
HH
s (
Th
ou
san
ds
) 2 0
68
701
2 7
69
Fe
male
% s
hare
12,8
14,3
13,3
Fem
ale
youth
headed h
hs t
hat re
port
ed
hunger
121
66
187
Fe
male
yo
uth
-he
ad
ed
HH
s (
Th
ou
san
ds
) 946
464
1 4
11
Bo
th
% s
ha
re
11,5
13,0
11,9
Yo
uth
he
ad
ed
hh
s t
ha
t re
po
rted
hu
ng
er
346
152
498
Yo
uth
-he
ad
ed
HH
s (
Th
ou
san
ds)
3 0
15
1 1
65
4 1
80
So
urc
e:
GH
S 2
016

ST
AT
IST
ICS
SO
UT
H A
FR
ICA
49
Vul
nera
ble
Gro
ups
Indi
cato
r, 2
016
(Rep
ort 0
3-19
-02)
2.6
Yo
uth
: E
du
cati
on
T
ab
le 2
.6.1
: P
erc
en
tag
e o
f yo
uth
wh
o a
tten
d e
du
ca
tio
nal in
sti
tuti
on
s, 20
16
Dis
ag
gre
gati
on
B
lac
k A
fric
an
C
olo
ure
d
Ind
ian
/As
ian
W
hit
e
RS
A
Se
x a
nd
p
op
ula
tio
n
gro
up
Ma
le
% s
ha
re
30
,5
24
,6
23
,7
30
,2
29
,9
Ma
le y
ou
th a
tte
nd
ing
2
55
2
20
1
55
17
6
2 9
84
Ma
le y
ou
th (
Th
ou
sa
nd
s)
8 3
56
81
8
23
2
58
3
9 9
89
Fe
male
% s
ha
re
30
,7
24
,6
29
,1
35
,7
30
,5
Fe
male
yo
uth
atte
ndin
g
2 5
20
20
2
63
20
3
2 9
89
Fe
ma
le y
ou
th(T
ho
us
an
ds
) 8
19
9
82
3
21
7
56
9
9 8
07
Bo
th
% s
ha
re
30
,6
24
,6
26
,3
32
,9
30
,2
Yo
uth
att
en
din
g
5 0
72
40
3
11
8
38
0
5 9
72
Yo
uth
(T
ho
us
an
ds
) 1
6 5
55
1 6
41
44
9
1 1
52
19
796
Se
x a
nd
ag
e
gro
up
15
-24
25
-34
R
SA
Ma
le
% s
ha
re
54
,7
3,5
2
9,9
Ma
le y
ou
th a
tte
nd
ing
2
81
3
17
1
2 9
84
Ma
le y
ou
th (
Th
ou
sa
nd
s)
5 1
45
4 8
43
9 9
89
Fe
male
% s
ha
re
53
,4
5,5
3
0,5
Fe
male
yo
uth
atte
ndin
g
(Th
ou
sa
nds)
2 7
32
25
7
2 9
89
Fe
male
yo
uth
(T
ho
usa
nds)
5 1
12
4 6
95
9 8
07
Bo
th
% s
ha
re
54
,1
4,5
3
0,2
Yo
uth
att
en
din
g
5 5
44
42
8
5 9
72
Yo
uth
(T
ho
us
an
ds
) 1
0 2
57
9 5
39
19
796
So
urc
e:
GH
S 2
016
Tab
le 2
.6.2
: P
erc
en
tag
e d
istr
ibu
tio
n o
f th
e t
yp
es
of
ed
ucati
on
al
insti
tuti
on
s a
tten
ded
by y
ou
th a
ged
15
-24 y
ears
, 20
16
Se
x a
nd
p
op
ula
tio
n
gro
up
B
lac
k A
fric
an
C
olo
ure
d
Ind
ian
/As
ian
W
hit
e
M
ale
F
em
ale
M
ale
F
em
ale
M
ale
F
em
ale
M
ale
F
em
ale
Sch
ool/P
rescho
ol
83
,7
77
,2
83
,5
74
,6
54
,1
47
,5
59
,0
49
,8
AB
ET
/Lite
racy C
lasse
s
1,1
1
,7
1,2
0
,5
0,0
0
,0
0,4
0
,0
Hig
he
r E
du
ca
tion
Institu
tion
6,6
9
,4
7,9
1
3,6
4
1,1
4
9,7
2
8,6
3
9,9
Fu
rth
er
Ed
uca
tio
n a
nd
Tra
inin
g
Colle
ge
6,1
7
,1
3,5
5
,5
1,3
0
,0
1,7
3
,4
Oth
er
Co
lleg
e
2,1
4
,0
2,9
4
,3
3,5
2
,8
5,0
3
,8
Oth
er
0,4
0
,6
1,1
1
,5
0,0
0
,0
5,3
3
,0
To
tal
(%)
10
0,0
1
00
,0
10
0,0
1
00
,0
10
0,0
1
00
,0
10
0,0
1
00
,0
To
tal
(Th
ou
san
ds
)*
2 5
17
2 5
03
20
0
19
9
55
63
17
1
20
0
So
urc
e:
GH
S 2
016
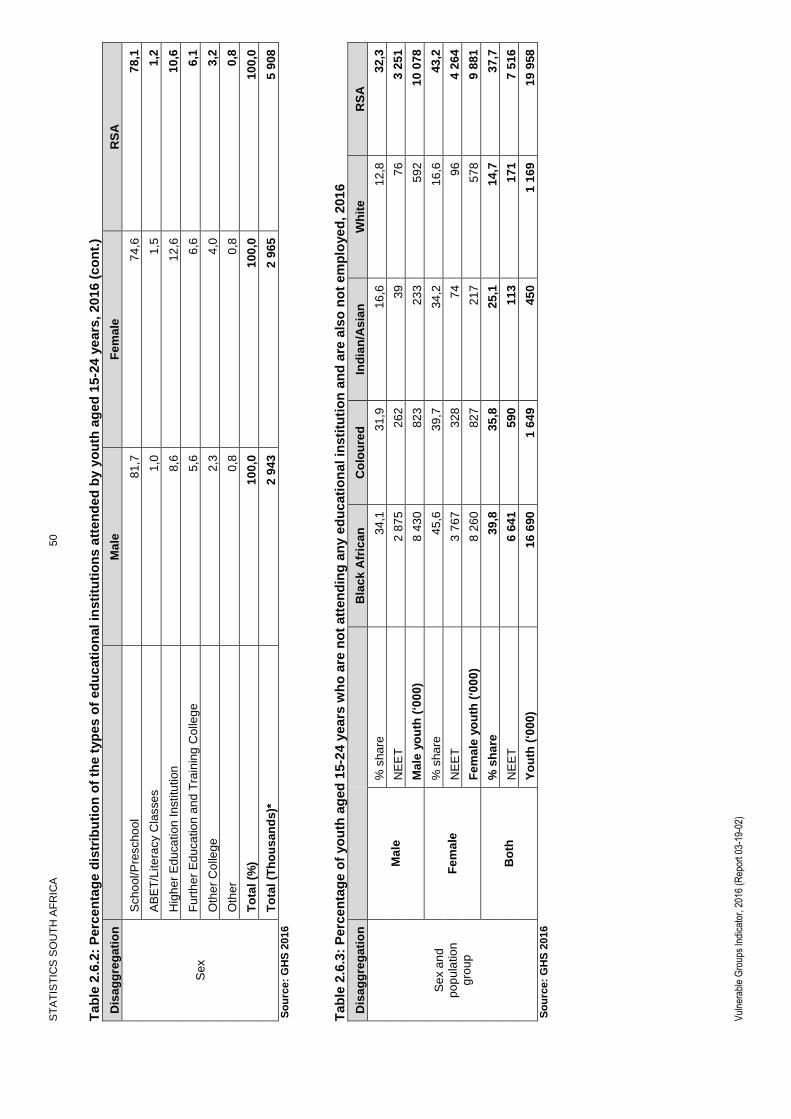
ST
AT
IST
ICS
SO
UT
H A
FR
ICA
50
Vul
nera
ble
Gro
ups
Indi
cato
r, 2
016
(Rep
ort 0
3-19
-02)
Tab
le 2
.6.2
: P
erc
en
tag
e d
istr
ibu
tio
n o
f th
e t
yp
es
of
ed
ucati
on
al
insti
tuti
on
s a
tten
ded
by y
ou
th a
ged
15
-24 y
ears
, 20
16 (
co
nt.
)
Dis
ag
gre
gati
on
Ma
le
Fe
ma
le
RS
A
Se
x
Sch
ool/P
rescho
ol
81
,7
74
,6
78
,1
AB
ET
/Lite
racy C
lasse
s
1,0
1
,5
1,2
Hig
he
r E
du
ca
tion
Institu
tion
8,6
1
2,6
1
0,6
Fu
rth
er
Ed
uca
tio
n a
nd
Tra
inin
g C
olle
ge
5
,6
6,6
6
,1
Oth
er
Co
lleg
e
2,3
4
,0
3,2
Oth
er
0,8
0
,8
0,8
To
tal
(%)
10
0,0
1
00
,0
10
0,0
To
tal
(Th
ou
san
ds
)*
2 9
43
2 9
65
5 9
08
So
urc
e:
GH
S 2
016
Tab
le 2
.6.3
: P
erc
en
tag
e o
f yo
uth
ag
ed
15-2
4 y
ears
wh
o a
re n
ot
att
en
din
g a
ny e
du
cati
on
al
insti
tuti
on
an
d a
re a
lso
no
t em
plo
ye
d,
201
6
Dis
ag
gre
gati
on
B
lac
k A
fric
an
C
olo
ure
d
Ind
ian
/As
ian
W
hit
e
RS
A
Se
x a
nd
p
op
ula
tio
n
gro
up
Ma
le
% s
ha
re
34
,1
31
,9
16
,6
12
,8
32
,3
NE
ET
2
87
5
26
2
39
76
3 2
51
Ma
le y
ou
th (
‘00
0)
8 4
30
82
3
23
3
59
2
10
078
Fe
ma
le
% s
ha
re
45
,6
39
,7
34
,2
16
,6
43
,2
NE
ET
3
76
7
32
8
74
96
4 2
64
Fe
ma
le y
ou
th (
‘00
0)
8 2
60
82
7
21
7
57
8
9 8
81
Bo
th
% s
ha
re
39
,8
35
,8
25
,1
14
,7
37
,7
NE
ET
6
64
1
59
0
11
3
17
1
7 5
16
Yo
uth
(‘0
00
) 1
6 6
90
1 6
49
45
0
1 1
69
19
958
So
urc
e:
GH
S 2
016

ST
AT
IST
ICS
SO
UT
H A
FR
ICA
51
Vul
nera
ble
Gro
ups
Indi
cato
r, 2
016
(Rep
ort 0
3-19
-02)
Tab
le 2
.6.4
: P
erc
en
tag
e d
istr
ibu
tio
n o
f th
e h
igh
est
lev
els
of
ed
ucati
on
att
ain
ed
by y
ou
th,
20
16
Dis
ag
gre
ga
tio
n
1
5-2
4
25
-34
RS
A(1
5-3
4)
M
ale
F
em
ale
M
ale
F
em
al
e
Ma
le
Fe
ma
le
Bo
th
Se
x a
nd
a
ge
gro
up
Le
ss t
han
ma
tric
7
2,8
6
7,0
5
1,8
4
8,1
6
2,5
5
7,9
6
0,2
Ma
tric
2
2,6
2
8,2
3
3,7
3
5,1
2
8,1
3
1,5
2
9,8
Oth
er
tert
iary
2
,5
2,8
7
,5
9,4
4
,9
6,0
5
,5
Gra
du
ate
s
1,3
1
,5
5,9
6
,7
3,5
4
,0
3,8
Oth
er
0,9
0
,5
1,2
0
,7
1,0
0
,6
0,8
To
tal
(%)
10
0,0
1
00
,0
10
0,0
1
00
,0
10
0,0
1
00
,0
10
0,0
To
tal
(‘00
0)
5 0
96
5 0
73
4 8
89
4 7
33
9 9
84
9 8
07
19
791
Po
pu
lation
a
nd
ag
e
gro
up
1
5-2
4
25
-34
RS
A (
15
-34
)
Bla
ck
A
fric
an
C
olo
ure
d
Ind
ian
/As
ian
W
hit
e
Bla
ck
A
fric
an
C
olo
ure
d
Ind
ian
/A
sia
n
Wh
ite
Bla
ck
A
fric
an
C
olo
ure
d
Ind
ian
/A
sia
n
Wh
ite
Le
ss t
han
ma
tric
7
2,5
6
8,2
3
5,9
4
6,9
5
3,2
5
2,5
1
4,6
1
5,4
6
3,1
6
0,9
2
4,4
3
1,4
Ma
tric
2
3,3
2
7,9
5
3,2
4
1,7
3
3,5
3
7,6
4
5,4
3
7,6
2
8,3
3
2,4
4
9,0
3
9,7
Oth
er
tert
iary
2
,6
2,1
2
,7
3,9
8
,1
5,6
9
,5
16
,7
5,3
3
,7
6,4
1
0,2
Gra
du
ate
s
0,9
0
,7
7,5
7
,5
4,2
3
,7
28
,5
30
,1
2,5
2
,1
18
,8
18
,6
Oth
er
0,7
1
,1
0,8
0
,0
1,0
0
,6
2,0
0
,3
0,8
0
,9
1,4
0
,1
To
tal
(%)
10
0,0
1
00
,0
10
0,0
1
00
,0
10
0,0
1
00
,0
10
0,0
1
00
,0
10
0,0
1
00
,0
10
0,0
1
00
,0
To
tal
(‘00
0)
8 4
94
88
1
20
6
58
8
8 0
49
76
1
24
3
56
9
16
543
1 6
42
44
9
1 1
57
So
urc
e:
GH
S 2
016
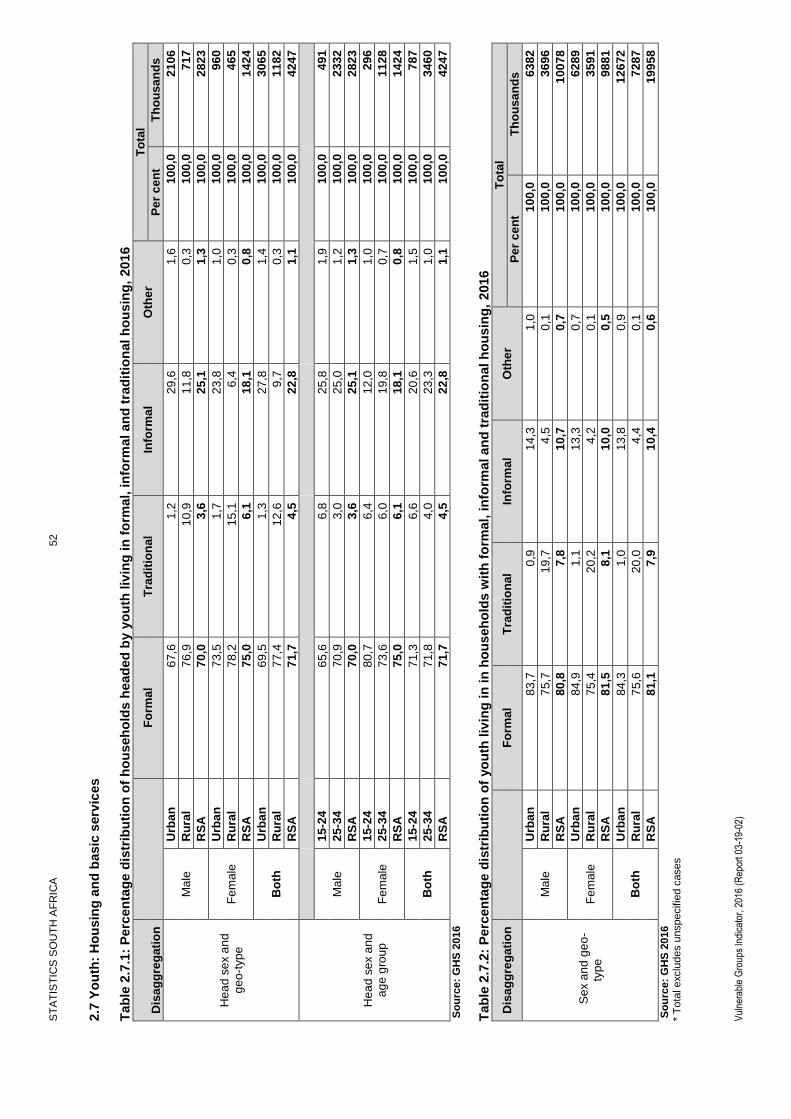
ST
AT
IST
ICS
SO
UT
H A
FR
ICA
52
Vul
nera
ble
Gro
ups
Indi
cato
r, 2
016
(Rep
ort 0
3-19
-02)
2.7
Yo
uth
: H
ou
sin
g a
nd
basic
serv
ices
T
ab
le 2
.7.1
: P
erc
en
tag
e d
istr
ibu
tio
n o
f h
ou
seh
old
s h
ead
ed
by y
ou
th liv
ing
in
fo
rmal, in
form
al an
d t
rad
itio
nal h
ou
sin
g,
20
16
Dis
ag
gre
gati
on
Fo
rma
l T
rad
itio
nal
Info
rma
l O
the
r T
ota
l
Pe
r c
en
t
Th
ou
sa
nd
s
Hea
d s
ex a
nd
g
eo
-typ
e
Ma
le
Urb
an
6
7,6
1
,2
29
,6
1,6
1
00
,0
21
06
Ru
ral
76
,9
10
,9
11
,8
0,3
1
00
,0
71
7
RS
A
70
,0
3,6
2
5,1
1
,3
10
0,0
2
82
3
Fe
male
Urb
an
7
3,5
1
,7
23
,8
1,0
1
00
,0
96
0
Ru
ral
78
,2
15
,1
6,4
0
,3
10
0,0
4
65
RS
A
75
,0
6,1
1
8,1
0
,8
10
0,0
1
42
4
Bo
th
Urb
an
6
9,5
1
,3
27
,8
1,4
1
00
,0
30
65
Ru
ral
77
,4
12
,6
9,7
0
,3
10
0,0
1
18
2
RS
A
71
,7
4,5
2
2,8
1
,1
10
0,0
4
24
7
Hea
d s
ex a
nd
a
ge
gro
up
Ma
le
15
-24
6
5,6
6
,8
25
,8
1,9
1
00
,0
49
1
25
-34
70
,9
3,0
2
5,0
1
,2
10
0,0
2
33
2
RS
A
70
,0
3,6
2
5,1
1
,3
10
0,0
2
82
3
Fe
male
15
-24
8
0,7
6
,4
12
,0
1,0
1
00
,0
29
6
25
-34
73
,6
6,0
1
9,8
0
,7
10
0,0
1
12
8
RS
A
75
,0
6,1
1
8,1
0
,8
10
0,0
1
42
4
Bo
th
15
-24
7
1,3
6
,6
20
,6
1,5
1
00
,0
78
7
25
-34
71
,8
4,0
2
3,3
1
,0
10
0,0
3
46
0
RS
A
71
,7
4,5
2
2,8
1
,1
10
0,0
4
24
7
So
urc
e:
GH
S 2
016
Tab
le 2
.7.2
: P
erc
en
tag
e d
istr
ibu
tio
n o
f yo
uth
liv
ing
in
in
ho
useh
old
s w
ith
fo
rmal, in
form
al an
d t
rad
itio
nal h
ou
sin
g,
2016
Dis
ag
gre
gati
on
Fo
rma
l T
rad
itio
nal
Info
rma
l O
the
r T
ota
l
Pe
r c
en
t
Th
ou
sa
nd
s
Se
x a
nd
ge
o-
typ
e
Ma
le
Urb
an
8
3,7
0
,9
14
,3
1,0
1
00
,0
63
82
Ru
ral
75
,7
19
,7
4,5
0
,1
10
0,0
3
69
6
RS
A
80
,8
7,8
1
0,7
0
,7
10
0,0
1
00
78
Fe
male
Urb
an
8
4,9
1
,1
13
,3
0,7
1
00
,0
62
89
Ru
ral
75
,4
20
,2
4,2
0
,1
10
0,0
3
59
1
RS
A
81
,5
8,1
1
0,0
0
,5
10
0,0
9
88
1
Bo
th
Urb
an
8
4,3
1
,0
13
,8
0,9
1
00
,0
12
67
2
Ru
ral
75
,6
20
,0
4,4
0
,1
10
0,0
7
28
7
RS
A
81
,1
7,9
1
0,4
0
,6
10
0,0
1
99
58
So
urc
e:
GH
S 2
016
* T
ota
l exclu
des u
nspecifie
d c
ases

ST
AT
IST
ICS
SO
UT
H A
FR
ICA
53
Vul
nera
ble
Gro
ups
Indi
cato
r, 2
016
(Rep
ort 0
3-19
-02)
Tab
le 2
.7.2
: P
erc
en
tag
e d
istr
ibu
tio
n o
f yo
uth
liv
ing
in
in
ho
useh
old
s w
ith
fo
rmal, in
form
al an
d t
rad
itio
nal h
ou
sin
g, 2
016 (
co
nt.
)
Dis
ag
gre
gati
on
Fo
rma
l T
rad
itio
nal
Info
rma
l O
the
r T
ota
l
Pe
r c
en
t
Th
ou
sa
nd
s
Se
x a
nd
ag
e
gro
up
Ma
le
15
-24
8
1,8
9
,5
8,2
0
,5
10
0,0
5
17
4
25
-34
79
,7
6,1
1
3,3
0
,9
10
0,0
4
90
3
RS
A
80
,8
7,8
1
0,7
0
,7
10
0,0
1
00
78
Fe
male
15
-24
8
1,5
9
,6
8,5
0
,5
10
0,0
5
13
7
25
-34
81
,4
6,4
1
1,6
0
,5
10
0,0
4
74
3
RS
A
81
,5
8,1
1
0,0
0
,5
10
0,0
9
88
1
Bo
th
15
-24
8
1,7
9
,5
8,4
0
,5
10
0,0
1
03
12
25
-34
80
,5
6,3
1
2,5
0
,7
10
0,0
9
64
7
RS
A
81
,1
7,9
1
0,4
0
,6
10
0,0
1
99
58
So
urc
e:
GH
S 2
016
*
To
tal exclu
des u
nspecifie
d c
ases
Tab
le 2
.7.3
: L
ivin
g c
on
dit
ion
in
dic
ato
rs o
f th
e y
ou
th c
om
pare
d t
o t
ho
se o
f th
e o
vera
ll p
op
ula
tio
n,
201
6
Ag
e
Ac
ce
ss
to
se
rvic
e in
dic
ato
r
Ac
ce
ss
to
pip
ed
wa
ter*
A
cc
es
s t
o i
mp
rove
d
Sa
nit
ati
on
* R
efu
se
/ W
as
te r
em
ove
d b
y
mu
nic
ipa
lity
* A
cc
es
s t
o e
lec
tric
ity
co
nn
ec
ted
to
th
e m
ain
s*
So
lid
fu
els
fo
r co
ok
ing
*
%
%
%
%
%
15
-24
67
,7
82
,5
58
,1
89
,3
16
,1
25
-34
73
,1
83
,0
65
,9
85
,7
10
,4
15
-34
70
,3
82
,7
61
,9
89
,9
13
,3
Po
pu
lati
on
7
1,2
8
3,8
6
3,2
8
9,1
1
3,2
S
ou
rce:
GH
S 2
016
*Access t
o w
ate
r:
%
of to
tal popula
tio
n/Y
outh
with a
ccess to w
ate
r.
*Sanitatio
n: %
of
popula
tio
n/Y
outh
liv
ing in d
welli
ng w
ith f
lush t
oile
ts w
ith o
r offsite d
isposal.
*Refu
se/W
aste
: %
of
popula
tio
n/Y
outh
liv
ing in
dw
elli
ngs w
here
rub
bis
h is r
em
oved b
y m
unic
ipalit
y.
*Ele
ctr
icity: %
of P
opula
tio
n/Y
outh
liv
ing in d
welli
ngs w
ith e
lectr
icity that
is c
onnecte
d to m
ain
ele
ctr
icity s
upplie
rs.
*Solid
fuels
for
cookin
g: %
of
popula
tio
n/Y
outh
liv
ing in
dw
elli
ngs w
ith w
ood,
coal and a
nim
al dung a
s the s
ourc
e o
f energ
y f
or
cookin
g

ST
AT
IST
ICS
SO
UT
H A
FR
ICA
54
Vul
nera
ble
Gro
ups
Indi
cato
r, 2
016
(Rep
ort 0
3-19
-02)
2.8
Yo
uth
: V
iole
nc
e a
nd
cri
me v
icti
ms
T
ab
le 2
.8.1
: P
erc
en
tag
e o
f yo
uth
liv
ing
in
ho
useh
old
s w
here
th
e h
ou
seh
old
s f
eel
un
safe
or
very
un
safe
to
walk
alo
ne i
n t
heir
are
a d
uri
ng
th
e d
ay,
2015
/16
D
isa
gg
reg
ati
on
WC
E
C
NC
F
S
KZ
N
NW
G
P
MP
L
P
RS
A
Pro
vin
ce
% s
ha
re
70
,9
85
,9
87
,4
90
,2
84
,2
86
,4
78
,0
89
,5
95
,7
83
,8
Yo
uth
(th
ousa
nd
s)*
1
43
3
2 1
36
35
4
91
5
3 2
19
1 1
30
3 5
32
1 4
00
2 0
17
16
137
% s
ha
re
71
,6
85
,7
87
,6
90
,6
84
,4
87
,0
77
,5
89
,6
95
,3
83
,6
Po
pu
lati
on
(t
ho
us
an
ds
)*
4 3
77
5 8
89
1 0
32
2 6
01
9 1
56
3 3
02
10
383
3 7
78
5 3
59
45
876
Se
x
M
ale
F
em
ale
R
SA
% s
ha
re
84
,1
83
,5
83
,8
Yo
uth
(th
ousa
nd
s)*
8
05
3
8 0
84
16
137
% s
ha
re
83
,8
83
,4
83
,6
Po
pu
lati
on
(t
ho
us
an
ds
)*
22
116
23
760
45
876
Ag
e g
rou
p
1
5-2
4
25
-34
RS
A
% s
ha
re
84
,0
83
,6
83
,8
Yo
uth
(th
ousa
nd
s)*
7
80
2
8 3
35
16
137
% s
ha
re
83
,6
Po
pu
lati
on
(t
ho
us
an
ds
)*
45
876
So
urc
e:
VO
CS
2015/1
6
*Tota
ls e
xclu
de u
nspecifie
d c
ases
Tab
le 2
.8.2
: P
erc
en
tag
e o
f yo
uth
liv
ing
in
ho
useh
old
s w
here
th
e h
ou
seh
old
s f
eel u
nsafe
or
very
un
safe
to
walk
alo
ne in
th
eir
are
a a
t n
igh
t, 2
015
/16
D
isa
gg
reg
ati
on
WC
E
C
NC
F
S
KZ
N
NW
G
P
MP
L
P
RS
A
Pro
vin
ce
% s
ha
re
28
,4
26
,7
26
,7
17
,7
35
,1
30
,4
23
,8
29
,1
52
,6
30
,7
Yo
uth
(th
ousa
nd
s)
57
3
66
4
10
8
18
0
1 3
40
39
7
1 0
74
45
6
1 1
04
5 8
96
% s
ha
re
31
,4
27
,1
28
,2
19
,0
35
,2
28
,4
24
,3
28
,2
52
,6
30
,9
Po
pu
lati
on
(t
ho
us
an
ds
) 1
91
4
1 8
60
33
2
54
5
3 8
08
1 0
76
3 2
43
1 1
95
2 9
55
16
930
Se
x
M
ale
F
em
ale
R
SA
% s
ha
re
31
,1
30
,3
30
,7
Yo
uth
(th
ousa
nd
s)
2 9
72
2 9
24
5 8
96
% s
ha
re
31
,2
30
,5
30
,9
Po
pu
lati
on
(t
ho
us
an
ds
) 8
23
8
8 6
92
16
930
Ag
e g
rou
p
1
5-2
4
25
-34
RS
A
% s
ha
re
84
,0
83
,6
83
,8
Yo
uth
(th
ousa
nd
s)
7 8
02
8 3
35
16
137
% s
ha
re
30
,9
Po
pu
lati
on
(t
ho
us
an
ds
)
1
6 9
30
So
urc
e:
VO
CS
2015/1
6
*Tota
ls e
xclu
de u
nspecifie
d c
ases
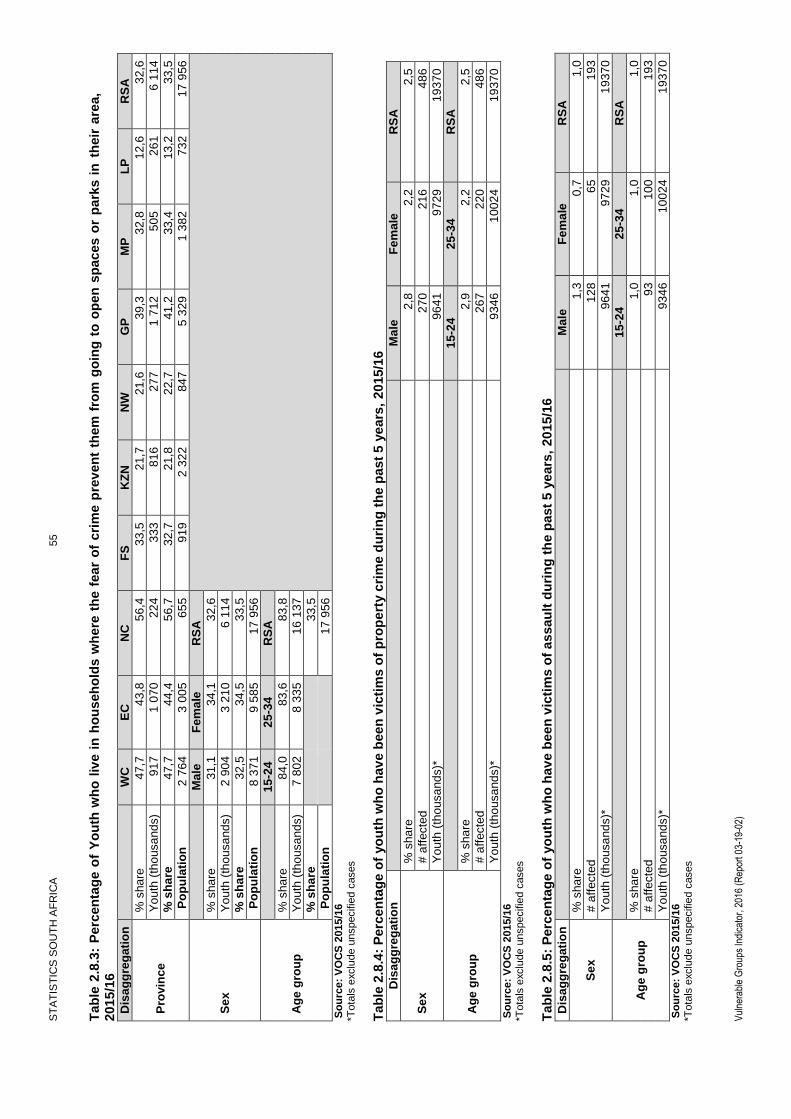
ST
AT
IST
ICS
SO
UT
H A
FR
ICA
55
Vul
nera
ble
Gro
ups
Indi
cato
r, 2
016
(Rep
ort 0
3-19
-02)
Tab
le 2
.8.3
: P
erc
en
tag
e o
f Y
ou
th w
ho
liv
e i
n h
ou
seh
old
s w
here
th
e f
ea
r o
f cri
me p
rev
en
t th
em
fro
m g
oin
g t
o o
pen
sp
aces
or
park
s i
n t
heir
are
a,
2015
/16
D
isa
gg
reg
ati
on
WC
E
C
NC
F
S
KZ
N
NW
G
P
MP
L
P
RS
A
Pro
vin
ce
% s
ha
re
47
,7
43
,8
56
,4
33
,5
21
,7
21
,6
39
,3
32
,8
12
,6
32
,6
Yo
uth
(th
ousa
nd
s)
91
7
1 0
70
22
4
33
3
81
6
27
7
1 7
12
50
5
26
1
6 1
14
% s
ha
re
47
,7
44
,4
56
,7
32
,7
21
,8
22
,7
41
,2
33
,4
13
,2
33
,5
Po
pu
lati
on
(t
ho
us
an
ds
) 2
76
4
3 0
05
65
5
91
9
2 3
22
84
7
5 3
29
1 3
82
73
2
17
956
Se
x
M
ale
F
em
ale
R
SA
% s
ha
re
31
,1
34
,1
32
,6
Yo
uth
(th
ousa
nd
s)
2 9
04
3 2
10
6 1
14
% s
ha
re
32
,5
34
,5
33
,5
Po
pu
lati
on
(t
ho
us
an
ds
) 8
37
1
9 5
85
17
956
Ag
e g
rou
p
1
5-2
4
25
-34
RS
A
% s
ha
re
84
,0
83
,6
83
,8
Yo
uth
(th
ousa
nd
s)
7 8
02
8 3
35
16
137
% s
ha
re
33
,5
Po
pu
lati
on
(t
ho
us
an
ds
)
1
7 9
56
So
urc
e:
VO
CS
2015/1
6
*Tota
ls e
xclu
de u
nspecifie
d c
ases
Tab
le 2
.8.4
: P
erc
en
tag
e o
f yo
uth
wh
o h
av
e b
een
vic
tim
s o
f p
rop
ert
y c
rim
e d
uri
ng
th
e p
ast
5 y
ears
, 20
15/1
6
Dis
ag
gre
gati
on
Ma
le
Fe
ma
le
RS
A
Se
x
% s
ha
re
2,8
2
,2
2,5
# a
ffecte
d
27
0
21
6
48
6
Yo
uth
(th
ousa
nd
s)*
9
64
1
97
29
19
37
0
Ag
e g
rou
p
1
5-2
4
25
-34
RS
A
% s
ha
re
2,9
2
,2
2,5
# a
ffecte
d
26
7
22
0
48
6
Yo
uth
(th
ousa
nd
s)*
9
34
6
10
02
4
19
37
0
So
urc
e:
VO
CS
2015/1
6
*Tota
ls e
xclu
de u
nspecifie
d c
ases
Tab
le 2
.8.5
: P
erc
en
tag
e o
f yo
uth
wh
o h
av
e b
een
vic
tim
s o
f as
sau
lt d
uri
ng
th
e p
ast
5 y
ears
, 20
15/1
6
Dis
ag
gre
gati
on
Ma
le
Fe
ma
le
RS
A
Se
x
% s
ha
re
1,3
0
,7
1,0
# a
ffecte
d
12
8
65
19
3
Yo
uth
(th
ousa
nd
s)*
9
64
1
97
29
19
37
0
Ag
e g
rou
p
1
5-2
4
25
-34
RS
A
% s
ha
re
1,0
1
,0
1,0
# a
ffecte
d
93
10
0
19
3
Yo
uth
(th
ousa
nd
s)*
9
34
6
10
02
4
19
37
0
So
urc
e:
VO
CS
2015/1
6
*Tota
ls e
xclu
de u
nspecifie
d c
ases

ST
AT
IST
ICS
SO
UT
H A
FR
ICA
56
Vul
nera
ble
Gro
ups
Indi
cato
r, 2
016
(Rep
ort 0
3-19
-02)
IND
ICA
TO
RS
: W
OM
EN
W
om
en a
re d
efined a
s the
fem
ale
pop
ula
tion.
3.1
Dem
og
rap
hy o
f w
om
en
T
ab
le 3
.1.1
: P
erc
en
tag
e d
istr
ibu
tio
n o
f th
e f
em
ale
po
pu
lati
on
, 201
6
Dis
ag
gre
gati
on
WC
E
C
NC
F
S
KZ
N
NW
G
P
MP
L
P
RS
A
Pro
vin
ce
N(‘
00
0)
3
23
6
3 5
18
60
9
1 4
59
5 6
14
1 8
81
6 7
09
2 1
90
2 9
86
28
202
%
11
,5
12
,5
2,2
5
,2
19
,9
6,7
2
3,8
7
,8
10
,6
10
0,0
Ge
o-t
yp
e
U
rba
n
Ru
ral
RS
A
N(‘
00
0)
1
7 9
20
10
282
28
202
%
63
,5
36
,5
10
0,0
Ag
e g
rou
p
0-4
5
-14
15
-24
25
-34
35
-44
45
-54
55
-64
65
-74
75
+
RS
A
N(‘
00
0)
2
54
3
5 1
34
5 1
37
4 7
43
3 8
92
2 8
14
1 9
80
1 3
25
63
3
28
202
%
9,0
1
8,2
1
8,2
1
6,8
1
3,8
1
0,0
7
,0
4,7
2
,2
10
0,0
Po
pu
lation
g
rou
p
B
lac
k
Afr
ica
n
Co
lou
red
In
dia
n/
As
ian
W
hit
e
RS
A
N(‘
00
0)
2
2 6
48
2 5
33
68
4
2 3
37
28
202
%
80
,3
9,0
2
,4
8,3
1
00
,0
S
ou
rce:
GH
S 2
016
Tab
le 3
.1.2
: P
erc
en
tag
e d
istr
ibu
tio
n o
f w
om
en
(18 y
ears
an
d a
bo
ve)
by t
he
ir m
ari
tal
sta
tus,
201
6
Dis
ag
gre
gati
on
WC
E
C
NC
F
S
KZ
N
NW
G
P
MP
L
P
RS
A
Pro
vin
ce
Ma
rrie
d/C
oh
ab
itin
g
49
,9
32
,6
41
,6
45
,0
32
,2
46
,3
49
,1
44
,0
39
,6
42
,2
Wid
ow
/Wid
ow
er/
Div
orc
ed
13
,2
18
,8
14
,6
18
,5
13
,6
11
,5
12
,2
12
,8
17
,5
14
,3
Neve
r m
arr
ied
37
,0
48
,6
43
,8
36
,5
54
,2
42
,2
38
,7
43
,2
42
,9
43
,6
To
tal
(%)
10
0,0
1
00
,0
10
0,0
1
00
,0
10
0,0
1
00
,0
10
0,0
1
00
,0
10
0,0
1
00
,0
To
tal
(‘00
0)
2 3
06
2 2
16
40
6
1 0
06
3 5
88
1 2
26
4 9
06
1 4
25
1 9
04
18
983
Ge
o-t
yp
e
U
rba
n
Ru
ral
RS
A
Ma
rrie
d/C
oh
ab
itin
g
45
,8
35
,0
42
,2
Wid
ow
/Wid
ow
er/
Div
orc
ed
12
,8
17
,3
14
,3
Neve
r m
arr
ied
41
,5
47
,7
43
,6
To
tal
(%)
10
0,0
1
00
,0
10
0,0
To
tal
(‘00
0)
12
646
6 3
38
18
983
S
ou
rce:
GH
S 2
016

ST
AT
IST
ICS
SO
UT
H A
FR
ICA
57
Vul
nera
ble
Gro
ups
Indi
cato
r, 2
016
(Rep
ort 0
3-19
-02)
Tab
le 3
.1.2
: P
erc
en
tag
e d
istr
ibu
tio
n o
f w
om
en
(18 y
ears
an
d a
bo
ve)
by t
he
ir m
ari
tal
sta
tus,
201
6 (
co
nt.
)
Po
pu
lation
g
rou
p
B
lac
k A
fric
an
C
olo
ure
d
Ind
ian
/ A
sia
n
Wh
ite
RS
A
Ma
rrie
d/C
oh
ab
itin
g
37
,9
48
,1
65
,9
64
,1
42
,2
Wid
ow
/Wid
ow
er/
Div
orc
ed
13
,7
13
,5
16
,1
18
,9
14
,3
Neve
r m
arr
ied
48
,4
38
,4
18
,0
17
,0
43
,6
To
tal
(%)
10
0,0
1
00
,0
10
0,0
1
00
,0
10
0,0
To
tal
(‘00
0)
14
847
1 7
72
50
6
1 8
59
18
983
So
urc
e:
GH
S 2
016
3.2
Wo
men
: H
ou
seh
old
ch
ara
cte
risti
cs
T
ab
le 3
.2.1
: P
erc
en
tag
e o
f h
ou
seh
old
s h
ead
ed
by f
em
ale
s a
ged
15 y
ea
rs a
nd
ab
ov
e,
201
6
Dis
ag
gre
gati
on
WC
E
C
NC
F
S
KZ
N
NW
G
P
MP
L
P
RS
A
Pro
vin
ce
% s
ha
re o
f fe
ma
le h
ea
de
d h
ouse
hold
s
37
,2
51
,2
41
,2
43
,5
47
,0
38
,1
34
,1
40
,2
50
,0
41
,4
Hou
se
ho
lds h
ea
ded
by f
em
ale
s
(Th
ou
sa
nds)
68
1
90
1
13
5
40
4
13
31
47
8
16
67
50
5
78
9
68
92
All
Ho
us
eh
old
s (
Th
ou
sa
nd
s)
1 8
30
1 7
59
32
9
92
9
2 8
30
1 2
56
4 8
85
1 2
55
1 5
80
16
654
Ge
o-t
yp
e
U
rba
n
Ru
ral
RS
A
% s
ha
re o
f fe
ma
le h
ea
de
d h
ouse
hold
s
37
,6
49
,8
41
,4
Hou
se
ho
lds h
ea
ded
by f
em
ale
s
(Th
ou
sa
nds)
4 3
26
2 5
66
6 8
92
All
Ho
us
eh
old
s (
Th
ou
sa
nd
s)
11
503
5 1
51
16
654
Po
pu
lation
g
rou
p
Bla
ck
A
fric
an
C
olo
ure
d
Ind
ian
/ A
sia
n
Wh
ite
RS
A
% s
ha
re o
f fe
ma
le h
ea
de
d h
ouse
hold
s
43
,1
40
,8
27
,8
30
,6
41
,4
Hou
se
ho
lds h
ea
ded
by f
em
ale
s
(Th
ou
sa
nds)
5 8
21
47
1
10
5
49
6
6 8
92
All
Ho
us
eh
old
s (
‘00
0)
13
504
1 1
54
37
7
1 6
18
16
654
Ag
e g
rou
p
1
5-2
4
25
-34
35
-44
45
-54
55
-64
65
+
RS
A
% s
ha
re o
f fe
ma
le h
ea
de
d h
ouse
hold
s
37
,6
32
,6
35
,5
42
,3
45
,4
60
,8
41
,4
Hou
se
ho
lds h
ea
ded
by f
em
ale
s
(Th
ou
sa
nds)
29
6
1 1
28
1 4
61
1 5
04
1 1
19
1 3
84
6 8
92
All
Ho
us
eh
old
s (
‘00
0)
78
7
3 4
60
4 1
13
3 5
53
2 4
65
2 2
74
16
654
S
ou
rce:
GH
S 2
016

ST
AT
IST
ICS
SO
UT
H A
FR
ICA
58
Vul
nera
ble
Gro
ups
Indi
cato
r, 2
016
(Rep
ort 0
3-19
-02)
Tab
le 3
.2.2
: P
erc
en
tag
e d
istr
ibu
tio
n o
f m
ale
an
d f
em
ale
-head
ed
ho
useh
old
s b
y h
ou
seh
old
co
mp
os
itio
n,
201
6
Dis
ag
gre
gati
on
WC
E
C
NC
F
S
KZ
N
NW
G
P
MP
L
P
RS
A
Ma
le
Sin
gle
1
8,8
3
3,2
2
3,2
2
5,5
3
3,1
3
5,1
2
4,4
3
3,0
3
3,9
2
8,2
Nucle
ar
58
,2
36
,3
45
,2
50
,0
34
,6
41
,1
54
,6
38
,7
38
,4
46
,3
Exte
nd
ed
19
,1
29
,0
28
,3
22
,5
30
,2
22
,2
19
,1
26
,2
25
,9
23
,4
Com
ple
x
4,0
1
,5
3,3
2
,0
2,0
1
,6
1,8
2
,1
1,8
2
,1
To
tal
(%)
10
0,0
1
00
,0
10
0,0
1
00
,0
10
0,0
1
00
,0
10
0,0
1
00
,0
10
0,0
1
00
,0
Ma
le-h
ea
ded
HH
s (
‘00
0)*
1
14
5
85
7
19
3
52
4
1 4
93
77
5
3 2
02
74
9
79
1
9 7
28
Fe
male
Sin
gle
2
0,4
1
8,5
1
4,8
1
9,0
2
0,2
2
1,5
2
2,4
1
8,4
1
6,5
1
9,9
Nucle
ar
38
,7
25
,4
28
,5
32
,9
24
,2
29
,0
33
,4
28
,5
28
,0
29
,7
Exte
nd
ed
35
,7
54
,3
53
,2
46
,1
54
,0
47
,1
41
,7
51
,6
55
,0
48
,2
Com
ple
x
5,3
1
,8
3,6
2
,0
1,7
2
,3
2,6
1
,5
0,6
2
,2
To
tal
(%)
10
0,0
1
00
,0
10
0,0
1
00
,0
10
0,0
1
00
,0
10
0,0
1
00
,0
10
0,0
1
00
,0
Fe
ma
le-h
ea
de
d H
Hs
(‘0
00
)*
68
1
90
1
13
5
40
2
1 3
29
47
7
1 6
54
50
4
78
7
6 8
70
Ma
le
U
rba
n
Ru
ral
RS
A
Sin
gle
2
6,2
3
3,7
2
8,2
Nucle
ar
51
,0
33
,3
46
,3
Exte
nd
ed
20
,6
31
,2
23
,4
Com
ple
x
2,3
1
,7
2,1
To
tal
(%)
10
0,0
1
00
,0
10
0,0
Ma
le-h
ea
ded
HH
s (
‘00
0)*
7
14
9
2 5
79
9 7
28
Fe
male
Sin
gle
2
2,6
1
5,3
1
9,9
Nucle
ar
32
,5
24
,8
29
,7
Exte
nd
ed
42
,0
58
,7
48
,2
Com
ple
x
2,8
1
,2
2,2
To
tal
(%)
10
0,0
1
00
,0
10
0,0
Fe
ma
le-h
ea
de
d H
Hs
(‘0
00
)*
4 3
11
2 5
59
6 8
70
S
ou
rce:
GH
S 2
016
*Tota
l only
in
clu
des h
ousehold
s h
eaded b
y p
ers
on o
f ages 1
5 y
ears
or
old
er.
*T
ota
l exclu
des u
nspecifie
d v
alu
es

ST
AT
IST
ICS
SO
UT
H A
FR
ICA
59
Vul
nera
ble
Gro
ups
Indi
cato
r, 2
016
(Rep
ort 0
3-19
-02)
Tab
le 3
.2.2
: P
erc
en
tag
e d
istr
ibu
tio
n o
f m
ale
an
d f
em
ale
-head
ed
ho
useh
old
s b
y h
ou
seh
old
co
mp
os
itio
n,
201
6 (
co
nt.
)
Ma
le
1
5-2
4
25
-34
35
-44
45
-54
55
-64
65
+
RS
A
Sin
gle
5
9,5
3
9,4
2
8,3
2
1,8
1
6,8
1
3,1
2
8,2
Nucle
ar
13
,8
42
,3
53
,2
52
,6
44
,7
42
,1
46
,3
Exte
nd
ed
22
,8
16
,1
16
,3
23
,7
36
,6
43
,3
23
,4
Com
ple
x
3,9
2
,2
2,2
2
,0
1,9
1
,5
2,1
To
tal
(%)
10
0,0
1
00
,0
10
0,0
1
00
,0
10
0,0
1
00
,0
10
0,0
Ma
le-h
ea
ded
HH
s (
‘00
0)*
4
88
2 3
28
2 6
45
2 0
39
1 3
42
88
6
9 7
28
Fe
male
Sin
gle
3
8,7
2
9,6
1
7,2
1
3,6
1
4,8
2
1,9
1
9,9
Nucle
ar
16
,5
35
,6
47
,8
33
,3
20
,7
11
,8
29
,7
Exte
nd
ed
38
,2
31
,7
33
,1
51
,6
62
,7
64
,5
48
,2
Com
ple
x
6,7
3
,1
1,9
1
,6
1,8
1
,9
2,2
To
tal
(%)
10
0,0
1
00
,0
10
0,0
1
00
,0
10
0,0
1
00
,0
10
0,0
Fe
ma
le-h
ea
de
d H
Hs
(‘0
00
)*
29
5
1 1
24
1 4
56
1 5
02
1 1
16
1 3
77
6 8
70
Ma
le
B
lac
k A
fric
an
C
olo
ure
d
Ind
ian
/ A
sia
n
Wh
ite
RS
A
Sin
gle
3
3,0
8
,4
8,4
1
2,3
2
8,2
Nucle
ar
40
,1
61
,3
70
,2
73
,6
46
,3
Exte
nd
ed
25
,0
26
,6
18
,8
11
,2
23
,4
Com
ple
x
1,9
3
,7
2,6
2
,9
2,1
To
tal
(%)
10
0,0
1
00
,0
10
0,0
1
00
,0
10
0,0
Ma
le-h
ea
ded
HH
s (
‘00
0)*
7
66
3
68
1
27
2
1 1
12
9 7
28
Fe
male
Sin
gle
1
8,3
9
,5
22
,3
47
,6
19
,9
Nucle
ar
28
,7
40
,2
39
,8
28
,7
29
,7
Exte
nd
ed
51
,1
45
,2
36
,9
19
,5
48
,2
Com
ple
x
1,9
5
,1
1,0
4
,3
2,2
To
tal
(%)
10
0,0
1
00
,0
10
0,0
1
00
,0
10
0,0
Fe
ma
le-h
ea
de
d H
Hs
(‘0
00
)*
5 8
01
47
0
10
5
49
5
6 8
70
So
urc
e:
GH
S 2
016
*Tota
l only
in
clu
des h
ousehold
s h
eaded b
y p
ers
on o
f ages 1
5 y
ears
or
old
er.
*T
ota
l exclu
des u
nspecifie
d v
alu
es

ST
AT
IST
ICS
SO
UT
H A
FR
ICA
60
Vul
nera
ble
Gro
ups
Indi
cato
r, 2
016
(Rep
ort 0
3-19
-02)
Tab
le 3
.2.3
: M
ean
ho
useh
old
siz
e b
y s
ex o
f th
e h
ou
seh
old
head
, 20
16
Dis
ag
gre
gati
on
WC
E
C
NC
F
S
KZ
N
NW
G
P
MP
L
P
RS
A
Pro
vin
ce
Ma
le
3,2
3
,1
3,3
3
,1
3,2
2
,9
3,0
3
,2
3,1
3
,1
Fe
ma
le
3,3
3
,7
4,0
3
,4
4,0
3
,5
3,3
3
,8
3,7
3
,6
Bo
th
3,3
3
,4
3,6
3
,2
3,6
3
,1
3,1
3
,4
3,4
3
,3
Ge
o-t
yp
e
U
rba
n
Ru
ral
RS
A
Ma
le
3,0
3
,3
3,1
Fe
ma
le
3,3
4
,1
3,6
Bo
th
3,1
3
,7
3,3
Ag
e g
rou
p
1
5-2
4
25
-34
35
-44
45
-54
55
-64
65
+
RS
A
Ma
le
1,8
2
,3
3,1
3
,5
3,8
3
,8
3,1
Fe
ma
le
2,3
2
,8
3,5
4
,0
4,1
3
,8
3,6
Bo
th
2,0
2
,5
3,2
3
,7
3,9
3
,8
3,3
So
urc
e:
GH
S 2
016

ST
AT
IST
ICS
SO
UT
H A
FR
ICA
61
Vul
nera
ble
Gro
ups
Indi
cato
r, 2
016
(Rep
ort 0
3-19
-02)
3.3
Wo
men
: In
co
me, p
ov
ert
y, e
co
no
mic
acti
vit
y a
nd
so
cia
l g
ran
ts
Tab
le 3
.3.1
: D
ep
en
den
cy r
ati
os b
y s
ex o
f th
e h
ou
seh
old
head
, 201
6
Dis
ag
gre
gati
on
T
ota
l D
ep
en
de
nc
y r
ati
o
W
C
EC
N
C
FS
K
ZN
N
W
GP
M
P
LP
R
SA
Pro
vin
ce
Ma
le
0,5
7
0,7
4
0,6
8
0,6
5
0,6
0
0,5
4
0,4
6
0,6
1
0,7
5
0,5
9
Fe
male
0
,78
1,3
0
1,1
7
1,1
4
1,1
6
1,1
5
0,8
0
1,2
3
1,3
4
1,1
0
Bo
th
0,6
5
1,0
3
0,8
7
0,8
6
0,8
6
0,7
7
0,5
8
0,8
6
1,0
5
0,8
1
Ge
o-t
yp
e
U
rba
n
Ru
ral
RS
A
Ma
le
0,5
1
0,7
8
0,5
9
Fe
male
0
,87
1,4
5
1,1
0
Bo
th
0,6
5
1,1
2
0,8
1
O
ld-a
ge
dep
en
de
nc
y r
ati
o
Pro
vin
ce
W
C
EC
N
C
FS
K
ZN
N
W
GP
M
P
LP
R
SA
Ma
le
0,1
3
0,1
9
0,1
8
0,1
4
0,1
4
0,1
1
0,0
8
0,1
0
0,1
6
0,1
2
Fe
male
0
,14
0,1
9
0,2
1
0,2
0
0,1
7
0,1
8
0,1
4
0,1
3
0,1
9
0,1
7
Bo
th
0,1
3
0,1
9
0,1
9
0,1
6
0,1
6
0,1
4
0,1
0
0,1
2
0,1
7
0,1
4
Ge
o-t
yp
e
U
rba
n
Ru
ral
RS
A
Ma
le
0,1
0
0,1
7
0,1
2
Fe
male
0
,15
0,2
0
0,1
7
Bo
th
0,1
2
0,1
9
0,1
4
C
hil
d-
de
pe
nd
en
cy r
ati
o
Pro
vin
ce
W
C
EC
N
C
FS
K
ZN
N
W
GP
M
P
LP
R
SA
Ma
le
0,4
5
0,5
6
0,5
0
0,5
1
0,4
6
0,4
3
0,3
8
0,5
1
0,6
0
0,4
7
Fe
male
0
,64
1,1
1
0,2
1
0,9
4
0,9
9
0,9
7
0,6
6
1,1
0
1,1
4
0,9
4
Bo
th
0,5
2
0,8
4
0,6
9
0,7
0
0,7
1
0,6
4
0,4
8
0,7
5
0,8
7
0,6
6
Ge
o-t
yp
e
U
rba
n
Ru
ral
RS
A
Ma
le
0,4
1
0,6
1
0,4
7
Fe
male
0
,72
1,2
5
0,9
4
Bo
th
0,5
3
0,9
3
0,6
6
S
ou
rce:
GH
S 2
016

ST
AT
IST
ICS
SO
UT
H A
FR
ICA
62
Vul
nera
ble
Gro
ups
Indi
cato
r, 2
016
(Rep
ort 0
3-19
-02)
Tab
le 3
.3.1
: D
ep
en
den
cy r
ati
os b
y s
ex o
f th
e h
ou
seh
old
head
, 201
6 (
co
nt.
) D
isa
gg
reg
ati
on
M
ea
n p
rop
ort
ion
of
ch
ild
ren
pe
r h
ou
se
ho
ld
Pro
vin
ce
W
C
EC
N
C
FS
K
ZN
N
W
GP
M
P
LP
R
SA
Ma
le
0,1
9
0,2
1
0,2
1
0,2
1
0,1
8
0,1
8
0,1
8
0,2
1
0,2
4
0,2
0
Fe
ma
le
0,2
5
0,3
6
0,3
5
0,3
3
0,3
3
0,3
3
0,2
6
0,3
6
0,3
7
0,3
2
Bo
th
0,2
1
0,2
8
0,2
6
0,2
6
0,2
5
0,2
4
0,2
1
0,2
8
0,3
1
0,2
5
Ge
o-t
yp
e
U
rba
n
Ru
ral
RS
A
Ma
le
0,1
8
0,2
3
0,2
0
Fe
ma
le
0,2
7
0,3
9
0,3
2
Bo
th
0,2
2
0,3
1
0,2
5
S
ou
rce:
GH
S 2
016
Tab
le 3
.3.2
: P
erc
en
tag
e o
f h
ou
seh
old
s w
ith
ou
t an
em
plo
yed
ho
us
eh
old
me
mb
er
by s
ex
of
ho
useh
old
head
, 2
016
Dis
ag
gre
gati
on
WC
E
C
NC
F
S
KZ
N
NW
G
P
MP
L
P
RS
A
Pro
vin
ce
% s
ha
re o
f m
ale
ho
use
hold
s w
ith
out
an
em
plo
ye
d m
em
be
r 1
5,4
3
0,4
2
6,3
2
2,0
2
2,5
2
5,7
1
2,7
1
9,8
2
6,4
1
9,5
Ma
le h
ea
de
d h
ouse
ho
lds w
itho
ut
an e
mp
loye
d m
em
be
r (T
ho
usa
nds)
17
7
26
1
51
11
6
33
8
20
0
40
7
14
9
21
0
1 9
08
All
ma
le-h
ea
de
d h
ou
se
ho
lds (
Th
ou
san
ds
) 1
14
9
85
8
19
3
52
5
1 5
00
77
8
3 2
19
75
1
79
3
9 7
67
% s
ha
re o
f fe
ma
le h
ou
seh
old
s w
ith
ou
t a
n e
mplo
ye
d m
em
be
r 2
1,4
4
9,7
4
5,4
4
5,7
4
0,2
4
4,1
2
8,1
4
4,6
5
4,9
3
9,4
Fe
male
he
ad
ed
hou
se
ho
lds w
ith
ou
t a
n e
mp
loye
d m
em
be
r (T
ho
usa
nds)
14
6
44
8
61
18
5
53
5
21
1
46
9
22
5
43
4
27
13
All
fe
ma
le-h
ead
ed
ho
us
eh
old
s (
Th
ou
sa
nd
s)
68
2
90
1
13
5
40
4
1 3
31
47
8
1 6
68
50
5
79
0
6 8
95
% s
ha
re o
f h
ouseh
old
s w
ith
ou
t a
n e
mp
loye
d m
em
be
r 1
7,6
4
0,3
3
4,1
3
2,3
3
0,8
3
2,7
1
7,9
2
9,8
4
0,6
2
7,7
Hou
se
ho
lds w
ith
ou
t a
n e
mplo
ye
d m
em
be
r (T
ho
usa
nds)
32
3
70
9
11
2
30
0
87
2
41
1
87
6
37
4
64
3
4 6
21
All
Ho
us
eh
old
s (
Th
ou
sa
nd
s)
1 8
31
1 7
59
32
9
92
9
2 8
31
1 2
56
4 8
88
1 2
56
1 5
83
16
662
So
urc
e:
GH
S 2
016

ST
AT
IST
ICS
SO
UT
H A
FR
ICA
63
Vul
nera
ble
Gro
ups
Indi
cato
r, 2
016
(Rep
ort 0
3-19
-02)
Tab
le 3
.3.2
: P
erc
en
tag
e o
f h
ou
seh
old
s w
ith
ou
t an
em
plo
yed
ho
us
eh
old
me
mb
er
by s
ex
of
ho
useh
old
head
, 2
016(c
on
t.)
Popula
tio
n
gro
up
B
lack A
fric
an
C
olo
ure
d
Ind
ian
/ A
sia
n
Wh
ite
RS
A
% s
hare
of m
ale
household
s w
ithout
an e
mplo
yed m
em
ber
20,6
15,5
12,1
16,5
19,5
Male
headed h
ousehold
s w
ithout an e
mplo
yed m
em
ber
(Th
ousands)
1 5
84
106
33
185
1 9
08
All
male
-he
ad
ed
ho
us
eh
old
s (
Th
ou
san
ds
) 7 6
89
684
272
1 1
23
9 7
67
% s
hare
of fe
ma
le h
ousehold
s w
ithout
an e
mplo
yed m
em
ber
41,4
23,4
19,3
34,7
39,4
Fem
ale
headed h
ousehold
s w
ithout
an e
mplo
yed m
em
ber
(Th
ousands)
2 4
10
110
20
172
2 7
13
All
fem
ale
-he
ad
ed
ho
us
eh
old
s (
Th
ou
san
ds
) 5 8
23
471
105
497
6 8
95
% s
hare
of household
s w
ithout
an e
mplo
yed m
em
ber
29,6
18,7
14,1
22,1
27,7
Household
s w
ithout an e
mplo
yed m
em
ber
(Th
ousands)
3 9
94
216
53
358
4 6
21
All
Ho
us
eh
old
s (
Th
ou
san
ds
) 13 5
12
1 1
54
377
1 6
19
16 6
62
Geo-t
ype
U
rban
R
ura
l R
SA
% s
hare
of m
ale
household
s w
ithout
an e
mplo
yed m
em
ber
14,9
32,3
19,5
Male
headed h
ousehold
s w
ithout an e
mplo
yed m
em
ber
(Th
ousands)
1 0
71
836
1 9
08
All
male
-he
ad
ed
ho
us
eh
old
s (
Th
ou
san
ds
) 7 1
78
2 5
89
9 7
67
% s
hare
of fe
ma
le h
ousehold
s w
ithout
an e
mplo
yed m
em
ber
29,2
56,5
39,4
Fem
ale
headed h
ousehold
s w
ithout
an e
mplo
yed m
em
ber
(Th
ousands)
1 2
63
1 4
50
2 7
13
All
fem
ale
-he
ad
ed
ho
us
eh
old
s (
Th
ou
san
ds
) 4 3
29
2 5
66
6 8
95
% s
hare
of household
s w
ithout
an e
mplo
yed m
em
ber
20,3
44,4
27,7
Household
s w
ithout an e
mplo
yed m
em
ber
(Th
ousands)
2 3
34
2 2
86
4 6
21
All
Ho
us
eh
old
s (
Th
ou
san
ds
) 11 5
07
5 1
55
16 6
62
So
urc
e:
GH
S 2
016
Tab
le 3
.3.3
: P
erc
en
tag
e o
f em
plo
yed
wh
o a
re e
mp
loyers
as a
pro
po
rtio
n o
f th
e o
vera
ll e
mp
loyed
, 20
16
Dis
ag
gre
gati
on
W
C
EC
N
C
FS
K
ZN
N
W
GP
M
P
LP
R
SA
Se
x a
nd
p
rovin
ce
%
sha
re o
f m
ale
em
plo
ye
rs
6,8
4
,3
6,4
3
,4
8,3
7
,0
8,5
6
,6
7,8
7
,3
Ma
le
Ma
le e
mp
loye
rs (
Th
ou
sa
nds)
88
32
12
15
11
0
39
25
0
45
61
65
3
A
ll em
plo
ye
d m
ale
(T
ho
usan
ds)
1 2
91
74
2
18
1
44
7
1 3
33
55
8
2 9
41
67
9
78
8
8 9
60
%
sha
re o
f fe
ma
le e
mp
loye
rs
2,0
1
,3
2,7
2
,2
2,0
1
,7
3,6
2
,3
1,8
2
,5
Fe
ma
le
Fe
male
em
plo
ye
rs (
Th
ousa
nds)
21
9
3
7
24
6
77
11
10
16
9
A
ll em
plo
ye
d f
em
ale
(T
ho
usan
ds)
1 0
25
70
1
12
7
33
4
1 1
63
34
1
2 1
27
49
5
56
1
6 8
73
%
sh
are
of
em
plo
ye
rs
4,7
2
,8
4,8
2
,9
5,4
5
,0
6,5
4
,8
5,3
5
,2
Bo
th
All
em
plo
ye
rs (
Th
ou
sa
nd
s)
10
9
41
15
23
13
4
45
32
8
56
71
82
2
A
ll e
mp
loye
d p
ers
on
s
(Th
ou
san
ds
) 2
31
5
1 4
43
30
8
78
1
2 4
96
90
0
5 0
68
1 1
74
1 3
49
15
833
So
urc
e:
QL
FS
Q3 2
016

ST
AT
IST
ICS
SO
UT
H A
FR
ICA
64
Vul
nera
ble
Gro
ups
Indi
cato
r, 2
016
(Rep
ort 0
3-19
-02)
Tab
le 3
.3.3
: P
erc
en
tag
e o
f em
plo
yed
wh
o a
re e
mp
loyers
as a
pro
po
rtio
n o
f th
e o
vera
ll e
mp
loyed
, 20
16 (
co
nt.
)
Se
x a
nd
p
op
ula
tio
n
gro
up
Bla
ck
Afr
ica
n
Co
lou
red
In
dia
n/A
sia
n
Wh
ite
RS
A
Ma
le
% s
ha
re o
f m
ale
em
plo
ye
rs
5,4
4
,2
14
,7
19
,3
7,3
M
ale
em
plo
ye
rs (
Th
ou
sa
nds)
36
1
38
50
20
5
65
3
A
ll em
plo
ye
d m
ale
(T
ho
usan
ds)
6 6
66
89
0
34
1
1 0
63
8 9
60
Fe
male
%
sha
re o
f fe
ma
le e
mp
loye
rs
1,9
1
,2
5,1
6
,1
2,5
F
em
ale
em
plo
ye
rs (
Th
ousa
nds)
99
9
9
52
16
9
A
ll em
plo
ye
d f
em
ale
(T
ho
usan
ds)
5 0
99
75
1
18
1
84
2
6 8
73
Bo
th
% s
ha
re o
f e
mp
loye
rs
3,9
2
,8
11
,4
13
,5
5,2
A
ll e
mp
loye
rs (
Th
ou
sa
nd
s)
45
9
47
59
25
7
82
2
A
ll e
mp
loye
d p
ers
on
s
(Th
ou
san
ds
) 1
1 7
65
1 6
42
52
2
1 9
05
15
833
Se
x a
nd
g
eo
-typ
e
Urb
an
R
ura
l R
SA
Ma
le
% s
ha
re o
f m
ale
em
plo
ye
rs
7,1
8
,0
7,3
M
ale
em
plo
ye
rs (
Th
ou
sa
nds)
48
6
16
8
65
3
A
ll em
plo
ye
d m
ale
(T
ho
usan
ds)
6 8
66
2 0
94
8 9
60
Fe
male
%
sha
re o
f fe
ma
le e
mp
loye
rs
2,6
2
,0
2,5
F
em
ale
em
plo
ye
rs (
Th
ousa
nds)
13
8
31
16
9
A
ll em
plo
ye
d f
em
ale
(T
ho
usan
ds)
5 3
14
1 5
58
6 8
73
Bo
th
% s
ha
re o
f e
mp
loye
rs
5,1
5
,4
5,2
A
ll e
mp
loye
rs (
Th
ou
sa
nd
s)
62
4
19
8
82
2
A
ll e
mp
loye
d p
ers
on
s
(Th
ou
san
ds
) 1
2 1
80
3 6
53
15
833
Se
x a
nd
a
ge
gro
up
15
-34
3
5+
R
SA
Ma
le
% s
ha
re o
f m
ale
em
plo
ye
rs
4,5
9
,3
7,3
M
ale
em
plo
ye
rs (
Th
ou
sa
nds)
16
4
48
9
65
3
A
ll em
plo
ye
d m
ale
(T
ho
usan
ds)
3 6
72
5 2
88
8 9
60
Fe
male
%
sha
re o
f fe
ma
le e
mp
loye
rs
1,3
3
,1
2,5
F
em
ale
em
plo
ye
rs (
Th
ousa
nds)
33
13
6
16
9
A
ll em
plo
ye
d f
em
ale
(T
ho
usan
ds)
2 4
89
4 3
84
6 8
73
Bo
th
% s
ha
re o
f e
mp
loye
rs
3,2
6
,5
5,2
A
ll e
mp
loye
rs (
Th
ou
sa
nd
s)
19
7
62
5
82
2
A
ll e
mp
loye
d p
ers
on
s
(Th
ou
san
ds
) 6
16
1
9 6
72
15
833
So
urc
e:
QL
FS
Q3 2
016

ST
AT
IST
ICS
SO
UT
H A
FR
ICA
65
Vul
nera
ble
Gro
ups
Indi
cato
r, 2
016
(Rep
ort 0
3-19
-02)
Tab
le 3
.3.4
: P
erc
en
tag
e o
f em
plo
yed
wh
o a
re o
wn
-acco
un
t w
ork
ers
as a
pro
po
rtio
n t
he e
mp
loyed
, 20
16
Dis
ag
gre
gati
on
W
C
EC
N
C
FS
K
ZN
N
W
GP
M
P
LP
R
SA
Sex a
nd
pro
vin
ce
%
share
of m
ale
ow
n a
ccount w
ork
ers
6,2
11,9
4,6
10,7
8,1
7,7
10,0
8,5
11,4
9,0
Male
M
ale
ow
n a
ccount
work
ers
(T
housands)
79
88
8
48
108
43
294
57
90
816
A
ll em
plo
yed m
ale
(T
housands)
1 2
91
742
181
447
1 3
33
558
2 9
41
679
788
8 9
60
%
share
of fe
ma
le o
wn a
ccount
work
ers
5,3
11,0
2,6
8,6
10,6
7,6
7,7
12,0
14,2
9,1
Fem
ale
F
em
ale
ow
n a
ccount
work
ers
(T
housands)
55
77
3
29
123
26
164
59
79
615
A
ll em
plo
yed f
em
ale
(T
housands)
1 0
25
701
127
334
1 1
63
341
2 1
27
495
561
6 8
73
%
sh
are
of
ow
n a
cco
un
t w
ork
ers
5,8
11,5
3,8
9,8
9,2
7,6
9,0
10,0
12,6
9,0
Bo
th
All
ow
n a
cco
un
t w
ork
ers
(T
ho
usan
ds)
134
166
12
77
230
69
458
117
170
1 4
31
A
ll e
mp
loyed
pe
rso
ns
(T
ho
us
an
ds)
2 3
15
1 4
43
308
781
2 4
96
900
5 0
68
1 1
74
1 3
49
15 8
33
Sex a
nd g
eo-
type
Urb
an
R
ura
l R
SA
%
share
of m
ale
ow
n a
ccount w
ork
ers
7,2
10,5
9,0
Male
M
ale
ow
n a
ccount
work
ers
(T
housands)
264
553
816
A
ll em
plo
yed m
ale
(T
housands)
3 6
72
5 2
88
8 9
60
%
share
of fe
ma
le o
wn a
ccount
work
ers
5,8
10,8
9,1
Fem
ale
F
em
ale
ow
n a
ccount
work
ers
(T
housands)
143
471
615
A
ll em
plo
yed f
em
ale
(T
housands)
2 4
89
4 3
84
6 8
73
%
sh
are
of
ow
n a
cco
un
t w
ork
ers
8,2
11,8
9,0
Bo
th
All
ow
n a
cco
un
t w
ork
ers
(T
ho
usan
ds
) 999
432
1 4
31
A
ll e
mp
loyed
pe
rso
ns
(T
ho
us
an
ds
) 12 1
80
3 6
53
15 8
33
Sex a
nd
Popula
tio
n
gro
up
Bla
ck
Afr
ican
C
olo
ure
d
Ind
ian
/Asia
n
Wh
ite
RS
A
%
share
of m
ale
ow
n a
ccount w
ork
ers
10,0
4,9
9,0
7,3
9,0
Male
M
ale
ow
n a
ccount
work
ers
(T
housands)
665
43
31
78
816
A
ll em
plo
yed m
ale
(T
housands)
6 6
66
890
341
1 0
63
8 9
60
%
share
of fe
ma
le o
wn a
ccount
work
ers
10,1
2,7
4,8
8,3
9,1
Fem
ale
F
em
ale
ow
n a
ccount
work
ers
(T
housands)
516
21
9
70
615
A
ll em
plo
yed f
em
ale
(T
housands)
5 0
99
751
181
842
6 8
73
%
sh
are
of
ow
n a
cco
un
t w
ork
ers
10,0
3,9
7,5
7,7
9,0
Bo
th
All
ow
n a
cco
un
t w
ork
ers
(T
ho
usan
ds
) 1 1
81
64
39
148
1 4
31
A
ll e
mp
loyed
pe
rso
ns
(T
ho
us
an
ds
) 11 7
65
1 6
42
522
1 9
05
15 8
33
So
urc
e:
QL
FS
Q3 2
016

ST
AT
IST
ICS
SO
UT
H A
FR
ICA
66
Vul
nera
ble
Gro
ups
Indi
cato
r, 2
016
(Rep
ort 0
3-19
-02)
Tab
le 3
.3.4
: P
erc
en
tag
e o
f em
plo
yed
wh
o a
re o
wn
-acco
un
t w
ork
ers
as a
pro
po
rtio
n t
he e
mp
loyed
, 20
16 (
co
nt.
)
Se
x
an
d
ag
e
gro
up
15
-34
3
5+
R
SA
%
sha
re o
f m
ale
ow
n a
ccou
nt w
ork
ers
7
,2
10
,5
9,0
Ma
le
Ma
le o
wn
acco
un
t w
ork
ers
(T
ho
usan
ds)
26
4
55
3
81
6
A
ll em
plo
ye
d m
ale
(T
ho
usan
ds)
3 6
72
5 2
88
8 9
60
%
sha
re o
f fe
ma
le o
wn
acco
un
t w
ork
ers
5
,8
10
,8
9,1
Fe
male
F
em
ale
ow
n a
cco
un
t w
ork
ers
(T
ho
usa
nds)
14
3
47
1
61
5
A
ll em
plo
ye
d f
em
ale
(T
ho
usan
ds)
2 4
89
4 3
84
6 8
73
%
sh
are
of
ow
n a
cc
ou
nt
wo
rke
rs
6,6
1
0,6
9
,0
Bo
th
All
ow
n a
cco
un
t w
ork
ers
(T
ho
us
an
ds
) 4
07
1 0
24
1 4
31
A
ll e
mp
loye
d p
ers
on
s (
Th
ou
sa
nd
s)
6 1
61
9 6
72
15
833
So
urc
e:
QL
FS
Q3 2
016
Tab
le 3
.3.5
: P
erc
en
tag
e o
f em
plo
yed
wh
o a
re w
ork
ing
as c
on
trib
uti
ng
fam
ily m
em
bers
as
a p
rop
ort
ion
th
e e
mp
loyed
, 20
16
Dis
ag
gre
gati
on
W
C
EC
N
C
FS
K
ZN
N
W
GP
M
P
LP
R
SA
Se
x a
nd
p
rovin
ce
%
sha
re o
f m
ale
s w
ork
ing
as c
on
trib
uting
fam
ily m
em
be
rs
0,1
0
,5
0,0
0
,1
0,5
0
,2
0,2
0
,1
0,5
0
,2
Ma
le
Ma
les w
ork
ing
as c
on
trib
utin
g fa
mily
mem
be
rs (
Th
ou
sa
nds)
1
4
0
1
6
1
4
1
4
22
A
ll em
plo
ye
d m
ale
(T
ho
usan
ds)
1 2
91
74
2
18
1
44
7
1 3
33
55
8
2 9
41
67
9
78
8
8 9
60
%
sha
re o
f fe
ma
les w
ork
ing
as c
on
trib
utin
g f
am
ily m
em
be
rs
0,2
0
,6
0,6
1
,0
0,7
0
,3
0,7
0
,6
1,5
0
,7
Fe
male
F
em
ale
s w
ork
ing
as c
on
trib
utin
g f
am
ily m
em
be
rs (
Th
ou
san
ds)
2
4
1
3
8
1
16
3
8
46
A
ll em
plo
ye
d f
em
ale
(T
ho
usan
ds)
1 0
25
70
1
12
7
33
4
1 1
63
34
1
2 1
27
49
5
56
1
6 8
73
%
sh
are
of
pe
rso
ns
wo
rkin
g a
s c
on
trib
uti
ng
fa
mil
y
me
mb
ers
0
,1
0,6
0
,3
0,5
0
,6
0,2
0
,4
0,3
0
,9
0,4
Bo
th
All
pe
rso
ns
wo
rkin
g a
s c
on
trib
uti
ng
fam
ily m
em
be
rs
(Th
ou
san
ds
) 2
8
1
4
1
4
2
20
4
12
68
A
ll e
mp
loye
d p
ers
on
s (
Th
ou
sa
nd
s)
2 3
15
1 4
43
30
8
78
1
2 4
96
90
0
5 0
68
1 1
74
1 3
49
15
833
So
urc
e:
QL
FS
Q3 2
016

ST
AT
IST
ICS
SO
UT
H A
FR
ICA
67
Vul
nera
ble
Gro
ups
Indi
cato
r, 2
016
(Rep
ort 0
3-19
-02)
Tab
le 3
.3.5
: P
erc
en
tag
e o
f em
plo
yed
wh
o a
re w
ork
ing
as c
on
trib
uti
ng
fam
ily m
em
bers
as
a p
rop
ort
ion
th
e e
mp
loyed
, 20
16 (
co
nt.
)
Se
x a
nd
P
op
ula
tion
g
rou
p
Bla
ck
A
fric
an
C
olo
ure
d
Ind
ian
/As
ian
W
hit
e
RS
A
Ma
le
% s
ha
re o
f m
ale
s w
ork
ing
as c
on
trib
uting
fam
ily m
em
be
rs
0,2
0
,0
1,3
0
,2
0,2
M
ale
s w
ork
ing
as c
on
trib
utin
g fa
mily
mem
be
rs (
Th
ou
sa
nds)
16
0
4
2
22
A
ll em
plo
ye
d m
ale
(T
ho
usan
ds)
6 6
66
89
0
34
1
1 0
63
8 9
60
Fe
male
%
sha
re o
f fe
ma
les w
ork
ing
as c
on
trib
utin
g f
am
ily m
em
be
rs
0,7
0
,3
0,7
0
,8
0,7
F
em
ale
s w
ork
ing
as c
on
trib
utin
g f
am
ily m
em
be
rs (
Th
ou
san
ds)
36
2
1
7
46
A
ll em
plo
ye
d f
em
ale
(T
ho
usan
ds)
5 0
99
75
1
18
1
84
2
6 8
73
Bo
th
% s
ha
re o
f p
ers
on
s w
ork
ing
as
co
ntr
ibu
tin
g f
am
ily m
em
be
rs
0,4
0
,1
1,1
0
,4
0,4
A
ll p
ers
on
s w
ork
ing
as
co
ntr
ibu
tin
g f
am
ily m
em
be
rs
(Th
ou
san
ds
) 5
2
2
6
8
68
A
ll e
mp
loye
d p
ers
on
s (
Th
ou
sa
nd
s)
11
765
1 6
42
52
2
1 9
05
15
833
Se
x a
nd
a
ge
gro
up
15
-34
3
5+
R
SA
Ma
le
% s
ha
re o
f m
ale
s w
ork
ing
as c
on
trib
uting
fam
ily m
em
be
rs
0,5
0
,1
0,2
M
ale
s w
ork
ing
as c
on
trib
utin
g fa
mily
mem
be
rs (
Th
ou
sa
nds)
18
4
22
A
ll em
plo
ye
d m
ale
(T
ho
usan
ds)
3 6
72
5 2
88
8 9
60
Fe
male
%
sha
re o
f fe
ma
les w
ork
ing
as c
on
trib
utin
g f
am
ily m
em
be
rs
0,8
0
,6
0,7
F
em
ale
s w
ork
ing
as c
on
trib
utin
g f
am
ily m
em
be
rs (
Th
ou
san
ds)
20
26
46
A
ll em
plo
ye
d f
em
ale
(T
ho
usan
ds)
2 4
89
4 3
84
6 8
73
Bo
th
% s
ha
re o
f p
ers
on
s w
ork
ing
as
co
ntr
ibu
tin
g f
am
ily m
em
be
rs
0,6
0
,3
0,4
A
ll p
ers
on
s w
ork
ing
as
co
ntr
ibu
tin
g f
am
ily m
em
be
rs
(Th
ou
san
ds
) 3
8
30
68
A
ll e
mp
loye
d p
ers
on
s (
Th
ou
sa
nd
s)
6 1
61
9 6
72
15
833
So
urc
e:
QL
FS
Q3 2
016

ST
AT
IST
ICS
SO
UT
H A
FR
ICA
68
Vul
nera
ble
Gro
ups
Indi
cato
r, 2
016
(Rep
ort 0
3-19
-02)
Tab
le 3
.3.6
: P
erc
en
tag
e d
istr
ibu
tio
n e
mp
loyed
pers
on
s b
y s
ex,
2016
Dis
ag
gre
gati
on
W
C
EC
N
C
FS
K
ZN
N
W
GP
M
P
LP
R
SA
Pro
vin
ce
Ma
le
Fo
rmal
75
,6
61
,9
56
,9
60
,5
69
,1
74
,1
79
,5
65
,9
56
,7
71
,2
Info
rma
l 1
1,3
2
6,7
1
3,3
1
9,5
2
0,0
1
5,1
1
6,7
2
2,1
2
8,4
1
8,7
Ag
ricultu
re
10
,5
8,3
2
5,9
1
2,1
7
,9
7,0
1
,2
9,8
1
0,7
7
,0
Dom
estic W
ork
ers
2
,6
3,1
3
,9
7,9
3
,0
3,7
2
,6
2,2
4
,3
3,2
To
tal
(%)
10
0,0
1
00
,0
10
0,0
1
00
,0
10
0,0
1
00
,0
10
0,0
1
00
,0
10
0,0
1
00
,0
All
em
plo
ye
d m
ale
s (
‘00
0)
1 2
91
74
2
18
1
44
7
1 3
33
55
8
2 9
41
67
9
78
8
8 9
60
Fe
male
Fo
rmal
73
,3
62
,4
67
,5
62
,1
64
,9
65
,1
76
,0
57
,8
52
,2
67
,7
Info
rma
l 8
,7
19
,2
11
,0
17
,6
15
,1
15
,0
10
,1
19
,7
24
,0
14
,1
Ag
ricultu
re
6,0
5
,5
6,8
1
,6
3,1
2
,7
0,6
6
,7
9,0
3
,7
Dom
estic W
ork
ers
1
2,1
1
3,0
1
4,7
1
8,7
1
6,9
1
7,2
1
3,4
1
5,8
1
4,8
1
4,5
To
tal
(%)
10
0,0
1
00
,0
10
0,0
1
00
,0
10
0,0
1
00
,0
10
0,0
1
00
,0
10
0,0
1
00
,0
All
em
plo
ye
d f
em
ale
s (
‘00
0)
1 0
25
70
1
12
7
33
4
1 1
63
34
1
2 1
27
49
5
56
1
6 8
73
Ge
o-t
yp
e
Urb
an
N
on
-u
rba
n
RS
A
Ma
le
Fo
rmal
78
,4
47
,5
71
,2
Info
rma
l 1
6,0
2
7,5
1
8,7
Ag
ricultu
re
2,6
2
1,5
7
,0
Dom
estic W
ork
ers
3
,1
3,5
3
,2
To
tal
(%)
10
0,0
1
00
,0
10
0,0
All
em
plo
ye
d m
ale
s (
‘00
0)
6 8
66
2 0
94
8 9
60
Fe
male
Fo
rmal
73
,1
49
,4
67
,7
Info
rma
l 1
1,7
2
2,3
1
4,1
Ag
ricultu
re
1,5
1
1,1
3
,7
Dom
estic W
ork
ers
1
3,7
1
7,1
1
4,5
To
tal
(%)
10
0,0
1
00
,0
10
0,0
All
em
plo
ye
d f
em
ale
s (
‘00
0)
5 3
14
1 5
58
6 8
73
S
ou
rce:
QL
FS
Q3 2
016

ST
AT
IST
ICS
SO
UT
H A
FR
ICA
69
Vul
nera
ble
Gro
ups
Indi
cato
r, 2
016
(Rep
ort 0
3-19
-02)
Tab
le 3
.3.6
: P
erc
en
tag
e d
istr
ibu
tio
n e
mp
loyed
pers
on
s b
y s
ex,
2016
(co
nt.
)
Po
pu
lation
g
rou
p
Bla
ck
Afr
ica
n
Co
lou
red
In
dia
n/A
sia
n
Wh
ite
RS
A
Ma
le
Fo
rmal
67
,4
72
,0
85
,7
89
,6
71
,2
Info
rma
l 2
1,9
1
1,7
1
4,1
5
,6
18
,7
Ag
ricultu
re
6,8
1
3,7
0
,3
4,9
7
,0
Dom
estic W
ork
ers
3
,9
2,6
0
,0
0,0
3
,2
To
tal
(%)
10
0,0
1
00
,0
10
0,0
1
00
,0
10
0,0
All
em
plo
ye
d m
ale
s (
‘00
0)
6 6
66
89
0
34
1
1 0
63
8 9
60
Fe
male
Fo
rmal
62
,1
74
,2
92
,3
90
,6
67
,7
Info
rma
l 1
6,4
8
,1
6,4
7
,2
14
,1
Ag
ricultu
re
3,8
5
,9
0,2
1
,9
3,7
Dom
estic W
ork
ers
1
7,7
1
1,8
1
,2
0,3
1
4,5
To
tal
(%)
10
0,0
1
00
,0
10
0,0
1
00
,0
10
0,0
All
em
plo
ye
d f
em
ale
s (
‘00
0)
5 0
99
75
1
18
1
84
2
6 8
73
Ag
e g
rou
p
15
-34
3
5+
R
SA
Ma
le
Fo
rmal
69
,2
72
,6
71
,2
Info
rma
l 2
0,3
1
7,5
1
8,7
Ag
ricultu
re
7,8
6
,5
7,0
Dom
estic W
ork
ers
2
,7
3,5
3
,2
To
tal
(%)
10
0,0
1
00
,0
10
0,0
All
em
plo
ye
d m
ale
s (
‘00
0)
3 6
72
5 2
88
8 9
60
Fe
male
Fo
rmal
74
,8
63
,7
67
,7
Info
rma
l 1
2,6
1
5,0
1
4,1
Ag
ricultu
re
4,6
3
,2
3,7
Dom
estic W
ork
ers
7
,9
18
,2
14
,5
To
tal
(%)
10
0,0
1
00
,0
10
0,0
All
em
plo
ye
d f
em
ale
s (
‘00
0)
2 4
89
4 3
84
6 8
73
So
urc
e:
QL
FS
Q3 2
016

ST
AT
IST
ICS
SO
UT
H A
FR
ICA
70
Vul
nera
ble
Gro
ups
Indi
cato
r, 2
016
(Rep
ort 0
3-19
-02)
Tab
le 3
.3.7
: L
ab
ou
r fo
rce
part
icip
ati
on
rate
s f
or
pe
rso
ns a
ged
15
-64
ye
ars
, 2
016
Dis
ag
gre
gati
on
WC
E
C
NC
F
S
KZ
N
NW
G
P
MP
L
P
RS
A
Pro
vin
ce
15
-34
56
,5
34
,9
46
,4
48
,9
34
,1
37
,5
60
,0
47
,3
28
,9
44
,4
35
+
63
,0
56
,4
50
,0
64
,6
52
,6
47
,0
73
,4
60
,3
56
,4
61
,2
To
tal
59
,8
44
,6
48
,1
56
,1
42
,1
42
,0
66
,8
53
,0
40
,5
52
,3
Ge
o-t
yp
e
U
rba
n
Ru
ral
RS
A
15
-34
53
,5
28
,5
44
,4
35
+
67
,0
47
,6
61
,2
To
tal
60
,1
36
,6
52
,3
Po
pu
lation
gro
up
Bla
ck
A
fric
an
C
olo
ure
d
Ind
ian
/As
ian
W
hit
e
RS
A
15
-34
42
,9
54
,2
48
,4
51
,0
44
,4
35
+
62
,0
57
,8
42
,6
63
,9
61
,2
To
tal
51
,4
56
,1
45
,2
59
,0
52
,3
S
ou
rce:
QL
FS
Q3 2
016
Tab
le 3
.3.8
: F
em
ale
un
em
plo
ym
en
t ra
te,
20
16
Dis
ag
gre
gati
on
WC
E
C
NC
F
S
KZ
N
NW
G
P
MP
L
P
RS
A
Pro
vin
ce
15
-34
34
,6
38
,5
48
,6
52
,3
39
,6
51
,7
45
,4
50
,8
42
,5
43
,4
35
+
14
,1
18
,3
13
,3
26
,2
11
,5
16
,5
21
,7
17
,7
15
,5
17
,8
To
tal
23
,5
26
,9
31
,5
38
,4
24
,4
33
,0
32
,1
34
,4
26
,6
29
,3
Ge
o-t
yp
e
U
rba
n
Ru
ral
RS
A
15
-34
41
,6
49
,4
43
,4
35
+
18
,1
16
,6
17
,8
To
tal
28
,7
31
,3
29
,3
Po
pu
lation
gro
up
Bla
ck
A
fric
an
C
olo
ure
d
Ind
ian
/ A
sia
n
Wh
ite
RS
A
15
-34
47
,7
36
,2
26
,6
8,1
4
3,4
35
+
20
,4
12
,6
7,4
6
,3
17
,8
To
tal
33
,1
23
,4
16
,6
6,9
2
9,3
So
urc
e:
QL
FS
Q3 2
016

ST
AT
IST
ICS
SO
UT
H A
FR
ICA
71
Vul
nera
ble
Gro
ups
Indi
cato
r, 2
016
(Rep
ort 0
3-19
-02)
Tab
le 3
.3.9
: F
em
ale
lab
ou
r ab
so
rpti
on
rate
, 20
16
Dis
ag
gre
gati
on
WC
E
C
NC
F
S
KZ
N
NW
G
P
MP
L
P
RS
A
Pro
vin
ce
15
-34
37
,0
21
,5
23
,9
23
,3
20
,6
18
,1
32
,8
23
,3
16
,6
25
,2
35
+
54
,1
46
,1
43
,4
47
,7
46
,6
39
,3
57
,4
49
,7
47
,6
50
,3
To
tal
45
,7
32
,6
33
,0
34
,6
31
,9
28
,1
45
,3
34
,7
29
,7
36
,9
Ge
o-t
yp
e
U
rba
n
Ru
ral
RS
A
15
-34
31
,2
14
,4
25
,2
35
+
54
,9
39
,7
50
,3
To
tal
42
,8
25
,1
36
,9
Po
pu
lation
gro
up
B
lac
k A
fric
an
C
olo
ure
d
Ind
ian
/ A
sia
n
Wh
ite
RS
A
15
-34
22
,4
34
,6
35
,5
46
,9
25
,2
35
+
49
,3
50
,6
39
,5
59
,8
50
,3
To
tal
34
,3
43
,0
37
,7
55
,0
36
,9
S
ou
rce:
QL
FS
Q3 2
016
Tab
le 3
.3.1
0:
Fem
ale
eco
no
mic
in
acti
vit
y r
ate
, 201
6
Dis
ag
gre
gati
on
WC
E
C
NC
F
S
KZ
N
NW
G
P
MP
L
P
RS
A
Pro
vin
ce
15
-34
43
,5
65
,1
53
,6
51
,1
65
,9
62
,5
40
,0
52
,7
71
,1
55
,6
35
+
37
,0
43
,6
50
,0
35
,4
47
,4
53
,0
26
,6
39
,7
43
,6
38
,8
To
tal
40
,2
55
,4
51
,9
43
,9
57
,9
58
,0
33
,2
47
,0
59
,5
47
,7
Ge
o-t
yp
e
U
rba
n
Ru
ral
RS
A
15
-34
46
,5
71
,5
55
,6
35
+
33
,0
52
,4
38
,8
To
tal
39
,9
63
,4
47
,7
Po
pu
lation
gro
up
B
lac
k A
fric
an
C
olo
ure
d
Ind
ian
/ A
sia
n
Wh
ite
RS
A
15
-34
57
,1
45
,8
51
,6
49
,0
55
,6
35
+
38
,0
42
,2
57
,4
36
,1
38
,8
To
tal
48
,6
43
,9
54
,8
41
,0
47
,7
S
ou
rce:
QL
FS
Q3 2
016

ST
AT
IST
ICS
SO
UT
H A
FR
ICA
72
Vul
nera
ble
Gro
ups
Indi
cato
r, 2
016
(Rep
ort 0
3-19
-02)
Tab
le 3
.3.1
1:
Gen
der
pari
ty r
ati
os
in
in
co
me e
arn
ing
s,
20
16
D
isa
gg
reg
ati
on
WC
E
C
NC
F
S
KZ
N
NW
G
P
MP
L
P
RS
A
Pro
vin
ce
R1
-R15
00
1
,42
1,4
1
2,2
7
0,9
8
1,6
8
1,1
2
0,9
3
1,3
2
1,2
0
1,2
4
R15
01
-R250
0
0,9
3
0,9
8
0,6
5
0,9
2
0,8
8
0,7
6
0,9
3
1,0
2
0,8
5
0,9
0
R25
01
-R350
0
0,7
4
0,6
1
0,7
5
0,6
2
0,7
2
0,6
7
0,9
3
0,6
6
0,6
1
0,7
4
R35
01
-R550
0
0,5
5
0,7
8
0,1
8
0,6
7
0,4
8
0,3
5
0,5
4
0,6
6
0,3
2
0,5
3
R55
01
-R750
0
0,6
0
0,7
8
0,2
9
0,7
2
0,6
8
0,3
6
0,5
7
0,2
5
0,4
5
0,5
5
R75
01
-R115
00
0
,57
1,2
1
0,8
3
0,4
0
0,4
8
0,3
1
0,5
7
0,4
7
0,5
9
0,5
5
R11
50
1+
0
,52
0,8
5
0,5
1
0,5
2
0,7
7
0,5
3
0,6
2
0,5
5
0,5
4
0,6
2
Ge
o-t
yp
e
U
rba
n
Ru
ral
RS
A
R1
-R15
00
1
,13
1,4
6
1,2
5
R15
01
-R250
0
1,0
1
0,7
1
0,9
0
R25
01
-R350
0
0,8
1
0,5
8
0,7
5
R35
01
-R550
0
0,5
6
0,4
4
0,5
3
R55
01
-R750
0
0,5
8
0,3
9
0,5
5
R75
01
-R115
00
0
,60
0,3
6
0,5
5
R11
50
1+
0
,64
0,4
8
0,6
2
Po
pu
lation
gro
up
B
lac
k
Afr
ica
n
Co
lou
red
In
dia
n/A
sia
n
Wh
ite
RS
A
R1
-R15
00
1
,29
1,4
3
0,9
1
0,6
7
1,2
4
R15
01
-R250
0
0,9
1
1,0
6
0,3
8
0,7
2
0,9
0
R25
01
-R350
0
0,7
3
0,7
3
0,6
3
1,2
1
0,7
4
R35
01
-R550
0
0,4
8
0,6
8
0,3
8
1,2
8
0,5
3
R55
01
-R750
0
0,4
8
0,5
3
0,5
0
1,2
8
0,5
5
R75
01
-R115
00
0
,48
0,9
0
0,4
3
0,8
6
0,5
5
R11
50
1+
0
,66
0,5
2
0,5
7
0,5
9
0,6
2
Ag
e g
rou
p
1
5-3
4
35
+
RS
A
R1
-R15
00
0
,89
1,5
2
1,2
4
R15
01
-R250
0
0,6
3
1,1
8
0,9
0
R25
01
-R350
0
0,6
6
0,8
2
0,7
4
R35
01
-R550
0
0,5
4
0,5
3
0,5
3
R55
01
-R750
0
0,5
4
0,5
5
0,5
5
R75
01
-R115
00
0
,60
0,5
2
0,5
5
R11
50
1+
0
,66
0,6
1
0,6
2
S
ou
rce:
QL
FS
Q3 2
016

ST
AT
IST
ICS
SO
UT
H A
FR
ICA
73
Vul
nera
ble
Gro
ups
Indi
cato
r, 2
016
(Rep
ort 0
3-19
-02)
3.4
Wo
men
: H
ealt
h
Tab
le 3
.4.1
: P
erc
en
tag
e o
f p
ers
on
s w
ith
acce
ss t
o m
ed
ical
aid
by s
ex,
2016
D
isa
gg
reg
ati
on
WC
E
C
NC
F
S
KZ
N
NW
G
P
MP
L
P
RS
A
Pro
vin
ce
% s
ha
re o
f m
ale
s w
ith
access to
med
ica
l a
id
24
,9
9,1
1
5,5
1
7,0
1
2,1
1
5,9
2
6,5
1
4,8
9
,8
17
,4
Ma
les w
ith
access t
o m
edic
al a
id
(Th
ou
sa
nds)
77
8
29
0
90
22
1
62
5
29
7
1 7
90
30
3
26
4
4 6
60
Ma
le p
op
ula
tio
n (
Th
ou
san
ds)
3 1
25
3 1
82
58
2
1 2
98
5 1
50
1 8
67
6 7
48
2 0
57
2 7
05
26
714
% s
ha
re o
f fe
ma
les w
ith
access t
o m
edic
al
aid
2
4,5
1
0,0
1
5,3
1
6,4
1
1,7
1
4,8
2
8,6
1
3,9
8
,3
17
,3
Fe
male
s w
ith
acce
ss t
o m
ed
ica
l a
id
(Th
ou
sa
nds)
79
2
34
7
93
23
8
65
3
27
7
1 8
94
30
0
24
6
4 8
39
Fe
male
po
pula
tio
n (
Th
ousa
nds)
3 2
30
3 4
84
60
6
1 4
50
5 5
71
1 8
69
6 6
14
2 1
49
2 9
63
27
935
% s
ha
re o
f p
ers
on
s w
ith
ac
ce
ss
to
m
ed
ica
l a
id
24
,7
9,6
1
5,4
1
6,7
1
1,9
1
5,4
2
7,6
1
4,3
9
,0
17
,4
Pe
rso
ns
wit
h a
cc
es
s t
o m
ed
ica
l a
id
(Th
ou
san
ds
) 1
57
0
63
8
18
3
45
9
1 2
78
57
4
3 6
84
60
3
51
0
9 4
99
To
tal
po
pu
lati
on
(T
ho
us
an
ds
) 6
35
4
6 6
66
1 1
87
2 7
49
10
721
3 7
35
13
362
4 2
06
5 6
68
54
649
Ge
o-t
yp
e
U
rba
n
Ru
ral
RS
A
% s
ha
re o
f m
ale
s w
ith
access to
med
ica
l a
id
23
,7
6,0
1
7,4
Ma
les w
ith
access t
o m
edic
al a
id
(Th
ou
sa
nds)
4 0
95
56
5
4 6
60
Ma
le p
op
ula
tio
n (
Th
ou
san
ds)
17
300
9 4
13
26
714
% s
ha
re o
f fe
ma
les w
ith
access t
o m
edic
al
aid
2
4,2
5
,4
17
,3
Fe
male
s w
ith
acce
ss t
o m
ed
ica
l a
id
(Th
ou
sa
nds)
4 2
94
54
4
4 8
39
Fe
male
po
pula
tio
n (
Th
ousa
nds)
17
763
10
172
27
935
% s
ha
re o
f p
ers
on
s w
ith
ac
ce
ss
to
m
ed
ica
l a
id
23
,9
5,7
1
7,4
Pe
rso
ns
wit
h a
cc
es
s t
o m
ed
ica
l a
id
(Th
ou
san
ds
) 8
39
0
1 1
09
9 4
99
To
tal
po
pu
lati
on
(T
ho
us
an
ds
) 3
5 0
63
19
586
54
649
Po
pu
lation
g
rou
p
B
lac
k
Afr
ica
n
Co
lou
red
In
dia
n/A
sia
n
Wh
ite
RS
A
% s
ha
re o
f m
ale
s w
ith
access to
med
ica
l a
id
10
,7
20
,0
48
,9
71
,1
17
,4
Ma
les w
ith
access t
o m
edic
al a
id
(Th
ou
sa
nds)
2 2
98
47
4
33
9
1 5
50
4 6
60
Ma
le p
op
ula
tio
n (
Th
ou
san
ds)
21
472
2 3
68
69
3
2 1
80
26
714
% s
ha
re o
f fe
ma
les w
ith
access t
o m
edic
al
aid
1
0,4
1
9,4
5
0,2
7
3,3
1
7,3
Fe
male
s w
ith
acce
ss t
o m
ed
ica
l a
id
(Th
ou
sa
nds)
2 3
20
49
1
34
0
1 6
88
4 8
39
Fe
male
po
pula
tio
n (
Th
ousa
nds)
22
427
2 5
28
67
6
2 3
04
27
935
% s
ha
re o
f p
ers
on
s w
ith
ac
ce
ss
to
m
ed
ica
l a
id
10
,5
19
,7
49
,6
72
,2
17
,4
Pe
rso
ns
wit
h a
cc
es
s t
o m
ed
ica
l a
id
(Th
ou
san
ds
) 4
61
8
96
5
67
9
3 2
37
9 4
99
To
tal
po
pu
lati
on
(T
ho
us
an
ds
) 4
3 8
99
4 8
97
1 3
69
4 4
84
54
649
S
ou
rce:
GH
S 2
016

ST
AT
IST
ICS
SO
UT
H A
FR
ICA
74
Vul
nera
ble
Gro
ups
Indi
cato
r, 2
016
(Rep
ort 0
3-19
-02)
3.5
Wo
men
: V
uln
era
bilit
y t
o h
un
ger
T
ab
le 3
.5.1
: P
erc
en
tag
e o
f H
ou
seh
old
s t
hat
rep
ort
ed
hu
ng
er
by s
ex o
f h
ou
se
ho
ld h
ead
, 2
016
Dis
ag
gre
gati
on
W
C
EC
N
C
FS
K
ZN
N
W
GP
M
P
LP
R
SA
Hea
d s
ex a
nd
p
rovin
ce
%
sha
re
12
,8
10
,4
14
,8
12
,1
13
,4
12
,6
8,7
9
,5
4,1
1
0,3
Ma
le
Ma
les liv
ing
in
hh
tha
t e
xp
eri
en
ce
d h
ung
er
(Th
ou
sa
nds)
14
6
88
28
63
19
6
97
27
3
70
32
99
3
M
ale
-he
ad
ed
HH
s (
Th
ou
san
ds)
1 1
42
84
8
19
1
52
0
1 4
65
77
3
3 1
46
73
6
78
3
9 6
05
%
sha
re
17
,5
12
,1
20
,5
12
,9
18
,0
13
,9
13
,8
14
,4
4,3
1
3,8
Fe
ma
le
Fe
male
s liv
ing
in h
h th
at e
xp
eri
en
ce
d h
un
ge
r (T
ho
usa
nds)
11
9
10
8
27
52
23
6
66
22
6
72
34
94
0
F
em
ale
-he
ade
d H
Hs (
Th
ousan
ds)
67
7
89
3
13
4
40
3
1 3
16
47
3
1 6
44
50
1
78
6
6 8
28
%
sh
are
1
4,5
1
1,3
1
7,2
1
2,4
1
5,6
1
3,1
1
0,4
1
1,5
4
,2
11
,8
Bo
th
Pe
rso
ns
liv
ing
in
hh
th
at
ex
pe
rie
nc
ed
hu
ng
er
(Th
ou
san
ds
) 2
64
19
6
56
11
5
43
2
16
3
49
9
14
2
66
1 9
33
A
ll h
ou
se
ho
lds (
Th
ou
sa
nd
s)
1 8
19
1 7
41
32
5
92
3
2 7
80
1 2
47
4 7
90
1 2
37
1 5
69
16
433
Hea
d s
ex a
nd
g
eo
-typ
e
Urb
an
R
ura
l R
SA
%
sha
re
9,4
1
3,0
1
0,3
Ma
le
Ma
les liv
ing
in
hh
tha
t e
xp
eri
en
ce
d h
ung
er
(Th
ou
sa
nds)
66
0
33
3
99
3
M
ale
-he
ad
ed
HH
s (
Th
ou
san
ds)
7 0
51
2 5
54
9 6
05
%
sha
re
13
,0
15
,1
13
,8
Fe
ma
le
Fe
male
s liv
ing
in h
h th
at e
xp
eri
en
ce
d h
un
ge
r (T
ho
usa
nds)
55
4
38
6
94
0
F
em
ale
-he
ade
d H
Hs (
Th
ousan
ds)
4 2
75
2 5
53
6 8
28
%
sh
are
1
0,7
1
4,1
1
1,8
Bo
th
Pe
rso
ns
liv
ing
in
hh
th
at
ex
pe
rie
nc
ed
hu
ng
er
(Th
ou
san
ds
) 1
21
4
71
9
1 9
33
A
ll h
ou
se
ho
lds (
Th
ou
sa
nd
s)
11
326
5 1
07
16
433
S
ou
rce:
GH
S 2
016
Note
: to
tals
exclu
de u
nspecifie
d c
ases
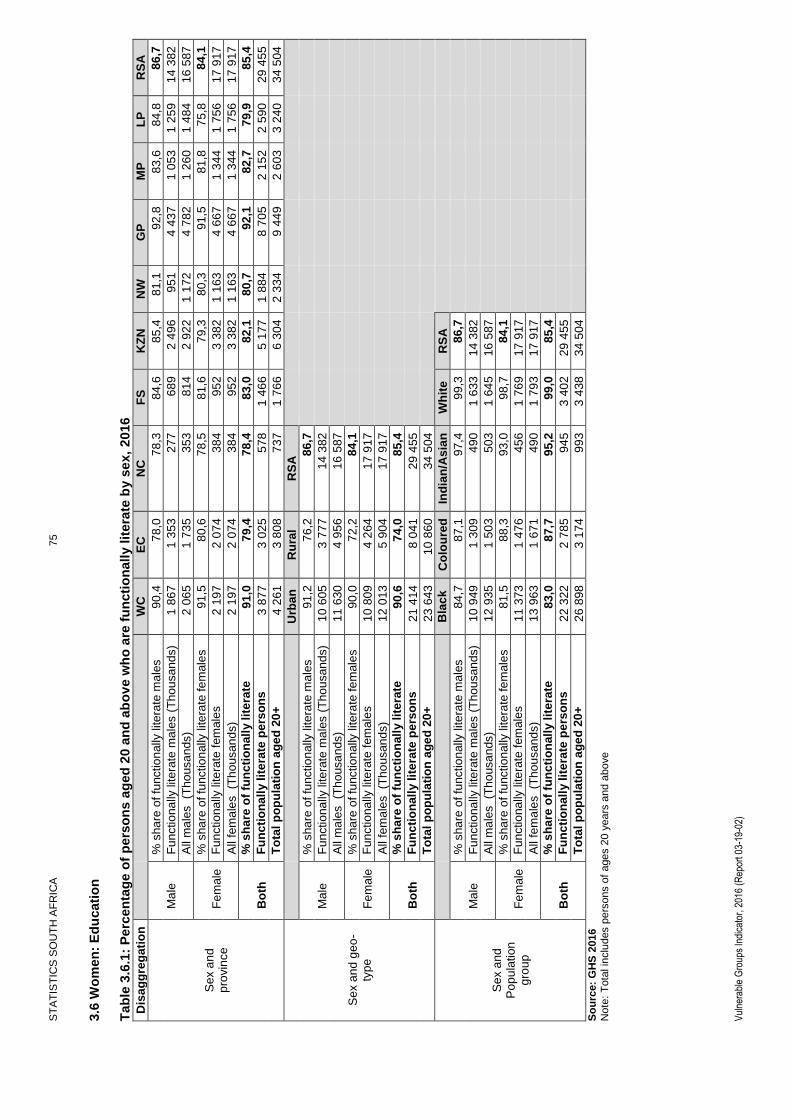
ST
AT
IST
ICS
SO
UT
H A
FR
ICA
75
Vul
nera
ble
Gro
ups
Indi
cato
r, 2
016
(Rep
ort 0
3-19
-02)
3.6
Wo
men
: E
du
cati
on
T
ab
le 3
.6.1
: P
erc
en
tag
e o
f p
ers
on
s a
ged
20 a
nd
ab
ov
e w
ho
are
fu
ncti
on
all
y l
itera
te b
y s
ex,
2016
D
isa
gg
reg
ati
on
W
C
EC
N
C
FS
K
ZN
N
W
GP
M
P
LP
R
SA
Se
x a
nd
p
rovin
ce
%
sha
re o
f fu
nctio
nally
lite
rate
ma
les
90
,4
78
,0
78
,3
84
,6
85
,4
81
,1
92
,8
83
,6
84
,8
86
,7
Ma
le
Fu
nctio
na
lly lite
rate
ma
les (
Tho
usan
ds)
1 8
67
1 3
53
27
7
68
9
2 4
96
95
1
4 4
37
1 0
53
1 2
59
14
382
A
ll m
ale
s
(Th
ousa
nds)
2 0
65
1 7
35
35
3
81
4
2 9
22
1 1
72
4 7
82
1 2
60
1 4
84
16
587
%
sha
re o
f fu
nctio
nally
lite
rate
fe
male
s
91
,5
80
,6
78
,5
81
,6
79
,3
80
,3
91
,5
81
,8
75
,8
84
,1
Fe
male
F
un
ctio
na
lly lite
rate
fem
ale
s
(Th
ou
sa
nds)
2 1
97
2 0
74
38
4
95
2
3 3
82
1 1
63
4 6
67
1 3
44
1 7
56
17
917
A
ll fe
ma
les (T
ho
usan
ds)
2 1
97
2 0
74
38
4
95
2
3 3
82
1 1
63
4 6
67
1 3
44
1 7
56
17
917
%
sh
are
of
fun
cti
on
all
y l
ite
rate
p
ers
on
s
91
,0
79
,4
78
,4
83
,0
82
,1
80
,7
92
,1
82
,7
79
,9
85
,4
Bo
th
Fu
nc
tio
na
lly l
ite
rate
pe
rso
ns
(Th
ou
san
ds
) 3
87
7
3 0
25
57
8
1 4
66
5 1
77
1 8
84
8 7
05
2 1
52
2 5
90
29
455
T
ota
l p
op
ula
tio
n a
ge
d 2
0+
(T
ho
us
an
ds
) 4
26
1
3 8
08
73
7
1 7
66
6 3
04
2 3
34
9 4
49
2 6
03
3 2
40
34
504
Se
x a
nd
ge
o-
typ
e
Urb
an
R
ura
l R
SA
%
sha
re o
f fu
nctio
nally
lite
rate
ma
les
91
,2
76
,2
86
,7
Ma
le
Fu
nctio
na
lly lite
rate
ma
les (
Tho
usan
ds)
10
605
3 7
77
14
382
A
ll m
ale
s
(Th
ousa
nds)
11
630
4 9
56
16
587
%
sha
re o
f fu
nctio
nally
lite
rate
fe
male
s
90
,0
72
,2
84
,1
Fe
male
F
un
ctio
na
lly lite
rate
fem
ale
s
(Th
ou
sa
nds)
10
809
4 2
64
17
917
A
ll fe
ma
les (T
ho
usan
ds)
12
013
5 9
04
17
917
%
sh
are
of
fun
cti
on
all
y l
ite
rate
p
ers
on
s
90
,6
74
,0
85
,4
Bo
th
Fu
nc
tio
na
lly l
ite
rate
pe
rso
ns
(Th
ou
san
ds
) 2
1 4
14
8 0
41
29
455
T
ota
l p
op
ula
tio
n a
ge
d 2
0+
(T
ho
us
an
ds
) 2
3 6
43
10
860
34
504
Se
x a
nd
P
op
ula
tion
g
rou
p
Bla
ck
A
fric
an
C
olo
ure
d
Ind
ian
/As
ian
W
hit
e
RS
A
%
sha
re o
f fu
nctio
nally
lite
rate
ma
les
84
,7
87
,1
97
,4
99
,3
86
,7
Ma
le
Fu
nctio
na
lly lite
rate
ma
les (
Tho
usan
ds)
10
949
1 3
09
49
0
1 6
33
14
382
A
ll m
ale
s
(Th
ousa
nds)
12
935
1 5
03
50
3
1 6
45
16
587
%
sha
re o
f fu
nctio
nally
lite
rate
fe
male
s
81
,5
88
,3
93
,0
98
,7
84
,1
Fe
male
F
un
ctio
na
lly lite
rate
fem
ale
s
(Th
ou
sa
nds)
11
373
1 4
76
45
6
1 7
69
17
917
A
ll fe
ma
les (T
ho
usan
ds)
13
963
1 6
71
49
0
1 7
93
17
917
%
sh
are
of
fun
cti
on
all
y l
ite
rate
p
ers
on
s
83
,0
87
,7
95
,2
99
,0
85
,4
Bo
th
Fu
nc
tio
na
lly l
ite
rate
pe
rso
ns
(Th
ou
san
ds
) 2
2 3
22
2 7
85
94
5
3 4
02
29
455
T
ota
l p
op
ula
tio
n a
ge
d 2
0+
(T
ho
us
an
ds
) 2
6 8
98
3 1
74
99
3
3 4
38
34
504
S
ou
rce:
GH
S 2
016
Note
: T
ota
l in
clu
des p
ers
ons o
f ages 2
0 y
ears
and a
bove

ST
AT
IST
ICS
SO
UT
H A
FR
ICA
76
Vul
nera
ble
Gro
ups
Indi
cato
r, 2
016
(Rep
ort 0
3-19
-02)
Tab
le 3
.6.1
: P
erc
en
tag
e o
f p
ers
on
s a
ged
20 a
nd
ab
ov
e w
ho
are
fu
ncti
on
all
y l
itera
te b
y s
ex, 2
016
(co
nt.
)
Se
x a
nd
ag
e
gro
up
20
- 3
9
40
- 5
9
60
+
RS
A
Ma
le
% s
ha
re o
f fu
nctio
nally
lite
rate
ma
les
93
,7
82
,6
61
,5
86
,7
F
un
ctio
na
lly lite
rate
ma
les (
Tho
usan
ds)
8 9
65
4 3
15
1 1
01
14
382
A
ll m
ale
s
(Th
ousa
nds)
9 5
70
5 2
27
1 7
90
16
587
Fe
male
%
sha
re o
f fu
nctio
nally
lite
rate
fe
male
s
95
,5
80
,3
54
,3
84
,1
F
un
ctio
na
lly lite
rate
fem
ale
s (
Th
ou
sa
nds)
8 8
84
4 6
63
1 5
26
17
917
A
ll fe
ma
les
(Th
ou
san
ds)
9 3
03
5 8
05
2 8
09
17
917
Bo
th
% s
ha
re o
f fu
nc
tio
nall
y l
ite
rate
pe
rso
ns
9
4,6
8
1,4
5
7,1
8
5,4
Fu
nc
tio
na
lly l
ite
rate
pe
rso
ns (
Th
ou
san
ds
) 1
7 8
49
8 9
78
2 6
27
29
455
To
tal
po
pu
lati
on
ag
ed
20
+
(Th
ou
sa
nd
s)
18
873
11
032
4 5
99
34
504
So
urc
e:
GH
S 2
016
Note
: T
ota
l in
clu
des p
ers
ons o
f ages 2
0 y
ears
and a
bove
Tab
le 3
.6.2
: P
erc
en
tag
e d
istr
ibu
tio
n o
f th
e h
igh
est
lev
el o
f ed
ucati
on
ob
tain
ed
by p
ers
on
s a
ged
25 y
ea
rs a
nd
ab
ov
e b
y s
ex,
201
6
Dis
ag
gre
gati
on
W
C
EC
N
C
FS
K
ZN
N
W
GP
M
P
LP
R
SA
Se
x a
nd
p
rovin
ce
Ma
le
Le
ss t
han
ma
tric
5
1,3
7
0,4
6
5,9
5
7,6
5
8,7
6
3,4
4
4,6
5
8,5
6
5,0
5
5,7
Ma
tric
2
6,8
1
8,2
2
3,9
2
9,3
2
9,2
2
3,9
3
0,7
2
7,6
2
2,6
2
7,1
Oth
er
tert
iary
8
,3
5,5
5
,9
6,9
5
,9
7,1
1
0,1
8
,5
6,8
7
,8
Gra
du
ate
s
11
,8
5,2
3
,4
4,8
5
,2
3,3
1
1,5
4
,3
3,9
7
,5
Oth
er
1,9
0
,7
1,0
1
,5
1,1
2
,3
3,2
1
,0
1,7
1
,9
To
tal
(%)
10
0,0
1
00
,0
10
0,0
1
00
,0
10
0,0
1
00
,0
10
0,0
1
00
,0
10
0,0
1
00
,0
To
tal
(‘00
0)
1 7
92
1 4
15
30
4
68
7
2 4
05
1 0
24
4 1
47
1 0
38
1 1
84
13
995
Fe
male
Le
ss t
han
ma
tric
5
3,2
7
1,5
6
7,9
6
2,0
6
1,6
6
3,2
4
4,0
5
8,5
6
9,6
5
7,8
Ma
tric
2
6,8
1
7,0
2
1,9
2
5,2
2
6,0
2
3,3
3
0,0
2
5,9
1
8,3
2
5,1
Oth
er
tert
iary
9
,2
6,5
6
,5
7,7
5
,5
8,5
1
1,4
9
,7
7,5
8
,5
Gra
du
ate
s
9,9
4
,7
3,1
4
,2
5,6
3
,4
12
,2
4,9
3
,3
7,2
Oth
er
0,9
0
,3
0,7
0
,9
1,4
1
,7
2,4
1
,0
1,4
1
,4
To
tal
(%)
10
0,0
1
00
,0
10
0,0
1
00
,0
10
0,0
1
00
,0
10
0,0
1
00
,0
10
0,0
1
00
,0
To
tal
(‘00
0)
1 9
14
1 7
36
33
7
82
0
2 8
70
99
6
4 0
78
1 1
23
1 4
79
15
354
So
urc
e:
GH
S 2
016

ST
AT
IST
ICS
SO
UT
H A
FR
ICA
77
Vul
nera
ble
Gro
ups
Indi
cato
r, 2
016
(Rep
ort 0
3-19
-02)
Tab
le 3
.6.2
: P
erc
en
tag
e d
istr
ibu
tio
n o
f th
e h
igh
est
lev
el o
f ed
ucati
on
ob
tain
ed
by p
ers
on
s a
ged
25 y
ea
rs a
nd
ab
ov
e b
y s
ex,
201
6(c
on
t.)
Se
x a
nd
ge
o-t
yp
e
Urb
an
R
ura
l R
SA
Ma
le
Le
ss t
han
ma
tric
4
8,9
7
2,9
5
5,7
Ma
tric
3
0,2
1
9,1
2
7,1
Oth
er
tert
iary
9
,2
4,3
7
,8
Gra
du
ate
s
9,7
2
,1
7,5
Oth
er
2,0
1
,6
1,9
Pe
r c
en
t 1
00
,0
10
0,0
1
00
,0
To
tal
10
046
3 9
49
13
995
Fe
male
Le
ss t
han
ma
tric
5
0,1
7
4,0
5
7,8
Ma
tric
2
9,0
1
7,0
2
5,1
Oth
er
tert
iary
9
,9
5,4
8
,5
Gra
du
ate
s
9,6
2
,3
7,2
Oth
er
1,5
1
,3
1,4
Pe
r c
en
t 1
00
,0
10
0,0
1
00
,0
To
tal
10
393
4 9
61
15
354
Se
x a
nd
Po
pu
latio
n g
roup
Bla
ck
Afr
ica
n
Co
lou
red
In
dia
n/A
sia
n
Wh
ite
RS
A
Ma
le
Le
ss t
han
ma
tric
6
1,7
6
1,0
2
7,5
1
6,4
5
5,7
Ma
tric
2
5,2
2
6,3
4
1,0
3
6,7
2
7,1
Oth
er
tert
iary
6
,5
5,7
1
0,3
1
8,3
7
,8
Gra
du
ate
s
4,6
5
,1
18
,8
27
,8
7,5
Oth
er
2,0
1
,9
2,4
0
,9
1,9
Pe
r c
en
t 1
00
,0
10
0,0
1
00
,0
10
0,0
1
00
,0
To
tal
10
771
1 2
85
44
8
1 4
91
13
995
Fe
male
Le
ss t
han
ma
tric
6
3,3
6
2,5
3
5,1
2
0,2
5
7,8
Ma
tric
2
2,7
2
5,5
3
7,8
3
8,3
2
5,1
Oth
er
tert
iary
7
,5
6,7
9
,6
16
,6
8,5
Gra
du
ate
s
5,0
4
,3
15
,9
23
,6
7,2
Oth
er
1,5
0
,9
1,6
1
,4
1,4
Pe
r c
en
t 1
00
,0
10
0,0
1
00
,0
10
0,0
1
00
,0
To
tal
11
816
1 4
54
43
6
1 6
48
15
354
So
urc
e:
GH
S 2
016

ST
AT
IST
ICS
SO
UT
H A
FR
ICA
78
Vul
nera
ble
Gro
ups
Indi
cato
r, 2
016
(Rep
ort 0
3-19
-02)
3.7
Wo
men
: H
ou
sin
g a
nd
basic
serv
ices
T
ab
le 3
.7.1
: T
yp
e o
f h
ou
sin
g b
y s
ex
of
the h
ou
seh
old
head
, 2
016
Dis
ag
gre
gati
on
F
orm
al
Tra
dit
ion
al
Info
rma
l O
the
r T
ota
l
(P
er
ce
nt)
T
ota
l
(T
ho
us
an
ds
)
Hea
d s
ex
an
d g
eo
-ty
pe
Ma
le
Urb
an
78
,7
0,9
1
9,1
1
,4
10
0,0
7
17
8
Rura
l 7
6,2
1
4,1
9
,3
0,5
1
00
,0
2 5
89
RS
A
78
,0
4,4
1
6,5
1
,1
10
0,0
9
76
7
Fe
male
Urb
an
84
,0
1,3
1
3,8
1
,0
10
0,0
4
32
9
Rura
l 7
6,2
1
9,6
4
,2
0,1
1
00
,0
2 5
66
RS
A
81
,1
8,1
1
0,2
0
,7
10
0,0
6
89
5
Bo
th
Urb
an
80
,7
1,0
1
7,1
1
,2
10
0,0
1
1 5
07
Rura
l 7
6,2
1
6,8
6
,7
0,3
1
00
,0
5 1
55
RS
A
79
,3
5,9
1
3,9
0
,9
10
0,0
1
6 6
62
So
urc
e:
GH
S 2
016
Tab
le 3
.7.2
: L
ivin
g c
on
dit
ion
in
dic
ato
rs o
f m
ale
an
d f
em
ale
-he
ad
ed
ho
useh
old
s,
20
16
Dis
ag
gre
gati
on
Ac
ce
ss
to
se
rvic
e in
dic
ato
r
Ac
ce
ss
to
p
ipe
d
wa
ter
Ac
ce
ss
to
im
pro
ve
d
sa
nit
ati
on
Refu
se
/ w
as
te r
em
ova
l b
y m
un
icip
ali
ty/l
oc
al
au
tho
rity
Ac
ce
ss
to
ele
ctr
icit
y c
on
ne
cte
d t
o
the
ma
ins
So
lid
fu
els
fo
r c
oo
kin
g
%
%
%
%
%
Hea
d S
ex
Ma
le-h
ea
de
d H
Hs
75
,9
84
,4
70
,4
81
,9
7,2
Fe
male
he
ad
ed
H
Hs
69
,3
82
,3
61
,5
87
,5
13
,1
All
ho
us
eh
old
s
73
,1
83
,5
66
,7
87
,5
9,6
S
ou
rce:
GH
S 2
016

ST
AT
IST
ICS
SO
UT
H A
FR
ICA
79
Vul
nera
ble
Gro
ups
Indi
cato
r, 2
016
(Rep
ort 0
3-19
-02)
3.8
Wo
men
: V
iole
nc
e a
nd
cri
me v
icti
ms
T
ab
le 3
.8.1
: P
erc
en
tag
e o
f w
om
en
(16 y
rs.
an
d a
bo
ve)
liv
ing
in
ho
useh
old
s w
here
th
e h
ou
seh
old
s f
eel
un
safe
or
very
un
safe
to
walk
alo
ne i
n t
heir
are
a d
uri
ng
th
e d
ay,
2015
/16
D
isa
gg
reg
ati
on
WC
E
C
NC
F
S
KZ
N
NW
G
P
MP
L
P
RS
A
Pro
vin
ce
% s
ha
re
72
,1
85
,8
87
,1
89
,8
84
,1
86
,0
76
,9
89
,2
95
,5
83
,0
Fe
male
s (
thou
san
ds)*
1
74
4
2 0
04
38
1
95
2
3 2
13
1 1
32
3 7
98
1 3
35
1 9
15
16
475
% s
ha
re
71
,6
85
,7
87
,6
90
,6
84
,4
87
,0
77
,5
89
,6
95
,3
83
,6
Po
pu
lati
on
(th
ou
sa
nd
s)*
4
37
7
5 8
89
1 0
32
2 6
01
9 1
56
3 3
02
10
383
3 7
78
5 3
59
45
876
Ag
e g
rou
p
1
6-2
4
25
-34
35
+
RS
A
% s
ha
re
83
,6
83
,5
82
,6
83
,0
Fe
male
s(t
ho
usa
nd
s)*
3
88
2
4 2
02
8 3
91
16
475
% s
ha
re
8
3,6
Po
pu
lati
on
(th
ou
sa
nd
s)*
45
876
So
urc
e:
VO
CS
2015/1
6
*Tota
ls e
xclu
de u
nspecifie
d c
ases
Tab
le 3
.8.2
: P
erc
en
tag
e o
f w
om
en
(16 y
rs.
an
d a
bo
ve)
liv
ing
in
ho
useh
old
s w
here
th
e h
ou
seh
old
s f
eel
un
safe
or
very
un
safe
to
walk
alo
ne i
n t
heir
are
a a
t n
igh
t, 2
015/1
6
Dis
ag
gre
gati
on
WC
E
C
NC
F
S
KZ
N
NW
G
P
MP
L
P
RS
A
Pro
vin
ce
% s
ha
re
31
,2
25
,0
27
,0
18
,7
33
,8
26
,8
23
,9
27
,2
54
,2
30
,1
Fe
male
s (
thou
san
ds)*
7
55
58
3
11
8
19
8
1 2
88
35
2
1 1
76
40
7
1 0
88
5 9
66
% s
ha
re
31
,4
27
,1
28
,2
19
,0
35
,2
28
,4
24
,3
28
,2
52
,6
30
,9
Po
pu
lati
on
(th
ou
sa
nd
s)*
1
91
4
1 8
60
33
2
54
5
3 8
08
1 0
76
3 2
43
1 1
95
2 9
55
16
930
Ag
e g
rou
p
1
6-2
4
25
-34
35
+
RS
A
% s
ha
re
30
,7
29
,8
30
,0
30
,1
Fe
male
s (
thou
san
ds)*
1
42
3
1 5
00
3 0
42
5 9
66
% s
ha
re
3
0,9
Po
pu
lati
on
(th
ou
sa
nd
s)*
16
930
So
urc
e:
VO
CS
2015/1
6
*Tota
ls e
xclu
de u
nspecifie
d c
ases

ST
AT
IST
ICS
SO
UT
H A
FR
ICA
80
Vul
nera
ble
Gro
ups
Indi
cato
r, 2
016
(Rep
ort 0
3-19
-02)
Tab
le 3
.8.3
: P
erc
en
tag
e o
f w
om
en
(16 y
rs.
an
d a
bo
ve)
wh
o l
ive i
n h
ou
seh
old
s w
here
th
e f
ear
of
cri
me p
rev
en
t th
em
fro
m g
oin
g t
o o
pen
sp
ace
s o
r p
ark
s in
th
eir
are
a,
201
5/1
6
Dis
ag
gre
gati
on
WC
E
C
NC
F
S
KZ
N
NW
G
P
MP
L
P
RS
A
Pro
vin
ce
% s
ha
re
48
,0
47
,0
59
,7
34
,5
22
,8
24
,8
43
,1
35
,7
12
,6
35
,2
Fe
male
s (
thou
san
ds)*
1
10
3
1 0
79
25
8
35
6
85
9
31
8
2 0
57
52
3
24
9
6 8
01
% s
ha
re
47
,7
44
,4
56
,7
32
,7
21
,8
22
,7
41
,2
33
,4
13
,2
33
,5
Po
pu
lati
on
(t
ho
us
an
ds
)*
2 7
64
3 0
05
65
5
91
9
2 3
22
84
7
5 3
29
1 3
82
73
2
17
956
Ag
e g
rou
p
1
6-2
4
25
-34
35
+
RS
A
% s
ha
re
32
,8
35
,2
36
,4
35
,2
Fe
male
s (
thou
san
ds)*
1
48
7
1 7
23
3 5
91
6 8
01
% s
ha
re
3
3,5
P
op
ula
tio
n
(th
ou
sa
nd
s)*
17
956
So
urc
e:
VO
CS
2016
*Tota
ls e
xclu
de u
nspecifie
d c
ases
Tab
le 3
.8.4
: P
erc
en
tag
e o
f w
om
en
ag
ed
16 a
nd
ab
ov
e w
ho
hav
e b
een
vic
tim
s o
f p
rop
ert
y c
rim
e d
uri
ng
th
e p
ast
5 y
ea
rs,
201
5/1
6
Dis
ag
gre
gati
on
WC
E
C
NC
F
S
KZ
N
NW
G
P
MP
L
P
RS
A
Pro
vin
ce
% s
ha
re
2,6
3
,3
0,7
1
,5
1,0
0
,8
2,4
0
,9
1,4
1
,9
# a
ffecte
d
63
78
3
16
40
11
11
9
13
28
37
3
Fe
male
s
(th
ousa
nds)*
2 4
23
2 3
49
44
0
1 0
65
3 8
34
1 3
16
5 0
12
1 5
13
2 0
21
19
971
Po
pu
lati
on
g
rou
p
B
lac
k
Afr
ica
n
Co
lou
red
In
dia
n/A
sia
n
Wh
ite
RS
A
% s
ha
re
1,8
2
,0
1,6
2
,2
1,9
# a
ffecte
d
28
4
35
9
45
37
3
Fe
male
s
(th
ousa
nds)*
1
5 6
08
1 7
93
55
0
2 0
20
19
971
So
urc
e:
VO
CS
2016
*Tota
ls e
xclu
de u
nspecifie
d c
ases
Tab
le 3
.8.5
: P
erc
en
tag
e o
f w
om
en
ag
ed
16 a
nd
ab
ov
e w
ho
hav
e b
een
vic
tim
s o
f A
ss
au
lt d
uri
ng
th
e p
ast
5 y
ears
, 2
015/1
6
Dis
ag
gre
gati
on
WC
E
C
NC
F
S
KZ
N
NW
G
P
MP
L
P
RS
A
Pro
vin
ce
%
sha
re
2,1
1
,5
3,8
3
,1
1,1
1
,8
0,7
1
,6
0,3
1
,3
Fe
male
s
(th
ousa
nds)*
2
33
8
2 3
38
41
5
1 0
14
3 6
90
1 2
72
5 0
00
1 4
71
2 0
71
19
610
Po
pu
lati
on
g
rou
p
Bla
ck
A
fric
an
C
olo
ure
d
Ind
ian
/As
ian
W
hit
e
RS
A
% s
ha
re
1,3
1
,9
0,0
1
,6
1,3
Fe
male
s
(th
ousa
nds)*
1
5 3
43
1 8
23
52
1
1 9
24
19
610
S
ou
rce:
VO
CS
2016 *
To
tals
exclu
de u
nspecifie
d c
ases

ST
AT
IST
ICS
SO
UT
H A
FR
ICA
81
Vul
nera
ble
Gro
ups
Indi
cato
r, 2
016
(Rep
ort 0
3-19
-02)
IND
ICA
TO
RS
: O
LD
ER
PE
RS
ON
S
Old
er
pers
ons a
re d
efine
d a
s p
eo
ple
ag
ed 6
0 y
ears
and o
lder.
4.1
Dem
og
rap
hy o
f o
lder
pers
on
s
Tab
le 4
.1.1
: P
erc
en
tag
e d
istr
ibu
tio
n o
f th
e o
lder
pe
rso
ns b
y s
ex,
2016
Dis
ag
gre
gati
on
WC
E
C
NC
F
S
KZ
N
NW
G
P
MP
L
P
RS
A
Pro
vin
ce
Ma
le
44
,6
37
,5
38
,2
36
,0
35
,7
44
,0
40
,4
38
,8
33
,2
38
,9
Fe
male
5
5,4
6
2,5
6
1,8
6
4,0
6
4,3
5
6,0
5
9,6
6
1,3
6
6,8
6
1,1
All
Eld
erl
y p
ers
on
s (
%)
10
0,0
1
00
,0
10
0,0
1
00
,0
10
0,0
1
00
,0
10
0,0
1
00
,0
10
0,0
1
00
,0
All
Eld
erl
y p
ers
on
s (
‘000
) 6
19
59
8
11
3
25
3
84
3
32
1
11
32
29
8
43
0
4 6
07
Ge
o-t
yp
e
U
rba
n
Ru
ral
RS
A
Ma
le
40
,3
36
,3
38
,9
Fe
male
5
9,7
6
3,7
6
1,1
All
Eld
erl
y p
ers
on
s (
%)
10
0,0
1
00
,0
10
0,0
All
Eld
erl
y p
ers
on
s(‘
000
) 2
94
9
1 6
58
4 6
07
Po
pu
lation
g
rou
p
B
lac
k A
fric
an
C
olo
ure
d
Ind
ian
/ A
sia
n
Wh
ite
RS
A
Ma
le
36
,9
41
,7
44
,4
42
,8
38
,9
Fe
male
6
3,1
5
8,3
5
5,6
5
7,2
6
1,1
All
Eld
erl
y p
ers
on
s (
%)
10
0,0
1
00
,0
10
0,0
1
00
,0
10
0,0
All
Eld
erl
y p
ers
on
s(‘
000
) 3
02
2
42
1
16
4
99
9
4 6
07
S
ou
rce:
GH
S 2
016

ST
AT
IST
ICS
SO
UT
H A
FR
ICA
82
Vul
nera
ble
Gro
ups
Indi
cato
r, 2
016
(Rep
ort 0
3-19
-02)
Tab
le 4
.1.2
: P
erc
en
tag
e o
f o
lder
pe
rso
ns (
60 y
ears
an
d o
lder)
as a
pro
po
rtio
n o
f th
e o
vera
ll p
op
ula
tio
n b
y s
ex,
2016
Dis
ag
gre
gati
on
W
C
EC
N
C
FS
K
ZN
N
W
GP
M
P
LP
R
SA
Pro
vin
ce
%
share
of m
ale
s 6
0 a
nd a
bove
8,8
7,0
7,4
7,0
5,8
7,5
6,7
5,5
5,2
6,6
Male
M
ale
s 6
0 a
nd a
bove
276
224
43
91
301
142
457
116
143
1 7
92
T
ota
l m
ale
popula
tio
n
3 1
27
3 2
13
584
1 3
10
5 1
92
1 8
77
6 8
34
2 1
00
2 7
39
26 9
75
%
share
of fe
ma
les 6
0 a
nd a
bove
10,6
10,6
11,4
11,1
9,7
9,6
10,1
8,3
9,6
10,0
Fem
ale
F
em
ale
s 6
0 a
nd a
bove
343
374
70
162
542
180
675
183
287
2 8
15
T
ota
l fe
male
popula
tio
n
3 2
36
3 5
18
609
1 4
59
5 6
14
1 8
81
6 7
09
2 1
90
2 9
86
28 2
02
%
sh
are
of
pe
rso
ns
60 a
nd
ab
ove
9,7
8,9
9,5
9,1
7,8
8,6
8,4
7,0
7,5
8,4
Bo
th
Po
pu
lati
on
60 a
nd
ab
ov
e
619
598
113
253
843
321
1 1
32
298
430
4 6
07
T
ota
l p
op
ula
tio
n
6 3
62
6 7
31
1 1
92
2 7
69
10 8
07
3 7
58
13 5
43
4 2
90
5 7
24
55 1
77
Geo-t
ype
Urb
an
R
ura
l R
SA
%
share
of m
ale
s 6
0 a
nd a
bove
6,8
6,3
6,6
Male
M
ale
s 6
0 a
nd a
bove
1 1
90
602
1 7
92
T
ota
l m
ale
popula
tio
n
17 4
49
9 5
26
26 9
75
%
share
of fe
ma
les 6
0 a
nd a
bove
9,8
10,3
10,0
Fem
ale
F
em
ale
s 6
0 a
nd a
bove
1 7
59
1 0
56
2 8
15
T
ota
l fe
male
popula
tio
n
17 9
20
10 2
82
28 2
02
%
sh
are
of
pe
rso
ns
60 a
nd
ab
ove
8
8
8,4
Bo
th
Po
pu
lati
on
60 a
nd
ab
ov
e
2 9
49
1 6
58
4 6
07
T
ota
l p
op
ula
tio
n
35 3
69
19 8
07
55 1
77
Popula
tio
n
gro
up
Bla
ck
Afr
ican
C
olo
ure
d
Ind
ian
/ A
sia
n
Wh
ite
RS
A
%
share
of m
ale
s 6
0 a
nd a
bove
5,1
7,4
10,4
19,4
6,6
Male
M
ale
s 6
0 a
nd a
bove
1 1
16
176
73
428
1 7
92
T
ota
l m
ale
popula
tio
n
21 6
99
2 3
73
700
2 2
03
26 9
75
%
share
of fe
ma
les 6
0 a
nd a
bove
8,4
9,7
13,3
24,4
10,0
Fem
ale
F
em
ale
s 6
0 a
nd a
bove
1 9
07
246
91
571
2 8
15
T
ota
l fe
male
popula
tio
n
22 6
48
2 5
33
684
2 3
37
28 2
02
%
sh
are
of
pe
rso
ns
60 a
nd
ab
ove
6,8
8,6
11,8
22,0
8,4
Bo
th
Po
pu
lati
on
60 a
nd
ab
ov
e
3 0
22
421
164
999
4 6
07
T
ota
l p
op
ula
tio
n
44 3
47
4 9
06
1 3
84
4 5
40
55 1
77
So
urc
e:
GH
S 2
016

ST
AT
IST
ICS
SO
UT
H A
FR
ICA
83
Vul
nera
ble
Gro
ups
Indi
cato
r, 2
016
(Rep
ort 0
3-19
-02)
4.2
Old
er
pe
rso
ns:
Ho
us
eh
old
ch
ara
cte
risti
cs
T
ab
le 4
.2.1
: P
erc
en
tag
e d
istr
ibu
tio
n o
f h
ou
seh
old
s h
ead
ed
by p
ers
on
s 6
0 y
ears
an
d o
lder
by s
ex o
f th
e h
ou
seh
old
he
ad
, 20
16
D
isa
gg
reg
ati
on
WC
E
C
NC
F
S
KZ
N
NW
G
P
MP
L
P
RS
A
Pro
vin
ce
Ma
le
56
,8
39
,1
44
,7
39
,0
39
,5
47
,1
47
,4
42
,6
34
,0
43
,6
Fe
male
4
3,2
6
0,9
5
5,4
6
1,0
6
0,5
5
2,9
5
2,6
5
7,4
6
6,0
5
6,4
Old
er
pe
rso
ns
-he
ad
ed
HH
s
(Pe
r c
en
t)
10
0,0
1
00
,0
10
0,0
1
00
,0
10
0,0
1
00
,0
10
0,0
1
00
,0
10
0,0
1
00
,0
Old
er
pe
rso
ns
-he
ad
ed
HH
s
(Th
ou
san
ds
) 3
90
46
2
79
19
9
64
2
25
5
79
0
23
4
34
5
3 3
95
Ge
o-t
yp
e
U
rba
n
Ru
ral
RS
A
Ma
le
47
,4
38
,0
43
,6
Fe
male
5
2,6
6
2,0
5
6,4
Old
er
pe
rso
ns
-he
ad
ed
HH
s
(Pe
r c
en
t)
10
0,0
1
00
,0
10
0,0
Old
er
pe
rso
ns
-he
ad
ed
HH
s
(Th
ou
san
ds
) 2
02
1
1 3
74
3 3
95
Hea
d
po
pu
latio
n
gro
up
B
lac
k
Afr
ica
n
Co
lou
red
In
dia
n/A
sia
n
Wh
ite
RS
A
Ma
le
38
,2
51
,5
59
,3
59
,7
43
,6
Fe
male
6
1,8
4
8,5
4
0,7
4
0,3
5
6,4
Old
er
pe
rso
ns
-he
ad
ed
HH
s
(Pe
r c
en
t)
10
0,0
1
00
,0
10
0,0
1
00
,0
10
0,0
Old
er
pe
rso
ns
-he
ad
ed
HH
s
(Th
ou
san
ds
) 2
44
9
25
5
90
60
1
3 3
95
S
ou
rce:
GH
S 2
016
Tab
le 4
.2.2
: M
ean
Rati
o o
f C
hild
ren
to
Old
er
pe
rso
ns in
old
er
pers
on
-head
ed
ho
useh
old
s b
y s
ex o
f th
e h
ou
seh
old
head
an
d p
rov
ince,
2016
D
isa
gg
reg
ati
on
H
H
Co
mp
os
itio
n
WC
E
C
NC
F
S
KZ
N
NW
G
P
MP
L
P
RS
A
Hea
d s
ex a
nd
P
rovin
ce
Ma
le
0,3
3
1,0
0
0,7
1
0,7
4
1,0
7
0,7
9
0,4
4
1,1
5
1,2
6
0,7
6
Fe
male
0
,61
1,4
7
1,4
2
1,3
1
1,7
2
1,2
5
0,9
9
1,5
3
1,5
2
1,3
2
Bo
th
0,4
5
1,2
9
1,1
0
1,0
9
1,4
6
1,0
4
0,7
3
1,3
7
1,4
3
1,0
8
So
urc
e:
GH
S 2
016
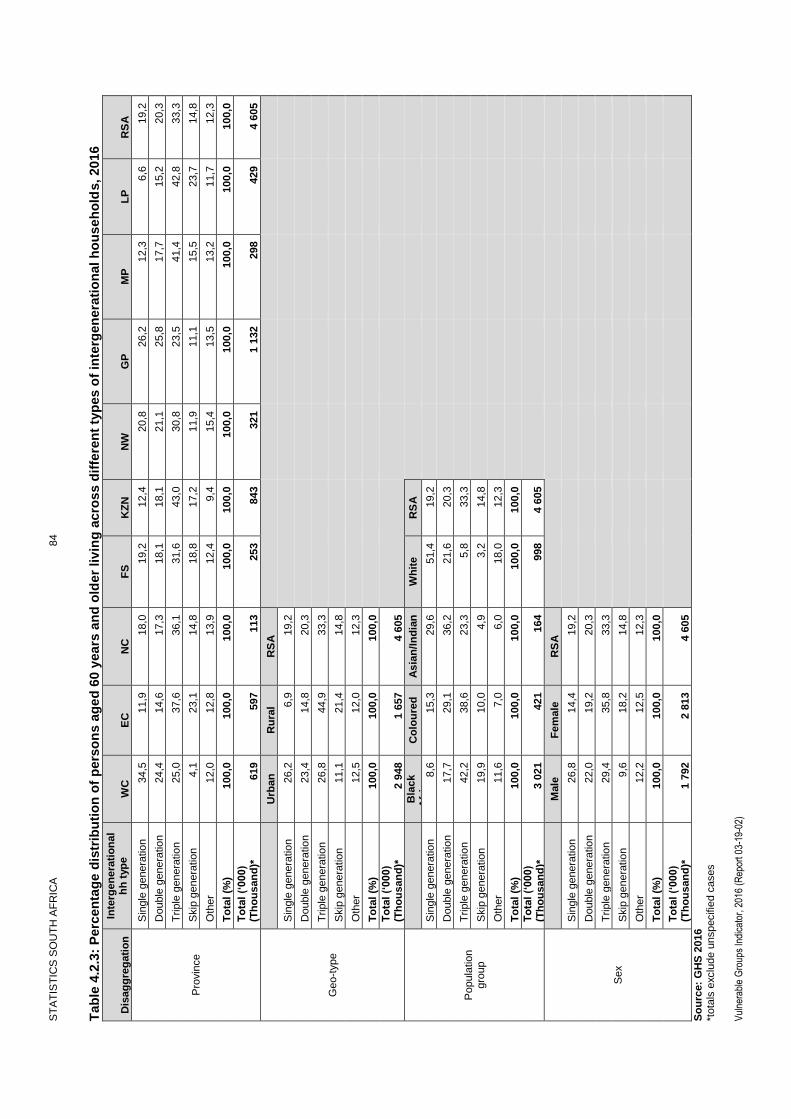
ST
AT
IST
ICS
SO
UT
H A
FR
ICA
84
Vul
nera
ble
Gro
ups
Indi
cato
r, 2
016
(Rep
ort 0
3-19
-02)
Tab
le 4
.2.3
: P
erc
en
tag
e d
istr
ibu
tio
n o
f p
ers
on
s a
ge
d 6
0 y
ears
an
d o
lder
liv
ing
acro
ss d
iffe
ren
t ty
pes o
f in
terg
en
era
tio
nal h
ou
se
ho
lds, 20
16
Dis
ag
gre
gati
on
Inte
rgen
era
tio
na
l h
h t
yp
e
WC
E
C
NC
F
S
KZ
N
NW
G
P
MP
L
P
RS
A
Pro
vin
ce
Sin
gle
genera
tio
n
34,5
11,9
18,0
19,2
12,4
20,8
26,2
12,3
6,6
19,2
Double
genera
tio
n
24,4
14,6
17,3
18,1
18,1
21,1
25,8
17,7
15,2
20,3
Trip
le g
enera
tio
n
25,0
37,6
36,1
31,6
43,0
30,8
23,5
41,4
42,8
33,3
Skip
genera
tio
n
4,1
23,1
14,8
18,8
17,2
11,9
11,1
15,5
23,7
14,8
Oth
er
12,0
12,8
13,9
12,4
9,4
15,4
13,5
13,2
11,7
12,3
To
tal
(%)
100,0
100,0
100,0
100,0
100,0
100,0
100,0
100,0
100,0
100,0
To
tal
(‘000)
(Th
ou
san
d)*
619
597
113
253
843
321
1 1
32
298
429
4 6
05
Geo-t
ype
U
rban
R
ura
l R
SA
Sin
gle
genera
tio
n
26,2
6,9
19,2
Double
genera
tio
n
23,4
14,8
20,3
Trip
le g
enera
tio
n
26,8
44,9
33,3
Skip
genera
tio
n
11,1
21,4
14,8
Oth
er
12,5
12,0
12,3
To
tal
(%)
100,0
100,0
100,0
To
tal
(‘000)
(Th
ou
san
d)*
2 9
48
1 6
57
4 6
05
Popula
tio
n
gro
up
B
lack
Afr
ican
C
olo
ure
d
As
ian
/In
dia
n
Wh
ite
RS
A
Sin
gle
genera
tio
n
8,6
15,3
29,6
51,4
19,2
Double
genera
tio
n
17,7
29,1
36,2
21,6
20,3
Trip
le g
enera
tio
n
42,2
38,6
23,3
5,8
33,3
Skip
genera
tio
n
19,9
10,0
4,9
3,2
14,8
Oth
er
11,6
7,0
6,0
18,0
12,3
To
tal
(%)
100,0
100,0
100,0
100,0
100,0
To
tal
(‘000)
(Th
ou
san
d)*
3 0
21
421
164
998
4 6
05
Sex
M
ale
F
em
ale
R
SA
Sin
gle
genera
tio
n
26,8
14,4
19,2
Double
genera
tio
n
22,0
19,2
20,3
Trip
le g
enera
tio
n
29,4
35,8
33,3
Skip
genera
tio
n
9,6
18,2
14,8
Oth
er
12,2
12,5
12,3
To
tal
(%)
100,0
100,0
100,0
To
tal
(‘000)
(Th
ou
san
d)*
1 7
92
2 8
13
4 6
05
So
urc
e:
GH
S 2
016
*tota
ls e
xclu
de u
nspecifie
d c
ases

ST
AT
IST
ICS
SO
UT
H A
FR
ICA
85
Vul
nera
ble
Gro
ups
Indi
cato
r, 2
016
(Rep
ort 0
3-19
-02)
Ta
ble
4.2
.4:
Pe
rce
nta
ge
dis
trib
uti
on
of
ho
use
ho
ld c
om
po
sit
ion
of
ho
use
ho
lds
hea
de
d b
y p
ers
on
s 6
0 y
ea
rs a
nd
old
er,
20
16
Dis
ag
gre
gati
on
H
H
Co
mp
os
itio
n
WC
E
C
NC
F
S
KZ
N
NW
G
P
MP
L
P
RS
A
Pro
vin
ce
Sin
gle
2
0,3
1
7,5
1
7,6
1
5,8
1
3,8
2
1,0
1
9,0
1
8,3
1
4,3
1
7,4
Nucle
ar
45
,9
19
,1
21
,2
23
,5
20
,6
25
,7
34
,9
19
,4
15
,0
26
,5
Exte
nd
ed
29
,0
61
,7
57
,6
58
,1
64
,6
51
,5
44
,6
61
,5
70
,0
54
,3
Com
ple
x
4,8
1
,7
3,6
2
,6
1,0
1
,8
1,6
0
,9
0,7
1
,9
To
tal
(%)
10
0,0
1
00
,0
10
0,0
1
00
,0
10
0,0
1
00
,0
10
0,0
1
00
,0
10
0,0
1
00
,0
To
tal
(‘00
0)
38
9
46
1
79
19
8
63
9
25
3
78
3
23
4
34
3
3 3
79
Po
pu
lation
g
rou
p
B
lac
k/
Afr
ica
n
Co
lou
red
A
sia
n/I
nd
ian
W
hit
e
RS
A
Sin
gle
1
4,8
1
0,4
1
1,0
3
1,6
1
7,4
Nucle
ar
17
,8
33
,8
53
,6
55
,0
26
,5
Exte
nd
ed
66
,0
50
,1
34
,7
11
,0
54
,3
Com
ple
x
1,4
5
,6
0,7
2
,5
1,9
To
tal
(%)
10
0,0
1
00
,0
10
0,0
1
00
,0
10
0,0
To
tal
(‘00
0)
2 4
39
25
4
90
59
6
3 3
79
Ge
o-t
yp
e
U
rba
n
Ru
ral
RS
A
Sin
gle
1
8,6
1
5,5
1
7,4
Nucle
ar
34
,2
15
,2
26
,5
Exte
nd
ed
44
,7
68
,3
54
,3
Com
ple
x
2,5
1
,0
1,9
To
tal
(%)
10
0,0
1
00
,0
10
0,0
To
tal
(‘00
0)
2 0
11
1 3
68
3 3
79
Hea
d s
ex
M
ale
F
em
ale
R
SA
Sin
gle
1
4,0
2
0,0
1
7,4
Nu
cle
ar
43
,4
13
,6
26
,5
Exte
nd
ed
41
,0
64
,5
54
,3
Com
ple
x
1,7
2
,0
1,9
To
tal
(%)
10
0,0
1
00
,0
10
0,0
To
tal
(‘00
0)
1 4
72
1 9
07
3 3
79
So
urc
e:
GH
S 2
01
6
*to
tals
ex
clu
de
un
sp
ec
ifie
d c
as
es

ST
AT
IST
ICS
SO
UT
H A
FR
ICA
86
Vul
nera
ble
Gro
ups
Indi
cato
r, 2
016
(Rep
ort 0
3-19
-02)
4.3
Old
er
pe
rso
ns:
In
co
me, p
ov
ert
y, e
co
no
mic
ac
tiv
ity a
nd
so
cia
l g
ran
ts
Tab
le 4
.3.1
: O
lde
r p
ers
on
s liv
ing
in
ho
useh
old
s w
ith
ou
t an
em
plo
yed
ad
ult
, 2016
Dis
ag
gre
gati
on
WC
E
C
NC
F
S
KZ
N
NW
G
P
MP
L
P
RS
A
Pro
vin
ce
Male
%
39,2
63,6
64,2
50,6
48,3
59,7
36,6
47,2
60,6
48,1
Male
s liv
ing
in
ho
us
eh
old
s w
ith
ou
t em
plo
yed
ad
ult
108
143
28
46
145
84
167
55
87
862
Po
pu
lati
on
of
male
s 6
0 a
nd
ab
ove
276
224
43
91
301
142
457
116
143
1 7
92
Fe
male
%
39,9
67,3
59,2
55,1
49,9
58,0
43,1
53,3
64,4
52,1
Fe
male
s liv
ing
in
ho
us
eh
old
s w
ith
ou
t em
plo
yed
ad
ult
137
251
41
89
271
104
291
97
185
1 4
67
Po
pu
lati
on
of
fem
ale
s 6
0 a
nd
ab
ov
e
343
374
70
162
542
180
675
183
287
2815
Bo
th
%
39,6
65,9
61,1
53,5
49,3
58,7
40,5
50,9
63,1
50,6
Liv
ing
in
ho
us
eh
old
s w
ith
ou
t em
plo
yed
ad
ult
245
394
69
135
416
189
458
152
271
2 3
29
Po
pu
lati
on
60 a
nd
ab
ov
e
619
598
113
253
843
321
1 1
32
298
430
4 6
07
Popula
tio
n
gro
up
B
lack
Afr
ican
C
olo
ure
d
Ind
ian
/Asia
n
Wh
ite
RS
A
Male
%
53,0
36,7
34,2
42,5
48,1
Male
s liv
ing
in
ho
us
eh
old
s w
ith
ou
t em
plo
yed
ad
ult
591
64
25
182
862
Po
pu
lati
on
of
male
s 6
0 a
nd
ab
ove
1 1
16
176
73
428
1 7
92
Fem
ale
%
56,1
32,7
34,3
50,0
52,1
Fe
male
s liv
ing
in
ho
us
eh
old
s w
ith
ou
t em
plo
yed
ad
ult
1 0
70
80
31
285
1 4
67
Po
pu
lati
on
of
fem
ale
s 6
0 a
nd
ab
ov
e
1 9
07
246
91
571
2 8
15
Bo
th
%
55,0
34,4
34,3
46,8
50,6
Liv
ing
in
ho
us
eh
old
s w
ith
ou
t em
plo
yed
ad
ult
1 6
61
145
56
467
2 3
29
Po
pu
lati
on
60 a
nd
ab
ov
e
3 0
22
421
164
999
4 6
07
Sex
M
ale
F
em
ale
R
SA
%
48,1
52,1
50,6
L
ivin
g in
ho
us
eh
old
s w
ith
ou
t em
plo
yed
ad
ult
862
1 4
67
2 3
29
P
op
ula
tio
n 6
0 a
nd
ab
ov
e
1 7
92
2 8
15
4 6
06
Geo-t
ype
U
rban
R
ura
l R
SA
Male
%
42,2
59,7
48,1
Male
s liv
ing
in
ho
us
eh
old
s w
ith
ou
t em
plo
yed
ad
ult
503
360
862
Po
pu
lati
on
of
male
s 6
0 a
nd
ab
ove
1 1
90
602
1 7
92
Fe
male
%
45,0
64,0
52,1
Fe
male
s liv
ing
in
ho
us
eh
old
s w
ith
ou
t em
plo
yed
ad
ult
791
676
1 4
67
Po
pu
lati
on
of
fem
ale
s 6
0 a
nd
ab
ov
e
1 7
59
1 0
56
2 8
15
Bo
th
%
43,9
62,5
50,6
Liv
ing
in
ho
us
eh
old
s w
ith
ou
t em
plo
yed
ad
ult
1 2
94
1 0
35
2 3
29
Po
pu
lati
on
60 a
nd
ab
ov
e
2 9
49
1 6
58
4 6
07
So
urc
e:
GH
S 2
016

ST
AT
IST
ICS
SO
UT
H A
FR
ICA
87
Vul
nera
ble
Gro
ups
Indi
cato
r, 2
016
(Rep
ort 0
3-19
-02)
Tab
le 4
.3.2
: P
erc
en
tag
e o
f h
ou
seh
old
s h
ead
ed
by o
lder
pers
on
s t
hat
are
cla
ss
ifie
d a
s lo
w in
co
me h
ou
seh
old
s (
at
mo
st
qu
inti
le 1
ho
useh
old
in
co
me),
2016
Dis
agg
reg
atio
n
W
C
EC
N
C
FS
K
ZN
N
W
GP
M
P
LP
R
SA
Pro
vin
ce
Ma
le
%
8,3
1
9,5
2
7,6
1
3,1
2
0,9
2
5,3
1
4,5
2
2,9
4
3,7
1
9,3
Lo
w in
co
me
ho
us
eh
old
s h
ea
de
d b
y
ma
les
(‘0
00
) 1
8
35
10
10
53
30
54
23
51
28
5
To
tal
ho
us
eh
old
s h
ea
ded
by m
ale
s
(‘0
00
) 2
22
18
0
35
78
25
3
12
0
37
5
10
0
11
7
1 4
80
Fe
ma
le
%
11
,7
24
,5
27
,4
14
,7
26
,1
25
,9
20
,8
30
,6
45
,6
25
,4
Lo
w in
co
me
ho
us
eh
old
s h
ea
de
d b
y
fem
ale
s (
‘00
0)
20
69
12
18
10
1
35
86
41
10
4
48
6
To
tal
ho
us
eh
old
s h
ea
ded
by f
em
ale
s
(‘0
00
) 1
68
28
1
44
12
1
38
8
13
5
41
5
13
4
22
8
1 9
15
Bo
th
%
9,8
2
2,5
2
7,5
1
4,1
2
4,0
2
5,6
1
7,8
2
7,3
4
5,0
2
2,7
To
tal
Lo
w in
co
me
ho
us
eh
old
s
(‘00
0)
38
10
4
22
28
15
4
65
14
1
64
15
5
77
1
To
tal
ho
us
eh
old
s h
ea
ded
by o
lde
r p
ers
on
s (
'10
0)
39
0
46
2
79
19
9
64
2
25
5
79
0
23
4
34
5
3 3
95
Po
pu
lation
g
rou
p
B
lac
k
Afr
ica
n
Co
lou
red
In
dia
n/A
sia
n
Wh
ite
RS
A
Ma
le
%
26
,2
13
,0
9,6
4
,9
19
,3
Lo
w in
co
me
ho
us
eh
old
s h
ea
de
d b
y
ma
les
(‘0
00
) 2
45
17
5
18
28
5
To
tal
ho
us
eh
old
s h
ea
ded
by m
ale
s
(‘0
00
) 9
36
13
1
54
35
9
1 4
80
Fe
ma
le
%
28
,7
15
,8
5,8
1
2,6
2
5,4
Lo
w in
co
me
ho
us
eh
old
s h
ea
de
d b
y
fem
ale
s (
‘00
0)
43
4
19
2
31
48
6
To
tal
ho
us
eh
old
s h
ea
ded
by f
em
ale
s
(‘0
00
) 1
51
3
12
4
37
24
2
1 9
15
Bo
th
%
27
,7
14
,3
8,1
8
,0
22
,7
To
tal
Lo
w in
co
me
ho
us
eh
old
s
(‘00
0)
67
9
36
7
48
77
1
To
tal
ho
us
eh
old
s h
ea
ded
by o
lde
r p
ers
on
s (
'10
0)
2 4
49
25
5
90
60
1
3 3
95
Ge
o-t
yp
e
U
rba
n
Ru
ral
RS
A
Ma
le
%
13
,0
30
,8
19
,3
Lo
w in
co
me
ho
us
eh
old
s h
ea
de
d b
y
ma
les
(‘0
00
) 1
25
16
1
28
5
To
tal
ho
us
eh
old
s h
ea
ded
by m
ale
s
(‘0
00
) 9
58
52
2
1 4
80
Fe
ma
le
%
20
,2
31
,8
25
,4
Lo
w in
co
me
ho
us
eh
old
s h
ea
de
d b
y
fem
ale
s (
‘00
0)
21
5
27
1
48
6
To
tal
ho
us
eh
old
s h
ea
ded
by f
em
ale
s
(‘0
00
) 1
06
3
85
2
1 9
15
Bo
th
%
16
,8
31
,4
22
,7
To
tal
Lo
w in
co
me
ho
us
eh
old
s
(‘00
0)
33
9
43
2
77
1
To
tal
ho
us
eh
old
s h
ea
ded
by o
lde
r p
ers
on
s (
'10
0)
2 0
21
1 3
74
3 3
95
S
ou
rce:
GH
S 2
016

ST
AT
IST
ICS
SO
UT
H A
FR
ICA
88
Vul
nera
ble
Gro
ups
Indi
cato
r, 2
016
(Rep
ort 0
3-19
-02)
Tab
le 4
.3.3
: P
erc
en
tag
e d
istr
ibu
tio
n o
f th
e m
ain
so
urc
e o
f in
co
me f
or
ho
us
eh
old
s h
ead
ed
by o
lder
pe
rso
ns,
201
6
Dis
ag
gre
gati
on
WC
E
C
NC
F
S
KZ
N
NW
G
P
MP
L
P
RS
A
Pro
vin
ce
Ma
le
Sa
larie
s/w
ag
es/c
om
mis
sio
n
31
,8
15
,4
15
,7
27
,9
25
,7
14
,7
40
,5
21
,0
12
,9
26
,5
Rem
itta
nce
s
1,8
1
,1
0,0
3
,9
4,5
1
,1
0,2
2
,2
0,5
1
,7
So
cia
l G
ran
ts
44
,6
80
,1
76
,9
62
,3
60
,4
76
,2
45
,0
67
,6
81
,5
60
,7
Sa
les o
f fa
rmin
g p
rod
ucts
a
nd
se
rvic
es
0,0
0
,3
0,0
0
,0
0,0
1
,8
0,0
1
,7
0,0
0
,3
Oth
er
no
n-f
arm
incom
e
21
,5
3,2
7
,4
5,3
9
,4
5,7
1
3,6
7
,0
4,7
1
0,3
No in
co
me
0,4
0
,0
0,0
0
,7
0,0
0
,5
0,8
0
,5
0,4
0
,4
To
tal
(%)
10
0,0
1
00
,0
10
0,0
1
00
,0
10
0,0
1
00
,0
10
0,0
1
00
,0
10
0,0
1
00
,0
To
tal
(‘00
0)
21
0
17
4
34
73
24
0
11
7
34
1
97
11
2
1 3
97
Fe
ma
le
Sa
larie
s/w
ag
es/c
om
mis
sio
n
36
,1
13
,4
19
,7
18
,1
22
,1
17
,1
35
,6
20
,7
8,7
2
2,5
Rem
itta
nce
s
1,5
1
,4
2,9
2
,0
5,9
1
,5
3,9
2
,6
4,9
3
,4
So
cia
l G
ran
ts
54
,2
83
,8
73
,6
77
,3
69
,0
79
,3
57
,0
74
,8
84
,2
71
,0
Sa
les o
f fa
rmin
g p
rod
ucts
a
nd
se
rvic
es
0,0
0
,7
0,7
0
,0
0,4
0
,8
0,0
0
,0
0,5
0
,3
Oth
er
no
n-f
arm
incom
e
8,2
0
,7
3,2
2
,6
2,7
1
,4
3,5
2
,0
1,3
2
,7
No in
co
me
0,0
0
,0
0,0
0
,0
0,0
0
,0
0,0
0
,0
0,3
0
,0
To
tal
(%)
10
0,0
1
00
,0
10
0,0
1
00
,0
10
0,0
1
00
,0
10
0,0
1
00
,0
10
0,0
1
00
,0
To
tal
(‘00
0)
15
9
27
4
43
11
5
37
3
13
1
38
0
13
1
21
9
1 8
26
Ge
o-t
yp
e
Ma
le
U
rba
n
Ru
ral
RS
A
Sa
larie
s/w
ag
es/c
om
mis
sio
n
33
,3
14
,7
26
,5
Rem
itta
nce
s
1,7
1
,7
1,7
So
cia
l G
ran
ts
50
,7
78
,4
60
,7
Sa
les o
f fa
rmin
g p
rod
ucts
a
nd
se
rvic
es
0,4
0
,1
0,3
Oth
er
no
n-f
arm
incom
e
13
,6
4,7
1
0,3
No in
co
me
0,3
0
,5
0,4
To
tal
(%)
10
0,0
1
00
,0
10
0,0
To
tal
(‘00
0)
89
2
50
5
1 3
97
Fe
ma
le
Sa
larie
s/w
ag
es/c
om
mis
sio
n
32
,2
10
,7
22
,5
Rem
itta
nce
s
3,6
3
,2
3,4
So
cia
l G
ran
ts
60
,2
84
,1
71
,0
Sa
les o
f fa
rmin
g p
rod
ucts
a
nd
se
rvic
es
0,1
0
,6
0,3
Oth
er
no
n-f
arm
incom
e
4,0
1
,3
2,7
No in
co
me
0,0
0
,1
0,0
To
tal
(%)
10
0,0
1
00
,0
10
0,0
To
tal
(‘00
0)
99
9
82
7
1 8
26
S
ou
rce:
GH
S 2
016

ST
AT
IST
ICS
SO
UT
H A
FR
ICA
89
Vul
nera
ble
Gro
ups
Indi
cato
r, 2
016
(Rep
ort 0
3-19
-02)
Tab
le 4
.3.4
: P
erc
en
tag
e o
f o
lder
pe
rso
ns
wh
o a
re b
en
efi
cia
rie
s o
f so
cia
l g
ran
ts,
201
6
Dis
ag
gre
gati
on
WC
E
C
NC
F
S
KZ
N
NW
G
P
MP
L
P
RS
A
Pro
vin
ce
%
50
,6
83
,5
80
,0
74
,0
77
,3
77
,2
54
,8
75
,6
87
,8
69
,7
Old
er
pe
rso
n
be
ne
ficia
rie
s
31
3
49
9
90
18
7
65
1
24
8
62
0
22
5
37
8
3 2
13
Po
pu
lati
on
of
old
er
pe
rso
ns
61
9
59
8
11
3
25
3
84
3
32
1
1 1
32
29
8
43
0
4 6
07
Po
pu
lation
g
rou
p
B
lac
k A
fric
an
C
olo
ure
d
Ind
ian
/As
ian
W
hit
e
RS
A
%
84
,6
81
,6
65
,0
20
,6
69
,7
Old
er
pe
rso
n
be
ne
ficia
rie
s
2 5
57
34
4
10
7
20
5
3 2
13
Po
pu
lati
on
of
old
er
pe
rso
ns
3 0
22
42
1
16
4
99
9
4 6
07
Se
x
M
ale
F
em
ale
R
SA
%
62
,2
74
,5
69
,7
Old
er
pe
rso
n
be
ne
ficia
rie
s
1 1
15
2 0
98
3 2
13
Po
pu
lati
on
of
old
er
pe
rso
ns
1 7
92
2 8
15
4 6
07
Ge
o-t
yp
e
U
rba
n
Ru
ral
RS
A
%
59
,5
88
,0
69
,7
Old
er
pe
rso
n
be
ne
ficia
rie
s
1 7
53
1 4
60
3 2
13
Po
pu
lati
on
of
old
er
pe
rso
ns
2 9
49
1 6
58
4 6
07
S
ou
rce:
GH
S 2
016
Tab
le 4
.3.5
: L
ab
ou
r fo
rce
part
icip
ati
on
rate
of
old
er
pers
on
s,
20
16
D
isa
gg
reg
ati
on
WC
E
C
NC
F
S
KZ
N
NW
G
P
MP
L
P
RS
A
Pro
vin
ce
Ma
le
21
,4
11
,8
18
,8
18
,5
18
,5
11
,2
27
,2
17
,7
21
,0
20
,2
Fe
male
1
0,3
7
,7
10
,1
5,9
6
,4
5,4
1
3,7
8
,5
9,7
9
,3
Bo
th
14
,9
9,2
1
3,4
1
0,7
1
0,4
7
,8
19
,6
12
,0
13
,8
13
,5
Ge
o-t
yp
e
U
rba
n
Ru
ral
RS
A
Ma
le
23
,1
13
,9
20
,2
Fe
male
1
1,0
6
,4
9,3
Bo
th
16
,0
9,0
1
3,5
Po
pu
lation
g
rou
p
B
lac
k A
fric
an
C
olo
ure
d
Ind
ian
/ A
sia
n
Wh
ite
RS
A
Ma
le
16
,6
17
,1
24
,6
30
,1
20
,2
Fe
male
7
,8
7,2
7
,6
15
,5
9,3
Bo
th
11
,0
11
,3
15
,2
21
,7
13
,5
S
ou
rce:
QL
FS
Q3 2
016
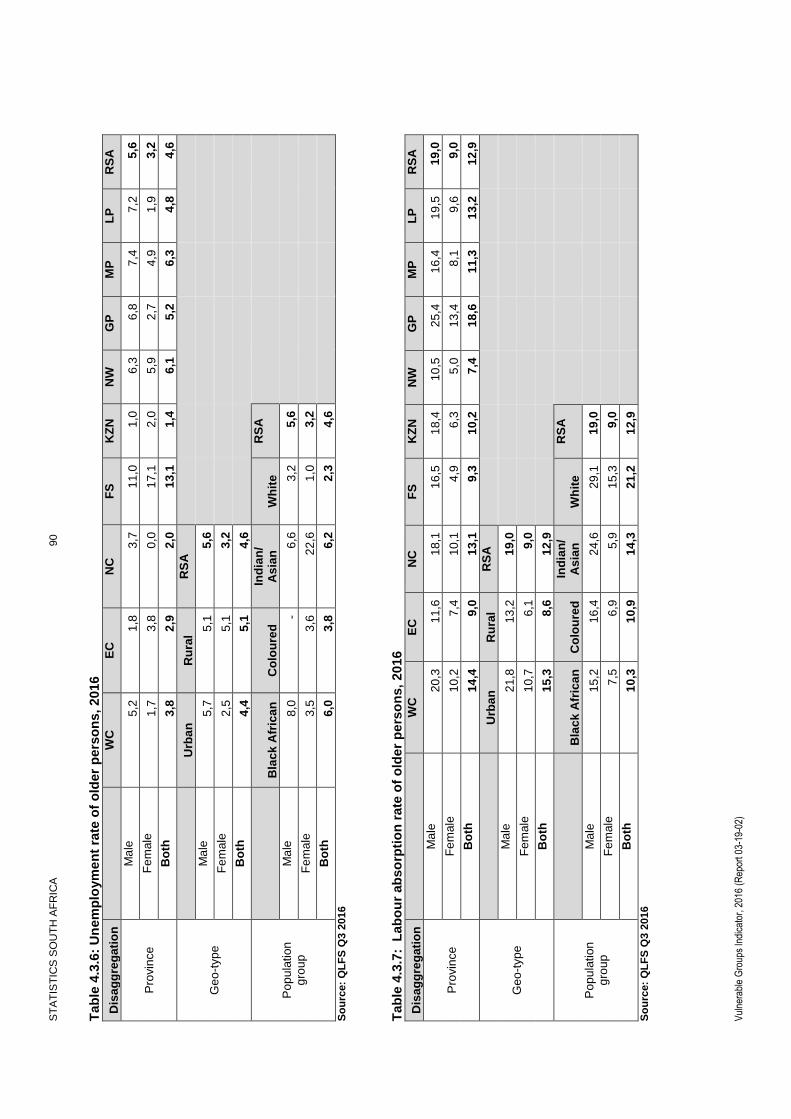
ST
AT
IST
ICS
SO
UT
H A
FR
ICA
90
Vul
nera
ble
Gro
ups
Indi
cato
r, 2
016
(Rep
ort 0
3-19
-02)
Tab
le 4
.3.6
: U
nem
plo
ym
en
t ra
te o
f o
lder
pers
on
s,
2016
Dis
ag
gre
gati
on
WC
E
C
NC
F
S
KZ
N
NW
G
P
MP
L
P
RS
A
Pro
vin
ce
Ma
le
5,2
1
,8
3,7
1
1,0
1
,0
6,3
6
,8
7,4
7
,2
5,6
Fe
male
1
,7
3,8
0
,0
17
,1
2,0
5
,9
2,7
4
,9
1,9
3
,2
Bo
th
3,8
2
,9
2,0
1
3,1
1
,4
6,1
5
,2
6,3
4
,8
4,6
Ge
o-t
yp
e
U
rba
n
Ru
ral
RS
A
Ma
le
5,7
5
,1
5,6
Fe
male
2
,5
5,1
3
,2
Bo
th
4,4
5
,1
4,6
Po
pu
lation
g
rou
p
B
lac
k A
fric
an
C
olo
ure
d
Ind
ian
/ A
sia
n
Wh
ite
RS
A
Ma
le
8,0
-
6,6
3
,2
5,6
Fe
male
3
,5
3,6
2
2,6
1
,0
3,2
Bo
th
6,0
3
,8
6,2
2
,3
4,6
So
urc
e:
QL
FS
Q3 2
016
Tab
le 4
.3.7
: L
ab
ou
r ab
so
rpti
on
rate
of
old
er
pe
rso
ns,
20
16
Dis
ag
gre
gati
on
WC
E
C
NC
F
S
KZ
N
NW
G
P
MP
L
P
RS
A
Pro
vin
ce
Ma
le
20
,3
11
,6
18
,1
16
,5
18
,4
10
,5
25
,4
16
,4
19
,5
19
,0
Fe
male
1
0,2
7
,4
10
,1
4,9
6
,3
5,0
1
3,4
8
,1
9,6
9
,0
Bo
th
14
,4
9,0
1
3,1
9
,3
10
,2
7,4
1
8,6
1
1,3
1
3,2
1
2,9
Ge
o-t
yp
e
U
rba
n
Ru
ral
RS
A
Ma
le
21
,8
13
,2
19
,0
Fe
male
1
0,7
6
,1
9,0
Bo
th
15
,3
8,6
1
2,9
Po
pu
lation
g
rou
p
B
lac
k A
fric
an
C
olo
ure
d
Ind
ian
/ A
sia
n
Wh
ite
RS
A
Ma
le
15
,2
16
,4
24
,6
29
,1
19
,0
Fe
male
7
,5
6,9
5
,9
15
,3
9,0
Bo
th
10
,3
10
,9
14
,3
21
,2
12
,9
S
ou
rce:
QL
FS
Q3 2
016

ST
AT
IST
ICS
SO
UT
H A
FR
ICA
91
Vul
nera
ble
Gro
ups
Indi
cato
r, 2
016
(Rep
ort 0
3-19
-02)
Tab
le 4
.3.8
: E
co
no
mic
in
acti
vit
y r
ate
of
old
er
pers
on
s,
20
16
Dis
ag
gre
gati
on
WC
E
C
NC
F
S
KZ
N
NW
G
P
MP
L
P
RS
A
Pro
vin
ce
Ma
le
78
,6
88
,2
81
,2
81
,5
81
,5
88
,8
72
,8
82
,3
79
,0
79
,8
Fe
male
8
9,7
9
2,3
8
9,9
9
4,1
9
3,6
9
4,6
8
6,3
9
1,5
9
0,3
9
0,7
Bo
th
85
,1
90
,8
86
,6
89
,3
89
,6
92
,2
80
,4
88
,0
86
,2
86
,5
Ge
o-t
yp
e
U
rba
n
Ru
ral
RS
A
Ma
le
76
,9
86
,1
79
,8
Fe
male
8
9,0
9
3,6
9
0,7
Bo
th
84
,0
91
,0
86
,5
Po
pu
lation
g
rou
p
B
lac
k A
fric
an
C
olo
ure
d
Ind
ian
/ A
sia
n
Wh
ite
RS
A
Ma
le
83
,4
82
,9
75
,4
69
,9
79
,8
Fe
male
9
2,2
9
2,8
9
2,4
8
4,5
9
0,7
Bo
th
89
,0
88
,7
84
,8
78
,3
86
,5
S
ou
rce:
QL
FS
Q3 2
016
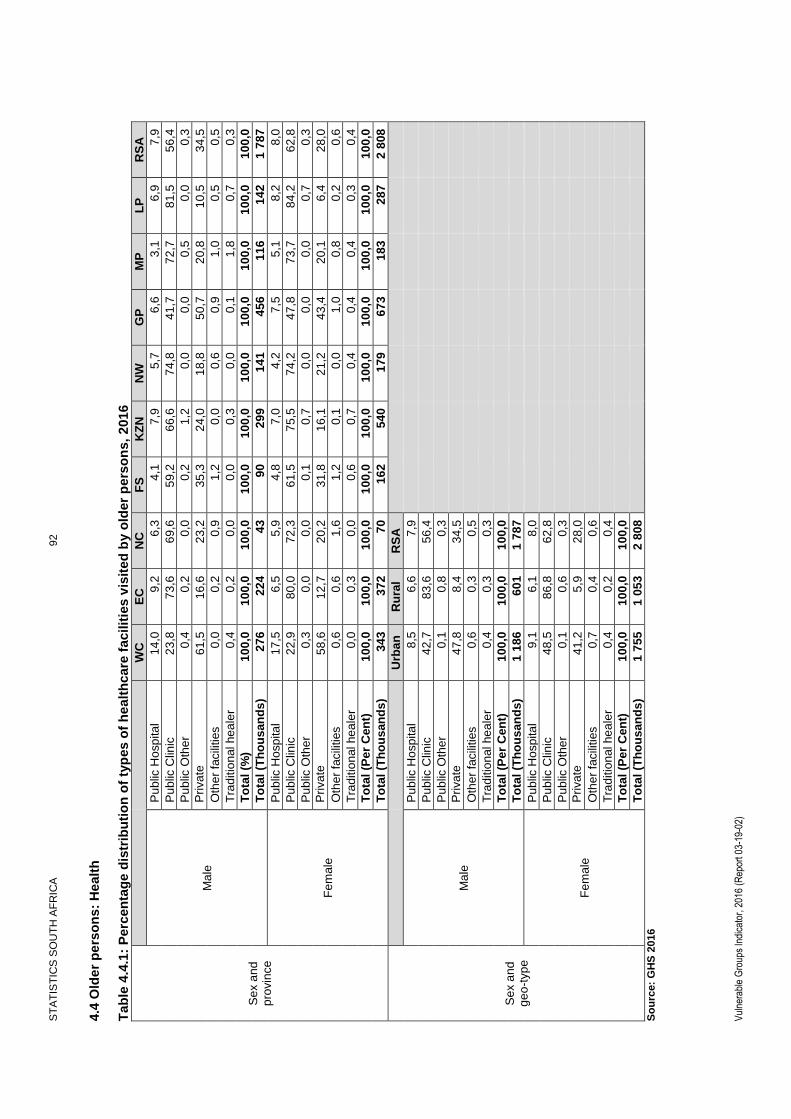
ST
AT
IST
ICS
SO
UT
H A
FR
ICA
92
Vul
nera
ble
Gro
ups
Indi
cato
r, 2
016
(Rep
ort 0
3-19
-02)
4.4
Old
er
pe
rso
ns:
He
alt
h
Tab
le 4
.4.1
: P
erc
en
tag
e d
istr
ibu
tio
n o
f ty
pes o
f h
ea
lth
care
facilit
ies v
isit
ed
by o
lder
pers
on
s,
2016
Se
x a
nd
p
rovin
ce
WC
E
C
NC
F
S
KZ
N
NW
G
P
MP
L
P
RS
A
Ma
le
Pu
blic
Ho
sp
ita
l 1
4,0
9
,2
6,3
4
,1
7,9
5
,7
6,6
3
,1
6,9
7
,9
Pu
blic
Clin
ic
23
,8
73
,6
69
,6
59
,2
66
,6
74
,8
41
,7
72
,7
81
,5
56
,4
Pu
blic
Oth
er
0,4
0
,2
0,0
0
,2
1,2
0
,0
0,0
0
,5
0,0
0
,3
Pri
va
te
Hosp
ita
l/C
linic
/Docto
r 6
1,5
1
6,6
2
3,2
3
5,3
2
4,0
1
8,8
5
0,7
2
0,8
1
0,5
3
4,5
Oth
er
facili
ties
0,0
0
,2
0,9
1
,2
0,0
0
,6
0,9
1
,0
0,5
0
,5
Tra
ditio
nal he
ale
r 0
,4
0,2
0
,0
0,0
0
,3
0,0
0
,1
1,8
0
,7
0,3
To
tal
(%)
10
0,0
1
00
,0
10
0,0
1
00
,0
10
0,0
1
00
,0
10
0,0
1
00
,0
10
0,0
1
00
,0
To
tal
(Th
ou
san
ds
) 2
76
22
4
43
90
29
9
14
1
45
6
11
6
14
2
1 7
87
Fe
male
Pu
blic
Ho
sp
ita
l 1
7,5
6
,5
5,9
4
,8
7,0
4
,2
7,5
5
,1
8,2
8
,0
Pu
blic
Clin
ic
22
,9
80
,0
72
,3
61
,5
75
,5
74
,2
47
,8
73
,7
84
,2
62
,8
Pu
blic
Oth
er
0,3
0
,0
0,0
0
,1
0,7
0
,0
0,0
0
,0
0,7
0
,3
Pri
va
te
Hosp
ita
l/C
linic
/Docto
r 5
8,6
1
2,7
2
0,2
3
1,8
1
6,1
2
1,2
4
3,4
2
0,1
6
,4
28
,0
Oth
er
facili
ties
0,6
0
,6
1,6
1
,2
0,1
0
,0
1,0
0
,8
0,2
0
,6
Tra
ditio
nal he
ale
r 0
,0
0,3
0
,0
0,6
0
,7
0,4
0
,4
0,4
0
,3
0,4
To
tal
(Pe
r C
en
t)
10
0,0
1
00
,0
10
0,0
1
00
,0
10
0,0
1
00
,0
10
0,0
1
00
,0
10
0,0
1
00
,0
To
tal
(Th
ou
san
ds
) 3
43
37
2
70
16
2
54
0
17
9
67
3
18
3
28
7
2 8
08
Se
x a
nd
g
eo
-typ
e
Urb
an
R
ura
l R
SA
Ma
le
Pu
blic
Ho
sp
ita
l 8
,5
6,6
7
,9
Pu
blic
Clin
ic
42
,7
83
,6
56
,4
Pu
blic
Oth
er
0,1
0
,8
0,3
Pri
va
te
Hosp
ita
l/C
linic
/Docto
r 4
7,8
8
,4
34
,5
Oth
er
facili
ties
0,6
0
,3
0,5
Tra
ditio
nal he
ale
r 0
,4
0,3
0
,3
To
tal
(Pe
r C
en
t)
10
0,0
1
00
,0
10
0,0
To
tal
(Th
ou
san
ds
) 1
18
6
60
1
1 7
87
Fe
male
Pu
blic
Ho
sp
ita
l 9
,1
6,1
8
,0
Pu
blic
Clin
ic
48
,5
86
,8
62
,8
Pu
blic
Oth
er
0,1
0
,6
0,3
Pri
va
te
Hosp
ita
l/C
linic
/Docto
r 4
1,2
5
,9
28
,0
Oth
er
facili
ties
0,7
0
,4
0,6
Tra
ditio
nal he
ale
r 0
,4
0,2
0
,4
To
tal
(Pe
r C
en
t)
10
0,0
1
00
,0
10
0,0
To
tal
(Th
ou
san
ds
) 1
75
5
1 0
53
2 8
08
S
ou
rce:
GH
S 2
016

ST
AT
IST
ICS
SO
UT
H A
FR
ICA
93
Vul
nera
ble
Gro
ups
Indi
cato
r, 2
016
(Rep
ort 0
3-19
-02)
Tab
le 4
.4.2
: P
erc
en
tag
e o
f o
lder
pe
rso
ns w
ith
acce
ss t
o m
ed
ical
aid
, 2
016
Dis
ag
gre
gati
on
Urb
an
R
ura
l R
SA
Ge
o-t
yp
e
Ma
le
%
37
,6
6,0
2
7,0
Ma
les w
ith
access t
o m
edic
al a
id
44
2
36
47
8
Ma
le p
op
ula
tio
n(T
ho
usan
ds)
1 1
75
59
3
1 7
68
Fe
male
%
3
2,1
3
,9
21
,5
Fe
male
s w
ith
acce
ss t
o m
ed
ica
l a
id
55
8
40
59
9
Fe
male
po
pula
tio
n(T
ho
usa
nds)
1 7
38
1 0
46
2 7
85
Bo
th
%
34
,4
4,6
2
3,7
Old
er
pe
rso
ns w
ith
acc
ess
to
me
dic
al
aid
1
00
1
76
1 0
77
Po
pu
lati
on
(T
ho
us
an
ds
) 2
91
4
1 6
39
4 5
53
Po
pu
lation
g
rou
p
Afr
ica
n/B
lac
k
Co
lou
red
In
dia
n/A
sia
n
Wh
ite
RS
A
Ma
le
%
8,4
1
6,8
5
0,7
7
6,2
2
7,0
Ma
les w
ith
access t
o m
edic
al a
id
93
30
36
32
0
47
8
Ma
le p
op
ula
tio
n(T
ho
usan
ds)
1 1
01
17
6
71
42
0
1 7
68
Fe
male
%
5
,0
18
,8
39
,0
75
,6
21
,5
Fe
male
s w
ith
acce
ss t
o m
ed
ica
l a
id
94
46
35
42
4
59
9
Fe
male
po
pula
tio
n(T
ho
usa
nds)
1 8
89
24
5
90
56
0
2 7
85
Bo
th
%
6,2
1
8,0
4
4,1
7
5,9
2
3,7
Old
er
pe
rso
ns w
ith
acc
ess
to
me
dic
al
aid
1
86
76
71
74
4
1 0
77
Po
pu
lati
on
(T
ho
us
an
ds
) 2
99
0
42
1
16
2
98
0
4 5
53
So
urc
e:
GH
S 2
016

ST
AT
IST
ICS
SO
UT
H A
FR
ICA
94
Vul
nera
ble
Gro
ups
Indi
cato
r, 2
016
(Rep
ort 0
3-19
-02)
Tab
le 4
.4.3
: P
erc
en
tag
e o
f p
ers
on
s 6
0 y
ea
rs a
nd
old
er
wh
o r
ep
ort
ed
su
fferi
ng
fro
m a
cu
te i
lln
es
ses
Co
mp
are
d t
o t
he o
vera
ll p
op
ula
tio
n, 201
6
Dis
ag
gre
gati
on
WC
E
C
NC
F
S
KZ
N
NW
G
P
MP
L
P
RS
A
Pro
vin
ce
% o
f old
er
pe
rso
ns
su
ffe
rin
g
10
,8
17
,4
14
,3
9,1
1
2,4
9
,2
17
,3
12
,6
8,7
1
3,4
Old
er
pe
rso
ns s
uff
erin
g
67
10
4
16
23
10
4
30
19
6
37
38
61
5
Old
er
pe
rso
ns
(th
ou
sa
nd
s)
61
9
59
8
11
3
25
3
84
3
32
1
1 1
32
29
8
43
0
4 6
07
% o
f p
op
ula
tio
n
su
ffe
rin
g
8,2
1
0,1
1
1,6
1
0,4
7
,1
9,7
1
4,4
1
1,3
7
,3
10
,2
To
tal
pe
rso
ns
su
ffe
rin
g
52
3
67
7
13
9
28
9
76
3
36
5
1 9
53
48
6
41
5
5 6
10
Po
pu
lati
on
(th
ou
sa
nd
) 6
36
2
6 7
31
1 1
92
2 7
69
10
807
3 7
58
13
543
4 2
90
5 7
24
55
177
Ge
o-t
yp
e
U
rba
n
Ru
ral
RS
A
% o
f old
er
pe
rso
ns
su
ffe
rin
g
13
,7
12
,8
13
,4
Old
er
pe
rso
ns s
uff
erin
g
40
3
21
3
61
5
Old
er
pe
rso
ns
(th
ou
sa
nd
s)
2 9
49
1 6
58
4 6
07
% o
f p
op
ula
tio
n
su
ffe
rin
g
11
,4
8,1
1
0,2
To
tal
pe
rso
ns
su
ffe
rin
g
4 0
13
1 5
97
5 6
10
Po
pu
lati
on
(th
ou
sa
nd
) 3
5 3
69
19
807
55
177
Se
x
M
ale
F
em
ale
B
oth
% o
f old
er
pe
rso
ns
su
ffe
rin
g
11
,1
14
,8
13
,4
Old
er
pe
rso
ns s
uff
erin
g
19
9
41
6
61
5
Old
er
pe
rso
ns
(th
ou
sa
nd
s)
1 7
92
2 8
15
4 6
07
% o
f p
op
ula
tio
n
su
ffe
rin
g
9,4
1
0,9
1
0,2
To
tal
pe
rso
ns
su
ffe
rin
g
2 5
27
3 0
82
5 6
10
Po
pu
lati
on
(th
ou
sa
nd
) 2
6 9
75
28
202
55
177
S
ou
rce:
GH
S 2
016

ST
AT
IST
ICS
SO
UT
H A
FR
ICA
95
Vul
nera
ble
Gro
ups
Indi
cato
r, 2
016
(Rep
ort 0
3-19
-02)
Tab
le 4
.4.4
: P
erc
en
tag
e o
f p
ers
on
s 6
0 y
ea
rs a
nd
old
er
wh
o r
ep
ort
ed
su
fferi
ng
fro
m c
hro
nic
illn
esse
s c
om
pare
d t
o t
he o
vera
ll p
op
ula
tio
n,
201
6
Dis
ag
gre
gati
on
WC
E
C
NC
F
S
KZ
N
NW
G
P
MP
L
P
RS
A
Pro
vin
ce
% o
f old
er
pe
rso
ns s
uff
erin
g
64
,0
65
,9
70
,3
66
,8
60
,0
60
,4
61
,8
54
,2
36
,0
59
,8
Old
er
pe
rso
ns s
uff
erin
g
39
6
39
4
79
16
9
50
6
19
4
69
9
16
2
15
5
2 7
54
Old
er
pe
rso
ns
(Th
ou
san
ds
) 6
19
59
8
11
3
25
3
84
3
32
1
1 1
32
29
8
43
0
4 6
07
% o
f p
op
ula
tio
n s
uff
eri
ng
1
9,7
1
6,7
2
1,5
1
9,6
1
4,4
1
6,9
1
5,8
1
4,1
8
,4
15
,6
To
tal
pe
rso
ns
su
ffe
rin
g
1 2
56
1 1
24
25
7
54
4
1 5
55
63
3
2 1
39
60
6
48
3
8 5
97
Po
pu
lati
on
(T
ho
us
an
ds
) 6
36
2
6 7
31
1 1
92
2 7
69
10
807
3 7
58
13
543
4 2
90
5 7
24
55
177
Ge
o-t
yp
e
U
rba
n
Ru
ral
RS
A
% o
f old
er
pe
rso
ns s
uff
erin
g
63
,0
54
,0
59
,8
Old
er
pe
rso
ns s
uff
erin
g
1 8
58
89
6
2 7
54
Old
er
pe
rso
ns
(Th
ou
san
ds
) 2
94
9
1 6
58
4 6
07
% o
f p
op
ula
tio
n s
uff
eri
ng
1
6,7
1
3,6
1
5,6
To
tal
pe
rso
ns
su
ffe
rin
g
5 9
08
2 6
89
8 5
97
Po
pu
lati
on
(T
ho
us
an
ds
) 3
5 3
69
19
807
55
177
Se
x
M
ale
F
em
ale
B
oth
% o
f old
er
pe
rso
ns s
uff
erin
g
52
,2
64
,6
59
,8
Old
er
pe
rso
ns s
uff
erin
g
93
5
1 8
19
2 7
54
Old
er
pe
rso
ns
(Th
ou
san
ds
) 1
79
2
2 8
15
4 6
07
% o
f p
op
ula
tio
n s
uff
eri
ng
1
2,0
1
9,0
1
5,6
To
tal
pe
rso
ns
su
ffe
rin
g
3 2
48
5 3
49
8 5
97
Po
pu
lati
on
(T
ho
us
an
ds
) 2
6 9
75
28
202
55
177
S
ou
rce:
GH
S 2
016
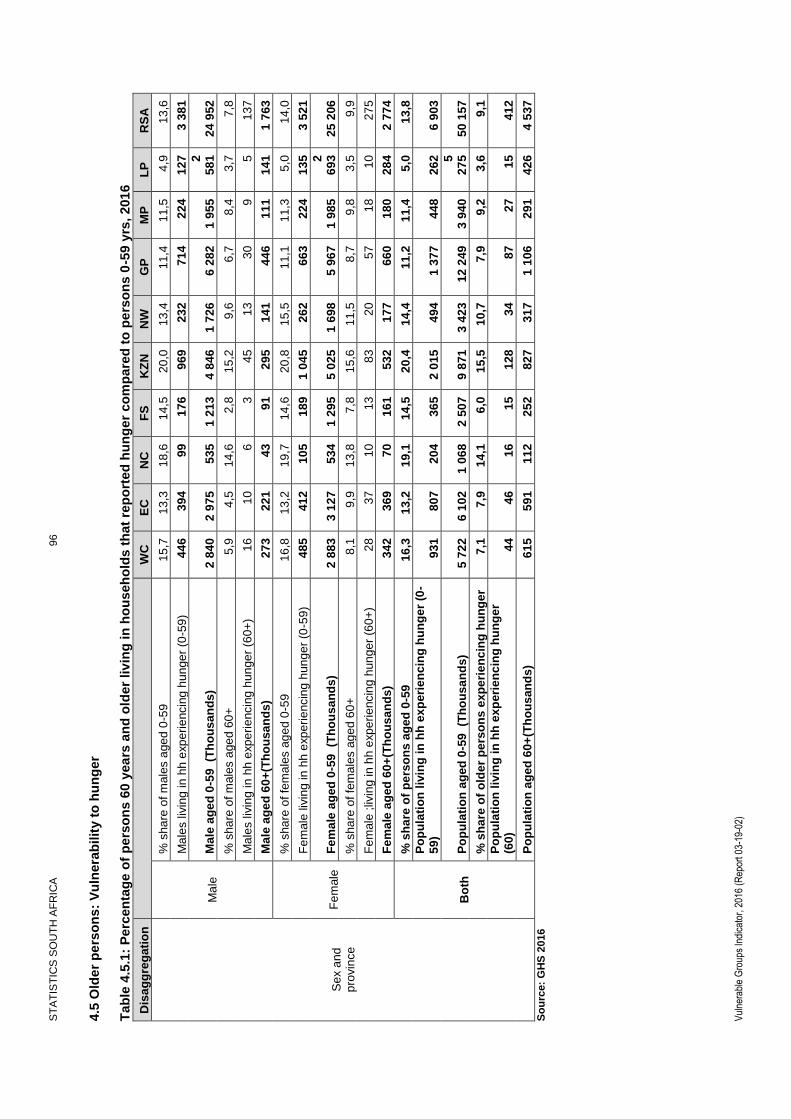
ST
AT
IST
ICS
SO
UT
H A
FR
ICA
96
Vul
nera
ble
Gro
ups
Indi
cato
r, 2
016
(Rep
ort 0
3-19
-02)
4.5
Old
er
pe
rso
ns:
Vu
lnera
bilit
y t
o h
un
ger
T
ab
le 4
.5.1
: P
erc
en
tag
e o
f p
ers
on
s 6
0 y
ea
rs a
nd
old
er
liv
ing
in
ho
useh
old
s t
hat
rep
ort
ed
hu
ng
er
co
mp
are
d t
o p
ers
on
s 0
-59
yrs
, 201
6
Dis
ag
gre
gati
on
W
C
EC
N
C
FS
K
ZN
N
W
GP
M
P
LP
R
SA
Se
x a
nd
p
rovin
ce
Ma
le
% s
ha
re o
f m
ale
s a
ge
d 0
-59
15
,7
13
,3
18
,6
14
,5
20
,0
13
,4
11
,4
11
,5
4,9
1
3,6
Ma
les liv
ing
in
hh
exp
eri
encin
g h
un
ge
r (0
-59
) 4
46
39
4
99
17
6
96
9
23
2
71
4
22
4
12
7
3 3
81
Ma
le a
ge
d 0
-59
(Th
ou
sa
nd
s)
2 8
40
2 9
75
53
5
1 2
13
4 8
46
1 7
26
6 2
82
1 9
55
2
58
1
24
952
% s
ha
re o
f m
ale
s a
ge
d 6
0+
5
,9
4,5
1
4,6
2
,8
15
,2
9,6
6
,7
8,4
3
,7
7,8
Ma
les liv
ing
in
hh
exp
eri
encin
g h
un
ge
r (6
0+
) 1
6
10
6
3
45
13
30
9
5
13
7
Ma
le a
ge
d 6
0+
(Th
ou
sa
nd
s)
27
3
22
1
43
91
29
5
14
1
44
6
11
1
14
1
1 7
63
Fe
male
% s
ha
re o
f fe
ma
les a
ge
d 0
-59
16
,8
13
,2
19
,7
14
,6
20
,8
15
,5
11
,1
11
,3
5,0
1
4,0
Fe
male
liv
ing
in
hh
exp
eri
encin
g h
un
ge
r (0
-59
) 4
85
41
2
10
5
18
9
1 0
45
26
2
66
3
22
4
13
5
3 5
21
Fe
ma
le a
ged
0-5
9
(Th
ou
sa
nd
s)
2 8
83
3 1
27
53
4
1 2
95
5 0
25
1 6
98
5 9
67
1 9
85
2
69
3
25
206
% s
ha
re o
f fe
ma
les a
ge
d 6
0+
8
,1
9,9
1
3,8
7
,8
15
,6
11
,5
8,7
9
,8
3,5
9
,9
Fe
male
;liv
ing
in
hh
exp
eri
encin
g h
un
ge
r (6
0+
) 2
8
37
10
13
83
20
57
18
10
27
5
Fe
ma
le a
ged
60+
(Th
ou
sa
nd
s)
34
2
36
9
70
16
1
53
2
17
7
66
0
18
0
28
4
2 7
74
Bo
th
% s
ha
re o
f p
ers
on
s a
ge
d 0
-59
1
6,3
1
3,2
1
9,1
1
4,5
2
0,4
1
4,4
1
1,2
1
1,4
5
,0
13
,8
Po
pu
lati
on
liv
ing
in
hh
ex
peri
en
cin
g h
un
ge
r (0
-5
9)
93
1
80
7
20
4
36
5
2 0
15
49
4
1 3
77
44
8
26
2
6 9
03
Po
pu
lati
on
ag
ed
0-5
9
(Th
ou
sa
nd
s)
5 7
22
6 1
02
1 0
68
2 5
07
9 8
71
3 4
23
12
249
3 9
40
5
27
5
50
157
% s
ha
re o
f o
lde
r p
ers
on
s e
xp
eri
en
cin
g h
un
ge
r 7
,1
7,9
1
4,1
6
,0
15
,5
10
,7
7,9
9
,2
3,6
9
,1
Po
pu
lati
on
liv
ing
in
hh
ex
peri
en
cin
g h
un
ge
r (6
0)
44
46
16
15
12
8
34
87
27
15
41
2
Po
pu
lati
on
ag
ed
60+
(Th
ou
san
ds
) 6
15
59
1
11
2
25
2
82
7
31
7
1 1
06
29
1
42
6
4 5
37
So
urc
e:
GH
S 2
016
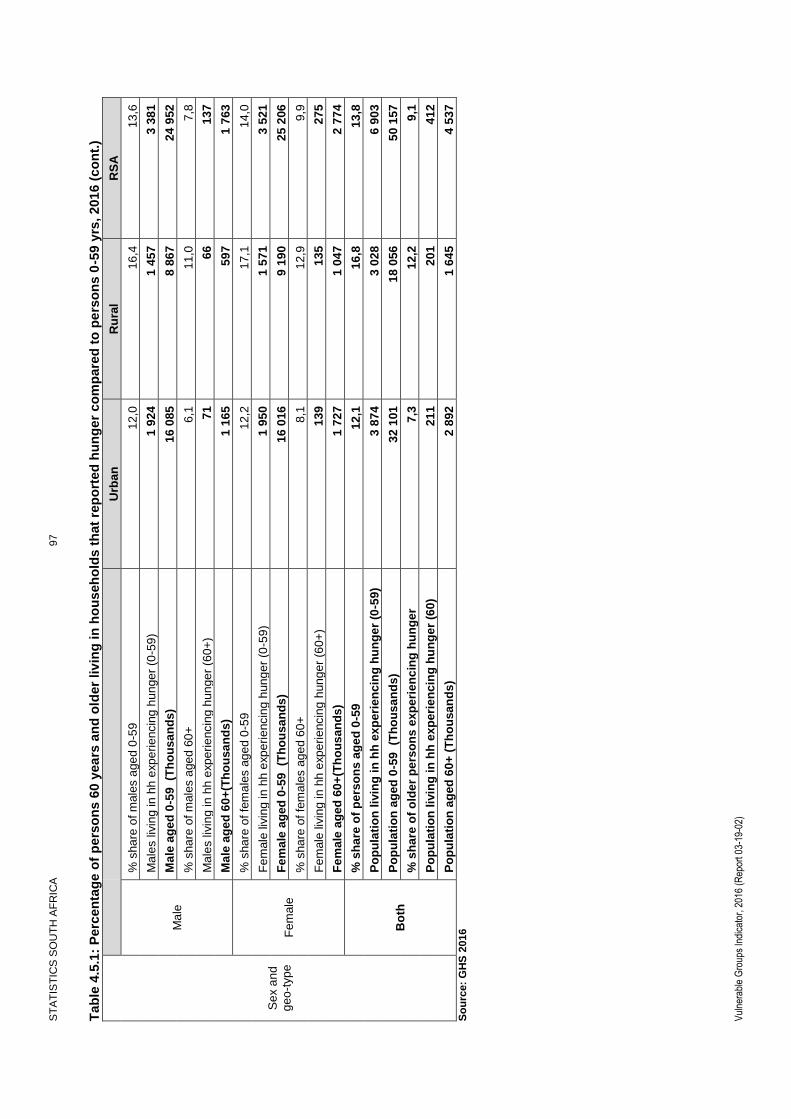
ST
AT
IST
ICS
SO
UT
H A
FR
ICA
97
Vul
nera
ble
Gro
ups
Indi
cato
r, 2
016
(Rep
ort 0
3-19
-02)
Tab
le 4
.5.1
: P
erc
en
tag
e o
f p
ers
on
s 6
0 y
ea
rs a
nd
old
er
liv
ing
in
ho
useh
old
s t
hat
rep
ort
ed
hu
ng
er
co
mp
are
d t
o p
ers
on
s 0
-59
yrs
, 201
6 (
co
nt.
)
Se
x a
nd
g
eo
-typ
e
Urb
an
R
ura
l R
SA
Ma
le
% s
ha
re o
f m
ale
s a
ge
d 0
-59
12
,0
16
,4
13
,6
Ma
les liv
ing
in
hh
exp
eri
encin
g h
un
ge
r (0
-59
) 1
92
4
1 4
57
3 3
81
Ma
le a
ge
d 0
-59
(Th
ou
sa
nd
s)
16
085
8 8
67
24
952
% s
ha
re o
f m
ale
s a
ge
d 6
0+
6
,1
11
,0
7,8
Ma
les liv
ing
in
hh
exp
eri
encin
g h
un
ge
r (6
0+
) 7
1
66
13
7
Ma
le a
ge
d 6
0+
(Th
ou
sa
nd
s)
1 1
65
59
7
1 7
63
Fe
male
% s
ha
re o
f fe
ma
les a
ge
d 0
-59
12
,2
17
,1
14
,0
Fe
male
liv
ing
in
hh
exp
eri
encin
g h
un
ge
r (0
-59
) 1
95
0
1 5
71
3 5
21
Fe
ma
le a
ged
0-5
9
(Th
ou
sa
nd
s)
16
016
9 1
90
25
206
% s
ha
re o
f fe
ma
les a
ge
d 6
0+
8
,1
12
,9
9,9
Fe
male
liv
ing
in
hh
exp
eri
encin
g h
un
ge
r (6
0+
) 1
39
13
5
27
5
Fe
ma
le a
ged
60+
(Th
ou
sa
nd
s)
1 7
27
1 0
47
2 7
74
Bo
th
% s
ha
re o
f p
ers
on
s a
ge
d 0
-59
1
2,1
1
6,8
1
3,8
Po
pu
lati
on
liv
ing
in
hh
ex
peri
en
cin
g h
un
ge
r (0
-59
) 3
87
4
3 0
28
6 9
03
Po
pu
lati
on
ag
ed
0-5
9
(Th
ou
sa
nd
s)
32
101
18
056
50
157
% s
ha
re o
f o
lde
r p
ers
on
s e
xp
eri
en
cin
g h
un
ge
r 7
,3
12
,2
9,1
Po
pu
lati
on
liv
ing
in
hh
ex
peri
en
cin
g h
un
ge
r (6
0)
21
1
20
1
41
2
Po
pu
lati
on
ag
ed
60+
(T
ho
usa
nd
s)
2 8
92
1 6
45
4 5
37
So
urc
e:
GH
S 2
016

ST
AT
IST
ICS
SO
UT
H A
FR
ICA
98
Vul
nera
ble
Gro
ups
Indi
cato
r, 2
016
(Rep
ort 0
3-19
-02)
4.6
Old
er
pe
rso
ns:
Ed
uca
tio
n
Tab
le 4
.6.1
: P
erc
en
tag
e o
f o
lder
pe
rso
ns w
ho
are
fu
ncti
on
all
y lit
era
te b
y s
ex
, 201
6
Dis
ag
gre
gati
on
W
C
EC
N
C
FS
K
ZN
N
W
GP
M
P
LP
R
SA
Se
x a
nd
p
rovin
ce
Ma
le
% s
ha
re o
f fu
nctio
nally
lite
rate
m
ale
s
82
,3
49
,7
53
,2
49
,5
54
,6
49
,8
77
,9
40
,0
41
,6
61
,5
Fu
nctio
na
lly lite
rate
ma
les
(Th
ou
sa
nds)
22
6
11
1
23
45
16
4
70
35
6
46
60
11
01
All
ma
les
(Th
ousa
nds)
27
5
22
4
43
91
30
1
14
2
45
7
11
6
14
3
17
90
Fe
male
% s
ha
re o
f fu
nctio
nally
lite
rate
fe
male
s
82
,1
50
,5
48
,5
52
,0
40
,4
48
,3
75
,4
38
,9
18
,9
54
,3
Fu
nctio
na
lly lite
rate
fem
ale
s
(Th
ou
sa
nds)
28
1
18
8
34
84
21
8
87
50
9
70
54
15
26
All
fem
ale
s (T
ho
usan
ds)
34
3
37
2
69
16
1
54
1
18
0
67
5
18
1
28
7
28
09
Bo
th
% s
ha
re o
f fu
nc
tio
nall
y l
ite
rate
p
ers
on
s
82
,2
50
,2
50
,3
51
,1
45
,4
49
,0
76
,4
39
,3
26
,5
57
,1
Fu
nc
tio
na
lly l
ite
rate
pe
rso
ns
(Th
ou
san
ds
) 5
08
29
9
57
12
9
38
2
15
7
86
5
11
7
11
4
26
27
To
tal
po
pu
lati
on
ag
ed
60
+
(Th
ou
san
ds
) 6
18
59
5
11
3
25
2
84
2
32
1
11
32
29
7
43
0
45
99
Se
x a
nd
ge
o-
typ
e
Urb
an
R
ura
l R
SA
Ma
le
% s
ha
re o
f fu
nctio
nally
lite
rate
m
ale
s
75
,4
34
,2
61
,5
Fu
nctio
na
lly lite
rate
ma
les
(Th
ou
sa
nds)
89
5
20
6
11
01
All
ma
les
(Th
ousa
nds)
11
88
60
2
17
90
Fe
male
% s
ha
re o
f fu
nctio
nally
lite
rate
fe
male
s
71
,7
25
,4
54
,3
Fu
nctio
na
lly lite
rate
fem
ale
s
(Th
ou
sa
nds)
12
59
26
7
15
26
All
fem
ale
s (T
ho
usan
ds)
17
57
10
53
28
09
Bo
th
% s
ha
re o
f fu
nc
tio
nall
y l
ite
rate
p
ers
on
s
73
,2
28
,6
57
,1
Fu
nc
tio
na
lly l
ite
rate
pe
rso
ns
(Th
ou
san
ds
) 2
15
4
47
3
26
27
To
tal
po
pu
lati
on
ag
ed
60
+
(Th
ou
san
ds
) 2
94
4
16
55
45
99
Se
x a
nd
P
op
ula
tion
g
rou
p
Bla
ck
A
fric
an
C
olo
ure
d
Ind
ian
/As
ian
W
hit
e
RS
A
Ma
le
% s
ha
re o
f fu
nctio
nally
lite
rate
m
ale
s
44
,4
68
,8
87
,8
98
,8
61
,5
Fu
nctio
na
lly lite
rate
ma
les
(Th
ou
sa
nds)
49
5
12
1
64
42
1
11
01
All
ma
les
(Th
ousa
nds)
11
16
17
6
73
42
6
17
90
Fe
male
% s
ha
re o
f fu
nctio
nally
lite
rate
fe
male
s
38
,5
70
,3
71
,9
97
,3
54
,3
Fu
nctio
na
lly lite
rate
fem
ale
s
(Th
ou
sa
nds)
73
3
17
3
65
55
4
15
26
All
fem
ale
s (T
ho
usan
ds)
19
03
24
6
91
57
0
28
09
Bo
th
% s
ha
re o
f fu
nc
tio
nall
y l
ite
rate
p
ers
on
s
40
,7
69
,7
79
,0
97
,9
57
,1
Fu
nc
tio
na
lly l
ite
rate
pe
rso
ns
(Th
ou
san
ds
) 1
22
9
29
4
12
9
97
5
26
27
To
tal
po
pu
lati
on
ag
ed
60
+
(Th
ou
san
ds
) 3
01
8
42
1
16
4
99
6
45
99
S
ou
rce:
GH
S 2
016 *
Tota
ls r
efe
r to
the p
opula
tio
n o
f old
er
pers
ons a
nd e
xclu
de u
nspecifie
d c
ases

ST
AT
IST
ICS
SO
UT
H A
FR
ICA
99
Vul
nera
ble
Gro
ups
Indi
cato
r, 2
016
(Rep
ort 0
3-19
-02)
Tab
le 4
.6.2
: P
erc
en
tag
e d
istr
ibu
tio
n o
f th
e h
igh
est
lev
el o
f ed
ucati
on
ob
tain
ed
by o
lder
pers
on
s,
2016
D
isa
gg
reg
ati
on
WC
E
C
NC
F
S
KZ
N
NW
G
P
MP
L
P
RS
A
Pro
vin
ce
Le
ss t
han
ma
tric
5
5,2
8
7,5
8
4,7
7
9,0
8
3,6
8
1,8
5
9,6
8
4,2
9
1,8
7
4,8
Ma
tric
1
9,2
5
,2
7,1
9
,0
5,9
7
,1
18
,8
10
,4
4,3
1
1,2
Oth
er
tert
iary
8
,6
3,7
4
,0
8,2
4
,0
3,7
6
,4
3,2
1
,5
5,1
Gra
du
ate
s
14
,8
2,9
3
,2
2,4
4
,1
3,8
1
0,7
2
,0
0,5
6
,4
Oth
er
2,1
0
,7
1,1
1
,5
2,4
3
,5
4,5
0
,3
1,9
2
,5
Pe
r c
en
t 1
00
,0
10
0,0
1
00
,0
10
0,0
1
00
,0
10
0,0
1
00
,0
10
0,0
1
00
,0
10
0,0
To
tal*
(Th
ou
sa
nd
s)
61
8
59
5
11
3
25
2
84
2
32
1
1 1
32
29
7
43
0
4 5
99
Ge
o-t
yp
e
U
rba
n
Ru
ral
RS
A
Le
ss t
han
ma
tric
6
4,6
9
3,0
7
4,8
Ma
tric
1
6,1
2
,4
11
,2
Oth
er
tert
iary
6
,7
2,2
5
,1
Gra
du
ate
s
9,6
0
,7
6,4
Oth
er
2,9
1
,8
2,5
Pe
r c
en
t 1
00
,0
10
0,0
1
00
,0
To
tal*
(Th
ou
sa
nd
s)
2 9
44
1 6
55
4 5
99
Po
pu
lation
g
rou
p
B
lac
k
Afr
ica
n
Co
lou
red
In
dia
n/A
sia
n
Wh
ite
RS
A
Le
ss t
han
ma
tric
8
9,6
8
3,0
7
1,9
2
7,2
7
4,8
Ma
tric
3
,4
5,9
1
5,5
3
6,4
1
1,2
Oth
er
tert
iary
2
,6
3,5
1
,8
13
,8
5,1
Gra
du
ate
s
2,0
4
,7
7,2
2
0,4
6
,4
Oth
er
2,4
2
,9
3,7
2
,2
2,5
Pe
r c
en
t 1
00
,0
10
0,0
1
00
,0
10
0,0
1
00
,0
To
tal*
(Th
ou
sa
nd
s)
3 0
18
42
1
16
4
99
6
4 5
99
Se
x a
nd
P
op
ula
tion
g
rou
p
M
ale
F
em
ale
R
SA
Le
ss t
han
ma
tric
7
0,0
7
7,9
7
4,8
Ma
tric
1
3,3
9
,8
11
,2
Oth
er
tert
iary
5
,4
4,9
5
,1
Gra
du
ate
s
8,5
5
,1
6,4
Oth
er
2,8
2
,3
2,5
Pe
r c
en
t 1
00
,0
10
0,0
1
00
,0
To
tal*
(Th
ou
sa
nd
s)
1 7
90
2 8
09
4 5
99
S
ou
rce:
GH
S 2
016
* T
ota
ls r
efe
r to
the p
opula
tio
n o
f old
er
pers
ons a
nd e
xclu
de u
nspecifie
d c
ases

ST
AT
IST
ICS
SO
UT
H A
FR
ICA
100
Vul
nera
ble
Gro
ups
Indi
cato
r, 2
016
(Rep
ort 0
3-19
-02)
4.7
Old
er
pe
rso
ns:
Ho
usin
g a
nd
basic
se
rvic
es
T
ab
le 4
.7.1
: P
erc
en
tag
e d
istr
ibu
tio
n o
f p
ers
on
s 6
0 y
ears
an
d o
lder
liv
ing
in
fo
rmal, in
form
al
an
d t
rad
itio
nal h
ou
sin
g,
2016
D
isa
gg
reg
ati
on
WC
E
C
NC
F
S
KZ
N
NW
G
P
MP
L
P
RS
A
Pro
vin
ce
Fo
rmal
97
,7
68
,0
94
,9
91
,8
77
,8
93
,8
94
,9
91
,1
95
,3
88
,2
Tra
ditio
nal
0,1
2
8,9
0
,2
3,5
2
0,6
0
,4
0,0
5
,1
2,3
8
,3
Info
rma
l 1
,4
2,2
4
,9
4,8
1
,6
5,9
4
,5
3,8
2
,4
3,1
Oth
er
0,7
0
,9
0,0
0
,0
0,0
0
,0
0,7
0
,0
0,0
0
,4
Pe
r c
en
t
10
0,0
1
00
,0
10
0,0
1
00
,0
10
0,0
1
00
,0
10
0,0
1
00
,0
10
0,0
1
00
,0
To
tal
(th
ou
sa
nd
s)*
6
19
59
8
11
3
25
3
84
3
32
1
11
32
29
8
43
0
46
07
Se
x
M
ale
F
em
ale
B
oth
Fo
rmal
88
,0
88
,3
88
,2
Tra
ditio
nal
7,3
8
,9
8,3
Info
rma
l 4
,2
2,5
3
,1
Oth
er
0,5
0
,3
0,4
Pe
r c
en
t
10
0,0
1
00
,0
10
0,0
To
tal
(th
ou
sa
nd
s)*
1
79
2
28
15
46
07
Ag
e g
rou
p
6
0-6
9
70
+
RS
A
Fo
rmal
88
,3
88
,1
88
,2
Tra
ditio
nal
7,6
9
,4
8,3
Info
rma
l 3
,7
2,2
3
,1
Oth
er
0,4
0
,3
0,4
Pe
r c
en
t
10
0,0
1
00
,0
10
0,0
To
tal
(th
ou
sa
nd
s)*
2
80
9
17
97
46
07
S
ou
rce:
GH
S 2
016
Tab
le 4
.7.2
: L
ivin
g c
on
dit
ion
in
dic
ato
rs o
f p
ers
on
s 6
0 y
ears
an
d o
lde
r co
mp
are
d t
o t
ho
se o
f th
e o
vera
ll p
op
ula
tio
n,
20
16
Ag
e c
oh
ort
Ac
ce
ss
to
se
rvic
e in
dic
ato
r
Ac
ce
ss
to
pip
ed
w
ate
r
Ac
ce
ss
to
im
pro
ve
d
sa
nit
ati
on
Refu
se
/ W
as
te b
y l
oc
al
au
tho
rity
/mu
nic
ipa
lity
E
lec
tric
ity
So
lid
fu
els
fo
r co
ok
ing
%
%
%
%
%
60
+
74
,0
86
,5
65
,6
94
,2
13
,8
All
P
op
ula
tio
n
71
,2
83
,8
63
,2
89
,1
13
,2
So
urc
e:
GH
S 2
016

ST
AT
IST
ICS
SO
UT
H A
FR
ICA
101
Vul
nera
ble
Gro
ups
Indi
cato
r, 2
016
(Rep
ort 0
3-19
-02)
4.8
Old
er
pe
rso
ns:
Vio
len
ce a
nd
cri
me v
icti
ms
T
ab
le 4
.8.1
: P
erc
en
tag
e o
f o
lder
pe
rso
ns l
ivin
g in
ho
useh
old
s w
here
th
e h
ou
seh
old
s f
eel u
nsafe
or
ve
ry u
nsafe
to
walk
alo
ne in
th
eir
are
a d
uri
ng
th
e d
ay, 2
015
/16
Dis
ag
gre
gati
on
WC
E
C
NC
F
S
KZ
N
NW
G
P
MP
L
P
RS
A
Pro
vin
ce
% s
ha
re
77
,8
86
,9
92
,1
91
,5
83
,7
87
,1
75
,8
89
,5
95
,8
83
,7
Old
er
pe
rson
s(t
ho
usa
nd
s)*
4
53
45
6
10
1
23
6
63
5
26
3
82
4
24
5
37
5
3 5
87
% s
ha
re
71
,6
85
,7
87
,6
90
,6
84
,4
87
,0
77
,5
89
,6
95
,3
83
,6
Po
pu
lati
on
(t
ho
us
an
ds
)*
4 3
77
5 8
89
1 0
32
2 6
01
9 1
56
3 3
02
10
383
3 7
78
5 3
59
45
876
Se
x
M
ale
F
em
ale
R
SA
% s
ha
re
83
,3
83
,9
83
,7
Old
er
pe
rson
s(t
ho
usa
nd
s)*
1
33
5
2 2
53
3 5
87
% s
ha
re
83
,8
83
,4
83
,6
Po
pu
lati
on
(t
ho
us
an
ds
)*
22
116
23
760
45
876
S
ou
rce:
VO
CS
2015/1
6
*T
ota
ls e
xclu
de u
nspecifie
d c
ases
Tab
le 4
.8.2
: P
erc
en
tag
e o
f o
lder
pers
on
s l
ivin
g i
n h
ou
seh
old
s w
here
th
e h
ou
seh
old
s f
eel
un
safe
or
ve
ry u
nsafe
to
walk
alo
ne i
n t
heir
are
a a
t n
igh
t,
2015
/16
Dis
ag
gre
gati
on
WC
E
C
NC
F
S
KZ
N
NW
G
P
MP
L
P
RS
A
Pro
vin
ce
% s
ha
re
36
,8
29
,3
35
,3
18
,8
36
,3
22
,6
26
,2
29
,3
52
,8
32
,0
Child
ren
(th
ou
sa
nds)*
2
15
15
4
39
48
27
5
68
28
5
81
20
6
1 3
71
% s
ha
re
31
,4
27
,1
28
,2
19
,0
35
,2
28
,4
24
,3
28
,2
52
,6
30
,9
Po
pu
lati
on
(t
ho
us
an
ds
)*
1 9
14
1 8
60
33
2
54
5
3 8
08
1 0
76
3 2
43
1 1
95
2 9
55
16
930
Se
x
M
ale
F
em
ale
R
SA
% s
ha
re
33
,1
31
,3
32
,0
Child
ren
(th
ou
sa
nds)*
5
32
83
9
1 3
71
% s
ha
re
31
,2
30
,5
30
,9
Po
pu
lati
on
(t
ho
us
an
ds
)*
8 2
38
8 6
92
16
930
S
ou
rce:
VO
CS
2015/1
6
*T
ota
ls e
xclu
de u
nspecifie
d c
ases
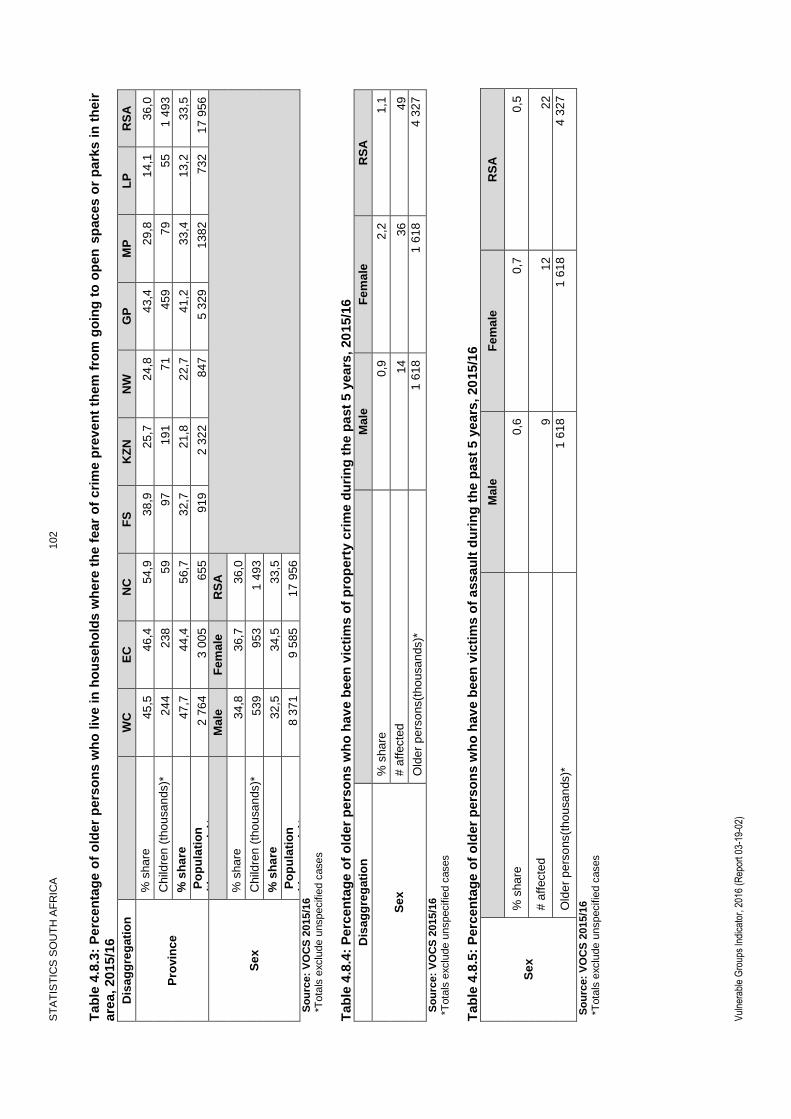
ST
AT
IST
ICS
SO
UT
H A
FR
ICA
102
Vul
nera
ble
Gro
ups
Indi
cato
r, 2
016
(Rep
ort 0
3-19
-02)
Tab
le 4
.8.3
: P
erc
en
tag
e o
f o
lder
pe
rso
ns w
ho
liv
e i
n h
ou
seh
old
s w
here
th
e f
ear
of
cri
me p
rev
en
t th
em
fro
m g
oin
g t
o o
pen
sp
aces
or
pa
rks
in
th
eir
are
a, 20
15/1
6
Dis
ag
gre
gati
on
WC
E
C
NC
F
S
KZ
N
NW
G
P
MP
L
P
RS
A
Pro
vin
ce
% s
ha
re
45
,5
46
,4
54
,9
38
,9
25
,7
24
,8
43
,4
29
,8
14
,1
36
,0
Child
ren
(th
ou
sa
nds)*
2
44
23
8
59
97
19
1
71
45
9
79
55
1 4
93
% s
ha
re
47
,7
44
,4
56
,7
32
,7
21
,8
22
,7
41
,2
33
,4
13
,2
33
,5
Po
pu
lati
on
(t
ho
us
an
ds
)*
2 7
64
3 0
05
65
5
91
9
2 3
22
84
7
5 3
29
13
82
73
2
17
956
Se
x
M
ale
F
em
ale
R
SA
% s
ha
re
34
,8
36
,7
36
,0
Child
ren
(th
ou
sa
nds)*
5
39
95
3
1 4
93
% s
ha
re
32
,5
34
,5
33
,5
Po
pu
lati
on
(t
ho
us
an
ds
)*
8 3
71
9 5
85
17
956
S
ou
rce:
VO
CS
2015
/16
*
To
tals
exclu
de u
nspecifie
d c
ases
Tab
le 4
.8.4
: P
erc
en
tag
e o
f o
lder
pe
rso
ns w
ho
hav
e b
een
vic
tim
s o
f p
rop
ert
y c
rim
e d
uri
ng
th
e p
ast
5 y
ears
, 20
15/1
6
Dis
ag
gre
gati
on
Ma
le
Fe
ma
le
RS
A
Se
x
% s
ha
re
0,9
2
,2
1,1
# a
ffecte
d
14
36
49
Old
er
pe
rso
ns(t
ho
usa
nds)*
1
61
8
1 6
18
4 3
27
S
ou
rce:
VO
CS
2015
/16
*T
ota
ls e
xclu
de u
nspecifie
d c
ases
Tab
le 4
.8.5
: P
erc
en
tag
e o
f o
lder
pe
rso
ns w
ho
hav
e b
een
vic
tim
s o
f a
ssau
lt d
uri
ng
th
e p
ast
5 y
ears
, 20
15/1
6
Se
x
M
ale
F
em
ale
R
SA
% s
ha
re
0,6
0
,7
0,5
# a
ffecte
d
9
12
22
Old
er
pe
rso
ns(t
ho
usa
nds)*
1
61
8
1 6
18
4 3
27
S
ou
rce:
VO
CS
2015
/16
*T
ota
ls e
xclu
de u
nspecifie
d c
ases

ST
AT
IST
ICS
SO
UT
H A
FR
ICA
103
Vul
nera
ble
Gro
ups
Indi
cato
r, 2
016
(Rep
ort 0
3-19
-02)
IND
ICA
TO
RS
: P
ER
SO
NS
WIT
H D
ISA
BIL
ITIE
S
Pers
ons w
ith d
isab
ilities a
re d
efin
ed a
s p
eo
ple
experi
encin
g v
ario
us le
ve
ls o
f difficultie
s in f
unction
al dom
ain
s s
uch a
s s
eein
g, h
eari
ng,
walk
ing, re
mem
bering
and c
oncentr
atin
g, self-c
are
, com
munic
ating a
nd s
ocia
l in
tera
ctio
n
5.1
Dem
og
rap
hy o
f d
isab
led
pers
on
s
Tab
le 5
.1.1
: D
istr
ibu
tio
n o
f d
isab
led
pe
rso
ns,
20
16
D
isa
gg
reg
ati
on
WC
E
C
NC
F
S
KZ
N
NW
G
P
MP
L
P
SA
Pro
vin
ce
'00
0
36
2
52
9
11
5
28
2
83
7
29
2
81
1
29
0
32
5
38
43
%
6,3
8
,6
10
,7
11
,0
8,6
8
,8
6,7
7
,5
6,4
7
,7
Ag
e g
rou
p
5
-14
15
-24
25
-34
35
-44
45
-54
55
-64
65
+
To
tal
'00
0
38
9
25
8
29
3
33
3,8
08
57
0,5
34
74
1,5
97
12
57
,53
1
38
43
%
3,6
2
,5
3,0
4
,7
11
,15
20
,91
42
,59
7,7
Po
pu
lation
g
rou
p
B
lac
k
Afr
ica
n
Co
lou
red
In
dia
n/
As
ian
W
hit
e
SA
'00
0
30
13
33
1
10
8
39
1
38
43
%
7,6
7
,4
8,4
9
,2
7,7
Se
x
M
ale
F
em
ale
B
oth
'00
0
15
73
22
70
38
43
%
6,5
8
,9
7,7
So
urc
e:
CS
2016
5.2
Dis
ab
led
pers
on
s:
Ho
useh
old
ch
ara
cte
risti
cs
Tab
le 5
.2.1
: D
istr
ibu
tio
n o
f d
isab
led
ho
us
eh
old
s, 2
016
D
isa
gg
reg
ati
on
WC
E
C
NC
F
S
KZ
N
NW
G
P
MP
L
P
SA
Pro
vin
ce
'00
0
30
5
40
4
94
23
7
63
6
25
2
72
4
22
9
27
0
3 1
50
%
9,7
1
2,8
3
,0
7,5
2
0,2
8
,0
23
,0
7,3
8
,6
10
0,0
Po
pu
lation
gro
up
B
lac
k
Afr
ica
n
Co
lou
red
In
dia
n/
As
ian
W
hit
e
SA
'00
0
2 5
07
25
7
77
30
9
3 1
50
%
79
,6
8,2
2
,5
9,8
1
00
,0
Se
x o
f h
ea
d o
f h
ou
se
hold
M
ale
F
em
ale
B
oth
'00
0
1 4
59
1 6
91
3 1
50
%
46
,3
53
,7
10
0,0
So
urc
e:
CS
2016

ST
AT
IST
ICS
SO
UT
H A
FR
ICA
104
Vul
nera
ble
Gro
ups
Indi
cato
r, 2
016
(Rep
ort 0
3-19
-02)
Tab
le 5
.2.2
: N
um
ber
of
ho
useh
old
s w
ith
dis
ab
led
ho
useh
old
head
s, 20
16
D
isa
gg
reg
ati
on
WC
E
C
NC
F
S
KZ
N
NW
G
P
MP
L
P
SA
Pro
vin
ce
'00
0
19
1
28
7
61
15
2
44
1
15
4
45
2
15
2
16
2
2 0
53
%
9,3
1
4,0
3
,0
7,4
2
1,5
7
,5
22
,0
7,4
7
,9
10
0,0
Se
x o
f h
ea
d o
f h
ou
se
hold
M
ale
F
em
ale
B
oth
'00
0
82
9
1 2
24
2 0
53
%
40
,4
59
,6
10
0,0
So
urc
e:
CS
2016
5.3
Dis
ab
led
pers
on
s:
Ed
ucati
on
T
ab
le 5
.3.1
: P
erc
en
tag
e d
istr
ibu
tio
n o
f th
e e
du
cati
on
al att
ain
men
t o
f d
isab
led
pers
on
s a
ged
25 a
nd
ab
ov
e, 2016
D
isa
gg
reg
ati
on
WC
E
C
NC
F
S
KZ
N
NW
G
P
MP
L
P
SA
Se
x a
nd
p
rovin
ce
No s
ch
oo
ling
8,5
2
1,4
2
1,8
1
5,7
2
6,6
2
4,6
1
1,4
3
5,8
4
0,2
2
1,4
So
me
pri
ma
ry
21
,3
29
,1
28
,8
28
,9
25
,7
26
,8
18
,5
21
,8
20
,1
23
,8
Com
ple
ted
prim
ary
8
,3
7,9
8
,2
7,2
5
,8
6,6
6
,1
5,0
4
,9
6,5
So
me
seco
nda
ry
32
,2
27
,9
25
,9
27
,7
22
,6
26
,0
33
,7
20
,0
18
,9
27
,0
Gra
de
12
/ S
tand
ard
10
1
6,4
8
,2
9,5
1
2,9
1
2,9
1
0,2
1
7,4
1
0,6
9
,2
12
,8
Hig
he
r 8
,7
4,0
3
,1
5,3
5
,2
2,9
8
,4
4,1
4
,1
5,7
Oth
er
4,6
1
,5
2,9
2
,3
1,3
2
,9
4,5
2
,7
2,6
2
,8
(To
tal)
Pe
r c
en
t 1
00
,0
10
0,0
1
00
,0
10
0,0
1
00
,0
10
0,0
1
00
,0
10
0,0
1
00
,0
10
0,0
(To
tal)
Th
ou
san
ds
32
4
43
4
99
23
0
68
1
23
8
70
4
23
5
24
9
3 1
94
Se
x a
nd
P
op
ula
tion
g
rou
p
U
rba
n
Ru
ral
SA
No s
ch
oo
ling
18
,8
23
,0
21
,4
So
me
pri
ma
ry
23
,3
24
,1
23
,8
Com
ple
ted
prim
ary
6
,2
6,7
6
,5
So
me
seco
nda
ry
27
,6
26
,6
27
,0
Gra
de
12
/ S
tand
ard
10
1
4,3
1
2,0
1
2,8
Hig
he
r 6
,6
5,1
5
,7
Oth
er
3,3
2
,5
2,8
(To
tal)
Pe
r c
en
t 1
00
,0
10
0,0
1
00
,0
(To
tal)
Th
ou
san
ds
1 2
35
1 9
59
3 1
94
S
ou
rce:
CS
2016
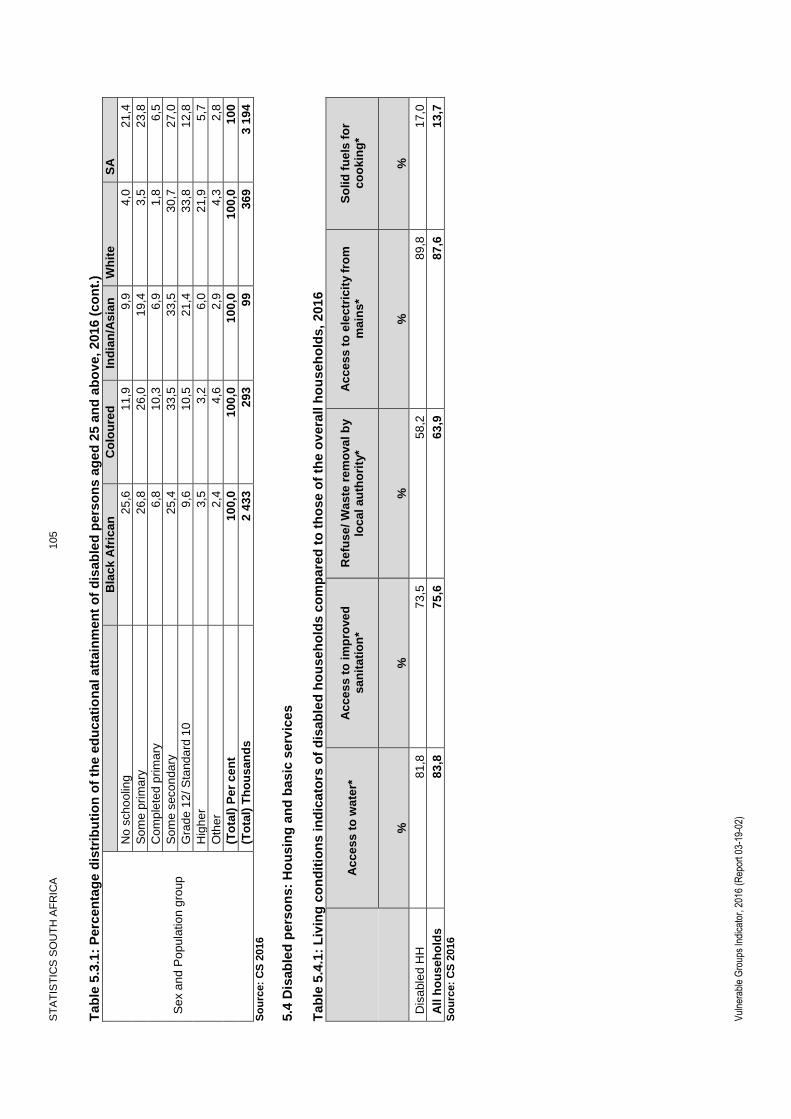
ST
AT
IST
ICS
SO
UT
H A
FR
ICA
105
Vul
nera
ble
Gro
ups
Indi
cato
r, 2
016
(Rep
ort 0
3-19
-02)
Tab
le 5
.3.1
: P
erc
en
tag
e d
istr
ibu
tio
n o
f th
e e
du
cati
on
al att
ain
men
t o
f d
isab
led
pers
on
s a
ged
25 a
nd
ab
ov
e, 2016 (
co
nt.
)
Se
x a
nd
Po
pu
latio
n g
roup
B
lac
k A
fric
an
C
olo
ure
d
Ind
ian
/As
ian
W
hit
e
SA
No s
ch
oo
ling
25
,6
11
,9
9,9
4
,0
21
,4
So
me
pri
ma
ry
26
,8
26
,0
19
,4
3,5
2
3,8
Com
ple
ted
prim
ary
6
,8
10
,3
6,9
1
,8
6,5
So
me
seco
nda
ry
25
,4
33
,5
33
,5
30
,7
27
,0
Gra
de
12
/ S
tand
ard
10
9
,6
10
,5
21
,4
33
,8
12
,8
Hig
he
r 3
,5
3,2
6
,0
21
,9
5,7
Oth
er
2,4
4
,6
2,9
4
,3
2,8
(To
tal)
Pe
r c
en
t 1
00
,0
10
0,0
1
00
,0
10
0,0
1
00
(To
tal)
Th
ou
san
ds
2
43
3
29
3
99
36
9
3 1
94
So
urc
e:
CS
2016
5.4
Dis
ab
led
pers
on
s:
Ho
usin
g a
nd
basic
serv
ice
s
Tab
le 5
.4.1
: L
ivin
g c
on
dit
ion
s in
dic
ato
rs o
f d
isab
led
ho
useh
old
s c
om
pa
red
to
th
ose o
f th
e o
vera
ll h
ou
seh
old
s,
201
6
Ac
ce
ss
to
wa
ter*
A
cc
es
s t
o i
mp
rove
d
sa
nit
ati
on
* R
efu
se
/ W
as
te r
em
ova
l b
y
loc
al a
uth
ori
ty*
Ac
ce
ss
to
ele
ctr
icit
y f
rom
m
ain
s*
So
lid
fu
els
fo
r c
oo
kin
g*
%
%
%
%
%
Dis
able
d H
H
81
,8
73
,5
58
,2
89
,8
17
,0
All
ho
us
eh
old
s
83
,8
75
,6
63
,9
87
,6
13
,7
So
urc
e:
CS
2016

ISBN: 978-0-621-45745-2