vulnerability and bargaining power in eu-russia gas relations
TRANSCRIPT
FIW, a collaboration of WIFO (www.wifo.ac.at), wiiw (www.wiiw.ac.at) and WSR (www.wsr.ac.at)
Vulnerability and Bargaining Power in EU-Russia Gas Relations
Edward Hunter CHRISTIE, Pavel K. BAEV, Volodymyr GOLOVKO
FIW-Research Reports 2010/11 N° 03 March 2011
This report contains three separate papers, each addressing selected issues concerning natural gas policy and security of gas supply in Europe. The over-arching themes are vulnerability (to supply disruptions, to supplier pricing power) and fragmentation; and measures designed to overcome them, namely interconnection and consolidation of bargaining power. The first paper contains a review of some of the economic effects of, and subsequent policy reactions to, the January 2009 cut of Russian gas supplies through the Ukraine Corridor, with a particular focus on Bulgaria and on EU policy. The second paper provides an analysis of the current state of gas relations between Ukraine and the Russian Federation, with a focus on the Ukrainian perspective and on recent political developments in that country. The third paper provides an analysis of the case for consolidating buyer power in line with the concept of an EU Gas Purchasing Agency. Keywords: Natural gas, security of supply, supply disruption, interconnector,
Russia, Ukraine, Bulgaria, European Union, energy policy, fragmentation, bargaining power, countervailing power, gas purchasing agency
JEL classification: C78, L11, Q34, Q48
The FIW-Research Reports 2010/11 present the results of six thematic work packages “The financial and economic crisis of 2007-2010 and the European economy“, “Modelling the Effects of Trade Policy and the Transmission Mechanisms of the Economic Crisis on the Austrian Economy“, “The Gravity Equation“, “Macroeconomic Aspects of European Integration“, “Effects of International Integration on Income Distribution“ and “New Energy Policy and Security of Gas Supply“, that were announced by the Austrian Federal Ministry of Economics, Family and Youth (BMWFJ) within the framework of the “Research Centre International Economics” (FIW) in January 2010.
FIW-Research Reports 2010/11
Abstract

Vulnerability and Bargaining Power in EU-Russia Gas Relations
31 January 2011
Lead author:
Edward Hunter CHRISTIE, Research Partner, PEI (Finland)
Contributing authors:
Pavel K. BAEV, Research Professor, PRIO (Norway)
Volodymyr GOLOVKO, Centre for Political Analysis (Ukraine)
Rahlgasse 3 Telefon: (+43-1) 533 66 10 E-Mail: [email protected]
A-1060 Vienna Fax: (+43-1) 533 66 10-50 Website: www.wiiw.ac.at
Wiener Institut für
Internationale
Wirtschaftsvergleiche
The Vienna Institute
for International
Economic Studies


Contents
Summary ....................................................................................................................... i
Paper 1: The 2009 Russia-Ukraine gas supply cut: economic effects and policy reactions
1. Introduction ............................................................................................................... 1
2. Economic background: the 2008-2009 recession ...................................................... 1
3. Anatomy of a shortfall ............................................................................................... 5
4. The economic cost of the supply cut in Bulgaria ....................................................... 8
5. Resilience variables: storage, diversification and LNG ............................................ 11
6. Policy choices for increased energy system resilience ............................................ 14
7. A virtual pipeline system in the making ................................................................... 18
8. Conclusions ............................................................................................................ 20
Paper 2: Ukrainian gas security after the January 2009 supply cut
1. Introduction ............................................................................................................. 22
2. The Russian Gas Price Explosion of 2005-2009 ..................................................... 23
3. Developments under the Yanukovych Presidency .................................................. 27
4. Key drivers of Ukraine’s current political orientation ................................................ 31
5. In search of energy policy independence? .............................................................. 37
6. Conclusions ............................................................................................................ 39
Paper 3: The potential for an EU Gas Purchasing Agency
1. Introduction ............................................................................................................. 42
2. Prospects for EU gas import demand...................................................................... 43
3. Modelling framework ............................................................................................... 46
4. Numerical simulations ............................................................................................. 52
5. Two questions for further research .......................................................................... 54
7. Conclusions ............................................................................................................ 57
References ................................................................................................................. 58

List of Tables and Figures
Paper 1: The 2009 Russia-Ukraine gas supply cut: economic effects and policy reactions
Table 1 Import shortfall and emergency responses, EU Member States ................................ 5
Table 2 Import shortfall and emergency responses, Energy Community countries................. 6
Table 3 Monthly gas imports by country of origin, Dec. 2008 and Jan. 2009 ........................ 13
Figure 1 Real GDP downturn in selected CEECs, 2010Q1 on 2008Q1 (%) ............................. 2
Figure 2 Evolution of real quarterly GDP, selected EU countries, 2007Q1 to 2009Q4 ............. 3
Figure 3 Energy import bill increase (% of GDP) from 2007 to 2008, CEECs .......................... 4
Figure 4 Cross-border gas supply responses to the January 2009 supply cut ......................... 6
Figure 5 Monthly gas consumption, Dec 2008 – Feb 2009, selected countries........................ 7
Figure 6 Bulgarian industrial production, change on previous month (%) ................................. 9
Figure 7 New orders in Bulgarian manufacturing, change on previous month (%) ................... 9
Figure 8 Actual versus projected monthly gas consumption, Bulgaria, Terajoules GCV ........ 10
Figure 8 The role of storage: January 2009 vs. January 2008, selected countries ................ 12
Figure 9 Illustration of the security of supply cost curve .......................................................... 14
Figure 10 Bulgaria’s potential as a highly interconnected gas market ...................................... 16
Figure 11 Map of the Energy Community’s Southeast Europe Gas Ring ................................. 18
Figure 12 Map of the New Europe Transmission System (NETS) ............................................ 19
Paper 2: Ukrainian gas security after the January 2009 supply cut
Table 1 Gas prices for Ukrainian customers, without tax, USD/tcm ...................................... 24
Table 2 Ukraine: selected macroeconomic indicators 2005-2011 ......................................... 27
Table 3 Political hypotheses concerning the Yanukovych Presidency .................................. 32
Table 4 Assessment of political hypotheses .......................................................................... 34
Figure 1 Russian gas exports and supply corridor capacities to Europe (including Turkey) .. 28
Paper 3: The potential for an EU Gas Purchasing Agency
Table 1 EU gas import dependence ratio: 2008 to 2035 ........................................................ 45
Table 2 Simulation results: effect of outside option and buyer alliance ................................. 53
Figure 1 Scenario projections for EU natural gas demand to 2035, Mtoe .............................. 44
Figure 2 EU gas import demand projections, 2020-2035, billions of cubic metres ................. 44
Figure 3 Simulation of Gazprom’s gross surplus function V(Q) .............................................. 50
Figure 4 Illustration of a possible gross surplus function for a gas buyer ............................... 52

i
Summary
This report contains three separate papers, each addressing selected issues concerning
natural gas policy and security of gas supply in Europe. The over-arching themes are vul-
nerability (to supply disruptions, to supplier pricing power) and fragmentation; and meas-
ures designed to overcome them, namely interconnection and consolidation of bargaining
power. The first paper contains a review of some of the economic effects of, and subse-
quent policy reactions to, the January 2009 cut of Russian gas supplies through the
Ukraine Corridor, with a particular focus on Bulgaria and on EU policy. The second paper
provides an analysis of the current state of gas relations between Ukraine and the Russian
Federation, with a focus on the Ukrainian perspective and on recent political developments
in that country. The third paper provides an analysis of the case for consolidating buyer
power in line with the concept of an EU Gas Purchasing Agency.
Paper 1: The 2009 Russia-Ukraine gas supply cut: economic effects and policy reactions
The January 2009 gas supply cut was among the most severe energy security crises in
recent European history. Bulgaria suffered significant economic losses. Industrial produc-
tion fell (in seasonally-adjusted terms) in line with the share of natural gas in the energy
product mix in Bulgarian industry, namely 23% for the 14-day period of the cut. The econ-
omy-wide effect may have been in the order of 0.35% of yearly GDP, corresponding to a
9.1% GDP shortfall for the 14-day period of the cut.
However Bulgaria was rather an exception. Most EU Member States suffered no shortage
at all in final domestic supply of natural gas. Redistribution between net importer countries
played a more important role than increased imports from suppliers, while storage played a
decisive role in several individual cases, as well as collectively. Imports from alternative
sources were however an important alleviating factor, and the role of liquefied natural gas
(LNG) was particularly important: accounting for only around 10% of imports of gas in the
OECD Europe region in 2008, LNG accounted for 24% of the short-term supply increase
that was necessary to compensate for the shortfall in Russian supplies. This confirmed the
‘swing supply’ potential of LNG and its very useful security of supply properties.
A substantial response is gradually taking shape in Southeast Europe, primarily driven by
EU co-financing as part of the European Union’s European Energy Programme for Recov-
ery (EEPR). Launched in 2009, the programme provides decisive levels of co-financing for
a large number of gas interconnectors in Central and Southeast Europe. Two projects, the
Hungary-Romania and Hungary-Croatia interconnectors, were completed before the end
of 2010. EEPR co-financing is also available for the Romania-Bulgaria and Bulgaria-
Greece interconnector projects, making completion highly likely. A Bulgaria-Serbia inter-
connector also seems likely to materialise.
The development of a comprehensive network of interconnectors across Southeast and
Central Europe, in combination with potentially higher (future) LNG import capacity, effec-
tively leads to the creation of a ‘virtual pipeline system’ which contributes to several policy

ii
objectives, notably long-term supply source diversification and increased price competition
and market integration. These benefits come in addition to a strongly improved resilience
against supply disruptions.
Paper 2: Ukrainian gas security after the January 2009 supply cut
The new administration of President Viktor Yanukovych has proceeded with a comprehen-
sive revision of Russo-Ukrainian relations, culminating in the controversial ‘Kharkov Trea-
ties’ of April 2010, including notably an agreement to extend the presence of Russia’s
Black Sea Fleet on Ukrainian territory in exchange for a reduction in the price of imported
gas. That arrangement has been variously interpreted, from a mortgaging of future inde-
pendence to a rational exchange in favour of concrete economic advantage.
In domestic politics a drift towards authoritarianism is in evidence given selective prosecu-
tions of political rivals and pressures against the media. In foreign policy Ukraine seems to
have re-aligned itself closer to the Russian Federation on a number of issues. Finally,
Ukraine remains a highly corrupt society, while powerful oligarchs seem to benefit from
comfortable relations with the new leadership.
A question of practical relevance is to better understand the primary drivers for the behav-
iour of the new Ukrainian leadership. For this purpose we formulate four political hypothe-
ses which we then assess qualitatively, on the basis of selected test cases corresponding
to political choices made in the course of 2010. The hypotheses, or behavioural models,
are: national interest (realism), private interests (kleptocracy), ‘Russia first’ (‘unionism’), and
‘Power first’ (authoritarianism).
We find evidence in favour of all four hypotheses, suggesting (unsurprisingly) a mix of mo-
tives for recent political choices. However our assessment suggests a clear dominance of
national interest (realism). The ‘Russia first’ hypothesis is found to be the weakest, while
both the ‘private interests’ and ‘Power first’ hypotheses play important roles.
Ukraine’s emerging energy policy seems more rational than suggested by the ‘Kharkov
Treaties’ alone. Ukraine’s main external energy policy goals are to hold down gas import
prices, to promote the continued (and if possible expanded) use of its infrastructure for
transit of Russian gas to Europe, to encourage the cancellation of the South Stream pro-
ject, to secure foreign investment and assistance in upgrading its gas transmission system
on the basis of a trilateral approach (EU-Russia-Ukraine), and to decrease its dependence
on Russian imports by building an LNG terminal.
Ukraine’s main domestic energy policy initiatives are to reform domestic gas prices and
raise energy efficiency, to ensure the financial balance of Naftogaz without state subsidies,
to reform the regulation of its domestic gas market in line with EU legislation, and to in-
crease the domestic production of natural gas in collaboration with foreign investors, in-
cluding Russia.
From a policy perspective, some examples in our analysis suggest that conditionality on
the part of the European Union could lead to concrete outcomes. Domestic gas price re-

iii
form, for instance, is driven at least in part by IMF conditionality, while regulatory reform is
related to hopes of closer ties with (and investment from) the European Union. Beyond
energy policy, Ukrainian hopes for a free-trade agreement and for an association agree-
ment open additional opportunities.
Two fundamental issues in Russian-Ukrainian gas relations remain open. From the Rus-
sian side, an outright merger (de facto an acquisition) of Naftogaz remains the goal, some-
thing which the Ukrainian leadership is unlikely to accept. From the Ukrainian side, the
cancellation of the South Stream project, at least as it is currently planned, combined with a
commitment to raising transit volumes through Ukraine would be a major victory. However
this vision depends on the success of the trilateral (EU-Russia-Ukraine) approach now
being promoted by Ukraine for modernising its gas transmission system, as well as on
longer-term EU gas demand patterns for which significant uncertainty prevails. Conversely,
the interest of EU actors and of Russia in that project also depends on how committed they
are to the South Stream project in its current form.
Paper 3: The potential for an EU Gas Purchasing Agency
The fragmentation of the EU’s natural gas markets and the essentially national approach
taken by EU Member States in matters of external energy policy are being seen as in-
creasingly unsatisfactory. In that context, the uncovering of large gaps in import prices for
Russian gas, notably between the Baltic States and Germany, have led to strong political
demands for a consolidation of the bargaining power of EU importers.
A notable development in this regard is the joint declaration of 5 May 2010 by the Presi-
dent of the European Parliament Jerzy Buzek and former Commission President Jacques
Delors on the need to create a European Energy Community. A component of the proposal
is to “engage in coordinated energy purchasing, should the need arise”. Concretely the
idea is to move towards coordinated buyer alliances and potentially towards the creation of
an EU Gas Purchasing Agency.
The analysis starts with a description of the theoretical model of bilateral bargaining devel-
oped by Tasneem Chipty and Christopher M. Snyder. The model assumes a monopoly
supplier and a set of buyers who service separate downstream markets (e.g. regional or
national monopoly distributors).The model is used to produce illustrative numerical simula-
tions of buyer alliances and their effects on the surplus (profit) functions of the buyers and
of the supplier, and their effects on prices. The numerical simulations are based on (highly)
stylised surplus functions for Gazprom and for an illustrative population of 62 small gas
importers.
The results of the simulation suggest that buyer alliances alone do not necessarily lead to
a fall in price for all allied buyers, although they typically bring about a fall in the average
price (provided certain assumptions are met). However, buyer alliances in combination
with diversification of supply can lead to a fall in price for all alliance members. The positive
effect of diversification experienced by one buyer can be de facto shared with buyers with

iv
no diversification through the introduction of a buyer alliance. On the other hand, buyer
alliances typically lead to a loss of surplus (profits) for at least some alliance members, but
not necessarily to losses for the supplier.
A key question, therefore, concerns the exact role of public policy in terms of coordinating
(and compensating) the interests of the various actors. If, as the simulations suggest, there
are cases where a buyer alliance could be profitable for consumers in an isolated market
due to lower prices but cause a loss of surplus for one of the buyers (or even all of them),
then policy intervention would be required. It would not be sufficient to merely authorise
alliances of buyers as they would not arise spontaneously. Instead it would be necessary
to mandate buyer consolidation – for the benefit of consumers – and perhaps also to affect
a partial compensation of the foregone profits for participating companies and their respec-
tive governments. The other important conclusion from the simulations is the critical role of
diversification of supply sources, and the fact that part of the advantages of diversification
can be, in effect, transmitted from a diversified market onto an isolated market through an
alliance of buyers. One conclusion is that legislation on a possible EU Gas Purchasing
Agency (and/or gas purchasing groups or consortia) should take into account the existing
degree of diversification, and possibly encourage further diversification in specific cases, in
coordination with rules for the creation of buyer alliances.
Keywords: Natural gas, security of supply, supply disruption, interconnector, Russia,
Ukraine, Bulgaria, European Union, energy policy, fragmentation, bargaining
power, countervailing power, gas purchasing agency
JEL classification: C78, L11, Q34, Q48

1
Edward Hunter Christie1, Research Partner, Pan-European Institute (PEI)
The 2009 Russia-Ukraine gas supply cut: economic ef fects and policy reactions
1. Introduction
In January 2009, supplies of Russian gas from the Ukraine Corridor were completely cut
off for a period of 14 days. It was the longest and most severe energy supply disruption
experienced in Europe in recent history. Shortly after supplies resumed, the Bulgarian gov-
ernment reported an estimate of the cost of the cut to the Bulgarian economy of 250 million
Euro, see RIA Novosti (2009).
The first goal in this paper is to assess whether adverse impacts of the supply cut can be
detected from macroeconomic or industry data, and if so, what the impact of the supply cut
actually was in the countries it affected. Second, the extent to which affected countries
were able to secure sufficient supplies from storage or from other sources will be analysed.
Third, an analysis of the policy reactions at the national and EU levels is given, with a par-
ticular focus on Bulgaria, the EU Member State that was most affected by the supply cut.
The January 2009 cut-off of gas supplies from Russia to Ukraine provides us with a natural
experiment. The ultimate impact of the cut-off should be detectable from first quarter 2009
data, or at least from January 2009 data, once other contemporaneous effects have been
stripped out (notably the recession), and taking into account the different extent of the ac-
tual supply shortfall on a country-by-country basis. The analysis therefore begins with a
brief note concerning the 2009 recession. The supply cut is then described in more detail,
and its impact on Bulgaria is estimated. The lack of severe shortages in other EU states is
then highlighted with a discussion on storage and diversification. Actual and potential policy
responses are then analysed and discussed.
2. Economic background: the 2008-2009 recession Most economists trace the origins of the crisis back to unsustainable credit and housing
market developments in the United States, see e.g. Sanfey (2010). Initially, many com-
mentators hoped that there would be ‘decoupling’ of growth between emerging markets
and OECD countries. This was only partly the case, with growth continuing in China, India
and several Asian and African countries. However the recession was severe across almost
1 Author contact information: [email protected]

2
all of Europe, with some Central and Eastern European Countries (CEECs) especially hard
hit. However it is not the case that the CEECs as a whole were harder hit than Western
Europe, indeed the opposite is the case. Moreover there is considerable heterogeneity in
the region. Focusing on the period from the first quarter of 2008 to the first quarter of 2010,
as shown in Figure 1, by far the largest downturns were observed in the three Baltic
States. At the opposite end of the distribution, Poland experienced positive growth over the
period (almost 5% in real terms). Looking more broadly at the evolution of quarterly GDP,
Figure 2 illustrates the substantial level of country heterogeneity mentioned above. One
should note also the fact that different countries entered and exited the recession at differ-
ent periods. In the case of the Baltic States the recession was not only considerably
deeper, but it also started earlier. Bulgaria, on the other hand, continued to grow strongly
until the end of 2008, but the fall in real GDP it experienced in the first quarter of 2009 was
steep. The change in the slope of its quarterly GDP curve is noteworthy.
Figure 1
Real GDP downturn in selected CEECs, 2010Q1 on 2008 Q1 (%)
Source: Eurostat quarterly national accounts, own calculations, based on quarterly GDP in national currency, chain-linked
volumes, seasonally adjusted and adjusted for number of working days. A negative figure indicates real positive GDP growth.
The oil price shock that culminated in July 2008 clearly played an important and somewhat
overlooked role in precipitating the recession. IEA (2009a) states that the oil price increase
played an ‘important albeit secondary role’. Hamilton (2009) finds that the oil price explains
part of the downturn of the US economy in 2008 and reports that the rise in the oil price
-10.0
-5.0
0.0
5.0
10.0
15.0
20.0
25.0
Latv
ia
Est
on
ia
Lith
ua
nia
Slo
ven
ia
Ro
ma
nia
Hu
ng
ary
Cro
ati
a
Bu
lga
ria
Se
rbia
Cze
ch R
.
Mo
ldo
va
Slo
vak
ia
Po
lan
d

3
made a partial contribution to the bursting of the US housing bubble, housing foreclosure
rates having been higher for households with greater commuting distances.
Figure 2
Evolution of real quarterly GDP, selected EU countr ies, 2007Q1 to 2009Q4
Source: Eurostat quarterly national accounts, own calculations, based on quarterly GDP in national currency, chain-linked
volumes, seasonally adjusted and adjusted for number of working days.
The price of crude oil rose to its highest real level in history in mid-2008, around 140
USD/barrel at current prices. As the import price of natural gas is tied to the prices of se-
lected petroleum products for most European countries, and given positive feedback ef-
fects onto the prices of other energy carriers, the entire energy import bill of most European
countries rose strongly from 2000 to 2008. Particularly in the final part of that period, price
increases were much too rapid to be offset by improvements in energy efficiency or by
substitution effects, thus resulting in a negative income shock for net importers of energy,
i.e. almost all European countries. That shock, which was substantial even when compar-
ing 2007 to 2008, can be estimated by computing the total energy import bill as a propor-
tion of GDP. The increase in that proportion between 2007 and 2008 is illustrated in Figure
3 for Central and Eastern European Countries.
85.0
90.0
95.0
100.0
105.0
110.0
115.0
20
07
Q1
20
07
Q2
20
07
Q3
20
07
Q4
20
08
Q1
20
08
Q2
20
08
Q3
20
08
Q4
20
09
Q1
20
09
Q2
20
09
Q3
20
09
Q4
Belgium
Bulgaria
Czech Republic
Lithuania
Poland
Portugal
4
From a purely static point of view, the negative shock on the energy import bill should in-
stantly impact GDP in the same year. However evidence from past oil shocks indicates
that the full effect of an energy price shock – so including indirect effects – takes several
additional quarters to play itself out. Finally, one should note that most Western European
countries were similarly affected on the basis of the metric presented here, and that there
is (roughly) as much within-group heterogeneity in Western Europe as is found among
CEECs.
Figure 3
Energy import bill increase (% of GDP) from 2007 to 2008, CEECs2
Source: UN Comtrade, Eurostat trade statistics, IMF, own calculations, based on net imports, SITC code 27 (all energy prod-
ucts), as share of current GDP; the average values from UN Comtrade and Eurostat were used.
To conclude, the gas supply cut of January 2009 occurred in the context of an extremely
steep downturn in economic activity across much of Europe. Energy price increases partly
explain the beginning of the slow-down in economic activity, as well as the heightened
macroeconomic and financial vulnerabilities (higher current account deficits, lower con-
sumer confidence) that enabled further catastrophic developments. The 2008-2009 period
is also characterised by high country heterogeneity. It is therefore within a complex and
highly dynamic situation that the January 2009 cut-off occurred.
2 Country codes: LT=Lithuania; SI=Slovenia; BA=Bosnia and Herzegovina; RS=Serbia; LV=Latvia; HR=Croatia; CZ=Czech Republic; SK=Slovakia; BG=Bulgaria; MD=Moldova; EE=Estonia; PL=Poland; HU=Hungary; RO=Romania.
0.00
0.20
0.40
0.60
0.80
1.00
1.20
1.40
1.60
1.80
LT SI BA RS LV HR CZ SK BG MD EE PL HU RO

5
3. Anatomy of a shortfall
The European Commission released a memo during the crisis outlining the severity of the
crisis and available short-term responses for each affected Member State as well as for
Members of the Energy Community, i.e. Southeast European countries. The contents of
the memo are reproduced in Tables 1 and 2.
Table 1
Import shortfall and emergency responses, EU Member States
Country Import shor t-fall
Diversification Gas storage Alternative fuel
Bulgaria 100% no diversification gas storage for 2-3 days, covering 35% of gas demand
alternative fuel for 20 days
Slovakia 97% no diversification gas storage for several weeks, covering 76% of gas demand
alternative fuel for 1 month
Greece 80% (overland) Only LNG terminal, fully capable, booked more ships
Only in LNG terminal One gas power plant switched to oil, sufficient till end of January
Austria 66% increased import from Norway and Germany
gas in storage for sev-eral weeks
Yes
Czech Republic
71% Increased import by 8mcm from Norway, and via Yamal/ Ger-many
Gas from storage 40days, 15% increase of domestic production
Not used now, could be coal and oil
Slovenia 50% gas from Algeria via Italy, and from Austria, but not increased amount
gas from storage in Austria till Monday then possible decrease of supply by another 20%
Yes
Hungary 45% increased gas from Norway by 5%
gas storage for 45 days Alternative fuel –crude 90days, fuel oil 30days
Poland 33% Half of the cut covered by Yamal, more gas from Norway
gas storage for several weeks
Yes
Romania 34% No diversification Increased domestic production (60%) and withdrawal from storage
Yes
Germany 60% in South-ern Germany,
10% total
+20mcm receiving from Yamal, more from Norway and Nether-lands
Gas storage for several weeks
Not used now
Italy 25% Increased import from Libya, Norway and Netherlands
79% full, covers 50% of demand
Not used now
France 15% Industry covered 80% full Not used now
Source: European Commission press release, dated 09/01/2009, Reference: MEMO/09/3

6
Table 2
Import shortfall and emergency responses, Energy Co mmunity countries Country Import
shortfall diversification Gas storage Alternative fuel
Serbia 100% 12% renegotiated with HU
1mcm, less than 1 day, 8% covered by production
3 weeks of fuel oil
Bosnia and Herzegovina
100% No diversification No storage Fuel oil only for 20 days
Macedonia 100% No diversification No storage Fuel oil stocks need only for industry
Croatia 40% Diversification to Italy, but not used, negotia-tions ongoing
Increased domestic pro-duction (43%) and sto-rage withdrawal, 500mcm stored
Fuel oil for indus-try
Moldova (ob-server)
100% No diversification No storage No alternative fuel
Source: European Commission press release, dated 09/01/2009, Reference: MEMO/09/3
Figure 4
Cross-border gas supply responses to the January 20 09 supply cut
Source: IEA (2009b)

7
As mentioned in Tables 1 and 2, additional LNG supplies were indeed forthcoming for
Greece (and Turkey). Russia also immediately increased supplies through the Yamal pipe-
line (to Poland and Germany) as well as through Blue Stream (to Turkey). Other notable
cross-border responses included reverse flow from the Czech Republic to Slovakia and (at
the very end of the crisis) from Greece to Bulgaria, as well as deliveries from Hungary to
Bosnia and Herzegovina and to Serbia and from Germany to Croatia. An overview of these
cross-border responses is shown in Figure 4. The impact of the supply cut on the domestic
supply of natural gas depended on the size of the shortfall (itself a function of dependence
on Russian gas and of dependence on the Ukraine Corridor) as well as on gas supply di-
versification possibilities and storage. This first layer of measures was sufficient in most EU
Member States. To see this one may look at monthly natural gas consumption, see Figure
5, which ranks selected EU countries (plus Croatia) by how large gas consumption was in
January 2009 relative to the December 2008 level. If a country affected by the cut never-
theless consumed a normal level of natural gas, then it was evidently able to rely on stor-
age and/or other overland routes or LNG in sufficient quantities.
Figure 5
Monthly gas consumption, Dec 2008 – Feb 2009, selec ted countries 3
Source: Eurostat energy statistics, own calculations. 2008M12=100 for all countries.
As January 2009 was a colder month than December 2008 in most of Europe, consump-
tion in the residential sector should have risen, pushing up total consumption levels in the
process as can be seen from the data for the countries to the right-hand side of the distri-
3 Country codes: BG=Bulgaria; HR=Croatia; SK=Slovakia; IT=Italy; HU=Hungary; DE=Germany; PL=Poland; SI=Slovenia; AT=Austria; RO=Romania; CZ=Czech Republic.
40.0
50.0
60.0
70.0
80.0
90.0
100.0
110.0
120.0
130.0
BG HR GR SK IT HU DE PL SI AT RO CZ
2008M12
2009M01
2009M02

8
bution. Conversely, consumption levels in Bulgaria (and to a lesser extent Croatia) suggest
that there was a binding constraint on domestically-available supply. In a second step, the
possibility of substituting to other energy products also provided important relief in many
cases. After these variables are taken into account, one is left with the (initial or potential)
level of demand that cannot be met, regardless of price, and rationing measures need to
be taken. For the most affected countries of Southeast Europe rationing was used exten-
sively, with priority given to the residential sector while many industrial customers were
disconnected. Kovacevic (2009) provides an assessment of these developments.
4. The economic cost of the supply cut in Bulgaria While the cut-off was complete, it was of a relatively limited duration (14 days), so its eco-
nomic impact would probably only be clearly visible from January 2009 data, or 2009Q1
data, rather than from 2009 annual data. The approach that was initially attempted was to
focus on quarterly GDP data for a sample of European countries and to then test for the
effect of the supply cut, having controlled for other contemporaneous factors. A regression
analysis of quarterly GDP of European countries over 2008-2009 was carried out, account-
ing for initial differences in macroeconomic vulnerability (using the 2005-2007 average of
the current account deficit), and stripping out the average GDP path using time period
dummy variables. A possible additional effect from the earlier energy price shock was also
taken into account. A gas shock variable was constructed and tested within this framework.
However the results were inconclusive. A more refined analysis of the transmission chan-
nels of the recession, as they affected each country, would be beyond the scope of this
paper and was therefore not attempted. The alternative approach is to take a case-study
approach, focusing on the most affected countries and using a combination of monthly
data and self-reported losses. We focus on the clearest case, Bulgaria.
A brief overview of the self-reported losses of Bulgarian companies is given in Tzvetkova
(2009), citing Bulgarian government sources. Self-reported losses of the corporate sector
reportedly amounted to 456 million Levs. Additional effects to the residential sector and to
the government sector (e.g. loss in tax revenues) were not available. As a result, a
rounded estimate of 500 million Levs (about 255 million euro) seems a plausible estimate.
This figure should be interpreted as a loss of output (production). The corresponding loss
of gross value added (ultimately GDP) should be somewhat lower. Seasonally-adjusted
monthly data for industrial production confirms the sharp drop in activity that occurred in
January 2009, see Figure 6. The fall was 10.6% as compared to December 2008, the
sharpest fall in activity in more than 10 years4. It was followed by a 0.6% rise in February,
rather than by a more substantial ‘rebound’ that could have been expected. This suggests
that demand-side factors brought production down by a similar magnitude in the course of
the first quarter of 2009. That interpretation is supported by first orders data for manufactur-
ing production, see Figure 7. While the recession was clearly brewing during the second 4 Only the period from February 2000 to October 2010 was selected for analysis.

9
half of 2008, the sharpest fall in orders happened immediately after the gas supply cut, in
February 2009. If only demand factors mattered, one would expect the largest fall in orders
in a long period to pre-date the largest fall in production, rather than the other way around.
Figure 6
Bulgarian industrial production, change on previous month (%)
Source: Bulgarian National Statistical Institute (seasonally adjusted data)
Figure 7
New orders in Bulgarian manufacturing, change on pr evious month (%)
Source: Eurostat short-term business statistics (seasonally adjusted data)
-12.0
-10.0
-8.0
-6.0
-4.0
-2.0
0.0
2.0
4.0
20
08
m7
20
08
m8
20
08
m9
20
08
m1
0
20
08
m1
1
20
08
m1
2
20
09
m1
20
09
m2
20
09
m3
20
09
m4
20
09
m5
20
09
m6
20
09
m7
20
09
m8
20
09
m9
20
09
m1
0
20
09
m1
1
20
09
m1
2
-20.0
-15.0
-10.0
-5.0
0.0
5.0
10.0
15.0
20
08
M0
7
20
08
M0
8
20
08
M0
9
20
08
M1
0
20
08
M1
1
20
08
M1
2
20
09
M0
1
20
09
M0
2
20
09
M0
3
20
09
M0
4
20
09
M0
5
20
09
M0
6
20
09
M0
7
20
09
M0
8
20
09
M0
9
20
09
M1
0
20
09
M1
1
20
09
M1
2

10
A more developed way of exploring this issue is to estimate a simplified monthly gas de-
mand function based on manufacturing orders, heating demand and prices5. The compari-
son of the actual versus projected consumption levels shortly before, during, and shortly
after the cut is shown in Figure 8.
Figure 8
Actual versus projected monthly gas consumption, Bu lgaria, Terajoules GCV
Source: Eurostat energy statistics, own estimations
The gap between the projected and actual levels of consumption for January 2009 is 30%
(the largest gap over the sample). For the crisis period itself, this suggests that the gap (or
share of unmet demand) was (31/14) x 0.3 = 66%. The economic value of the supply gap
can be estimated using the average price for natural gas on Bulgaria’s domestic market.
Using Eurostat data for the first half of 2009, taking the non-weighted average of mid-sized
industrial and mid-sized residential customers, one finds an average market price of
23,110 BGN/TJ (all taxes included). Applying this price to the demand gap mentioned
above yields a sum of 66.56 million Levs. This is the market value of unmet demand. This
figure is lower than foregone production, since natural gas is only one of many intermedi-
ate goods and services used for production.
Bulgaria extended production from the old Galata field that would otherwise have been
closed, see Kovacevic (2009) and The Scotsman (2009). Also, Bulgaria was able to rely on
some (limited) withdrawals from storage, and from some substitution in favour of heavy fuel
oil. The lack of imports, although critical, did not therefore impact on GDP on a one-to-one 5 A simple time-series model was estimated over the period 2007M07 to 2009M12, regressing monthly gross inland consumption of natural gas demand on the half-yearly average price, monthly heating degree-days and gross manufacturing orders lagged by one month.
4000
5000
6000
7000
8000
9000
10000
11000
12000
13000
14000
20
08
M0
7
20
08
M0
8
20
08
M0
9
20
08
M1
0
20
08
M1
1
20
08
M1
2
20
09
M0
1
20
09
M0
2
20
09
M0
3
20
09
M0
4
20
09
M0
5
20
09
M0
6
Consumed
Projected

11
basis. However the Bulgarian authorities had to impose wide-ranging disconnections on
industry in order to prioritise hospitals, schools and the residential sector, see Kovacevic
(2009), Bloomberg (2009). The corresponding fall in industrial production discussed earlier
is the result of that decision. The assumption we will therefore make is that the supply cut
is responsible for the entire 10.6% fall in industrial production of January 2009 (as com-
pared to December 2008 in seasonally-adjusted terms). Using this assumption, we con-
clude that industrial production would have been 1/(1-0.106)=1.119 times higher than it
was without the cut. According to national accounts data, GVA in industry was 2949 million
Levs in the first quarter of 2009. Assuming for simplicity that January 2009 GVA in industry
was one third of industry GVA for the quarter, namely 983 million Levs, and that the share
of foregone GDP is equal to the share of foregone output, then foregone industry GVA is
equivalent to 0.119 x 983 = 117 million Levs. As for the short-run impact, corresponding to
the duration of the cut itself, it would amount to (31/14) x 10.6% = 23.5% for industrial pro-
duction. This proportion is in line with the natural gas intensity of industrial production in
Bulgaria6.
Other losses are harder to estimate. There were certainly effects in other sectors besides
industry, as well as lost revenues for the state. Organising fuel substitution efforts and at-
tempting to secure additional gas supplies led to costs as well. Finally, business and con-
sumer confidence were undoubtedly hit by the crisis, possibly leading to depressed de-
mand as the year progressed. For all these reasons, the estimates from self-reporting
mentioned earlier seem plausible. Assuming then that the loss in output was indeed in the
order of 500 million Levs, this would imply a loss of GDP of around 228 million Levs7, or
0.35% of 2009 GDP, around double the estimated loss based only on the fall in industrial
production. Set against the duration of the crisis, a rough estimate of GDP loss amounts to
(365/14) x 0.35 = 9.1% of period-GDP.
5. Resilience variables: storage, diversification a nd LNG A remarkable outcome of the 2009 gas supply cut is how little effect it had on Central
European countries. Most of those countries have a high dependence on Russian supplies
through the Ukraine Corridor and could have been expected to fare badly. Storage played
a key role notably for the Czech Republic, Italy and Austria. Figure 8 shows how withdraw-
als from storage compensated for lower net imports when comparing January 2008 to
January 2009. Diversity of supply sources is the other key variable that should help allevi-
ate supply cuts. In the case of the January 2009 crisis, the largest source of additional
supplies was the re-routing of supplies from other net importer states, although increased
supplies from producer states also played an important role. For example, Croatia was 6 Eurostat energy consumption data show that Bulgaria’s final consumption of energy in the industry sector in 2008 was 3539 thousands of tonnes of oil equivalent (ktoe), of which 846 ktoe was due to natural gas, a proportion of 23.9%. 7 According to Bulgarian GNI statistics, the ratio of GDP to output was 43.6% in 2008 and 47.6% in 2009. The average of the two ratios was applied.
12
able to rely on stop-gap supplies from Germany and France, but Libya refused to provide
assistance, see Reuters (2009a), arguing that all of its supply capacity was “reserved”. On
a more positive note, Algeria, Egypt, Qatar, Norway and Trinidad and Tobago all played a
role in the month of the crisis, with in some cases very substantial temporary increases in
exports. An overview of these short-run shifts in import patterns, comparing December
2008 with January 2009 for imports into the OECD Europe region, is shown in Table 3.
Figure 8
The role of storage: January 2009 vs. January 2008, selected countries
Source: Eurostat energy statistics, own calculations.
What these shifts highlight is the limited ability of some exporters to strongly increase sup-
ply at short notice, for instance Norway. On the other hand, redistribution of gas flows be-
tween OECD countries (excluding Norway) played a key role. Implicitly, part of that redis-
tribution had to rely on storage withdrawals in importing countries that were less affected or
not affected by the cut in Russian supplies. This finding strengthens the case for adequate
investment in storage facilities. Liquefied natural gas (LNG) accounted for an important
share of additional supplies. LNG imports accounted for 10.5% of total OECD Europe im-
ports in December 2008, and for 12.6% in January 2009. More revealingly, if one com-
putes the import gap as the sum of all the individual decreases in imports shown in Table
3, plus the rise in total imports, and if one then computes what proportion of the gap was
covered by LNG imports, one finds a share of 24%. The additional supplies that came to
OECD Europe from other OECD Europe countries (including Norway) were almost exclu-
0.0
10.0
20.0
30.0
40.0
50.0
60.0
70.0
80.0
90.0
100.0
CZ08 CZ09 IT08 IT09 AT08 AT09
Withdrawals
Net imports
Production

13
sively in the form of piped gas. The contribution of LNG to the additional external supplies,
i.e. those from non-OECD countries, was even stronger. It was (unsurprisingly) 100% in
the cases of Egypt, Qatar and Trinidad and Tobago, and 42% in the case of Algeria. Nor-
wegian LNG exports actually fell in January 2009, though this was slightly more than com-
pensated by the increase in piped gas exports. In sum, LNG accounted for around half of
the increase in non-OECD imports in January 2009. These findings suggest a ‘swing sup-
ply’ capacity with very positive security of supply implications.
Table 3
Monthly gas imports by country of origin, Dec. 2008 and Jan. 2009 Origin Dec2008 Jan2009 Change (%) Change (mcm)
OECD excl. Norway 8245 10060 22.0% 1815
Algeria 4244 5022 18.3% 778
Egypt 481 861 79.0% 380
Qatar 510 840 64.7% 330
Norway 8533 8854 3.8% 321
Trinidad and Tobago 659 938 42.3% 279
Other Former USSR 418 490 17.2% 72
Libya 1019 1032 1.3% 13
Nigeria 768 685 -10.8% -83
Iran 426 329 -22.8% -97
Turkmenistan 302 85 -71.9% -217
Russia 11523 8756 -24.0% -2767
Other / Unknown (*) 2253 2387 5.9% 134 Total Imports 39381 40339 2.4% 958
Memo: LNG 4117 5102 23.9% 985
Source: IEA Natural Gas Monthly, own calculations. Reporter: OECD Europe. Units: millions of cubic metres (mcm).
The conclusion is that storage withdrawals and redistribution of piped gas between Euro-
pean net importer countries, through interconnectors and reverse flow operation, played
the most important roles in alleviating the effects of the crisis. However, increased external
supplies also made an important contribution, notably in the form of LNG. These mecha-
nisms were sufficient to forestall gas shortages in most of the countries that suffered a drop
in imports of Russian gas. However as outlined earlier, Bulgaria and some non-EU coun-
tries in Southeast Europe suffered substantial shortages given that the mechanisms de-
scribed above could not be activated to a sufficient degree. As a result, investments should
be made in interconnection and reverse flow capabilities, as well as in higher storage ca-
pacity and higher storage withdrawal capacity, with a particular focus on Southeast
Europe. New LNG terminals and regasification facilities, or extensions of existing LNG fa-
cilities, should likewise be undertaken. These measures are those that would secure gas
supplies in case of a short-term crisis under certain assumptions, notably that the duration

14
of the cut is relatively short (e.g. a few weeks, not a permanent cut) and that there are no
binding supply constraints with alternative supplier countries. In addition, and under the
assumption that these measures could be insufficient in certain cases, dual-fuel capabili-
ties, security stockholdings of alternative fuels and corresponding contingency plans con-
stitute a second layer of measures that could be enhanced. Such preparations already
exist in European countries and indeed were tested to their limits in Southeast European
countries. These general conclusions are naturally in line with the common understanding
in policy circles and in recent literature. For example, the European Commission identifies
the development of the Southern Corridor and connections between Central and South-
east European countries (including the integration of the Baltic States) as gas infrastructure
priorities, see European Commission (2010a). The interesting question is which invest-
ments should be prioritised and according to what criteria.
6. Policy choices for increased energy system resil ience The previous section concluded with a general “shopping list” of measures to increase
resilience against short-term gas supply disruptions. One way to prioritise projects is to find
a way of valuing their energy security benefits so as to be able to rank projects on the basis
of a cost-benefit analysis. A general framework for this is the ‘security of supply cost curve’,
a concept introduced in Lapuerta (2007) and applied to the case of Bulgaria in Silve and
Noel (2010). The concept is illustrated in Figure 9.
Figure 9
Illustration of the security of supply cost curve
Source: Silve and Noel (2010)

15
The methodology consists in ranking investment projects by the unit cost of providing addi-
tional security of supply. In the case of natural gas, security of supply can be defined as the
additional volume that can be made available (or substituted for) in time of crisis, and
measured (for example) in millions of cubic metres per day. By ranking potential projects
from the lowest to the highest unit cost, a cost curve is constructed. Because energy infra-
structure projects are typically “lumpy”, the cost curve will typically be a step function as
shown in Figure 9. The practical application is that financial resources should go towards
the lowest-cost projects first, and stop when a given (deemed sufficient) level of security of
supply (the red line in Figure 9) has been reached or surpassed. Also, given that one will
wish to ensure that demand is secured when it is highest, the cost curve should be defined
against peak demand. The latter may be based on peak demand under the assumption of
exceptional conditions. The European Union’s new legislation on security of gas supply,
see European Union (2010), in force since December 2010, specifies that Member States
should assume a representative crisis day that is “of exceptionally high gas demand occur-
ring with a statistical probability of once in 20 years”. In order to assess the unit cost for
each proposed project, Silve and Noel (2010) compute the net present value of the cost of
each project for supplying volume units of gas in case of a supply disruption. This enables
them to rank concrete projects for the case of Bulgaria. They conclude that reverse flow
capacities with Greece and Turkey, together with diesel backup facilities for heat genera-
tion, would achieve a satisfactory level of security at the lowest cost if supply disruptions
are assumed to be relatively infrequent. In a more pessimistic scenario, building the
(planned) interconnector with Romania is also part of the optimal solution. On the other
hand they find that a planned expansion of the Chiren Underground Gas Storage facility is
not desirable from the point of view of unit cost. One explanation the authors suggest is
that focusing on reverse flow and interconnectors alone may be insufficient if neighbouring
countries are suffering from substantial supply disruptions at the same time.
Bulgaria’s gas policy priorities are in any case broader-based. In the absence of supply
disruptions, in other words most of the time, the potential economic value of higher domes-
tic gas storage depends on the ability to use changes in stocks in order to exploit price
differences across time as well as between markets. If interconnection investments are
expected, cross-border gas trading would be assumed to develop and investment in stor-
age becomes more attractive. In addition Nabucco, South Stream and CNG (compressed
natural gas) shipments from Georgia are all possible solutions for future supplies. A sym-
bolic illustration of this interconnected future for Bulgaria is given in Figure 10.
In addition to heightened awareness about security of supply, the actual and potential
availability of EU co-financing has also contributed to modifying perceptions in the region.
The EU’s European Energy Programme for Recovery (EEPR), launched in 2009 as a re-
sponse to both the economic downturn and energy security needs, puts forward Union co-
financing for several projects which will affect Bulgaria and its neighbours. The Bulgaria-

16
Greece and Bulgaria-Romania interconnector projects are part of the selected projects, as
are the Nabucco and Interconnector-Turkey-Greece-Italy (ITGI) projects. In the wider re-
gion, Romania-Hungary, Hungary-Slovakia and Hungary-Croatia interconnectors are also
being supported. This creates an overall vision and an incentive for cross-border coopera-
tion.
Figure 10
Bulgaria’s potential as a highly interconnected gas market
Source: Simitchiev (2010). IGB, ITB, IBS and IBR refer to interconnectors between Bulgaria and Greece, Turkey, Serbia and
Romania, respectively. UGS: Underground Gas Storage.
If these interconnector projects materialise because they are deemed profitable by the cor-
responding investors given EU co-financing, the energy security benefits they bring would
carry negligible additional costs. The capital costs (net of EU co-financing) and operating
costs would be covered by revenues from commercial operations. Only the specific costs
incurred during supply disruptions would remain, i.e. mainly the gas price differentials (as
compared to the usual price of the missing supplies) may typically be larger in the event of
a supply disruption where markets are more liberalised.
Two further insights merit development. The first is that EU co-financing modifies the net
present value calculations of energy security options. The second is that, in any case, a full
NPV calculation must take into consideration the full economic benefits of projects, not only

17
those that relate to security of supply. If an interconnector fulfils a useful function on the
gas market by enabling arbitrage between national markets, then proceeds from gas
traded through it in periods without supply disruptions, i.e. almost all the time, should be
counted as positive income streams.
Concerning the first issue we take the example of the Bulgaria-Greece interconnector.
Silve and Noel (2010) find an NPV of costs of 36.51 million euro per million cubic metre per
day of secured supply, under a worst-case scenario of a 15-day supply disruption occur-
ring every year, and an NPV of 33.90 million euro per million cubic metre per day of se-
cured supply under a best-case scenario of one disruption every 10 years. Using the same
assumptions, namely a time horizon of 20 years, a discount factor of 10%, OPEX of 0.37
million euro per year, and additional fuel costs of 2.3 million euro for each incidence of a
supply disruption, together with an assumed CAPEX of 230.28 million euro, we were able
to reproduce the results of Silve and Noel (2010). EU co-financing for the Bulgaria-Greece
interconnector may amount to up to 45 million euro, see European Commission (2010c).
As for capital expenditure, Simitchiev (2010) mentions a lower estimate of 150 million euro.
We will assume for simplicity that actual CAPEX will be at the mid-point between the
Simitchiev (2010) and Silve and Noel (2010) estimates, i.e. 190 million euro, and that EU
co-financing is obtained in full. We will furthermore assume that this is equivalent, from the
point of view of the project’s investors, to facing a CAPEX of 190 – 45 = 145 million euro,
with all other assumptions held constant. In this case, NPV of costs for the two scenarios
are 24.34 and 21.78 million euro per million cubic metre per day. The project remains a
relatively expensive option – reverse flow NPV estimates are in a range of 0.65 to 5.61
million euro per million cubic metre per day – however the impact of EU co-financing is
substantial.
The second issue, namely to account for the positive cash-flows of the interconnector pro-
jects, seems particularly useful. A direct estimate of these cash-flows is not simple. How-
ever a simplified approach is possible based on the concept of revealed preferences. As-
suming that the investors who proposed a given project actually carry it out, one can con-
struct a series of cash-flows that is consistent with the project breaking even. We assume
an identical positive cash-flow every year, a 5% discount rate, a 30 year time horizon, 0.37
million euro OPEX, 2.3 million euro extra fuel costs for each supply disruption incident, and
the best-case scenario of one disruption every 10 years. We furthermore assume that EU
co-financing is fully tapped into. In that case, the yearly positive cash-flow would have to be
in a range of 7.3 to 12.2 million euro per year, corresponding to a possible range for
CAPEX of 150 to 230 million euro. Assuming a discount rate of 10%, the range would be
10.9 to 18.7 million euro. By implication, given a capacity of 7 mcm/day and assuming av-
erage capacity use of 70%, the income from transporting one thousand cubic metres
would need to be in a range of 5-11 euro. Price differences between national markets can
be larger even than the high end of that range, suggesting that physical arbitrage could
occur. Depending on the persistence of demand patterns in different markets the intercon-
nector could also more simply be used as a supply line, operating in a single direction for

18
extended periods. In both cases the interconnector would therefore serve a useful eco-
nomic function in addition to enhancing security of supply.
7. A virtual pipeline system in the making While many countries in the region have signed up to either the Nabucco or South Stream
projects – in several cases to both projects – there is a growing realisation that the cheap-
est near-term option both for diversification of sources and for sourcing additional import
volumes, at least from the point of view of capital costs, is to pursue a combination of
cross-border interconnection capacity and increased LNG import capacity.
Figure 11
Map of the Energy Community’s Southeast Europe Gas Ring
Source: Energy Community web-site
As noted by Greek Development Minister Costis Hatzidakis, see Reuters (2009b), the
countries of the region “want to treat the Greek-Bulgarian, Bulgarian-Romanian and Ro-
manian-Hungarian pipelines as a single whole, as a single pipeline. Especially since all
three separate pipelines are financed by the European Union.” EU co-financing is thus

19
providing a strong impetus for the creation of what Tsakiris (2010a) describes as “the con-
struction of interconnector pipelines with LNG terminals into one virtual pipeline system”.
The overlapping development of these many individual projects in and between Southeast
Europe and Central Europe fit in with or enhance pre-existing regional visions, in particular
the Southeast Europe Gas Ring concept put forward by the Energy Community, see Fig-
ure 11, and the New Europe Transmission System (NETS), see Figure 12. NETS is a
partnership between Central and Southeast European gas transmission system operators,
namely FGSZ (Hungary), Plinarco (Croatia), Transgaz (Romania) and BH-Gas (Bosnia
and Herzegovina).
Figure 12
Map of the New Europe Transmission System (NETS)
Source: NETS (2009)
Socor (2010) interprets the list of approved interconnector projects covered by the EU’s
EEPR programme as an extension of the NETS concept, while the Energy Community
strongly endorses notably the Bulgaria-Serbia interconnector project as an important con-
tribution to the realisation of the Gas Ring concept. Recent developments are promising,
see Tsakiris (2010b), Socor (2010). The Hungary-Romania interconnector has been built
and was inaugurated on 14 October 2010. The Croatia-Hungary interconnector, also sup-

20
ported by the EU’s EEPR programme as well as by a €150 million loan from the European
Investment Bank (EIB), was completed in December 2010. The final agreement for the
Bulgaria-Greece interconnector was signed in November 2010, with operations expected
to start in early 2013. The Bulgarian government also stated its readiness to finalise an
agreement with its partners concerning the Bulgaria-Romania interconnector. Both of these
projects are eligible for EEPR funding. In addition, Bulgaria and Serbia signed a bilateral
agreement for developing a Bulgaria-Serbia interconnector in March 2010. While that pro-
ject is not covered by the EEPR, other options for EU funding are being considered and
the European Commission seems closely involved and highly supportive of the project. Some of the interconnector projects have already been completed or are already under
construction, while signs are encouraging for most of the remaining ones. As these pro-
jects were mostly not expected to materialise before the decision to grant EU co-financing
was made, it is clear that the projects are insufficiently profitable from the point of view of
the private returns of some of the project partners8, but that they are sufficiently profitable
with EU co-financing. Moreover we would assume that the EU decisions are adequate
from the point of view of social returns (meaning that the projects are economically justi-
fied). If this is the case, then the interconnector projects are a case of an economically
sound policy at the EU level for overcoming the fragmentation that would persist if only
national actors were involved.
8. Conclusions The main lesson from the January 2009 gas supply cut was that countries with high stor-
age capacity and/or extensive connections to countries that had either high storage or al-
ternative suppliers fared well. Indeed the ultimate impact of the cut on domestic supply was
non-existent in most of the countries that suffered a drop in import volumes. Bulgaria was
the unhappy exception among EU countries. A combination of vulnerability factors meant
that the cut led to a short-fall of around 30% of gas supply for the month of the crisis. It was
estimated that the total GDP shortfall due to the cut was 0.35% of 2009 GDP, equivalent to
a 9.1% GDP shortfall for the 14-day period of the disruption.
Transforming the Bulgarian gas market from a vulnerable system into a resilient system
can be achieved relatively cheaply thanks to investments in reverse flow capabilities, dual-
fuel capabilities and some (but not all) interconnector projects with neighbouring countries.
A more ambitious option is being pursued by the Bulgarian government in collaboration
with other countries in Southeast Europe, namely the construction of a comprehensive set
of interconnectors in the region and with Central Europe. Economic benefits other than
increased security of supply, combined with the impact of EU co-financing, explain why the
set of chosen infrastructure investments differs from the lower-cost options that would be
8 For simplicity we refer to the returns accruing to the individual project partners as private re-turns, even though many of them are state-owned energy companies. The broader notion of social returns in this section should be interpreted not as the social returns for the individual countries concerned, but for a broader region, or for the EU as a whole.

21
required to deal only with short-lived supply cuts. The development of a comprehensive
network of interconnectors across Southeast and Central Europe, in combination with
higher (future) LNG imports, effectively leads to the creation of a virtual pipeline system
which contributes to other policy objectives, notably long-term supply source diversification
and increased price competition and market integration. These benefits come in addition to
a strongly improved resilience against supply disruptions.

22
Pavel K. Baev, Research Professor, Peace Research Institute (PRIO)
Edward Hunter Christie9, Research Partner, Pan-European Institute (PEI)
Volodymyr Golovko, Centre for Political Analysis (Ukraine)
Ukrainian gas security after the January 2009 suppl y cut
1. Introduction The state of Ukraine’s energy relations with the Russian Federation is of key importance
for the European Union. From the point of view of short-term risks, the breakdown of those
relations led to the most severe gas supply crisis in European history when Russian sup-
plies through the Ukrainian Corridor were cut off for two weeks in January 2009. From the
broader strategic point of view, Ukraine is the main transit country for Russian gas supplies
to the European Union, and Ukraine’s relations with both the EU and Russia may ulti-
mately determine whether large potential infrastructure projects such as South Stream are
built. Finally, Ukraine is also a large and important European state as well as an important
market for natural gas in its own right. How Ukraine tackles its energy security challenges
will, in any event, have an impact on EU affairs. In this context it seems vital to re-assess
the state of Russo-Ukrainian energy relations with a particular focus on developments
within Ukraine.
Incoherent and muddled as Ukraine’s policy towards Russia remains at the start of 2011,
there is hardly much doubt that import and transit of natural gas remains one of its crucial
determinants. This major European state is among the worst affected by the economic
crisis, and policy-making in Kiev is not just constrained by massive budget deficits but seri-
ously distorted by a looming state bankruptcy. Instead of translating a combination of na-
tional and corporate interests into a set of strategic goals, the leadership has to produce
urgent and sometimes desperate responses to a permanent force majeure situation, and
the government reshuffling in December 2010 was a consequence of this struggle. Presi-
dent Viktor Yanukovych, elected in February 2010 by a margin no greater than 4%, de-
serves credit for making Ukraine governable – against many expectations – but this nec-
essary enforcement of order on the unruly political arena has involved hard pressure on
the opposition (including criminal charges against Yulia Timoshenko) and exclusion of
many elite groups from state politics.
Such concentration of power has brought justified criticism in the West about a retreat of
democracy, and Yanukovych’s apparent readiness to improve relations with Russia has
9 Corresponding author. Contact information: [email protected]

23
amplified those10. Setting a new pattern for the gas business is a central element of the
new course, and the deal – struck already in April 2010 – on securing favourable prices for
supply and transit of gas in exchange for extending the lease on the Sevastopol base for
the Black Sea Fleet exemplifies the readiness to accept far-reaching long-term compro-
mises in exchange for (relatively) short-term advantages. Yanukovych has firmly expelled
many stakeholders from decision-making in gas policy, which nevertheless remains a
product of bargaining between various interest groups, so that even Gazprom finds it diffi-
cult to understand the intricacies of this process.
In this paper we attempt to make sense of Ukraine’s policies and motives with respect to
natural gas supplies. The analysis starts with a refresher on the development of Ukraine’s
gas relations with the Russian Federation over the last few years (Sections 2 and 3). The
core of the paper, Section 4, offers an applied political science approach towards identify-
ing the motives and drivers for the actions of the current Ukrainian leadership in its energy
relationships with Russia and with the European Union. Section 5 gives an assessment of
the most recent domestic and bilateral developments. Section 6 concludes.
2. The Russian Gas Price Surge of 2005-2009 Political conflicts between Ukraine and Russia have accompanied a five-fold price increase
for Russian gas imports into Ukraine, see table 1. Initially, according to the 2004 bilateral
import contract, Ukraine received Russian gas imports in the context of a barter deal, as
material remuneration for transit of gas to European markets. At the time, the implicit price
of imports was estimated to be 50 USD per thousand cubic metre (USD/tcm) in 2004 and
55 USD/tcm in 2005. The implicit transit fee was estimated at 1.09 USD/tcm per 100 km. In
addition, Ukraine imported gas from Turkmenistan (transited through Russia’s transmission
system, owned and controlled by Gazprom). In 2005 Kiev imported 23 billion cubic metres
(bcm) of Russian gas and 35 bcm of gas from Turkmenistan, almost all of Turkmenistan’s
Russia-bound export flow. Finally, Ukrainian companies produced around 20 bcm per year
domestically. Formally this domestic production was destined solely for sales to the house-
hold sector and it fully covered that component of domestic demand. Implicitly, industrial
consumption was related to imported natural gas. According to the 2004 agreement, the
sale of gas from Turkmenistan to Ukraine was handled by a newly formed company called
RosUkrEnergo. RosUkrEnergo was owned, on a parity basis, by OAO Gazprombank, the
authorised bank of Gazprom, and a Ukrainian stake, handled by Austria’s Raiffeisen Bank,
see Fredholm (2008). The Ukrainian stake was in fact held by two oligarchs, Dmytro Fir-
tash (45%) and Ivan Fursin (5%). In addition, the 2004 agreements foresaw an involve-
ment of Gazprom in the modernisation of Ukraine’s Gas Transmission System. One idea
10 Quality analyses of current political developments in Ukraine can be found in Sherr (2010), Valasek (2010) and Pifer (2010). The other question which is being raised is the extent to which Ukraine can remain a genuinely independent country if it continues on its current course.

24
was to have an international consortium of gas companies, including Gazprom and Euro-
pean (notably German) gas companies, and of course Naftogaz, owning, operating and
upgrading the infrastructure of the Ukraine Corridor. A parity-owned company was formed
between Gazprom and Naftogaz, but no concrete projects were finalised, see Fredholm
(2008). The Russian side always wanted much more, a substantial equity stake in the en-
tire system, and substantial control over it.
Table 1
Gas prices for Ukrainian customers, without tax, US D/tcm 2005 2006 2007 2008 2009 1st
quarter 2010
3rd quarter 2010
Russian i m-ports
55 (1) 95 130 179.5 250 (4) 305 248
Industrial cu s-tomers
82.5 150 144 186 230 252 264
Households (domestically produced gas)
20.3 74 61.6-74 (2)
60.4-67.8 (3)
78 78 118
Source: Naftogaz, media reports. Notes: (1): implicit price of barter deal; (2): Price cut due to Government Regulation; (3): Price changed due to fluctuation of exchange; (4): Average annual price.
Far-reaching changes were tabled in 2005 by Ukraine’s then-new President Yushchenko.
Yushchenko’s idea was to revise all of the 2004 agreements, excluding RosUkrEnergo as
an intermediary and re-focusing the consortium between Naftogaz and Gazprom on new
pipelines only, not on the existing transmission system. In exchange, Yushchenko pro-
posed a gradual transition from the existing regime to cash payments at European prices,
see Stern (2006). Moscow seized the opportunity and demanded the full European price
from 1 January 2006. There does not seem to have been any legal basis for the Russian
side to have chosen that particular date. The 2004 agreements covered the period until
2009 and the Ukrainian side had not unilaterally cancelled them, but only asked to re-
negotiate them. At first, Russia demanded a price of 160 USD/tcm, an abrupt three-fold
increase. This would of course have immediately plunged Ukraine into severe economic
difficulties. Ukraine naturally refused to agree to those terms. The Russian side then
gradually ratcheted up the price, ultimately demanding 230 USD/tcm, a four-fold increase
on the existing level, while simultaneously proposing that if that was too high, Ukraine
could “pay” by transfers of ownership of Ukrainian assets. Ukraine of course refused again.
While deliveries of Russian gas to Ukraine hung in the balance, the Ukrainian side believed
it could, in the worst case scenario, still rely on deliveries from Turkmenistan. An agree-
ment for 2006 deliveries was announced on 23 December 2005. The Russian side then
cornered Ukraine by buying off Turkmenistan for the bulk of its exports on 29 December

25
2005, see RIA Novosti (2005). The stage was set for a complete shut-down of Ukraine’s
gas imports.
Vladimir Putin went on television on 31 December 2005 and issued a public ultimatum to
Ukraine that it must accept the new price level, and that if it did, it would be delayed by
three months, see Fredholm (2008). Given that both the terms and the form were unac-
ceptable, Ukraine refused. At that stage, the Ukrainian side had almost certainly underes-
timated the determination of the Russian side, all the way up to President Putin, to use
coercion in order to obtain what it wanted. It is also interesting to note how deadlines could
be shifted by the Russian side without any formal or legal basis. Russia cut gas supplies to
Ukraine on 1 January 2006. The legal basis for Russia’s actions seems very weak. Sup-
porters of the Russian side, e.g. Stern (2006), have suggested that Ukraine “started the
revision” of the 2004 agreement and use the fact that Ukraine took no legal action against
Russia as evidence for that view. However these arguments fail to consider how states
(and individuals) behave when they are in a relationship of dependence with a considera-
bly stronger counterpart.
Rapid and intense negotiations ensued as soon as the deliveries had been cut. The
Ukrainian side caved in under the pressure. They needed a rapid resumption of deliveries
and it was the middle of winter. Gas exports from Russia would, from then on, be sold not
directly to the Ukrainian gas company Naftogaz, but to the dubious Russo-Ukrainian inter-
mediary, RosUkrEnergo. The price of natural gas sold by Gazprom to RosUkrEnergo rose,
officially at least, to 230 USD/tcm. However RosUkrEnergo would “mix” that with gas from
Turkmenistan (now strangely available), purchased at a much lower price. The result was
an average price of 95 USD/tcm for 2006 and was thus a price that the Ukrainian economy
could perhaps cope with. The 2006 agreement was applied from 2006 to 2008. However
the import price for Ukraine grew substantially in 2007 and in 2008 as the “export price” of
Central Asian gas rose. During that period, RosUkrEnergo remained the single intermedi-
ary in Russian-Ukrainian gas trade. In effect, RosUkrEnergo was a vehicle for monopolis-
ing Ukraine’s gas imports as it controlled the gas from both sources of imports, Russia and
Turkmenistan. But this was not all. The other two main consequences of the 2006 agree-
ment were that Naftogaz would be banned from re-exporting any surplus gas to Europe,
and the second was the creation of a company called UkrGazEnergo, a 50-50 joint venture
between Naftogaz and RosUkrEnergo which was licensed to supply the Ukrainian domes-
tic market. Implicitly, Gazprom obtained a participation of 25% in a gas distribution com-
pany on the Ukrainian market. In compliance with the agreement, UkrGazEnergo was rap-
idly licensed to distribute gas to an increasing share of industrial customers. With its mar-
gins trimmed by RosUkrEnergo on the import side and by UkrGazEnergo on the distribu-
tion side, Naftogaz suffered from rapidly worsening finances.
The 2008-2009 conflict which culminated in the disastrous shut-down of the Ukraine Corri-
dor in January 2009 can be partly attributed to a conflict between the Ukrainian govern-
ment and the intermediary RosUkrEnergo. Ukraine’s Prime Minister at the time, Yulia Ty-

26
moshenko, wished to remove RosUkrEnergo from the Russian-Ukrainian gas trade. At the
time, as well as more recently, Tymoshenko has accused RosUkrEnergo not only of mak-
ing a mess of the gas trade with Russia, but also of serving as a slush fund for certain
Ukrainian political leaders – a view endorsed notably by Aslund (2009) – and of having
links with criminal elements.
As in the 2005-2006 dispute, Russian negotiators adopted harsh negotiating tactics, mak-
ing last-minute demands for immediate payments of large debts and fines for late pay-
ments, and raising the proposed export price by substantial amounts in the final weeks
before 31 December 2008. In the final days before the deadline one had the clear impres-
sion that the Russian side wanted the negotiations to fail – and that the timing (winter) was,
as in 2005-2006, due to a deliberate selection of a period of higher vulnerability. In parallel,
the complexity of the relations between the Kremlin, Gazprom, RosUkrEnergo, Naftogaz,
the Ukrainian government and the Ukrainian President were difficult to disentangle for most
observers as many confusing and conflicting statements were made, for instance of pay-
ments being made but not received. Of course, the fact that RosUkrEnergo is 50% con-
trolled by Gazprom should not be forgotten.
After two weeks of suspended gas supplies (and furious reactions from across Europe),
Ukraine and Russia signed a contract for the period 2009-2019, introducing a new pricing
formula very similar to what is in force for Russian exports to EU countries. The gas export
price is automatically adjusted every quarter in line with the (lagged) development of gasoil
and fuel oil prices. The formula implies gas prices for Ukraine that are slightly higher than
those paid by Germany. A minor concession was however made by applying a temporary
20% discount on the formula price for the year 2009. The exclusion of RosUkrEnergo was
also confirmed with that agreement, so that all Ukrainian imports after January 2009 are,
formally speaking, of “Russian gas” and handled by Gazprom.
Gas prices on Ukraine’s domestic market followed separate paths. From the end of 2008,
gas prices for Ukrainian industrial customers were subsidised for chemical and metallurgi-
cal plants with the aim of supporting them in the economic downturn. That price is calcu-
lated based on a notional fixed cost of imported gas of 230 USD/tcm, plus costs of trans-
portation inside the country. Gas prices for households didn’t have a direct correlation with
changes in the Russian gas price. For electoral reasons, in view of the March 2006, Sep-
tember 2007 and planned (but abandoned) December 2008 parliamentary elections, as
well as due to the January 2010 Presidential elections, Ukraine’s successive heads of
government repeatedly avoided imposing significant increases on residential gas prices.
Uncompensated price subsidies are one component of the financial difficulties experienced
by Naftogaz. However one should add the problem of non-compliance (non-payment)
which, to some degree, was always present in Ukraine. In addition, as mentioned earlier,
Naftogaz was squeezed between RosUkrEnergo and UkrGazEnergo, experiencing limited
access to its own market and reduced margins in general.

27
From the economic perspective, external economic conditions worsened in 2008 and
2009, leading to a slowdown in 2008 and a disastrous -15% in GDP in 2009. From a struc-
tural perspective, the Ukrainian economy has been dependent on moderate natural gas
prices to support the manufacturing of its main export commodities: iron and steel ac-
counted for almost 40% of total goods exports over 2005-2008. Rising energy import costs
contributed to the country’s pre-crisis vulnerabilities. Based on UN COMTRADE statistics,
the total energy import bill (all energy products) rose from 8.5% to 10.4% of GDP between
2005 and 2008. However this explains only a fraction of the rise in the current account
deficit, see Table 2. Ukraine was on an unsustainable path from the macroeconomic per-
spective, with signs of overheating and sharp increases in consumption and imports.
Ukraine was then strongly affected by the global recession through the trade channel, with
goods exports falling by 40% in 2009.
Table 2
Ukraine: selected macroeconomic indicators 2005-201 1
2005 2006 2007 2008 2009 2010e 2011f
Real GDP growth (%) 2.7 7.3 7.9 2.1 -15.1 3.7 4.5
Average inflation rate (%) 13.5 9.1 12.8 25.2 15.9 9.8 10.8
General government net debt (% of GDP) 13.1 11.1 9.6 18.4 33.6 38.6 39.8
Current account balance (% of GDP) 2.9 -1.5 -3.7 -7.1 -1.5 -0.4 -1.3
Source: IMF World Economic Outlook Database, October 2010.
3. Developments under the Yanukovych Presidency A major re-alignment in Ukraine’s energy and foreign policies developed rapidly in the
course of 2010. Fragile economically, politically fractious and highly dependent on Russian
energy supplies and Russian good-will, Ukraine was going to have to take some difficult
decisions. One clear threat to Ukrainian economic interests was the looming possibility of
losing transit fees and other related revenues from the transiting of Russian gas to Europe
due to the construction of a set of Russian bypass or “transit avoidance” pipelines. If Nord
Stream and South Stream were to exist and operate at their full design capacities, transit
through Ukraine could fall to zero as soon as 2015 and remain at only very low levels
thereafter, see Figure 1. Another key challenge was the high price level for imported Rus-
sian gas which pressed down on margins in Ukraine’s main export industries.

Figure 1
Russian gas ex ports and supply corridor capacities to Europe (inc luding Turkey)
Source: IEA (2009: 470)
In a sense, the new Ukrainian government decided to aim high. Its most important foreign
energy policy goals were as follows:
• Revise the Timoshenko
annual gas prices, if possible down to 220
around 330 USD/tcm);
• Increase the volume of Russian gas transiting through Ukraine;
• Stop the implementation of the South Stream proje
projects that could negatively affect Ukrainian transit.
In the beginning, the new Ukrainian negotiation team felt some kind of euphoria. Official
Kiev assumed that Moscow would change its energy policy toward Ukraine due to
Russian orientation of Yanukovych (“pro
main proposal of the Ukrainians was to restore the project of an international consortium
for running the Ukrainian Gas Transmission System (GTS). But this seem
attractive to Russia, because Gazprom had already moved forward in developing altern
tive gas pipeline projects bypassing Ukraine. If these projects were completed, the Ru
sians had reasoned, they would anyway be able to influence the Ukrai
tion strategy without direct control of Ukraine’s GTS, and would in any case have almost no
need for it. In another interpretation, the South Stream project in particular is a credible
strategic threat to Ukrainian transit which the Russ
can extract valuable concessions from Ukraine. This shift in Russia’s (apparent) bargaining
28
ports and supply corridor capacities to Europe (inc luding Turkey)
In a sense, the new Ukrainian government decided to aim high. Its most important foreign
energy policy goals were as follows:
Revise the Timoshenko-Putin 2009 agreement in order to decrease the average
annual gas prices, if possible down to 220-230 USD/tcm (from forecast levels of
around 330 USD/tcm);
Increase the volume of Russian gas transiting through Ukraine;
Stop the implementation of the South Stream project and of other Russian bypass
projects that could negatively affect Ukrainian transit.
In the beginning, the new Ukrainian negotiation team felt some kind of euphoria. Official
Kiev assumed that Moscow would change its energy policy toward Ukraine due to
Russian orientation of Yanukovych (“pro-Russian” in the Ukrainian public opinion). The
main proposal of the Ukrainians was to restore the project of an international consortium
for running the Ukrainian Gas Transmission System (GTS). But this seem
attractive to Russia, because Gazprom had already moved forward in developing altern
tive gas pipeline projects bypassing Ukraine. If these projects were completed, the Ru
sians had reasoned, they would anyway be able to influence the Ukrainian gas transport
tion strategy without direct control of Ukraine’s GTS, and would in any case have almost no
need for it. In another interpretation, the South Stream project in particular is a credible
strategic threat to Ukrainian transit which the Russian side is unlikely to drop unless they
can extract valuable concessions from Ukraine. This shift in Russia’s (apparent) bargaining
ports and supply corridor capacities to Europe (inc luding Turkey)
In a sense, the new Ukrainian government decided to aim high. Its most important foreign
agreement in order to decrease the average
230 USD/tcm (from forecast levels of
ct and of other Russian bypass
In the beginning, the new Ukrainian negotiation team felt some kind of euphoria. Official
Kiev assumed that Moscow would change its energy policy toward Ukraine due to the pro-
Russian” in the Ukrainian public opinion). The
main proposal of the Ukrainians was to restore the project of an international consortium
for running the Ukrainian Gas Transmission System (GTS). But this seemed no longer so
attractive to Russia, because Gazprom had already moved forward in developing alterna-
tive gas pipeline projects bypassing Ukraine. If these projects were completed, the Rus-
nian gas transporta-
tion strategy without direct control of Ukraine’s GTS, and would in any case have almost no
need for it. In another interpretation, the South Stream project in particular is a credible
ian side is unlikely to drop unless they
can extract valuable concessions from Ukraine. This shift in Russia’s (apparent) bargaining

29
power is the main reason why the Ukrainian side felt forced to propose political conces-
sions. This process led to the Medvedev-Yanukovych “Kharkov treaties” in April 2010.
According to the 2nd article of the “Treaty on the residence of the Black Sea Fleet of the
Russian Federation on Ukrainian territory”, the Russian fleet will extend its presence on the
Crimean peninsula until 2042, as opposed to the earlier deadline of 2017, in exchange for
a gas price discount. If the formula price is above 333 USD/tcm, the discount is 100
USD/tcm, whereas if the formula price is below 333 USD/tcm, the discount is 30%. But
there is one important condition: the discount, valid until 2019, is rendered as a debt of
Ukraine to Russia which is to be paid off by granting the additional 25 years of presence of
the Black Sea Fleet in Crimea.
Synchronously to the Black Sea fleet treaty, Gazprom and Naftogaz signed an Addendum
(Appendix) to the 2009 gas supply contract specifying the following:
• The companies refuse to use punitive measures against each other;
• Ukraine increases its purchases of Russian gas up to 36.5 bcm per year;
• Gazprom shall settle 80% of the transit fees no later than the 6th day of the month
immediately following transit, and the remaining 20% no later than the 20th day of
that month (the latter was the old deadline for the entire payment);
• The discount on the formula price shall be not more than 100 USD/tcm and comes
in the form of a decrease in Russian export duties. The discount applies for a
maximum volume of 30 bcm in 2010 and for a maximum volume of 40 bcm per
year thereafter;
The Russian gas price decrease has mostly not been passed through to end-use prices:
the fall for industrial customers was about 3 USD/tcm – from 255 to 252 USD/tcm. Nafto-
gaz gains from these new agreements as it is now in a position to cash in reasonable profit
margins. This allows the company to improve its hitherto fragile financial situation. In addi-
tion, Naftogaz increased residential gas prices by 50% in August 2010. Further increases
should occur in line with IMF-approved reforms until domestic prices reach “import parity”,
an explicit goal of the reforms being to ensure a sound financial framework for Naftogaz
and steady improvements in energy efficiency in the country as a whole. On this issue, the
Ukrainian leadership is at risk of a popular backlash if it raises prices too much too fast,
while international financial institutions have a history of encouraging rapid price reforms
without taking sufficiently into consideration the risk of rising non-payment and theft. The
need for the reform is unquestionable, but the key question is the pace.
Although the gas question was at the centre of the “reset” of Ukrainian-Russian relations a
number of other agreements were also made. First of all, the Ukrainian side tried to “sell”
to Russia its new policy of non-integration into NATO. This was not deemed sufficiently
attractive, however. The Russian side was disappointed that a “no-block” election pledge
had been made by Yanukovych, thus ruling out Ukrainian membership of the Russian-led

30
military alliance in the former Soviet space, the CSTO. However other integrative meas-
ures were undertaken from the economic viewpoint:
• Integration with Russian (state-run) companies in the nuclear industry at the ex-
pense of collaboration with Western companies;
• Russian capital expansion in the Ukrainian bank sector;
• Partial Merger in the aviation industry with the creation of a joint venture between
Antonov (Ukraine) corporation and Russian United Aircraft Corporation (OAK)
(Russia);
There have also been rumours concerning a possible “list of Putin” enumerating Ukrainian
private and public companies that Putin proposed should be controlled by Russia. No con-
firmation of the existence of such a list has been found, although the rumour is not implau-
sible. If it is only a rumour, then at the very least it reveals current perceptions about the
direction of bilateral relations. Finally, the Kharkov treaties leave open a number of points
which the Ukrainian side would find very favourable:
• Renunciation of the ‘take-or-pay’ clause in bilateral gas agreements, or if it kept,
then the introduction of an analogous clause on transit, ‘pump or pay’, in case tran-
sit volumes are lower than contracted;
• Revision of the gas pricing formula specified in the 2009 supply contract. Besides
the high base level implied by the formula, Naftogaz would prefer it if the link to
gasoil and fuel oil prices were dropped;
• Full restoration of cooperation in the defence and machine-building industries;
• Settlement of the border demarcation in the Azov Sea and in the Kerch Channel.
Possibility of a merger between Gazprom and Naftogaz
One the most discussed part of the Ukrainian-Russian gas negotiation is the format of a
possible merger between Gazprom and Naftogaz. Initially this seemed to be an impromptu
idea of Putin at a joint press conference with Prime Minister Azarov in April 2010. Given
the large difference in market valuation between the companies, the Ukrainian side rapidly
concluded that Ukraine would be merely a minority shareholder in the merged company,
and that such a merger would satisfy all of Russia’s key demands while offering very little
of value to Ukraine in return. Following Ukraine’s refusal Moscow continued to propose
some form of full integration, at times switching to more aggressive bargaining rhetoric. In
August 2010 Putin stated that Ukraine had been given too big a discount on the price of
gas, and that it should therefore not try to obtain any new concessions. From Autumn 2010
the pressure intensified. According to Ukrainian government officials, Russia threatened to
stop negotiations about a Russian participation in the modernisation of the Ukrainian GTS.
On the other hand, Russia also suggested that a merger between Naftogaz and Gazprom
would mean the currently lower Russian domestic gas prices for Ukrainian customers, and

31
also that Russia would consider decreasing the capacity of the South Stream project.
Other paths towards uniting Gazprom and Naftogaz were also explored. A notable one
was to proceed with asset swaps. Ukraine was interested in this possibility, and hoped to
obtain ownership of gas deposits in Russia with a production flow of 30 bcm per year,
equivalent to Ukraine’s demand for Russian-produced gas.
In response Moscow proposed some deposits on the Yamal Peninsula as well as part of
the Astrakhan deposit. However in both cases particularly high up-front costs were a draw-
back. In addition the Astrakhan deposit has high sulphur content, which was why other
foreign investors (ENI and Total) had previously decided not to invest there. Ukraine stood
firm, asking for access to commercially more favourable deposits in the Urengoy gas field.
In exchange, Ukraine proposed joint exploration of the ‘Palasa structure’ on Ukraine’s
Black Sea shelf, as well as joint development of non-conventional gas in Ukraine. As a
result and as a first step, Ukraine and Russia declared the creation of two joint ventures in
November 2010 for developing Ukrainian resources, the first for the Palasa structure (esti-
mated reserves of 1000 bcm), the second for development of shale gas and coal-bed
methane. A memorandum to that effect was duly signed on 22 December 2010. The ques-
tion of the “main” joint venture was left open. Component assets of Ukraine’s GTS are po-
tentially on the table, e.g. underground storage facilities. In exchange, Russia could con-
sent to swaps with deposits in Russia (though most likely not in the Urengoy field), or to
further cuts in the export price and to commitments to higher transit volumes through
Ukraine. Another area of negotiation was the idea to lease Ukrainian underground storage
facilities to an international consortium of which Gazprom would be a member. The main
lobbyist for this idea from the Russian side was the manager of Gazpromsbyt Ukraine,
Anatoly Podmyshalsky.
Conversely, Ukraine’s energy Minister, Yuri Boyko, proposed the construction of gas stor-
age facilities in Eastern Ukraine. Currently, Ukraine’s (substantial) gas storage capacity is
mainly in Western Ukraine. Supplying all of the Eastern regions from Ukrainian storage in
case of a full cut in Russian imports would require operating large parts of Ukraine’s GTS
in reverse flow, exactly what Ukraine did during the January 2009 crisis. This had played a
role in extending the duration of the crisis – since the reverse flow operations meant that a
resumption of Russian deliveries couldn’t be accepted. New storage facilities in Eastern
Ukraine would therefore increase security of supply for Ukraine’s Eastern regions without
prejudice to the normal (East-to-West) operation of the GTS. Additional storage would also
be useful in case a proposed Ukrainian LNG terminal were built. The issue of LNG imports
to Ukraine is briefly addressed in a later section.
4. Key drivers of Ukraine’s current political orien tation The many developments listed in the last section illustrate how Ukraine under the
Yanukovych Presidency has sought to alleviate severe economic and energy policy chal-
lenges by making far-reaching arrangements with the Russian Federation. In both political
and economic terms, some of the concessions Ukraine has made have been highly con-

32
troversial both inside Ukraine and in the West. The merger or swapping of assets across
several strategic components of Ukraine’s national economy and the partial re-orientation
of Ukraine’s foreign, security and defence policies unfolded very rapidly, raising the ques-
tion of Ukraine’s future as a genuinely independent country. Symbolic political gestures
concerning the use of the Russian language and the recent scrapping of Stepan Bandera’s
‘Hero of Ukraine’ status also seemed to suggest a deeper “pro-Russia” orientation. Taking
these developments together, the question which seems most relevant is to determine the
motives of the current Ukrainian Presidency. As is typically the case with real government
policies, there are often several reasons for any particular decision, as well as more than
one general driver or motive for a government’s strategies. However a useful analysis can
be made by formulating four hypotheses concerning the primary motive for Ukraine’s cur-
rent policy orientation. The hypotheses are shown in Table 3.
Table 3
Political hypotheses concerning the Yanukovych Pres idency
Hypothesis Name Consistent with
1 National interest Realism
2 Private interests Kleptocracy
3 Russia first “Unionism”
4 Power first Authoritarianism
Source: authors’ formulations
The first hypothesis presumes that the Ukrainian leadership pursues a realist and prag-
matic policy driven by a strong commitment to national interests and the acknowledgement
that Ukraine’s current position of weakness could be overcome only by painful compro-
mises. The ‘gas for Sevastopol’ deal exemplifies such compromise, in which something
symbolically valuable but not crucial for the core interests is traded for absolutely neces-
sary economic concessions. Two key assumptions in this supposition is that accession to
NATO is not seen as important or even desirable by the Yanukovych team, while eco-
nomic failure is perceived as the main threat to Ukraine’s existence.
The second hypothesis focuses on the parochial economic interest of several business
groups that are effectively controlling Ukraine’s politics and seek to maximize the profits
derived from the ‘privatization’ of the government. The richest Ukrainian ‘oligarch’, Rinat
Akhmetov, is often portrayed as the main sponsor of Yanukovych’s career (Dmytro Firtash
is now believed to be the main sponsor), while Deputy Prime Ministers Sergei Tigipko and
Andrei Klyuev have their own private business interests. Corruption is the main political
driver in this perspective, but it is also important that the ‘oligarchs’ are investing in their

33
core business and not simply ‘stealing’ the state. Getting cheaper gas is crucial for preserv-
ing profit margins, but the Russian business tycoons must be kept at bay in their aggres-
sive acquisitions of Ukrainian assets.
The third hypothesis ascribes to the Ukrainian leadership an ideological intention of build-
ing a closer alliance with Russia and a willingness to sacrifice key elements of state sover-
eignty. Rejection of Western values and curtailing of efforts to build closer ties with the EU
are parts of the same ‘Russia-first’ course, which is underpinned by the desire to change
the identity of the Ukrainian state-project according to the vision of a Slavic/Orthodox ‘civili-
zation’. Closer economic integration with Russia then becomes both the main way of ad-
vancing this ‘natural’ unity and the key means of lifting Ukraine from the quagmire of re-
cession. An important assumption in this perspective is that cross-border business net-
works, including those in the gas sector, could grow fast without any conflicts caused by
competition between ‘territorial’ business empires.
The last hypothesis suggests that the main driver of Ukraine’s foreign policy is politics itself
– the desire of the ruling group to keep power in its hands by building a dominant political
machine. The intention to convert political control into financial gain is a part of this plan but
the notion of ‘national interest’ is only a figure of speech in propaganda manipulations of
the electorate. The ‘oligarchs’ are kept on a short leash in this power-centric model; the
pattern of permanent reconfiguration of leadership that was reinforced by the ‘orange revo-
lution’ is replaced with a one-party rule; and the remarkably rich culture of political com-
promises is discarded.
Testing the hypotheses
There are elements of plausibility to each hypothesis, and expert opinion is currently me-
andering between them, but it appears possible to apply a set of simple logical tests to
each of them. We assess each hypothesis in view of twelve test cases and assess in each
case the adequacy of the hypotheses. The overview of this assessment is given in Table 4.
A plus sign symbolises consistency, a minus sign inconsistency, a zero denotes neutrality
and a question mark denotes an undetermined result.
The logic of the first hypothesis suggests that the ‘realist-minded’ leadership cannot bar-
gain on vital ‘national interests’, must try to counter-balance external dependencies, and
keeps trading symbolic values for tangible benefits. The delimitation of the maritime border
in the Kerch Strait is a good test for the first hypothesis, and its result is affirmative, as
Ukraine refuses to yield any ground to Russia.
The second test case is the intensity of Ukraine’s contacts with the EU. One may for in-
stance mention Ukraine’s willingness to align domestic energy market regulations with EU
standards, see Section 5, as well as ongoing efforts to secure an association agreement
and a free-trade agreement. These moves are all opposed by Russia, explicitly in the case
of energy market regulation, implicitly in the case of the free-trade agreement (see next test
case below). This is however an area of policy inconsistency for the Yanukovych leader-

34
ship. Its selective use of the justice system to neutralise political opposition (especially from
Tymoshenko and her allies) and its clampdown on media freedom is leading to warnings
and condemnations from both the United States and the European Union, thus threatening
Ukraine’s prospects, see Financial Times (2011).
Table 4
Assessment of political hypotheses Hypotheses Hypothesis 1 Hypothesis 2 Hypothesis 3 Hypothesis 4
National interest Private interests Russia first Power first
Test cases
Firmness on Kerch Strait
border issue
+ - - +
EU association and free-
trade agreements
+ + - -
Not joining the Russian
Customs Union
+ -/+ - -
“No block” pledge (No
CSTO membership)
+ 0 - 0
Industrial assets partly
cordoned off
+ + - +
Relative lack of oligarch-
friendly policies
+ - 0 -
Russian language not
raised to official status
+ - - +
Abrogation of Stepan
Bandera’s Hero status
- 0 + -
Cooperation with Putin’s
United Russia party
- - 0/+ -
Appointing loyalist to
Kiev City administration
0 0 0 +
Not boosting the power
of the security services
+ + 0 -
Lack of clampdown on
oligarchs
+/- + 0 -
Source: authors’ assessments
The partly symmetric test case is the possible accession of Ukraine to the Russia-led Cus-
toms Union (under effect since 6 July 2010 with Russia, Belarus, and Kazakhstan) which
Ukraine has declined. Joining the Customs Union could have benefitted many Ukrainian
exporters (notably from the Yanukovych power base), but it would have prevented an in-
dependent Ukrainian trade policy including a (separate) free-trade agreement with the EU,
itself also potentially beneficial for Ukrainian exporters. In defence policy Yanukovych sig-
nalled the abandonment of the previous administration’s NATO membership goal. This
was a non-choice given German and French opposition anyway, so the test case is the

35
voluntary choice made in favour of a “no block” pledge, signifying a lack of interest in the
Russian-controlled military block, the Collective Security Treaty Organisation (CSTO).
The evidence for the second hypothesis should support the straightforward ‘money rules’
logic with the important clarification about ‘our money’. One obvious test for it is the protec-
tion of Ukrainian assets – from the Antonov Aeronautic Complex to the Kremenchug oil
refinery – from Russian ‘predators’, and this protectionism is indeed well documented. A
particular case here is the careful containment of Gazprom’s attack on Naftogaz, including
the rejection of offers for joint control over the gas infrastructure, as noted in Section 3. One
could also expect a business-friendly anti-crisis policy, with rescue packages to ‘oligarchs-
in-need’ and privatization on the cheap, but Yanukovych has generally followed the IMF
guidelines and thus secured many new loans.
An ambitious intention to alter the identity of the Ukrainian state in the third hypothesis is
not necessarily in conflict with the economic interests prevalent in the previous case. The
best test here is the uplifting of the Russian language to the status of the second state lan-
guage, but Yanukovych, despite earlier promises and in the face of negative reactions in
Western Ukraine, is tending towards a compromise along the lines of the Council of
Europe’s European Charter for Regional or Minority Languages. Another test case is the
recent cancellation of the Yushchenko presidential decree that awarded Stepan Bandera
the honour of ‘Hero of Ukraine’. This was a goal of the Yanukovych team and a friendly
signal to Moscow. However a deliberately slow and indirect process was chosen, see e.g.
New York Times (2011), operating through the justice system and based on a technical-
ity11, rather than by direct decree. While the original Yushchenko decree was arguably a
divisive move, better statesmanship would have called for an attempt at national reconcilia-
tion12 on this highly emblematic question of national historical identity. An additional test
concerns closer ties between the Party of Regions (of Yanukovych) and the United Russia
party of Vladimir Putin. While the interest from the Russian side is clear – an attempt to
create a Moscow-centred network of like-minded political parties in the former Soviet space
– the importance and ultimate effect of this potential channel of influence is not yet clear,
so the test result remains undetermined at this point in time.
The prevalence of political drivers in the fourth hypothesis involves determined efforts from
the ruling group at expanding its support base and ensuring its ability to win elections. One
test here is the control over the political machine in Kiev, which was the epicentre of the
Orange Revolution, and Yanukovych has indeed replaced the head of the city administra-
tion with a loyalist. The last two test cases concern more typically ‘Putinistic’ actions which
11 The first step in the process, taken by a Donetsk (Eastern Ukraine) court in April 2010, was to rule that the Yushchenko decree was unlawful because Bandera wasn’t a Ukrainian citizen. Yushchenko, now as a private citizen, appealed against the decision. His appeal was not taken into consideration by the Higher Administrative Court of Ukraine, hence the Donetsk decision was not overruled and therefore now has legal force, see Kyiv Post (2011a). 12 The Regional Council of Lviv (Western Ukraine) held a special session in front of the Stepan Bandera monument in protest, see Ukrinform (2011), while opposition deputy Kirilenko stated his view that “this is an anti-Ukrainian decision (…) motivated by political concerns [and] will widen the split in society and increase political tension”, see Kyiv Post (2011b).

36
could have been undertaken but were not. The first action would have been to boost the
budget, power and reach of the security services. Remarkably little has occurred in that
direction. The second action would have been to tame the oligarchs, for example by selec-
tively prosecuting one of them for corruption (or some other offence). However no moves
of this sort have been observed.
None of the twelve listed cases constitutes an ultimate ‘litmus test’ and one should also not
treat the results of this assessment in a statistical manner given that many other important
cases could also be considered. The ‘gas-for-Sevastopol’ deal, for instance, would argua-
bly be consistent with all four hypotheses if one considers its short-term implications, but
the long-term implications, in terms of limiting Ukraine’s freedom of action in its foreign and
defence policies, are clearly negative.
Interpretation and implications
Every hypothesis identifying a single driver of political behaviour involves a big dose of
simplification, so mixed results are not surprising, and greater number of tests would
probably confirm that real policy-making always involves a combination of contradictory
motives and interests. One conclusion that can be drawn with reasonable certainty from
the collected data is that a pan-Slavic ambition to foster an ‘ever-closer union’ with Russia
has very little place in the goals pursued by the Ukrainian leadership. Only a few bitterly
disappointed supporters of the Orange Revolution argue along the lines of this hypothesis,
while most experts would insist that pro-Russian forces are absent from the motley Ukrain-
ian political arena. Political motives are certainly present among the drivers of policy-setting
and it could be argued that Yanukovych has performed far above expectations in consoli-
dating control, but his deviations from democracy remain nevertheless relatively innocent
comparing with Putin’s ‘vertical of power’. Wish-lists of friendly ‘oligarchs’ are granted privi-
leged attention of the government, which is as (extremely) corrupt as for instance Nigeria
or Zimbabwe, but on balance, Yanukovych has demonstrated greater independence from
parochial interests of the Donetsk clan than the second hypothesis presumes. The idea of
‘national interests’ is always open to interpretation but it can be convincingly argued that
the Ukrainian leadership sticks to its (honestly-held) interpretation of those interests and
strives to safeguard them to the degree possible in severely unfavourable conditions.
The gas business involves a particularly complex interplay of conflicting interests so that
the need to reduce payments to Moscow (including by developing domestic non-
conventional sources) somewhat contradicts Ukraine’s self-presentation as the shortest
and most reliable transit route. The desire to keep control over the domestic gas transmis-
sion system also exacerbates the lack of funds for their modernisation. Yanukovych has to
resort to delays and bluffs, playing a very weak hand against EU plans to diversify sources
of gas supply (which means less transit through Ukraine), and against the Russian plan to
diversify transit routes by constructing the Nord Stream and South Stream pipelines.
Ukraine’s hopes are pinned on the possibility of terminating the latter project due to its ex-
orbitant costs but, in Gazprom’s peculiar assessments of cost-efficiency, extra-high in-

37
vestments in construction mean larger volumes of profit for sub-contractors and fatter bo-
nuses for managers.
5. In search of energy policy independence? Ukraine’s many concessions to Russia may give the impression that the country has given
up on a genuinely independent course. The opposite is however the case. As soon as the
new Ukrainian government understood that Moscow wasn’t inclined to make more sub-
stantial offers to Ukraine, a return to a “multi-vector” energy policy started to be developed.
Three pillars of policy may be identified: the alignment of domestic gas market regulations
with the EU Acquis; a trilateral approach (EU-Russia-Ukraine) to modernising the domestic
GTS; and policies to reduce dependence on Russian imports. In addition Ukraine is also
interested in reviving gas trade with Central Asia over the Russian route.
Ukraine wishes to align its legislation with the EU Acquis. In June 2010 the Ukrainian par-
liament passed the law “On the bases of the functioning of the natural gas market in
Ukraine”. The law orders:
• the elimination of monopoly positions;
• the introduction of a competitive internal gas market;
• the provision of non-discriminatory third party access to the GTS;
• the separation of transmission operations from distribution operations;
The most important regulations should come into force over the 2012-2015 period. Consis-
tent with this approach, Ukraine is also in the final stages of accession to the Energy
Community which drives forward a (lagged) adoption of the EU Acquis on energy in non-
EU countries in Eastern and South-eastern Europe. The Protocol of Membership was
submitted in November 2010 to the Ukrainian parliament for ratification. There are however
risks of intervening revisions to the new legislation, as well as delays or disruptions to the
ratification procedure for Energy Community membership, as a result of ongoing Russian
pressure. Valery Yazev, Deputy Speaker of the State Duma of the Russian Federation and
President of the Russian Gas Association, stated that passing such legislation would block
the path to further Russo-Ukrainian integration, and seemed to threaten the Ukrainian side
by stating that the Ukrainian pipeline system would “whither away”, see Dyen (2010).
Ukraine’s GTS is in need of wide-ranging modernisation and investment. Ukraine’s 2009
attempt (under Yuschchenko and Tymoshenko) to proceed with primarily Western in-
volvement in the modernisation of the GTS, culminating in the 23 March 2009 agreement
between the European Commission and Ukraine, had come under heavy Russian fire. The
new approach is to push for a trilateral approach, Russia-EU-Ukraine. The first major meet-
ing with the Commission took place on 22 November 2010 in Brussels, where Yanukovych
re-affirmed Ukraine’s opposition to the South Stream project and his commitment to Euro-
pean security of supply, see e.g. New York Times (2010). However Ukraine hasn’t ob-

38
tained long-term guarantees of increasing transit volumes or guarantees of investment for
the modernisation of the GTS.
In parallel, Ukraine wishes to achieve a lower degree of import dependence as well as a
lower reliance on Russian imports. The Ukrainian government has set the goal of increas-
ing domestic gas production over the next 10 years from 20 bcm per year to at least 30
bcm. This is to be pursued by developing conventional offshore deposits in the Black Sea
as well as non-conventional resources, in particular shale gas and coal-bed methane de-
posits. The success or failure of these goals will crucially depend on foreign investments.
Russia has (unsurprisingly) expressed interest in all Ukrainian projects. However both
types of projects are technology-intensive and Western companies are better placed to
play a role. The commercial development of shelf gas deposits in the Black Sea could de-
velop through two projects. The first project is led by a company called Vanco Prykerchen-
ska. A production-sharing agreement (PSA) was signed in 2008 already, but was later
cancelled. While the composition of Vanco Prykerchenska is somewhat murky13, see De-
mydenko (2008) and Yeremenko (2008), relations with the Ukrainian government seem to
be on the mend, see Kyiv Post (2010). The second project is the previously-mentioned
joint venture between Naftogaz and Gazprom. Since 2010 the government has began to
elaborate program of shale and coal gas production. Ukrainian shale gas reserves are little
explored and estimated to be in a range of 2 to 32 trillion cubic metres. The first step is a
pilot extraction project over 2010-2014, estimated to cost USD 500 million, around 20% of
which would be covered from the state budget. One challenge is the likely high cost of the
extracted gas as compared to prices on the Ukrainian market, also given the discount se-
cured by Ukraine for Russian gas. As a result, Naftogaz hasn’t shown a strong interest. On
the other hand, potential foreign investors include Shell, PKN Orlen and TNK-BP. At the
same time, experts from the gas industry suspect that, for obvious reasons, Gazprom’s
interest in this area is rather to deter the development of shale and coal gas in Ukraine.
Ukraine is also interested in reviving gas trade with Central Asia over the Russian route.
This would bring Ukraine back to its earlier situation – a combination of “Russian” and
“Central Asian” imports, all transiting through Russia and controlled by Gazprom and by
the Russian state – pursued because the “Central Asian” gas might be somewhat cheaper.
This is a danger zone for Ukraine’s external gas policy. It is tempting for both economic
and private interests, but it does nothing to reduce the strategic dependence on Gazprom
and its resulting pricing power on the Ukrainian economy.
More usefully, Ukraine also wishes to diversify its sources of imports by building an LNG
terminal on the Black Sea coast. A state-owned enterprise (“National project LNG-
terminal”) was established in December 2010 with the aim of building the terminal and a
13 Owned in equal shares by Vanco International (a 100%-owned affiliate of Houston-based Vanco Energy Company), DTEK Holdings Limited of Ukrainian businessman Rinat Akhmetov, Shadowlight Investments Limited of Russian businessman Yevgeniy Novitsky, and Integrum Technologies Limited of Austria (unknown owners).

39
regasification plant14. The goal would be to start operations in 2015 with a capacity of 5
bcm per year, rising to 10 bcm per year from 2016, see Moscow Times (2010). Azerbaijani
supplies shipped from Georgia could be a major source of supplies. A Memorandum be-
tween Ukraine and Azerbaijan to that effect has been approved. If all goes to plan,
Ukraine’s LNG terminal would represent a substantial diversification of supply sources,
accounting for around 20% of its imports (around 50 bcm in 2008).
6. Conclusions Ukraine’s main external energy policy goals are to hold down gas import prices, to promote
the continued (and if possible expanded) use of its infrastructure for transit of Russian gas
to Europe, to encourage the cancellation of the South Stream project, to secure foreign
investment and assistance in upgrading its gas transmission system on the basis of a tri-
lateral approach (EU-Russia-Ukraine), and to decrease its dependence on Russian im-
ports by building an LNG terminal. Ukraine’s main domestic energy policy initiatives are to
reform domestic gas prices and raise energy efficiency, to ensure the financial balance of
Naftogaz without state subsidies, to reform the regulation of its domestic gas market in line
with EU legislation, and to increase the domestic production of natural gas in collaboration
with foreign investors, including Russia.
Taken together, these policy developments suggest a well-thought-out strategy. Given
Ukraine’s economic vulnerabilities, its government decided to pay a price: foreign and de-
fence policy concessions, and some economic concessions, in exchange for substantial
relief in terms of its gas import bill. Pressures from Russia continue to bear upon Ukraine,
as the former has an altogether more ambitious vision for integrating and controlling key
assets and key policies of the latter. However these pressures are considerably less ag-
gressive than during the Yushchenko Presidency, and much less likely to lead to significant
conflicts. The risk of supply disruptions of the kind seen in January 2006 and in January
2009 seems very low for the near future.
According to our analysis, Ukraine’s leadership has been mainly driven by a “realist” un-
derstanding of its relations with Russia in line with its core economic interests, not by a
“Russia first” agenda. Domestically speaking, while corruption is still at massive levels, and
while the interplay of private and public interests remains unhelpful, the current govern-
ment seems more inclined towards consolidation of political power than towards the private
interests of its members, though these goals sometimes overlap. In that context, several
negative developments have taken shape with respect to liberal democratic standards. The
justice system has been used selectively in an obvious attempt to shut down political com-
petition and pressures against the media are a serious concern. However talk of a “Putini-
sation” of Ukraine seems too pessimistic an assessment at this point in time. Conditionality
from the EU (and to a lesser degree the United States) could be an important countervail-
14 Dmytro Firtash, RosUkrEnergo’s co-owner, has declared an interest in the project as he commits to moving out of the Russian-Ukrainian gas trade.

40
ing force, certainly preferable to a domestic political backlash or to a further slide towards
authoritarianism.
Concerning Ukraine’s domestic gas market, the country’s dependence on stop-gap sup-
port from the IMF encouraged the adoption of necessary domestic gas price reforms.
Gradual alignment with import prices seems feasible both politically and economically pro-
vided it occurs at the right pace. The potential longer-run effects of these reforms could
make a significant contribution to Ukraine’s energy security position as well. Another crucial
question is the restructuring of Naftogaz in the context of Ukraine’s drive towards unbun-
dling. There is a strong probability that some form of separation between transmission (in-
cluding transit of Russian gas) and distribution activities will occur. However it also seems
likely that the Ukrainian leadership will develop ways to exert continued control on the en-
tire industry after these reforms take place.
Three further points should be mentioned. The first is an expressed interest in reviving the
gas trade with Turkmenistan, with Russia as the transit partner. This is a danger zone for
Ukraine. It may be packaged (again) in a way that seems tempting for the Ukrainian lead-
ership, but should be avoided. Central Asian gas handled by Gazprom (as opposed to
“Russian gas” handled by Gazprom) is a false solution to pricing and diversification chal-
lenges. Instead, LNG from Azerbaijan (for example) would be a genuine solution for diver-
sification, while domestic energy price reform and other (broader) measures to boost com-
petitiveness are real solutions to high energy import prices. Second, the drive towards
power consolidation has meant moves against Tymoshenko and her allies. The highly tar-
geted nature of these measures is damaging for the international reputation of the
Yanukovych leadership and a threat to relations with the European Union. Moreover, in
spite of (or perhaps because of) her own controversial involvement in the gas trade in the
1990s, Tymoshenko should in retrospect be recognised as one of the few Ukrainian politi-
cians who actually understood the implications of Ukraine’s successive gas import con-
tracts. Ukraine has yet to develop a constructive culture of political opposition where former
political figures are seen not only as political challengers but also as bearers of valuable
experience in national leadership. Third, and this is related to the two points above, one of
Ukraine’s main structural weaknesses is its very high level of corruption. This generates
major economic distortions and also does severe harm to Ukraine’s international reputa-
tion. Reforms to address this issue have been comparatively successful in some transition
countries and should also be attempted in Ukraine – instead of selectively prosecuting past
instances of individual corruption for political purposes.
Two fundamental issues in Russian-Ukrainian gas relations remain open. From the Rus-
sian side, an outright merger (de facto an acquisition) of Naftogaz remains the goal, some-
thing which the Ukrainian leadership is unlikely to accept. From the Ukrainian side, the
cancellation of the South Stream project, at least as it is currently planned, combined with a
commitment to raising transit volumes through Ukraine would be a major victory. However
this vision depends on the success of the trilateral (EU-Russia-Ukraine) approach now
being promoted by Ukraine for its gas transmission system, as well as on longer-term EU

41
gas demand patterns for which significant uncertainty prevails. Conversely, the interest of
EU actors and of Russia in that project also depends on how committed they are to the
South Stream project in its current form. But that would be a matter for another paper.

42
Edward Hunter Christie15, Research Partner, Pan-European Institute (PEI)
The potential for an EU Gas Purchasing Agency
1. Introduction The European Union is highly dependent on imports for all fossil fuels. The EU’s own re-
serves of conventional natural gas, primarily located in the North Sea, are in rapid and es-
sentially terminal decline. As a result, the EU’s net import dependence for natural gas is
generally projected to rise from around 60% today (based on 2007 data) to between 75%
and 80% by 2020 and to between 84% and 89% by 2030, see Christie (2010) for an over-
view of recent scenarios. In parallel, the fragmentation of the EU’s natural gas markets in
combination with the essentially national approach taken by EU Member States in matters
of external energy policy has been seen as increasingly unsatisfactory. A notable devel-
opment in this regard is the joint declaration of 5 May 2010 by the President of the Euro-
pean Parliament Jerzy Buzek and former Commission President Jacques Delors on the
need to create a European Energy Community.
One aspect of the fragmentation between EU Member States is the bilateral nature of gas
import contracts. EU gas companies have typically entered into large state-backed long-
term supply contracts with suppliers such as Gazprom with pricing clauses that are subject
to confidentiality. However such information does tend to seep out16. The uncovering of
large gaps in import prices for Russian gas, notably between the Baltic States and Ger-
many, have therefore led to strong political demand for a consolidation of the bargaining
power of EU customers. According to Arvydas Sekmokas, Lithuania’s Minister of Energy,
Lithuania pays around 100 US dollars per thousand cubic metre (USD/tcm) more than
does Germany for its imports of Russian gas17.
The proposal made by Jerzy Buzek and Jacques Delors is to “engage in coordinated en-
ergy purchasing, should the need arise”, see European Parliament (2010). Andoura et al.
(2010), the policy paper that outlines in more detail the concept of the European Energy
Community, clarifies that coordinated purchasing could take either a weak form, namely
the formation of consortia of companies and Member States, or a strong form, namely the
creation of a fully-fledged EU gas purchasing agency - in other words the creation of a
‘single buyer’ for natural gas imports. The goal in this paper is to offer an analysis of the
15 Contact information: [email protected] 16 Christie (2009) proposed that it should be compulsory for EU gas companies to release in-formation on bilateral supply contracts and import values to EU institutions and (all) Member State governments, for instance under the auspices of the Agency for the Coordination of En-ergy Regulators (ACER). 17 Welcome address given at the opening of the 11th IAEE European Conference in Vilnius, Lithuania, 26 August 2010.

43
potential for these options, namely the effects of consolidating buyer power in the context
of gas supply contract negotiations. The analysis starts with a review of the recent devel-
opments and scenario projections for the EU’s long-term natural gas import requirements.
The background to the concept of the single buyer is then given, with a description of the
chosen theoretical model from the literature. Stylised surplus functions for a gas exporter
and for gas importers are then constructed, leading to numerical simulations of key cases.
An analysis of the potential impacts on import prices and quantities is then offered, fol-
lowed by a brief policy discussion and ideas for further research.
2. Prospects for EU gas import demand The EU’s Climate and Energy Package, or New Energy Policy (the 20-20-20 targets), had
initially been projected to lead to substantially lower demand for natural gas imports ac-
cording to Commission projections using the PRIMES energy model, see European Com-
mission (2008). Subsequent energy model projections, e.g. from IEA (2009a) and from
Eurogas, point to less dramatic effects. A review of those scenarios is given in Christie
(2010). Significant uncertainties remain for the 2030 horizon and beyond depending on
policy choices. In spite of the failure to secure a global agreement at the COP15 talks in
Copenhagen in December 2009, it is generally assumed that the European Union will
commit to substantial cuts in emissions for 2030 in the first instance and then onwards to
2050. Recent political commitments outline the goal of achieving a cut in greenhouse
gases of at least 80% on the 1990 level by 2050, see e.g. Group of Eight (2009). The base
assumptions corresponding to this ambitious vision correspond to an attempt to stabilise
atmospheric concentration of CO2 to 450 parts per million (ppm). In this section we focus
only18 on the most recent scenarios from the IEA World Energy Outlook 2010 (IEA, 2010),
see Figure 1. The scale is cut at 300 Mtoe in order to improve readability. The Current
Policies scenario is the most conservative scenario, assuming only that existing market
and public policy instruments function effectively in line with official targets. It does not as-
sume that policy commitments or targets will be met if there are no policy instruments in
place for their implementation. The New Policies scenario additionally assumes that official
targets and commitments made for the 2020 horizon are met even if aspects of their con-
crete implementation are not yet complete. In the EU case this includes meeting all of the
20-20-20 targets. The 450 scenario assumes that additional (ambitious) measures are
taken to ensure a long-term stabilisation of atmospheric CO2 emissions at 450 ppm. The
difference between the Current Policies and New Policies scenarios is relatively limited
although it does gather momentum by 2030-2035.
18 The new scenario projections of the European Commission, see DG Energy (2010), focus rather more on the EU targets to 2020 and end in 2030, while IEA (2010) develops a fully-fledged ‘450 scenario’ and extends the projection period to 2035.
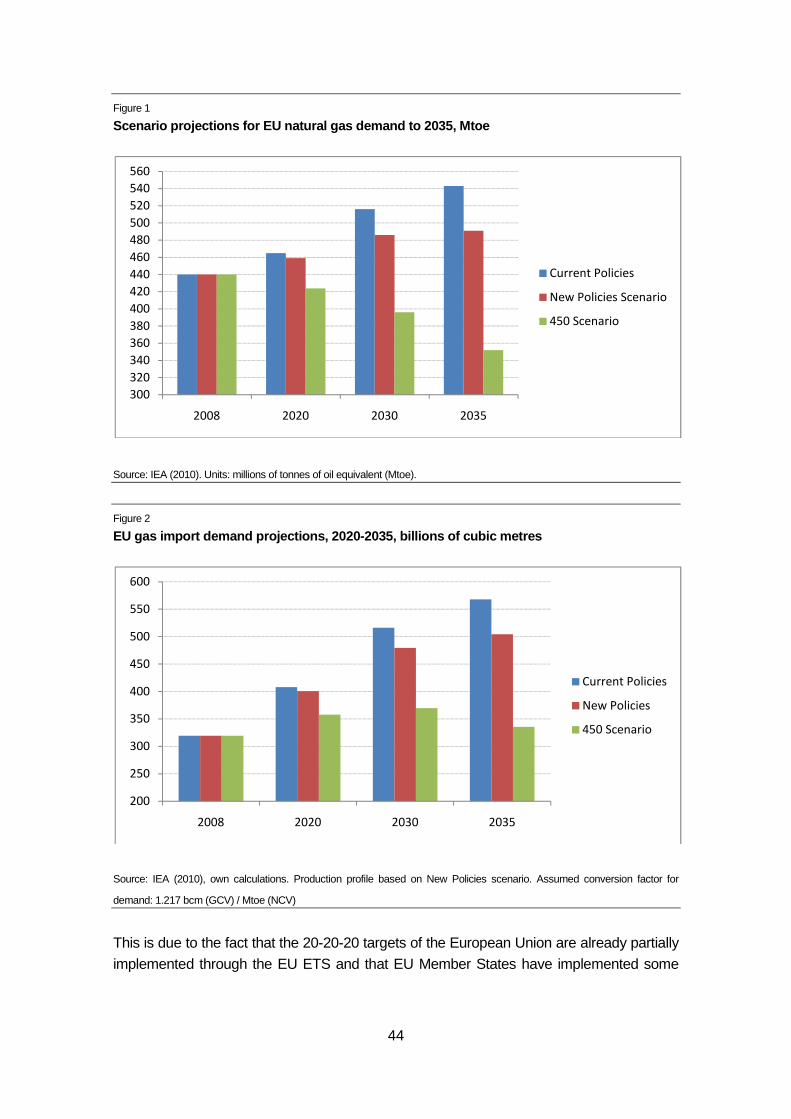
44
Figure 1
Scenario projections for EU natural gas demand to 2 035, Mtoe
Source: IEA (2010). Units: millions of tonnes of oil equivalent (Mtoe).
Figure 2
EU gas import demand projections, 2020-2035, billio ns of cubic metres
Source: IEA (2010), own calculations. Production profile based on New Policies scenario. Assumed conversion factor for
demand: 1.217 bcm (GCV) / Mtoe (NCV)
This is due to the fact that the 20-20-20 targets of the European Union are already partially
implemented through the EU ETS and that EU Member States have implemented some
300
320
340
360
380
400
420
440
460
480
500
520
540
560
2008 2020 2030 2035
Current Policies
New Policies Scenario
450 Scenario
200
250
300
350
400
450
500
550
600
2008 2020 2030 2035
Current Policies
New Policies
450 Scenario

45
policies that should contribute to partially meeting the renewable energy and energy effi-
ciency targets. On the other hand the 450 scenario diverges strongly from the other sce-
narios, implying a historical peak for natural gas demand sometime between 2008 and
2020 followed by a fall of roughly 21% on the 2008 level by 2035. The New Policies sce-
nario on the other hand projects a rise in demand of about 10% by 2035, almost all of
which would be achieved by 2030, after which only very modest growth would seem likely.
The evolution of import demand follows a somewhat different pattern to that of total de-
mand. Because EU production is falling rapidly, the moment when import demand peaks
occurs much later than the moment when total demand peaks, see Figure 2 (the scale is
cut at 200 bcm in order to improve readability).
The Current Policies scenario can be seen as highly unlikely given the political momentum
in favour of (somewhat) ambitious climate change policies in the European Union, while
the range offered by the gap between the New Policies and 450 scenarios seems a good
guide to what could unfold over the projection period. The gap between the 450 and New
Policies scenario is around 40 bcm per year in 2020 and around 110 bcm per year in 2030.
The dynamics are also fundamentally different. In the 450 scenario, import demand would
reach a peak around 2030 of around 360 bcm per year and then start to fall, while it would
continue to rise beyond 2035 in the New Policies scenario, rising above 500 bcm per year
in the process. The challenge of uncertainty of demand for natural gas therefore remains
firmly on the table especially after 2020. On the supply side the main developments are a
rapidly falling total production with only a modest contribution from unconventional sources.
EU production is projected to fall from 216 bcm in 2008 to 112 bcm by 2030, a fall of
around 50%. The overall conclusion is that the EU’s net import dependence will rise sub-
stantially to 2030 in all scenarios, see Table 1. Furthermore, even a fully successful imple-
mentation of highly ambitious climate change policies, leading to significant falls in total
demand in the short-term, will not suffice to compensate for the fall in domestic production.
Moreover it bears noting that even the inclusion of Norway (say, if one considers the pro-
duction in the EEA) does not suffice to reverse the trend of decline. As noted in IEA (2010:
192), declines in production first in the UK and then in the Netherlands strongly outweigh a
projected growth in Norwegian production.
Table 1
EU gas import dependence ratio: 2008 to 2035
Current Policies New Policies 450 Scenario
2008 60% 60% 60%
2020 72% 72% 69%
2030 82% 81% 77%
2035 86% 84% 78%
Source: IEA (2010), own calculations.

46
3. Modelling framework The negotiating power of buyers in the literature on bilateral oligopolies is generally re-
ferred to as countervailing power. A general definition of countervailing power may be
given as “the ability of large buyers in concentrated downstream markets to extract price
concessions from suppliers”, see Snyder (2005).
One class of models, developed notably by Chipty and Snyder (1999) and Inderst and
Wey (2003), can be described as follows: assume one monopoly supplier and several
buyers (i=1, .., n), each of which purchases a quantity qi. The supplier enters into simulta-
neous negotiations with each of the buyers separately. Negotiations determine the quanti-
ties to be traded, qi, and the tariffs Ti for each bundle. In line with a Nash equilibrium, the
supplier and the respective buyer maximise the joint surplus (sum of profits) from their
agreement, and split the surplus equally.
Each buyer is assumed to be serving a separate market, e.g. in different regions or even
different countries, such that the downstream demand functions are considered independ-
ent from each other. The base assumption of separate downstream markets is an impor-
tant departure from classical models of monopoly provision. Intuitively, an individual buyer
is essentially unaffected by the price obtained by another buyer because they each supply
separate markets through separate physical outlets. These outlets are geographically too
distant from one another to serve a common market due to transportation costs. The eco-
nomic geography of natural gas infrastructure fits well with this general assumption. Recent
research that applies this framework to European gas imports includes Caldas Cabrera
(2009) and Ikonnikova and Zwart (2010).
The net surplus (profit) earned by the supplier is given in (1), where V(Q) is what Chipty
and Snyder (1999) call ‘gross surplus’, in other words the profit of the supplier net of the
revenues from sales to the buyers. V(Q) contains all of the costs incurred by the supplier,
including the costs of producing Q, as well as any revenues from other activities that may
exist. The net surplus of buyer i is given in (2). Similarly, vi(qi) is the ‘gross surplus’ for the
buyer, including the revenue of activities that use qi as an input, any other revenues, minus
all costs except the tariff paid for obtaining qi.
V�Q� + ∑ T�
� (1)
v��q�� − T� (2)
The bargaining equilibrium is such that the gains from trade between the seller and the
buyers equalise. Therefore, as shown in (3), the incremental gain in net surplus when one
more negotiation (here with buyer a) is successful brings equal benefits to the seller and to
the additional buyer, and this holds for all negotiations, i.e. for all buyers.
V�Q� + ∑ T�
� − V�Q − q�� + ∑ T�
��� � = v��q�� − T� ∀ a = 1, … , n (3)

47
Solving (3) for Ta, as shown in (4), yields the vector of equilibrium tariffs Ta* shown in (5).
V�Q� + T� − V�Q − q�� = v��q�� − T� ↔ 2T� = v��q�� + V�Q − q�� − V�Q� (4)
T�
∗ =�
� v��q�� + V�Q − q�� − V�Q�� ∀ a = 1, … , n (5)
Substituting (5) into (1) and (2) yields the expressions for the equilibrium quantities. The
net surplus for buyer a in equilibrium is shown in (6).
�
� v��q�� + V�Q� − V�Q − q��� (6)
We now label the corresponding equilibrium quantities qis and Qs, in reference to the fact
that the buyers all remain separated from each other, and compute an alternative equilib-
rium where, say, buyers 1 and 2 have merged. We label the equilibrium quantities for that
second equilibrium as qim and Qm.
Departing from Chipty and Snyder (1999) we do not consider the possibility of a full merger
of buyer companies which would lead to a new buyer surplus function for the joint entity
which may be quite different from the sum of the two initial surplus functions. Instead we
consider only the idea of consolidating orders, i.e. joint bargaining, and assume that coor-
dination and sharing of rents between the two buyers is seamless, i.e. that there is no sec-
ond-round game where the agreement to operate jointly could break down ex post. Joint
bargaining leads to a joint tariff for the buyers, and therefore to a joint unit price which may
be different from either or both prices achieved when bargaining separately. In addition, the
joint quantity may differ from the sum of the quantities that result from separate bargaining.
The net surplus of buyers 1 and 2 in the separated equilibrium is shown in (7), while their
net surplus in the “merged” equilibrium is shown in (8).
�
� v��q�
� � + V�Q�� − V�Q� − q�� �� +
�
� v��q�
� � + V�Q�� − V�Q� − q�� �� (7)
�
� v��q�
�� + v��q��� + V�Q�� − V�Q� − q�
� − q���� (8)
The consolidation is favourable for the buyers if the quantity shown in (8) is greater than
the quantity shown in (7) and if that is the case it is assumed that the buyers recognise this
and join forces. As in Chipty and Snyder (1999), re-arranging terms from (8) > (7), and
adding on each side of the inequality sign the net supplier surplus from the separated equi-
librium when there is trade with neither buyer 1 nor with buyer 2, leads to the condition
shown in (9).
v��q�
�� + v��q��� + V�Q�� − V�Q� − q�
� − q��� + V�Q� − q�
� − q�� � >
v��q�� � + v��q�
� � + 2V�Q�� − V�Q� − q�� � − V�Q� − q�
� � + V�Q� − q�� − q�
� � (9)

48
The additional term on each side of the inequality sign helps to construct a breakdown of
components that each have a clear economic interpretation. Chipty and Snyder (1999)
define them as follows: downstream efficiency DE (efficiency gains for the buyers from the
fact of merging); upstream efficiency UE (indirect effect on the surplus of the supplier due
to possible changes in total quantity sold); and what the authors refer to as ‘bargaining
position’. We prefer to refer to that last component as ‘incremental separated bargaining
power’ and label it as ISBP. The three terms are shown in (10), (11) and (12).
DE = v��q��� + v��q�
��� − v��q�� � + v��q�
� ��(10)
UE = V�Q�� − V�Q� − q�
� − q���� − V�Q�� − V�Q� − q�
� − q�� �� (11)
ISBP = V�Q� − q�
� � − V�Q� − q�� − q�
� �� − V�Q�� − V�Q� − q�� �� (12)
The condition that (8) > (7), i.e. that it is profitable for buyers 1 and 2 to consolidate, is
equivalent to the condition that DE + UE + ISBP > 0.
The term ISBP represents the incremental gross surplus effect for the supplier in the sepa-
rated equilibrium. In particular, it is the incremental gross surplus from buyer 1 when buyer
2 is out, minus the incremental gross surplus of buyer 1 when buyer 2 is in. Chipty and
Snyder (1999) develop a detailed analysis of this term. For the purposes of this paper, the
first goal is to understand the effect on prices of the consolidation of 2 (or more) buyers.
The second goal is not to consider whether buyers should merge, but only whether they
should make their purchases (and relevant bargaining) jointly or separately. The second
question remains as stated, namely that the sum over (10) to (12) should be greater than
zero. As specified, the buyers do not merge so there is no new surplus function which
could result for instance from synergy effects between the buyers. Joint buyer surplus is
thus simply the sum of the surplus functions of the two buyers. An open question is how, in
the event of joint bargaining, the two buyers would agree to split the proceeds. Here we
assume that the sharing of rents operates through the fact of having a single price. In other
words we will assume that the price applicable to both buyers is the jointly achieved tariff
divided by the jointly purchased quantity. This brings us to the issue of the equilibrium price
that is achieved in this manner. As shown in Chipty and Snyder (1999), the total tariff is
lower in the ‘merged’ equilibrium provided that - DE + UE + ISBP > 0. The role of the DE
term is the key as compared to the profitability condition. As we assume that the buyers do
not merge, DE can only play a role if the equilibrium quantities are different between the
two equilibria. If price changes occur this may be the case, unless we assume that the
buyers do not pass through any of the price decrease (or increase) onto their customers.
This would be a strong assumption. EU gas companies should be assumed to be profit-
maximising, so that changes in the price of their main material input, imported natural gas,
49
should change the optimised supply curve they present on their downstream markets. We
briefly consider each case.
Fixed quantities
Assuming that the quantities for each buyer are identical in both equilibria, DE = 0 and the
profitability and lower total tariff conditions are identical, namely that the two buyers agree
to bargain jointly if UE + ISBP > 0. There is however an additional consequence. As the
quantities for buyers 1 and 2 are the same, and if we do not consider the possibilities of
market exit or outside option, the bargaining process is identical for all the other buyer-
supplier pairings since they are bargaining over the same remaining quantity with the sup-
plier. As a result, the total quantity supplied is also the same between the two equilibria.
Labelling the equilibrium quantities simply as q1, q2 and Q, the condition reduces to ISBP >
0 as shown in (13). The upstream efficiency term UE is therefore also zero.
UE + ISBP = ISBP = V�Q − q�� − V�Q − q� − q��� − V�Q� − V�Q − q��� > 0 (13)
This case ties in with the focus of Chipty and Snyder (1999) on the properties of the ISBP
term. It is not particularly useful to repeat the full analysis here. The conclusion in the cur-
rent context is that, under the assumption of fixed quantities, consolidated buying is profit-
able depending only on the curvature of the supplier’s gross surplus function and the quan-
tities involved. In the simplest cases, if V(.) is globally concave, i.e. if V’’(x) is negative for all
x>0, then the first term in (13) is always larger than the second term and ISBP > 0. If V(.) is
globally convex then ISBP < 0. One important point is that V(.) may not have such strongly
regular properties. If the curvature is reversed for higher or lower quantities, e.g. if V(.) is S-
shaped, then the results will depend on the specific quantity levels. Furthermore, the prop-
erties of V(.) will in turn determine consolidation (or merger) decisions, leading to specific
firm-size (or coalition-size) distributions. Chipty and Snyder (1999) develop some thoughts
in that direction in an appendix to their article.
For the case of EU gas imports from Russia, the empirical question is therefore the shape
and properties of the gross surplus function V(Q). We provide an illustration using Gaz-
prom data as published on the company web-site. Ideally, corporate cost functions should
be estimated using a combination of bottom-up modelling and top-down validation. For this
illustration we use only a rough top-down approach based on yearly corporate data from
the company’s web-site covering the period 2003-2008. The gross surplus function is
taken as profits (EBIT) minus total revenue, where total revenue is assumed to be equal to
the proceeds from gas sales. In this way, the net surplus is, as in the model, equal to V(Q)
plus the sum of the ‘tariffs’ (total price charged for each bundle delivered to customers).
Also, and this is an important working assumption, the revenue and EBIT series are con-
verted into US Dollars and then deflated using the average annual oil price, the latter taken
as the arithmetic average of the Brent and Urals oil prices. The deflation is carried out in
order to side-step the problem that Gazprom’s export prices (to EU countries) are set ac-

50
cording to pricing clauses that track the price of selected petroleum products. Given the
evolution of the oil price over 2003-2008, revenues and profits at current prices rose very
strongly.
The observed observation pairs, and a simulated quadratic function based on an OLS re-
gression on a total of 6 data points, are shown in Figure 3. A linear variant as well as a
variant with Q and Q to the power of 1.5 were also attempted but yielded a lower R-
squared. The horizontal axis refers to delivered volumes of gas in billions of cubic metres.
The vertical axis refers to values in millions of US dollars, deflated by the oil price with 2003
as the reference period. The gross surplus function thus estimated is V(Q) = -1540840 +
5300Q – 4.612Q2 with Q in billions of cubic metres per year and V(.) in millions of US Dol-
lars, assuming the 2003 average oil price. The gross surplus function is negative for all Q
and globally concave. One should note that this is not the profit function, but essentially
profits minus payments for sold gas. Of course the results are not particularly robust given
the small number of data points and the lack of a corroborating bottom-up approach. How-
ever the illustration suggests that Gazprom’s cost function could be locally concave in a
range of production quantity of around 560 – 610 bcm per year. If this is the case, then the
ISBP term from the model would be positive, and consolidating buying would be favourable
for EU buyers of Russian gas. A more refined analysis of the possible shape and proper-
ties of V(Q) for the case of Gazprom would merit further research.
Figure 3
Simulation of Gazprom’s gross surplus function V(Q)
-30000
-25000
-20000
-15000
-10000
530 550 570 590 610 630
observed
simulated

51
Changeable quantities
We now assume that the quantities may differ. This could be explained by downstream
market conditions, so that the gross surplus functions of the buyers depend not only on the
quantities, but also on the tariffs obtained. A full treatment of this modification would require
a re-specification of the model, with the insertion of a richer formulation for the gross sur-
plus functions. In this section we simplify the approach on the basis that the buyers con-
tinue, as in the original model, to maximise their total profit, so the core properties of the
bargaining equilibria should be safeguarded. Three cases may be considered. The first is a
voluntary equilibrium between buyers which allows for buyer consolidation if this is profit-
able, although the price effect may be positive or negative. The second is a forced equilib-
rium, imposed by public authorities in order to try to secure lower downstream prices for
consumers and (since we are analysing natural gas imports) a lower energy import bill.
This option would be activated by government(s) and/or EU institutions if there is a scope
for import price reductions. The third case is a compromise, allowing voluntary buyer con-
solidation, but only if it leads to lower prices. The conditions for the respective cases are as
follows: Voluntary consolidation: if DE + UE + ISBP > 0; Forced consolidation: if - DE + UE
+ ISBP > 0; Compromise: if DE + UE + ISBP > 0 and - DE + UE + ISBP > 0.
For the buyers, we assume that these are the EU Member States rather than individual
companies. The typical EU gas company imports and distributes gas on its home market
facing relatively weak competition. Stripping out the oil price effect, the rest of the cost
structure is assumed to be locally quadratic and strongly convex in the short-run. This may
be justified on the basis of the fixed nature of the infrastructure, implying a local cost-
minimising optimum which corresponds to the optimal flow rate through the available gas
infrastructure. Conversely the gross surplus function is assumed to be locally quadratic and
strongly concave. For simplicity we will assume a globally quadratic and concave gross
surplus function for the buyers. An illustrative calibration is attempted using Eurostat’s
Structural Business Statistics (SBS)19 in combination with gas import data from the IEA
(volumes) and from Eurostat (values). Unfortunately the data situation is not favourable
due to confidentiality restrictions, so that there are few countries for which the full set of
variables can be obtained for more than one or two time periods. A holistic approach was
therefore adopted, based on the case of Hungary. Only four observations were available
which moreover do not strongly suggest a concave quadratic function. However the func-
tion was fitted anyway, choosing three of the four observations and computing the exact
curve that passes through them. The results should therefore be interpreted only as an
illustration, not as a fully-fledged calibration.
A further justification for imposing a strongly concave surplus function (for the short-run) is
to assume a dominant national gas company with limited access to alternative markets.
The company would face steep losses if it over-contracts supplies as compared to down-
19 Data for the sector: Distribution and trade of gaseous fuels through mains, NACE (rev. 1.1) code 4022.

52
stream demand even by small amounts. Large losses on the increasing portion of the sur-
plus function would be related to the negative impacts of a gas supply shortage.
Figure 4
Illustration of a possible gross surplus function f or a gas buyer
4. Numerical simulations The stylised gross surplus functions described earlier were used to generate a simplified
numerical simulation of the possible effect of buyer coordination. The gross surplus func-
tion for Gazprom was taken as found. For the buyers it was assumed that there are 62
similarly-sized buyers with gross supply functions based on randomised parameters in a
range close to those found for the buyer function. Buyer coordination was simulated as
follows. First, the separated equilibrium was simulated and the results stored. Second, for
each successive non-overlapping pair of buyers, the optimisation was run again with the
constraint that the price per unit obtained by the two coordinating buyers is equalised.
For each pair there is always one winner and one loser in terms of the change in the price
per unit compared to the separated equilibrium. However, in every case simulated, the new
price is lower than the average unit price from the separated equilibrium. From the point of
view of prices, therefore, forming an alliance is always favourable under the assumptions
used. However in none of the simulated cases does an increase in the joint net surplus of
the pair of buyers occur. Finally, in a majority of cases (26 out of 31), both buyers experi-
ence a loss in net surplus. These results suggest that the gains from consolidating pur-
chases, with the assumptions used, are limited. Average prices can be reduced, but there
0
500
1000
1500
2000
2500
0.0 2.0 4.0 6.0 8.0 10.0 12.0 14.0
vq
vqsim

53
is always a loser in the alliance. And the typically negative changes in net surplus suggest
that buyers will not have a private incentive to form alliances. The assumptions are how-
ever important. It was notably assumed that the supplier is in a monopoly position with
respect to all the buyers (no outside option for any buyer) and, implicitly, that each buyer is
a monopoly distributor on its own home market. This also means that exit (and indeed en-
try) is impossible.
A second round of simulations was therefore carried out to account for the possibility of
outside options for at least some of the buyers. This is in keeping with the current situation
of EU gas importers. Some have access to more than one supplier, others do not. The
simulation was therefore re-done, adding a constraint on one of the buyers that the pur-
chased volume must be below a fixed level, itself strictly smaller than the (monopoly) equi-
librium. Unsurprisingly the price falls, regardless of which buyer is chosen. The change in
net surplus depends on the characteristics of the outside option and was not simulated.
The more interesting case is now to combine outside option with buyer coalition by forming
a coalition between a buyer that has an outside option and one that does not. An example
from the simulations is summarised in Table 2.
Table 2
Simulation results: effect of outside option and bu yer alliance
Case
B1 Net
Surplus
B2 Net
Surplus
B1
Price
B2
Price
B1
Volume
B2
Volume
S Net
Surplus
Monopoly equilibrium 368 393 187.1 189.5 9.62 9.64 89321
B1 outside option n.c. 408 180.7 187.9 9.00 9.65 88331
Outside option and alliance n.c. 369 182.1 182.1 9.00 10.19 89090
Alliance w/o outside option 360 388 187.8 187.8 9.58 9.91 89632
Two buyers are considered, B1 and B2, as well as the supplier S. The first case is the mo-
nopoly equilibrium, or separated equilibrium. Values are in millions of US dollars (assuming
the 2003 oil price), prices in US dollars per thousand cubic metre, and volumes in billions
of cubic metres. The second row shows what happens when buyer 1 is given (or forced to
take) an outside option. This is affected by imposing a maximum purchase of 9 bcm, below
the equilibrium volume of 9.62 bcm. In that case, the surplus of the supplier falls and the
price falls for buyer 1 from 187.1 to 180.7. Note also that the surplus of buyer 2 rises and
that his price falls: there has been a reduction in the competition for the same source of
supply. The third row shows the effect of imposing an alliance between buyer 1 and buyer
2 when buyer 1 is exercising a (partial) outside option. The joint price obtained by the alli-
ance is 182.1, higher for buyer 1, lower for buyer 2, as compared to the situation without
the alliance. Also, the net surplus of buyer 2 falls – but the purchased volume rises. On the
54
other hand the surplus of the supplier rises. This suggests that an alliance of buyers can be
profitable to the supplier under certain conditions. Going beyond the model, the fall in the
price for buyer 2 combined with the increase in volume is potentially profitable for the final
customers of buyer 2 depending on downstream market conditions and regulation.
The final case illustrates the effects of the alliance between the same buyers when there is
no outside option. In this particular case net surplus falls for both buyers while it rises for
the supplier. The joint price the buyers secure is in between the initial prices (slightly lower
than the monopoly average price), implying that final customers could gain in one country
but lose in the other.
Taken together these results highlight some potential conclusions. First, the exercise of a
partial outside option may be beneficial for the isolated buyers who remain and detrimental
to the supplier. Such a partial option may be due to a government-imposed diversification
policy, or to a voluntary commercial diversification, itself due to price considerations and/or
to a rational risk diversification strategy. Second, buyer alliances do not necessarily lead to
a higher surplus for either buyer, but can lead to a higher surplus for the supplier. The op-
posite outcome may also occur as shown in Chipty and Snyder (1999) but this was not
apparent from the simulations made here. Last but not least, combining the imposition of
an outside option with a buyer alliance can lead to lower prices for both buyers and to a
loss of surplus for the supplier, though not necessarily to higher surpluses for either buyer.
Moreover if one assumes that a buyer already exercises an outside option and is then
forced to form an alliance with a second buyer who does not have such an option, then the
price for the first buyer may rise while the price for the second buyer may fall and the sur-
plus of both buyers may fall. Lower prices, in turn, may or may not lead to welfare gains for
final customers downstream.
There are several relevant policy implications from these results. The first implication is that
supplier diversification, even over a small share of supplies, can contribute very favourably
to bargaining outcomes in terms of price. If downstream market conditions allow, then
gains in consumer welfare seem possible as well. The second implication is that, if the
buyers are entirely dependent on the same supplier, buyer alliances based on the principle
of a single price (as opposed, e.g., to corporate mergers) may typically lead only to a mod-
erate fall in the average price, with some of the buyers facing higher prices than without the
alliance. On the other hand, buyer alliances may bring interesting results if a buyer with a
single source of supplies joins forces with a buyer who has more than one source of sup-
plies. In a sense, the advantages of diversification can be transmitted through alliances of
buyers, thus helping to overcome the effects of monopoly power in isolated markets.
5. Two questions for further research In Chipty and Snyder (1999), merged buyers increase their ‘bargaining position’ if the sur-
plus function of the supplier is concave. This is interpreted as the ability to obtain lower
prices in Normann et al. (2007), in which a partial empirical validation of the model based
on experimental data yields good results. While we take issue with the jump from the no-

55
tion of ‘bargaining position’ (as defined in Chipty and Snyder, 1999), to the actual ability to
obtain lower prices, it is however clear that the shape of the cost function of the supplier
plays an important role. Caldas Cabrera (2009) analyses the case for consolidating EU
buyers of Russian gas on the basis of the possible shape of Gazprom’s cost function. This
approach has major drawbacks as several key assumptions that underpin it are not met in
practice. However the approach does deliver one particularly fascinating insight. Leaving
aside Gazprom’s horizontal diversification (e.g. media ownership), and focusing only on the
costs of gas production, the (remaining) cost function is the sum of the cost functions for
each individual gas field. The insight is that if Gazprom were producing only from its large
traditional fields, then its cost function would exhibit decreasing marginal costs, i.e. a con-
cave cost function. However the cost function should shift upwards as easier fields are
depleted (Western Siberia) and production shifts to new and more challenging fields off-
shore and in the Arctic region (Shtokman and the Yamal Peninsula). Caldas Cabrera
(2009) concludes that the decision to consolidate EU buyers depends on ‘where one
stands’ on Gazprom’s cost curve. Of course, doing so with any accuracy is impossible
without access to sensitive corporate data which is subject not only to commercial confi-
dentiality but also to state secrecy. However one idea for further research would be to ex-
plore plausible shapes and properties of this type of cost function. In that context, the goal
would be to describe the properties of a cost function that is the sum over a distribution of
natural gas fields. The gas fields are at different stages of maturity and each present differ-
ent challenges and cost profiles over time. The evolution of the total cost function over time
would be an interesting research question, and one could explore how different scenarios
concerning the phasing in of production at new fields affects the cost function.
On a different level, the case of the Baltic States raises an interesting challenge to the
model of Chipty and Snyder (1999). In the model the authors assume, implicitly, that the
surplus functions of the buyers are independent from the surplus function of the seller.
However Gazprom is a significant shareholder in the dominant Lithuanian gas company,
Lietuvos Dujos, and in the Latvian monopolist gas company, Latvijas Gaze. Both compa-
nies are 34% owned by Gazprom . This implies that roughly a third of the profits in both
cases accrue to the company that is their monopoly provider. A different specification of
the model, allowing the simulation of cases where part of the surplus may flow back to the
supplier, could hold interesting clues for the (currently shelved) idea of the European
Commission back in September 2007 to introduce a ‘Gazprom clause’ into EU gas market
legislation. Conversely, the case of E.ON Ruhrgas poses two further questions. It was (un-
til recently) a minority shareholder of Gazprom, so part of the surplus can flow back to a
buyer. It is also a minority shareholder in the Baltic gas companies mentioned, so there
can be (additional) surplus flows between buyers. In addition the supplier and one buyer
may collude in modifying the bargaining stance of a third buyer.

56
6. Prospects and political support The recently adopted Communication of the Commission on the EU’s “Energy2020” strat-
egy, European Commission (2010d), is not very specific about the exact type of policy in-
strument that may be created, but the document makes clear that measures will be pro-
posed, see Box 1. The usual steps should therefore follow, namely a Commission proposal
for a regulation or a directive, to be submitted to the European Parliament and then to the
European Council for approval.
Box 1
Selected extracts from the European Commission’s En ergy2020 strategy
New patterns of supply and demand in global energy markets and increasing competition for energy resources make it essential for the EU to be able to throw its combined market weight effectively in relations with key third-country energy partners. (…)
The EU must now formalise the principle whereby Member States act in the benefit of the EU as a whole in bilateral energy relations with key partners and in global discussions. (…)
Mechanisms will be proposed by the Commission to align existing international agreements (notably in the gas sector) with the internal market rules and to strengthen cooperation between Member States for the conclusion of new ones. (…)
Supply issues, including network development and possibly grouped supply arrangements as well as regulatory aspects, notably concerning the freedom of transit and investment security, would be covered. (…)
Source: European Commission (2010d), pp. 17-19.
The EU’s Energy Commissioner, Günther Oettinger, had for his part also hinted at the
forthcoming measures, e.g. when stating in January 2010 that “in future, energy supply
contracts signed by individual member states with third countries would be replaced by
European treaties”, see Euractiv (2010). The statement implies that an EU-wide approach
would be mandatory, although the notions of ‘single price’ or ‘single buyer’ are not explicitly
mentioned. Andoura et al. (2010) on the other hand were more specific, explicitly mention-
ing both the idea of gas purchasing consortia (presumably on a voluntary basis) and the
idea of a gas purchasing agency. It is the latter analysis – which focuses more on the
question of the legality of the proposal in light of EU competition law – which underpinned
Jacques Delors’ intervention with Jerzy Buzek at the European Parliament.
At the Member State level, support for the notion of a gas purchasing agency is particularly
visible in Lithuania, with Parliamentary (Seimas) Speaker Irena Degutiene making a num-
ber of supportive interventions on the topic. As mentioned earlier the Lithuanian govern-

57
ment discovered that the country paid substantially more for Russian gas imports than
Germany, a discrepancy which seems hard to justify save through an analysis of relative
bargaining power and of outside options. The views of most other Member States are less
often or less openly discussed. This is bound to change when the Commission publishes
its proposals.
7. Conclusions Elements of reflection on the potential effects of consolidating the negotiating power of EU
gas companies and Member States were developed, using the model of Chipty and Sny-
der (1999) as the basis for a theoretical discussion as well as for numerical illustrations.
The latter were made based on very stylised surplus functions in order to represent Gaz-
prom on the one hand and fragmented EU gas importers on the other. Simulations were
carried out in order to determine the effect of forcing pairs of buyers to ask for and apply a
single (common) import price. The net surplus of the gas importing companies may rise or
fall depending on the shape and properties of the surplus functions of the buyers and of the
supplier. Moreover the net surplus of the supplier does not necessary fall. In terms of price
effects, buyer alliances alone do not necessarily lead to a fall in price for all allied buyers,
but they do bring a fall in the average price. Moreover, buyer alliances in combination with
diversification of supply sources can lead to a fall in price for all alliance members. The
positive effect of diversification experienced by one buyer can be de facto shared with buy-
ers with no diversification through the introduction of a buyer alliance. However it may be
the case that the buyer who diversifies would be better off outside the alliance.
A key question concerns the exact role of public policy in terms of coordinating (and com-
pensating) the interests of the various actors. If, as the simulations shown have suggested,
there are cases where a buyer alliance could be profitable for consumers in an isolated
market due to lower prices but cause a loss of surplus for one of the buyers (or even all of
them), then policy intervention would be required. It would not be sufficient to merely
authorise alliances of buyers as they would not arise spontaneously. Instead it would be
necessary to mandate buyer consolidation – for the benefit of consumers – and perhaps
also to affect a partial compensation of the foregone profits for participating companies and
their respective governments. The other important conclusion from the simulations is the
critical role of diversification of supply sources, and the fact that part of the advantages of
diversification can be, in effect, transmitted from a diversified market onto an isolated mar-
ket through an alliance of buyers. One conclusion is that legislation on a possible EU gas
purchasing agency (and/or gas purchasing groups or consortia) should take into account
the existing degree of diversification, and possibly encourage further diversification in spe-
cific cases, in coordination with rules for the creation of buyer alliances.

58
References
Andoura, Sami, Leigh Hancher and Marc Van der Woude (2010). “Towards a European Energy Commu-nity: A Policy Proposal”. Notre Europe. March 2010. Aslund, Anders (2009). Will the Real Gazprom CEO Please Stand Up. Op-Ed in the Moscow Times, 28 January 2009. Auverlot, Dominique, Hervé Pouliquen and Christian Stoffaës (2010). “La sécurité gazière de l’Europe: De la dépendance à l’interdépendance”. Centre d’Analyse Stratégique. March 2010. Barysch, Katinka (2010). Shale gas and EU energy security. Blog article. Centre for European Reform, 11 June 2010. Available at: http://centreforeuropeanreform.blogspot.com/2010/06/shale-gas-and-eu-energy-security.html Blanchard, Olivier J., Mitali Das and Hamid Faruqee (2010). “The Initial Impact of the Crisis on Emerging Market Countries.” Brookings Papers on Economic Activity, Spring 2010: 263-307. Bloomberg (2009). Bulgaria Rations Gas as Ex-Ally Russia Cuts Supply (Update1). Bloomberg, 9 January 2009. Available at: http://www.bloomberg.com/apps/news?pid=newsarchive&sid=auVGAyT2ZcGk Caldas Cabrera, Melina (2009). “Buyer Power In The European Gas Market.” Revista de la Competencia y la Propiedad Intelectual Nº 8. Caporaso, James A. (1978). “Dependence, Dependency, and Power in the Global System: A Structural and Behavioral Analysis.” International Organization 32 (1): 13-43. Chipty, Tasneem and Christopher M. Snyder (1999). “The Role Of Firm Size In Bilateral Bargaining: A Study Of The Cable Television Industry.” The Review of Economics and Statistics 81(2): 326–340. Christie, Edward H. (2008a). “European Energy Security after the 2008 South Ossetia War”. Presentation. NATO-EAPC Seminar: ‘Energy security through development of cooperation’. Yerevan, 2-3 October 2008. Christie, Edward H. (2008b). “EU-Russia Energy Relations: Russian strategies and ideas for EU re-sponses”. Presentation. Conference of the 20th Anniversary of the PanEuropean Institute at the Turku School of Economics: ‘Energy challenges in Northern Europe’. Turku, 27-28 November 2008. Christie, Edward H. (2009). “Energy vulnerability and EU-Russia energy relations.” Journal of Contempo-rary European Research 5 (2): 274-292. Christie, Edward H. (2010). “Security of supply: some theoretical building blocks.” Paper presented at the 11th IAEE European Conference, August 25-28, 2010, Vilnius. De Jong, Jacques, Jean-Michel Glachant, Manfred Hafner and Robert Grant (ed) (2010). “A smart EU energy policy – final report”. CIEP, LdP-EUI, FEEM and Wilton Park. April 2010. Demydenko, Myroslav (2008). “Ukraine, Vanco Energy, and the Russian Mob.” Eurasia Daily Monitor Volume: 5 Issue: 177. DG Energy (2010). “EU Energy Trends to 2030 – Update 2009.” European Commission, Directorate-General for Energy: Brussels. Dyen (2010). Ukraina pyeryed viborom – Evropyeyskoye zakonodatyel'stvo nye pozvolit otdat' GTS «Gaz-promu». (Ukraine faces a choice – European legislation does not allow giving the GTS to Gazprom). Available at: http://www.day.kiev.ua/301225 Egging, Ruud, Franziska Holz, Christian von Hirschhausen and Steven A. Gabriel (2009). “Representing GASPEC with the World Gas Model.” The Energy Journal 30 (Special Issue): 97-118. Euractiv (2009). Regulator: Renewed gas crisis 'likely'. Euractiv, 21 October 2009. Available at: http://www.euractiv.com/en/energy/regulator-renewed-gas-crisis/article-186570

59
Euractiv (2010). Oettinger defends European vision on energy. Euractiv, 15 January 2010. Available at: http://www.euractiv.com/en/priorities/oettinger-defends-european-vision-energy/article-188911 European Commission (2008). An EU Energy Security and Solidarity Action Plan. Communication from the Commission. COM(2008) 781 final. European Commission: Brussels. European Commission (2010a). Energy infrastructure priorities for 2020 and beyond - A Blueprint for an integrated European energy network. Communication from the Commission. COM(2010) 677 final. Euro-pean Commission: Brussels. European Commission (2010b). Energy infrastructure priorities for 2020 and beyond - A Blueprint for an integrated European energy network. Impact Assessment. SEC(2010) 1395 final. European Commission: Brussels. European Commission (2010c). Report from the Commission to the Council and the European Parliament on the implementation of the European Energy Programme for Recovery. COM(2010)191 final. European Commission: Brussels. European Commission (2010d). Energy 2020. A strategy for competitive, sustainable and secure energy. Communication from the Commission. COM(2010) 639 final. European Commission: Brussels. European Parliament (2010). Full text of the Buzek and Delors Declaration on the creation of a European Energy Community. Press Release, 5 May 2010. European Union (2010). Regulation (EU) No 994/2010 of the European Parliament and of the Council of 20 October 2010 concerning measures to safeguard security of gas supply and repealing Council Directive 2004/67/EC. Financial Times (2011). EU warns Ukraine over democratic ‘values’. Financial Times, 11 January 2011. Fredholm, Michael (2008). “Natural Gas Trade Between Russia, Turkmenistan and Ukraine – Agreements and Disputes.” Asian Cultures and Modernity, Research Report No. 15, University of Stockholm. Fumagalli, Chiara and Massimo Motta (2008). “Buyers’ Miscoordination, Entry And Downstream Competi-tion.” The Economic Journal 118 (August): 1196–1222. Group of Eight (2009). Responsible Leadership For A Sustainable Future. Declaration of the Leaders of the Group of Eight, L’Aquila G8 Summit, 8 July 2009. Gazprom (2008). New Initiatives of the European Union and Export of Russian Gas – Gazprom’s Vision. Presentation by Alexander Medvedev, Gazprom Deputy Management Committee Chairman, VI Interna-tional Forum “Russian Gas – 2008”, Moscow. Gnansounou, Edgar (2008). “Assessing the energy vulnerability: Case of industrialised countries.” Energy Policy 36 (10): 3734-3744. Gupta, Eshita (2008). “Oil vulnerability index of oil-importing countries.” Energy Policy 36 (3): 1195-1211. Greene, David L. (2010). “Measuring energy security: Can the United States achieve oil independence?” Energy Policy 38 (4): 1614-1621. Hamilton, James D. (2009). “Causes and Consequences of the Oil Shock of 2007-08.” Brookings Papers on Economic Activity, Spring 2009: 215-259. Holz, Franziska, Christian von Hirschhausen and Claudia Kemfert (2008). “A Strategic Model of European Gas Supply (GASMOD).” Energy Economics 30 (3): 766-788 IEA (2009a). World Energy Outlook 2009. Paris: OECD/IEA. IEA (2009b). Energy Security & Climate Change Mitigation: What role for fossil fuels? Presentation given by Nobuo Tanaka, Executive Director, International Energy Agency, 11 May 2009, Cracow. IEA (2010). World Energy Outlook 2010. Paris: OECD/IEA.

60
Ikonnikova, Svetlana and Gijsbert T.J. Zwart (2010). “Reinforcing buyer power: Trade quotas and supply diversification in the EU natural gas market.” TILEC Discussion Paper 2010-018, Tilburg University. Jansen, Jaap C. and Ad J. Seebregts (2010). “Long-term energy services security: What is it and how can it be measured and valued?” Energy Policy 38 (4): 1654-1664. Keppel, Catherine and Julia Woerz (2010). “The Impact of the Global Recession in Europe - The Role of International Trade.” Paper prepared for the SUERF/BWG Conference and Special OeNB East Jour Fixe “Contagion and Spillovers – New Insights from the Crisis”, 12 February 2010. Kovacevic, Aleksandar (2009). “The Impact of the Russia–Ukraine Gas Crisis in South Eastern Europe.” NG 29, Oxford Institute for Energy Studies. Kyiv Post (2010). Ukraine, Vanco Ltd. agree to postpone Stockholm arbitration for another 3 months. Kyiv Post, 13 December 2010. Available at: http://www.kyivpost.com/news/nation/detail/92699/ Kyiv Post (2011a). Court: Ruling on Bandera legal. Kyiv Post, 12 January 2011. Available at: http://www.kyivpost.com/news/nation/detail/94611/ Kyiv Post (2011b). Update: Stepan Bandera is no longer a Hero of Ukraine. Kyiv Post, 12 January 2011. Available at: http://www.kyivpost.com/news/nation/detail/94584/ Lapuerta, Carlos (2007). Gas storage regulation and security of supply. Presentation. EPRG Spring semi-nar, May 2007, Cambridge. Moscow Times (2010). Ukraine Plans LNG Terminal to Diversify. Moscow Times, 3 November 2010. Available at: http://www.themoscowtimes.com/business/article/ukraine-plans-lng-terminal-to-diversify/421752.html New York Times (2010). Ukraine Leader Pushes Triangular Partnership. New York Times, 2 November 2010. Available at: http://www.nytimes.com/2010/11/23/world/europe/23iht-ukraine.html?_r=1 New York Times (2011). ‘Hero of Ukraine’ Prize to Wartime Partisan Leader Is Revoked. New York Times, 12 January 2011. Available at: http://www.nytimes.com/2011/01/13/world/europe/13ukraine.html?_r=1 Normann Hans-Theo, Bradley J. Ruffle and Christopher M. Snyder (2007). “Do Buyer-Size Discounts Depend on the Curvature of the Surplus Function? Experimental Tests of Bargaining Models.” The RAND Journal of Economics 38(3): 747-767. Pifer, Steven (2010). “Ukraine: Finding a balance?” Brookings comment, 4 October 2010. Reuters (2009a). Croatia secures more emergency gas supply -INA. Reuters, 16 January 2009. Available at: http://uk.reuters.com/article/idUKLG32409920090116 Reuters (2009b). UPDATE 2-Bulgaria to join ITGI pipeline to import Azeri gas. Reuters, 14 July 2009. Available at: http://www.reuters.com/article/idUSLE41826820090714?pageNumber=1 Reuters (2010). Yanukovich says ready for Russian fleet, gas deals. Reuters, 13 February 2010. Available at: http://www.reuters.com/article/idUSLDE61C01V20100213?type=marketsNews RIA Novosti (2005). Gazprom to buy 30 bln cu m of gas from Turkmenistan in 2006. RIA Novosti, 29 De-cember 2005. Available at: http://en.rian.ru/russia/20051229/42778226.html RIA Novosti (2009). Bulgarian president to talk gas compensation during Russia visit. RIA Novosti, 2 Feb-ruary 2009. Available at:

61
http://en.rian.ru/world/20090202/119926901.html Sherr, James (2010). “The mortgaging of Ukraine’s independence.” Briefing paper, Royal Institute for In-ternational Affairs (Chatham House). Silve, Florent and Pierre Noel (2010). “Cost Curves for Gas Supply Security: The Case of Bulgaria”. EPRG Working Paper 1031. Electricity Policy Research Group, University of Cambridge. Simitchiev, Rosen (2010). Bulgaria as a corridor of natural gas to Europe. Presentation at the Conference: Hellenic-Bulgarian Cooperation in the Energy Sector, Sofia, 29 April 2010. Snyder, Christopher (2005). “Countervailing power.” Manuscript prepared for the New Palgrave Dictionary. Socor, Vladimir (2010). “Hungary-Romania Gas Interconnector: First Step Towards Region-Wide Net-work.” Eurasia Daily Monitor Volume: 7 Issue: 186. Stern, Jonathan (2006). “The Russian-Ukrainian gas crisis of January 2006.” Oxford Institute for Energy Studies. The Scotsman (2009). Melrose extends Bulgarian gas production as Russia row bites. The Scotsman, 9 January 2009. Available at: http://thescotsman.scotsman.com/business/Melrose-extends-Bulgarian-gas-production.4859163.jp Tsakiris, Theodoros (2010a). “Size Does not Always Matter: Small Capacity Pipelines Serve Regional Gas Needs in Southeast Europe Better than Mega-Projects.” Online Analysis. EKEM European Energy Policy Observatory, 13 September 2010. Tsakiris, Theodoros (2010b). “Balkan gas interconnectors progress as Borissov grows wary of Nabucco.” Online Analysis. EKEM European Energy Policy Observatory, 11 December 2010. Tzvetkova, Marina (2009). “Gas Crisis Foreshadows Worse 2009.” AmCham Magazine Bulgaria, Issue 96, February 2009. Ukrinform Photo (2011). Extraordinary session of Lviv Regional Council takes place near Stepan Bandera Monument. Ukrinform, 13 January 2011. Available at: http://photo.ukrinform.ua/eng/current/photo.php?id=367943 Umbach, Frank (2010). “Global energy security and the implications for the EU.” Energy Policy 38 (3): 1229-1240. Valasek, Tomas (2010). “Ukraine turns away from democracy and the EU.” Briefing paper, Centre for European Reform (CER). Yeremenko, Alla (2008). The Bearers of the Black Sea Shelf. Zerkalo Nedeli, 17-23 May 2008. Available at: http://www.mw.ua/1000/1550/62947/