vtt science 168 - characterisation of lignocellulose ... · gqdjq, lnrrfq lgh puriv wfxgrusq...
TRANSCRIPT

-otl
aA
DD
0
32
/ 7
102
TT
VE
CN
EIC
S
861
+iddhh
a*GMFTSH
9 NBSI 8-3377-06-259-879 )detnirp( NBSI 5-4377-06-259-879 )fdp(
L-NSSI 4394-9971 NSSI 4394-9971 )detnirp( NSSI 2494-9971 )fdp(
3-5958-83-159-879 )detnirp( 6-4958-83-159-879 )fdp(
X911-2422X911-2422 )detnirp( 3021-2422 )fdp(
ytisrevinU otlaA
gnireenignE lacimehC fo loohcS smetsysoiB dna stcudorpoiB fo tnemtrapeD
if.otlaa.www
+ SSENISUB YMONOCE
+ TRA
+ NGISED ERUTCETIHCRA
+ ECNEICS
YGOLONHCET
REVOSSORC
LAROTCOD SNOITATRESSID
oha
-arh
O an
iaT
ssa
m yh
parg
ota
morh
c sa
g si
sylo
ryp l
acit
ylan
a yb
stn
enop
moc
esol
ullec
ongil
fo
noit
asir
etca
rah
C
yrt
emo
rtce
ps y
tisr
evi
nU
otla
A
7102
smetsysoiB dna stcudorpoiB fo tnemtrapeD
fo noitasiretcarahC stnenopmoc esolullecongil
sag sisyloryp lacitylana yb ssam yhpargotamorhc
yrtemortceps
oha-arhO aniaT
LAROTCOD SNOITATRESSID

seires noitacilbup ytisrevinU otlaASNOITATRESSID LAROTCOD 032 / 7102
TTV ECNEICS 861
esolullecongil fo noitasiretcarahC sag sisyloryp lacitylana yb stnenopmoc
yrtemortceps ssam yhpargotamorhc
oha-arhO aniaT
fo rotcoD fo eerged eht rof detelpmoc noitatressid larotcod A eht fo noissimrep eht htiw ,dednefed eb ot )ygolonhceT( ecneicS
cilbup a ta ,gnireenignE lacimehC fo loohcS ytisrevinU otlaA fo ht02 no loohcs eht fo 2eK llah erutcel eht ta dleh noitanimaxe
.21 ta 7102 rebmeceD
ytisrevinU otlaA gnireenignE lacimehC fo loohcS
smetsysoiB dna stcudorpoiB fo tnemtrapeD

rosseforp gnisivrepuS dnalniF ,ytisrevinU otlaA ,nenirouV inapaT rosseforP
srosivda sisehT
dnalniF ,dtL dnalniF fo ertneC hcraeseR lacinhceT TTV ,nenimmaT ajraT rotcoD
srenimaxe yranimilerP lagutroP ,orievA fo ytisrevinU ,niguytvE yrtimD rosseforP etaicossA
nedewS ,HTK ,mlohöjS htebasilE rosseforP etaicossA
tnenoppO niapS ,yrtnuoC euqsaB eht fo ytisrevinU ,idibaL lelaJ rosseforP
seires noitacilbup ytisrevinU otlaASNOITATRESSID LAROTCOD 032 / 7102
© 7102 oha-arhO aniaT
NBSI 8-3377-06-259-879 )detnirp( NBSI 5-4377-06-259-879 )fdp(
L-NSSI 4394-9971 NSSI 4394-9971 )detnirp( NSSI 2494-9971 )fdp(
:NBSI:NRU/if.nru//:ptth 5-4377-06-259-879
yO aifarginU iknisleH 7102
dnalniF
seires noitacilbup ytisrevinU otlaA TTV ECNEICS 861
© 7102 oha-arhO aniaT
NBSI 3-5958-83-159-879 )detnirp( NBSI 6-4958-83-159-879 )fdp(
L-NSSI X911-2422 NSSI X911-2422 )detnirp( NSSI 3021-2422 )fdp(
:NBSI:NRU/if.nru//:ptth 6-4958-83-159-879
yO aifarginU iknisleH 7102
dnalniF

tcartsbA otlaA 67000-IF ,00011 xoB .O.P ,ytisrevinU otlaA if.otlaa.www
rohtuA oha-arhO aniaT
noitatressid larotcod eht fo emaNssam yhpargotamorhc sag sisyloryp lacitylana yb stnenopmoc esolullecongil fo noitasiretcarahC
yrtemortceps
rehsilbuP gnireenignE lacimehC fo loohcS
tinU smetsysoiB dna stcudorpoiB fo tnemtrapeD
seireS seires noitacilbup ytisrevinU otlaA SNOITATRESSID LAROTCOD 032 / 7102
hcraeser fo dleiF ygolonhcet tcudorpoiB
dettimbus tpircsunaM 7102 tsuguA 32 ecnefed eht fo etaD 7102 rebmeceD 02
)etad( detnarg hsilbup ot noissimreP 7102 rebmevoN 1 egaugnaL hsilgnE
hpargonoM noitatressid elcitrA noitatressid yassE
tcartsbAa si )SM/CG-yP( yrtemortceps ssam yhpargotamorhc sag htiw denibmoc sisyloryp lacitylanA
noitadarged sisyloryP .utis ni slairetam esolullecongil fo sisylana eht rof desu eb nac taht euqinhcet mia niam ehT .elpmas laitini eht fo nigiro dna erutan eht gninrecnoc noitamrofni edivorp stcudorp
morf noitasiretcarahc etardyhobrac dna ningil rof sisyloryp lacitylana ylppa ot saw siseht siht fo nI .desilitu euqinhcet niam eht saw sisyloryp lamrehtosI .slairetam tnalp cisolullecongil suoirav
redro ni deilppa erew sisyloryp detanoitcarf dna noitprosed lamreht ,sisylomehcomreht ,noitidda etardyhobrac dna erutcurts ningil ni devresbo segnahc eht fo gnidnatsrednu retteb edivorp ot
ot dedarged si ningil doowdrah ,sisyloryp nI .sessecorp dna slairetam suoirav ni noitisopmoc ,serutcurts niahc edis ralimis htiw stcudorp noitadarged sisyloryp epyt lygnirys dna lycaiaug
ot desu eb nac stcudorp noitadarged ningiL .sragusordyhna elbats mrof setardyhobrac saerehw tonnac SM/CG-yP ,revewoH .skcotsdeef doow eht fo oitar G/S dna noitisopmoc ningil eht enfied .seiceps doow tnereffid neewteb noitisopmoc etardyhobrac fo nosirapmoc eht rof dednemmocer eb
.SM/CG-yP yb splup morf yltcerid deniatbo saw ytitnauq dna erutcurts ningil no noitamrofnI erew serutcurts niahc edis trohs fo esaercni dna stcudorp sisyloryp ningil detanegyxo fo esaerceD noitcnuf a sa serutcurts niahc edis trohs eht fo esaerceD .egavaelc dnob rehte-ateb htiw detaicossa dna ,gnikooc ni demrof stcudorp ningil eht fo gnihcael etacidni ot deterpretni saw noitacfiingiled fo
.ningil plup laudiser eht ni ningil evitan fo tnemhcirne suhtningil sti ,doow fo naht niarg tneps srewerb fo erutcurts lacimehc xelpmoc erom eht ot euD
stluser sisylomehcomrehT .sisylomehcomreht dna SM/CG-yP yb desiretcarahc saw noitisopmoc G/S dna serutcurts lygnirys epyt evitan fo noitamitserednu ot sdael SM/CG-yP taht detartsnomed ot snaem a sa deilppa saw stnegaer HAMT dna cAAMT htiw sisylomehcomreht ,noitidda nI .soitar
taht dewohs stluser ehT .ylevitcepser ,sretse dna sdica yttaf eerf neewteb etaitnereffid eht morf stnetnoc dica yttaf latot enimreted ot desu eb nac HAMT enilakla htiw sisylomehcomreht citahpila dna sdica eerf neewteb hsiugnitsid ot desu eb nac cAAMT .sretse citamora dna citahpila
.sdica eerf dna sretse citamora neewteb ton tub ,sretsesuorodo eht no noitamrofni edivorp ot depoleved saw dohtem noitprosed lamreht a noitidda nI fo nosirapmoc eht ot elbacilppa si dohtem ehT .ningil morf desaeler sdnuopmoc cinagro elitalov
.serutarepmet noitadarged lamreht rieht woleb selpmas ningil tnereffid
sdrowyeK setardyhobrac ,ningil ,esolullecongil ,sisylana ,SM/CG-yP
)detnirp( NBSI 8-3377-06-259-879 )fdp( NBSI 5-4377-06-259-879
L-NSSI 4394-9971 )detnirp( NSSI 4394-9971 )fdp( NSSI 2494-9971
rehsilbup fo noitacoL iknisleH gnitnirp fo noitacoL iknisleH raeY 7102
segaP 451 nru :NBSI:NRU/fi.nru//:ptth 5-4377-06-259-879

ämletsiviiT otlaA 67000 ,00011 LP ,otsipoily-otlaA if.otlaa.www
äjikeT oha-arhO aniaT
imin najriksötiäV-afiargotamorkusaak-isyyloryp ällesittyylana nenimithennoul neittnenopmok nasoolullesongiL
allairtemortkepsassam
ajisiakluJ uluokaekrok nakiinket naimeK
ökkiskY sotial nakiinketoib aj nediettoutoiB
ajraS seires noitacilbup ytisrevinU otlaA SNOITATRESSID LAROTCOD 032 / 7102
alasumiktuT akkiinketetoutoiB
mvp neskutiojrikisäK 7102.80.32 äviäpsötiäV 7102.21.02
äviäpsimätnöym navulusiakluJ 7102.11.10 ileiK itnalgnE
aifargonoM ajriksötiävilekkitrA ajriksötiäveessE
ämletsiviiTadiosylana naadiov )SM/CG-yP( allairtemortkepsassam-afiargotamorkusaak-isyyloryP
tavatna teettoutisyyloryP .ajettnenopmok nediin äätsire attevrat namli ajelaairetamasoolullesongil itsajaal niittiktut assajriksötiäv ässäT .ätsärepukla aj atseetnoul neettyän navattiktut aoteit
atsisialire niitniosiretkarak neittaardyhiliih aj niniingil attuuvutlevos nisyyloryp nesittyylana neS .äisyyloryp ätsimretosi niittetyäk änämletenem anesillaisaääP .atsielaairetamasoolullesongil niitiov attoj ,atiokiinketisyylorypoitkarf aj -oitprosedomret ,-isyylomekomret niittennydöyh iskäsil
ire asseskumutsook neittaardyhiliih aj asseetnekar niniingil aiskotuum ääträmmy nimmerap ,atierekosordyhna ajeliibats tavatsodoum titaardyhiliih ässisyyloryP .assiessesorp aj assielaairetam
aj -ilyysajaug iskisigolana naatleetnekarujtekuvis aaojah iniingil nuupithel saat nuk -akaarasoolullesongil naadiov alluva nediettoutisyyloryp nediäN .iskietsidhy iskisippyytilyygnirys
nejutaas ässöyT .)G/S( edhusilyysajaug-ilyygnirys aj sumutsook niniingil äättirääm atsienia alletisous adiov naaknetiuk ie aakkiinket-SM/CG-yP alleetsurep netsolut
SM/CG-yP nejossam netsillaimeK .älliläv neijaluup ire neesimaatrev neskumutsookittaardyhiliih ässöyT .ätsytsire niniingil äävätlede namli atseetnekar aj atseduusiotip niniingil aoteit iotna
neyhyl aj nenimenehäv nediettoutsimaojah nisyyloryp niniingil neivätläsis aeppah ätte ,niittiavah neeseenuthapat anakia notiek ässedyethy tavo nenimytnääsil nedietnekar neivaamo nujtekuvis nediettoutisyyloryp neivaamo nujtekuvis neyhyl itsavaatsaV .neesimaektak netsodisirettee-ateb
nedietnekar netsillaimek nedienytnys assissesorpottiek ittioso asseatsiaklav aassam nenimenehäv .niiniingilsönnääj nassam navutsakir niniingil nesiatlak niviitan aj navutsiop
niniingil nes ,alluup niuk sumutsook nenillaimek ipmesiaktuminom no älliksämominap aksoK nisyylomekomreT .alliokiinketisyylomekomret ätte -SM/CG-yP äkes niittidhennoul attennekar
neduuso nedietnekarilyygnirys netsillonnoul ioivraila SM/CG-yP ätte ,tavittioso teskolut tamatna ätsieretse nediin topahavsar taapav naamattore söym niittellevos äisyylomekomreT .neethus-G/S aj
aissnegaer-HAMT atsilakla ätte ,tavittioso teskoluT .ajessnegaer-HAMT aj -cAAMT ällämättyäk ätte atsisittaafila äkes neesimättirääm neduusiotipoppahavsarsianokok äättyäk naadiov
topah taapav naamattore äättyäk naatseloup naadiov aissnegaer-cAAMT .ätsieretse atsisittaamora .ajoppah atiapav aj ätieretse aisittaamora ie attum ,tiretse tesittaafila aj
neivesiah neivuthiah ätsiniingil ämletenem avutsurep nooitprosedomret niittetihek iskäsiL nediettyäniniingil netsialire uutlevos ämleteneM .iskesimättirääm nedietsidhy netsinaagro
.nalitöpmälsimaojah nesimret nediin ella tavo aktoj ,assiolitöpmäl nuuliatrev
tanasniavA titaardyhiliih ,iniingil ,asoolullesongil ,isyylana ,SM/CG-yP
)utteniap( NBSI 8-3377-06-259-879 )fdp( NBSI 5-4377-06-259-879
L-NSSI 4394-9971 )utteniap( NSSI 4394-9971 )fdp( NSSI 2494-9971
akkiapusiakluJ iknisleH akkiaponiaP iknisleH isouV 7102
äräämuviS 451 nru :NBSI:NRU/fi.nru//:ptth 5-4377-06-259-879

i
Acknowledgements
This thesis work is based on experimental work carried out at Oy Keskuslaboratorio, KCL and VTT Technical Research Centre of Finland during the years 2003-2017. Financial support from the Academy of Finland (projects “Effect of fibre wall chemistry on energy demand in wood defibration, Defibre” no 133276 and “Lignin Fiber” no 133091), Tekes- the Finnish Funding Agency for Innovation (project “VOC reduction of lignin-containing materials” in the ERA-IB program), KCL and VTT is gratefully acknowledged. I express my deepest gratitude to my supervisor, Dr. Tarja Tamminen, for encouraging me to continue towards a doctoral degree, and for her constant support and valuable advice during these years. I want to thank Prof. Tapani Vuorinen for the supervision and guidance during doctoral studies. Assoc. Prof. Dmitry Evtyugin and Assoc. Prof. Elisabeth Sjöholm are acknowledged for their comments as the pre-examiners of this thesis. Warm thanks are extended to my co-autors Prof. Maija Tenkanen, Dr. Anna Kalliola, Dr. Jarmo Ropponen, Prof. Jorge Colodette, Prof. Borges Gomes, Dr. Piritta Niemi, Dr. Anna-Marja Aura, Prof. Kaisa Poutanen, Prof. Marco Orlandi, Prof. Johanne Buchert, Dr. Greta Faccio and Dr. Anne Savolainen for their advice and pleasant collaboration. I also thank the skilful technical staff at KCL and VTT. Special thanks go to Petteri Vihra and Eila Turunen for their help in sample pretreatments and in Py-GC/MS analyses. I am grateful to my colleagues at VTT for inspiring discussion on the research and other topics, and for creating a pleasant and relaxing working atmosphere. Thanks to my parents and sister and my friends for their support. Finally, my warmest thanks to my family Timo, Leevi and Vilppu for their love and encouragement. Espoo, November 13, 2017 Taina Ohra-aho

ii
Contents
Acknowledgements i List of Abbreviations iv List of Publications vi
Author’s Contribution vii 1. Introduction 1
1.1 Aims and approaches of the study 3
2. Analytical pyrolysis 4 2.1 Instrumentation 4
2.2 Sample preparation 5
2.3 Pyrolysis techniques 6
3. Thermal degradation of the main lignocellulose components 8 3.1 Lignin 8
3.2 Cellulose 13
3.3 Hemicelluloses 15
4. Applications of analytical pyrolysis in lignocellulosic processing 18 4.1 Macromolecular biomass components 18
4.1.1 Wood fibres 18 4.1.2 Alternative biomass sources (non-wood) 20 4.2 Low molecular weight compounds 21
4.2.1 Extractives 21 5. Experimental 23
5.1 Materials and methods 23
5.1.1 Material preparation 23 5.1.2 Pyrolysis techniques 26
6. Results and discussion 30 6.1 Applications in pulping chemistry 30
6.1.1 Lignin structure in different wood types (I, IV) 30 6.1.2 Lignin structure in alkaline pulps (I, V) 34 6.1.3 Lignin structure in bleached pulps (I) 36 6.1.4 Determination of lignin substructures (S/G/H) (I, IV) 36
6.1.5 Quantity of lignin in pulps after cooking and bleaching (I, IV) 41 6.1.6 Carbohydrate composition in wood and pulps (VI) 43

iii
6.2 Lignin utilization 46
6.2.1 Thermal desorption method for lignin quality control (II) 46
6.2.2 Thermochemolysis as a tool for the analysis of esterified lignin substrucures (III) 49 6.2.3 BSG as a potential novel source of lignin material (V) 52
7. Conclusions 57 8. Future prospects 59 References 60

iv
List of Abbreviations
AL acidolysis
AoSOX1 Aspergillus oryzae sulfhydryl oxidase
AQ antraquinone
BSG brewer’s spent grain
BSTFA N,O-bis(trimethylsilyl)trifluoroacetamide
D chlorine dioxide
2D NMR two-dimensional nuclear magnetic resonance spectroscopy
ECF elemental chlorine free
EMAL enzymatic mild acidolysis
FA ferulic acid
FID flame ionization detector
FPD flame photometric detector
FTIR fourier transform infrared spectroscopy
G guaiacyl
H p-hydroxyphenyl
HexA hexenuronic acid
HPLC high performance liquid chromatography
INS insoluble residue after hydrolysis
IR infrared spectroscopy
MaL Melanocarpus albomyces laccase
MWL milled wood lignin
NIR near-infrared spectrometry
NMR nuclear magnetic resonance spectroscopy
O oxygen

v
P-AEF protease-alkali extracted fraction
p-CA para-coumaric acid
PC principal component
PCA principal component analysis
31P NMR phosphorus nuclear magnetic resonance spectroscopy
PO pressurized alkaline hydrogen peroxide
Py-GC/MS pyrolysis coupled with gas chromatography mass spectrometry
Q chelation
S syringyl
SE softwood Kraft lignin provided by Stora Enso
SEC size-exclusion chromatography
TBAH tetrabutylammonium hydroxide
TD thermal desorption
TEAAc tetraethylammonium acetate
TFPTAH trimethyl-3-trifluoromethylphenylammonium hydroxide
TG thermogravimetry
THM thermally assisted hydrolysis and methylation
TIC total ion current
TMAAc tetramethyl ammonium acetate
TMAH tetramethyl ammonium hydroxide
TMPAH trimethylphenylamine hydroxide
TMSH trimethylsulfonium hydroxide
UB unbleached
UV ultraviolet spectroscopy
VOC volatile organic compound

vi
List of Publications
This doctoral dissertation consists of a summary and of the following publications which are referred to in the text by their numerals I Ohra-aho, T., Tenkanen, M., Tamminen, T. (2005). Direct analysis of lignin and lignin-
like components from softwood kraft pulp by Py-GC/MS techniques. Journal of Ana-lytical and Applied Pyrolysis 74, 123–128. DOI: 10.1016/j.jaap.2004.11.010
II Kalliola, A., Savolainen, A., Ohra-aho, T., Faccio, G., Tamminen, T. (2012). Reducing the content of VOCs of softwood kraft lignins for material applications. BioResources 7, 2871–2882.
III Ohra-aho, T., Ropponen, J., Tamminen, T. (2013). Thermochemolysis using TMAAc and TMAH reagents as means to differentiate between free acids and esters. Journal of Analytical and Applied Pyrolysis 103, 31–35. DOI: 10.1016/j.jaap.2012.09.015.
IV Ohra-aho, T., Gomes, F.J.B., Colodette, J.L., Tamminen, T. (2013). S/G ratio and lignin structure among Eucalyptus hybrids determined by Py-GC/MS and nitrobenzene oxi-dation. Journal of Analytical and Applied Pyrolysis 101, 166–171. DOI: 10.1016/j.jaap.2013.01.015.
V Ohra-aho, T., Niemi, P., Aura, A.-M., Orlandi, M., Poutanen, K., Buchert, J., Tamminen, T. (2016). Structure of brewer’s spent grain lignin and its interactions with gut microbi-ota in vitro. Journal of Agricultural and Food Chemistry 64, 812–820. DOI: 10.1021/acs.jafc.5b05535.
VI Ohra-aho, T., Gomes, F.J.B., Colodette, J.L., Tamminen, T. Carbohydrate composition in Eucalyptus wood and pulps – comparison between Py-GC/MS and acid hydrolysis. Accepted for publication to Journal of Analytical and Applied Pyrolysis.

vii
Author’s Contribution
Publication I: The author planned the analysis work and interpreted the results together with Dr. Tarja Tamminen and Prof. Maija Tenkanen; the author supervised the Py-GC/MS measurements and performed the Py-GC/MS data handling. Prof. Maija Tenkanen was re-sponsible for the cooking and bleaching experiments. The author wrote the publication to-gether with the supervisor Dr. Tarja Tamminen.
Publication II: The author planned the TD-GC/MS measurements with Dr. Tarja Tam-minen and Dr Anna Kalliola and supervised the TD-GC/MS measurements and evaluated its data. Dr. Anna Kalliola supervised oxidation experiments and wrote the publication. Dr. Anne Savolainen performed the laccase treatments and Dr. Greta Faccio the Sulfuryl oxidase treatments.
Publication III: The author designed the work plan together with Dr. Tarja Tamminen and Dr. Jarmo Ropponen, supervised the Py-GC/MS measurements and interpreted the Py-GC/MS data. Dr. Jarmo Ropponen synthetized the lignin model compounds and carried out the NMR measurements. The author had main responsibility for writing the publication.
Publication IV: The author designed the work plan together with Dr. Tarja Tamminen and Prof. Jorge Luiz Colodette. Prof. Fernando José Borges Gomes was responsible for the alka-line nitrobenzene oxidation measurements. The author supervised the Py-GC/MS measure-ments, evaluated the measurement data and had main responsibility for writing the publica-tion.
Publication V: The author planned the Py-GC/MS measurements together with Dr. Piritta Niemi, Dr. Anna-Marja Aura and Dr. Tarja Tamminen. The author supervised the BSG and lignin Py-GC/MS measurements and carried out Py-GC/MS measurements after the in vitro Colona experiments. Dr. Piritta Niemi performed the lignin isolations under the supervision of Prof. Johanna Buchert for the enzymatic treatments and Prof. Marco Orlandi for the chem-ical treatments. Dr. Anna-Marja Aura carried out the in vitro colona fermentations and in-terpreted the results together with Prof. Kaisa Poutanen. The author interpreted the Py-GC/MS data and had main responsibility for writing the publication.
Publication VI: The author designed the work plan together with Dr. Tarja Tamminen and Prof. Jorge Luiz Colodette. The author supervised the isothermal pyrolysis measurements, carried out the fractionated pyrolysis measurements and interpreted the Py-GC/MS data. Prof. Fernando José Borges Gomes was responsible for the carbohydrate analyses carried out by HPLC after acid hydrolysis. The author had main responsibility for writing the publication.

1
1. Introduction
Chemical components of lignocellulosic biomasses are divided into macromolecular sub-stances and low molecular weight compounds. Macromolecular cell wall components, lignin and polysaccharides i.e. cellulose and hemicelluloses, are present in all plant species. The chemical composition of lignin and hemicelluloses varies depending on the plant species, whereas cellulose is a uniform component in all. The amount and type of low molecular weight compounds, extractives and minerals also varies between different plant species.
As a linear, high molecular weight polymer, cellulose is built up exclusively of glucose. Hemicelluloses are variously composed of five neutral sugars: glucose, mannose, galactose, xylose and arabinose, which are in close association with cellulose in the cell wall. The molec-ular chains of hemicelluloses are much shorter and more branched due to side groups in comparison to cellulose. During development of the cells, lignin is the last component formed in the cell walls, interpenetrating the polysaccharide fibrils and thus strengthening the cell walls. The structure of lignin is different from that of polysaccharides. It is an amorphous substance, composed of aromatic phenylpropanes including p-hydroxypehnyl (H), guaiacyl (G) and syringyl (S) units with different numbers of methoxyl groups. Lignin units are linked together with carbon-oxygen and carbon-carbon bonds, but also with polysaccharides. Minor polymeric carbohydrates in lignocellulosic biomasses are starch and pectin, which are more abundant in annual plants than in wood species (Fengel and Wegener, 1989).
Analysis of biomass components is complex because the components are highly associated with each other. It is difficult to separate lignocellulosic components without degrading the polymers or changing the molecular properties. Analysis of lignocellulosic components can be carried out by determining only the main cell wall components together with extractives and ash. On the other hand, very detailed analyses including the determination of functional groups and individual polysaccharide and lignin units are also carried out. Composition anal-yses are made for the extractive-free samples. Thus the analyses are always started by remov-ing extractives. For studying the detailed structures and polymer properties of the lignocellu-losic constituents, their isolation is first necessary (Fengel and Wegener, 1989).
An approximate estimate of the total content of polysaccharides can be obtained by subject-ing the sample to an oxidative delignification, after which the polysaccharide material (holo-cellulose) remains as a solid residue. However, a more reliable analysis is based on separate determination of the polysaccharide constituents using chromatographic methods (gas chromatography, high-performance anion-exchange chromatography or capillary electropho-resis). Before the analysis, cell wall polysaccharides are depolymerized to sugar units, which is most commonly effected by acid hydrolysis of glycoside bonds. Other advantageous depol-ymerisation techniques are acid methanolysis and enzymatic hydrolysis. Methanolysis is suitable for the neutral monosaccharides and acidic sugars, but cellulose is not depolymer-

2
ized totally due to its high crystallinity. Enzymatic hydrolysis can be performed to determine the uronic and hexenuronic acid contents of pulp samples (Sjöström and Alen 1999).
Lignin content can be determined using either direct or indirect methods. Most commonly, lignin is determined gravimetrically as Klason lignin after hydrolysis of polysaccharides with strong acid. However, part of the lignin is soluble in acid. This acid soluble lignin can be de-termined by UV spectroscopy from the hydrolysate and be included in Klason lignin in order to obtain a value for total lignin. Lignin content can also be determined without isolation from wood and pulp samples by Fourier transform infrared spectroscopy (FTIR) and near-infrared spectrometry (NIR). For these methods, a specific calibration model is needed in order to determine the lignin content. In the acetyl bromide method, lignin content can be determined by UV spectroscopy at 280 nm after solubilisation of lignin-containing samples in a mixture of acetyl bromide and glacial acetic acid. For spectroscopic methods, the adsorp-tion coefficients of various types of lignins are needed. The content of methoxyl groups can be used to determine the lignin content indirectly. From the pulp samples, residual lignin can be measured by the kappa number, based on oxidant consumption. Kappa number can be con-verted to Klason lignin by using specific conversion factors (Fengel and Wegener, 1989).
Structural information of lignin in situ can be obtained for biomass samples using several spectroscopic techniques, UV, FTIR and nuclear magnetic resonance (NMR) and oxidative degradation methods. In the case of lignocellulosic materials, however, spectroscopic meth-ods suffer from poor sensitivity and overlapping signals of lignin and polysaccharides. Oxida-tive degradation methods in alkaline media that preserve the aromatic ring include oxidation with potassium permanganate followed by hydrolysis and methylation, nitrobenzene oxida-tion, and oxidation with metal oxides such as cupric oxide (CuO). Degradation products can be used to determine the H, G and S unit ratios, but also the etherified and free phenolic hy-droxyl group of lignin.
For more detailed structural analysis, lignin must first be isolated. This cannot be done without altering the structure of lignin. However, relatively unchanged lignin can be obtained from ball milled biomass by dioxane-water extraction (Björkman’s procedure) or enzymatic hydrolysis. A third isolation method that has been used is mild enzymatic hydrolysis followed by an acid hydrolysis stage. Isolated lignin samples can be characterized with several tech-niques, including the previously mentioned oxidative degradation methods, but molar-mass distribution by size-exclusion chromatography (SEC) can also be carried out. More detailed information concerning lignin functional groups together with substructures can be deter-mined with UV, IR and 13C-NMR spectroscopy from isolated lignins without interfering poly-saccharides. Free phenolic hydroxyl groups after phosphitylation can be determined by 31P NMR and interunit linkages by 2D-NMR. The average composition of the C9-units in lignin can be calculated based on the elemental composition and methoxyl group content.
The previously mentioned methods are widely used to determine the composition of ligno-cellulosic materials either separately or in combinations of several methods. Most of the di-rect methods are time consuming, and determination of lignin and carbohydrates must be performed separately. One potential method to determine the composition of lignocellulosic materials is analytical pyrolysis combined with gas chromatography mass spectrometry (Py-GC/MS). Py-GC/MS enables simultaneous determination of lignin and carbohydrates from fibre-based materials in a micro scale without the need for tedious isolation. Other ad-vantages are that pretreatments such as extractives removal or refining are not always neces-sarily required prior to the analysis of lignocellulose materials. Due to extensive studies of

3
various lignocellulosic materials, the phenolic lignin pyrolysis products and degradation products of polysaccharides have been well identified and reported (Faix et al. 1990b; Faix et al. 1991a; Ralph and Hatfield 1991). Isothermal pyrolysis is widely used for materials compar-ison. However, there are various techniques, including thermochemolysis, thermal desorp-tion, fractionated pyrolysis and sequential pyrolysis, which can be applied in conjunction with isothermal pyrolysis in order to better understand the lignocellulose structure of feed-stocks and products.
1.1 Aims and approaches of the study
The main aim of this thesis was to study how analytical pyrolysis can be applied for the lignin and carbohydrate characterisation of various lignocellulosic plant materials and products. In a broader framework, the aim is to understand more deeply the changes observed in lignin structure and carbohydrate composition in various processes, and whether these changes can be detected not only by isothermal pyrolysis, but by applying several different Py-GC/MS techniques. More specifically, different Py-GC/MS techniques were applied:
to evaluate differences between lignocellulosic feedstocks
to monitor structural changes in lignin together with its quantity during pulp deligni-fication and bleaching
to determine volatile organic compounds released from treated Kraft lignins
to differentiate aromatic and aliphatic ester bonds together with their corresponding free acids

4
2. Analytical pyrolysis
Analytical pyrolysis is a method in which chemical bonds between molecules are degraded in an inert atmosphere using thermal energy. The original large molecules are degraded to low molecular weight fragments, i.e. volatiles, that can be more easily analysed. The strength of the bonds between molecules influences the energy needed to break the bonds. The pyrolysis conditions (time, temperature and heating rate) and the nature of the sample material affect the type and distribution of the formed degradation products. Samples of the same material pyrolysed under identical conditions are degraded repeatedly in a similar manner to the same degradation products, whereas samples from other origins behave differently. The volatile degradation products retain the structural information of the initial sample. Thus analysis of the degradation products and the process used for the thermal degradation provides infor-mation about the nature and origin of the initial sample material (Ericsson, 1985; Wampler, 1995).
Analytical pyrolysis is designed for the analysis of solid and high molecular weight material. The samples may thus be insoluble, or they may include both synthetic and natural polymers as well as volatiles. The pyrolysis is a pretreatment method, and must be connected with an analytical instrument for the analysis of degradation products.
2.1 Instrumentation
There are several analytical pyrolysis instruments available. The three most commonly used pyrolysis instruments are isothermal furnace (micro furnace), inductively heated Curie-point and resistively heated filament (Sobeih et al., 2008). The way the sample is heated depends on the instrument type. In each of the techniques the aim is to heat the sample rapidly to the final temperature, thus avoiding secondary reactions of the products. The sample size must be kept low (recommended 10-100 μg) in order to reach the desired temperature quickly enough (Andersson and Ericsson, 1979; Wampler, 1995).
The furnace pyrolyser is kept isothermally at the desired pyrolysis temperature and the sample is injected into a hot interface. The degradation starts immediately when the sample meets the hot zone and the degradation products are led simultaneously into a gas chroma-tography. In this system the temperature is kept constant, but the heating rate of the sample is dependent on the sample material itself together with the composition of the sample intro-duction device. In Curie-point instruments, electric current is induced into the pyrolysis fila-ment inductively with the aid of a high frequency coil. The filament is made from ferromag-netic metal or alloy. Pyrolysis temperature is dependent on the Curie-point of the ferromag-netic alloy or metal. Only one temperature can be used at a time. It is necessary to change a filament made from a different alloy if a different temperature is required. In a Curie-point pyrolyser the sample is placed into a cold interface, heated briefly and cooled again. That is

5
also the case in the resistively heated filaments, but the heating source is different from that in the Curie-point pyrolyser (Wampler, 1999, 1995). Resistively heated filament is heated using a high voltage, which produces a current through the filament made from resistive metal (platinum). The first high voltage pulse heats the filament until it reaches the desired temperature. The second low voltage pulse maintains the pyrolysis temperature for the se-lected time. The advantage of the resistively heated pyrolysers is that sample can be heated to a variety of temperatures without the need to change the filament for each temperature. Py-rolysis can be performed at any temperature over the filament’s usable range (Andersson and Ericsson, 1979; Ericsson, 1985; Tydén-Ericsson, 1973).
For the analysis of degradation products, the pyrolyser is connected with an analysis device.
Most commonly, the pyrolyser is directly connected to the gas chromatograph injection port. Column carrier gas passes through the pyrolysis instrument, leading degradation products to the injector and thereafter into the capillary column for separation. Separation of compounds is based on their polarity or boiling point differences. These factors are dependent on the selected stationary phase of the capillary column. Detection of degradation products is usual-ly carried out by mass spectrometry, because this enables the identification of compounds based on the formed mass spectra. There are several commercial mass spectra libraries, which help in the identification of compounds (Wampler, 1995). Other types of detectors, such as a flame ionisation detector (FID), a flame photometric detector (FPD), which is selec-tive for sulphur (Selsbo et al., 1997), and FTIR have been used. Compound identification without model compounds is not possible if FID is used as a detector. However, pyrolysis profiles i.e. fingerprints are distinct among polymers determined under the same conditions. Therefore is also possible to identify polymers based on their pyrolysis profiles. Gas chroma-tography separates only the volatile and semi-volatile degradation products. The high molec-ular weight fragments may leave and condense into the injector. Direct installation of the pyrolysis instrument into mass spectrometry or IR also enables analysis of the high molecular weight fragments (Wampler, 1995).
2.2 Sample preparation
Pyrolysis is a degradative pretreatment method for high molecular weight material. However, optimization of sample size, homogeneity, removal of contaminants and sample dosage are also important parts of the analyses. It is necessary to keep the sample size constant and ra-ther low (10-100 μg), because pyrolysis instruments are designed to heat low sample amounts rapidly to high temperatures. Overload of sample changes the heating rate and causes contamination of both the pyrolysis unit and the analytical instrument. The homoge-neity and sample size together with dosage can be controlled more easily for soluble than for insoluble material. The sample volume can be kept constant when sample solution is trans-ferred with a syringe to the pyrolysis instrument. Solvent is evaporated before the sample is transferred to the pyrolysis unit. This enables better contact between the sample and the sample holder. In the case of insoluble samples, which most natural materials are, homogeni-zation and sample size optimization are necessary. The smaller the particles are the better, and the higher surface area of sample is in contact with the sample holder (Wampler, 1995). Pretreatments such as milling, however, may change the nature of the sample and the results are no longer representative (Syverud et al., 2003). Samples may contain natural or external-

6
ly added inorganic species, which may change the decomposition behaviour of the polymer either by lowering the pyrolysis temperature or changing the product distribution (Müller-Hagedorn et al., 2003; Patwardhan et al., 2010). Inorganic species can be removed by ex-tracting samples with acid or tap water (Kleen and Gellerstedt, 1995).
2.3 Pyrolysis techniques
Isothermal pyrolysis The commonest way to analyse various sample materials is isothermal pyrolysis in which the temperature, time and heating rates are kept constant. The used instrument type defines the temperature and time needed for the efficient degradation of material. Isothermal pyrolysis is used for both qualitative and quantitative analyses of sample materials (Wampler, 1995). Depending on the instrument type, the pyrolysis unit can be utilized for thermal desorption, sequential pyrolysis, fractionated pyrolysis and thermochemolysis analyses. Thermal desorption The principle in thermal desorption (TD) is that volatile organic compounds (VOCs) are col-lected into an adsorbent. The adsorbent is heated in a gas flow, and the VOCs thus released pass directly into gas chromatography (Woolfenden, 2012). Thermal desorption tempera-tures are lower in comparison to those used in pyrolysis, because degradation of the sample material needs to be avoided. Thermal desorption can be used prior to pyrolysis in order to separate non-polymeric compounds from the polymeric material. In this case sample materi-al is heated in a pyrolysis unit at constant temperature until all the volatile compounds have been released (Kleen et al., 2003). Volatiles are directly led by the carrier gas into the gas chromatography column for separation and detection. External adsorbent is not used. Fractionated pyrolysis Fractionated pyrolysis measurements can be performed directly after thermal desorption analysis. The principle of fractionated pyrolysis is that the same original sample is analysed at increasing temperatures for different times. The method makes it possible to study particular fractions of a sample. The pyrolysis time is sufficient when all the degradation products have been released at the adjusted temperature (Selsbo et al., 1997). In general, at lower tempera-tures longer times are needed to release all the compounds. Pyrolysis time is set using se-quential pyrolysis, in which sample pyrolysis is performed under identical conditions (tem-perature and time) several times until all the degradation products have been released (Ericsson, 1978; Ericsson and Lattimer, 1995). Thermochemolysis After isothermal pyrolysis, thermochemolysis is the second most utilized technique in pyroly-sis. In thermochemolysis, organic substance is degraded into smaller fragments by means of a chemical reagent and heat. Thermally assisted hydrolysis and methylation (THM) in the presence of tetramethyl ammonium hydroxide (TMAH) is one such reaction and it was estab-lished for a pyrolysis instrument by Challinor (1989). In this procedure, a mixture of sample material and reagent solution are subjected to heat in a pyrolysis unit. As a consequence, hy-drolytic scission of ester and ether bonds takes place. This is followed by salt formation and finally the salts undergo pyrolysis to form corresponding methyl derivatives. The THM reac-

7
tion scheme suggested by Challinor (2001) is shown in Figure 1. As a strong base, TMAH cleaves ether and ester bonds, leading to methylation of etherified and esterified functional groups together with release of free alcohol and acid groups, as well as salts (Challinor, 1996; Drechsel et al., 2003; Hardell and Nilvebrant, 1999) Other similar types of reagents that have been used for the thermochemolysis are trimethylsulfonium hydroxide (TMSH), tetrabu-tylammonium hydroxide (TBAH), trimethylphenylamine hydroxide (TMPAH) and trimethyl-3-trifluoromethylphenylammonium hydroxide (TFPTAH) (Shadkami and Helleur, 2010).
Neutral derivatization reagents, e.g. tetramethylammonium acetate (TMAAc), tetrae-thylammonium acetate (TEAAc) and N,O-bis(trimethylsilyl)trifluoroacetamide (BSTFA), have been used to determine free acids and hydroxyl groups (Grasset et al., 2002; Hardell and Nilvebrant, 1999; Kuroda, 2000a). The use of neutral reagents with more basic reagents makes it possible to distinguish bound fatty acids from free acids. Instead of methylation, an ethylation reaction takes place with TEAAc. This phenomenon can be utilized when naturally existing methyl esters or ethers are differentiated from the free acids and alcohols.
1) Hydrolysis
OH
+ A B A + B OH
2) Formation of TAA salt
A +
R4N+OH R4N+A + OH
B OH + R4N+OH
R4N+OB + H2O
3) Thermal dissociation to alkyl derivatives
R4N+A AR + R3N
R4N+OB BOR + R3N
A-B = hydrolysable analyte molecule
Figure 1. Reaction mechanisms in thermochemolysis (Challinor, 2001).

8
3. Thermal degradation of the main lignocellu-lose components
3.1 Lignin
Lignin is the most abundant aromatic substance in the living world, giving mechanical strength to plant species (S.Y. Lin and Dence 1992). Lignin originates from phenylpropanoid precursors such as p-coumaryl alcohol, coniferyl alcohol and sinapyl alcohol (Figure 2). The phenylpropanoid units are linked with ether (β-O-4, 4-O-5) or carbon-carbon bonds (β-β, β-1, 5-5, β-5) in the lignin network as shown in Figure 3 (Ralph et al., 2007). The structure of lignin and the ratios of different hydroxycinnamyl alcohols vary depending on the plant spe-cies, cell type and environmental factors, but also between different parts of the plant (Sarkanen and Hergert, 1971). Lignin in softwood is enriched with guaiacyl substructures, whereas hardwood lignin contains about equal amounts of guaiacyl and syringyl substruc-tures. Both softwood and hardwood contain minor amounts of p-hydroxyphenyl substruc-tures. Annual plants contain all three substructures, but significantly more p-hydroxyphenyl substructures than wood species. However, the main linkage between phenylpropanoid units in all plant species is β-O-4.
Figure 2. Primary lignin monomers, the monolignols p-coumaryl, coniferyl and sinapyl alcohol.

9
Figure 3. Schematic structure of softwood lignin and the common linkages of softwood (Ralph et al., 2007)

10
In pyrolysis, lignin is thermally degraded to a mixture of phenols including p-hydroxyphenyl, guaiacyl and syringyl type degradation products with side chains of from one to three carbon atoms. Side chains contain both saturated and unsaturated alkyl groups in-cluding oxygenated functionalities (C=O, C-OH), as shown in Table 1. These monomeric deg-radation products are formed mainly as a result of the cleavage of ether linkages. Based on extensive model compound studies, some of the condensed linkages, such as β-5 (Kuroda & Nakagawa-izumi 2006) and β-1 (Kuroda & Ashitani 2007; Jiang et al. 2016) are also known to be cleaved to monomers. Degradation of ether linkages both in free and non-phenolic form has been verified in several studies (Akazawa et al., 2016; Amen-Chen et al., 2001; Brezny et al., 1983; Faix et al., 1988; Kuroda, 2000b; Y. Liu et al., 2016; Zhang et al., 2016). It has been found that the free phenolic ether and β-aryl bonds are thermally less stable than non-phenolic bonds (Akazawa et al., 2016; Nakamura et al., 2008; Watanabe et al., 2009). In ad-dition the absence of hydroxyl groups from the α and γ position of the propyl chain reduces the reactivity of β-O-4 bond cleavage to the same level as that of non-phenolic structures (Kawamoto et al., 2007). The release of hydroxyl group or cleavage of the α-ether linkage is the rate determining step for the cleavage of β-ether bonds (Kawamoto et al., 2008). The condensed structures present in lignin affect the yield of the monomeric pyrolysis products. (Böttcher, 1993; Gardner et al., 1985; Izumi et al., 1995a; Izumi and Kuroda, 1997; Kuroda et al., 1994). Syringyl substructures are less condensed than guaiacyl substructures. Thus sy-ringyl units are overestimated in comparison to guaiacyl units in Py-GC/MS analysis. A cor-rection equation has been developed that reduces the yield of syringyl units with relation to guaiacyl units and compensates for the effect of condensation (Böttcher, 1993). Degradation mechanisms for β-ether bond cleavage Even after extensive studies, the degradation mechanisms of lignin in pyrolysis are not yet fully understood. Molecular mechanisms of lignin degradation in pyrolysis and gasification were summarised in the recent review by Kawamoto (2017). In analytical pyrolysis the focus is on primary pyrolysis reactions, although the temperatures used in analytical pyrolysis are in most cases in the range in which secondary pyrolysis reactions may also occur (> 400 °C).
It has been proposed that both homolytic and heterolytic reactions take place, even though there is no actual evidence of pyrolytic cleavage mechanisms. However, both mechanisms lead to the same degradation products. The heterolytic reaction is possible only for free phe-nolic lignin structures. In the heterolytic reaction pathway, a para substituted phenolate ani-on is formed as a result of the cleavage of ether linkages. In the homolysis reaction pathways, a phenoxy radical is formed from the cleavage of ether bonds. Formation of stable radical improves the efficient cleavage of the ether linkages and reduces the bond dissociation energy of the aromatic O-C bond.

11
Figure 4. Supposed cleavage mechanisms of non-phenolic and free phenolic β-ether bonds of lignin. Figure modified from Kawamoto et al. (2008).
Homolytic and heterolytic reaction mechanisms have been widely studied by using model compounds with phenolic or non-phenolic end groups (Figure 4). The release of hydroxyl functional groups or degradation of ether-linked polysaccharides or lignin units from the -position has been explained to be the rate determining step for the cleavage of β-ether bonds (Kawamoto et al., 2008). It is important to note that the presence of α, -diaryl ether linkages in plant lignin are in general either undetectable or present at very low levels (Ralph et al., 1998), although α, -diaryl ether linkages have been detected from tobacco lignin (Ralph et al., 1998) and wheat straw lignin (del Río et al., 2012). In the case of free phenolic units, the heterolysis reaction is thought to take place via a quinone methide intermediate. The reaction will be continued via the homolytic pathway, which is thought to be followed when non-phenolic groups exist in lignin. The temperature needed for the bond cleavage is lower in heterolysis than in homolysis reactions (Kawamoto et al., 2008).
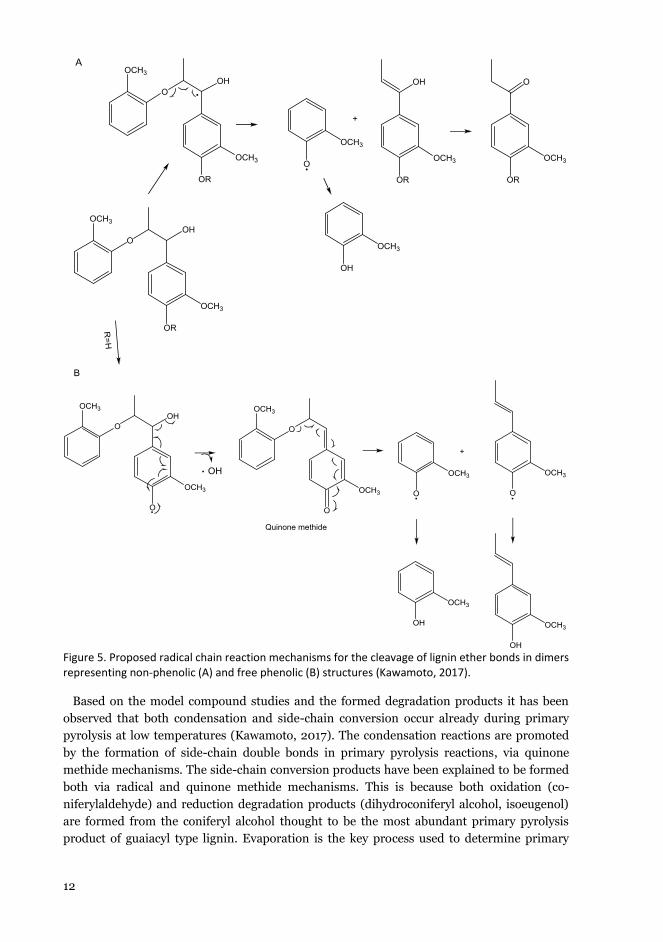
Two types of radical chain mechanism have been supposed to cleave the β-ether bond in lignin networks (Kawamoto, 2017). The reactions taking place for the non-phenolic struc-tures (A) and for the free phenolic structures (B) are shown in Figure 5. The reaction rate for the free phenolic structures is greater than that for the non-phenolic structures. The reaction products that are formed via radical degradation mechanisms of the β-ether bond are C=O and C =Cβ type monomers (Figure 5).
12
Figure 5. Proposed radical chain reaction mechanisms for the cleavage of lignin ether bonds in dimers representing non-phenolic (A) and free phenolic (B) structures (Kawamoto, 2017).
Based on the model compound studies and the formed degradation products it has been observed that both condensation and side-chain conversion occur already during primary pyrolysis at low temperatures (Kawamoto, 2017). The condensation reactions are promoted by the formation of side-chain double bonds in primary pyrolysis reactions, via quinone methide mechanisms. The side-chain conversion products have been explained to be formed both via radical and quinone methide mechanisms. This is because both oxidation (co-niferylaldehyde) and reduction degradation products (dihydroconiferyl alcohol, isoeugenol) are formed from the coniferyl alcohol thought to be the most abundant primary pyrolysis product of guaiacyl type lignin. Evaporation is the key process used to determine primary

13
pyrolysis products during heat treatment of lignin, and also in analytical pyrolysis measure-ments. Evaporation prevents the formation of secondary products.
Table 1. Lignin pyrolysis degradation products and main side chain structures.
H units Side chain structure, R
Phenol H 4-Methylphenol CH3 4-Vinylphenol CH=CH2
G units S units Guaiacol Syringol H 4-Methylguaiacol Methylsyringol CH3 4-Ethylguaiacol Ethylsyringol CH2-CH3 Vinylguaiacol 4-Vinylsyringol CH=CH2 Eugenol 4-Allylsyringol CH2-CH=CH2 cis-Isoeugenol cis-Propenylsyringol CH=CH-CH3 (cis) trans-Isoeugenol trans-Propenylsyringol CH=CH-CH3 (trans) Vanillin Syringaldehyde CHO Acetoguaiacone Acetosyringone CO-CH3 Guaiacyl vinyl ketone Syringyl vinyl ketone CO-CH=CH2 Homovanillin Homosyringaldehyde CH2-CHO Guaiacylacetone Syringylacetone CH2-CO-CH3 4-(1-Hydroxyprop-2-enyl)guaiacol 4-(1-Hydroxy-prop-2-enyl)syringol CHOH-CH=CH2 Dihydroconiferyl alcohol Dihydrosinapyl alcohol CH2-CH2-CH2OH cis-Coniferyl alcohol cis-Sinapyl alcohol CH=CH-CHOH trans-Coniferyl alcohol trans-Sinapyl alcohol CH=CH-CHOH Coniferaldehyde Sinapaldehyde CH=CH-CHO
3.2 Cellulose
Cellulose is a linear high molecular weight polymer with a uniform chain structure of D-glucose units (Figure 6). The units are bound by β-(1-4)-glucoside linkages with a repeating cellobiose unit (Fengel and Wegener, 1989). Thermal degradation of cellulose begins by wa-ter evolution and rearrangement of interchain and intrachain hydrogen bonds. Dehydration initiates the cellulose degradation, which involves the cleavage of β-(1-4)-glycosidic linkages and the formation of levoglucosan. Non-reducing chain ends, higher molecular weight and

14
the crystallinity of cellulose promote levoglucosan formation in high yield. Oppositely reduc-ing chain-ends as well as amorphous regions of cellulose have lower thermal stability, being thus the initiation points for the thermal degradation. At lower temperatures, a high yield of char is formed, whereas higher temperatures support the formation of levoglucosan as well as non-condensable gases. Carbon monoxide and carbon dioxide follow closely the weight loss of cellulose, but carbon monoxide is also formed at higher temperatures as a result of sup-posed secondary reactions.
Figure 6. Structure of cellulose (Fengel and Wegener, 1989).
There are several theories of cellulose thermal degradation mechanisms and the formation of levoglucosan as the main degradation product. Several studies have suggested that cellulose degradation occurs via two main competitive transglycosylation reactions (Choi et al., 2011; Mamleev et al., 2009, 2006; Sheirs et al., 2001). The initial pathway is via an intermolecular transglycosylation reaction within the glucose monomer of cellulose. This is followed by two different reactions to form anhydrosaccharides after a second transglycosylation reaction and β-elimination (acid catalysed) to form liquid tar (Mamleev et al., 2006; Zhang et al., 2013). The acids (Bronsted acid) formed via β-elimination are able to attack the remaining cellulose, thus catalysing further reactions (Shaik et al., 2013). Two continuous transglycosylation steps are included for the cellulose degradation by transglycosylation reactions. In the first transglycosylation step a cellulose chain is depolymerized into a levoglucosan chain-end in-termediate and a short cellulose chain. In the second transglycosylation step the levoglucosan chain-end intermediate is converted into levoglucosan and another levoglucosan chain-end intermediate is formed (Mamleev et al., 2006; Zhang et al., 2013). It has also been proposed that cellulose can be degraded to form levoglucosan via a glucose intermediate, free radical mechanisms or ionic mechanisms. Based on the theoretical studies of Zhang et al. (2013), it was concluded that levoglucosan formation via the levoglucosan chain-end intermediate in the transglycosylation reaction is the most reasonable pathway. The levoglucosan yield can be as high as 60 w%, but other anhydrosugars are also formed, together with pyrans, furans, light oxygenate gases and char. Levoglucosan and the other most abundant products of cellulose degradation in the temperature range of 350 -550 °C are presented in Table 2.

15
Table 2. Main degradation products formed in cellulose pyrolysis in the temperature range of 350-550 °C (Mettler et al., 2012; Paulsen et al., 2013; Wu et al., 2016).
Compounds Anhydrosugar Light oxygenates Levoglucosan Methyl glyoxal 1,6-Anhydroglucofuranose Glucolaldehyde 1,4:3,6-Dianhydroglucopyranose Formaldehyde Levoglucosanone Hydroxyacetone Pyrans Acetic acid 1,5-Anhydro-4-deoxy-D-glycero-hex-1-en-3-ulose Formic acid 2,3-Dihydro-3,5-dihydro-6-methyl-4H-pyran-4-one Puryvic acid 3,5-Dihydroxy-2-methyl-4H-pyran-4-one 2,3-butanedione Furans Glyoxal Hydroxymethylfurfural Permanent gases Furfural Carbon monoxide 5-Methylfurfural Carbon dioxide 2-Furanmethanol Other 2,5-Dimethyfuran 2-Hydroxy-3-methyl-2-cyclopenten-one 2-Methyl furan 1,2-Cyclopentanedione Furan Char 2,5-Dimethyl-4-hydroxy-3(2H)-furanone 2(5H) Furanone
3.3 Hemicelluloses
Hemicelluloses are heteropolysaccharides composed of various sugar units and with a much shorter, and branched, molecular chain than that of cellulose. Sugar units (anhydrosugars) making up the polyoses can be subdivided into groups such as pentoses, hexoses, hexuronic acids and deoxy-hexoses. The main hemicellulose of softwood is galactoglucomannan, but low quantities of xylan (arabinoglucuronoxylan) are also present. Hardwood is composed mainly of glucuronoxylan and minor amounts of glucomannan (Fengel and Wegener, 1989; Sjöström and Alen, 1999). In herbaceous crops, xylan is the most abundant hemicellulose. Partial chemical structures of hardwood hemicelluloses are shown in Table 7. Pectins, com-posed mainly of galacturonans, are present at less than 1% in both softwoods and hardwoods (Fengel and Wegener, 1989).
16
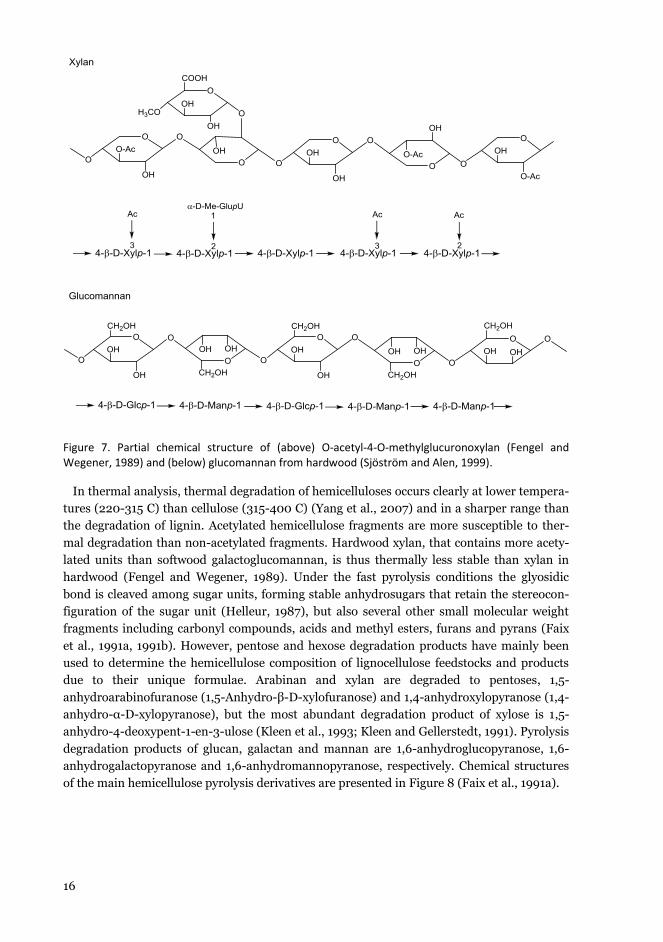
Figure 7. Partial chemical structure of (above) O-acetyl-4-O-methylglucuronoxylan (Fengel and Wegener, 1989) and (below) glucomannan from hardwood (Sjöström and Alen, 1999).
In thermal analysis, thermal degradation of hemicelluloses occurs clearly at lower tempera-tures (220-315 C) than cellulose (315-400 C) (Yang et al., 2007) and in a sharper range than the degradation of lignin. Acetylated hemicellulose fragments are more susceptible to ther-mal degradation than non-acetylated fragments. Hardwood xylan, that contains more acety-lated units than softwood galactoglucomannan, is thus thermally less stable than xylan in hardwood (Fengel and Wegener, 1989). Under the fast pyrolysis conditions the glyosidic bond is cleaved among sugar units, forming stable anhydrosugars that retain the stereocon-figuration of the sugar unit (Helleur, 1987), but also several other small molecular weight fragments including carbonyl compounds, acids and methyl esters, furans and pyrans (Faix et al., 1991a, 1991b). However, pentose and hexose degradation products have mainly been used to determine the hemicellulose composition of lignocellulose feedstocks and products due to their unique formulae. Arabinan and xylan are degraded to pentoses, 1,5-anhydroarabinofuranose (1,5-Anhydro-β-D-xylofuranose) and 1,4-anhydroxylopyranose (1,4-anhydro-α-D-xylopyranose), but the most abundant degradation product of xylose is 1,5-anhydro-4-deoxypent-1-en-3-ulose (Kleen et al., 1993; Kleen and Gellerstedt, 1991). Pyrolysis degradation products of glucan, galactan and mannan are 1,6-anhydroglucopyranose, 1,6-anhydrogalactopyranose and 1,6-anhydromannopyranose, respectively. Chemical structures of the main hemicellulose pyrolysis derivatives are presented in Figure 8 (Faix et al., 1991a).

17
Figure 8. Pentose and hexose pyrolysis derivatives of cellulose and hemicelluloses (Faix et al., 1991a).

18
4. Applications of analytical pyrolysis in ligno-cellulosic processing
4.1 Macromolecular biomass components
4.1.1 Wood fibres
Analytical pyrolysis combined with gas chromatography mass spectrometry (Py-GC/MS) has widely been used to determine lignin and carbohydrate composition from various lignocellu-lose feedstocks and products directly, especially from wood fibres. Both softwood and hard-wood species have been classified based on their pyrolysis degradation products with (Challinor, 1995; Clifford et al., 1995) and without derivatisation (Kuroda and Yamaguchi, 1995; Saiz-Jimenez and De Leeuw, 1986). Pyrolysis degradation products of lignin have been used to distinguish between pine, spruce and larch softwood species and the location inside the species, but also to identify different tissue types (Alves et al., 2009). Degradation prod-ucts of both lignin and polysaccharides formed from oak species have been found to classify oaks based on their origin (Nonier et al., 2006). Lignin content has been determined by Py-GC/MS directly from softwoods, without the need for external or internal calibration. Lignin content has been determined by dividing the sum of peak areas of lignin degradation prod-ucts by the sum of all degradation products present in chromatograms (Alves et al., 2008, 2006).
The Py-GC/MS technique has increasingly been used to determine the S/G/H ratio from different wood species, but especially the S/G ratio from hardwood species. G/H ratios de-termined by Py-GC/MS have been found to distinguish between compression and native young Pinus radiata wood (Nanayakkara et al., 2016). S/G ratios have been found to vary within a single tree (Yokoi et al., 1999), but the wood provenance (Rodrigues et al., 1999), eccentric growth (Rodrigues et al., 2001), and seeds of different origin (Yokoi et al., 2001) may also have an effect. S/G ratios have been determined from wood feedstocks meant for pulp production, such as various Eucalyptus spp. (del Río et al., 2005; Lima et al., 2008) and Eucalyptus spp. wood clones cultivated in four regions in Brazil (Barbosa et al., 2008; Nunes et al., 2010; Yokoi et al., 2001). Selected lignin pyrolysis degradation products have been used to distinguish between different eucalypt species and geographical origins, but also to predict the ease of delignification of the resulting pulps measured as active alkali consump-tion (Galetta et al., 2014). Lignin pyrolysis derivatives as well as S/G ratios of various Euca-lyptus spp. with (González-Vila et al., 1999) and without derivatisation (Reina et al., 2014) have been used to estimate ease of delignification and alkali consumption.
Py-GC/MS has been used to characterise lignin structure and S/G/H ratios together with other techniques (2D-NMR, thioacidolysis and derivatisation followed by reductive cleavage) after lignin isolation from different eucalypt species (Rencoret et al., 2008) and hybrids
19
(Prinsen et al., 2012) and tissues of Quercus suber (Lourenço et al., 2016). Changes in lignin and carbohydrate composition and yield after the isolation of lignin carbohydrate complexes from spruce wood has been monitored by Py-GC/MS together with 2D-NMR (Du et al., 2014).
Thermochemolysis with various reagents has been utilised to obtain more detailed infor-mation on lignin structure and functional groups. Thermochemolysis with TMAH has been used to determine lignin composition from different species such as spruce (Hardell and Nilvebrant, 1996), beech leaf litter (Hermosin and Saiz-Jimenez, 1999) and eucalypt (González-Vila et al., 1999). Free and etherified phenolic lignin units have been distinguished by Py-GC/MS by analysing pre-methylated samples (Camarero et al., 1999). Thermochemol-ysis with trimethylsilylation reagent has been found to provide useful information concerning the cinnamyl alcohol and cinnamyl aldehyde end-groups, whereas thermochemolysis with TMAH provides information only on cinnamyl alcohol end-groups (Kuroda, 2000a; Nakagawa-Izumi and Kuroda, 2003).
Changes in both carbohydrate and lignin composition have been determined by Py-GC/MS from surface and inner layers of pulp fibres after different alkaline cooking processes (Sjöberg et al., 2002; Tanaka et al., 1997) and from pulp fibres in cooking (Kleen et al., 1993; Lourenço et al., 2013, 2012), but also from wood fibres after fungal degradation (del Río et al., 2002, 2001a; Martínez et al., 2005), hydrothermal treatment (Grinins et al., 2013), hy-drothermal carbonisation (Wikberg et al., 2016), genetic modification (Meier et al., 2005) and from archaeological wood (Łucejko et al., 2012). Lignin structure has been followed ex-tensively directly from pulps or isolated lignin fractions after various alkaline cooking pro-cesses (Choi et al., 2001; Prinsen et al., 2013), oxygen delignification (Akim et al., 2001; Ibarra et al., 2005; Lima et al., 2015), bleaching (del Río et al., 2001b; Ibarra et al., 2007), and mediator-laccase delignification (Oudia et al., 2009, 2007; Tamminen et al., 2003a). Changes in S/G ratios of eucalypt species have been followed directly from wood and pulps after cooking, oxygen delignification and bleaching (Hasumi et al., 2009; Lima et al., 2015). Delignification kinetics of syringyl and guaiacyl units in heartwood and sapwood of Eucalyp-tus globulus have been investigated by Py-GC-MS/FID and modelled as double first-order reactions (Lourenço et al., 2012). Lignins dissolved during alkaline cooking (Prinsen et al., 2013) and organosolv cooking (Kangas et al., 2015) have been characterised by Py-GC/MS together with other techniques (2D-NMR, 31P NMR, SEC) in order to obtain more infor-mation on delignification mechanisms. Py-GC/MS analysis of non-hydrolysed residues from different bioethanol production methods from softwood provided useful information con-cerning fermentation processes, i.e. the efficiency of cellulose hydrolysis (Dizhbite et al., 2011).
Lignin pyrolysis degradation products together with some other chemical experiments and chemometric methods have been used to quantitatively characterize lignin structure-antioxidant activity relationships from lignins of various industrial side streams (Ponomarenko et al., 2015).
Recently, analytical pyrolysis has been increasingly utilized to simulate applied pyrolysis reactions and to obtain understanding on bio-oil composition; especially catalytic upgrading is being studied (Adam et al., 2005; Mullen and Boateng, 2010). Different zeolite catalysts have been studied for upgrading lignin-based bio-oils from Kraft lignin (Shen et al., 2015), from various industrial side streams (Mullen and Boateng, 2010), milled wood lignins and organosolv lignin from hardwood, softwood and herbaceous biomasses (Zhou et al., 2016),
20
but also from bio-oils from wood feedstocks (Ohra-aho and Linnekoski, 2015). In addition to zeolite catalyst, various Al/SBA-15 catalysts for the cracking of pyrolysis vapours of sawdust have also been studied (Qiang et al., 2009). The effect of the chemical structure of lignin on the phenolic composition of bio-oil at various temperatures has been studied by Py-GC/MS (C. Liu et al., 2016). The effects of hydrolysis pretreatment temperature and washing pH on the pyrolysis liquid product yield and quality of birch wood have been investigated. Based on the results, neutral washing pH and low hydrolysis temperature favoured the formation of lignin derivatives, anhydrosugars and especially levoglucosan (Zhurinsh et al., 2013). Catalyt-ic effects of different alkali metals, alkali earth metals and switchgrass ash on primary cellu-lose pyrolysis reactions at various temperatures showed that mineral salts and high tempera-ture accelerated the reaction. These parameters led to the formation of low molecular weight compounds instead of levoglucosan from pure cellulose (Patwardhan et al., 2010), as well as from different hardwood and softwood species (Müller-Hagedorn et al., 2003).
4.1.2 Alternative biomass sources (non-wood)
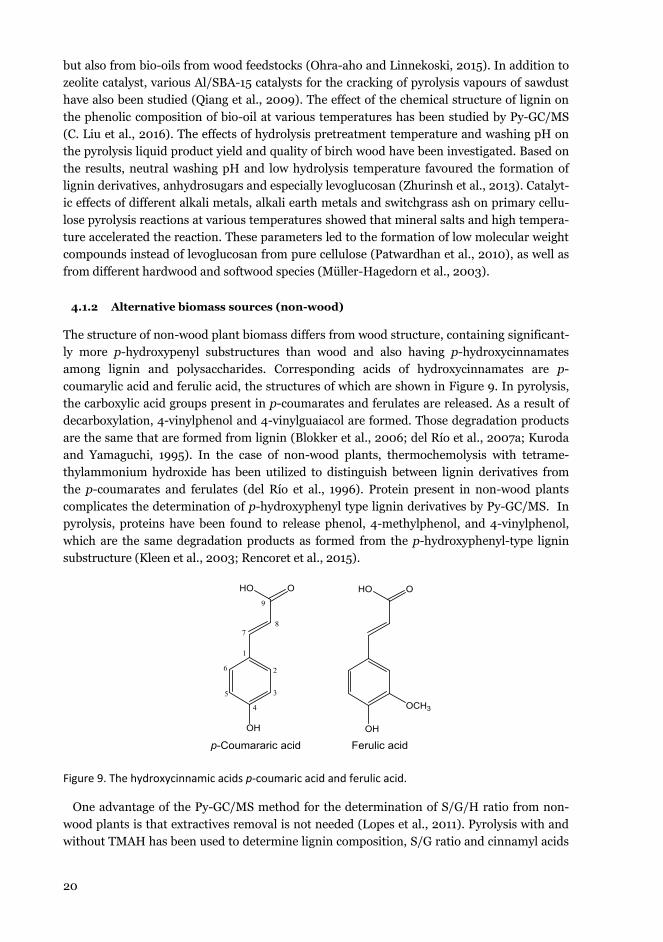
The structure of non-wood plant biomass differs from wood structure, containing significant-ly more p-hydroxypenyl substructures than wood and also having p-hydroxycinnamates among lignin and polysaccharides. Corresponding acids of hydroxycinnamates are p-coumarylic acid and ferulic acid, the structures of which are shown in Figure 9. In pyrolysis, the carboxylic acid groups present in p-coumarates and ferulates are released. As a result of decarboxylation, 4-vinylphenol and 4-vinylguaiacol are formed. Those degradation products are the same that are formed from lignin (Blokker et al., 2006; del Río et al., 2007a; Kuroda and Yamaguchi, 1995). In the case of non-wood plants, thermochemolysis with tetrame-thylammonium hydroxide has been utilized to distinguish between lignin derivatives from the p-coumarates and ferulates (del Río et al., 1996). Protein present in non-wood plants complicates the determination of p-hydroxyphenyl type lignin derivatives by Py-GC/MS. In pyrolysis, proteins have been found to release phenol, 4-methylphenol, and 4-vinylphenol, which are the same degradation products as formed from the p-hydroxyphenyl-type lignin substructure (Kleen et al., 2003; Rencoret et al., 2015).
Figure 9. The hydroxycinnamic acids p-coumaric acid and ferulic acid.
One advantage of the Py-GC/MS method for the determination of S/G/H ratio from non-wood plants is that extractives removal is not needed (Lopes et al., 2011). Pyrolysis with and without TMAH has been used to determine lignin composition, S/G ratio and cinnamyl acids

21
directly from non-wood biomasses such as sago palm, jute, hemp, flax, sisal and abaca (del Río et al., 2007a; Gutiérrez et al., 2006; Kuroda et al., 2001), core and bast fibres of kenaf (Kuroda et al., 2005, 2002), but also lignins isolated from wheat straw (del Río et al., 2012), coconut (Rencoret et al., 2013) and brewer’s spent grain (Rencoret et al., 2015). Lignin from sugarcane bagasse and wheat straw has been characterized by Py-GC/MS directly and after isolation (del Río et al., 2015). The effect of harvesting time on kenaf bast lignin S/G ratio was evaluated by Py-GC/MS. Based on the results, a harvesting time of 5 months provided a raw material that was most suitable for the delignification (Mazumder et al., 2005). For the opti-misation of bio-oil production from palm kernel shell its phenolic lignin units have been de-termined by Py-GC/MS (Chang et al., 2016). 5-hydroxyguaiacyl lignin unit has been identi-fied by Py-GC/MS from non-wood plants (del Río et al., 2007b).
In addition to structural analysis, wheat straw lignin has been quantified by Py-GC/MS us-ing 1,3,5-trimethoxybenzene as an internal standard (Bocchini et al., 1997). A linear relation-ship between lignin pyrolysis degradation products and the Klason lignin content of various grasses was observed (Fahmi et al., 2007). Thermochemolysis with TMAH has been used to determine the p-coumaric and ferulic acid ratio and quantity from different fossil plant mate-rials (Blokker et al., 2006).
Pre-methylation prior to Py-GC/MS has been used to evaluate changes in free phenolic lig-nin structures and S/G/H ratios during fungal treatment of wheat straw (Camarero et al., 2001; Martínez et al., 2001). Changes in lignin in angiosperm and woody plants after genetic modification (Rencoret et al., 2016) and in bamboo lignin after organosolv treatment (Bai et al., 2013) have also been evaluated by Py-GC/MS. Py-GC/MS together with thermogravimet-ric analysis has been used to evaluate the thermal behaviour of wheat straw lignin in order to provide data and kinetic information necessary for the evaluation of the pyrolysis process and products formed as a means to use wheat straw lignin for energy and chemicals (Yang et al., 2010).
4.2 Low molecular weight compounds
4.2.1 Extractives
The lignocellulosic biomasses contain small amounts of low molecular weight extractives that have also been analysed by Py-GC/MS, mainly using thermochemolysis technique (Challinor, 2001; Shadkami and Helleur, 2010). Derivatisation has been used in order to avoid decar-boxylation of acid groups present in the extractives. Extractives composition can be deter-mined from natural materials directly (Niemi et al., 2012) and after solvent extraction (Challinor, 1996). Thermochemolysis with TMAH and TMAAc reagents together have been used to determine wood resin acids and fatty acids (Hardell and Nilvebrant, 1999; Mizumoto et al., 2010), and the composition of natural waxes (Asperger et al., 2001). TMAH is used to define total fatty acids, whereas TMAAc defines only the free fatty acids. Thermochemolysis with TMAAc has been used to determine fatty acids, phenolic acids and gallocatechin com-pounds directly from Eucalyptus camaldulensis wood. Similar results were obtained by the conventional standard method including off-line transmethylation of acetone extracts and GC analysis (Yokoi et al., 2003). The main disadvantage of TMAH is that polyunsaturated fatty acids are isomerized and partly degraded at high concentrations of this strong base. Di-lution of TMAH has been found to diminish the isomerisation (Jun-kai et al., 1997). TMSH is

22
another alkaline reagent which does not isomerize polyunsaturated fatty acid. Therefore its reactivity to determine fatty acids containing saturated, monounsaturated and polyunsatu-rated fatty acid from triglycerides, phospholipids, free fatty acids and cholesteryl esters has been evaluated together with TMAH. The results showed that TMAH allowed almost quanti-tative methylation of saturated and mono-unsaturated fatty acid components independently of the classes of lipids, but polyunsaturated fatty acids were isomerized and partly degraded. TMSH was effective in determining quantitatively all types of fatty acids including polyun-saturated fatty acids from triglycerides, free fatty acids and phospholipids, the exception be-ing cholesteryl ester. TMSH was unable to react with cholesteryl ester due to steric hindrance (Ishida et al., 2009). In addition to TMAAc, TEAAc has been used together with more basic thermochemolysis reagents (TMAH and TBAH) for the analysis of lipids from natural mate-rials (Guignard et al., 2005; Válková et al., 2009). The advantage of TEAAc is that naturally occurring methyl esters can be distinguished from the free acids. Phenolic extractives have been determined directly from wood by thermochemolysis with TBAH. TBAH reacts only with free acids and hydroxyl groups and thus phenolic extractives can be distinguished from lignin derivatives (Ishida et al., 2009). Derivatisation of sample with trimethylsilyl diazome-thane (TMS- diazomethane) prior to thermochemolysis with TMSH enables analysis of cate-chins and condensed tannins from plants (Shadkami et al., 2009). Thermochemolysis with 13C-labeled TMAH has been used to distinguish between tannin and lignin phenolic degrada-tion products from soil samples (Nierop and Filley, 2008). Based on the pyrolysis degrada-tion products of monomeric and dimeric flavanols, different types of condensed tannins can be distinguished from bark extracts of Salix species and Acacia mearnsii (Ohara et al., 2003).

23
5. Experimental
5.1 Materials and methods
All materials and methods, including the analytical pyrolysis methods used in Publications I-VI, are summarized in Table 3. More detailed descriptions of the materials and methods are presented in the original Publications.
5.1.1 Material preparation
Synthesis of guaiacyl palmitate and 2-nonylpalmitate The structures of esters for the thermochemolysis study presented in Publication III are shown in Figure 10. The syntheses of the products are here described briefly. Palmitic acid and guaiacol or 2-nonanol together with 4-dimethylaminopyridine were dissolved in di-chloromethane and cooled to 0°C. This was followed by addition of dicyclohexanecar-bodiimide portion-wise in a dichloromethane solution. The reaction was left at room temper-ature overnight and was then filtered to remove solids. The filtrate was evaporated and the crude product was purified by flash chromatography from heptane, increasing the polarity with ethanol. The yields of guaiacyl palmitate and 2-nonylplmitate were 83 % and 72 %, re-spectively.
Figure 10. The model compounds guaiacyl palmitate and 2-nonylpalmitate synthesized for the ther-mochemolysis study reported in Publication III.

24
Tabl
e 3.
Mat
eria
ls, p
yrol
ysis
cond
ition
s and
stan
dard
ana
lysis
met
hods
use
d fo
r the
stud
y
Publ
icat
ion
I I IV
VI
VI
II
III
V
Oth
er m
etho
ds
Kap
pa n
umbe
r ac
cord
ing
to
SCA
N-C
1 an
d he
xenu
roni
c ac
id c
onte
nt w
as d
eter
min
ed
by H
PLC
aft
er e
nzym
atic
hy-
drol
ysis
acc
ordi
ng to
met
hod
by T
enka
nen
et a
l., (1
999)
S/G
rat
io w
ith
nitr
oben
zene
ox
idat
ion
follo
wed
by
HPL
C
(Lin
and
Den
ce, 1
992)
Car
bohy
drat
e co
mpo
siti
on
usin
g ac
id h
ydro
lysi
s fo
llow
ed
by H
PLC
(Wal
lis e
t al.,
199
6)
Car
bohy
drat
e co
mpo
siti
on
usin
g ac
id h
ydro
lysi
s fo
llow
ed
by H
PLC
(Wal
lis e
t al.,
199
6)
1 H
NM
R
Ther
moc
hem
olys
is
TMA
H
400
°C, 4
s
TMA
Ac:
280
°C
, 2 s
TM
AH
: 600
°C
, 70
0 °C
, 800
°C
ea
ch 2
s
TMA
H: 6
00 °
C, 2
s
Frac
tion
ated
py
roly
sis
320
°C, 4
0 s
480
°C, 1
2 s
620
°C, 4
s
800
°C, 2
s
320
°C, 4
4 s
450
°C, 1
6 s
580
°C, 4
s
800
°C, 2
s
320
°C, 4
4 s
450
°C, 1
6 s
580
°C, 4
s
800
°C, 2
s
Isot
herm
al
pyro
lysi
s
580
°C,
2 s
580
°C,
2 s
580
°C,
2 s
600
°C,
2 s
Ther
mal
de
sorp
tion
150
°C, 5
min
and
19
0 °C
, 5 m
in
Mat
eria
ls
Labo
rato
ry E
CF-
light
ble
ache
d pi
ne (P
inus
silv
estr
is)
Kra
ft p
ulps
Labo
rato
ry o
xyge
n de
ligni
fied
EC
F bl
each
ed s
pruc
e ( P
icea
ab
ies)
Kra
ft p
ulps
Eig
htee
n 7-
year
-old
euc
alyp
t hyb
rids
, inc
ludi
ng a
num
ber
of d
oubl
e/tr
iple
/fou
rth
cros
sing
s am
ong
E. g
rand
is, E
. ur
ophy
lla, E
. glo
bulu
s, E
. dun
nii a
nd E
. cam
aldu
lens
is
spec
ies
Labo
rato
ry-p
repa
red
soda
-O2 a
nd s
oda-
AQ
pul
ps o
f Euc
a-ly
pt h
ybri
d G
1xU
GL
(E. g
rand
is (C
offs
Har
bour
) x [E
. ur
ophy
lla (R
) x E
. glo
bulu
s (R
)]) a
t diff
eren
t deg
rees
of
delig
nific
atio
n (ĸ
= 5
0, 3
5 an
d 15
)
Soft
woo
d K
raft
lign
ins
trea
ted
with
and
wit
hout
lacc
ase
(and
sul
fhyd
ryl o
xida
se, A
sper
gillu
s or
yzae
) at p
H 8
and
ox
idat
ion
at p
H 1
0
Gua
iacy
l pal
mita
te
and
2-no
nyl p
alm
itat
e
BSG
and
its
ligni
n fr
acti
ons
P-A
EF
(Nie
mi e
t al.,
201
2),
INS
(Aur
a et
al.,
201
3), A
L an
d E
MA
L

25
Isolation of lignin-rich fractions from BSG Lignin isolation from the BSG by enzymatic hydrolysis to soluble (P-AEF) and insoluble (INS) lignin-rich fractions was described in more detailed publications by Aura et al. (2013) and Niemi et al. (2012). However, the scheme of the isolation is shown in Figure 11 a. Frac-tionations of BSG by acidolysis (AL) and enzymatic mild acidolysis (EMAL) are also shown in Figure 11. Prior to lignin isolation by AL and EMAL, BSG was dried and milled with a Retch S100 ball mill (Figure 11, Publication VI). After the milling, extractives were removed with hexane in a Soxhlet apparatus. Reduction of protein content was carried out with Alcalase 2.4 L (20 μl/g of dry material). Acidolysis was performed according to the method of Gellerstedt et al., (1994) The conditions used in acidolysis are shown in Figure 11. Dissolved lignin was precipitated with 0.01 M HCl at 4 °C overnight. Isolation of EMAL was performed according to Guerra et al., (2006), with some modifications. BSG material after the protease treatment was subjected to carbohydrate digestion with Depol740 and Celluclast 1.5 treatment at pH 4.5 and 50 °C for 48 h. This was followed by mild acidolysis with 0.01 M HCl and lignin pre-cipitation from the solution similarly to the procedure used after the acidolysis (Figure 11).
Figure 11. Scheme for the BSG fractionation by enzymatic hydrolysis (left) (Aura et al., 2013; Niemi et al., 2012) and acidolysis and enzymatic mild acidolysis (right).

26
5.1.2 Pyrolysis techniques
Instrument All pyrolysis measurements in the Publications I-VI were performed with a platinum foil pulse pyrolyser (Pyrola2000®, Pyrol AB, Lund, Sweden), which was connected to a GC/MS instrument (Varian 3800 GC/2000 MS, Walnut Creek, USA). Figure 12 shows the pyrolysis unit. For the separation of degradation products, a mid-polar capillary column coated with a stationary phase of 14% cyanopropyl-phenyl 86% dimethyl polysiloxane (J&W, DB-1701, 30 m x 0.25 mm, film 1 μm) was used. The mass spectra of the products were obtained using ion trap mass spectrometry (EI 70 eV). The detector mass range was selected based on the mate-rial studied. In the cases of isothermal pyrolysis results, peak identifications were carried out according to the literature (Faix et al., 1991a, 1991b, 1990a, 1990b; Ralph and Hatfield, 1991) and commercial mass spectra Nist92 and Nist05 libraries.
Figure 12. Resistively heated filament pyrolyzer
Isothermal and fractionated pyrolysis Isothermal pyrolysis of wood and pulp samples was carried out at 580 °C. The pyrolysis time was 2 s. The temperature was selected because it gave the best yield for the lignin degrada-tion products. Short pyrolysis time was favoured in order to avoid secondary reactions in py-rolysis. Pyrolysis of brewer’s spent grain and its lignin fractions was carried out at 600 °C, a slightly higher temperature than used for wood and pulp samples. A temperature of 600 °C was selected because thermochemolysis in the presence of TMAH was carried out at that temperature. Fractionated pyrolysis results were reported in two different Publications, I and VI. The conditions used for the fractionated pyrolysis were slightly different in Publications I and VI (Table 3). This was due to the different aims of the fractionation pyrolysis. Publication I focused on lignin and Publication VI on carbohydrate thermal behaviour.
Thermal desorption Thermal desorption measurements were carried out in a pyrolyser unit. A more detailed de-scription of the GC/MS conditions is described in Publication II. The measurements were carried out utilizing the chamber temperature only. This was possible because the tempera-tures used for the study, 150 and 190 °C, were lower than the maximum allowed chamber temperature of 225 °C. The samples were placed in special glass boats made for thermal de-

27
sorption purposes. Therefore it was also possible to use higher amounts of sample, about 2.5 mg for the thermal desorption analysis in comparison to 100 μg used for pyrolysis measure-ments. For the quantitative analysis, standard solutions of guaiacol in amounts of 1.5-6 μg were prepared (R2 = 0.96). A pyrolysis probe for the liquid injections was used for guaiacol standard. Thermochemolysis Thermochemolysis technique was utilized in Publications I, III and V. All thermochemolysis measurements were performed on-line in Py-GC/MS instruments. Depending on the materi-al studied, slightly different conditions were used as shown in Table 3. In Publications I and V, thermochemolysis was carried out using TMAH, aiming at obtaining structural infor-mation concerning lignin. Thermochemolysis results were compared in these studies with isothermal pyrolysis results.
Publication III reported the results obtained when two model compounds, guaiacyl palmi-tate and 2-nonyl palmitate (Figure 10), which contained both aromatic and aliphatic ester bonds, were analysed with two methylation reagents TMAH and TMAAc, aiming at determin-ing the total fatty and free fatty acids contents, respectively. A short reaction time of 2 sec-onds was favoured with both reagents. TMAH thermochemolysis was performed at 600ºC, whereas a lower temperature of 280 °C was used for TMAAc thermochemolysis in order to prevent thermal degradation of the ester bond. A thermochemolysis temperature of 600ºC was selected because at that temperature the highest recovery for the fatty acids with TMAH has been obtained (Drechsel et al., 2003). Overloading of the detector was avoided by dilut-ing both model compounds as well as the internal standard heneicosanoic acid to solvent (methanol or dichloromethane) before transferring to the filament. In TMAH thermochemol-ysis, sample together with internal standard was added to the filament prior to the TMAH reagent. In the case of TMAAc thermochemolysis, reagent was mixed with sample either be-fore or after the addition of sample and internal standard. The results were similar. There-fore, average values were calculated for all the measurements. Data analysis The peak areas of lignin and carbohydrate degradation products were integrated as a total ion current (TIC) or using selected main ions (m/z). The selected peak ions were used in case of the peak intensities were low or there existed co-eluted peaks in the total ion current gas chromatogram. The ions that were used for the integration are listed in Table 4. The peak areas that were calculated with selected ions were converted to the corresponding total peak areas using factors calculated from the pure mass spectrum of each compound as was report-ed by Sjöberg (Sjöberg et al., 2002). Monosaccharide content was calculated, including 1,4-anhydroxylopyranose, 4-hydroxy-5,6-dihydro-(2H)-pyran-2-one, 1,5-anhydroarabinofurano-se, 1,6-anhydrogalactopyranose, 1,6-anhydroglucopyranose and 5-hydroxymethyl-2-tetra-hydofuraldehyde-3-one, 5-hydroxymethyl-2-furaldehyde and 1.4-dideoxy-D-glycero-hex-1-enopyranos-3-ulose to determine xylose (two first compounds), arabinose, galactose and glu-cose (four last compounds), respectively. Two methods for the calculation of monosaccha-ride content were used. In method A cellulose derivative, 1,6-anhydroglucopyranose (levoglu-cosan) was used for the calculation of glucose, whereas in method B the four main degrada-tion products of cellulose, 1,6-anhydroglucopyranose, 5-hydroxymethyl-2-

28
tetrahydofuraldehyde-3-one, 5-hydroxymethyl-2-furaldehyde and 1.4-dideoxy-D-glycero-hex-1-enopyranos-3-ulose were included.
For the lignin structure evaluation peak areas of lignin degradation products were divided by the weight of the sample and peak areas were normalized to 100 %. For the lignin quanti-tative analysis from alkaline softwood pulps (Publication I), a one point external standard calibration using Kraft lignin as a standard was used.
Principal component analysis All guaiacyl and syringyl type lignin pyrolysis products integrated from pyrograms of euca-
lypt hybrids were normalized to 100% separately (Publication IV). Thereafter the data was subjected to multivariate data analysis SIMCA-P 8.1 (Umetrics AB, Umeå, Sweden). Principal component analysis (PCA) is designed for visualization of similarities and differences among samples. It presents the data in two- or three-dimension so that the major trends and domi-nant patterns can be overviewed. Principal components that are obtained describe the vari-ance of the data. The first principal component (PC1) describes the largest variance in the data set. A second component (PC2) is orthogonal to PC1 and it reflects the second largest source of variation in the data. Two principal components were calculated for the data set in Publication IV, because the third component did not improve the model.

29
Table 4. Pyrolysis degradation products of lignocellulosic materials in isothermal pyrolysis and the origin of degradation products. Ions listed were used to integrate degradation products when inten-sities of degradation products were low or co-eluted peaks existed. Multiplication factors were used to convert peak the selective ion peak areas to corresponding total ion current (TIC) areas.
Compound Origin Ions (m/z) Factor Phenol Lg/prot 65, 66, 94 1.5 2-Methylphenol Lg/prot 77, 107, 108 2.2 4-Methylphenol Lg/prot 77, 107, 108 2.2 4-Vinylphenol Lg/prot/FA TIC 1.0 Guaiacol Lg 81, 109, 124 1.6 4-Methylguaiacol Lg 67, 123, 138 2.0 4-Ethylguaiacol Lg 122, 137, 152 2.2 4-Vinylguaiacol Lg/pCA 135, 107, 150 2.1 Eugenol Lg 77, 149, 164 3.8 cis-Isoeugenol Lg 77, 149, 164 3.9 trans-Isoeugenol Lg 77, 149, 164 3.5 Vanillin Lg 123, 151, 152 2.4 Homovanillin Lg 122, 137, 166 2.0 Acetoguaiacone Lg 123, 151, 166 2.1 Guaiacylacetone Lg 122, 137, 180 2.7 4-(Oxy-allyl)guaiacol Lg 123, 151, 178 2.7 4-(1-Hydroxyprop-2-enyl)guaiacol Lg 124, 137, 180 3.1 Dihydroconiferyl alcohol Lg 122, 137, 182 2.9 cis-Coniferyl alcohol Lg 124, 137, 180 4.0 trans-Coniferyl alcohol Lg 137, 163, 180 2.7 Coniferaldehyde Lg 135, 147, 178 5.5 Syringol Lg 139, 154 2.9 4-Methylsyringol Lg 153, 168 3.3 4-Ethylsyringol Lg 167, 182 2.5 4-Vinylsyringol Lg 165, 180 3.0 4-Allylsyringol Lg 179, 194 5.3 cis-Propenylsyringol Lg 179, 194 6.8 trans-Propenylsyringol Lg 179, 194 4.5 Syringaldehyde Lg 167, 181, 182 3.0 Homosyringaldehyde Lg 167, 196 2,7 Acetosyringone Lg 181, 196 2.8 Syringylacetone Lg 167, 210 2.3 Propiosyringol Lg 181, 210 2.4 4-(Oxy-allyl)syringol Lg 181, 208 4.5 4-(1-Hydroxy-prop-2-enyl)syringol Lg 167, 210 5.3 Dihydrosinapyl alcohol Lg 167, 168, 212 2.9 cis-Sinapyl alcohol Lg 167, 210 4.5 trans-Sinapyl alcohol Lg 167, 210 7.5 Sinapaldehyde Lg 208 8.1 4-Hydroxy-5,6-dihydro-(2H)-pyran-2-one Ch TIC 1 1,4-Anhydroxylopyranose Ch TIC 1 1,5-Anhydroarabinofuranose Ch TIC 1 1,6-Anhydrogalactopyranose Ch 60 4,2 5-Hydroxymethyl-2-furaldehyde Ch TIC 1 5-Hydroxymethyl-2-tetrahydofuraldehyde-3-one Ch TIC 1 1.4-Dideoxy-D-glycero-hex-1-enopyranos-3-ulose Ch TIC 1 1,6-Anhydroglucopyranose (levoglucosan) Ch TIC 1
Lg = lignin, Prot=protein, FA = Ferulic acid, pCA = p-Coumaric acid, Ch = carbohydrate, TIC=total ion cur-rent

30
6. Results and discussion
6.1 Applications in pulping chemistry
Wood raw materials for alkaline pulping and pulps after cooking and bleaching were charac-terized by Py-GC/MS. Observed differences in lignin structure between different wood spe-cies and clones based on pyrolysis degradation products were evaluated (Publications I and IV). The structure and quantity of aromatic fibre components were followed during alkaline pulping (Publications I and VI). Carbohydrate composition in eucalypt wood and pulps were determined by Py-GC/MS and the results were compared with those obtained by acid hydrol-ysis followed by HPLC (Publication VI).
6.1.1 Lignin structure in different wood types (I, IV)
The Py-GC/MS technique makes lignin analysis possible without prior isolation from wood. Lignin degradation products are well separated from the carbohydrate degradation products. This can be seen from pyrograms (Figure 13) of softwood pine (Pinus silvestris) (Publication I) and hardwood eucalypt hybrid G1xUGL (E. grandis (Coffs Harbour) x [E. urophylla (R) x E. globulus (R)]), which is one of the eighteen 7-year-old eucalypt hybrids studied as a raw material for pulping (Publications IV and VI). The result in Figure 13 shows that the pyrolysis degradation products of lignin from the softwood pine were mainly guaiacyl type, whereas hardwood eucalyptus lignin produced both syringyl and guaiacyl type degradation products. A few p-hydroxyphenyl type degradation products were also detected from both wood types. The side chain structures of guaiacyl type degradation products in both wood types and with syringyl type degradation products were similar. Both wood raw materials showed high con-tents of oxygen-rich pyrolysis degradation products, referred to as peak numbers 13, 15-16, 18, 20-21, 24-37 in Figure 13. This is due to the high content of phenolic β-O-4 linkages to-gether with cinnamyl and sinapyl alcohol-end groups present in native wood lignin (Akazawa et al., 2016; Brezny et al., 1983; Kuroda, 2000b).

31
Figure 13. Pyrograms of softwood pine and hardwood eucalypt hybrid G1xUGL (E. grandis (Coffs Har-bour) x [E. urophylla (R) x E. globulus (R)]) obtained at 580 °C.
Peak identities of carbohydrate derivatives: a 1,5-Anhydro-4-deoxypent-1-en-3-ulose (xyl); b 5-Hydroxymethyl-2-tetrahydrofuraldehyde-3-one (glc); c 1,5-Anhydroarabinofuranose (ara); d 5-Hydroxymethyl-2-furaldehyde (glc); e 1.4-Dideoxy-D-glycero-hex-1-enopyranose-3-ulose (glc); f 1,5-Anhydroxylopyranose (xyl); g 1,6-Anhydrogalactopyranose (gal); h 1,6-Anhydromannopyranose (man); i 1,6-Anhydroglucopyranose (glc) Peak identities of lignin derivatives: 1 Phenol (H); 2 Guaiacol (G); 3 2-Methylphenol (H); 4 4-Methylphenol (H); 5 4-Methylguaiacol (G); 6 4-Ethylguaiacol (G); 7 Vinylguaiacol (G); 8 Eugenol (G); 9 Syringol (S); 10 cis-Isoeugenol (G); 11 trans-Isoeugenol (G); 12 4-Methylsyringol (S); 13 Vanillin (V); 14 4-Ethylsyringol (S); 15 Homovanillin (G); 16 Acetoguaiacone (G); 17 4-Vinylsyringol (S); 18 Guai-acylacetone (G); 19 4-Allylsyringol (S); 20 4-(oxy-allyl)guaiacol (G); 21 4-(1-Hydroxyprop-2-enyl)guaiacol (G); 22 cis-Propenylsyringol (S); 23 trans-Propenylsyringol (S); 24 Dihydroconiferyl alco-hol (G); 25 Syringaldehyde (S); 26 cis-Coniferyl alcohol (G); 27 Homosyringaldehyde (S); 28 Ace-tosyringone (S); 29 trans-Coniferyl alcohol (G); 30 Syringylacetone (S); 31 Coniferaldehyde (G); 32 4-(oxy-allyl)syringol (S); 33 4-(1-Hydroxy-prop-2-enyl)syringol (S); 34 Dihydrosinapyl alcohol (S); 35 cis-Sinapyl alcohol (S); 36 trans-Sinapyl alcohol (S); 37 Sinapaldehyde (S)
Hardwood and softwood can easily be distinguished based on the Py-GC/MS results, be-cause the degradation products are different. In this study, the effect of the change of the spe-cies in eucalypt hybrids on lignin structure and thereafter lignin degradation products in Py-GC/MS was evaluated. Although the same guaiacyl and syringyl type lignin pyrolysis degra-dation products were formed, their intensities were changed when one crossing was replaced by another. By subjecting the data (Publication IV, Tables 3 and 4) to principal component analysis (PCA), a clearer indication of the structural variations of lignins between different species was observed. Eucalypt crossings were well separated from each other (a score plot, Figure 14) based on the Py-GC/MS data shown in the loading plot (Figure 15). This supports

32
the interpretation that original lignin structure varies between eucalypt hybrids. A similar phenomenon has been reported earlier (Prinsen et al., 2012; Rencoret et al., 2008; Yokoi et al., 2001).
Lignin degradation products were divided into four different sides in the loading plot, alter-ing the distribution of eucalypt hybrids in the score plot. In the first principal component direction, lignin degradation products with a carbonyl group (C=O) in the side chain were placed opposite to the degradation product with reduced short side chain (C6-C1 and C6-C2) structures. Potential sources of degradation products with a carbonyl group in the side chain and reduced short side chain structures are expected to be β-O-4 and β-5 substructures, re-spectively (Brezny et al., 1983; Kuroda and Nakagawa-izumi, 2006; Kuroda, 2000b; Ohra-aho et al., 2000). In the second component direction, eucalypt hybrids were divided based on the frequency of degradation products with and without a hydroxyl group in the propenyl side chain (C6-C3). Coniferyl alcohol and sinapyl alcohol degradation products reflect the presence of cinnamyl and sinapyl alcohol end groups in lignin, but also β-O-4 bond cleavage (Kuroda, 2000b). Formation of propenylphenols in Py-GC/MS has also been linked to cleav-age of β-O-4 bonds (Kuroda, 2000b; Watanabe et al., 2009) as a result of water loss from the hydroxyl group present in the α-position of the propenyl chain (Choi et al., 2001; Kawamoto et al., 2008). Propenylphenols have been minor components detected in the pyrolysis of β-O-4 ether type trimeric model compound (Ohra-aho et al., 2000), but present in lignins con-taining less β-O-4 substructures, such as Kraft lignin (Ohra-aho and Linnekoski, 2015). This indicates that propenylphenols have another origin.
Guaiacyl and syringyl pyrolysis degradation products with equal side chains were correlated (loading plot in Figure 15). This indicates that they have originated from similar substruc-tures present in lignin. The result emphasized the importance of using all the main degrada-tion products for the calculation of S/G ratios, rather than only selected degradation prod-ucts. Selected guaiacyl and syringyl degradation products with different side chains have been used in previous studies to determine S/G ratios (Lima et al., 2008; Nunes et al., 2010).

33
Figure 14. PCA of the pyrolysis data for eucalypt hybrids. The score plot of the two principal compo-nents shows how the samples are related to each other. The first principal component described the highest variance (44 %) and the second component the second highest variance (27 %) of the data (Publication VI).
Figure 15. Loading plot describing which guaiacyl (G) and syringyl (S) lignin structural units are im-portant for the classification of samples seen in the Score plot in Figure 14.

34
6.1.2 Lignin structure in alkaline pulps (I, V)
Eucalypt hybrid E. grandis × [E. urophylla × E. globulus], G1xUGL was used as a feedstock for the production of pulps by soda-AQ and soda-O2 cooking processes aimed at bioethanol and/or biogas production. In order to better understand the cooking performance, pulps at kappa 50, 35 and 15 were studied in more detail. Residual lignin structure from these pulps was characterised previously after isolation by acidolysis (Prinsen et al., 2013). The aim of this study was to demonstrate the possibility to determine residual lignin from alkaline pulps directly, without lignin isolation by Py-GC/MS. The results of direct analysis of residual lig-nin from soda-AQ and soda-O2 pulps have not been published earlier, but the carbohydrate compositions of the same pulps are presented in Publication VI. Due to the decreased lignin content in cooking, degradation products were integrated using selected ions as described in the method section (section 5.1.2).
The main change during cooking was the decrease of the oxygenated pyrolysis degradation products that are typical for native wood lignin (Table 5). The phenomenon was observed already at the early stage of both alkaline cooks of eucalypt wood (k=50). This means that part of the β-O-4 substructures are cleaved already in the early stage, but the degradation reaction continues throughout the cooking time. At the same time, degradation products with short side chains were increased, reflecting the cleavage of lignin side chains in cooking (Fengel and Wegener, 1989). Similar behaviour has been observed from lignins isolated from eucalypt pulps (Prinsen et al., 2013). The proportion of phenylpropenyls increased abundant-ly in the impregnation stage, but by the final stage the structures were reduced to the same level as in the wood. The total proportion of carbonyl type structures was rather stable during cooking, although some changes were observed inside the carbonyl type structures. As a re-sult of added oxygen at higher kappa values, a slightly higher proportion of carbonyl type structures was observed in soda-O2 than in soda-AQ pulps. Otherwise the changes in lignin structure were similar with both cooking types.
The result for unbleached softwood Kraft pulp (result in Publication I, and section 6.1.3) was compared with that for both unbleached alkaline hardwood pulps. Similar changes in guaiacyl type lignin degradation products were observed in unbleached softwood Kraft pulp as in both alkaline hardwood pulps in the final cooking stage (Table 5). This indicates that similar types of reaction are taking place in all types of cooking processes.

35
Table 5. Distribution of guaiacyl and syringyl type lignin pyrolysis degradation products (after normal-ization to 100 %) in eucalypt wood (G1xUGL) and soda-AQ and soda-O2 alkaline pulps, at kappa 50, 35 and 15.
Wood Soda-AQ Soda-O2 Peak Name G1xUGL k=50 k=35 k=15 k=50 k=35 k=15 Phenol 0.2 0.7 1.2 2.6 0.8 1.3 2.4 2-Methylphenol 0.1 0.3 0.5 1.0 0.4 0.6 1.1 4-Methylphenol 0.2 0.6 0.9 1.6 0.7 1.0 1.8 Guaiacol 1.1 1.6 3.1 2.0 1.8 2.0 2.1 4-Methylguaiacol 1.0 1.5 1.7 1.8 1.7 1.9 2.0 4-Ethylguaiacol 0.1 0.4 0.4 0.5 0.4 0.5 0.5 4-Vinylguaiacol 2.8 3.5 3.7 4.2 4.2 4.7 4.8 Eugenol 0.6 1.0 0.9 0.8 1.0 1.0 0.9 cis-Isoeugenol 0.4 0.6 0.6 0.0 0.6 0.6 0.4 trans-Isoeugenol 2.2 2.8 2.6 1.7 2.7 2.7 1.8 Vanillin 2.8 2.5 2.1 2.1 2.6 2.5 1.9 Homovanillin 2.5 2.9 2.7 5.4 4.1 4.4 5.8 Acetoguaiacone 1.1 1.4 1.3 1.1 1.5 1.4 1.1 Guaiacylacetone 0.4 0.9 1.0 1.6 1.6 1.8 2.0 4-(Oxy-allyl)guaiacol 1.4 0.6 0.5 0.0 0.5 0.4 0.0 4-(1-Hydroxyprop-2-enyl)guaiacol 0.7 0.6 0.6 0.0 0.6 0.6 0.0 Dihydroconiferyl alcohol 0.4 0.4 0.4 0.0 0.4 0.4 0.0 cis-Coniferyl alcohol 0.8 0.5 0.4 0.0 0.4 0.3 0.0 trans-Coniferyl alcohol 6.4 0.6 0.3 0.0 0.4 0.3 0.0 Coniferaldehyde 2.5 1.0 0.9 0.0 1.0 1.1 0.0 Syringol 5.4 6.2 7.6 9.9 6.0 6.9 8.6 4-Methylsyringol 3.7 5.2 5.8 6.1 5.0 5.4 6.0 4-Ethylsyringol 1.0 1.0 1.2 1.5 1.1 1.2 1.6 4-Vinylsyringol 7.6 9.6 10.3 10.2 9.3 9.8 9.9 4-Allylsyringol 2.9 4.3 3.9 2.5 3.7 3.3 2.7 cis-Propenylsyringol 1.6 3.1 2.9 1.5 2.6 2.2 1.7 trans-Propenylsyringol 6.3 10.9 10.3 5.3 8.8 7.8 5.3 Syringaldehyde 10.9 8.4 7.5 7.9 7.2 6.3 6.4 Homosyringaldehyde 6.5 11.6 10.8 18.9 14.7 14.7 18.7 Acetosyringone 3.8 4.7 4.6 4.8 4.3 4.2 4.7 Syringylacetone 1.5 3.1 3.4 4.0 4.3 4.8 4.8 Propiosyringol 0.3 0.4 0.5 0.0 0.4 0.4 0.0 4-(Oxy-allyl)syringol 2.8 1.2 0.9 0.0 0.8 0.5 0.0 4-(1-Hydroxy-prop-2-enyl)syringol 3.1 1.5 1.4 1.0 1.3 1.1 1.1 Dihydrosinapyl alcohol 0.7 0.4 0.2 0.0 0.3 0.0 0.0 cis-Sinapyl alcohol 2.2 0.5 0.4 0.0 0.3 0.0 0.0 trans-Sinapyl alcohol 6.1 0.0 0.0 0.0 0.0 0.0 0.0 Sinapaldehyde 5.9 3.7 2.6 0.0 2.9 2.1 0.0

36
6.1.3 Lignin structure in bleached pulps (I)
Residual lignin structure in a light ECF bleaching of pine pulps was monitored directly from pulps by Py-GC/MS without lignin isolation. As in the case of unbleached hardwood pulps, method sensitivity was increased using selected mass fragments for the integration of lignin degradation products instead of TIC (Publication I, section 5.1.2). Changes in softwood lignin structure along with delignification and bleaching were followed using guaiacyl type degrada-tion products.
Figure 16 shows distributions of guaiacyl type degradation products after the normalization to 100 % after cooking and at different stages of delignification. The proportion of pro-penylphenols (eugenol, cis-isoeugenol and trans-isoeugenol), which was slightly increased at the beginning of cooking (section 6.1.2), was constant throughout the whole bleaching se-quence. The main change after the cooking was an increase of carbonyl-type degradation products (vanillin, homovanillin, acetoguaiacone), whereas the proportion of short side chain structures (guaiacol, 4-methylguaiacol and 4-vinylguaiacol), which were abundant in un-bleached pulp, was decreased during delignification and bleaching. This indicates that the bleaching chemicals readily leached the lignin structures which had reacted during cooking, leaving the native type lignin structures present in pulp residual lignin intact. Thus, bleaching enriches the proportion of native type lignin. The results of the residual lignin isolated from a fully bleached eucalypt pulp supported this finding (Ibarra et al., 2005).
Figure 16. Distribution of guaiacyl-type lignin pyrolysis degradation products (after normalization to 100%) in pine wood chips and pulps after cooking (UB) and different ECF bleaching stages.
6.1.4 Determination of lignin substructures (S/G/H) (I, IV)
The S/G/H ratio is an important parameter to be measured from wood feedstocks intended for pulping, due to the different reactivities of substructures. The syringyl substructures have higher reactivity in alkaline pulping conditions than guaiacyl substructures (Tsutsumi et al., 1995). An increased pulp yield has been obtained for eucalypt wood with higher S/G ratios

37
(del Río et al., 2005). The S/G ratio also affects the alkali charge necessary to obtain the re-quired lignin content in Kraft pulping (Reina et al., 2014). The reactivity of p-hydroxyphenyl type substructures in wood has been found to be lower in comparison to guaiacyl type units (Akim et al., 2001). The high enrichment of p-hydroxyphenyl type units has been evident in both softwood and hardwood pulps after alkaline cooking stages (Poppius-Levlin et al., 2001; Prinsen et al., 2013; Tamminen et al., 2003a).
The lignin substructures were followed in greater detail in two Publications I and IV. Publi-cation IV reports the S/G/H ratio, particularly the S/G ratio determination from the various eucalypt hybrids used as feedstocks for pulp production. The aim was to evaluate the suitabil-ity of Py-GC/MS to determine S/G ratios from wood feedstocks in comparison to the most commonly used alkaline nitrobenzene oxidation method. Publication I reports results accord-ing to which high enrichment of p-hydroxyphenyl substructures was observed in comparison to the guaiacyl substructures during cooking and especially delignification of pine wood pulp. For a deeper analysis of the possible origin of p-hydroxyphenyl substructures, ther-mochemolysis with TMAH and fractionated pyrolysis were applied. Eucalypt raw materials Lignin substructures (S/G/H) have been determined most commonly by the oxidative degra-dation of lignin followed by analysis of the products. Suitable methods in alkaline media are nitrobenzene oxidation, oxidation with metal oxides such as cupric oxide, or with potassium permanganate followed by hydrolysis and methylation (Schultz and Templeton, 1986; Sun et al., 1995; Xie, 2004). Degradation products are aldehydes and aromatic acids that can be de-termined by chromatographic methods. A disadvantage of these methods is long and labori-ous sample preparation. An alternative method used for the determination of lignin substruc-tures is Py-GC/MS, because time-consuming sample preparation is not needed (Izumi et al., 1995a; Izumi and Kuroda, 1997).
The lignin substructures (S/G/H) from the hardwood were in general determined as the S/G ratio, as also reported in Publication IV. The proportion of p-hydoxyphenyl structures in the studied eucalypt hybrids were low, varying from o.3 to 0.5 %. This was one reason why only guaiacyl and syringyl type degradation products were used for the determination of lig-nin substructures, but also because part of the p-hydroxyphenyl structures may originate from other structures than lignin (Publication I, Böttcher 1993). Based on the result obtained in the principal component analysis (Figure 15), all the guaiacyl and syringyl type degrada-tion products were used to determine S/G ratios.
Figure 17 shows that the S/G ratios determined by Py-GC/MS varied from 1.9 to 3.1 among eucalypt hybrids. Rather higher S/G ratios from 2.7 to 4.0 were determined by alkaline nitro-benzene oxidation. Similar results obtained by Py-GC/MS and alkaline nitrobenzene oxida-tion have been reported earlier (Izumi et al., 1995a; Nunes et al., 2010). The differences be-tween these two methods are related to different degradation mechanisms of lignin by Py-GC/MS and alkaline nitrobenzene oxidation. In alkaline nitrobenzene oxidation, lignin is oxidatively cleaved to form mainly syringylaldehyde and vanillin from syringyl and guaiacyl β-O-4 substructures, respectively. Thus the method is indicative for the non-condensed lignin units that are more prevalent among syringyl than guaiacyl type substructures (Xie 2004). In pyrolysis, mixtures of phenols are formed as a result of cleavage of β-O-4 and some con-densed linkages using thermal energy. Degradation of non-condensed lignin units is favoured in alkaline nitrobenzene oxidation methods, but also in Py-GC/MS. Thus both methods over-

38
estimate the actual S/G ratios, especially the syringyl substructures present in lignin. Howev-er, in Py-GC/MS the overestimation is smaller due to the cleavage of some condensed linkag-es present mainly in guaiacyl type lignin substructures.
Figure 17. S/G ratios determined by Py-GC/MS and alkaline nitrobenzene oxidation methods for 18 Eucalypt crossings.
Pulps after cooking and delignification The number of p-hydroxyphenyl type degradation products detected from both wood raw materials and pulps was lower in comparison to the guaiacyl and syringyl type degradation products, as shown in Table 5 and Figure 18. The proportion of p-hydroxyphenyl substruc-tures was also minor (< 1 %) in wood feedstocks in comparison to the guaiacyl or guaiacyl and syringyl type substructures. However, after the soda-AQ and soda-O2 cooking series of eucalypt wood, p-hydroxyphenyl type degradation products were enriched to 5% (Table 5). In unbleached softwood Kraft pulp, the enrichment was to 10% and was even more striking in fully bleached pulp at over 35 % (Figure 18). The result in Figure 18 shows that all three p-hydroxyphenyl structures (phenol, 2-methylphenol and 4-methylphenol) were enriched in delignification. However, the proportions of the corresponding guaiacyl structures (guaiacol and 4-methylguaiacol) were simultaneously decreased. The distinctive behaviour of p-hydroxyphenyl structures in comparison to guaiacyl structres during cooking and bleaching support the interpretation that the p-hydroxypenyl structure may also have other sources than lignin. Other wood components that have been reported to form phenols and methylphenols in pyrolysis are polysaccharides after alkaline pulping (Ziobro, 1990) and at high temperature (Higman et al., 1970), proteins and amino acids (Choi et al., 2001; Higman et al., 1970; Kleen et al., 2003). Phenolic extractives also form phenol (Ohara et al., 2003).
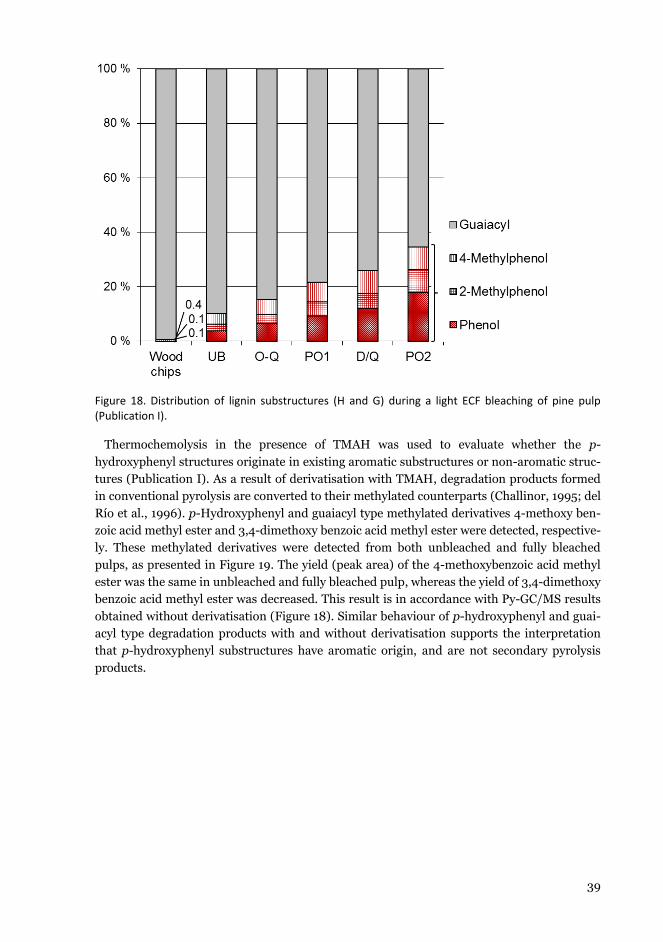
39
Figure 18. Distribution of lignin substructures (H and G) during a light ECF bleaching of pine pulp (Publication I).
Thermochemolysis in the presence of TMAH was used to evaluate whether the p-hydroxyphenyl structures originate in existing aromatic substructures or non-aromatic struc-tures (Publication I). As a result of derivatisation with TMAH, degradation products formed in conventional pyrolysis are converted to their methylated counterparts (Challinor, 1995; del Río et al., 1996). p-Hydroxyphenyl and guaiacyl type methylated derivatives 4-methoxy ben-zoic acid methyl ester and 3,4-dimethoxy benzoic acid methyl ester were detected, respective-ly. These methylated derivatives were detected from both unbleached and fully bleached pulps, as presented in Figure 19. The yield (peak area) of the 4-methoxybenzoic acid methyl ester was the same in unbleached and fully bleached pulp, whereas the yield of 3,4-dimethoxy benzoic acid methyl ester was decreased. This result is in accordance with Py-GC/MS results obtained without derivatisation (Figure 18). Similar behaviour of p-hydroxyphenyl and guai-acyl type degradation products with and without derivatisation supports the interpretation that p-hydroxyphenyl substructures have aromatic origin, and are not secondary pyrolysis products.

40
Figure 19. Pyrolysis degradation products obtained from an unbleached and a fully bleached pulp using thermochemolysis with TMAH at 400 °C. Thermochemolysis products with TMAH were meth-oxybenzoic acid methyl ester and dimethoxybenzoic acid methyl ester (Publication III).
Fractionated pyrolysis, which was used in Publication I, is one potential method to study lignin substructures (S/G/H). The method makes it possible to study the degradation behav-iour of sample components as a function of temperature (Selsbo et al., 1997). It has been used to study the possible bonds formed during pulping among the added chemicals and pulp components (Kleen et al., 2003; Selsbo et al., 1997). In Publication I, fractionated pyrolysis was applied to clarify the origin of the p-hydroxyphenyl type substructures. Fully bleached pulp was subjected to fractionated pyrolysis due to its observed highest proportion of p-hydroxyphenyl type degradation products of aromatic structures (34 %).
The degradation of p-hydroxyphenyl and guaiacyl type substructures together with degra-dation of cellulose and hemicelluloses in fully bleached pulp as a function of temperature is presented in Figure 20. Formation of guaiacyl and p-hydroxyphenyl substructures as a func-tion of temperature clearly differed from each other, but also from the degradation of cellu-lose and hemicelluloses (not previously reported). Release of guaiacyl type degradation prod-ucts started and ended at lower temperatures than the p-hydroxyphenyl type degradation products. High levels of p-hydroxyphenyl type degradation products were released at a tem-perature of 620 °C, at which only a small quantity of guaiacol was detected of the guaiacyl type degradation products, but also at the highest temperature (800 °C), at which no guaiacyl type degradation products were released. In fully bleached pulps, degradation of cellulose and hemicelluloses follow each other closely up to 620 °C. At that temperature, no degrada-tion products of hemicelluloses were detected, whereas some degradation products of cellu-lose were still present. Degradation of cellulose continued up to highest temperature (800 °C), as did the formation of p-hydroxyphenyl type degradation products. A small quantity of phenol, but not of other aromatics, has been detected from Avicel, pure microcrystalline cel-lulose, in Py-GC/MS (Tamminen, Ohra-aho, et al. 2003). However, under pulping conditions other phenolic structures are also known to be formed from polysaccharides (Ziobro 1990). Higher enrichment of p-hydroxyphenyl structures in pulps, as in the corresponding isolated residual lignin, also supports this phenomenon (Tamminen et al., 2003a). Other possible

41
sources than polysaccharides for p-hydroxypehnyl type degradation products could be plant proteins, which degrade to the same p-hydroxyphenyl structures as have been detected from the studied pulps, but also to other nitrogenous compounds (1H-pyrrole-2,5-dione, indole and 2-methylindole). Thermal degradation of these protein-based nitrogenous compounds determined by fractionated pyrolysis is similar to that of p-hydroxyphenyl type degradation products in pulps (Kleen et al., 2003). However, nitrogenous compounds were not detected from the fully bleached pulps subjected to fractionated pyrolysis. Based on this result, protein as a source of p-hydroxyphenyl structures in pulps can be excluded.
Figure 20. Degradation of guaiacyl and p-hydroxyphenyl type substructures as well as cellulose and hemicelluloses of fully bleached pulp as a function of temperature after laboratory oxygen delignifi-cation and ECF bleaching of spruce Kraft pulp.
6.1.5 Quantity of lignin in pulps after cooking and bleaching (I, IV)
Quantitative analysis of lignin or other natural polymers by Py-GC/MS is more complex in comparison to synthetic polymers, due to the difficulties in finding suitable standards for calibration. Quantitative methods have been reported in the literature in which the amount of each degradation product is calculated separately using the corresponding pure compounds for calibration (Izumi et al., 1995b) or using one monomeric compound as an internal stand-ard (Bocchini et al., 1997). However, this underestimates the lignin content, due to the for-mation of compounds not detectable by GC/MS. Other approaches to the quantification of lignin from softwood and pulps have been to divide lignin degradation products by all the degradation products (lignin and carbohydrates) present in the pyrogram (Alves et al., 2006) and to predict the lignin content from pyrolysis data with aid of a multivariate calibration model (Kleen et al., 1993). The approach of the study presented in Publication I was to use a standard for lignin calibration that behaved similarly to the studied material. The distribu-tion of degradation products formed from softwood Kraft lignin was closest to that for pulp lignin (Poppius-Levlin et al., 2001). Milled wood lignin was rejected due to its high content of native type structures present in lignin. In order to obtain information concerning the possi-ble applicability of the Py-GC/MS method, comparison of the results with lignin contents calculated from lignin kappa values was performed. In the kappa number analysis the con-

42
sumption of potassium permanganate during oxidation of pulp under standardised condi-tions is measured. Lignin can be calculated from the kappa number using an earlier defined constant (Fengel and Wegener, 1989). In addition to lignin, hexenuronic acid formed from hemicelluloses during pulping also contribute to the kappa number. As a result the hexenu-ronic acids content must be reduced from the kappa number before its conversion to lignin content (Li and Gellerstedt, 1997).
Lignin quantitation was based on the one point external standard calibration method, as-suming that the sum of peak areas of lignin degradation products of the external standard is 100 %. p-Hydroxyphenyl and guaiacyl type degradation products (Figure 16 and Figure 18) were integrated and the sum of the peak area was normalized to the weight of the sample. Thereafter the lignin contents of the unbleached pulp and a light ECF delignified softwood pulp were calculated and compared with lignin values calculated from lignin kappa number. Good correlation among the methods was obtained (Figure 21), although in unbleached pulp the quantity of pyrolysis lignin was lower and in fully bleached pulp samples higher than lig-nin kappa. In Py-GC/MS, known aromatic pyrolysis degradation products are used to deter-mine the lignin content. However, all components that are oxidized by potassium permanga-nate, not only lignin, will increase the Kappa number (Li et al., 2002; Li and Gellerstedt, 2002). Pulps after cooking and the first delignification stage may contain higher levels of non-lignin structures, which may increase the lignin value estimated from the kappa number more than after further delignification stages. For the fully bleached pulps, a higher lignin content was obtained by Py-GC/MS than from the kappa number. This is probably due to the fact that p-hydroxyphenyl type units originating from other sources than lignin increase the apparent lignin content as determined by Py-GC/MS, but also because all lignin fragments in pulps do not react in kappa number determination, thus lowering the lignin content estimat-ed from the kappa number (Tamminen et al., 2003b).
Figure 21. Quantity of p-hydroxyphenyl and guaiacyl type pyrolysis degradation products in pulps measured by Py-GC/MS. Lignin content in pulp was calculated from the lignin kappa value, multiply-ing lignin kappa by 0.15 % (Publication I).
43
6.1.6 Carbohydrate composition in wood and pulps (VI)
Acid hydrolysis followed by high performance anion exchange chromatography with pulsed amperometric detection (HPAEC-PAD) is the commonest method to determine carbohydrate composition as monosaccharides from fibre materials. Py-GC/MS is an alternative method to determine carbohydrate composition. In pyrolysis, cellulose and hemicelluloses are degraded to stable anhydrosugars, such as 1,6-anhydromannopyranose, 1,6-anhydrogalactopyranose, 1,6-anhydroglucopyranose, 1,5-anhydroarabinofuranose and 1,4-anhydroxylopyranose, but furans, pyrans, light oxygenates and gases are also formed. Even incomplete formation of anhydrosugars has successfully been used to determine carbohydrate composition from pulp fibres via multivariate calibration against reference data (Kleen et al., 1993) and also direct comparison of peak areas (Syverud et al., 2003). The advantage of Py-GC/MS in comparison to acid hydrolysis is that fibre-based materials can be analysed without milling (Syverud et al., 2003) and extractives removal (Barbosa et al., 2008).
In the study presented in Publication VI, the relative carbohydrate compositions of various eucalypt species were determined by Py-GC/MS. In addition, pulps produced from the same species by soda-AQ and soda-O2 processes were analysed similarly. The results were com-pared with those obtained by acid hydrolysis followed by HPLC. As described in the experi-mental part (section 5.1.2), carbohydrate composition was calculated in two ways both in the wood and pulp samples. In the method A, glucose content was calculated including only 1,6-anhydroglucopyranose, as has been done earlier for pulp samples (Kleen et al., 1993; Syverud et al., 2003) and in method B the glucose content was calculated including 1,6-anhydroglucopyranose and three other main cellulose degradation products 5-hydroxymethyl-2-tetrahydofuraldehyde-3-one, 5-hydroxymethyl-2-furaldehyde and 1.4-dideoxy-D-glycero-hex-1-enopyranos-3-ulose. For the wood samples the method A gave val-ues 51.3–64.1 % for glucose and 33.0–46.5 % for xylose, whereas the method B gave values 67.9–78.2% for glucose and 19.4–30.6% for xylose. The absolute values determined by meth-od B were closer to the values obtained by acid hydrolysis (74.1–78.6 % for glucose and 16.7–22.6 % for xylose). In the case of pulp samples the method A gave closer values (85.5 - 91.2 % for glucose and 8.8 – 14.5 % for xylose) than method B (91.2 – 94.3 % for glucose and 5.7 – 8.8 % for xylose) to those obtained with acid hydrolysis (84.4 – 88.7 % for glucose and 11.3 – 15.6 % for xylose). This was opposite to the results obtained for the wood samples, but well in accordance with the results presented for the pulp samples in earlier Publications (Kleen et al., 1993; Syverud et al., 2003).
Figure 22 shows that the linear relationship between the relative glucose and xylose con-tents among the Py-GC/MS results calculated by method A or method B and acid hydrolysis in the whole sample set was poor for the wood samples. A similar phenomenon was observed for the arabinose and galactose that were present in lower amounts in wood (not shown). For the pulp samples the correlation between the two methods was good. Py-GC/MS methods A and B gave similar correlation results, as shown in Figure 23. This is consistent with earlier reports (Kleen et al., 1993; Syverud et al., 2003). The correlation among the methods was improved when different types of cooks (soda-AQ and soda-O2) were followed separately as shown in Figure 23. These results indicate that the degradation behaviour of cellulose and hemicelluloses in pyrolysis are different in wood than in pulp. The lignin content is much higher in wood than in pulp samples, which may affect the thermal behaviour of carbohy-drates, especially of xylan, that is partly linked with lignin (Pinto et al., 2002). Additionally, cooking changes the xylan structure, releasing the acetyl and uronic acid groups of xylan.

44
These changes have been proposed to make xylan thermally more stable in pulp than in wood (Oudia et al., 2007).
Figure 22. Comparison of relative glucose and xylose contents between Py-GC/MS and acid hydrolysis followed by HPLC from eucalypt hybrids. In method A, carbohydrate composition was calculated from Py-GC/MS data including only 1,6-anhydroglucopyranose for the glucose content. In method B (Publication VI), relative carbohydrate composition was calculated from Py-GC/MS data including 1,6-anhydroglucopyranose; 5-hydroxymethyl-2-tetrahydofuraldehyde-3-one; 5-hydroxymethyl-2-furaldehyde and 1.4-Dideoxy-D-glycero-hex-1-enopyranos-3-ulose for the glucose content

45
Figure 23. Comparison of relative glucose and xylose contents between Py-GC/MS and acid hydrolysis followed by HPLC from different cooking stages of soda-AQ and soda-O2 pulps. Raw material was the same for both pulps (E. grandis (Coffs Harbour) x [E. urophylla (R) x E. globulus (R)]. In method A, carbohydrate composition was calculated from Py-GC/MS data including only 1,6-anhydroglucopyranose for the glucose content. In method B, relative carbohydrate composition was calculated from Py-GC/MS data including 1,6-anhydroglucopyranose; 5-hydroxymethyl-2-tetrahydofuraldehyde-3-one; 5-hydroxymethyl-2-furaldehyde and 1.4-Dideoxy-D-glycero-hex-1-enopyranos-3-ulose for the glucose content (Publication VI).
In this study, fractionated pyrolysis was applied in order to find an explanation for the ob-served difference in the degradation behaviours of carbohydrates in wood and pulp samples. Two eucalypt hybrids, G1xUGL and C1xUGL, as well as soda-O2 pulp cooked from G1xUGL (kappa 15), were selected for the fractionated pyrolysis. Degradation behaviour of the carbo-hydrates and lignin was followed. Thermal stability of hemicelluloses was lower in compari-son to lignin and cellulose in the wood samples (G1xUGL and C1xUGL), as shown in Table 6. This is in accordance with earlier results reported in the literature (Shen et al., 2010; Yang et al., 2007). The thermal behaviour of cellulose was similar both in wood and pulp samples, whereas cooking clearly increased the thermal stability of lignin and especially of xylan (Table 6). Release of acetyl and methylglucuronic acid side groups has been reported to occur at a lower temperature than degradation of the xylan chain (Shen et al., 2010). Cooking re-leases side groups of xylan (Pinto et al., 2002), which increases the thermal stability of xylan in pulp. This has earlier been verified by thermogravimetry (Oudia et al., 2007). In conclu-sion, in the pulp sample xylan, lignin and cellulose were degraded mainly at one temperature (450 °C), whereas in wood samples the degradation of xylan and lignin occurred more clearly at a lower temperature than cellulose. Thermal degradation of all fibre components was clos-er to each other in pulp than in wood samples.

46
Table 6. Thermal behaviour of carbohydrates and lignin in eucalypt hybrids (C1xUGL and G1xUGL) and soda-O2 pulp (k=15) of G1xUGL, determined by fractionated pyrolysis (Publication VI).
C1xUGL G1xUGL soda-O2 pulp of G1xUGL Temp., °C 320 450 580 800 320 450 580 800 320 450 580 800 Time, s 44 16 4 2 44 16 4 2 44 16 4 2 Xylose 42.9 57.1 0.0 0.0 44.1 55.9 0.0 0.0 1.3 98.7 0.0 0.0 Arabinose 100.0 0.0 0.0 0.0 100.0 0.0 0.0 0.0 0.0 0.0 0.0 0.0 Galactose 55.4 44.6 0.0 0.0 43.3 56.7 0.0 0.0 0.0 0.0 0.0 0.0 Glucose 2.2 97.1 0.6 0.1 2.3 97.4 0.3 <0.1 0.1 99.4 0.4 0.1 Lignin 28.2 71.1 0.7 0.1 24.2 74.7 1.0 0.1 5.9 89.8 4.2 0.2
6.2 Lignin utilization
Concern due to increasing greenhouse gas emissions and diminishing fossil resources has increased the impetus towards using renewable resources. Lignin, as the largest natural source of aromatics, has been seen as a promising resource for renewable materials, chemi-cals and fuels. However, its complex structure has made its utilisation difficult without any modification. In this study, the structures of Kraft lignins from different sources were charac-terised with various analytical pyrolysis techniques with the aim of using the lignin for com-posites and barriers. The main problem that has been encountered in applying Kraft lignin as such, or in the processing of Kraft lignin at high temperatures, is the release of odorous vola-tile organic compounds (VOCs). A thermal desorption method was utilised for the evaluation of Kraft lignin quality intended for composites (Publication II). Esterification is one potential way to modify lignin and especially improve its film forming ability (Hult et al., 2013). The potential of the use of thermochemolysis to determine the degree of esterification of fatty acid modified lignins was evaluated in Publication III. The method evaluation was carried out with model compounds representing aliphatic and aromatic esters of modified lignin.
Brewers Spent Grain (BSG), a by-product generated in the brewing industry, is one new al-ternative lignin source. However, the structure of non-wood plant biomass such as BSG dif-fers from wood structure, containing ferulic and p-coumaric acid units among lignin and cel-lulose, together with protein. Thus its composition is more complex, which makes lignin iso-lation and characterisation more challenging. Py-GC/MS with and without methylation was utilized as a direct method to obtain structural information concerning BSG and its lignin-rich fractions (VI).
6.2.1 Thermal desorption method for lignin quality control (II)
The thermal desorption method has been utilized as a part of fractionated pyrolysis to sepa-rate volatiles from the polymeric material (Kleen et al., 2003). In the current study, thermal desorption was used as an individual method for the analysis of volatile organic compounds (VOCs) released from the Kraft lignins in conditions simulating the temperature in thermo-plastic processing. The pyrolysis unit was selected for thermal desorption analyses because it was possible to use a much wider and higher temperature range than is possible in other methods (static headspace, dynamic headspace) generally used to determine VOCs (Koning et al., 2009). Two classes of odorous compounds with low odour threshold values have been

47
defined from Kraft lignins: phenolic structures of lignin and other aliphatic thiols formed in cooking (Karnofski, 1975).
Two softwood Kraft lignins (StoraEnso = SE and Indulin AT) from different sources were treated under oxidative conditions with and without enzymes (Laccase MaL from Melano-carpus albomyces (Ma) and sulfhydryl oxidase AoSOX1 from Aspergillus oryzae (Ao)) in order to reduce VOCs. The conditions used for the oxidative treatments are presented in Pub-lication II in more detail. After the treatments, VOCs were measured at two separate temper-atures, 150 ºC and 190 ºC. The lower temperature was selected because it is close to the sof-tening temperature of Kraft lignin (Ropponen et al., 2011), whereas the higher temperature was closer to the thermoplastic processing temperature. Two heating times, 5 and 10 minutes, were tested prior to selection of the final thermal desorption temperature. At the lower temperature, the longer heating time did not increase VOC formation, whereas at the higher temperature the average increase of VOCs was 17 %. The shorter time was selected in order to avoid secondary reactions during heating. Figure 24 shows the main VOCs released from references and treated Kraft lignins at 150 °C and 190 °C. More VOCs were released at the higher temperature, especially lignin-related monomers. It is obvious that at 190 °C, lig-nin degradation may already be taking place (Kawamoto, 2017; Ropponen et al., 2011). Sul-phur compounds and lignin-related monomers were the main volatiles released at both tem-peratures from SE lignins, but at 190 °C the odorous carbohydrate derivative 2-cyclopenten-1-one-3-ethy-2-hydroxy was also detected (Niemelä, 1988). There was some variation in VOC formation between different treatments of SE lignin, but only oxygen treatment without en-zyme at pH 10.7 clearly reduced VOC formation. Lower amounts of odorous sulphur com-pounds and only a few lignin-based compounds were released from Indulin AT in compari-son to SE lignin.
The amount of guaiacol was determined quantitatively, due to the facts that it was present in the highest amount and has a low odour threshold value (3-21 ppb). The result showed that the treatments clearly reduced guaiacol formation from both lignins (Figure 25). Howev-er, the amount of guaiacol released from the lignins remained far above its odour threshold value. The difference in odour values evaluated for the untreated and treated samples was minor (Publication II, Figure 21). However, the obtained odour values decreased simultane-ously with decreasing VOCs released from the sample.

48
Figure 24. Main volatiles released from freeze-dried SE lignin and Indulin AT samples at 150 °C and 190 °C after oxidative treatments with and without enzymes (Laccase MaL from Melanocarpus al-bomyces (Ma) and sulfhydryl oxidase AoSOX1 from Aspergillus oryzae (Ao)). Reference sample (ref.) was not O2 boosted and all other samples are O2 boosted with laccase dose (0.1%) or without (0%).
Figure 25. Amount of guaiacol released from the freeze-dried SE lignin and Indulin AT samples at 150 °C and 190 °C after oxidative treatments with and without enzymes (Laccase MaL from Melanocar-pus albomyces (Ma) and sulfhydryl oxidase AoSOX1 from Aspergillus oryzae (Ao)). Reference sample (ref.) was not O2 boosted and all other samples are O2 boosted with laccase dose (0.1 %) or without (0 %).
0
50000
100000
150000
200000
250000
300000Pe
ak a
rea
norm
aliz
ed to
sam
ple
amou
nt
2-Cyclopenten-1-one-3-ethyl-2-hydroxy
2-Methoxy-1,4-benzenediol
Dihydroconiferylalcohol
Homovanillin
Vanillin
Guaiacol
Dimethyltrisulfide
Dimethyldisulfide
Methanethiol
TD at 150 ºC TD at 190 ºC
SE Indulin AT
SE Indulin AT
0
30
60
90
120
150
180
Gua
iaco
l, pp
m
TD 150 °C TD 190 °C
Indulin ATSE
49
6.2.2 Thermochemolysis as a tool for the analysis of esterified lignin substrucures (III)
Lignin as such has poor thermoplastic properties due to its three-dimensional molecular structure. However, esterification of technical lignins with fatty acids has been found to lower the glass transition point of lignin (Funakoshi et al., 1979; Thiebaud et al., 1997). As a result, the thermoplasticity and film forming properties of lignin are improved. This enables the use of lignin as a coating material on paperboard. Lignin functionalization with tall oil fatty acid (TOFA), consisting of a mixture of oleic, linoleic and linolenic acids, has been presented in a recent Publication (Hult et al., 2013). Lignin hydroxyl groups were esterified with fatty acids to different degrees of substitution, aiming to develop aqueous lignin ester dispersion formu-lations for coatings. In the study presented in Publication III, model compounds (guaiacyl palmitate and 2-nonyl palmitate) representing both aliphatic and aromatic ester bonds among lignin and fatty acids were used to evaluate the existing thermochemolysis method for the analysis of degree of esterification from the novel lignin material.
Thermochemolysis in the presence of TMAH and TMAAc was applied in Publication III. TMAH has been used to determine total acid contents in both natural and synthetic materials (Challinor, 1996; Drechsel et al., 2003; Hardell and Nilvebrant, 1999), whereas TMAAc has been used to determine free fatty acids in wood extractives (Hardell and Nilvebrant, 1999). It has been reported that degradation and methylation of ester bonds may take place especially in high temperature thermochemolysis with TMAAc (Drechsel et al., 2003). Another pro-posed explanation for the high degree of free acids has been possible transesterification in TMAAc thermochemolysis in the presence of methanol (Joll et al. 2004). In this study, guai-acyl palmitate and 2-nonyl palmitate were analysed by thermochemolysis using TMAH and TMAAc reagents as a means to differentiate between free acids and esters. Additionally, the possible transesterification reaction during on-line thermochemolysis using TMAAc in the presence of methanol was evaluated. Thus all the measurements were carried out using two solvents, methanol and dichloromethane.
The results in Figure 26 and Figure 27 show that aromatic ester reacted completely with TMAH, whereas part of the aliphatic ester was intact in the presence of TMAH. As a result, a small amount of the original 2-nonyl palmitate was detected. The yields of palmitic acid from the theoretical value in the case of guaiacyl palmitate were 100 % and 88 % when methanol and dichloromethane were used as a solvent, respectively. Correspondingly, the yields of palmitic acid in the case of 2-nonyl palmitate were 79 % and 78 % in methanol and dichlor-methane media (Figure 28). Due to the incomplete hydrolysis of 2-nonyl palmitate at 600 °C, thermochemolysis with TMAH was also performed at 700 °C and 800 °C, which gave yields of 76 % and 82 %, respectively. This showed that increase of thermochemolysis temperature did not have an influence on the hydrolysis of 2-nonylpalmitate with TMAH.
The palmitic acid contents released from guaiacyl palmitate and 2-nonyl palmitate in TMAAc thermochemolysis were partly unexpected. A high amount of palmitic acid was de-tected from the guaiacyl palmitate with TMAAc, corresponding to about one third of the the-oretical content (Figure 28). The measured value was abundant, as any unreacted palmitic acid after the synthesis was shown to be removed during the purification, further verified by NMR analysis of the product. A small amount of nonmethylated guaiacol was also detected after TMAAc thermochemolysis, indicating thermal degradation of guaiacyl palmitate already at 280 °C (Figure 26). However, thermal degradation cannot explain the high content of re-leased palmitic acid, because hydrolysis and salt formation were expected to occur prior to

50
thermal degradation (Challinor, 2001). Thus it was assumed that palmitic acid is released and methylated from the aromatic esters in the presence of TMAAc. Significantly less palmit-ic acid was released from the 2-nonyl palmitate than from guaiacyl palmitate in the presence of TMAAc (Figure 28). This indicates that aliphatic ester is more stable in the presence of TMAAc than aromatic ester in low temperature thermochemolysis. In the case of 2-nonyl palmitate, TMAAc appears to react mainly with the free acid group, and not with the ester group as originally expected.
Figure 26. Products formed from guaiacyl palmitate by TMAH thermochemolysis (above) and TMAAc thermochemolysis (below) (Publication III).
Figure 27. Products formed from 2-nonyl palmitate by TMAH thermochemolysis (above) and TMAAc thermochemolysis (below) (Publication III).

51
Two solvents, methanol and dichloromethane, were used in order to gain better under-standing of the effect of the solvents on the methylation reaction, i.e. transesterification. If transesterification of the ester groups in the sample takes place via methoxide ion formation from methanol, a higher proportion of methylated products would be formed with methanol than with dichloromethane. The palmitic acid content was slightly higher when the samples were diluted in methanol rather than in dichloromethane in the presence of TMAAc. Howev-er, taking into account the standard deviation, similar values were obtained with both sol-vents. Thus it is proposed that transesterification with TMAAc is an insignificant reaction in on-line thermochemolysis, supporting the earlier results of (Joll et al., 2004).
Figure 28. Theoretical and measured palmitic acid contents determined from guaiacyl palmitate and 2-nonyl palmitate using TMAH and TMAAc.

52
6.2.3 BSG as a potential novel source of lignin material (V)
Brewers spent grain (BSG) is an abundant by-product generated in the brewing of beer from barley grain (Xiros and Christakopoulos, 2012). It is a food grade material, which is rich in cell wall polysaccharides (arabinoxylan and cellulose), protein and lignin (Robertson et al., 2010). BSG is currently used as a ruminant feed (Mussatto et al., 2006), but other potential applications are also being investigated due to its low price, good availability and valuable composition (Mussatto, 2014). As BSG is rich in protein and dietary fibre, it could also be used in more valuable applications, e.g. as a dietary component in human food. It has been suggested that lignin as part of dietary fibre may help to protect against cancer and cardio-vascular diseases (Mussatto, 2014). A recent study by Rencoret et al. (2015) showed that lig-nin in BSG consists of guaiacyl and syringyl type units, but also contains significant amounts of p-coumarates and ferulates. p-Coumarates have been supposed to acylate the lignin γ-OH group, and ferulates to form crosslinks between lignin and polysaccharides. These structural features together with high protein content have made isolation and also characterisation of lignin from BSG challenging. The aim of the work presented in Publication V was to obtain structural information on BSG lignin fractions by Py-GC/MS methods after the isolation by enzymatic and chemical methods. Original BSG fibres were measured as well, due to the pos-sible modification of lignin during isolation.
Lignin isolation from BSG using enzymatic hydrolysis to two lignin-rich fractions, soluble (P-AEF) and insoluble fraction (INS), has been reported in Publications by Niemi et al. (2012) and Aura et al. (2013), but the scheme of BSG fractionation by enzymatic hydrolysis is shown in Figure 11. The composition analysis determined by traditional wet-chemical meth-ods for P-AEF and INS fractions was also reported earlier (Aura et al., 2013; Niemi et al., 2012). Two other lignin fractions were isolated by acidolysis (AL) and enzymatic mild aci-dolysis (EMAL), and detailed description of the isolations are presented in section 5.1.1. Py-GC/MS analysis results of all four lignin-rich fractions together with the original BSG was only presented in Publication V.
Composition analysis by Py-GC/MS showed that separation of lignin from protein and car-bohydrates by enzymatic hydrolysis was incomplete (Figure 29). This result is in accordance with earlier reported results (Aura et al., 2013; Niemi et al., 2012). The yield of P-AEF and INS fractions also remained low, at 14 and 39 %, respectively. More pure lignin fractions were obtained with two other isolation methods, acidolysis (AL) and enzymatic mild acidolysis (EMAL) including a protease pretreatment (Figure 29). However, the yields of AL and EMAL fractions were 21 % and 5.8 %, being thus rather low. The reason for the low yield of the EM-AL fraction was the poor solubility of lignin in mild acid. In P-AEF and AL the lignin was sol-ubilized, but was poorly precipitable. This was observed as dark colour of the residual liquid.

53
Figure 29. Composition of original BSG and its lignin-rich fractions determined by Py-GC/MS. Isolation processes of lignin-rich fractions from BSG are presented in Figure 11. Brewers spent grain (BSG), protease-alkaline extracted fraction (P-AEF) and insoluble residue (INS) after enzymatic hydrolysis, acidolysis lignin (AL) and enzymatic mild acidolysis lignin (EMAL). Carbohydrates (Ch), nitrogen-containing aromatic structures from protein (N), p-hydroxyphenyl substructures from protein and lignin (H), guaiacyl (G) and syringyl (S) substructures from lignin, 4-vinylphenol from lignin, protein and p-coumarate (pCA) and 4-vinylguaiacol from lignin and ferulate (FA) (Publication V).
The next Py-GC/MS and thermochemolysis results of hydroxycinnamates and lignin are presented in more detail from the original BSG and its lignin fractions. At higher tempera-ture, hydroxycinnamates are degraded to 4-vinylphenol and 4-vinylguaiacol, and therefore these degradation products were excluded from the lignin structure evaluation in Py-GC/MS. Thermochemolysis with TMAH enables separation of hydroxycinnamates from lignin deriva-tives (Blokker et al., 2006; del Río et al., 2007a; Kuroda et al., 1995). p-Hydroxyphenyl type pyrolysis degradation products originate from protein, lignin and p-coumarate, which are all present in BSG (Kleen et al., 2003; Rencoret et al., 2015). p-Hydroxyphenyl type degradation products were excluded, because they cannot be specified as lignin degradation products.
The content of ferulic and p-coumaric acids in the original BSG and its lignin-rich fractions was highest of all the aromatic degradation products (Table 8). The result showed that high ferulic acid contents in the original BSG and in the lignin-rich fractions INS and P-AEF were related to a high polysaccharide content of samples (Figure 29). It has been reported that ferulic acid binds polysaccharides and lignin together, forming ester bonds with polysaccha-rides and ether bonds with lignin (Jacquet et al., 1995; Ralph, 2010). Acidolysis treatment releases ferulate-linked polysaccharides. Thus the yield of ferulic acid and polysaccharides was low in AL and EMAL fractions. Due to the milder acidolysis conditions, carbohydrates and ferulic acid were released to a lesser extent after the EMAL than AL treatment, as has been reported by Jacquet et al., (1995). The proportion of p-coumaric acid was the same in BSG, P-AEF and EMAL, but lower than in INS and AL (Table 8). p-Coumaric acid has been reported to acylate the -carbon of the lignin side chain (Ralph, 2010), especially in con-

54
densed lignin structures (Rencoret et al., 2015). Based on this, it appears that lignin in INS and AL is enriched with condensed lignin.
Degradation of the β-O-4 bond results in a high yield of oxygen-containing side chain struc-tures in pyrolysis with (Kuroda, 2002; Kuroda and Nakagawa-Izumi, 2006) and without TMAH (Kuroda, 2000b). The results showed that oxygenated syringyl units were less abun-dant in all samples from Py-GC/MS than from Py/TMAH (Table 7, Table 8). Recently it has been reported that a small amount of -OH is acylated in BSG lignin mainly in syringyl units (Rencoret et al., 2015). In pyrolysis, acetyl groups have been reported to be eliminated to-gether with the attached hydroxyl group, leading to the formation of double bond structures in the side chains (Moldoveanu, 2010). This also occurs in the case of acylation by p-coumaric acid (Ralph, 2010; Rencoret et al., 2015). The total absence of sinapyl alcohol type degradation products in the BSG samples thus suggests that the -OH groups in syringyl units are more acylated than in guaiacyl units. This was observed especially for P-AEF, AL and EMAL samples.
The TMAH/py analysis confirmed that acylation of -OH groups in the syringyl structures leads to underestimation of the content of native type syringyl structures in Py-GC/MS. As a result, higher S/G ratios (0.8-1.2) were obtained by Py/TMAH in comparison to Py-GC/MS (0.5-0.7), especially in the case of BSG and AL. Thus, thermochemolysis with TMAH should be used for the determination of S/G-ratios of acylated lignins.

55
Table 7. Relative proportion of aromatic degradation products of guaiacyl (G) and syringyl (S) type lignin units, p-coumaric and ferulic acid formed in Py-GC/MS from the original BSG and from lignin-rich enzymatically and chemically isolated fractions of BSG (Publication V).
Compound Mw orig. BSG P-AEF INS AL EMAL
4-Vinylphenol 120 H/p-CA 8.0 8.8 13.8 8.5 10.0 Guaiacol 124 G 4.4 5.0 5.8 7.0 5.3 4-Methylguaiacol 138 G 4.9 7.6 3.6 9.1 6.1 4-Ethylguaiacol 152 G 1.2 1.7 0.8 2.1 2.2 4-Vinylguaiacol 150 G/FA 36.6 36.2 30.3 20.8 31.4 Eugenol 164 G 1.8 2.3 1.4 2.0 2.5 cis-Isoeugenol 164 G 1.1 1.4 0.8 1.5 1.8 trans-Isoeugenol 164 G 4.9 7.7 4.1 6.6 9.0 Vanillin 152 G 7.2 1.0 4.1 2.0 1.5 Homovanillin 166 G 1.5 0.0 2.2 2.5 0.7 Acetoguaiacone 166 G 1.6 0.7 1.3 0.8 0.6 Guaiacylacetone 180 G 0.6 1.0 0.8 3.2 3.1 4-(Oxy-allyl)guaiacol 178 G 0.7 0.1 0.6 0.6 0.4 4-(1-Hydroxyprop-2-enyl)guaiacol 180 G 0.3 0.0 0.6 0.5 0.1 cis-Coniferyl alcohol 180 G 1.6 0.8 1.9 0.6 0.3 trans-Coniferyl alcohol 180 G 4.1 3.8 5.8 1.6 0.9 Coniferaldehyde 178 G 1.7 0.0 2.0 1.3 0.0 Syringol 154 S 2.1 2.3 2.9 3.5 2.2 4-Methylsyringol 168 S 2.3 3.7 1.8 4.8 3.0 4-Ethylsyringol 182 S 0.1 0.5 0.2 0.9 0.7 4-Vinylsyringol 180 S 3.2 4.7 3.1 6.6 6.1 4-Allylsyringol 194 S 1.5 2.0 1.2 1.8 1.9 cis-Propenylsyringol 194 S 1.0 1.5 0.7 1.4 1.5 trans-Propenylsyringol 194 S 3.4 5.7 2.9 4.8 5.3 Syringaldehyde 182 S 2.3 0.3 1.5 1.1 0.6 Homosyringaldehyde 196 S 0.2 0.0 0.6 0.5 0.0 Acetosyringone 196 S 1.5 1.0 1.3 1.4 0.9 Syringylacetone 210 S 0.2 0.4 0.3 2.0 1.6 4-(Oxy-allyl)syringol 208 S 0.0 0.0 0.2 0.4 0.4 4-(1-Hydroxy-prop-2-enyl)syringol 210 S 0.0 0.0 0.2 0.1 0.0 cis-Sinapyl alcohol 210 S 0.0 0.0 0.2 0.0 0.0 trans-Sinapyl alcohol 210 S 0.0 0.0 1.7 0.0 0.0 Sinapaldehyde 208 S 0.0 0.0 1.1 0.0 0.0 S/G 0.5 0.7 0.6 0.7 0.7
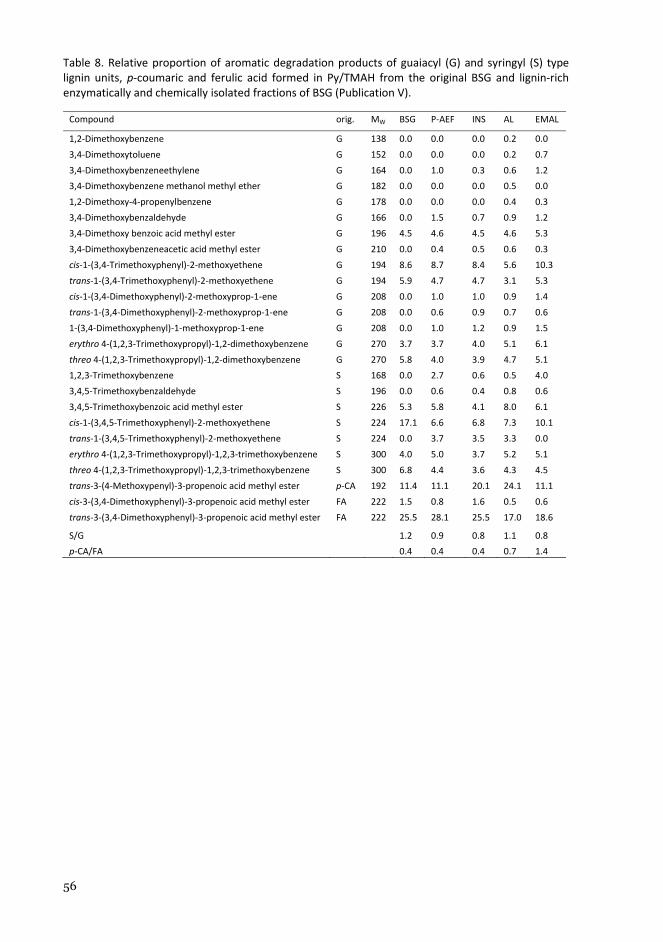
56
Table 8. Relative proportion of aromatic degradation products of guaiacyl (G) and syringyl (S) type lignin units, p-coumaric and ferulic acid formed in Py/TMAH from the original BSG and lignin-rich enzymatically and chemically isolated fractions of BSG (Publication V).
Compound orig. MW BSG P-AEF INS AL EMAL
1,2-Dimethoxybenzene G 138 0.0 0.0 0.0 0.2 0.0 3,4-Dimethoxytoluene G 152 0.0 0.0 0.0 0.2 0.7 3,4-Dimethoxybenzeneethylene G 164 0.0 1.0 0.3 0.6 1.2 3,4-Dimethoxybenzene methanol methyl ether G 182 0.0 0.0 0.0 0.5 0.0 1,2-Dimethoxy-4-propenylbenzene G 178 0.0 0.0 0.0 0.4 0.3 3,4-Dimethoxybenzaldehyde G 166 0.0 1.5 0.7 0.9 1.2 3,4-Dimethoxy benzoic acid methyl ester G 196 4.5 4.6 4.5 4.6 5.3 3,4-Dimethoxybenzeneacetic acid methyl ester G 210 0.0 0.4 0.5 0.6 0.3 cis-1-(3,4-Trimethoxyphenyl)-2-methoxyethene G 194 8.6 8.7 8.4 5.6 10.3 trans-1-(3,4-Trimethoxyphenyl)-2-methoxyethene G 194 5.9 4.7 4.7 3.1 5.3 cis-1-(3,4-Dimethoxyphenyl)-2-methoxyprop-1-ene G 208 0.0 1.0 1.0 0.9 1.4 trans-1-(3,4-Dimethoxyphenyl)-2-methoxyprop-1-ene G 208 0.0 0.6 0.9 0.7 0.6 1-(3,4-Dimethoxyphenyl)-1-methoxyprop-1-ene G 208 0.0 1.0 1.2 0.9 1.5 erythro 4-(1,2,3-Trimethoxypropyl)-1,2-dimethoxybenzene G 270 3.7 3.7 4.0 5.1 6.1 threo 4-(1,2,3-Trimethoxypropyl)-1,2-dimethoxybenzene G 270 5.8 4.0 3.9 4.7 5.1 1,2,3-Trimethoxybenzene S 168 0.0 2.7 0.6 0.5 4.0 3,4,5-Trimethoxybenzaldehyde S 196 0.0 0.6 0.4 0.8 0.6 3,4,5-Trimethoxybenzoic acid methyl ester S 226 5.3 5.8 4.1 8.0 6.1 cis-1-(3,4,5-Trimethoxyphenyl)-2-methoxyethene S 224 17.1 6.6 6.8 7.3 10.1 trans-1-(3,4,5-Trimethoxyphenyl)-2-methoxyethene S 224 0.0 3.7 3.5 3.3 0.0 erythro 4-(1,2,3-Trimethoxypropyl)-1,2,3-trimethoxybenzene S 300 4.0 5.0 3.7 5.2 5.1 threo 4-(1,2,3-Trimethoxypropyl)-1,2,3-trimethoxybenzene S 300 6.8 4.4 3.6 4.3 4.5 trans-3-(4-Methoxypenyl)-3-propenoic acid methyl ester p-CA 192 11.4 11.1 20.1 24.1 11.1 cis-3-(3,4-Dimethoxyphenyl)-3-propenoic acid methyl ester FA 222 1.5 0.8 1.6 0.5 0.6 trans-3-(3,4-Dimethoxyphenyl)-3-propenoic acid methyl ester FA 222 25.5 28.1 25.5 17.0 18.6
S/G 1.2 0.9 0.8 1.1 0.8 p-CA/FA 0.4 0.4 0.4 0.7 1.4

57
7. Conclusions
In this thesis, different analytical pyrolysis techniques were applied for the characterisation of lignin and carbohydrates from various lignocellulosic plant materials. Based on the results of the study, Py-GC/MS is better suitable for the characterisation and quantitation of lignin than carbohydrates. The results were supported by other methods used in the study. Iso-thermal pyrolysis can be well used for the analysis of woody feedstocs, however, in the case of non-woody materials thermochemolysis method give more precise information. Thermal desorption technique is applicable for the determination of volatiles from the lignocellulose materials without breaking the macromolecular structure. Fractionated pyrolysis can be ap-plied together with other pyrolysis techniques to understand more deeply the lignocellulose structure and its effect on thermal degradation behaviour.
Variation in lignin composition between softwood and hardwood feedstocks, but also in non-woody material (agro-industrial residue) such BSG, was observed directly from the deg-radation product profiles. In addition, the change of species in eucalypt hybrids altered the pyrolysis degradation products formed from lignin and S/G ratios, confirming that there are differences in the original lignin structure in all the studied eucalypt hybrids. Py-GC/MS showed lower S/G ratios in comparison to alkaline nitrobenzene oxidation, due to the differ-ent degradation mechanisms of these two methods. Py-GC/MS is a potential method for the determination of S/G ratios from the feedstocks intended for pulping. In addition to lignin, Py-GC/MS provides information on the carbohydrate composition of eucalypt hybrids. How-ever, based on the results of this study, Py-GC/MS cannot be recommended for the compari-son of carbohydrate composition among different wood species. Fractionated pyrolysis demonstrated that the thermal behaviour of cellulose and xylose, together with the minor components arabinose and galactose, varies between different eucalypt wood species. Similar thermal behaviour between studied components is a prerequisite for reliable Py-GC/MS analysis.
Characterisation of lignin from BSG by Py-GC/MS was more challenging than from wood. BSG contains significant amounts of protein and hydroxycinnamates that interfere with the analysis of lignin structure, even from the isolated lignin fractions. Comparison of the iso-thermal pyrolysis and thermochemolysis results of BSG and its lignin fractions showed that more detailed information on lignin structure can be obtained with these methods together than with either method separately. Thermochemolysis results demonstrated that isothermal pyrolysis leads to underestimation of native type syringyl structures and S/G ratios due to the acylation. More precise information on lignin structure and S/G ratio can therefore be ob-tained by thermochemolysis than by isothermal pyrolysis.
Py-GC/MS provided information on lignin structure and quantity directly from pulps in cooking, oxygen delignification and bleaching stages. For that purpose, the sensitivity of the method was improved by integrating the compounds with selected mass fragments (m/z)

58
instead of using total ion current. The main key features of pyrolysis degradation products in different stages are described in the following. Decrease of oxygenated lignin pyrolysis degra-dation products was reflected in the β-ether bond cleavage and in increased degradation of short chain structures of the side chains during cooking. As a result of the oxygen delignifica-tion stage, the proportion of lignin pyrolysis degradation products with oxygenated side chain structures increased. Delignification leached the lignin products that were formed in cooking. As a result, lignin pyrolysis degradation products with short side chains were decreased to the same level that has been found in native lignin. The result demonstrated that the residual lignin structure in fully bleached pulps is close to the native lignin structure.
In addition striking enrichment of p-hydroxyphenyl structures was observed during cook-ing and delignification that was opposite phenomenon in comparison to the behaviour of guaiacyl type structures. Thermochemolysis and fractionated pyrolysis were applied in order to obtain more information on the phenomena. The thermochemolysis method demonstrated that p-hydroxyphenyl substructures are formed from aromatic substructures, and are not secondary pyrolysis products. The distinct thermal behaviour of p-hydroxyphenyl type deg-radation products in comparison to guaiacyl type degradation products in fractionated pyrol-ysis suggested that they are derived not only from lignin but also from other pulp compo-nents. Analysis of p-hydroxyphenyl type degradation products is complex, due to the several possible sources. This phenomenon does not apply only to wood based material, but to all types of lignocelluloses, including BSG. In BSG the origin of p-hydroxyphenyl type degrada-tion products were lignin, hydroxycinnamates and protein.
A new external standard calibration method was developed for the quantitative analysis of lignin directly from pulps after the cooking and different delignification stages up to fully bleached pulps. The method is well applicable to the pulps because the degradation products used for the quantitation can be well defined, which is not possible in the case of traditional methods.
The thermal desorption method provided information on odorous volatile organic com-pounds released from treated Kraft lignins intended for composite processes. The method is applicable in the comparison of odorous compounds released from various samples below 225 °C. Quantitative analysis enables comparison of results with the odour threshold values of the compounds.
Thermochemolysis with TMAAc and TMAH reagents was applied as means to differentiate between free acids and esters, respectively. The reactivity of aromatic and aliphatic esters was evaluated in thermochemolysis as the release of palmitic acid from model compounds. The result demonstrated that thermochemolysis with alkaline TMAH can be used to determine total fatty acid content from both aliphatic and aromatic esters. Aliphatic ester was stable with neutral TMAAc, whereas aromatic ester was partially degraded. Thus TMAAc can be used to distinguish between free acids and aliphatic esters in matrices such as wood extrac-tives, containing only aliphatic esters. However, it cannot be used to determine free acids from samples which contain aromatic and aliphatic ester linkages, or only aromatic ester linkages.

59
8. Future prospects
In this study lignin structure was mainly characterized by isothermal pyrolysis, the exception being non-woody BSG that was determined with isothermal pyrolysis and thermochemolysis. In the future, it would be advantageous to utilize the thermochemolysis method to determine lignin structure, and also S/G/H ratios from the various types of lignocellulosic materials. It would be informative to use other thermochemolysis reagents than TMAH for the lignin structural characterisation, especially of the free functional groups from various lignocellu-lose materials and products. Thermochemolysis has not widely been applied for the determi-nation of carbohydrate composition from wood species. Thermochemolysis or pre-sialylation followed by Py-GC/MS could probably provide more stable carbohydrate degradation prod-ucts. Quantitative analysis of lignin from non-woody materials with traditional methods is complicated due to the presence of protein and hydroxycinnamates that interfere with the analysis. Development of an in situ Py-GC/MS method for lignin quantitation from non-woody materials would increase the applicability of the method in the future.
Thermochemolysis with TMAAc for the determination of free acid from the aromatic esters was not acceptable. However, it was suitable for determining free acids from aliphatic esters. For the purpose of differentiating free acids from esters, different thermochemolysis reagents need to be tested. The reagent would be more applicable if it could be used to distinguish free acids from both aliphatic and aromatic esters.
The utilization of thermal desorption, sequential and fractionated pyrolysis techniques is advantageous in studies in which more information concerning the thermal behaviour of ma-terials is needed. The method could be used to simulate various thermal processes with dif-ferent types of biomasses.

60
References
Adam, J., Blazso, M., Meszaros, E., Stöcker, M., Nilsen, M.H., Bouzga, A., Hustad, J.E., Grronli, M., Oye, G., 2005. Pyrolysis of biomass in the presence of Al-MCM-41 type catalysts. Fuel 1494–1502. doi:10.1016/j.fuel.2005.02.006
Akazawa, M., Kojima, Y., Kato, Y., 2016. Effect of pyrolysis temperature on the pyrolytic degradation mechanism of β-aryl ether linkages. J. Anal. Appl. Pyrolysis 118, 164–174. doi:10.1016/j.jaap.2016.02.001
Akim, L.G., Colodette, J.L., Argyropoulos, D.S., 2001. Factors limiting oxygen delignification of kraft pulp. Can. J. Chem. 79, 201–210. doi:10.1139/cjc-79-2-201
Alves, A., Gierlinger, N., Schwanninger, M., Rodrigues, J., 2009. Analytical pyrolysis as a direct method to determine the lignin content in wood Part 3 . Evaluation of species-specific and tissue-specific differences in softwood lignin composition using principal component analysis. J. Anal. Appl. Pyrolysis 85, 30–37. doi:10.1016/j.jaap.2008.09.006
Alves, A., Rodrigues, J., Wimmer, R., Schwanninger, M., 2008. Analytical pyrolysis as a direct method to determine the lignin content in wood Part 2: Evaluation of the common model and the influence of compression wood. J. Anal. Appl. Pyrolysis 81, 167–172. doi:10.1016/j.jaap.2007.11.001
Alves, A., Schwanninger, M., Pereira, H., Rodrigues, J., 2006. Analytical pyrolysis as a direct method to determine the lignin content in wood Part 1: Comparison of pyrolysis lignin with Klason lignin. J. Anal. Appl. Pyrolysis 76, 209–213. doi:10.1016/j.jaap.2005.11.004
Amen-Chen, C., Pakdel, H., Roy, C., 2001. Production of monomeric phenols by thermochemical conversion of biomass: A review. Bioresour. Technol. 79, 277–299. doi:10.1016/S0960-8524(00)00180-2
Andersson, E.M., Ericsson, I., 1979. Determination of the temperature—time profile of the sample in pyrolysis—gas chromatography. J. Anal. Appl. Pyrolysis 1, 27–38. doi:10.1016/0165-2370(79)80003-0
Asperger, A., Engewald, W., Fabian, G., 2001. Thermally assisted hydrolysis and methylation - A simple and rapid online derivatization method for the gas chromatographic analysis of natural waxes. J. Anal. Appl. Pyrolysis 61, 91–109. doi:10.1016/S0165-2370(01)00116-4
Aura, A.M., Niemi, P., Mattila, I., Niemelä, K., Smeds, A., Tamminen, T., Faulds, C., Buchert, J., Poutanen, K., 2013. Release of small phenolic compounds from Brewer’s spent grain and its lignin fractions by human intestinal microbiota in vitro. J. Agric. Food Chem. 61, 9744–9753. doi:10.1021/jf4024195
Bai, Y.Y., Xiao, L.P., Shi, Z.J., Sun, R.C., 2013. Structural variation of bamboo lignin before and after ethanol organosolv pretreatment. Int. J. Mol. Sci. 14, 21394–21413. doi:10.3390/ijms141121394
Barbosa, L.C.A., Maltha, C.R., Silva, V.L., Colodette, J.L., 2008. Determination of the syringyl/guaiacyl ratio in eucalyptus wood by pyrolysis-gas chromatography/mass spectrometry (Py-GC/MS). Quim. Nova 31, 2035–2041. doi:10.1590/S0100-40422008000800023
Blokker, P., Boelen, P., Broekman, R., Rozema, J., 2006. The occurrence of p-coumaric acid and ferulic acid in fossil plant materials and their use as UV-proxy. Plant Ecol. 182, 197–207. doi:10.1007/s11258-005-9026-y
Bocchini, P., Galletti, G.C., Camarero, S., Martinez, A.T., 1997. Absolute quantitation of lignin pyrolysis products using an internal standard. J. Chromatogr. A 773, 227–232.
61
Brezny, R., Mihalov, V., Kovasick, V., 1983. Low temperature thermolysis of lignins. Holzforschung 37, 199–204.
Böttcher, J.H., 1993. Untersuchungen zur Charakterisierung von Holz und Holzkomponenten mittels konventioneller Analysentechniken und der FTIR- Spekroskopie unter Anwendung von multivariaten statistischen Verfahren. University of Hamburg.
Camarero, S., Bocchini, P., Galletti, G.C., Martínez, A.T., 1999. Pyrolysis-gas chromatography/mass spectrometry analysis of phenolic and etherified units in natural and industrial lignins. Rapid Commun. Mass Spectrom. 13, 630–636. doi:10.1002/(SICI)1097-0231(19990415)13:7<630::AID-RCM535>3.0.CO;2-5
Camarero, S., Bocchini, P., Galletti, G.C., Martinez, M.J., Martinez, A.T., 2001. Compositional changes of weat lignin by a funagal peroxidase analysed by pyrolysis-GC-MS. J. Anal. Appl. Pyrolysis 58–59, 413–423.
Challinor, J.M., 2001. Review: The development and applications of thermally assisted hydrolysis and methylation reactions. J. Anal. Appl. Pyrolysis 61, 3–34. doi:10.1016/S0165-2370(01)00146-2
Challinor, J.M., 1996. Characterisation of wood extractives by pyrolysis-gas chromatography/mass spectrometry of quaternary ammonium hydroxide extracts. J. Anal. Appl. Pyrolysis 37, 1–13.
Challinor, J.M., 1995. Characterisation of wood by pyrolysis derivatisation gas chromatography–mass spectrometry. J. Anal. Appl. Pyrolysis 35, 93–107.
Challinor, J.M., 1989. A Pyrolysis-derivatisation-gas chromatography technique for the structural elucidation of some synthetic polymers. J. Anal. Appl. Pyrolysis 16, 323–333.
Chang, G., Huang, Y., Xie, J., Yang, H., Liu, H., Yin, X., Wu, C., 2016. The lignin pyrolysis composition and pyrolysis products of palm kernel shell, wheat straw, and pine sawdust. Energy Convers. Manag. 124, 587–597. doi:10.1016/j.enconman.2016.07.038
Choi, B.J., Faix, O., Meier, D., 2001. Characterization of Residual Lignins from Chemical Pulps of Spruce (Picea abies L.) and Beech (Fagus sylvatica L.) by Analytical Pyrolysis – Gas Chromatography/Mass Spectrometry. Holzforschung 55, 185–192.
Choi, S.S., Kim, M.C., Kim, Y.K., 2011. Influence of silica on formation of levoglucosan from carbohydrates by pyrolysis. J. Anal. Appl. Pyrolysis 90, 56–62. doi:10.1016/j.jaap.2010.10.009
Clifford, D.J., Carson, D.M., McKinney, D.E., Bortiatynski, J.M., Hatcher, P.G., 1995. A new rapid technique for the characterization of lignin in vascular plants: thermochemolysis with tetramethylammonium hydroxide (TMAH). Org. Geochem. 23, 169–175. doi:10.1016/0146-6380(94)00109-E
del Río, J.C., Gutiérrez, A., Hernando, M., Landín, P., Romero, J., Martínez, Á.T., 2005. Determining the influence of eucalypt lignin composition in paper pulp yield using Py-GC/MS. J. Anal. Appl. Pyrolysis 74, 110–115. doi:10.1016/j.jaap.2004.10.010
del Río, J.C., Gutiérrez, A., Martínez, M.J., Martínez, A.T., 2001a. Py-GC/MS study of Eucalyptus globulus wood treated with different fungi. J. Anal. Appl. Pyrolysis 58–59, 441–452. doi:10.1016/S0165-2370(00)00184-4
del Río, J.C., Gutiérrez, A., Rodríguez, I.M., Ibarra, D., Martínez, Á.T., 2007a. Composition of non-woody plant lignins and cinnamic acids by Py-GC/MS, Py/TMAH and FT-IR. J. Anal. Appl. Pyrolysis 79, 39–46. doi:10.1016/j.jaap.2006.09.003
del Río, J.C., Gutiérrez, A., Romero, J., Martínez, M.J., Martínez, A.T., 2001b. Identification of residual lignin markers in eucalypt kraft pulps by Py-GC/MS. J. Anal. Appl. Pyrolysis 58–59, 425–439. doi:10.1016/S0165-2370(00)00126-1
del Río, J.C., Lino, A.G., Colodette, J.L., Lima, C.F., Gutiérrez, A., Martínez, Á.T., Lu, F., Ralph, J., Rencoret, J., 2015. Differences in the chemical structure of the lignins from sugarcane bagasse

62
and straw. Biomass and Bioenergy 81, 322–338. doi:10.1016/j.biombioe.2015.07.006
del Río, J.C., Marques, G., Rencoret, J., Martínez, Á.T., Gutiérrez, A., 2007b. Occurrence of naturally acetylated lignin units. J. Agric. Food Chem. 55, 5461–5468. doi:10.1021/jf0705264
del Río, J.C., Martin, F., Gonzalez-Vila, F.J., 1996. Thermally assisted hydrolysis and alkylation as a novel pyrolytic approach for the structural characterization of natural biopolymers and geomacromolecules. TrAC - Trends Anal. Chem. 15, 70–79. doi:10.1016/0165-9936(96)80763-1
del Río, J.C., Rencoret, J., Prinsen, P., Martínez, Á.T., Ralph, J., Gutiérrez, A., 2012. Structural characterization of wheat straw lignin as revealed by analytical pyrolysis, 2D-NMR, and reductive cleavage methods. J. Agric. Food Chem. 60, 5922–5935. doi:10.1021/jf301002n
del Río, J.C., Speranza, M., Gutiérrez, A., Martínez, M.J., Martínez, A.T., 2002. Lignin attack during eucalypt wood decay by selected basidiomycetes: A Py-GC/MS study. J. Anal. Appl. Pyrolysis 64, 421–431. doi:10.1016/S0165-2370(02)00043-8
Dizhbite, T., Telysheva, G., Dobele, G., Arshanitsa, A., Bikovens, O., Andersone, A., Kampars, V., 2011. Py-GC/MS for characterization of non-hydrolyzed residues from bioethanol production from softwood. J. Anal. Appl. Pyrolysis 90, 126–132. doi:10.1016/j.jaap.2010.11.004
Drechsel, D., Dettmer, K., Engewald, W., 2003. Studies of thermally assisted hydrolysis and methylation - GC-MS of fatty acids and triglycerides using different reagents and injection systems. Chromatographia 57, S-283-S-289. doi:10.1007/BF02492117
Du, X., Pérez-Boada, M., Fernández, C., Rencoret, J., del Río, J.C., Jiménez-Barbero, J., Li, J., Gutiérrez, A., Martínez, A.T., 2014. Analysis of lignin–carbohydrate and lignin–lignin linkages after hydrolase treatment of xylan–lignin, glucomannan–lignin and glucan–lignin complexes from spruce wood. Planta 239, 1079–1090. doi:10.1007/s00425-014-2037-y
Ericsson, I., 1985. Influence of pyrolysis parameters on results in pyrolysis-gas chromatography. J. Anal. Appl. Pyrolysis 8, 73–86. doi:10.1016/0165-2370(85)80016-4
Ericsson, I., 1978. Sequential Pyrolysis Gas Chromatographic Study of the Decomposition Kinetics of Cis-1,4-Polybutadiene. J. Chromatogr. Sci. 16, 340–344. doi:10.1093/chromsci/16.8.340
Ericsson, I., Lattimer, R.P., 1995. Nomenclature and terminology for analytical pyrolysis. J. Anal. Appl. Pyrolysis 31, 251–256.
Fahmi, R., Bridgwater, A. V., Thain, S.C., Donnison, I.S., Morris, P.M., Yates, N., 2007. Prediction of Klason lignin and lignin thermal degradation products by Py-GC/MS in a collection of Lolium and Festuca grasses. J. Anal. Appl. Pyrolysis 80, 16–23. doi:10.1016/j.jaap.2006.12.018
Faix, O., Fortmann, I., Bremer, J., Meier, D., 1991a. Thermal degradation products of wood: A collection of electron-impact (EI) mass spectra of polysaccharide derived products. Holz als Roh- und Werkst. 49, 299–304.
Faix, O., Fortmann, I., Bremer, J., Meier, D., 1991b. Thermal degradation products of wood: Gas chromatographic separation and mass spectrometric characterization of polysaccharide derived products. Holz als Roh- und Werkst. 49, 213–219.
Faix, O., Meier, D., Fortmann, I., 1990a. Thermal degradation products of wood: Gas chromatographic separation and mass spectrometric characterization of monomeric lignin derived products. Holz als Roh- und Werkst. 48, 281–285.
Faix, O., Meier, D., Fortmann, I., 1990b. Thermal degradation products of wood: A collection of electron-impact (EI) mass spectra of monomeric lignin derived products. Holz als Roh- und Werkst. 48, 351–354.
Faix, O., Meier, D., Fortmann, I., 1988. Pyrolysis-gas chromatography-mass spectrometry of two trimeric lignin model compounds with alkyl-aryl ether structure. J. Anal. Appl. Pyrolysis 14, 135–148.

63
Fengel, D., Wegener, G., 1989. Wood: Chemistry, Ultrastructure, Reactions. Walter de Gruyter, Berlin, Germany.
Funakoshi, H., Shiraishi, N., Norimoto, M., Aoki, T., Hayashi, H., Yokota, T., 1979. Studies on the thermoplasticization of wood. Holzforschung 33, 159–166.
Galetta, M.A., Reina, L., Resquin, F., Mantero, C., González-Pérez, J.A., Almendros, G., Menéndez, M.P., González-Vila, F.J., 2014. Chemometric appraisal of lignin pyrolytic assemblages from Eucalyptus woods relevant for pulping in Uruguay. J. Anal. Appl. Pyrolysis 109, 296–303. doi:10.1016/j.jaap.2014.08.001
Gardner, D.J., Schultz, T.P., McGinnis, G.D., 1985. The pyrolytic behaviour of selected lignin preparations. J. Wood Chem. Technol. 5, 85–110.
Gellerstedt, G., Pranda, J., Lindfors, E.-L., 1994. Structural and molecular properties of residual birch kraft lignins. J. Wood Chem. Technol. 14, 467–482.
González-Vila, F.J., Almendros, G., del Río, J.C., Martín, F., Gutiérrez, A., Romero, J., 1999. Ease of delignification assessment of wood from different Eucalyptus species by pyrolysis (TMAH)-GC/MS and CP/MAS 13C-NMR spectrometry. J. Anal. Appl. Pyrolysis 49, 295–305. doi:10.1016/S0165-2370(98)00097-7
Grasset, L., Guignard, C., Amblès, A., 2002. Free and esterified aliphatic carboxylic acids in humin and humic acids from a peat sample as revealed by pyrolysis with tetramethylammonium hydroxide or tetraethylammonium acetate. Org. Geochem. 33, 181–188. doi:10.1016/S0146-6380(01)00150-4
Grinins, J., Andersons, B., Biziks, V., Andersone, I., Dobele, G., 2013. Analytical pyrolysis as an instrument to study the chemical transformations of hydrothermally modified wood. J. Anal. Appl. Pyrolysis 103, 36–41. doi:10.1016/j.jaap.2012.10.016
Guerra, A., Filpponen, I., Lucia, L.A., Saquing, C., Baumberger, S., Argyropoulos, D.S., 2006. Toward a Better Understanding of the Lignin Isolation Process from Wood. J. Agric. Food Chem. 54, 5939–5947.
Guignard, C., Lemée, L., Amblès, A., 2005. Lipid constituents of peat humic acids and humin. Distinction from directly extractable bitumen components using TMAH and TEAAc thermochemolysis. Org. Geochem. 36, 287–297. doi:10.1016/j.orggeochem.2004.07.016
Gutiérrez, A., Rodríguez, I.M., del Río, J.C., 2006. Chemical characterization of lignin and lipid fractions in industrial hemp bast fibers used for manufacturing high-quality paper pulps. J. Agric. Food Chem. 54, 2138–2144. doi:10.1021/jf052935a
Hardell, H.-L., Nilvebrant, N.-O., 1999. A rapid method to discriminate between free and esterified fatty acids by pyrolytic methylation using tetramethylammonium acetate or hydroxide. J. Anal. Appl. Pyrolysis 52, 1–14. doi:10.1016/S0165-2370(99)00035-2
Hardell, H.-L., Nilvebrant, N.-O., 1996. Analytical pyrolysis of spruce milled wood lignins in the presence of tetramethylammonium hydroxide. Nord. Pulp Pap. Res. J. 11, 121–126.
Hasumi, A., Nakagawa-Izumi, A., Homma, M., Ohi, H., Nakamata, K., 2009. Structural Micro-analysis of Residual Lignin in Pulp by Pyrolysis-GC Mass spectrometry. Japan Tappi J. 63, 81–88.
Helleur, R.J., 1987. Characterization of the saccharide composition of heteropolysaccharides by pyrolysis-capillary gas chromatography-mass spectrometry. J. Anal. Appl. Pyrolysis 11, 297–311.
Hermosin, B., Saiz-Jimenez, C., 1999. Thermally assisted hydrolysis and methylation of milled beech leaf litter. J. Anal. Appl. Pyrolysis 49, 417–424. doi:10.1016/S0165-2370(98)00111-9
Higman, E.B., Schmeeltz, I., Schlotzhauer, W.S., 1970. Products from the Thermal Degradation of Some Naturally Occuring Materials. J. Agric. Food Chem. 18, 636–639.
Hult, E.-L., Ropponen, J., Poppius-Levlin, K., Ohra-aho, T., Tamminen, T., 2013. Enhancing the

64
barrier properties of paper board by a novel lignin coating. Ind. Crops Prod. 50, 694–700. doi:10.1016/j.indcrop.2013.08.013
Ibarra, D., Chávez, M.I., Rencoret, J., del Río, J.C., Gutiérrez, A., Romero, J., Camarero, S., Martínez, M.J., Jiménez-Barbero, J., Martínez, A.T., 2007. Lignin Modification during Eucalyptus globulus Kraft Pulping Followed by Totally Chlorine-Free Bleaching: A Two-Dimensional Nuclear Magnetic Resonance, Fourier Transform Infrared, and Pyrolysis−Gas Chromatography/Mass Spectrometry Study. J. Agric. Food Chem. 55, 3477–3490. doi:10.1021/jf063728t
Ibarra, D., del Río, J.C., Gutiérrez, A., Rodríguez, I.M., Romero, J., Martínez, M.J., Martínez, Á.T., 2005. Chemical characterization of residual lignins from eucalypt paper pulps. J. Anal. Appl. Pyrolysis 74, 116–122. doi:10.1016/j.jaap.2004.12.009
Ishida, Y., Katagiri, M., Ohtani, H., 2009. Reaction efficiency of organic alkalis with various classes of lipids during thermally assisted hydrolysis and methylation. J. Chromatogr. A 1216, 3296–3299. doi:10.1016/j.chroma.2009.01.071
Izumi, A., Kuroda, K., Ohi, H., Yamaguchi, A., 1995a. Strucutral Analysis of Lignin by Pyrolysis-Gas Chromatography (III) -Comparative studues of pyrolysis-gas chromatography and nitrobenzene oxidation for the determination method of lignin composition in hardwood. Japan TAPPI J. 49, 1339–1346.
Izumi, A., Kuroda, K., Ohi, H., Yamaguchi, A., 1995b. No title. Mokuzai Gakkaishi 49, 735–745.
Izumi, A., Kuroda, K.I., 1997. Pyrolysis-mass spectrometry analysis of dehydrogenation lignin polymers with various syringyl/guaiacyl ratios. Rapid Commun. Mass Spectrom. 11, 1709–1715. doi:10.1002/(SICI)1097-0231(19971015)11:15<1709::AID-RCM5>3.0.CO;2-J
Jacquet, G., Pollet, B., Lapierre, C., Mhamdi, F., Rolando, C., 1995. New ether-linked ferulic acid-coniferyl alcohol dimers identified in grass straws. J. Agric. Food Chem. 43, 2746–2751.
Jiang, X.-Y., Lu, Q., Ye, X.-N., Hu, B., Dong, C.-Q., 2016. Experimental and theoretical studies on the pyrolysis mechanism of β-1-type lignin dimer model compound. BioResources 11, 6232–6243. doi:10.15376/biores.11.3.6232-6243
Joll, C.A., Couton, D., Heitz, A., Kagi, R.I., 2004. Comparison of reagents for off-line thermochemolysis of natural organic matter. Org. Geochem. 35, 47–59. doi:10.1016/j.orggeochem.2003.06.002
Jun-kai, D., Wei, J., Tian-zhi, Z., Ming, S., 1997. The effect polyunsaturated proportions thermally of isomerization and degradation of fatty acids from oils by different volume of tetramethylammonium hydroxide in assisted hydrolysis and methylation. J. Anal. Appl. Pyrolysis 42, 1–8.
Kangas, H., Liitiä, T., Rovio, S., Ohra-aho, T., Heikkinen, H., Tamminen, T., Poppius-Levlin, K., 2015. Characterization of dissolved lignins from acetic acid Lignofibre (LGF) organosolv pulping and discussion of its delignification mechanisms. Holzforschung 69, 247–256. doi:10.1515/hf-2014-0070
Karnofski, M.A., 1975. Odor generation in the kraft process. J. Chem. Educ.
Kawamoto, H., 2017. Lignin pyrolysis reactions. J. Wood Sci. 63, 117–132. doi:10.1007/s10086-016-1606-z
Kawamoto, H., Horigoshi, S., Saka, S., 2007. Effects of side-chain hydroxyl groups on pyrolytic β-ether cleavage of phenolic lignin model dimer. J. Wood Sci. 53, 268–271. doi:10.1007/s10086-006-0839-7
Kawamoto, H., Nakamura, T., Saka, S., 2008. Pyrolytic cleavage mechanisms of lignin-ether linkages : A study on p -substituted dimers and trimers. Holzforschung 62, 50–56. doi:10.1515/HF.2008.007

65
Kleen, M., Gellerstedt, G., 1995. Influence of inorganic species on the formation polysaccharide and lignin degradation products in the analytical pyrolysis of pulps. J. Anal. Appl. Pyrolysis 35, 15–41.
Kleen, M., Gellerstedt, G., 1991. Characterization of chemical and mechanical pulps by pyrolysis-gas chromatography/mass spectrometry. J. Anal. Appl. Pyrolysis 19, 139–152.
Kleen, M., Lindblad, G., Backa, S., 1993. Quntification of lignin and carbohydrates in Kraft pulps using analytical pyrolysis and multivariate data analysis. J. Anal. Appl. Pyrolysis 25, 209–227.
Kleen, M., Ohra-aho, T., Tamminen, T., 2003. On the interaction of HBT with pulp lignin during mediated laccase delignification - A study using fractionated pyrolysis-GC/MS. J. Anal. Appl. Pyrolysis 70, 589–600. doi:10.1016/S0165-2370(03)00028-7
Koning, S., Janssen, H.-G., Brinkman, U.A.T., 2009. Modern Methods of Sample Preparation for GC Analysis. Chromatographia 69, 33–78. doi:10.1365/s10337-008-0937-3
Kuroda, K., Ashitani, T., 2007. Thermal behavior of β-1 subunits in lignin: pyrolysis of 1, 2-diarylpropane-1, 3-diol-type lignin model compounds. J. Agric. Food Chem. 55, 2770–2778.
Kuroda, K. ichi, Nakagawa-izumi, A., 2006. Analytical pyrolysis of lignin: Products stemming from β-5 substructures. Org. Geochem. 37, 665–673. doi:10.1016/j.orggeochem.2006.01.012
Kuroda, K. ichi, Yamaguchi, A., 1995. Classification of Japanese softwood species by pyrolysis-gas chromatography. J. Anal. Appl. Pyrolysis 33, 51–59. doi:10.1016/0165-2370(94)00828-O
Kuroda, K., Suzuki, A., Kato, M., Imai, K., 1995. Analysis of rice (Oryza sativa L.) lignin by pyrolysis-gas chromatography. J. Anal. Appl. Pyrolysis 34, 1–12. doi:10.1016/0165-2370(94)00850-Z
Kuroda, K., Yamaguchi, A., Sakai, K., 1994. Analysis of Sugi wood and its lignin preparations. Mokuzai Gakkaishi 40, 987–995.
Kuroda, K.I., 2002. Electron-impact (EI) mass spectra of 1,2-dimethoxybenzenes related to the pyrolysis products of guaiacyl lignin in the presence of tetramethylammonium hydroxide (TMAH). J. Anal. Appl. Pyrolysis 64, 433–451. doi:10.1016/S0165-2370(02)00044-X
Kuroda, K.I., 2000a. Pyrolysis-trimethylsilylation analysis of lignin: Preferential formation of cinnamyl alcohol derivatives. J. Anal. Appl. Pyrolysis 56, 79–87. doi:10.1016/S0165-2370(00)00085-1
Kuroda, K.I., 2000b. Analytical pyrolysis products derived from cinnamyl alcohol-end groups in lignins. J. Anal. Appl. Pyrolysis 53, 123–134. doi:10.1016/S0165-2370(99)00067-4
Kuroda, K.I., Izumi, A., Mazumder, B.B., Ohtani, Y., Sameshima, K., 2002. Characterization of kenaf (Hibiscus cannabinus) lignin by pyrolysis-gas chromatography-mass spectrometry in the presence of tetramethylammonium hydroxide. J. Anal. Appl. Pyrolysis 64, 453–463. doi:10.1016/S0165-2370(02)00047-5
Kuroda, K.I., Nakagawa-Izumi, A., 2006. Tetramethylammonium hydroxide (TMAH) thermochemolysis of lignin: Improvement of the distribution profile of products derived from b-aryl ether subunits. J. Anal. Appl. Pyrolysis 75, 104–111. doi:10.1016/j.jaap.2005.04.011
Kuroda, K.I., Nakagawa-Izumi, A., Mazumder, B.B., Ohtani, Y., Sameshima, K., 2005. Evaluation of chemical composition of the core and bast lignins of variety Chinpi-3 kenaf (Hibiscus cannabinus L.) by pyrolysis-gas chromatography/mass spectrometry and cupric oxide oxidation. Ind. Crops Prod. 22, 223–232. doi:10.1016/j.indcrop.2005.01.002
Kuroda, K.I., Ozawa, T., Ueno, T., 2001. Characterization of sago palm (Metroxylon sagu) lignin by analytical pyrolysis. J. Agric. Food Chem. 49, 1840–1847. doi:10.1021/jf001126i
Li, J., Gellerstedt, G., 2002. Oxymercuration-demercuration kappa number : An ccurate estimation of the lignin content in chemical pulps. Nord. Pulp Pap. Res. J. 17, 410–414.
Li, J., Gellerstedt, G., 1997. The contribution to kappa number from hexeneuronic acid groups in pulp

66
xylan. Carbohydr. Res. 302, 213–218.
Li, J., Sevastyanova, O., Gellerstedt, G., 2002. The distribution of oxidizable structures in ECF- and TCF-bleached kraft pulps. Nord. Pulp Pap. Res. J. 17, 415–419.
Lima, C.F., Barbosa, L.C.A., Marcelo, C.R., Silvério, F.O., Colodette, J.L., 2008. Comparison between analytical pyrolysis and nitrobenzene oxidation for determination of syringyl/guaiacyl ratio in Eucalyptus spp. Lignin. BioResources 3, 701–712.
Lima, C.F., Barbosa, L.C.A., Silva, M.N.N., Colodette, J.L., Silvério, F.O., 2015. In situ determination of the syringyl/guaiacyl ratio of residual lignin in pre-bleached eucalypt kraft pulps by analytical pyrolysis. J. Anal. Appl. Pyrolysis 112, 164–172. doi:10.1016/j.jaap.2015.02.002
Lin, S.Y., Dence, C.W., 1992. Methods in Lignin Chemistry. Springer-Verlag, Nev Yourk.
Liu, C., Hu, J., Zhang, H., Xiao, R., 2016. Thermal conversion of lignin to phenols: Relevance between chemical structure and pyrolysis behaviors. Fuel 182, 864–870. doi:10.1016/j.fuel.2016.05.104
Liu, Y., Liu, Y., Lyu, G., Ji, X., Yang, G., Chen, J., Lucia, L.A., 2016. Analytical Pyrolysis Pathways of Guaiacyl Glycerol- β -guaiacyl Ether by Py-GC/MS. BioResources 11, 5816–5828.
Lopes, F.J.F., Silvério, F.O., Baffa, D.C.F., Loureiro, M.E., Barbosa, M.H.P., 2011. Determination of Sugarcane Bagasse Lignin S/G/H Ratio by Pyrolysis GC/MS. J. Wood Chem. Technol. 31, 309–323. doi:10.1080/02773813.2010.550379
Lourenço, A., Gominho, J., Marques, A.V., Pereira, H., 2013. Py-GC/MS(FID) assessed behavior of polysaccharides during kraft delignification of Eucalyptus globulus heartwood and sapwood. J. Anal. Appl. Pyrolysis 101, 142–149. doi:10.1016/j.jaap.2013.01.018
Lourenço, A., Gominho, J., Marques, A.V., Pereira, H., 2012. Reactivity of syringyl and guaiacyl lignin units and delignification kinetics in the kraft pulping of Eucalyptus globulus wood using Py-GC-MS/FID. Bioresour. Technol. 123, 296–302. doi:10.1016/j.biortech.2012.07.092
Lourenço, A., Rencoret, J., Chemetova, C., Gominho, J., Gutiérrez, A., del Río, J.C., Pereira, H., 2016. Lignin Composition and Structure Differs between Xylem, Phloem and Phellem in Quercus suber L. Front. Plant Sci. 7, 1–14. doi:10.3389/fpls.2016.01612
Łucejko, J.J., Zborowska, M., Modugno, F., Colombini, M.P., Praogonekdzyński, W., 2012. Analytical pyrolysis vs. classical wet chemical analysis to assess the decay of archaeological waterlogged wood. Anal. Chim. Acta 745, 70–77. doi:10.1016/j.aca.2012.07.046
Mamleev, V., Bourbigot, S., Le Bras, M., Yvon, J., 2009. The facts and hypotheses relating to the phenomenological model of cellulose pyrolysis. Interdependence of the steps. J. Anal. Appl. Pyrolysis 84, 1–17. doi:10.1016/j.jaap.2008.10.014
Mamleev, V., Bourbigot, S., Le Bras, M., Yvon, J., Lefebvre, J., 2006. Model-free method for evaluation of activation energies in modulated thermogravimetry and analysis of cellulose decomposition. Chem. Eng. Sci. 61, 1276–1292. doi:10.1016/j.ces.2005.07.040
Martínez, A.T., Camarero, S., Gutiérrez, A., Bocchini, P., Galletti, G.C., 2001. Studies on wheat lignin degradation by Pleurotus species using analytical pyrolysis. J. Anal. Appl. Pyrolysis 58–59, 401–411. doi:10.1016/S0165-2370(00)00116-9
Martínez, Á.T., Speranza, M., Ruiz-Dueñas, F.J., Ferreira, P., Camarero, S., Guillén, F., Martínez, M.J., Gutiérrez, A., Del Río, J.C., 2005. Biodegradation of lignocellulosics: Microbial, chemical, and enzymatic aspects of the fungal attack of lignin. Int. Microbiol. 8, 195–204. doi:im2305029 [pii]
Mazumder, B.B., Nakgawa-Izumi, A., Kuroda, K.I., Ohtani, Y., Sameshima, K., 2005. Evaluation of harvesting time effects on kenaf bast lignin by pyrolysis-gas chromatography. Ind. Crops Prod. 21, 17–24. doi:10.1016/j.indcrop.2003.12.003
Meier, D., Fortmann, I., Odermatt, J., Faix, O., 2005. Discrimination of genetically modified poplar clones by analytical pyrolysis-gas chromatography and principal component analysis. J. Anal.

67
Appl. Pyrolysis 74, 129–137. doi:10.1016/j.jaap.2004.12.001
Mettler, M.S., Paulsen, A.D., Vlachos, D.G., Dauenhauer, P.J., 2012. The chain length effect in pyrolysis: bridging the gap between glucose and cellulose. Green Chem. 14, 1284. doi:10.1039/c2gc35184f
Mizumoto, M., Shimokita, E., Ona, T., Seino, T., Ishida, Y., Ohtani, H., 2010. Rapid and direct characterization of total fatty acids in wood by thermochemolysis-gas chromatography-flame ionization detector/mass spectrometry with tetrabutylammonium hydroxide. J. Anal. Appl. Pyrolysis 87, 163–167. doi:10.1016/j.jaap.2009.11.004
Moldoveanu, S.C., 2010. The chemistry of the pyrolytic process., in: Moldoveanu, S.C. (Ed.), Pyrolysis of Organic Molecules with Applications to Health and Environmental Issues. Elsevier B.V., Oxford, pp. 7–48.
Mullen, C.A., Boateng, A.A., 2010. Catalytic pyrolysis-GC/MS of lignin from several sources. Fuel Process. Technol. 91, 1446–1458. doi:10.1016/j.fuproc.2010.05.022
Mussatto, S.I., 2014. Brewer ’ s spent grain : a valuable feedstock for industrial applications. J. Agric. Food Chem. 94, 1264–1275. doi:10.1002/jsfa.6486
Mussatto, S.I., Dragone, G., Roberto, I.C., 2006. Brewers’ spent grain: Generation, characteristics and potential applications. J. Cereal Sci. 43, 1–14. doi:10.1016/j.jcs.2005.06.001
Müller-Hagedorn, M., Bockhorn, H., Krebs, L., Müller, U., 2003. A comparative kinetic study on the pyrolysis of three different wood species. J. Anal. Appl. Pyrolysis 68–69, 231–249. doi:10.1016/S0165-2370(03)00065-2
Nakagawa-Izumi, A., Kuroda, K., 2003. Analysis of cinnamyl alcohol- and cinnamyl aldehyde end groups in lignin by trimethylsilylation/pyrolysis-gas chromatography. Bunseki Kagaku 52, 1159–1166. doi:10.2116/bunsekikagaku.52.1159
Nakamura, T., Kawamoto, H., Saka, S., 2008. Pyrolysis behavior of Japanese cedar wood lignin studied with various model dimers. J. Anal. Appl. Pyrolysis 81, 173–182. doi:10.1016/j.jaap.2007.11.002
Nanayakkara, B., Riddell, M., Harrington, J., 2016. Screening of juvenile Pinus radiata wood by means of Py-GC/MS for compression wood focussing on the ratios of p-hydroxyphenyl to guaiacyl units (H/G ratios). Holzforschung 70, 313–321. doi:10.1515/hf-2015-0068
Niemelä, K., 1988. The formation of 2-hydroxy-2-cyclopenten-1-ones from polysaccahrides dueing kraft pulping of pine wood. Carbohydr. Res. 184, 131–137.
Niemi, P., Tamminen, T., Smeds, A., Viljanen, K., Ohra-aho, T., Holopainen-Mantila, U., Faulds, C.B., Poutanen, K., Buchert, J., 2012. Characterization of lipids and lignans in brewer’s spent grain and its enzymatically extracted fraction. J. Agric. Food Chem. 60, 9910–9917. doi:10.1021/jf302684x
Nierop, K.G.J., Filley, T.R., 2008. Simultaneous analysis of tannin and lignin signatures in soils by thermally assisted hydrolysis and methylation using 13C-labeled TMAH. J. Anal. Appl. Pyrolysis 83, 227–231. doi:10.1016/j.jaap.2008.07.004
Nonier, M.F., Vivas, N., Vivas De Gaulejac, N., Absalon, C., Soulie, P., Fouquet, E., 2006. Pyrolysis-gas chromatography/mass spectrometry of Quercus sp. wood: Application to structural elucidation of macromolecules and aromatic profiles of different species. J. Anal. Appl. Pyrolysis 75, 181–193. doi:10.1016/j.jaap.2005.05.006
Nunes, C.A., Lima, C.F., Barbosa, L.C.A., Colodette, J.L., Gouveia, A.F.G., Silvério, F.O., 2010. Determination of Eucalyptus spp lignin S/G ratio: A comparison between methods. Bioresour. Technol. 101, 4056–4061. doi:10.1016/j.biortech.2010.01.012
Ohara, S., Yasuta, Y., Ohi, H., 2003. Structure Elucidation of Condensed Tannins from Barks by Pyrolysis/ Gas Chromatography. Holzforschung 57, 145–149.

68
Ohra-aho, T., Linnekoski, J., 2015. Catalytic pyrolysis of lignin by using analytical pyrolysis-GC-MS. J. Anal. Appl. Pyrolysis 113, 186–192. doi:10.1016/j.jaap.2014.12.012
Ohra-aho, T., Sipilä, J., Tamminen, T., 2000. Analysis of lignin and model compounds by Pyrolysis-GC/MS, in: Proceedings of the Sixth EuropeanWorkshop on Lignocellulosics and Pulp. Bordeaux, France, pp. 487–490.
Oudia, A., Mészáros, E., Jakab, E., Simões, R., Queiroz, J., Ragauskas, A., Novák, L., 2009. Analytical pyrolysis study of biodelignification of cloned Eucalyptus globulus (EG) clone and Pinus pinaster Aiton kraft pulp and residual lignins. J. Anal. Appl. Pyrolysis 85, 19–29. doi:10.1016/j.jaap.2008.09.015
Oudia, A., Mészáros, E., Simões, R., Queiroz, J., Jakab, E., 2007. Pyrolysis-GC/MS and TG/MS study of mediated laccase biodelignification of Eucalyptus globulus kraft pulp. J. Anal. Appl. Pyrolysis 78, 233–242. doi:10.1016/j.jaap.2006.07.003
Patwardhan, P.R., Satrio, J.A., Brown, R.C., Shanks, B.H., 2010. Influence of inorganic salts on the primary pyrolysis products of cellulose. Bioresour. Technol. 101, 4646–4655. doi:10.1016/j.biortech.2010.01.112
Paulsen, A.D., Mettler, M.S., Dauenhauer, P.J., 2013. The role of sample dimension and temperature in cellulose pyrolysis. Energy and Fuels 27, 2126–2134. doi:10.1021/ef302117j
Pinto, P.C., Evtuguin, D. V., Neto, C.P., Silvestre, A.J.D., Amado, F.M.L., 2002. Behavior of Eucalyptus globulus lignin during kraft pulping. I. Analysis by NMR, ESI/MS, and GPC. J. Wood Chem. Technol. 22, 109–125. doi:10.1081/WCT-120013356
Ponomarenko, J., Dizhbite, T., Lauberts, M., Volperts, A., Dobele, G., Telysheva, G., 2015. Analytical pyolysis - A tool for revealing of lignin structure - antioxidant activity relationship. J. Anal. Appl. Pyrolysis 113, 360–396. doi:10.1016/j.jaap.2015.02.027
Poppius-Levlin, K., Tamminen, T., Kalliola, A., Ohra-aho, T., 2001. Characterization of residual lignins in pulps delignified by laccase/N-hydroxyacetanilide, ACS Symposium Series.
Prinsen, P., Gutiérrez, A., Rencoret, J., Nieto, L., Jiménez-Barbero, J., Burnet, A., Petit-Conil, M., Colodette, J.L., Martínez, Á.T., del Río, J.C., 2012. Morphological characteristics and composition of lipophilic extractives and lignin in Brazilian woods from different eucalypt hybrids. Ind. Crops Prod. 36, 572–583. doi:10.1016/j.indcrop.2011.11.014
Prinsen, P., Rencoret, J., Gutie, A., Liitia, T., Tamminen, T., Colodette, J.L., Mart, A.T., Jose, C., 2013. Modification of the Lignin Structure during Alkaline Deligni fi cation of Eucalyptus Wood by Kraft , Soda-AQ , and Soda-O2 Cooking. Ind. Eng. Chem. Res. 52, 15702–15712.
Qiang, L., Wen-zhi, L., Dong, Z., Xi-feng, Z., 2009. Analytical pyrolysis-gas chromatography/mass spectrometry (Py-GC/MS) of sawdust with Al/SBA-15 catalysts. J. Anal. Appl. Pyrolysis 84, 131–138. doi:10.1016/j.jaap.2009.01.002
Ralph, J., 2010. Hydroxycinnamates in lignification. Phytochem. Rev. 9, 65–83.
Ralph, J., Brunow, G., Boerjan, W., 2007. Encyclopedia of life science. John Wiley and Sons, pp. 1–10.
Ralph, J., Hatfield, R.D., 1991. Pyrolysis-GC–MS characterization of forage materials. J. Agric. Food Chem. 39, 1426–1437.
Ralph, J., Hatfield, R.D., Piquemal, J., Yahiaoui, N., Pean, M., Lapierre, C., Boudet, A.M., 1998. NMR characterization of altered lignins extracted from tobacco plants down-regulated for lignification enzymes cinnamylalcohol dehydrogenase and cinnamoyl-CoA reductase. Proc. Natl. Acad. Sci. U. S. A. 95, 12803–12808. doi:10.1073/pnas.95.22.12803
Reina, L., Galetta, A., Vinciguerra, V., Resquin, F., Menéndez, P., 2014. The relationship between Eucalyptus grandis lignin structure and kraft pulping parameters. J. Anal. Appl. Pyrolysis 107, 284–288. doi:10.1016/j.jaap.2014.03.013

69
Rencoret, J., del Río, J.C., Nierop, K.G.J., Gutiérrez, A., Ralph, J., 2016. Rapid Py-GC / MS assessment of the structural alterations of lignins in genetically modified plants. J. Anal. Appl. Pyrolysis 121, 155–164. doi:10.1016/j.jaap.2016.07.016
Rencoret, J., Marques, G., Ibarra, D., Li, J., Santos, J.I., Rı, C., 2008. Structural characterization of milled wood lignins from different eucalypt species. Holzforschung 62, 514–526. doi:10.1515/HF.2008.096
Rencoret, J., Prinsen, P., Gutiérrez, A., Martinez, Á.T., del Río, J.C., 2015. Isolation and structural characterization of the milled wood lignin, dioxane lignin, and cellulolytic lignin preparations from brewer’s spent grain. J. Agric. Food Chem. 63, 603–613. doi:10.1021/jf505808c
Rencoret, J., Ralph, J., Marques, G., Gutiérrez, A., Martínez, Á.T., del Río, J.C., 2013. Structural characterization of lignin isolated from coconut (Cocos nucifera) coir fibers. J. Agric. Food Chem. 61, 2434–2445. doi:10.1021/jf304686x
Robertson, J.A., I’Anson, K.J.A., Treimo, J., Faulds, C.B., Brocklehurst, T.F., Eijsink, V.G.H., Waldron, K.W., 2010. Profiling brewers’ spent grain for composition and microbial ecology at the site of production. LWT - Food Sci. Technol. 43, 890–896. doi:10.1016/j.lwt.2010.01.019
Rodrigues, J., Graça, J., Pereira, H., 2001. Influence of tree eccentric growth on syringyl/guaiacyl ratio in Eucalyptus globulus wood lignin assessed by analytical pyrolysis. J. Anal. Appl. Pyrolysis 58–59, 481–489. doi:10.1016/S0165-2370(00)00121-2
Rodrigues, J., Meier, D., Faix, O., Pereira, H., 1999. Determination of tree to tree variation in syringyl/guaiacyl ratio of Eucalyptus globulus wood lignin by analytical pyrolysis. J. Anal. Appl. Pyrolysis 48, 121–128. doi:10.1016/S0165-2370(98)00134-X
Ropponen, J., Räsänen, L., Rovio, S., Ohra-aho, T., Liitiä, T., Mikkonen, H., Van De Pas, D., Tamminen, T., 2011. Solvent extraction as a means of preparing homogeneous lignin fractions. Holzforschung 65, 543–549. doi:10.1515/HF.2011.089
S.Y. Lin, Dence, C.W., 1992. Methods in Lignin Chemistry. New York.
Saiz-Jimenez, C., De Leeuw, J.W., 1986. Lignin pyrolysis products: Their structures and their significance as biomarkers. Org. Geochem. 10, 869–876. doi:10.1016/S0146-6380(86)80024-9
Sarkanen, K.V., Hergert, H.L., 1971. Classification and distribution, in: Sarkanen, K.V., Ludwig, C.H. (Eds.), Lignins: Occurrence, Formation, Structure and Reactions. Wiley-Interscience, New York, pp. 43–94.
Schultz, T.P., Templeton, M.C., 1986. Proposed mechanism for the Nitrobenzene Oxidation of Lignin. Holzforschung 40, 93–97.
Selsbo, P., Ericsson, I., Kleen, M., 1997. Characterization of sulfur in wood pulps using pyrolysis-gas chromatography with sulfur-selective detection. J. Anal. Appl. Pyrolysis 43, 1–14. doi:10.1016/S0165-2370(97)00055-7
Shadkami, F., Estevez, S., Helleur, R., 2009. Analysis of catechins and condensed tannins by thermally assisted hydrolysis/methylation-GC/MS and by a novel two step methylation. J. Anal. Appl. Pyrolysis 85, 54–65. doi:10.1016/j.jaap.2008.09.001
Shadkami, F., Helleur, R., 2010. Recent applications in analytical thermochemolysis. J. Anal. Appl. Pyrolysis 89, 2–16. doi:10.1016/j.jaap.2010.05.007
Shaik, S.M., Sharratt, P.N., Tan, R.B.H., 2013. Influence of selected mineral acids and alkalis on cellulose pyrolysis pathways and anhydrosaccharide formation. J. Anal. Appl. Pyrolysis 104, 234–242. doi:10.1016/j.jaap.2013.07.010
Sheirs, J., Camino, G., Tumiatti, W., 2001. Overview of water evolution during the thermal degradation of cellulose. Eur. Polym. J. 37, 933–942.
Shen, D., Zhao, J., Xiao, R., Gu, S., 2015. Production of aromatic monomers from catalytic pyrolysis of

70
black-liquor lignin. J. Anal. Appl. Pyrolysis 111, 47–54. doi:10.1016/j.jaap.2014.12.013
Shen, D.K., Gu, S., Bridgwater, A. V., 2010. The thermal performance of the polysaccharides extracted from hardwood: Cellulose and hemicellulose. Carbohydr. Polym. 82, 39–45. doi:10.1016/j.carbpol.2010.04.018
Sjöberg, J., Kleen, M., Dahlman, O., 2002. Analyses of carbohydrates and lignin in the surface and inner layers of softwood pulp fibers obtained employing various alkalinen cooking processes. Nord. Pulp Pap. Res. J. 17, 296–301.
Sjöström, E., Alen, R., 1999. Analytical Methods in Wood Chemistry, Pulping, and Papermaking. Springer, Berlin.
Sobeih, K.L., Baron, M., Gonzalez-Rodriguez, J., 2008. Recent trends and developments in pyrolysis-gas chromatography. J. Chromatogr. A 1186, 51–66. doi:10.1016/j.chroma.2007.10.017
Sun, R., Lawther, J.M., Banks, W.B., 1995. The effect of alkaline nitrobenzene oxidation conditions on the yield and components of phenolic monomers in wheat straw lignin and compared to cupric(II) oxidation. Ind. Crops Prod. 4, 241–254. doi:10.1016/0926-6690(95)00038-0
Syverud, K., Leirset, I., Vaaler, D., 2003. Characterization of carbohydrates in chemical pulps by pyrolysis gas chromatography/mass spectrometry. J. Anal. Appl. Pyrolysis 67, 381–391. doi:10.1016/S0165-2370(02)00076-1
Tamminen, T., Kleen, M., Ohra-aho, T., Poppius-Levlin, K., 2003a. Chemistry of Mediated-Laccase Delignification Analyzed by Pyrolysis-GC/MS. J. Pulp Pap. Sci. 29, 319–324.
Tamminen, T., Ohra-aho, T., Hortling, B., Tenkanen, M., 2003b. Residual lignin in hydrogen peroxide-bleached softwood pulps, in: Proceedings of the 12th International Symposium onWood Pulp Chemicals, Vol. I. pp. 69–72.
Tanaka, J., Izumi, A., Suzuki, S., Ohi, H., Kuroda, K., 1997. Structural Analysis of Lignin by Pyrolysis-Gas Chromatography (IV) -Comparison with nitrobenzene oxidation for determination of decaed hardwoods and kraft-cooked hardwoods. Japan TAPPI J. 51, 358–366.
Tenkanen, M., Gellerstedt, G., Vuorinen, T., Teleman, A., Perttula, M., Li, J., Buchert, J., 1999. Determination of Hexenuronic Acid in Softwood Kraft Pulps by Three Different Methods. J. Pulp Pap. Sci. 25, 305–311.
Thiebaud, S., Borredon, M.E., Baziard, G., Senocq, F., 1997. Properties of wood esterified by fatty-acid chlorides. Bioresour. Technol. 59, 103–107.
Tsutsumi, B.Y., Kondo, R., Sakai, K., Imamura, H., 1995. The Difference of Reactivity between Syringyl Lignin and Guaiacyl Lignin in Alkaline Systems. Holzforschung 49, 423–428.
Tydén-Ericsson, I., 1973. A new pyrolyzer with improved control of pyrolysis conditions. Chromatographia 6, 353–358. doi:10.1007/BF02270569
Válková, D., Grasset, L., Amblès, A., 2009. Molecular compounds generated by ruthenium tetroxide oxidation and preparative off line thermochemolysis of lignite humic acids from South Moravia: Implications for molecular structure. Fuel 88, 2113–2121. doi:10.1016/j.fuel.2009.01.026
Wallis, A., Wearne, R., Wright, P., 1996. Chemical Analysis of Polysaccharides in Plantation Eucalyptus wood and Pulps. Appita J. 49, 258–262.
Wampler, T.P., 1999. Introduction to pyrolysis – capillary gas chromatography. J. Chromatogr. A 842, 207–220.
Wampler, T.P., 1995. Appleid pyrolysis handbook. Marcel Dekker, Inc., New York.
Watanabe, T., Kawamoto, H., Saka, S., 2009. Radical chain reactions in pyrolytic cleavage of the ether linkages of lignin model dimers and a trimer. Holzforschung 63, 424–430. doi:10.1515/HF.2009.076

71
Wikberg, H., Ohra-aho, T., Honkanen, M., Kanerva, H., Harlin, A., Vippola, M., Laine, C., 2016. Hydrothermal carbonization of pulp mill streams. Bioresour. Technol. 212, 236–244. doi:10.1016/j.biortech.2016.04.061
Woolfenden, E., 2012. Thermal Desorption for Gas Chromatography, in: Poole, C.F. (Ed.), Gas Chromatography. pp. 235–289. doi:10.1016/B978-0-12-385540-4.00010-9
Wu, S., Shen, D., Hu, J., Zhang, H., Xiao, R., 2016. Role of β-O-4 glycosidic bond on thermal degradation of cellulose. J. Anal. Appl. Pyrolysis 119, 147–156. doi:10.1016/j.jaap.2016.03.006
Xie, Y.M., 2004. Difference of condensed lignin structures in eucalyptus species. Nord. Pulp Pap. Res. J. 19, 18–21. doi:10.3183/NPPRJ-2004-19-01-p018-021
Xiros, C., Christakopoulos, P., 2012. Biotechnological potential of brewers spent grain and its recent applications. Waste and Biomass Valorization 3, 213–232. doi:10.1007/s12649-012-9108-8
Yang, H., Yan, R., Chen, H., Lee, D.H., Zheng, C., 2007. Characteristics of hemicellulose, cellulose and lignin pyrolysis. Fuel 86, 1781–1788. doi:10.1016/j.fuel.2006.12.013
Yang, Q., Wu, S., Lou, R., Lv, G., 2010. Analysis of wheat straw lignin by thermogravimetry and pyrolysis-gas chromatography/mass spectrometry. J. Anal. Appl. Pyrolysis 87, 65–69. doi:10.1016/j.jaap.2009.10.006
Yokoi, H., Ishida, Y., Ohtani, H., Tsuge, S., Sonoda, T., Ona, T., 1999. Characterization of within-tree variation of lignin components in Eucalyptus camaldulensis by pyrolysisgas chromatography. Analyst 124, 669–674. doi:10.1039/A809217F
Yokoi, H., Nakase, T., Goto, K., Ishida, Y., Ohtani, H., Tsuge, S., Sonoda, T., Ona, T., 2003. Rapid characterization of wood extractives in wood by thermal desorption-gas chromatography in the presence of tetramethylammonium acetate. J. Anal. Appl. Pyrolysis 67, 191–200. doi:10.1016/S0165-2370(02)00061-X
Yokoi, H., Nakase, T., Ishida, Y., Ohtani, H., Tsuge, S., Sonoda, T., Ona, T., 2001. Discriminative analysis of Eucalyptus camaldulensis grown from seeds of various origins based on lignin components measured by pyrolysis-gas chromatography. J. Anal. Appl. Pyrolysis 57, 145–152. doi:10.1016/S0165-2370(00)00137-6
Zhang, J.J., Jiang, X.Y., Ye, X.N., Chen, L., Lu, Q., Wang, X.H., Dong, C.Q., 2016. Pyrolysis mechanism of a β-O-4 type lignin dimer model compound: A joint theoretical and experimental study. J. Therm. Anal. Calorim. 123, 501–510. doi:10.1007/s10973-015-4944-y
Zhang, X., Yang, W., Dong, C., 2013. Levoglucosan formation mechanisms during cellulose pyrolysis. J. Anal. Appl. Pyrolysis 104, 19–27. doi:10.1016/j.jaap.2013.09.015
Zhou, S., Xue, Y., Sharma, A.M., Bai, X., 2016. Lignin Valorization through Thermochemical Conversion: Comparison of Hardwood, Softwood and Herbaceous Lignin. ACS Sustain. Chem. Eng. 4, 6608–6617. doi:10.1021/acssuschemeng.6b01488
Zhurinsh, A., Dobele, G., Rizhikovs, J., Zandersons, J., Grigus, K., 2013. Effect of pretreatment conditions on the analytical pyrolysis products from birch wood lignocellulose. J. Anal. Appl. Pyrolysis 103, 227–231. doi:10.1016/j.jaap.2012.12.008
Ziobro, G.C., 1990. Origin and nature of kraft colour. 1. Role of aromatics. J. Wood Chem. Technol. 10, 133–149.
Ohra-aho T., Tenkanen M., Tamminen T. (2005) Direct analysis of lignin and lignin-like components from softwood kraft pulp by Py-GC/MS techniques. J. Anal. Appl. Pyrolysis 74, 123-128.
Reproduced with permission from Elsevier B.V.
I

Direct analysis of lignin and lignin-like components from
softwood kraft pulp by Py-GC/MS techniques
Taina Ohra-aho a,*, Maija Tenkanen b, Tarja Tamminen a
aKCL, P.O. Box 70, FIN-02151 Espoo, FinlandbDepartment of Applied Chemistry and Microbiology, University of Helsinki, P.O. Box 27, FIN-00014, University of Helsinki, Finland
Received 2 July 2004; accepted 22 November 2004
Abstract
Analytical pyrolysis combined with gas chromatography/mass spectrometry was used to analyse the structure and quantity of aromatic
components, mainly guaiacyl and hydroxyphenyl derivatives, directly from chemical pulps. The quantity of aromatic degradation products
was determined using a new external calibration method. The external standard was analyzed similarly to the pulp sample, and the combined
area of the degradation products formed, normalized to the sample amount, was used for calibration. The method was sensitive enough to
detect aromatics from fully bleached softwood pulps at a concentration level of 0.4 wt.%.
The effect of bleaching on lignin structures in softwood pulps was studied by following the changes in guaiacyl-type degradation product
distribution. The residual lignin structures that had been modified during cooking were removed during the course of bleaching. The residual
lignin in fully bleached pulps therefore was found to bear features characteristic of native lignin in addition to increased oxidation. A striking
enrichment of hydroxyphenyl-type aromatic pyrolysis products was observed during bleaching. It is suggested that they are derived not only
from lignin but also from other pulp components.
# 2004 Published by Elsevier B.V.
Keywords: Analytical method; Pyrolysis; Kraft pulp; Softwood; Residual lignin; Quantitation; Gas chromatography; Mass spectrometry
1. Introduction
Pyrolysis-gas chromatography/mass spectrometry (Py-
GC/MS) is a technique, which provides a method for
specifically detecting lignin in pulp, without interference
from other fibre components. On the other hand, only the
aromatic moieties of lignin are detectable. In the case of
softwood lignin, hydroxyphenyl- and guaiacyl-type pheno-
lic compounds are detected. The method has generally been
used for the qualitative recognition of lignin in pulp rather
than quantitation.
A quantitative method has been reported in the literature
in which the amount of each degradation product is
calculated separately using the corresponding pure com-
pounds for calibration [1]. It is quite complicated and in
addition, not all the lignin degradation products are
commercially available. Calibration with one monomeric
internal standard underestimates the lignin content [2,3].
We have earlier developed a method based on external
calibration for the determination of absolute amounts of
aromatic lignin from pulps [6]. This method is now
described in more detail in the experimental part below.
Because not all the linkages between the lignin subunits are
cleaved during pyrolysis, the standard used for external
calibration needs to be structurally similar to the lignin to be
quantified. Model compound studies have shown that the
beta aryl ether bond is cleaved extensively in pyrolysis, but
only partial cleavage of carbon–carbon bonds are reported to
take place [4,5].
In addition to the quantitative determination, changes in
guaiacyl and hydroxyphenyl-type aromatic structures can be
followed through the bleaching sequence. In earlier studies a
striking enrichment of hydroxyphenyl-type structures has
been observed during bleaching [7,8]. This effect is even
more pronounced when the pulp is analysed directly
www.elsevier.com/locate/jaap
J. Anal. Appl. Pyrolysis 74 (2005) 123–128
* Corresponding author.
E-mail address: [email protected] (T. Ohra-aho).
0165-2370/$ – see front matter # 2004 Published by Elsevier B.V.
doi:10.1016/j.jaap.2004.11.010

compared with the analysis of the corresponding isolated
residual lignin [9–12]. This suggests that other fibre
components in addition to lignin contribute to the formation
of hydroxyphenyl degradation products.
The aim of this study was to follow the degree of
delignification as well as the structural changes in the lignin
and possibly other aromatic components along a light
elementary chlorine free (ECF) bleaching sequence. In
addition, methylated-pyrolysis and fractionated pyrolysis
have been applied in order to clarify the origin of
hydroxyphenyl structures as they have been suggested to
contribute to the brightness reversion of fully bleached
pulps.
2. Experimental
2.1. Samples
Laboratory-bleached pine (Pinus silvestris) kraft pulps
were studied. The ECF-light bleaching sequence contained
oxygen (O), chelation (Q), pressurized alkaline hydrogen
peroxide (PO) and chlorine dioxide (D) stages in the order
O–Q–PO–D/Q–PO. Pulp samples were analysed after each
stage. Detailed information about the chemical charges and
reaction parameters are reported elsewhere [13]. Kraft
lignin, precipitated (pH 2.5) from black liquor from the
conventional kraft cooking of pine, was used as an external
standard. For the fractionated pyrolysis study, an oxygen-
delignified ECF bleached spruce (Picea abies) kraft pulp
was used [14].
2.2. The pyrolysis-gas chromatography/mass
spectrometry system
A platinum foil pulse pyrolyzer (Pyrolab20001 from
Pyrolab, Sweden) was connected to a GC/MS instrument
(Varian 3800 GC/2000 MS). A description of the pyrolyzer
has been given elsewhere [15].
2.3. Isothermal and fractionated pyrolysis
About 80 mg of the pulp sample were weighed accurately
on an automatic ultra-micro balance (CAHN 29 Instruments
Inc., Cerritos, USA) and transferred to the foil. The pyrolysis
chamber (maintained at 150 8C) was purged with helium
(18 ml/min) and the temperature rise time was set to 8 ms.
Isothermal pyrolysis was performed at 580 8C for 2 s. The
degradation products were led into a capillary column
(J&W, DB-1701, 30 m � 0.25 mm, film 1 mm) for separa-
tion using helium as carrier gas, flow rate 0.9 ml/min. The
injector temperature was 280 8C. The capillary column
temperature was programmed as follows: initial temperature
100 8C, rate of increase 4 8C/min to 265 8C and held for
5 min. The different compounds were identified and
quantified using an ion trap mass spectrometer (EI
70 eV). The ion trap temperature was set to 180 8C and
the mass range was scanned from m/z 46 to 299. The
products formed were identified using data from [16,17] and
the commercial NIST92 library.
The pyrolysis temperatures and times used in fractionated
pyrolysis are presented in Table 1. Other conditions were the
same as in the isothermal Py-GC/MS method.
2.4. Pyrolysis-methylation
Pyrolysis-methylation was performed in the presence of a
10% aqueous solution of tetramethyl ammonium hydroxide
(TMAH, 10% w/w aqueous solution, Merck). About 80 mgof the pulp sample were weighed accurately and transferred
to the foil. A 2–3 ml of TMAHwere added and mixed gently
with the sample. Pyrolysis was performed at 400 8C for 4 s.
After pyrolysis, the degradation products were separated on
a capillary column (J&W, DB-1, 30 m � 0.25 mm, film
1 mm) using helium as carrier gas, flow rate 1 ml/min. The
injector temperature was 280 8C. The capillary column
temperature was programmed as follows: initial temperature
50 8C for 5 min, rate of increase 10 8C/min to 320 8C and
held for 5 min. The ion trap temperature was set to 200 8Cand the mass range was scanned from m/z 46 to 650.
2.5. Kappa number
Kappa number was determined using the standard
method SCAN-C 1. Lignin kappa was calculated by
subtracting the contribution from hexenuronic acid (HexA)
to the kappa number (kappa-0.085 � HexA) [18]. The
hexenuronic acid content was determined by high perfor-
mance liquid chromatography after enzymatic hydrolysis
[19]. Lignin content (‘‘aromatic lignin’’) was calculated
from the lignin kappa number by multiplying by 0.15% [20].
3. Results and discussion
3.1. External standard calibration method
Softwood pulp lignin is composed of two cinnamyl
alcohol units: p-coumaryl alcohol and coniferyl alcohol.
Sixteen guaiacyl-type pyrolysis degradation products that
were formed from the coniferyl alcohol units, and 3
hydroxyphenyl-type pyrolysis degradation products that
were expected to originate from p-coumaryl alcohol units
were identified and quantified in the pulps studied. The
T. Ohra-aho et al. / J. Anal. Appl. Pyrolysis 74 (2005) 123–128124
Table 1
Conditions used for fractionated pyrolysis
Temperature (8C) Time (s)
40 320
12 480
4 620
2 800

pyrogram of the unbleached pine kraft pulp is shown in
Fig. 1. The main peaks seen in the pyrogram represent the
degradation products formed from polysaccharides. Aro-
matic degradation products are numbered in the pyrogram
and the identities of these are given in Table 2. As the
pyrogram illustrates, the peak intensities of the aromatic
degradation products in the unbleached pulp were quite low.
In order to increase the sensitivity of the quantitation
method, the peak areas were integrated using specific ionsm/
z. Ions that were used for the integration are given in Table 2.
The peak areas integrated using selected ions m/z were
converted to the corresponding total peak areas using factors
calculated from the pure mass spectrum of each component.
Factors were calculated similarly as has been reported in
reference study [21].
After the integration procedure, peak areas were normal-
ized to the weighed sample amount. The quantity of aromatic
products in the pulp sampleswas determined using a one point
external standard calibration. Kraft lignin was used as an
external standard because the distribution of its degradation
products was similar to that for pulp lignin [12]. The method
was sensitive enough to detect aromatics in the fully bleached
softwood pulps at a level of 0.4 wt.%. The residual standard
deviation of three parallel measurement was 5% and the
concentration range was up to 0.4 wt.%.
3.2. Composition of aromatic degradation
products in pulp
The distribution of hydroxyphenyl- and guaiacyl-type
degradation products was followed through a light ECF
bleaching sequence. Changes in the relative amounts of all
aromatic degradation products are shown in Fig. 2.
Strikingly, the hydroxyphenyl pyrolysis products were
highly enriched during delignification and bleaching and
corresponded to guaiacyl-type structures. The proportion of
hydroxyphenyl structures in the fully bleached pulp was
three-fold in comparison to the unbleached pulp. In wood
chips the proportion of hydroxyphenyl structures was less
than 1%. Enrichment in hydroxyphenyl structures has also
been observed in previous studies [9–12]. However, the
reason for the phenomenon has been unclear.
The hydroxyphenyl structures detected in pulps are
phenol and 2- and 4-methylphenol. Thus, the substitution
pattern of the degradation products differs clearly from the
guaiacyl-type structures, several of which still bear residues
from the propane side chains of lignin subunits. This
suggests, together with the different behaviour during
bleaching, that there may be sources other than lignin of the
hydroxyphenyl structures. Other wood components that
have been reported to form phenol, the main hydroxyphenyl
structure, in pyrolysis are polysaccharides [22–23], phenolic
extractives [24] and protein and amino acids [22].
The distribution of the three-hydroxyphenyl structures
along the bleaching sequence is shown in Fig. 2. The result
T. Ohra-aho et al. / J. Anal. Appl. Pyrolysis 74 (2005) 123–128 125
Fig. 1. Total ion current pyrogram of the unbleached pine kraft pulp.
Pyrolysis was performed at 580 8C for 2 s. Numbered peaks are aromatic
degradation products, the structures of which are given in Table 1.
Table 2
Aromatic degradation products detected in the pulp samples
Peak
number
Compound Structure Ions used for
integration
Factora
1 Phenol H 94, 66, 65 1.5
2 Guaiacol G 124, 109, 81 1.6
3 2-Methylphenol H 108, 107, 77 2.2
4 4-Methylphenol H 108, 107, 77 2.2
5 4-Methylguaiacol G 138, 123, 67 2.0
6 4-Ethylguaiacol G 152, 137, 122 2.2
7 4-Vinylguaiacol G 150, 135, 107 2.1
8 Eugenol G 164, 149, 77 3.8
9 cis-Isoeugenol G 164, 149, 77 3.9
10 trans-Isoeugenol G 164, 149, 77 3.5
11 Vanillin G 152, 151, 123 2.4
12 Homovanillin G 166, 137, 122 2.0
13 Acetoguaiacone G 166, 151, 123 2.1
14 4-(Oxy-allyl)
guaiacol
G 178, 151, 123 2.7
15 4-(Hydroxy-prop-
2-enyl)guaiacol
G 180, 137, 124 3.1
16 Dihyroconifery
lalcohol
G 182, 137, 122 3.1
17 cis-Coniferyl
alcohol
G 180, 137, 124 4.0
18 trans-Coniferyl alcohol G 180, 163, 137 2.7
19 Coniferaldehyde G 178, 147, 135 5.5
H: hydroxyphenyl-type; G: guaiacyl-type.a Factor used to correct the peak areas to correspond to the total peak
areas.
Fig. 2. Distribution between hydroxyphenyl- and guaiacyl-type degrada-
tion products during bleaching.

shows that all hydroxyphenyl structures are enriched. The
proportion of phenol increased five-fold, and that of 2-
methylphenol four-fold, after the initial stage. The enrich-
ment of 4-methylphenol was lower. The proportion of the
corresponding guaiacyl structures (guaiacol and 4-methyl-
guaiacol) simultaneously decreased (Table 3).
It is expected that all guaiacyl-type degradation products
originate from lignin, reflecting the effect of bleaching on
lignin structure. The distribution between guaiacyl-type
structures after normalization to 100% is presented in
Table 3. The main change was an increase in carbonyl-type
structures due to the oxidation of lignin (vanillin, homo-
vanillin, acetoguaiacone). No changes were observed in the
proportion of the degradation products with two- and three-
carbon alkyl chains. The proportion of short side chain
structures (guaiacol and 4-methylguaiacol) increased during
cookingasaconsequenceof thecleavageof thenativebetaaryl
ether bonds, but decreased steadily during further delignifica-
tion and bleaching (Table 3). This indicates that the bleaching
chemicals reacted preferentially with the lignin, which had
beenmodifiedduringcooking, compared to the residual lignin
fraction still containing beta aryl ether bonds. Native lignin
structures are therefore enriched during bleaching. The result
is similar to that froma studyof residual lignins isolated froma
fully bleached eucalypt pulp [25].
3.3. Quantity of aromatic degradation products
in pine kraft pulps
The quantities of hydroxyphenyl- and guaiacyl-type
structures were compared with results obtained by tradi-
tional methods. A good correlation was found between
lignin values calculated from lignin kappa and the aromatic
pyrolysis degradation products (Fig. 3). However, for the
unbleached pulps, the quantity of aromatic pyrolysis
degradation products was lower than that indicated by the
lignin kappa value. This is probably due to the fact that
unbleached kraft pulps contain substances (also other than
hexenuronic acid) that contribute to the kappa number
measurement, erroneously increasing the lignin content
estimated from the kappa number [26].
For the fully bleached pulp, Py-GC/MS gave higher
values compared to the lignin kappa values. This result
indicates that a certain fraction of residual lignin is
undetectable using the kappa number measurement, as we
have reported earlier [10]. This fraction is enriched during
bleaching, thus giving rise to too low lignin content
especially for the bleached pulps, when the calculation is
based on kappa number. Thus, the pyrolysis method
estimates lignin content more reliably compared to the
traditional method both for unbleached and bleached pulps.
3.4. Origin of hydroxyphenyl units
The amount of guaiacyl-type structures decreased by
approximately 90% during bleaching, whereas only 50% of
the hydroxyphenyl structures were simultaneously removed.
One aim of this study was to clarify whether this difference
is due to different reactivities of the corresponding lignin
subunits, or if the hydroxyphenyl structures originate to a
significant extent from non-lignin material.
Pyrolysis-methylation in the presence of tetramethyl
ammonium hydroxide (TMAH) was performed on
unbleached and fully bleached pulp samples. The purpose
of the experiment was to determine whether the hydro-
xyphenyl structures originated from non-aromatic struc-
tures, which during isothermal pyrolysis decomposed
forming phenols. The methylated analogues of guaiacyl
structures (dimethoxybenzene derivatives) and hydroxyphe-
nyl structures (methoxylbenzene derivatives) were expected
to form, if the corresponding aromatic components were
already present in the starting material [27]. In this case,
only methylated analogues of phenol (4-methoxy benzoic
acid methyl ester) and guaiacol (3,4-dimethoxy benzoic acid
methyl ester) were detected. Part of the pyrogram, detected
by specific ions m/z 135 and 196, is shown in Fig. 4. The
T. Ohra-aho et al. / J. Anal. Appl. Pyrolysis 74 (2005) 123–128126
Table 3
Distribution of guaiacyl-type aromatic trace components (after normal-
ization to 100%) in wood chips and pulps
Compound Wood
chips
UB O–Q1 PO1 D/Q PO2
Guaiacol 3.9 13.0 10.5 10.4 8.9 10.3
4-Methylguaiacol 10.6 14.4 11.6 10.8 9.9 9.0
4-Ethylguaiacol 1.5 3.0 2.3 2.3 2.1 2.2
4-Vinylguaiacol 10.4 18.1 15.9 16.2 14.5 14.0
Eugenol 5.0 5.1 4.9 4.8 4.8 4.9
cis-Isoeugenol 2.3 3.1 3.1 3.6 3.3 4.9
trans-Isoeugenol 12.3 12.6 12.4 12.8 11.9 12.9
Vanillin 9.0 7.0 11.6 13.2 18.4 19.8
Homovanillin 5.9 6.1 7.5 8.0 13.0 16.1
Acetoguaiacone 4.8 4.3 5.5 5.3 5.9 6.0
4-(Oxy-allyl)guaiacol 2.9 1.2 1.3 n.d. n.d. n.d.
4-(Hydroxy-prop-2-enyl)
guaiacol
5.0 4.0 4.1 4.0 4.1 n.d.
Dihyroconiferylalcohol 4.0 3.6 3.7 4.3 n.d. n.d.
cis-Coniferyl alcohol 3.5 1.2 1.6 2.3 3.3 n.d.
trans-Coniferyl alcohol 10.0 0.6 1.3 n.d. n.d n.d.
Coniferaldehyde 8.8 2.8 2.8 2.0 n.d. n.d.
Fig. 3. Quantity of aromatic hydroxyphenyl- and guaiacyl-type degradation
products in pulps determined by the Py-GC/MS external standard method.
Aromatic lignin content in pulp calculated from the lignin kappa value
(lignin kappa = 0.15%).

unbleached and fully bleached pulps contained both phenol
and guaiacol analogues. The yield of guaiacol, detected at
ion m/z 196, was lower in the fully bleached pulp than in the
unbleached pulp. The peak area of phenol, however,
detected at ion m/z 135 was the same in the unbleached
and fully bleached pulps, in accordance with the results
obtained using isothermal pyrolysis. This test proved that the
hydroxyphenyl structures originated from aromatic struc-
tures present in the pulp, and they were not secondary
products formed during pyrolysis.
Another method applied to clarify the origin of the
hydroxyphenyl structures was fractionated pyrolysis. The
principle of this technique is that the same original sample is
analyzed stepwise at increasing temperatures for different
times [28]. It is therefore possible to study particular
fractions of a sample. Earlier, the method has been used to
study the bonding behavior of sulfur in sulfur-treated
softwood pulp [29] as well the interactions between 1-
hydroxybenzotriazole and softwood pulp residual lignin
[30]. In the present study, fractionated pyrolysis was applied
to evaluate the bonding between the hydroxyphenyl- and
guaiacyl-type structures in order to determine whether they
originated from the same polymer components.
The distribution of hydroxyphenyl- and guaiacyl-type
structures in fully bleached pulp as a function of temperature
is presented in Fig. 5. The main portion of guaiacyl
structures formed at 320 8C a temperature at which no
hydroxyphenyl structures were formed. Some of the
guaiacyl structures and the main portion of the hydro-
xyphenyl structures originated at 480 8C indicating that both
structures had the same origin, probably lignin. However, a
high percentage of hydroxyphenyl structures formed at
620 8C, accompanied by only small quantities of guaiacyl
structures. It is likely, therefore, that hydroxyphenyl
structures forming at higher temperatures probably arose
from some structure other than lignin.
Intact pulp polysaccharides cannot be source of the
hydroxyphenyl structures, as it was shown that they are
present already in the original sample in the form of
aromatic structures. In addition, we have shown earlier that
upon pyrolysis, pure microcrystalline cellulose only yields a
small amount of phenol, but no methylphenols, which are
detectable from pulp fiber [10]. On the contrary, poly-
saccharides modified during pulping are a probable source
of the phenol derivatives, as aromatic structures are known
to form from carbohydrates under pulping conditions [23].
The almost complete lack of p-hydroxyphenyl-type degra-
dation products with longer residues from the phenylpropan
side chain structure is a further evidence against lignin being
their main source.
4. Conclusions
Analytical Py-GC/MS can be used for the characteriza-
tion of residual lignin directly from softwood pulps. It is
possible to determine the pulp aromatics both quantitatively
and qualitatively during the bleaching sequence. For
quantitative information, an external calibration method
was applied. An advantage of the pyrolysis method is that
the products detected are precisely known. Problems
relating to lignin quantitation based on traditional methods,
such as kappa number, can therefore be overcome.
T. Ohra-aho et al. / J. Anal. Appl. Pyrolysis 74 (2005) 123–128 127
Fig. 4. Pyrolysis degradation products obtained from an unbleached and a fully bleached pulp using pyrolysis-methylation. Methylation was performed at
400 8C in the presence of TMAH.
Fig. 5. Formation of guaiacyl- and hydroxyphenyl-type structures as a
function of temperature in a fully bleached ECF pulp.

Hydroxyphenyl structures were enriched during bleach-
ing. Their main source was suggested to be aromatic
structures formed from polysaccharides during pulping. It
was shown that the aromatic structureswere alreadypresent in
the starting material, and that they were not artefacts formed
during pyrolysis. Lignin in the bleached pulps was oxidized,
but was otherwise strikingly similar to native lignin.
Acknowledgements
We thank Peter Vihra for performing the technical work
in the pyrolysis experiments.
References
[1] A. Izumi, K.-I. Kuroda, H. Ohi, A. Yamaguchi, Mokuzai Gakkaishi 49
(1995) 735.
[2] P. Bocchini, G.D. Galletti, S. Camarero, A.T. Martinez, J. Chromatogr.
A 773 (1997) 227.
[3] A.-S. Jaaskelainen, D.S. Argyropoulos, in: Proceedings of the Sixth
European Workshop on Lignocellulosics and Pulp, Bordeaux, France,
September 3–6, 2000, pp. 371–374.
[4] O. Faix, D. Meier, I. Fortmann, J. Anal. Appl. Pyrol. 14 (1988) 135.
[5] K.-I. Kuroda, J. Anal. Appl. Pyrol. 53 (2000) 123.
[6] T. Ohra-aho, J. Sipila, T. Tamminen, in: Proceedings of the Sixth
European Workshop on Lignocellulosics and Pulp, Bordeaux, France,
September 3–6, 2000, pp. 487–490.
[7] F. Chakar, I. Lucia, A. Ragauskas, Preprints International Pulp
Bleaching Conference, PPATAC 2000, pp. 123–130.
[8] L. Akim, J. Colodette, D.S. Argyropoulos, Preprints International Pulp
Bleaching Conference, PPATAC 2000, pp. 103–110.
[9] T. Tamminen,M. Kleen, T. Ohra-aho, K. Poppius-Levlin, J. Pulp Paper
Sci. 29 (2003) 319.
[10] T. Tamminen, T. Ohra-aho, B. Hortling, M. Tenkanen, in: Proceedings
of the 12th International Symposium on Wood Pulp Chemicals, vol. I,
Madison, WI, USA, June 9–12, 2003, pp. 69–72.
[11] K. Poppius-Levlin, T. Tamminen, K. Rajanen, A.-S. Jaaskelainen, L.
Viikari, in: Proceedings of the 10th International Symposium onWood
Pulp Chemicals, vol. 1, Yokohama, June 7–10, 1999, p. 556.
[12] K. Poppius-Levlin, T. Tamminen, A. Kalliola, T. Ohra-aho, in: D.S.
Argyropoulos (Ed.), Proceedings of the ACS Smposium Series 785,
Oxidative Delignification Chemistry, Fundamentals and Catalysis,
2001, pp. 358–372 (Chapter 22).
[13] M. Tenkanen, I. Forsskahl, T. Tamminen, M. Ranua, K. Vuorenvirta,
K. Poppius-Levlin, in: Proceedings of the Seventh European Work-
shop on Lignocellulosics and Pulp, Turku, Finland, August 25–29,
2002, pp. 107–110.
[14] B. Hortling, T. Tamminen, A. Varhimo, in: Proceedings of the Seventh
European Workshop on Lignocellulosics and Pulp, Turku, Finland,
August 25–29, 2002, pp. 439–442.
[15] I. Tyden-Ericsson, Chromatographia 6 (1973) 353.
[16] J. Ralph, R.D. Hatfield, J. Agric. Food Chem. 39 (1991) 1426.
[17] O. Faix, D. Meier, I. Fortmann, Holz als Roh- undWerkstoff 48 (1990)
281.
[18] J. Li, G. Gellertedt, Carboh. Res. 302 (1997) 213.
[19] M. Tenkanen, G. Gellerstedt, T. Vuorinen, A. Teleman, M. Perttula, J.
Li, J. Buchert, J. Pulp Paper Sci. 25 (1999) 306.
[20] T. Tamminen, B. Hortling, in: D.S. Argyropoulos (Ed.), Proceedings
of the ACS Smposium Series 785, Oxidative Delignification Chem-
istry, Fundamentals and Catalysis, 2001, pp. 73–91 (Chapter 4).
[21] J. Sjoberg, M. Kleen, O. Dahlman, R. Agnemo, H. Sundvall, Nord.
Pulp. Paper Res. J. 17 (2002) 295.
[22] E.B. Higman, I. Schmeeltz, W.S. Schlotzhauer, J. Agric. Food Chem.
18 (1970) 636.
[23] G.C. Ziobro, J Wood Chem. Technol. 10 (1990) 133.
[24] S. Ohara, Y. Yasuta, H. Ohi, Holzforschung 57 (2003) 145.
[25] D. Ibarra, J.C. del Rio, A. Gutierrez, I.M. Rodrigues, J. Romero, M.J.
Martinez, A.T. Martinez, Proceedings of the 16th International Smpo-
sium on Analytical and Applied Pyrolysis, Alicante, Spain, May 23–
27, 2004, p. 166.
[26] O. Sevastyanova, J. Li, G. Gellerstedt, Proceedings of the 11th
International Symposium on Wood Pulp. Chemicals, vol. I, Nice,
France, June 11–14, 2001, pp. 358.
[27] J.M. Challinor, J. Anal. Appl. Pyrol. 35 (1995) 93.
[28] I. Ericsson, R.P. Lattimer, J. Anal. Appl. Pyrol. 31 (1995) 251.
[29] P. Selsbo, I. Ericsson, M. Kleen, J. Anal. Appl. Pyrol. 43 (1997) 1.
[30] M. Kleen, T. Ohra-aho, T. Tamminen, J. Anal. Appl. Pyrol. 70 (2003)
589–600.
T. Ohra-aho et al. / J. Anal. Appl. Pyrolysis 74 (2005) 123–128128
Kalliola A., Savolainen A., Ohra-aho T., Faccio G., Tamminen T. (2012) Reducing the content of VOCs of softwood kraft lignins for material applications. BioResources, 7, 2871-2882.
Reproduced with permission from BioResources.
II

PEER-REVIEWED ARTICLE bioresources.com
Kalliola et al. (2012). “VOCs of SW kraft lignin,” BioResources 7(3), 2871-2882. 2871
REDUCING THE CONTENT OF VOCS OF SOFTWOOD KRAFT LIGNINS FOR MATERIAL APPLICATIONS Anna Kalliola,a,* Anne Savolainen,b Taina Ohra-aho,a Greta Faccio,a and Tarja Tamminen a
Three laccases, functioning in mild acidic, and one in slightly alkaline conditions, were evaluated in order to reduce low-molecular phenolic VOCs of kraft lignins, which could be used in lignin/natural fibers composites. The potential of a sulfhydryl oxidase to catalyze the oxidation of sulfur containing VOCs (thiols) was also tested in combination with the laccase-catalyzed oxidation. In addition, oxidation at alkaline pH at room temperature that may induce polymerization of phenolics in an analogous manner to the laccase-catalyzed reaction was investigated. Enzyme reactivity towards lignin was evaluated as consumption of oxygen in the reaction solution. The effect of treatments on VOC reduction was determined both by sensing (odorimetry) and chemical (TD-GC/MS, SEC) analyses. Laccases, Lcc2, and MaL from Thielavia arenaria and Melanocarpus albomyces, respectively, showed potential in reducing odors. The most promising results were obtained by oxidizing lignin with O2 at alkaline pH. However, the odor threshold values of the main VOC compounds are extremely low, which poses a challenge to VOC reduction.
Keywords: VOC; Kraft lignin; Composite; Laccase; Sulfhydryl oxidase; Oxygen; Oxidation Contact information: a: VTT Technical Research Centre of Finland, VTT, P.O. Box 1000, FI-02044 VTT, Finland; b: Trelleborg Industrial Products Finland Oy, Kikkerläntie 72, 38300 SASTAMALA, Finland. *Corresponding author: [email protected] INTRODUCTION The potential of lignin to replace oil-based raw materials is being actively investigated for various material applications, such as composites. Based only on renewable resources, the Arboform® composites consist of isolated lignin, natural fibers, and natural additives, which are used in conventional thermoplastic processes such as injection molding (Naegele et al. 2002). However, there are several difficulties in applying lignin. One of them is the volatile organic compounds (VOCs), either present in the isolated lignin, or formed as they are processed at high temperature in thermoplastic processes. This drawback reduces the applicability of lignin-based composites, e.g. in the inner parts of cars. VOCs in kraft lignin are typically lignin-originated phenolic structures, e.g. guaiacol (2-methoxyphenol), or reduced sulfur compounds formed in cooking. The odor threshold values of these VOCs are extremely low. For example, the odor threshold value for guaiacol in water solutions is reported to vary from 3 to 21 ppb (Fazzalari 1978; Buttery et al. 1988; Guth 1997). The great variation is due to different measurement techniques. For reduced sulfur compounds, dimethyl disulfide, and dimethyl trisulfide,

PEER-REVIEWED ARTICLE bioresources.com
Kalliola et al. (2012). “VOCs of SW kraft lignin,” BioResources 7(3), 2871-2882. 2872
the threshold values are reported to be 5 and 0.2 ppb, respectively (Guth 1997; Zoeteman et al. 1973). Recently, small amounts of organically modified montmorillonite (silicate clay-based) dispersed into the lignin/natural fibers system have been shown to improve the mechanical and thermal behaviors. Thermogravimetric analysis results suggested that exfoliated or intercalated layered aluminosilicates acted as a protective barrier against degradation of organic components. The thermooxidative degradation of the organic compounds (lignin, natural fibers, and additives) occurred in the temperature range of 180 to 420°C (Guigo et al. 2009). Laccases catalyze the oxidation of a wide range of aromatic substrates, especially phenols, simultaneously with the reduction of molecular oxygen to water. Phenolic substrates are oxidized to phenoxyl radicals, which, depending on reaction conditions, can spontaneously polymerize via radical coupling or rearrange themselves leading to quinones, alkyl–aryl cleavage, Cα oxidation, cleavage of Cα–Cβ bonds, or aromatic ring. Mediators, acting as intermediate substrates for laccases, enable laccase to indirectly oxidize large molecules, and even nonphenolic substrates (Giardina et al. 2010). Polymerization of lignosulfonates by laccases with and without mediators in varying reaction conditions has been confirmed recently (Areskogh et al. 2010; Prasetyo et al. 2010). Sulfhydryl oxidases catalyze the formation of de novo disulfide bonds from free thiol groups, with the reduction of molecular oxygen to hydrogen peroxide. These enzymes have been investigated in the food industry to improve the flavor of products such as ultraheat-treated milk and aromatic beverages such as coffee, tea, chocolate, wine, and beer (Starnes et al. 1986; Swaisgood 1977). The objective of this study was to evaluate different approaches aiming to reduce VOCs of softwood kraft lignins. Laccase-catalyzed oxidation was tested as a potential means to polymerize the lignin-derived low-molecular phenolics such as guaiacol. Since the solubility of lignin increases significantly as pH increases and favors laccases that are active at higher pH, a laccase with the pH optimum at 8 was evaluated in addition to three other laccases functioning in mild acidic conditions. Sulfhydryl oxidase-catalyzed oxidation was tested as a means to reduce the odor from sulfur-containing compounds, e.g. thiols (methyl mercaptan, CH3SH). As a straightforward way of reducing VOCs, oxidations at alkaline pH and at room temperature were investigated. The idea of the treatment was based on the hypothesis that at ambient temperatures the reaction kinetics will be slower than at elevated temperatures, causing phenoxyl radicals to be relatively stable, which may induce polymerization of phenolics in an analogous manner to the laccase-catalyzed reaction. TD-GC/MS, is presented as a novel method to simulate and quantify the VOC formation in the temperature range of thermoplastic processing. EXPERIMENTAL Materials Two softwood kraft lignins, commercial Indulin AT (Mead WestVaco), and non-commercial SE (Stora Enso) were used as raw materials. Four laccases were tested: Thielavia arenaria Lcc1 (TaLcc1) and Lcc2 (TaLcc2) (Paloheimo et al. 2006a and b) produced as recombinant enzymes in Trichoderma reesei

PEER-REVIEWED ARTICLE bioresources.com
Kalliola et al. (2012). “VOCs of SW kraft lignin,” BioResources 7(3), 2871-2882. 2873
by Roal Oy (Rajamäki, Finland), Trametes hirsuta (ThL) (produced in its native host by VTT), and Melanocarpus albomyces (MaL) (overproduced in Trichoderma reesei by VTT). TaLcc1, TaLcc2, and ThL are most active in mild acidic conditions, whereas MaL, in slightly alkaline conditions.
The mediator 1-hydroxybenzotriazole (HBT) was used with a dose of 5 percent with respect to lignin, in addition to ThL and TaLcc2 in two experiments. Sulfhydryl oxidase, Aspergillus oryzae (AoSOX1) (Faccio et al. 2010), produced in Trichoderma reesei by VTT was also tested. Methods Lignin dissolution Lignin suspensions for enzyme treatments were prepared by dissolving lignin first into alkaline water, after which pH was decreased using 1 M HCl, and finally set to the target pH using 0.05 M sodium citrate buffer in the case of pH 5 and 6, and 0.05 or 0.2 M sodium phosphate buffer in the case of pH 8. In general terms, the lignin dissolution was performed according to Mattinen et al. (2008), however, using NaOH of higher molarities when increasing the lignin dry solids above 0.1 percent. For oxidation at alkaline pH, only a small amount of HCl was needed to decrease pH to 10 or 10.7 after dissolving lignin in NaOH. Enzyme activity measurements 2,2’-azino-bis-(3-ethylbenzthiazoline)-6-sulphonic acid (ABTS) (Roche) was used as a substrate for laccases in spectrophotometric enzyme activity measurement at pH 5 and 6, and guaiacol (Fluka) at pH 8. Katal units were used to express the catalytic activity of the laccase preparations (nkat/mL).
One katal of laccase is that amount of laccase which converts/oxidizes a mole of substrate per second under the specified conditions. Laccases were dosed on an activity basis with respect to the lignin content (nkat/g). 1 nkatal (10-9 mol/s) corresponds to 0.0600 enzyme units (U, 1 μmol/min), another commonly used unit expressing the catalytic activity. AoSOX1 was dosed on protein basis in respect to the sulfur content of lignin (2.2 percent). Treatments At the analytical scale, the reactivity of enzymes towards the lignin was evaluated by monitoring oxygen consumption in the reaction solution. Lignin dry solids were 1, 2.5, or 5 percent. Monitoring was performed with an Oxy-10 mini sensor oxygen meter (PreSens, Germany) in a closed 1.9 mL vessel based on dynamic luminescence quenching. Parallel treatments were performed. Selected treatments with promising enzyme dosages were repeated at a larger laboratory scale in a 2-L Parr reactor to allow the use of sensing analysis (odorimetry). Treatments were done at 5 or 10 percent lignin dry solids, and under 5 bars initial oxygen pressure at room temperature (RT) for 1 or 2 hours (Table 1).
Reference samples (pH 5, 6, and 8, samples 1, 7, 10, and 12, respectively), were prepared according to the dissolution-pH adjustment procedure at room temperature (not O2 boosted).

PEER-REVIEWED ARTICLE bioresources.com
Kalliola et al. (2012). “VOCs of SW kraft lignin,” BioResources 7(3), 2871-2882. 2874
Table 1. Experimental Set-up of the Oxidative Treatments Performed with and without Enzyme in 2-L Parr Reactor under 5 Bar Initial O2 Pressure at RT. Reference samples (ref.) were not O2 boosted.
Sample Substratea Lignin dry solids (%)
pH Enzymeb Dosagec
(nkat/g ; %) HBT (%)
Treatment (h)
1 SE 5 5 - - - - ref. 2 SE 5 5 - - - 2 3 SE 5 5 ThL 100 - 2 4 SE 5 5 ThL 100 5 2 5 SE 5 6 TaLcc2 100 - 2 6 SE 5 6 TaLcc2 100 5 2 7 Ind AT 5 5 - - - - ref. 8 Ind AT 5 5 - - - 2 9 Ind AT 5 5 ThL 100 - 2
10 SE 10 8 - - - - ref. 11 SE 10 8 - - - 1 12 SE 10 8 MaL 0.1 - 1 13 SE 10 8 MaL, AoSOX1 0.1, 0.1 - 1 14 SE 10 10.7 - - - 1
a Lignins: SE = Stora Enso lignin, Ind AT = Indulin AT b Laccases: ThL = Trametes hirsuta, TaLcc2 = Thielavia arenaria Lcc2, MaL = Melanocarpus albomyces, Sulfhydryl oxidase: AoSOX1 = Aspergillus oryzae c ThL and TaLcc2 activity measurements with ABTS; doses nkat/g. MaL and AoSOX1doses on protein bases; MaL dose in respect to lignin, AoSOX1 dose in respect to sulfur in lignin. Analyses
In the odorimetry procedure, a wet sample volume containing 5 g of lignin dry solids was placed in a small crucible and stabilized inside closed glass containers (500 mL) for 48 hours at 40ºC. Thereafter, the odor panel members (ten qualified experts) evaluated the odor intensity of each sample using a scale of 1 to 6, which was selected according to VDA-270 (1992) recommendations. The stabilized samples were also graded using numbers 0 to 10 by individual perception. The least odor-intense sample got number 0 and the most odor-intense was assigned number 10. The panel was able to evaluate a maximum 6 of the samples at a time. Three separate sessions were conducted. In general terms, the odorimetry method was a modification combining sensing analyses described by Söderhjelm and Pärssinen (1985) and Morvan et al. (2003). The thermal desorption (TD) method was developed based on the earlier used method (Kleen et al. 2003) in order to simulate the formation of volatile degradation products at elevated temperatures prevailing in the injection molding. TD measurements were carried out with a Pyrolab pyrolyzer unit (Pyrolab2000®) connected to a Varian 3800 gas chromatography/Varian Saturn 2000 mass spectrometer. About 2.5 mg of the freeze-dried sample was weighed accurately and heated at 150 and 190ºC for 5 minutes in a pyrolysis chamber. Thereafter, volatiles were led to the gas chromatography column (J&W, DB-1701, 30 m x 0.25 mm, film 1 μm) for separation. The oven was programmed as follows: initial temperature 100°C, rate of increase 4°C/min to 265°C and held for 18 min at the final temperature. A constant carrier gas flow of 0.9 ml/L was used. The mass spectra of the products were obtained using an ion trap mass spectrometer (EI 70 eV). The scan range of m/z 46-650 was used. Sulfur and phenol compounds were tentatively

PEER-REVIEWED ARTICLE bioresources.com
Kalliola et al. (2012). “VOCs of SW kraft lignin,” BioResources 7(3), 2871-2882. 2875
identified using commercial mass spectra library Nist05. Quantification of guaiacol was performed with an external standard calibration (guaiacol, 98 percent, Aldrich). Average lignin molecular size classes (Mn, Mw) of the freeze-dried samples were measured by size exclusion chromatography (SEC), using PSS MCX 1000 and 100 000 columns in 0.1 M NaOH eluent (25°C) with UV detection (280 nm). The molecular size distributions and average molecular sizes were calculated in relation to polystyrene sulfonate standards, using Waters Empower 2 software. RESULTS AND DISCUSSIONS Laccase Reactivity towards Lignins At analytical scale, the reactivity of laccases (ThL, TaLcc1, TaLcc2) functioning in mild acidic conditions was tested towards both kraft lignins by following the reduction of dissolved O2 in the reaction solutions. At pH 6, ThL and TaLcc2 showed higher reactivity towards lignins, as the curves of O2 consumption were steeper than in the case of TaLcc1 (Fig. 1a). Although the dissolution-pH adjustment procedure (Mattinen et al. 2008) is intended to reduce the agglomerates, lignin is mainly undissolved at pH 6, since the dissociation of guaiacyl- and syringyl-derived phenols occurs at higher pH levels (Ragnar et al. 2000). In order to increase the dissolution and the reactivity of lignin, the treatment was performed at pH 8 by inclusion of MaL with the respective pH optimum. At pH 8, lignin already reacted with the dissolved oxygen present in the reaction solution. However, more O2-consuming reactions occurred in the presence of TaLcc1, TaLcc2, and MaL than in their absence (Fig. 1b). The enzyme dosing was based on guaiacol activity since lignin resembles guaiacol by its chemical structure and has similar behavior in terms of pH. Even if the activity of MaL (to guaiacol) was lowest, e.g. MaL 67.1 nkat/mL, TaLcc1 111.2 nkat/mL, TaLcc2 339.6 nkat/mL, it catalyzed lignin oxidation more efficiently than TaLcc1 or TaLcc2 at pH 8. Sulfhydryl oxidase (AoSOX1, 1 percent dose in respect to sulfur in lignin) was tested together with MaL.
However, the O2 consumption did not increase when compared to MaL treatment done without AoSOX1 (Fig. 1b). From the practical point of view, a 0.1 percent dose of MaL already showed potential in treating lignin.
In addition to the laccase- (and AoSOX1) catalyzed oxidation, the oxidation of SE lignin was followed in alkaline conditions (pH 10), which causes the dissociation of the phenolic structures. Increasing pH from 8 to 10 increased O2 consumption and indicated improved lignin reactivity when compared to MaL-catalyzed oxidation (Fig. 2).
Lignin Odor and Volatiles Formation Based on the results obtained from the O2 consumption measurements, selected laccase treatments and oxidation at alkaline pH were performed at higher lignin dry solids and under oxygen pressure (Table 1). The pH level for the alkaline oxidation was set to 10.7, according to experimentally determined pK0 value of Indulin AT (at 21°C) (Norgren and Lindström 2000).

PEER-REVIEWED ARTICLE bioresources.com
Kalliola et al. (2012). “VOCs of SW kraft lignin,” BioResources 7(3), 2871-2882. 2876
0
1
2
3
4
5
6
7
8
9
10
0 30 60 90 120
Dis
solv
ed o
xyge
n (m
g/L
)
Time (min)
SE, pH 6
SE, pH 6, TaLcc1 100 nkat/g
SE, pH 6, TaLcc2 100 nkat/g
SE, pH 6, ThL 100 nkat/g
IndAT, pH 6, TaLcc1 100 nkat/g
IndAT, pH 6, TaLcc2 100 nkat/g
a
0
1
2
3
4
5
6
7
8
9
0 5 10 15 20 25 30
Dis
solv
ed o
xyge
n (m
g/L
)Time (min)
pH 8
pH 8, TaLcc2 60 nkat/g
pH 8, TaLcc1 60 nkat/g
pH 8, TaLcc2 600 nkat/g
pH 8, TaLcc1 600 nkat/g
pH 8, MaL 0.1%
pH 8, MaL 0.1% + AoSOX1 1%
pH 8, MaL 1%
b SE lignin
Fig. 1. a) Oxygen consumption of SE lignin and Indulin AT solution (ds. 1%) with and without laccase at pH 6. b) Oxygen consumption of SE lignin solution (ds. 2.5%) with and without laccase (and AoSOX1) at pH 8. 0.1% MaL dose equals to 31 nkat/g, and 1% MaL dose equals to 310 nkat/g. 1% AoSOX1 dose with respect to sulfur in lignin
0
1
2
3
4
5
6
7
8
9
0 5 10 15 20 25 30
Dis
solv
ed o
xyge
n (m
g/L
)
Time (min)
pH 8
pH 8, AoSOX1 0.1%
pH 8, MaL 0.1% + AoSOX1 0.1%
pH 8, MaL 0.1%
pH 10
SE lignin
Fig. 2. Oxygen consumption of SE lignin solution (ds. 5%) with and without laccase (and AoSOX1) at pH 8, and oxidation at pH 10. 0.1% MaL dose equals to 57 nkat/g The overall odor intensity of the lignin samples (Table 1) was evaluated by ten human sniffers (the odor panel). The odor intensity of the samples varied between 2.9 and 3.9 (4 = disturbing, 3 = clearly perceptible), and standard deviations were rather large (Fig. 3 upper panel). Although the odor of the samples differed only slightly, the oxidation by TaLcc2 and MaL+AoSOX1 and the oxidation at pH 10.7, indicated reduced VOC content, with the lowest odor intensity values e.g. 2.9 (Sample 5), 3.2 (Sample 13), and 3.0 (Sample 14), respectively. Grading the lignin samples using numbers from 0 to 10 (0 = the least odor intense, 10 = the most intense odor) supported the same observations (Fig. 3 lower panel).

PEER-REVIEWED ARTICLE bioresources.com
Kalliola et al. (2012). “VOCs of SW kraft lignin,” BioResources 7(3), 2871-2882. 2877
3.4 3.53.9 3.7
3.4 3.3 3.53.8
3.53.9
2.9
3.6 3.73.4 3.2 3.0
1
2
3
4
5
6
Odo
r in
tens
ity (-
)
5.4 5.36.6
5.6
2.7 3.0
5.36.2
5.4
7.3
2.9
6.9 6.6
4.53.8
2.0
0
2
4
6
8
10
1 2 3 4 5 6 7 8 9 1 5 10 11 12 13 14
Gra
de (-
)
Sample
10 = most odorous; 0 = least odorous
6 = not acceptable, 5 = strongly disturbing, 4 = disturbing,3 = clearly perceptible, but not disturbing, 2 = perceptible, not disturbing, 1 = not perceptible
Fig. 3. Odor intensity (upper panel) and grade (lower panel) of the wet SE lignin and Indulin AT samples treated with and without laccases (and AoSOX1) at different pH level. Samples are numbered according to Table 1; open dots refer to reference samples that were not O2 boosted. Evaluation of samples 1 and 5 was conducted in the first and second separate odor panel
Volatile degradation products of the freeze-dried lignin samples (SE lignin treated with or without MaL/MaL+AoSOX1, and at pH 10.7) were determined by TD-GC/MS at 150 and 190ºC. Lignin softening takes place typically at 150ºC, after which an increase in temperature induces depolymerization and recondensation (Bergmann et al. 2005). 190ºC represents the temperature of the latter range, and also resembles the temperature at thermoplastic processing. The main part of the volatiles had already evaporated within 5 minutes at both temperatures. The most abundant degradation product of lignin was guaiacol (Fig. 4). Clearly more volatiles were formed at 190ºC than at 150ºC. In the case of reference (pH 8, ref.) and O2 treated (pH 8, 0%) samples, the sum of main volatiles was ca. 5-fold more at 190ºC than at 150ºC. In the case of MaL or MaL+AoSOX1 treated lignin, it was ca. 3.5-fold more, and in lignin oxidized at pH 10.7 it was less than 2-fold more at 190ºC than at 150ºC. At both temperatures, clearly less volatiles were formed as SE lignin was oxidized at pH 10.7, than treated with or without MaL/MaL+AoSOX1 at pH 8. At least three explanations for reduced formation of volatiles of alkali-oxidized lignin may exist. Firstly, in the freeze-dried alkaline sample, the low-molecular phenolics most likely existed in sodium-salt form, which hindered their volatilization. Secondly, part of the phenolics might have degraded to non-volatile structures, which is unwanted, since in composite applications the molecular size presumably correlate with strength properties. Thirdly, polymerization/radical coupling of small-molecular phenolics, e.g. guaiacol, could have taken place. Also, the oxidation at pH 10.7 reduced the amount of sulfur containing VOCs. In these conditions, they might have degraded and further oxidized to sulfate. Furthermore,

PEER-REVIEWED ARTICLE bioresources.com
Kalliola et al. (2012). “VOCs of SW kraft lignin,” BioResources 7(3), 2871-2882. 2878
the dissociation of thiols occurs at alkali pH levels, e.g. the pKa value of methanethiol is 10.33 (Steward 1985), and thus the existence as sodium-salt may have hindered their volatilization.
The quantification of the main volatile, guaiacol, showed that its amounts in the SE lignin samples were still rather high when compared to the odor threshold values measured in water solutions, i.e. 1.3 ppm at 150ºC and 24 ppm at 190ºC (Fig. 5).
0
20000
40000
60000
80000
100000
120000
140000
160000
pH 8, ref. pH 8, 0% pH 8, MaL 0.1% pH 8, MaL0.1%+AoSOX1
0.1%
pH 10.7
0
20000
40000
60000
80000
100000
120000
140000
160000
pH 8, ref. pH 8, 0% pH 8, MaL0.1%
pH 8, MaL0.1%+AoSOX1
0.1%
pH 10.7
Methanethiol DimethyldisulfideDimethyltrisulfide2-Cyclopenten-1-one-3-ethyl-2-hydroxy1.4-Benzenediol, 2-methoxyGuaiacolVanillinHomovanillinDihydroconiferylalcohol
190 oC
150 oC
Peak
are
as n
orm
aliz
ed to
sam
ple
area
s
Lignin originated
Sulfur compounds
Fig. 4. Main volatiles of freeze-dried SE lignin samples at 190ºC (upper panel) and 150 ºC (lower panel). Reference sample (ref.) was not O2 boosted

PEER-REVIEWED ARTICLE bioresources.com
Kalliola et al. (2012). “VOCs of SW kraft lignin,” BioResources 7(3), 2871-2882. 2879
0
20
40
60
80
100
120
140
160
pH 8, ref. pH 8, 0% pH 8, MaL0.1%
pH 8, MaL0.1%
+AoSOX10.1%
pH 10.7 pH 10.7, ref. pH 10.7
Gua
iaco
l (m
g/kg
)
TD 150 °C
TD 190 °C
SE lignin Indulin AT
Fig. 5. Volatile guaiacol of freeze-dried SE lignin and Indulin AT samples at 150°C and 190°C. Reference samples (ref.) were not O2 boosted
In order to investigate the importance of oxygen excess in the alkaline treatment, the pH 10.7 treatment was repeated to Indulin AT with and without oxygen boosting (5 bar initial O2). The results clearly showed that oxygen-pressurized alkali treatment decreased the volatile guaiacol formation at 150ºC and at 190ºC, when compared to the alkaline treatment performed without O2 boosting (Fig. 5). Molecular Size Distribution of Lignin The effect of the treatments on molecular size of both SE lignin and Indulin AT was analyzed using SEC. The results (molecular size distributions) indicated that the primary oxidation products, phenoxyl radicals, polymerized via radical coupling in the oxidation performed at room temperature and at pH 10.7. Also, MaL and MaL+AoSOX1 catalyzed oxidation caused minor polymerization of phenolics (Fig. 6a). Moreover, the experiments done with Indulin AT verified that at room temperature, the oxygen-pressurized alkali treatment caused lignin polymerization when compared to the alkali treatment done without O2 boosting (Fig. 6b). However, the change in molecular size was rather small. Yet, the aim of this study was not to polymerize lignin in great extent, but to reduce the formation of low-molecular weight phenolic volatiles. In alkaline oxygen oxidation (initially 5 bar O2 excess) performed at elevated temperatures (90°C and 110°C), just the opposite takes place, as the Indulin AT macromolecule degrades fast, partly ending up to carbon dioxide (Kalliola et al. 2011). The degradation of lignin is desirable in pulp delignification, but likely unwanted in the composite applications.

PEER-REVIEWED ARTICLE bioresources.com
Kalliola et al. (2012). “VOCs of SW kraft lignin,” BioResources 7(3), 2871-2882. 2880
Sample Mn Mw PD
IndAT, pH 10.7, ref 2 250 4 750 2.1
IndAT, pH 10.7 2 640 6 000 2.3
Sample Mn Mw PD
SE lignin, pH 8, ref 2 250 5 150 2.3
SE lignin, pH 8, 0% 2 330 5 260 2.3
SE lignin, pH 8, MaL 0.1% + AoSOX1 0.1% 2 470 5 840 2.4
SE lignin, pH 8, MaL 0.1% 2 480 5 990 2.4
SE ligin, pH 10.7 2 570 5 980 2.3 Fig. 6. a) Molecular size distributions of freeze-dried SE lignin samples. b) Molecular size distributions of freeze-dried Indulin AT samples. Reference samples (ref.) were not O2 boosted CONCLUSIONS
1. Laccase-catalyzed oxidation and oxygen oxidation in alkaline conditions were evaluated in order to reduce VOCs of kraft lignins for composite applications. Laccases Lcc2 from T. arenaria and MaL from M. albomyces with or without sulfhydryl oxidase from A. oryzae, as well as the alkaline oxygen oxidation (pH 10.7), showed potential in reducing odors. The importance of the oxygen excess in the alkali treatment was highlighted by the results. The analyses performed showed no clear effect of sulfhydryl oxidase.
2. Volatile degradation products of lignin were determined by TD-GC/MS method at temperatures prevailing in the thermoplastic processing. Also, the quantification of volatile guaiacol was conducted. The analysis method developed a possibility to study the effect of application processing under varying temperature and residence time, as well as distinct volatiles formed from different lignins from each other’s.
3. From the practical point of view, the most promising results were obtained by oxygen oxidizing lignin at alkaline pH. The treatment would be straightforward to apply at an industrial scale.
4. Yet, the odor threshold values of the main VOC compounds are extremely low, which makes the reduction of VOCs challenging.

PEER-REVIEWED ARTICLE bioresources.com
Kalliola et al. (2012). “VOCs of SW kraft lignin,” BioResources 7(3), 2871-2882. 2881
ACKNOWLEDGMENTS Tekes is acknowledged for financial support via project “VOC reduction of lignin containing materials” in the ERA-IB program. Stora Enso Corporation is thanked for providing the kraft lignin raw material. Marja Paloheimo, Roal Oy is thanked for providing Lcc1 and Lcc2 from T. arenaria. Mrs. Nina Vihersola and Mr. Juha Kaunisto are acknowledged for performing the experiments, Mrs. Eila Turunen for performing the TD-GC/MS and SEC analyses, Mrs. Tiina Liitiä for the determination of lignin molecular size distributions, and Mrs. Riitta-Maija Osmonen (VTT Expert Services) for arranging the sensing (odorimetry) analyses. REFERENCES CITED Areskogh, D., Li, J., Gellerstedt, G., and Henriksson, G. (2010). “Investigation of the
molecular weight increase of commercial lignosulfonates by laccase catalysis,” Biomacromolecules 11(4), 904-910.
Bergmann, P. C. A., Boersma, A. R., Zwart, R. W. R., and Kiel, J. H. A. (2005). “Torrefaction for biomass co-firing in existing coal-fired power stations,” Non-confidential ECN report, ECN-C--05-013, The Netherlands.
Buttery, R., Turnbaugh, J., and Ling, L. (1988). “Contribution of volatiles to rice aroma,” J. Agric. Food Chem. 36(5), 1006-1009.
Faccio, G., Kruus, K., Buchert, J., and Saloheimo, M. (2010). “Secreted fungal sulfhydryl oxidases: sequence analysis and characterisation of a representative flavin-dependent enzyme from Aspergillus oryzae,” BMC Biochemistry 11, 31-42.
Fazzalari, F.A. (1978). Compilation of Odor and Taste Threshold Values Data, Amer. Society for Testing and Materials, Philadelphia.
Giardina, P., Faraco, V., Pezzella, C., Piscitelli, A., Vanhulle, S., and Sannia, G. (2010). “Review: Laccases: A never-ending story,” Cell. Mol. Life Sci. 67, 369-385.
Guigo, N., Vincent, L., Mija, A., Naegele, H., and Sbirrazzuoli, N. (2009). “ Innovative green nanocomposites based on silicate clays/lignin/natural fibres,” Composites Science and Technology 69, 1979-1984.
Guth, H. (1997). “Quantitation and sensory studies of character impact odorants of different white wine varieties,” J. Agric. Food Chem. 45(8), 3027-3032.
Kalliola, A., Kuitunen, S., Liitiä, T., Rovio, S., Ohra-aho, T., Vuorinen, T., and Tamminen, T. (2011). “Lignin oxidation mechanisms under oxygen delignification conditions. Part 1. Results from direct analyses,” Holzforschung 65, 567-574.
Kleen, M., Ohra-aho, T., Tamminen, T. (2003). “On the interactions of HBT with pulp lignin during mediated laccase delignification – A study using fractionated pyrolysis-GC/MS,” J. Anal. Appl. Pyrolysis 70, 589-600.
Mattinen, M., Suortti, T., Grosselink, R., Argyropoulos, D. S., Evtuguin, D., Suurnäkki, A., de Jong, E., and Tamminen, T. (2008). “Polymerization of different lignins by laccase,” BioResources 3(2), 549-565.
Morvan, M., Talou, T., and Beziau, J-F. (2003). “MOS–MOSFET gas sensors array measurements versus sensory and chemical characterisation of VOC’s emissions from car seat foams,” Sensors and Actuators B 95, 212–223.

PEER-REVIEWED ARTICLE bioresources.com
Kalliola et al. (2012). “VOCs of SW kraft lignin,” BioResources 7(3), 2871-2882. 2882
Naegele, H., Pfitzer, J., Naegele, E., Inone, E. R., Eisenreich, N., and Eckl, W. (2002). “ARBOFORM – A thermoplastic, processable material from lignin and natural fibers,” In: Hu, T.Q. (ed.), Chemical Modification, Properties, and Usage of Lignin, Kluwer Academic/Plenum, New York.
Norgren, M. and Lindström, B. (2000). “Dissociation of phenolic groups in kraft lignin at elevated temperatures,” Holzforschung 54(5), 519-527.
Paloheimo, M., Puranen, L., Valtakari, L., Kruus, K., Kallio, J., Mäntylä, A., Fagerström, R., Ojapalo, P., and Vehmaanperä, J. (2006a). “Novel laccase enzyme and use thereof,” Patent WO/2006/032723.
Paloheimo, M., Valtakari, L., Puranen, L., Kruus, K., Kallio, J., Mäntylä, A., Fagerström, R., Ojapalo, P., and Vehmaanperä, J. (2006b). “Novel laccase enzymes and their uses,” Patent WO/2006/032724.
Prasetyo, E., Kudanga, T., Østergaard, L., Rencoret, J., Gutiérrez, A., Del Río, J., Santos, J., Nieto, L., Jiménez-Barbero, J., Martínez, A., Li, J., Gellerstedt, G., Lepifre, S., Silva, C., Kim, S., Cavaco-Paulo, A., Klausen, B., Lutnaes, B., Nyanhongo, G., and Guebitz, G. (2010). “Polymerization of lignosulfonates by the laccase-HBT (1-hydroxybenzotriazole) system improves dispersibility,” Bioresource Technol. 101, 5054-5062.
Ragnar, M., Lindgren, C. T., and Nilvebrant, N.-O. (2000). “pKa-values of guaiacyl and syringyl phenols related to lignin,” J. Wood Chem. Technol. 20(3), 277-305.
Söderhjelm, L., and Pärssinen, M., (1985) “The use of descriptors for the characterisation of odour in packaging materials,” Paperi ja Puu – Paper och Trä 67, 412-416.
Starnes, R. L., Katkocin, D. M., Miller, C. A., and Strobel Jr., R. J. (1986). “Microbial sulfhydryl oxidase,” US Patent US 1986/4632905, 06/738764.
Stewart, R. (1985). “The proton: Applications to organic chemistry,” In: Vol. 46 of Organic Chemistry, A series of Monographs,Wasserman, H. H. (ed.), Academic Press, New York.
Swaisgood, H. E. (1977). “Process of removing the cooked flavour from milk,” US Patent US 1977/4053644, 621631.
VDA-270 (1992). “Determination of the odour characteristics of trim materials in motor vehicles”.
Zoeteman, B. C. J., Piet, G. J., and van de Heuvel, R. (1973). Threshold Odour Concentration in Water (and Air) of Chemical Substances, Government Institute for Drinking Water Supply.
Article submitted: October 24, 2011; Peer review completed: January 13, 2012; Revised version received and accepted: May 10, 2012; Published: May 21, 2012.
Ohra-aho T., Ropponen J., Tamminen T. (2013) Thermochemolysis using TMAAc and TMAH reagents as means to differentiate between free acids and esters. J. Anal. Appl. Pyrolysis 103, 31-35.
Reproduced with permission from Elsevier B.V.
III

Journal of Analytical and Applied Pyrolysis 103 (2013) 31–35
Contents lists available at ScienceDirect
Journal of Analytical and Applied Pyrolysis
journa l h om epage: www.elsev ier .com/ locate / jaap
Thermochemolysis using TMAAc and TMAH reagents as means to differentiate
between free acids and esters
T. Ohra-aho ∗, J. Ropponen, T. Tamminen
VTT-Technical Research Centre of Finland, P.O. Box 1000, FI-02044 VTT, Finland
a r t i c l e i n f o
Article history:
Received 10 July 2012
Accepted 28 September 2012
Available online 8 October 2012
Keywords:
Thermochemolysis
Tetramethylammonium hydroxide
Tetramethylammonium acetate
Ester bond
Free acids
Py-GC/MS
a b s t r a c t
The reactivity of aromatic and aliphatic esters in on-line thermochemolysis in the presence of methylation
reagents was studied using model compounds. Guaiacyl and 2-nonyl palmitates were synthesised, rep-
resenting aromatic and aliphatic ester bonds, respectively. These model compounds were analysed by
on-line thermochemolysis using tetramethylammonium acetate (TMAAc) and tetramethylammonium
hydroxide (TMAH) in order to differentiate free acids from esterified acids. The released palmitic acid
with TMAH for both model compounds was close to the theoretical palmitic acid content in the model
compounds, even if part of the aliphatic ester had not reacted with TMAH. The free palmitic acid con-
tent by TMAAc was one third of the theoretical value for aromatic ester and only a few percentages for
aliphatic ester. The result indicated that the less basic reagent is able to hydrolyse the aromatic ester
linkage to some extent, whereas the aliphatic ester remains intact. Thus, differentiation of free acids by
TMAAc from the esterified acids cannot be reliably performed from matrices containing aromatic esters.
It was found that transesterification due to the use of methanol as a solvent with TMAAc is an insignificant
reaction in on-line thermochemolysis.
© 2012 Elsevier B.V. All rights reserved.
1. Introduction
The on-line derivatisation method “thermally assisted hydroly-
sis and methylation” in the presence of the reagent tetramethylam-
monium hydroxide (TMAH) was developed by Challinor [1]. The
method, also called thermochemolysis, has been widely used for
the characterisation of a variety of natural materials and synthetic
polymers reviewed by Challinor [2] and Shadkami [3]. TMAH is a
strong base and it cleaves ester and ether bonds extensively, form-
ing more volatile methyl ester and ether derivatives [4]. TMAH
is supposed to react also with the free acids present in the sam-
ple. Therefore, it can be used to determine the total fatty acid
content of the sample [5–7]. Another thermochemolysis reagent,
tetramethylammonium acetate (TMAAc), is more selective. It reacts
only with free acid and alcohol groups. It has been used together
with TMAH to differentiate between free and esterified fatty acids
in wood extractives [6]. Tetraethylammonium acetate (TEAAc) is
another reagent that also has been applied to give information of
the free acids present in the sample. Instead of methylation, ethy-
lated products are formed. The advantage of TEAAc is that it can be
used to detect methyl esters originally present in the samples sep-
arately from the free acids [8] TMAAc and TEAAc have mainly been
used together with more basic thermochemolysis reagents like
∗ Corresponding author. Tel.: +358 40 570 9322; fax: +358 20 722 7026.
E-mail address: [email protected] (T. Ohra-aho).
TMAH and tetrabutylammonium hydroxide (TBAH) for the anal-
ysis of lipids from natural materials including humic and humin
substances [9,10] as well as earlier mentioned wood extractives
[6,11]. In addition, aquatic natural organic matter, which contains
mainly phenolic structures, has been studied with different ther-
mochemolysis reagents [12]. In that study, methylation reaction
with TMAAc (in methanol) was explained to occur partly via trans-
esterification. In addition to free functional groups, part of the ester
bonds present in the natural organic matter was supposed to react
with the methoxide ion to form methyl esters. The methoxide ion
was suggested to derive from the methanol used as TMAAc sol-
vent. The measured free acid content would thus be higher than
the actual fatty acid content present in the sample. The measure-
ment was done using off-line thermochemolysis. It is expected that
transesterification does not take place in on-line thermochemoly-
sis. Triglycerides were analysed also with TMAAc and other more
basic reagents [7]. Quite high proportion of acids was in free form.
Therefore, it was concluded that part of the ester bond might be
cleaved at the high temperature thermochemolysis with TMAAc.
Though TMAAc and TEAAc are used to determine free acid in differ-
ent type of natural polymers containing both aromatic and aliphatic
ester bonds, it has not been reported in literature whether TMAAc
and TEAAc react differently with the two types of esters. Before
using reagents with different alkalinity in the analysis of modified
biopolymers containing both aliphatic and aromatic ester linkages,
two model compounds, guaiacyl palmitate and 2-nonyl palmitate
were synthesised, representing the aromatic ester bond between
0165-2370/$ – see front matter © 2012 Elsevier B.V. All rights reserved.
http://dx.doi.org/10.1016/j.jaap.2012.09.015

32 T. Ohra-aho et al. / Journal of Analytical and Applied Pyrolysis 103 (2013) 31–35
phenol and fatty acid and aliphatic ester bond between aliphatic
alcohol and fatty acid, respectively. These model compounds were
analysed using TMAH and TMAAc in order to understand the
behaviour of the reagents in the analysis of ester bonds and free
acids. Even if it has been claimed that transesterification probably
does not take place in on-line thermochemolysis this possibility
was studied in the present study, and it was found to be negligible,
as expected.
2. Materials and methods
2.1. The general procedure for model compound
All materials used for the synthesis were commercial and used
as such unless otherwise noted. 1H and 13C NMR spectra were
recorded on a Bruker Avance III 500 MHz NMR spectrometer and
the chemical shifts were calibrated to the residual proton and car-
bon resonance of the deuterated solvent.
Guaiacyl palmitate: palmitic acid (7.43 g, 29.0 mmol), qua-
iacol (3.42 g, 27.6 mmol) and 4-dimethylaminopyridine (0.67 g,
5.52 mmol) were dissolved in dichloromethane (100 ml) and cooled
to 0 ◦C, followed by addition of dicyclohexanecarbodiimide (6.83 g,
33.1 mmol) portion wise in a dichloromethane solution. The reac-
tion was left to reach room temperature overnight and was then
filtered to remove solids. The filtrate was evaporated and the
crude product was purified by flash chromatography from heptane
increasing polarity to EtOAc:heptane 5:95 to give product as a white
solid. Yield was 8.32 g (83%).1H NMR (500.1 MHz, CDCl3): ı 0.88 (t, J = 6.70 Hz, 3H, –CH3),
1.26–1.37 (m, 22H, –CH2), 1.43 (t, J = 7.11 Hz, 2H, –CH2), 1.77 (t,
J = 7.46 Hz, 2H, –CH2), 2.58 (t, J = 7.46 Hz, 2H, –CH2), 3.82 (s, 3H,
–OCH3), 6.93–7.21 (m, 4H, –ArH). 13C NMR (125.8 MHz, CDCl3):
ı 14.11 (–CH3), 22.67 (–CH2), 25.04 (–CH2), 29.06 (–CH2), 29.28
(–CH2), 29.35 (–CH2), 29.50 (–CH2), 29.61 (–CH2), 29.65–29.68 (5C,
–CH2), 31.91 (–CH2), 34.05 (–CH2), 55.77 (–OCH3), 112.35 (ArCH),
120,72 (ArCH), 122.82 (ArCH), 126.71 (ArCH), 139.84 (ArC), 151.14
(ArC), 171.89 (–CO).
2-Nonyl palmitate: palmitic acid (7.04 g, 27.4 mmol), 2-
nonanol (3.77 g, 26.1 mmol) and 4-dimethylaminopyridine (0.64 g,
5.23 mmol) were dissolved in dichloromethane (100 ml) and cooled
to 0 ◦C, followed by addition of dicyclohexanecarbodiimide (6.47 g,
31.4 mmol) portion wise from a dichloromethane solution. The
reaction was left to reach room temperature overnight and was
then filtered to remove solids. Filtrate was evaporated and the
crude product was purified by flash chromatography from heptane
increasing polarity to EtOAc:heptane 2:98 to give product as a clear
oil. Yield 7.17 g (71.7%).
Yield of product was 7.17 g (72%).1H NMR (500 MHz, CDCl3): ı 0.88 (t, J = 6.93 Hz, 6H, –CH3), 1.19
(d, J = 6.25 Hz, 3H, CH3), 1.25–1.34 (m, 34H, CH2), 1.42–1.63 (m, 4H,
–CH2), 2.26 (t, J = 7.53 Hz, 2H, –CH2), 4.89 (hex, J = 6.32 Hz, 1H, –CH).13C NMR (126 MHz, CDCl3): ı 14.07 (–CH3), 14.11 (–CH3), 20.02
(–CH3), 22.64 (–CH2), 22.69 (–CH2), 25.12 (–CH2), 25.42 (–CH2),
29.15 (–CH2), 29.21 (–CH2), 29.29 (–CH2), 29.36 (–CH2), 29.41
(–CH2), 29.48 (–CH2), 29.60 (–CH2), 29.65–29.69 (5C, –CH2), 31.78
(–CH2), 31.92 (–CH2), 34.77 (–CH2), 35.96 (–CH2), 70.71 (–CH),
173.58 (–CO).
2.2. Thermochemolysis
Thermochemolysis with TMAH (10% in aqueous solution,
Merck) and TMAAc (15% in aqueous solution, TCI) was performed
using a platinum foil pulse pyrolyzer (Pyrolab2000® from Pyro-
lab, Sweden) connected to a gas chromatograph mass spectrometer
(Varian 3800 GC-Varian Saturn 2000 MS). A fused silica capillary
Fig. 1. Model compounds.
column (J&W, DB-1701, 30 m × 0.25 mm, film thickness 1 �m) was
used for the compound separation. 2–4 �l of the sample solu-
tion (model compounds diluted to methanol or dichloromethane)
at concentration about 0.5 mg/ml was pipetted on the filament
together with internal standard (heneicosanoic acid, Fluka purum
≥98%) and the reagent. The mixture was inserted to the pyrolyzer
maintained at 175 ◦C and the filament was heated to temperatures
between 280 and 600 ◦C depending on the reagent used. Pyroly-
sis time was 2 s. After pyrolysis, the degradation products were led
into the capillary column for separation using helium as carrier
gas at flow rate 1.0 ml min−1. The column temperature was pro-
grammed from 80 ◦C (2 min) to 160 ◦C at 8 ◦C min−1 and extended
from 160 ◦C to 280 ◦C at 5 ◦C min−1. The final temperature was held
for 5 min. The mass spectrometer was operated in EI mode (70 eV)
using mass range of m/z 46–650. Acid content was calculated using
internal standard calibration.
3. Results and discussion
3.1. Thermochemolysis conditions
Two model compounds guaiacyl palmitate and 2-nonyl palmi-
tate, which contained both aromatic and aliphatic ester bonds,
were synthesised. Structures of model compounds are shown in
Fig. 1. These model compounds were analysed using on-line ther-
mochemolysis with two methylation reagents TMAH and TMAAc.
On-line thermochemolysis was performed in a pyrolysis unit.
Therefore, short reaction time of 2 s was favoured. Both methylation
reagents were used as aqueous solutions. Based on literature, ther-
mochemolysis at pyrolysis temperature of 600 ◦C has given highest
recovery for the fatty acids [7]. Our experience was that 400 ◦C
and 600 ◦C gave basically the same yield of fatty acid. However,
at high temperatures such as 600 ◦C, better yield for the aro-
matic compounds were obtained (not reported). Therefore, TMAH
thermochemolysis was performed at 600 ◦C, whereas lower tem-
perature was used for TMAAc thermochemolysis to avoid thermal
degradation of the ester bond. Both model compounds as well as the
internal standard were diluted to methanol and dichloromethane
before transferring on the filament. The reason to use two solvents
with different structure was to understand the effect of the solvents
on the methylation reaction i.e. transesterification. If transesterifi-
cation of the ester groups in the sample take place via methoxide
ion formation, higher proportion of methylated products would be
formed when methanol is used as a solvent in thermochemolysis by
TMAAc. It was proposed that transesterification does not take place
when dichloromethane is used as a solvent. The solutions were pre-
pared for the model compounds in order to be able to transfer a
suitable amount of sample on the filament and avoid overload of
the detector. In TMAAc thermochemolysis, the reagent was mixed
with the sample in two different ways: before or after addition of
the sample on the filament. The concentration of TMAAc in the mix-
ture was 3%. There was no difference in the results depending on
how the reagent was mixed with the sample. Therefore, the results
are presented as average. TMAH was always added after sample
addition directly on the filament. All measurements were done at

T. Ohra-aho et al. / Journal of Analytical and Applied Pyrolysis 103 (2013) 31–35 33
Fig. 2. Expected products formed in TMAH thermochemolysis of guaiacyl palmitate (above) and 2-nonyl palmitate (below).
least triplicate. The released palmitic acid content was calculated
for the model compounds using internal standard calibration.
3.2. Thermochemolysis by TMAH and TMAAc
The expected reactions taking place in TMAH thermochemol-
ysis of guaiacyl and 2-nonyl palmitate are shown in Fig. 2. It was
expected that TMAAc does not react with ester bonds. Total ion
gas chromatograms in Figs. 3 and 4 show the methylated prod-
ucts formed from the guaiacyl palmitate and 2-nonyl palmitate
in thermochemolysis with TMAH and TMAAc. In the presence of
TMAH, guaiacyl palmitate was hydrolysed and palmitic acid methyl
ester and dimethoxybenzene were formed as methylation prod-
ucts (Fig. 3). The peak intensities of dimethoxybenzene and palmitic
acid methyl ester were surprisingly high in comparison to internal
standard intensity when TMAAc was used, as TMAAc is not sup-
posed to hydrolyse esters [6]. The result indicates that part of the
aromatic ester was hydrolysed in the thermochemolysis by TMAAc.
In addition to methylated products, also nonmethylated guaiacol
was detected probably as a thermal degradation product of guaiacyl
palmitate. Nonmethylated palmitic acid was not detected, probably
because the elution of fatty acids without derivatisation is poor.
Methyl palmitate was the only methylated product from 2-
nonyl palmitate in the presence of TMAH (Fig. 4). Small peak of
2-nonanol was detected, but not 2-nonyl methyl ether. It has ear-
lier been reported that all alcohol groups are not fully methylated
[1]. Also small amount of the original ester 2-nonyl palmitate was
found, indicating incomplete reaction of aliphatic esters in the
presence of TMAH. In the thermochemolysis of 2-nonyl palmitate
with TMAAc, only a small peak of methyl palmitate was found, indi-
cating that only the free acid is reacted with TMAAc, as expected.
The peak with highest abundance was the unreacted ester. In addi-
tion, a small amount of non-methylated 2-nonanol was detected.
Our results regarding the thermochemolysis of aliphatic esters by
TMAAc were consistent with the results reported in literature [6].
The amount of released palmitic acid was calculated for the
TMAH and TMAAc thermochemolysis experiments. The palmitic
acid content determined by TMAH was compared with the theoret-
ical content. The results are shown in Figs. 5 and 6. The measured
total palmitic acid content for the guaiacyl palmitate was close
to the theoretical value (Fig. 5). When methanol was used as sol-
vent, the average palmitic acid content was closer to the theoretical
value than in the case of dichloromethane as solvent. However,
the standard deviation was higher when methanol was used. The
released palmitic acid content from the guaiacyl palmitate with
TMAAc was about one third of the theoretical total content. Again
higher average palmitic acid content was measured when methanol
was used as solvent as compared to dichloromethane. However,
the methylation of palmitic acid cannot explain to form via trans-
esterification, because palmitic acid content was equal with both
solvents. The measured free palmitic acid content was surprisingly
high, as any unreacted palmitic acid after the synthesis was sup-
posed to be removed during the purification, further verified by
NMR analysis of the product. The origin of the measured high free
palmitic acid content is thus concluded to be partial hydrolysis of
the aromatic ester bond in the thermochemolysis by TMAAc.
Fig. 3. Products formed from guaiacyl palmitate (in dichloromethane) by TMAH thermochemolysis (above) and TMAAc thermochemolysis (below).

34 T. Ohra-aho et al. / Journal of Analytical and Applied Pyrolysis 103 (2013) 31–35
Fig. 4. Products formed from 2-nonylpalmitate (in dichloromethane) by TMAH thermochemolysis (above) and TMAAc thermochemolysis (below).
The palmitic acid content determined with TMAH from the 2-
nonyl palmitate was slightly lower than the theoretical value, as
part of the 2-nonyl palmitate had not reacted with TMAH (Fig. 6). A
small peak of the original ester is seen in the total ion gas chro-
matogram, verifying the conclusion (Fig. 4). A small amount of
palmitic acid was measured in the presence of TMAAc from the
2-nonyl palmitate. The palmitic acid content measured from 2-
nonyl palmitate was much lower in comparison to the palmitic
acid content measured from guaiacyl palmitate. In the case of 2-
nonyl palmitate, TMAAc seems to react only with the free acid
group, not with the ester group, as expected. The result proved that
the aliphatic ester bond is more stable against less basic reagents
such as TMAAc in comparison to the aromatic ester bond. Also in
this case, the palmitic acid content was slightly higher when the
samples were diluted in methanol rather than dichloromethane.
However, the standard deviation was large when methanol was
used. Due to the similar values obtained with both solvents it was
proposed that transesterification due to the use of methanol as
solvent with TMAAc is an insignificant reaction in on-line ther-
mochemolysis.
The influence of pyrolysis temperature on palmitic acid yield
was studied in the case of 2-nonyl palmitate, because part of the
ester was not hydrolysed and methylated in the presence of TMAH.
However, there were no differences in palmitic acid content at tem-
peratures of 600, 700 and 800 ◦C, indicating that hydrolysis and
methylation was independent on the temperature changes (Fig. 7).
The influences of reaction time before pyrolysis and pyrolysis time
on palmitic acid yield were not studied.
Fig. 5. Amount of palmitic acid released from guaiacyl palmitate by TMAH and
TMAAc.
Fig. 6. Amount of palmitic acid released from 2-nonyl palmitate by TMAH and
TMAAc.
Fig. 7. Effect of temperature on palmitic acid yield from 2-nonyl palmitate (in
dichloromethane) by TMAAc. One measurement was done at 800 ◦C.
4. Conclusions
TMAH has been used for the determination of total fatty
acids content. In this study, TMAH was used to determine total
palmitic acid content from model compounds that represented
both aliphatic and aromatic ester bonds between alcohol and fatty
acid. Palmitic acid was hydrolysed and methylated totally from the
aromatic ester, whereas part of the aliphatic ester remained sta-
ble. TMAAc has earlier been used to differentiate between free and
esterified acids in wood extractives. The fatty acids in wood extrac-
tives are esterified with cyclic and aliphatic alcohols. The results
obtained in this study showed that the aromatic ester bond is partly
hydrolysed and methylated in the presence of TMAAc, whereas the
aliphatic ester bond is stable against TMAAc. It means that TMAAc
can be used to distinguish between free acids and aliphatic esters

T. Ohra-aho et al. / Journal of Analytical and Applied Pyrolysis 103 (2013) 31–35 35
in matrices such as wood extractives, containing only aliphatic
alcohols. However, it cannot used to determine free acids from sam-
ples, which contain either aromatic and aliphatic ester linkages, or
only aromatic ester linkages. Transesterification in thermochemol-
ysis in the presence of methanol has been suggested to increase
the yield of methylated products. However, it was now showed
that in on-line thermochemolysis, the transesterification reaction
is insignificant.
Acknowledgements
The authors would like to thank Ms. Eila Turunen for performing
the technical work in the Py-GC/MS experiments. The financial sup-
port from the Academy of Finland is acknowledged (Effect of fiber
wall chemistry on energy demand in wood defibration, Defibre,
133276).
References
[1] J.M. Challinor, A pyrolysis-derivatisation-gas chromatography technique forthe structural elucidation of some synthetic polymers, Journal of Analyticaland Applied Pyrolysis 16 (1989) 323–333.
[2] J.M. Challinor, Review: the development and applications of thermally assistedhydrolysis and methylation reactions, Journal of Analytical and Applied Pyrol-ysis 61 (2001) 3–34.
[3] F. Shadkami, R. Hellure, Review: recent applications in analytical ther-mochemolysis, Journal of Analytical and Applied Pyrolysis 89 (2010) 2–16.
[4] J.M. Challinor, On the mechanism of high temperature reactions of quater-nary ammonium hydroxides with polymers, Journal of Analytical and AppliedPyrolysis 29 (1994) 223–224.
[5] J.M. Challinor, Characterisation of wood extractives by pyrolysis-gas chro-matography/mass spectrometry of quaternary ammonium hydroxide extracts,Journal of Analytical and Applied Pyrolysis 37 (1996) 1–13.
[6] H.-L. Hardell, N.-O. Nilvebrant, A rapid method to discriminate between freeand esterified fatty acids by pyrolytic methylation using tetramethylammo-nium acetate or hydroxide, Journal of Analytical and Applied Pyrolysis 49(1999) 1–14.
[7] D. Drechsel, K. Dettmer, W. Engewald, Studies of thermally assisted hydrol-ysis and methylation-GC–MS of fatty acids and triglycerides using differentreagents and injection systems, Chromatographia 57 (2003) S-283–S-289.
[8] L. Grasset, C. Guignard, A. Amblès, Free and esterified aliphatic carboxylic acidsin humin and humic acids from a peat sample as revealed by pyrolysis withtetramethylammonium hydroxide or tetramethylammonium acetate, OrganicGeochemistry 33 (2002) 181–188.
[9] C. Guignard, L. Lemée, A. Amblès, Lipid constituents of peat humic acidsand humin. Distinction from directly extractable bitumen componentsusing TMAH and TEAAc thermochemolysis, Organic Geochemistry 36 (2005)287–297.
[10] D. Válková, L. Grasset, A. Amblès, Molecular compounds generated by ruthe-nium tetroxide oxidation and preparative off line thermochemolysis of lignitehumic acids from South Moravia: implications for molecular structure, Fuel 88(2009) 2113–2121.
[11] M. Mizumoto, E. Shimokita, T. Ona, T. Seino, Y. Ishida, H. Ohtani, Rapid anddirect characterization of total fatty acids in wood by thermochemolysis-gaschromatography–flame ionization detector/mass spectrometry with tetra-butylammonium hydroxide, Journal of Analytical and Applied Pyrolysis 87(2010) 163–167.
[12] C.A. Joll, D. Couton, A. Heitz, R.I. Kagi, Comparison of reagents for off-linethermochemolysis of natural organic matter, Organic Geochemistry 32 (2004)47–59.

Ohra-aho T., Gomes F.J.B., Colodette J.L., Tamminen T. (2013) S/G ratio and lignin structure among Eucalyptus hybrids determined by Py-GC/MS and nitrobenzene oxidation. J. Anal. Appl. Pyrolysis 101, 166-171.
Reproduced with permission from Elsevier B.V.
IV

Journal of Analytical and Applied Pyrolysis 101 (2013) 166–171
Contents lists available at SciVerse ScienceDirect
Journal of Analytical and Applied Pyrolysis
journa l h o me page: www.elsev ier .com/ locate / jaap
S/G ratio and lignin structure among Eucalyptus hybrids determined by
Py-GC/MS and nitrobenzene oxidation
T. Ohra-ahoa,∗, F.J.B. Gomesb, J.L. Colodetteb, T. Tamminena
a VTT-Technical Research Centre of Finland, P.O. Box 1000, FI-02044 VTT, Finlandb Department of Forest Engineering, Federal University of Vic osa, 36570-000 Vic osa, Brazil
a r t i c l e i n f o
Article history:
Received 7 September 2012
Accepted 24 January 2013
Available online 1 February 2013
Keywords:
Eucalypt
Wood
Lignin
S/G ratio
Py-GC/MS
Nitrobenzene oxidation
a b s t r a c t
The ratio among syringyl (S) and guaiacyl (G) lignin substructures is increasingly used as criteria in the
selection of Eucalyptus species to pulping processes. The S/G distribution of several Brazilian Eucalyp-
tus species and their crossings was determined by analytical pyrolysis-GC/MS (Py-GC/MS) and alkaline
nitrobenzene oxidation directly from wood fibers. The ratio varied among the Eucalyptus hybrids. In Py-
GC/MS, the S/G ratio is calculated by summing up the proportions of S and G type lignin pyrolysis products
with various 1–3 carbon containing side chain structures. Py-GC/MS revealed that the distribution of the
lignin side chain structures varied among the species. Similar trends were seen both in the G and in the S
series. The result was verified with principal component analysis (PCA), which also revealed that similar
side chains structures in the G and S units are correlated with each other. That PCA result confirmed
that all G and S type degradation products should be included in the calculation of S/G ratios instead of
selected products. S/G ratios determined by Py-GC/MS and alkaline nitrobenzene oxidation were close
to each other, but not equal. Lower values were obtained by Py-GC/MS. The differences between the two
methods are probably related the degradation mechanism of lignin with Py-GC/MS and nitrobenzene
oxidation methods. Based on these results, it is not possible to say which of the methods is more reliable.
However, both methods can well be used to compare the S/G ratios of lignin among samples.
© 2013 Elsevier B.V. All rights reserved.
1. Introduction
Lignin is a highly heterogeneous polymer composed of hydrox-
ycinnamyl alcohols, including coniferyl, sinapyl and p-coumaryl
alcohol building blocks. The structure of lignin varies depending
on the plant species, cell type and environmental factors. Lignin
units are linked by a variety of ether and carbon–carbon bonds that
are usually classified into condensed linkages, such as biphenyl,
biphenyl ethers and non-condensed linkages, including alkyl-aryl
ether linkages (�-O-4) [1]. In hardwood species like Eucalyptus spp,
lignin is mainly composed of guaiacyl (G) and syringyl (S) moieties.
Several studies have shown that the structure of lignin, particularly
S/G ratio, affects the processability of the wood, e.g. delignification
[2–4]. Furthermore, the S/G ratio determined both with alkaline
nitrobenzene and with permanganate oxidation methods has been
found to correlate with the proportion of the condensed structures
of lignin. The higher the S/G ratio less condensed structures has
been determined from the wood [5].
Analytical pyrolysis combined with gas chromatography–mass
spectrometry (GC/MS) has been increasingly used to determine
∗ Corresponding author. Tel.: +358 40 570 9322; fax: +358 20 722 7026.
E-mail address: [email protected] (T. Ohra-aho).
lignin structure from wood fibers, because time consuming sample
preparation is not needed. In addition, the phenolic lignin pyrolysis
products have been identified and reported [6–8]. The technique
has increasingly been used for the estimation of the S/G ratio of
lignin [2,4,9–15]. Another method commonly used for the same
purpose is the nitrobenzene oxidation method [9–17]. In the alka-
line nitrobenzene oxidation, lignin is oxidatively cleaved to form
aromatic carbonyl compounds, i.e. syringaldehyde and vanillin as
main products [18]. Due to the lacking reactivity of nitrobenzene
oxidation against condensed structures, the yield of the carbonyl
compounds is approximately 50% of the lignin. Due to the high pro-
portion of condensed guaiacyl units, only about 30% of them are
converted to vanillin. On the contrary, the conversion of syringyl
units to syringaldehyde may be as high as 90% due to the low pro-
portion of condensation in this case. Therefore, the obtained S/G
ratio by alkaline nitrobenzene oxidation is expected to be higher
than the actual proportion of guaiacyl and syringyl units in lignins
[1,17].
In pyrolysis, lignin is thermally degraded to a mixture of phenols
by heating samples in an inert atmosphere. The formed products
retain the structural information of the original polymer. However,
it has been difficult to find direct relationship among the pheno-
lic pyrolysis degradation products and the original lignin structure.
It is proposed that the phenols formed result from the cleavage of
0165-2370/$ – see front matter © 2013 Elsevier B.V. All rights reserved.
http://dx.doi.org/10.1016/j.jaap.2013.01.015

T. Ohra-aho et al. / Journal of Analytical and Applied Pyrolysis 101 (2013) 166–171 167
the �-O-4 and some condensed linkages such as �-5 [19–22]. How-
ever, the yield of the pyrolysis products is expected to be highly
dependent on the number of condensed structures present in lignin
[9,10,12,23]. Thus, also Py-GC/MS overestimates the syringyl units
in lignin similarly to nitrobenzene oxidation. A correction equation
has been developed in order to compensate for the effect of con-
densation and thus reduce the yield of S units with relation to G
units [10]. The yield of the monomeric pyrolysis degradation prod-
ucts for the different Japanese hardwood species has been reported
to vary from 12.2 to 26.1% of Klason lignin [14]. For hardwood
type synthetic dehydrogenation polymers the pyrolysis yield var-
ied from 10 to 20% [12]. The pyrolysis yields were thus much lower
than that reported for the nitrobenzene oxidation yields of vanillin
and syringaldehyde [12,14]. S/G ratios by Py-GC/MS and alkaline
nitrobenzene oxidation have been compared [9,11–14]. The ratios
for wood samples are close to each other, but not equal [11,13,14].
In several studies poor chromatographic separation of carbohy-
drate derivatives from lignin derivatives has caused problems in
integration of lignin derivatives [11,13,14]. To overcome this prob-
lem, selected lignin pyrolysis degradation products have been used
for the S/G ratio calculation by Py-GC/MS [11,13]. That, however,
may lead to false information about the S/G ratios. Good correlation
among Py-GC/MS and nitrobenzene oxidation methods has been
obtained for the isolated lignins [12]. In isolated lignin samples,
the cellulosic fiber matrix is not present, which in wood samples
may affect the result. The problem related to overlapping carbohy-
drate derivatives is also overcome. However, the isolation process
may change the lignin structure and also the isolation increases the
analysis time.
Eucalyptus wood is fast growing plant material that is increas-
ingly used for pulp production in temperate zones. S/G ratio of
lignin is one of the most important parameters used to evaluate the
performance of Eucalyptus wood. Thus, reliable and fast methods
for the determination of S/G ratios of lignin directly from wood sam-
ples without any need of lignin isolation are needed. In this study,
a large number of wood samples from several Eucalyptus species
including E. grandis, E. urophylla, E. globulus, E. dunnii, E. camaldu-
lensis and their crossings were subjected to Py-GC/MS analysis. The
aim of the study was to determine possible differences in the struc-
ture of lignin and S/G ratio among Eucalyptus hybrids by Py-GC/MS.
Especially the effect of the change of species in Eucalyptus crossings
on lignin structure was studied. In addition, Py-GC/MS was com-
pared with alkaline nitrobenzene oxidation, aiming at clarifying
the potential of the two methods for the estimation of the S/G ratio
in lignin. The aim was also to understand the reasons behind the
observed differences among the S/G ratios obtained with Py-GC/MS
and alkaline nitrobenzene oxidation.
2. Material and methods
2.1. Sample preparation
Eighteen 7-year-old Eucalyptus hybrids, including a number
of double/triple/fourth crossings among E. grandis, E. urophylla, E.
globulus, E. dunnii and E. camaldulensis species obtained from Brazil
were used as raw materials of this study. Detailed list of the Euca-
lyptus hybrids is presented in Table 1.
For the chemical analyses, wood chips were prepared with a
laboratory chipper (a Chogokukikai model). The chips were well
mixed (260 m3 rotary mixers) and screened according to SCAN-
CN 40:94 procedures [24]. For the S/G ratio determination with
alkaline nitrobenzene oxidation, the chips were grinded in a Wiley
type mill (40 mesh screen) to 40–60 mesh and extractives were
removed (mixture of ethanol/toluene 1:2 followed first by ethanol
and secondly by hot water) according to TAPPI T264cm-97 standard
Table 1Samples.
No. Eucalyptus hybrids Short code
1 E. urophylla (IP) × E. grandis (IP) IP
2 E. urophylla (Flores IP) × E. urophylla (Timor) U1×U2
3 E. urophylla (Flores IP) × E. camaldulensis (VM2) U1×C2
4 E. urophylla (Flores IP) × [E. urophylla (R) × E.
globulus (R)]
U1×UGL
5 E. grandis (Coffs Harbour) × [E. urophylla (R) × E.
globulus (R)]
G1×UGL
6 E. dunni (R) × [E. urophylla (R) × E. globulus (R)] D1×UGL
7 E. camaldulensis (VM1) × [E. urophylla (R) × E.
globulus (R)]
C1×UGL
8 [E. dunnii (R) × E. grandis (R)] × [E. urophylla
(R) × E. globulus (R)]
DG×UGL
9 [E. dunnii (R) × E. grandis (R)] × E. urophylla
(Timor)
DG×U2
10 [E. dunnii (R) × E. grandis (R)] × E. camaldulensis
(VM1)
DG×C1
11 [E. dunnii (R) × E. grandis (R)] × E. globulus (R)
(Dad, pollen)
DG×GL2
12 E. dunni (KR) × E. globulus (R) (Dad, pollen) D2×GL2
13 E. grandis (Coffs Harbour) × E. globulus (R) (Dad,
pollen)
G1×GL2
14 E. urophylla (Timor) × E. globulus (R) (Mom,
stigma)
U2×GL1
15 E. urophylla (Timor) × E. camaldulensis (VM1) U2×C1
16 E. camaldulensis (VM1) × E. camaldulensis (VM1) C1×C2
17 E. dunni (R) × E. dunni (KR) D1×D2
18 VCP – E. grandis (VCP) × E. urophylla (VCP) VCP
procedure [25]. Lignin composition and S/G ratio was measured by
Py-GC/MS for the Wiley milled chips without extractives removal.
2.2. Determination of the S/G ratio by nitrobenzene
oxidation/HPLC
The determination of the S/G ratio of each extractive-free wood
sample was obtained by the nitrobenzene oxidation according to
Lin and Dence [17]. Approximately 0.2 g (oven dryed) of each wood
sample together with NaOH aqueous solution (7 mL; 2 mol L−1)
and nitrobenzene (0.5 mL) was loaded into a stainless steel reac-
tor and heated up to 170 ◦C for 2.5 h, with analyses repeated twice.
The oxidized material was then extracted with chloroform (6×30 mL). After the first extraction, HCl was added (2.5 mL; 4 mol L−1)
to the aqueous phase. The combined organic phases were evap-
orated. The sample was transferred to a 50 mL volumetric flask
and the volume completed with acetonitrile/water solution (1:1,
v/v). Following, the solution was filtered in a regenerated cellu-
lose membrane, pore size 0.45 �m, analyzed by high performance
liquid chromatography (HPLC) in a Shimadzu CBM-10A appa-
ratus equipped with a UV-VIS detector SPD-10AV, operating at
280 nm wavelength, LC-10AD pump and Rheodyne injector with a
20 mL loop and a Lichrosorb RP-18 (250 mm × 4 mm, 5 �m) reverse
phase analytical column. The mobile phase was composed of ace-
tonitrile/water (1:6, v/v) and the pH was adjusted to 2.6 with
trifluoroacetic acid (TFA) buffer. The column temperature was kept
at 40 ◦C, and mobile phase flow of 1.5 mL/min was used. Vanillin
and syringaldehyde standards (Aldrich, Milwaukee, WI, USA) were
used for quantification of derivatives of guaiacyl and syringyl units,
respectively. Calibration curves using vanillin and syringaldehyde
standards were obtained in the concentrations of 0.375, 0.75,
1.125, and 1.5 mmol L−1 for vanillin, and 0.825, 1.65, 2.475, and
3.3 mmol L−1 for syringaldehyde. The solutions were prepared in
an acetonitrile/water mixture (1:1, v/v), at pH 2.6. The equation
used for vanillin and syringaldehyde were y = 5,669,520x − 84,175
(R2 = 0.9993, %RSD = 1.35) and y = 3,056,620x + 75,181 (R2 = 0.9996,
%RSD = 2.05), respectively. The partial least square method was
used to fit the data.
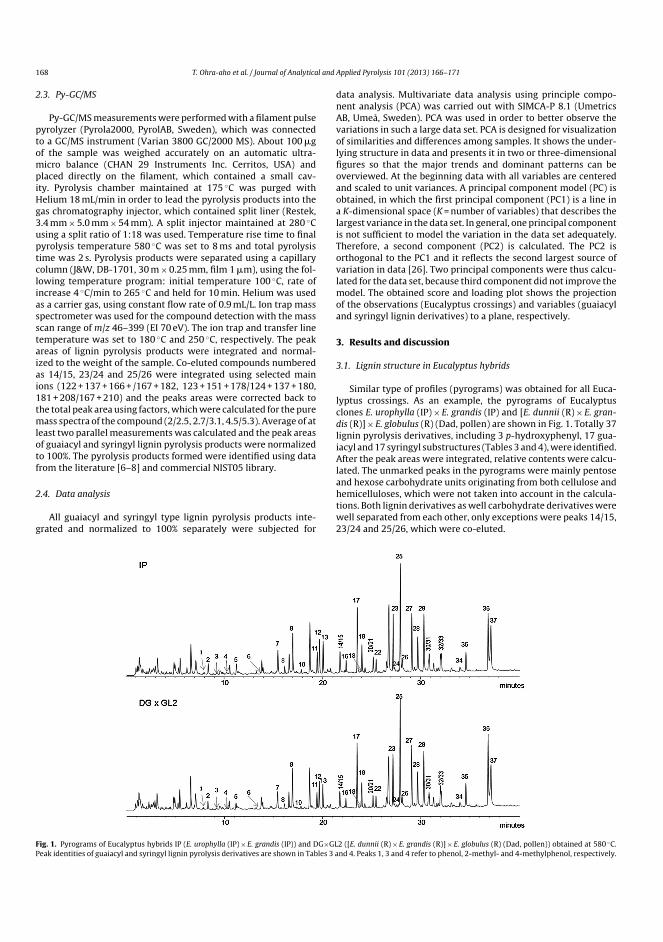
168 T. Ohra-aho et al. / Journal of Analytical and Applied Pyrolysis 101 (2013) 166–171
2.3. Py-GC/MS
Py-GC/MS measurements were performed with a filament pulse
pyrolyzer (Pyrola2000, PyrolAB, Sweden), which was connected
to a GC/MS instrument (Varian 3800 GC/2000 MS). About 100 �g
of the sample was weighed accurately on an automatic ultra-
micro balance (CHAN 29 Instruments Inc. Cerritos, USA) and
placed directly on the filament, which contained a small cav-
ity. Pyrolysis chamber maintained at 175 ◦C was purged with
Helium 18 mL/min in order to lead the pyrolysis products into the
gas chromatography injector, which contained split liner (Restek,
3.4 mm × 5.0 mm × 54 mm). A split injector maintained at 280 ◦C
using a split ratio of 1:18 was used. Temperature rise time to final
pyrolysis temperature 580 ◦C was set to 8 ms and total pyrolysis
time was 2 s. Pyrolysis products were separated using a capillary
column (J&W, DB-1701, 30 m × 0.25 mm, film 1 �m), using the fol-
lowing temperature program: initial temperature 100 ◦C, rate of
increase 4 ◦C/min to 265 ◦C and held for 10 min. Helium was used
as a carrier gas, using constant flow rate of 0.9 mL/L. Ion trap mass
spectrometer was used for the compound detection with the mass
scan range of m/z 46–399 (EI 70 eV). The ion trap and transfer line
temperature was set to 180 ◦C and 250 ◦C, respectively. The peak
areas of lignin pyrolysis products were integrated and normal-
ized to the weight of the sample. Co-eluted compounds numbered
as 14/15, 23/24 and 25/26 were integrated using selected main
ions (122 + 137 + 166 + /167 + 182, 123 + 151 + 178/124 + 137 + 180,
181 + 208/167 + 210) and the peaks areas were corrected back to
the total peak area using factors, which were calculated for the pure
mass spectra of the compound (2/2.5, 2.7/3.1, 4.5/5.3). Average of at
least two parallel measurements was calculated and the peak areas
of guaiacyl and syringyl lignin pyrolysis products were normalized
to 100%. The pyrolysis products formed were identified using data
from the literature [6–8] and commercial NIST05 library.
2.4. Data analysis
All guaiacyl and syringyl type lignin pyrolysis products inte-
grated and normalized to 100% separately were subjected for
data analysis. Multivariate data analysis using principle compo-
nent analysis (PCA) was carried out with SIMCA-P 8.1 (Umetrics
AB, Umeå, Sweden). PCA was used in order to better observe the
variations in such a large data set. PCA is designed for visualization
of similarities and differences among samples. It shows the under-
lying structure in data and presents it in two or three-dimensional
figures so that the major trends and dominant patterns can be
overviewed. At the beginning data with all variables are centered
and scaled to unit variances. A principal component model (PC) is
obtained, in which the first principal component (PC1) is a line in
a K-dimensional space (K = number of variables) that describes the
largest variance in the data set. In general, one principal component
is not sufficient to model the variation in the data set adequately.
Therefore, a second component (PC2) is calculated. The PC2 is
orthogonal to the PC1 and it reflects the second largest source of
variation in data [26]. Two principal components were thus calcu-
lated for the data set, because third component did not improve the
model. The obtained score and loading plot shows the projection
of the observations (Eucalyptus crossings) and variables (guaiacyl
and syringyl lignin derivatives) to a plane, respectively.
3. Results and discussion
3.1. Lignin structure in Eucalyptus hybrids
Similar type of profiles (pyrograms) was obtained for all Euca-
lyptus crossings. As an example, the pyrograms of Eucalyptus
clones E. urophylla (IP) × E. grandis (IP) and [E. dunnii (R) × E. gran-
dis (R)] × E. globulus (R) (Dad, pollen) are shown in Fig. 1. Totally 37
lignin pyrolysis derivatives, including 3 p-hydroxyphenyl, 17 gua-
iacyl and 17 syringyl substructures (Tables 3 and 4), were identified.
After the peak areas were integrated, relative contents were calcu-
lated. The unmarked peaks in the pyrograms were mainly pentose
and hexose carbohydrate units originating from both cellulose and
hemicelluloses, which were not taken into account in the calcula-
tions. Both lignin derivatives as well carbohydrate derivatives were
well separated from each other, only exceptions were peaks 14/15,
23/24 and 25/26, which were co-eluted.
Fig. 1. Pyrograms of Eucalyptus hybrids IP (E. urophylla (IP) × E. grandis (IP)) and DG×GL2 ([E. dunnii (R) × E. grandis (R)] × E. globulus (R) (Dad, pollen)) obtained at 580 ◦C.
Peak identities of guaiacyl and syringyl lignin pyrolysis derivatives are shown in Tables 3 and 4. Peaks 1, 3 and 4 refer to phenol, 2-methyl- and 4-methylphenol, respectively.

T. Ohra-aho et al. / Journal of Analytical and Applied Pyrolysis 101 (2013) 166–171 169
Table 2Proportion of p-hydroxyphenyl, guaiacyl and syringyl lignin pyrolysis derivatives
and S/G ratios determined with py-GC/MS and alkaline nitrobenzene oxidation
method.
H% G% S% S/G ratio
Py-GC/MS Nitrobenzene
oxidationb
IP 0.5 29.4 70.1 2.4 2.8
U1×U2 0.5 28.8 70.7 2.5a 3.0
U1×C2 0.5 28.2 71.4 2.5a 3.1
U1×UGL 0.3 24.8 74.8 3.0 3.3
G1×UGL 0.5 27.3 72.1 2.6a 3.1
D1×UGL 0.4 25.1 74.5 3.0a 3.9
C1×UGL 0.4 28.6 71.0 2.5 3.3
DG×UGL 0.3 28.7 70.9 2.5 3.3
DG×U2 0.5 29.1 70.4 2.4a 2.7
DG×C1 0.5 30.1 68.5 2.2 2.9
DG×GL2 0.4 25.6 74.0 2.9 3.0
D2×GL2 0.4 24.8 74.8 3.0 3.7
G1×GL2 0.5 27.0 72.5 2.7 3.6
U2×GL1 0.4 25.3 74.4 2.9 4.0
U2×C1 0.5 28.2 71.3 2.5 2.8
C1×C2 0.5 24.6 74.9 3.0a 3.2
D1×D2 0.3 24.3 75.4 3.1 3.9
VCP 0.5 34.5 64.9 1.9a 3.0
a Average of three parallel measurements.b Average of two parallel measurements.
As shown in Table 2, the main lignin pyrolysis derivatives in
hardwoods are syringyl and guaiacyl type substructures. The pro-
portion of p-hydroxyphenyl structures represented less than 1% of
all lignin derivatives determined. The p-hydroxyphenyl type prod-
ucts probably originate at least partly from non-lignin material
[10,27], even if in these samples the proportion of p-hydroxyphenyl
structures correlated with the proportion of the guaiacyl structures.
Due to the low proportion of p-hydroxyphenyl derivatives, only
guaiacyl and syringyl units were compared in the structural evalu-
ation of the Eucalyptus hybrids. The range of guaiacyl units varied
from 24.3 to 34.5% and syringyl units from 64.9 to 75.4% of the
identified lignin structures (Table 2).
The same side chain structures were detected both in guaia-
cyl and in syringyl units (Tables 3 and 4). Thus, it was possible
to compare the distribution of guaiacyl and syringyl side chain
structures separately after normalization of the peak areas to 100%
(Tables 3 and 4). Basically similar changes in both series (G and S)
among different hybrids were observed. The main part of the oxy-
gen rich degradation products is expected to originate as a result of
�-O-4 bond cleavage [20,21]. Low content of oxygen rich degra-
dation products has been seen for example in lignin after Kraft
cooking, which is known to cleave the �-O-4 bonds, supporting
the interpretation hypothesis [27]. The proportion of oxygen rich
degradation products in both series (G and S) slightly changed
among Eucalyptus hybrids. This suggests that the frequency of �-
O-4 type ether linkages varies in these clones.
The overall variation in lignin structure among Eucalyptus
hybrids was minor. However, some differences were seen. Change
of one crossing to another altered the distribution pattern of lignin
derivatives. That variation was seen for example comparing lignin
pyrolysis products among the crossings U1×U2, U1×C2, U1×UGL as
well crossings U1×UGL, G1×UGL, D1×UGL, C1×UGL, and DG×UGL
and crossings DG×UGL, DG×U2, DG×C1, DG×GL2 among each
other (Tables 3 and 4).
Due to the difficulties to observe the variation in such a large
data set, multivariate analysis using PCA was used. Two principal
components that describe the variance of the data were calculated.
Same data as illustrated in Tables 3 and 4 were subjected to PC anal-
ysis. The first principle component described the highest variance
(44%) and the second component the second highest variance (27%) Tab
le
3D
istr
ibu
tio
n
of
gu
aia
cyl
lig
nin
un
its
in
dif
fere
nt
Eu
caly
ptu
s
cro
ssin
gs
aft
er
no
rmali
zati
on
to
10
0%
. Pro
po
rtio
ns
of
sid
e
chain
stru
ctu
res
wit
h
an
d
wit
ho
ut
ox
yg
en
were
calc
ula
ted
sep
ara
tely
.
Peak
no
.C
om
po
un
dIP
U1×U
2
U1×C
2
U1×U
GL
G1×U
GL
D1×U
GL
C1×U
GL
DG
×UG
L
DG
×U2
DG
×C1
DG
×GL2
D2×G
L2
G1×G
L2
U2×G
L1
U2×C
1
C1×C
2
D1×D
2
VC
P
2
G
3.8
3.9
3.5
2.9
4.1
3.1
4.9
2.7
3.7
4.9
3.2
3.3
3.8
3.3
3.6
4.2
2.4
3.3
5G
-CH
33
.5
4.0
3.1
3.3
3.6
3.3
3.6
3.2
3.8
3.7
2.9
3.0
3.4
3.7
3.4
4.1
3.4
3.7
6
G-C
H2
CH
30
.5
0.6
0.5
0.4
0.5
0.3
0.5
0.3
0.5
0.6
0.3
0.4
0.4
0.4
0.4
0.5
0.3
0.5
7G
-CH
CH
29
.1
9.9
8.8
8.9
10
.2
9.8
9.3
8.0
9.8
9.5
8.7
9.5
9.2
9.1
9.1
10
.7
9.7
10
.1
8G
-CH
2C
HC
H2
2.3
2.3
2.1
2.2
2.3
2.3
2.0
2.2
2.5
2.2
2.3
2.4
2.3
2.3
2.2
2.1
2.5
2.4
10
G-C
H
CH
CH
3ci
s
1.4
1.5
1.3
1.3
1.4
1.5
1.2
1.2
1.5
1.3
1.2
1.5
1.4
1.4
1.3
1.3
1.5
1.5
11
G-C
HC
HC
H3
tran
s7
.4
7.9
6.5
7.1
8.0
8.1
6.5
6.9
8.1
6.9
7.2
7.7
7.9
8.1
7.3
7.7
8.7
7.9
13
G-C
HO
11
.3
9.8
11
.1
11
.4
10
.3
10
.7
9.0
11
.4
10
.7
9.5
10
.6
11
.9
10
.1
9.8
9.3
9.3
11
.6
10
.9
14
G-C
H2C
HO
9.7
9.2
9.6
9.7
9.2
9.4
7.1
9.9
9.5
7.9
9.5
10
.3
8.6
8.7
8.4
7.9
10
.8
10
.1
16
G-C
OC
H3
4.2
3.8
4.2
4.3
4.1
4.0
3.7
4.0
4.0
3.8
3.9
4.7
4.0
3.7
3.6
3.9
3.9
4.0
18
G-C
H2
CO
CH
31
.3
1.4
1.2
1.1
1.5
1.1
1.5
1.0
1.1
1.3
1.1
1.2
1.3
1.3
1.3
1.3
1.0
1.1
20
G-C
OC
HC
H2
6.0
5.7
6.0
6.4
5.3
6.3
4.7
6.7
6.2
5.1
6.2
6.3
5.5
5.8
5.6
5.3
7.6
6.3
21
G-C
HO
H
CH
CH
22
.5
2.7
2.2
2.3
2.4
2.4
2.1
2.5
2.6
2.2
2.1
2.3
2.3
2.5
2.5
2.4
2.7
2.7
24
G-C
H2
CH
2C
H2O
H
1.7
1.7
1.6
1.5
1.5
1.5
1.9
1.7
1.8
2.0
1.5
1.4
1.5
1.4
1.5
1.7
1.8
1.8
26
G-C
H
CH
CH
2O
H
cis
2.8
2.9
3.4
3.2
2.9
2.7
3.1
3.8
3.0
3.1
3.7
3.0
3.0
3.0
3.4
3.1
2.7
2.9
29
G-C
H
CH
CH
2O
H
tran
s
22
.4
22
.6
25
.2
24
.3
23
.3
24
.0
30
.0
23
.9
20
.9
26
.6
26
.8
21
.6
25
.6
26
.2
28
.2
25
.3
19
.9
20
.1
31
G-C
H
CH
CH
O
10
.3
9.7
9.6
9.6
9.3
9.3
8.9
10
.5
10
.4
9.3
8.8
9.7
9.6
9.3
8.7
9.3
9.5
10
.7

170 T. Ohra-aho et al. / Journal of Analytical and Applied Pyrolysis 101 (2013) 166–171Ta
ble
4D
istr
ibu
tio
n
of
syri
ng
yl
lig
nin
un
its
sep
ara
tely
in
dif
fere
nt
Eu
caly
ptu
s
cro
ssin
gs
aft
er
no
rmali
zati
on
to
10
0%
. Pro
po
rtio
ns
of
sid
e
chain
stru
ctu
res
wit
h
an
d
wit
ho
ut
ox
yg
en
were
calc
ula
ted
sep
ara
tely
.
Peak
no
.C
om
po
un
dIP
U1×U
2
U1×C
2
U1×U
GL
G1×U
GL
D1×U
GL
C1×U
GL
DG
×UG
L
DG
×U2
DG
×C1
DG
×GL2
D2×G
L2
G1×G
L2
U2×G
L1
U2×C
1
C1×C
2
D1×D
2
VC
P
9
S
6.4
6.4
6.2
6.1
7.5
5.6
8.3
5.3
6.3
8.1
5.9
6.0
6.8
6.2
6.7
7.2
4.5
5.5
12
S-C
H3
5.1
5.5
4.5
4.9
5.2
4.9
5.4
5.0
5.7
5.3
4.4
4.6
5.3
5.4
5.6
5.6
4.8
5.0
15
S-C
H2
CH
31
.2
1.4
1.2
1.1
1.3
1.0
1.2
1.0
1.3
1.4
1.0
1.1
1.2
1.2
1.3
1.3
1.0
1.2
17
S-C
H
CH
29
.8
10
.4
9.6
9.2
10
.6
9.4
10
.5
8.8
10
.3
10
.8
9.5
9.4
10
.2
9.9
10
.5
11
.0
8.7
9.9
19
S-C
H2
CH
CH
23
.9
4.0
3.8
3.7
4.1
3.9
3.6
3.8
4.2
4.0
3.6
4.0
3.9
3.9
3.9
4.0
4.0
4.1
22
S-C
H
CH
CH
3ci
s
2.1
2.3
1.9
2.0
2.2
2.1
1.6
2.0
2.2
1.9
1.9
2.2
2.0
2.1
1.9
1.9
2.2
2.3
23
S-C
HC
HC
H3
tran
s7
.8
8.7
7.6
7.7
8.7
8.1
7.9
7.3
8.7
8.6
7.6
8.0
8.3
8.4
8.4
8.5
7.9
8.4
25
S-C
HO
15
.8
14
.3
16
.2
17
.6
15
.1
16
.5
13
.8
17
.7
15
.4
13
.7
16
.1
17
.2
15
.0
14
.9
14
.0
13
.8
18
.4
15
.9
27
S-C
H2
CH
O9
.3
8.8
9.5
10
.0
9.0
9.7
7.5
10
.2
9.3
7.8
10
.2
10
.0
9.0
9.1
9.1
8.3
11
.3
9.3
28
S-C
O
CH
35
.5
5.0
5.6
5.9
5.3
5.6
5.1
5.9
5.7
5.0
5.5
5.8
5.7
5.1
5.2
5.3
5.4
5.0
30
S-C
H2
CO
CH
31
.8
1.9
1.6
1.6
2.1
1.5
2.1
1.4
1.7
2.0
1.6
1.7
1.9
1.8
1.9
2.1
1.3
1.4
32
S-C
O
CH
CH
24
.4
4.5
4.9
5.1
3.9
5.1
3.6
5.4
4.9
4.1
5.2
4.8
4.3
4.6
4.9
4.5
6.1
5.1
33
S-C
HO
H
CH
CH
24
.3
4.6
3.9
3.9
4.3
4.0
3.8
4.0
4.3
4.1
3.7
3.8
4.2
4.6
4.5
4.4
4.3
4.5
34
S-C
H2
CH
2C
H2O
H
1.0
1.0
1.0
1.0
1.0
0.9
1.1
1.0
1.0
1.1
1.0
0.9
1.0
1.0
1.0
1.0
0.9
1.1
35
S-C
H
CH
CH
2O
H
cis
3.2
3.2
3.7
3.4
3.1
3.4
3.5
3.5
3.0
3.5
3.9
3.1
3.5
3.5
3.8
3.3
3.5
3.3
36
S-C
H
CH
CH
2O
H
tran
s
8.5
9.3
10
.2
8.7
8.4
9.3
12
.6
8.1
7.0
10
.0
10
.2
8.7
9.1
9.8
9.5
9.4
6.9
8.0
37
S-C
H
CH
CH
O
9.8
8.9
8.5
8.3
8.2
9.0
8.3
9.5
9.0
8.6
8.5
8.8
8.7
8.5
7.9
8.3
8.8
9.9
Fig. 2. PCA of the pyrolysis data for Eucalyptus hybrids. The score plot of the two
principle components shows how the samples are related to each other.
of the data. Fig. 2 shows a score plot, which illustrates the distri-
bution of Eucalyptus samples based on the pyrolysis data shown in
the loading plot in Fig. 3.
No grouping was observed among the hybrids. However, PCA
confirmed the finding that when one crossing was replaced by
another, the distribution of lignin derived pyrolysis products was
also changed. That indicated also differences in the lignin original
structures among different Eucalyptus hybrids. In the first princi-
ple component direction, Eucalyptus hybrids with high content of
carbonyl group in side chain were grouped on the right side of the
score plot whereas those hybrids with high amount of short side
chain structures were placed on the left side of the loading plot. In
the second component direction, Eucalyptus hybrids were divided
based on the lignin structural units with three carbon atoms in side
chain. Lignin structural units with alcohol group in side chain were
placed in the upper part of the plot, whereas the reduced struc-
tures were placed in the lower part. Although there was no clear
grouping of the Eucalyptus hybrids based on the syringyl and gua-
iacyl type phenolic compounds of lignin, the results clearly proved
that lignin structure differs among the different Eucalyptus hybrids.
Similar finding has been reported elsewhere [15,28].
The loading plot (Fig. 3) also shows that guaiacyl and syringyl
units with equal side chain structures were grouped together. In
Fig. 3. Loading plot describes which guaiacyl (G) and syringyl (S) lignin structural
units are important for the classification of samples seen in the Score plot.

T. Ohra-aho et al. / Journal of Analytical and Applied Pyrolysis 101 (2013) 166–171 171
PCA it means that structures close to each others have a positive cor-
relation. This indicates that they both originate from similar linkage
types in lignin.
3.2. S/G ratio
For the S/G ratio determination with Py-GC/MS, all guaiacyl and
syringyl type phenolic compounds shown in Tables 3 and 4 were
taken for the calculation, because in PCA (Fig. 3) a positive relation
was found among guaiacyl and syringyl type phenolic compounds
with similar side chains. The S/G ratios obtained by Py-GC/MS were
compared with nitrobenzene oxidation. They varied among the
Eucalyptus clones from 1.9 to 3.1 and from 2.7 to 4.0, respectively
(Table 2). The average percentage error for Py-GC/MS measure-
ments was 6% and for nitrobenzene oxidation the error varied in
the range of 4–5%. The S/G values obtained for Py-GC/MS were
thus lower than by nitrobenzene oxidation. Similar results have
been obtained earlier [13,14]. The suggested reason for the lower
S/G ratio determined by Py-GC/MS in contrast to nitrobenzene oxi-
dation is that in nitrobenzene oxidation only �-O-4 linkages are
cleaved, while in Py-GC/MS other linkages in lignin are cleaved as
well to some extent. The difference in S/G ratio among the two
methods was not constant, varying from 0.1 to 1.1 depending on
sample. One cause for the deviation is probably the fact that the
structure of lignin is different in Eucalyptus hybrids, which may
affect the yield of the degradation products in both Py-GC/MS and
alkaline nitrobenzene methods. More information about the lignin
linkages and the degradation mechanisms of both methods would
be needed to clarify the differences obtained among the methods.
Based on our results it is difficult to evaluate which method is more
reliable or more accurate. Both methods can well be applied to
follow the S/G ratios among sample series, e.g. in the process line.
4. Conclusions
The distribution of lignin-derived pyrolysis products, obtained
by the Py-GC/MS method, varied among the studied Eucalyptus
crossings. This indicates that the lignin structures differ among
the samples. Principal component analysis showed that the same
side chain structures in the guaiacyl and syringyl series correlated
with each other. This motivated to use all detectable G and S type
degradation products in the calculation of S/G ratio. The S/G ratios
determined with pyrolysis and with nitrobenzene oxidation were
close to each other. However the discrepancy between the methods
varied among the Eucalyptus hybrids, probably due to differences
in their lignin structures that affect the result of both methods. Both
methods can thus be used to evaluate S/G ratio but neither of them
provides universally correct values.
Acknowledgements
The authors thank Ms. Eila Turunen for performing the tech-
nical work in the Py-GC/MS experiments. The Financial support
from the Academy of Finland and Brazilian CNPq are gratefully
acknowledged (Effect of fiber wall chemistry on energy demand in
wood defibration, Defibre, 133276).
References
[1] K.V. Sarkanen, H.L. Hergert, Classification and distribution, in: K.V. Sarkanen,C.H. Ludwig (Eds.), Lignins: Occurrence, Formation, Structure and Reactions,Wiley-Interscience, New York, 1971, pp. 43–94.
[2] J.C. Del Rio, A. Gutiérrez, J. Romero, M.J. Martínez, A.T. Martínez,Identification of residual lignin markers in eucalypt Kraft pulps bypy-GC/MS, Journal of Analytical and Applied Pyrolysis 58–59 (2001)425–439.
[3] F.J. González-Vila, G. Almendros, J.C. del Rio, F. Martín, A. Gutierrez, J. Romeo,Ease of delignification assessment of wood from different Eucalyptus speciesby pyrolysis (TMAH)-GC/MS and CP/MAS 13C-NMR spectrometry, Journal ofAnalytical and Applied Pyrolysis 49 (1999) 295–305.
[4] J.C. Del Rio, A. Gutiérrez, M. Hernando, P. Ladín, J. Romero, A.T. Martínez,Determining the influence of eucalypt lignin composition in paper pulpyield using Py-GC/MS, Journal of Analytical and Applied Pyrolysis 74 (2005)110–115.
[5] Y. Xie, Difference of condensed lignin structures in Eucalyptus species, NordicPulp and Paper Research Journal 19 (2004) 18–21.
[6] O. Faix, D. Meier, I. Fortmann, Thermal degradation products of wood, Holz alsRoh- und Werkstoff 48 (1990) 281–285.
[7] O. Faix, D. Meier, I. Fortmann, Thermal degradation products of wood, Holz alsRoh- und Werkstoff 48 (1990) 351–354.
[8] J. Ralph, R.D. Hatfield, Pyrolysis-GC–MS characterization of forage materials,Journal of Agricultural and Food Chemistry 39 (1991) 1426–1437.
[9] D.J. Gardner, T.P. Schultz, G.D. McGinnis, The pyrolytic behaviour of selectedlignin preparations, Journal of Wood Chemistry and Technology 5 (1985)85–110.
[10] J.H. Böttcher, Untersuchungen zur Charakterisierung von Holz undHolzkomponenten mittels konventioneller Analysentechniken und der FTIR-Spekroskopie unter Anwendung von multivariaten statistischen Verfahren,Doctoral Thesis, University of Hamburg, Fachbereich Biologie, Hamburg,1993.
[11] C.F. Lima, L.C.A. Barbosa, C.R. Marcelo, F.O. Silvério, J.L. Colodette, Comparisonbetween analytical pyrolysis and nitrobenzene oxidation for determinationof syringyl/guaiacyl ratio in Eucalyptus spp. lignin, Bioresources 3 (2008)707–712.
[12] A. Izumi, K. Kuroda, Pyrolysis-gas chromatography analysis of dehydrogenationpolymers with various syringyl to guaiacyl ratios, Mokuzai Gakkaishi 43 (1997)194–202.
[13] C.A. Nunes, C.F. Lima, L.C.A. Barbosa, J.L. Colodette, A.F.G. Gouveia, F.O. Sil-vério, Determination of Eucalyptus spp. lignin S/G ratio: a comparison betweenmethods, Bioresource Technology 101 (2010) 4056–4061.
[14] A. Izumi, K. Kuroda, H. Ohi, A. Yamaguchi, Structural analysis of lignin bypyrolysis-gas chromatography (III) – comparative studies of pyrolysis–gaschromatography and nitrobenzene oxidation for the determination methodof lignin composition in hardwood, Japan TAPPI Journal 49 (1995) 1339–1346.
[15] H. Yokoi, T. Nakase, Y. Ishida, H. Ohtani, S. Tsuge, T. Sonoda, T. Ona, Discrimi-native analysis of Eucalyptus camaldullenis grown from seeds of various originsbased on lignin components measured by pyrolysis-gas chromatography, Jour-nal of Analytical and Applied Pyrolysis 57 (2001) 145–152.
[16] Y. Watanabe, K. Kitao, Pyrolytic gas-liquid chromatography of lignin, WoodResearch 38 (1966) 40–46.
[17] S.Y. Lin, C.W. Dence, Methods in Lignin Chemistry, Springer-Verlag, New York,1992.
[18] T.P. Schultz, M.C. Templeton, Proposed mechanisms for nitrobenzene oxidationof lignin, Holzforschung 40 (1986) 93–97.
[19] M. Klein, P. Virk, Energy Laboratory Report No. MIT-EL 81-005, MassachusettsInstitute of Technology, Cambridge, MA, 1981.
[20] R. Brezny, V. Mihalov, V. Kovácik, Low temperature thermolysis of lignins,Holzforschung 37 (1983) 199–204.
[21] K.J. Kuroda, Analytical pyrolysis products derived from cinnamyl alcohol-end groups in lignins, Journal of Analytical and Applied Pyrolysis 53 (2000)123–134.
[22] K. Kuroda, A. Nakagawa-Izumi, Analytical pyrolysis of lignin: prod-ucts stemming from �-5 substructures, Organic Geochemistry 37 (2006)665–673.
[23] K. Kuroda, A. Yamaguchi, K. Sakai, Analysis of Sugi wood and its lignin prepa-rations, Mokuzai Gakkaishi 40 (1994) 987–995.
[24] Scandinavian Pulp, Paper and Board Testing Committee, SCAN-Test Methods,Scandinavian Pulp, Paper and Board, Stockholm, Sweden, 2004.
[25] Technical Association of the Pulp and Paper Industry (TAPPI), TAPPI Test Meth-ods 2000–2001, TAPPI, Atlanta, USA, 2000.
[26] L. Eriksson, E. Johansson, N. Kettaneh-Wold, S. Wold, Introduction to Multi- andMegavariate Data Analysis Using Projection Methods (PCA & PLS), Umetrics,Sweden, 1999, pp. 43–68.
[27] T. Ohra-aho, M. Tenkanen, T. Tamminen, Direct analysis of lignin andlignin-like components from softwood Kraft pulp by different pyrolysis-GC/MS techniques, Journal of Analytical and Applied Pyrolysis 74 (2005)123–128.
[28] P. Prinsen, A. Gutiérrez, J. Rencoret, L. Nieto, J. Jiménez-Barbero, A. Burnet,M. Petit-Conil, J.L. Colodette, Á.T. Martínez, J.C. del Rio, Morphological char-acteristics and composition of lipophilic extractives and lignin in Brazilianwoods from different eucalypt hybrids, Industrial Crops and Products 36 (2012)572–583.

Ohra-aho T., Niemi P., Aura A.-M., Orlandi M., Poutanen K., Buchert J., Tamminen T. (2016) Structure of brever’s spent grain lignin and its interactions with gut microbiota in vitro. J. Agric. Food Chem. 64, 812-820.
Reproduced with permission from ACS Publications
V

Structure of Brewer’s Spent Grain Lignin and Its Interactions with GutMicrobiota in VitroTaina Ohra-aho,*,† Piritta Niemi,† Anna-Marja Aura,† Marco Orlandi,§ Kaisa Poutanen,†
Johanna Buchert,# and Tarja Tamminen†
†VTT Technical Research Centre of Finland Ltd., P.O. Box 1000, FI-02044 VTT, Espoo, Finland§Department of Environmental and Earth Sciences, University of MilanoBicocca, Piazza della Scienza 1, Milan, I-20126 Italy#Natural Resources Institute Finland, Viikinkaari 4, FI-00790 Helsinki, Finland
ABSTRACT: Lignin is part of dietary fiber, but its conversion in the gastrointestinal tract is not well understood. The aim of thiswork was to obtain structural information on brewer’s spent grain (BSG) lignin and to understand the behavior of the polymericpart of lignin exposed to fecal microbiota. The original BSG and different lignin fractions were characterized by pyrolysis-GC/MSwith and without methylation. Methylation pyrolysis proved that the ratio between guaiacyl and syringyl units was similar in alllignin samples, but the ratio between p-coumaric and ferulic acids varied by the isolation method. Combined pyrolysis resultsindicated higher acylation of γ-OH groups in syringyl than in guaiacyl lignin units. The polymeric lignin structure in the alkali-soluble fraction after enzymatic hydrolysis was slightly altered in the in vitro colon fermentation, whereas lignin in the insolubleresidue after enzymatic treatments remained intact.
KEYWORDS: brewer’s spent grain, lignin, Py-GC/MS, TMAH/Py, in vitro fermentation, colon microbiota
■ INTRODUCTION
Brewer’s spent grain (BSG) is the most abundant byproductgenerated in the brewing of beer.1 It is composed of theinsoluble parts of malts, which are not dissolved in mashing,namely, the husks, bran, and residues of endosperm. BSG isrich in cell wall polysaccharides (arabinoxylan and cellulose),protein, and lignin.2 A lower amount of lipids is also present.BSG is a food grade material and currently used for ruminantfeed.3 However, as it is rich in protein and dietary fiber, it couldbe used in more valuable applications as well, such as a dietarycomponent in human food.Although lignin is included in our everyday diet as a part of
plant cell walls, the metabolism of lignin in humans or otheranimals is not well-known. Instead, it is generally assumed thatlignin is an inert material in the gastrointestinal tract and notfermented or metabolized by the colon microbiota. However,there are some indications of lignin degradation by goats.4 Inaddition, lignin has been shown to be a precursor of themammalian lignans, enterodiol and enterolactone, in rats,5
suggesting that nonruminants could also be able to degradelignin. More recently, partial lignin degradation by human fecalmicrobiota has been shown.6,7 Mono- and dimeric phenolicmetabolites were released and metabolized from BSG and itsenzymatically extracted fractions through microbial conversionsin an in vitro colon model.Being a polymeric material, lignin is not absorbed in the
gastrointestinal tract but remains in the gut lumen, where itmay interact with other components of the digested food oraffect microbial conversion activities, as has been shown forisolated condensed tannins, which inhibited dietary fiberfermentation by colon microbiota.8 Nevertheless, potentialhealth effects have been proposed to arise from lignin. Themammalian lignans, enterodiol and enterolactone, produced
from lignin5 may help protect against cancer and cardiovasculardisease.9,10 Furthermore, lignin-rich dietary fiber is capable ofadsorbing carcinogenic compounds in the colon,11 thuspreventing the carcinogens from being absorbed intocirculation and thus lowering the risk of cancer.12
The structure of BSG lignin has been recently characterizedfrom different lignin fractions, those being “milled-wood”lignin, dioxane lignin, and celluolytic lignin, isolated fromBSG.13 In the present paper, lignin fractions isolated previouslyby sequential enzymatic hydrolyses7,12 were characterized byanalytical pyrolysis coupled with gas chromatography and massspectrometer (Py-GC/MS) with and without tetramethylam-monium hydroxide (TMAH). The results were compared withtwo other isolation methods, acidolysis and enzymatichydrolysis followed by mild acidolysis, to learn more aboutthe BSG lignin structure and fractionation. Structural analysis ofthe initial BSG was performed as reference, because theenzymatic and chemical fractionations may have changed theoriginal lignin structure. The characterization data were furtherutilized when the conversion of the BSG lignin fractions byfecal microbiota was studied using an in vitro colon model.Release of lignin-related small phenolic metabolites in thefermentation of BSG lignin has been reported earlier.6,7 In thecurrent study, the aim was to understand the behavior of thepolymeric part of lignin exposed to fecal microbiota.
Received: November 21, 2015Revised: January 10, 2016Accepted: January 11, 2016Published: January 11, 2016
Article
pubs.acs.org/JAFC
© 2016 American Chemical Society 812 DOI: 10.1021/acs.jafc.5b05535J. Agric. Food Chem. 2016, 64, 812−820

■ MATERIALS AND METHODSMaterials. BSG was obtained from Sinebrychoff brewery (Kerava,
Finland) and stored at −20 °C.14 The main components werecarbohydrates (42.2%), mainly arabinoxylan (22.2%) and glucan(17.1%), protein (22.8%), lignin (19.3%), lipids (11.0%), and ash(4.7%).Preparation of Lignin Fractions. BSG was fractionated with
enzymatic methods as described previously.7,14 In brief, Masuko milledBSG was treated sequentially with carbohydrate- and protein-degrading enzymes. Two different fractions were obtained by athree-step hydrolysis: one by precipitation of protease- and alkali-soluble material (denoted protease-alkaline extracted fraction, P-AEF)and one as the insoluble residue after the hydrolyses (INS). Foracidolysis (AL) and enzymatic mild acidolysis (EMAL) ligninisolation, BSG was dried and milled with a Retch S100 ball mill(400 rpm for 10 h) to very fine powder (Figure 1). The extractives
were removed with hexane in a Soxhlet for 6 h. Proteolysis was carriedout for the hexane-extracted material with Alcalase 2.4 L (20 μL/g ofdry material) at 50 °C and pH 7 for 24 h. Acidolysis was performed byrefluxing the material in 85:15 dioxane/water solutions with 0.1 MHCl at 88 °C for 2 h under nitrogen atmosphere according to themethod of Gellerstedt et al.15 The solids were separated by filtration,and the dissolved lignin was precipitated from the filtrate with 0.01 MHCl at 4 °C overnight. Isolation of EMAL was performed according tothe method of Guerra et al.,16 with some modifications as follows: Theextractive-free and protease-treated BSG was first treated withDepol740 (3000 nkat/g solid material) and Celluclast 1.5 (15 FPU/g solid material at pH 4.5, 50 °C for 48 h. After carbohydratedigestion, it was further treated with 0.01 M HCl in 85:15 dioxane/water solutions at 88 °C for 2 h under argon nitrogen atmosphere. Thedissolved lignin was precipitated as described above.In Vitro Colon Model. Fermentation of lignin fractions P-AEF and
INS in the in vitro colon model was performed according to themethod of Barry et al.17 with some modifications described by Niemiet al.6 and Aura et al.7 The fermentation experiments were performedin triplicate, but samples for Py-GC/MS analysis were taken from onebatch. A time course from 0 to 24 h was followed using the sameinoculum for all of the substrates. Incubation was performed at 37 °Cin tightly closed bottles and in magnetic stirring (250 rpm). Fecalbackgrounds were incubated without addition of the supplements.Fermentation of P-AEF and INS was performed in different fecalcontrols, FC1 and FC2, respectively.For Py-GC/MS analyses, 1 mL of the fermented samples (P-AEF-
FC1, INS-FC2, FC1, and FC2) of 0 and 24 h time points was thawed;0.5 mL of water (pH 2.5) and 25 μL of 6 M HCl were added to lowerthe pH to near 2.5. Samples were centrifuged (14000 rpm/10 min) to
remove the liquid fraction, and thereafter the solid fractions werewashed twice with water (pH 2.5). The solid fractions were stored at−20 °C until analyzed.
Py-GC/MS measurements without and with tetramethylammoniumhydroxide (TMAH) were performed with a filament pulse pyrolyzer(Pyrola2000, PyrolAB, Sweden), which was connected to a GC/MSinstrument (Varian 3800 GC/2000 MS, Palo Alot, CA, USA). About50−100 μg of the solid samples was weighed accurately on anautomatic ultramicro balance (CHAN 29 Instruments Inc., Cerritos,CA, USA) and transferred to the filament. A equal volume of samplesobtained from in vitro colon fermentation was pipetted on filament.For methylation pyrolysis, a 10% TMAH aqueous solution (2 μL) wasadded and mixed with the sample. The pyrolysis chamber maintainedat 175 °C was purged with helium at 18 mL/min to lead thedegradation products into the gas chromatography injector, main-tained at 280 °C. The temperature rise time to final pyrolysistemperature 600 °C was set to 8 ms, and the total pyrolysis time was 2s. Pyrolysis products were separated on a 30 m × 0.25 mm i.d., 1 μmfilm thickness, fused silica capillary column of DB-1701 (J&WScientific, Folsom, CA, USA) using the following temperature programfor direct pyrolysis: initial temperature 80 °C held for 1 min, rate ofincrease of 4 °C/min to 265 °C and held for 17.75 min. For TMAH/Py: initial temperature 80 °C held for 2 min, rate of increase of 8 °C/min to 160 °C and extended from 160 to 280 °C at 5 °C/min. Aconstant carrier gas flow of 1.0 mL/min was used. An ion trap massspectrometer was used for compound detection with the mass scanrange of m/z 46−650 (EI 70 eV). The ion trap temperature was set to180 °C. The degradation products formed were identified using datafrom the literature18−21 and commercial NIST05 library. The peakareas of carbohydrate, lignin, p-coumaryl acid, ferulic acid, and proteinpyrolysis degradation products were integrated and normalized to theweight of the sample. Peak molar areas were calculated for all pyrolysisproducts before normalization to 100%. Two parallel measurementswere carried out for the lignin samples and three measurements for thefermentation samples. The results are given as average. Averagestandard deviations for the Py-GC/MS and Py/TMAH measurementswere 15 and 17%, respectively. Due to the high amount of interferingcomponents formed from the fecal controls, only the largest peakswere integrated from the total ion chromatograms obtained from thepyrolysis in the presence of TMAH.
Principal Component Analysis (PCA). Py-GC/MS and TMAH/Py data were separately subjected to PCA. Multivariate data analysiswas carried out with SIMCA-13 (Umetrics AB, Umea, Sweden),according to the method of Ohra-aho et al.22 Two principalcomponents were calculated for both data sets. The most importantvariables, lignin degradation products with predictivity >0.5, wereincluded in the model. The changes in P-AEF and INS duringfermentation in an in vitro colon model in comparison to fecalcontrols were evaluated using score plots.
■ RESULTS AND DISCUSSIONThe isolation of two lignin-rich fractions, soluble (P-AEF) andinsoluble fraction (INS), from BSG using enzymatic hydrolysishas been described before.7,14 Acidolysis (AL) and enzymaticmild acidolysis (EMAL) were applied to produce purer ligninsamples for comparison.Lignin yields in the P-AEF, INS, AL, and EMAL fractions
were 14, 39, 21, and 5.8% on the theoretical lignin in BSG,respectively. On athe basis of the composition analyses, the P-AEF and the INS both contained about 40% of lignin. P-AEFcontained a similar proportion of protein (45%) as lignin andless carbohydrate (6.7%), whereas INS contained morecarbohydrates (39%) but less protein (6.6%). Both fractionscontained also about 10% of ash.7,14 For AL and EMAL,composition analyses were not performed due to inadequateamounts of material, but an estimation was obtained from thePy-GC/MS results (Figure 2). Residual lipids were notincluded. For comparison, the composition of all samples was
Figure 1. Scheme for the BSG fractionation methods acidolysis andenzymatic mild acidolysis.
Journal of Agricultural and Food Chemistry Article
DOI: 10.1021/acs.jafc.5b05535J. Agric. Food Chem. 2016, 64, 812−820
813
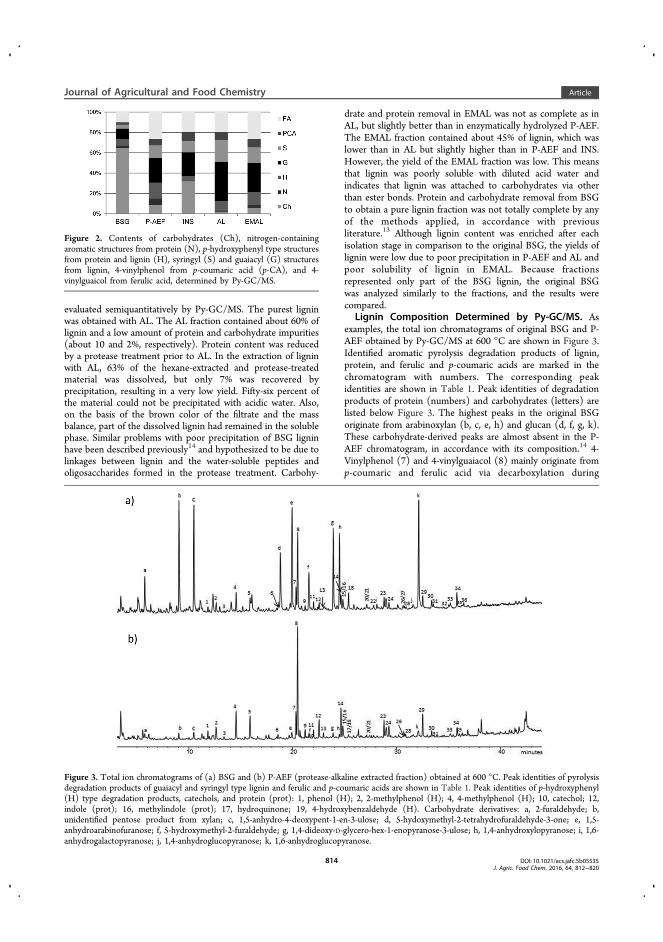
evaluated semiquantitatively by Py-GC/MS. The purest ligninwas obtained with AL. The AL fraction contained about 60% oflignin and a low amount of protein and carbohydrate impurities(about 10 and 2%, respectively). Protein content was reducedby a protease treatment prior to AL. In the extraction of ligninwith AL, 63% of the hexane-extracted and protease-treatedmaterial was dissolved, but only 7% was recovered byprecipitation, resulting in a very low yield. Fifty-six percent ofthe material could not be precipitated with acidic water. Also,on the basis of the brown color of the filtrate and the massbalance, part of the dissolved lignin had remained in the solublephase. Similar problems with poor precipitation of BSG ligninhave been described previously14 and hypothesized to be due tolinkages between lignin and the water-soluble peptides andoligosaccharides formed in the protease treatment. Carbohy-
drate and protein removal in EMAL was not as complete as inAL, but slightly better than in enzymatically hydrolyzed P-AEF.The EMAL fraction contained about 45% of lignin, which waslower than in AL but slightly higher than in P-AEF and INS.However, the yield of the EMAL fraction was low. This meansthat lignin was poorly soluble with diluted acid water andindicates that lignin was attached to carbohydrates via otherthan ester bonds. Protein and carbohydrate removal from BSGto obtain a pure lignin fraction was not totally complete by anyof the methods applied, in accordance with previousliterature.13 Although lignin content was enriched after eachisolation stage in comparison to the original BSG, the yields oflignin were low due to poor precipitation in P-AEF and AL andpoor solubility of lignin in EMAL. Because fractionsrepresented only part of the BSG lignin, the original BSGwas analyzed similarly to the fractions, and the results werecompared.
Lignin Composition Determined by Py-GC/MS. Asexamples, the total ion chromatograms of original BSG and P-AEF obtained by Py-GC/MS at 600 °C are shown in Figure 3.Identified aromatic pyrolysis degradation products of lignin,protein, and ferulic and p-coumaric acids are marked in thechromatogram with numbers. The corresponding peakidentities are shown in Table 1. Peak identities of degradationproducts of protein (numbers) and carbohydrates (letters) arelisted below Figure 3. The highest peaks in the original BSGoriginate from arabinoxylan (b, c, e, h) and glucan (d, f, g, k).These carbohydrate-derived peaks are almost absent in the P-AEF chromatogram, in accordance with its composition.14 4-Vinylphenol (7) and 4-vinylguaiacol (8) mainly originate fromp-coumaric and ferulic acid via decarboxylation during
Figure 2. Contents of carbohydrates (Ch), nitrogen-containingaromatic structures from protein (N), p-hydroxyphenyl type structuresfrom protein and lignin (H), syringyl (S) and guaiacyl (G) structuresfrom lignin, 4-vinylphenol from p-coumaric acid (p-CA), and 4-vinylguaicol from ferulic acid, determined by Py-GC/MS.
Figure 3. Total ion chromatograms of (a) BSG and (b) P-AEF (protease-alkaline extracted fraction) obtained at 600 °C. Peak identities of pyrolysisdegradation products of guaiacyl and syringyl type lignin and ferulic and p-coumaric acids are shown in Table 1. Peak identities of p-hydroxyphenyl(H) type degradation products, catechols, and protein (prot): 1, phenol (H); 2, 2-methylphenol (H); 4, 4-methylphenol (H); 10, catechol; 12,indole (prot); 16, methylindole (prot); 17, hydroquinone; 19, 4-hydroxybenzaldehyde (H). Carbohydrate derivatives: a, 2-furaldehyde; b,unidentified pentose product from xylan; c, 1,5-anhydro-4-deoxypent-1-en-3-ulose; d, 5-hydoxymethyl-2-tetrahydrofuraldehyde-3-one; e, 1,5-anhydroarabinofuranose; f, 5-hydroxymethyl-2-furaldehyde; g, 1,4-dideoxy-D-glycero-hex-1-enopyranose-3-ulose; h, 1,4-anhydroxylopyranose; i, 1,6-anhydrogalactopyranose; j, 1,4-anhydroglucopyranose; k, 1,6-anhydroglucopyranose.
Journal of Agricultural and Food Chemistry Article
DOI: 10.1021/acs.jafc.5b05535J. Agric. Food Chem. 2016, 64, 812−820
814

pyrolysis23−25 but also partially from lignin. The presence of p-coumaric and ferulic acid in BSG has been verified previously.26
In pyrolysis, protein has been found to form phenol (1), 4-methylphenol (4), indole (14), and methylindole (16) as themain degradation products and 4-vinylphenol (7) as a minorproduct.13,27 Both guaiacyl (G) and syringyl (S) units withvarious side chains were detected, confirming the presence oflignin. Also, p-hydroxyphenyl type degradation units (H) werepresent, but most of those are expected to originate fromproteins and p-coumaric acid. Lignans, which were found insmall quantities (<0.01%) in BSG,14 degrade in pyrolysis tosimilar guaicyl and syringyl structures as lignin.28,29 However,the effect of lignans on the yields of guaicyl and syringyl unitscan be regarded as insignificant due to their low amount.All of the degradation products mentioned above were found
in BSG and its fractions, but only the phenolic compoundsreleased in pyrolysis from the guaiacyl and syringyl type ligninunits as well as ferulic and p-coumaric acids were included forthe structural characterization (Table 1). p-Hydroxyphenyl-typepyrolysis degradation products were excluded because theycannot be specified as lignin degradation products.13,27 4-Vinylguaiacol and 4-vinylphenol were the most abundant
aromatic pyrolysis degradation products in all samples,indicating high contents of ferulic and p-coumaric acids. Higherproportions of guaiacyl type than syringyl type ligninderivatives were formed from the original BSG and thefractions, indicating that BSG lignin is rich in guaiacyl typeunits. This is in agreement with previous findings.13 In thepresent study, the S/G ratio varied between 0.5 and 0.7, beinglowest in the original BSG.The most abundant pyrolysis products in BSG were guaiacyl
type degradation products guaiacol, 4-methylguaiacol, trans-isoeugenol, vanillin, and trans-coniferyl alcohol. A slightly lowerproportion of corresponding syringyl type degradation productssyringol, 4-methylsyringol, trans-propenylsyringol, and syringal-dehyde was detected. This composition was close to thatdetected for the INS fraction. In comparison to the otherfractions, INS contained the highest proportion of oxygen-containing side-chain structures, that is, vanillin, syringalde-hyde, homovanillin, homosyringaldehyde, cis- and trans-coniferyl alcohol, coniferaldehyde, cis- and trans-sinapyl alcohol,and sinapaldehyde. These degradation products are releasedfrom native lignin structures with high content of β-O-4bonds.30 Especially the oxygen-containing syringyl units with
Table 1. Relative Molar Abundance of Aromatic Degradation Products of Guaiacyl (G) and Syringyl (S) Type Lignin Units andp-Coumaric and Ferulic Acid Formed in Py-GC/MS from the Original BSG and Lignin-rich Enzymatically and ChemicallyIsolated Fractions of BSG
peak compound Mw orig BSG P-AEF INS AL EMAL
7 4-vinylphenol 120 H/p-CA 8.0 8.8 13.8 8.5 10.02 guaiacol 124 G 4.4 5.0 5.8 7.0 5.35 4-methylguaiacol 138 G 4.9 7.6 3.6 9.1 6.16 4-ethylguaiacol 152 G 1.2 1.7 0.8 2.1 2.28 4-vinylguaiacol 150 G/FA 36.6 36.2 30.3 20.8 31.49 eugenol 164 G 1.8 2.3 1.4 2.0 2.513 cis-isoeugenol 164 G 1.1 1.4 0.8 1.5 1.814 trans-isoeugenol 164 G 4.9 7.7 4.1 6.6 9.018 vanillin 152 G 7.2 1.0 4.1 2.0 1.521 homovanillin 166 G 1.5 0.0 2.2 2.5 0.722 acetoguaiacone 166 G 1.6 0.7 1.3 0.8 0.625 guaiacylacetone 180 G 0.6 1.0 0.8 3.2 3.126 4-(oxyallyl)guaiacol 178 G 0.7 0.1 0.6 0.6 0.427 4-(1-hydroxyprop-2-enyl)guaiacol 180 G 0.3 0.0 0.6 0.5 0.131 cis-coniferyl alcohol 180 G 1.6 0.8 1.9 0.6 0.334 trans-coniferyl alcohol 180 G 4.1 3.8 5.8 1.6 0.935 coniferaldehyde 178 G 1.7 0.0 2.0 1.3 0.011 syringol 154 S 2.1 2.3 2.9 3.5 2.215 methylsyringol 168 S 2.3 3.7 1.8 4.8 3.020 4-ethylsyringol 182 S 0.1 0.5 0.2 0.9 0.723 4-vinylsyringol 180 S 3.2 4.7 3.1 6.6 6.124 4-allylsyringol 194 S 1.5 2.0 1.2 1.8 1.928 cis-propenylsyringol 194 S 1.0 1.5 0.7 1.4 1.529 trans-propenylsyringol 194 S 3.4 5.7 2.9 4.8 5.330 syringaldehyde 182 S 2.3 0.3 1.5 1.1 0.632 homosyringaldehyde 196 S 0.2 0.0 0.6 0.5 0.033 acetosyringone 196 S 1.5 1.0 1.3 1.4 0.936 syringylacetone 210 S 0.2 0.4 0.3 2.0 1.637 4-(oxyallyl)syringol 208 S 0.0 0.0 0.2 0.4 0.438 4-(1-hydroxyprop-2-enyl)syringol 210 S 0.0 0.0 0.2 0.1 0.039 cis-sinapyl alcohol 210 S 0.0 0.0 0.2 0.0 0.040 trans-sinapyl alcohol 210 S 0.0 0.0 1.7 0.0 0.041 sinapaldehyde 208 S 0.0 0.0 1.1 0.0 0.0
S/G 0.5 0.7 0.6 0.7 0.7
Journal of Agricultural and Food Chemistry Article
DOI: 10.1021/acs.jafc.5b05535J. Agric. Food Chem. 2016, 64, 812−820
815

three carbon atoms in the side chain were less abundant in theother fractions. Recently it has been reported that a smallamount of γ-OH groups are acylated in BSG lignin mainly insyringyl units.13 Similar structures have been observed also forother plant materials such as kenaf bast31 and coconuts coirfibers.32 In pyrolysis, acetyl groups have been reported to beeliminated together with the attached hydroxyl group, leadingto the formation of double-bond structures in the side chains.33
This happens also in the case of acylation by p-coumaricacid.13,34 The total absence of sinapyl alcohol-type degradationproducts in the BSG samples thus suggests that the γ-OHgroups in syringyl units are more acylated than guaiacyl units.This was observed especially for P-AEF, AL, and EMALsamples.Methylation pyrolysis with tetramethylammonium hydroxide
(Py/TMAH) provides more precise information about thecontent of p-coumaric and ferulic acid as well as ligninstructure. In the presence of TMAH decarboxylation is avoidedby the formation of methyl esters from the free acid groups.Due to the high alkalinity of the TMAH, ester groups in thesample are hydrolyzed and exchanged into their respective fattyacid methyl esters. In addition, more information is obtained ofthe hydroxyl groups present in the side chains due to theformation of methyl ethers with hydroxyl groups.35,36 The mostabundant aromatic degradation products in BSG and itsfractions were ferulic and p-coumaric acid, as detected also byPy-GC/MS. Using this method, the distinction between thecinnamic acids and lignin-derived pyrolysis degradationproducts can be made. The proportion of ferulic acid was
highest in the original BSG, P-AEF, and INS, but clearly lowerin AL and EMAL fractions (Table 2). AL contained the lowestamount of carbohydrates (Figure 2), indicating that acidolysistreatment efficiently removed ferulate-linked polysaccharides.Ferulic acids have been reported to act as cross-links betweenpolysaccharides and lignin, forming ester bonds withpolysaccharides and ether bonds with lignin.34,37 Acidolysismay also to some extent cleave the ether bonds between ligninunits.38 EMAL treatment has also been found to releasecarbohydrate37 and ferulate residues, but to a lesser extent dueto the milder acidolysis conditions used. The proportion of p-coumaric acid was the same as in BSG, P-AEF, and EMAL butlower than in INS and AL. p-Coumaric acid has been reportedto acylate the γ-carbon of the lignin side chain.34 Recently it hasbeen found that p-coumarates are present in condensed ligninin high amounts.13 On this basis, it seems that lignin in INS andAL is enriched with condensed lignin. Clearly higher content ofsyringyl units typically formed from lignin subunits containingβ-O-4 bonds39 were measured for all samples by Py/TMAHthan by Py-GC/MS. As a result, also somewhat higher S/Gratios of 0.8−1.2 were obtained by Py/TMAH in comparisonto Py-GC/MS, especially in the case of BSG and AL. The Py/TMAH analysis confirmed that acylation of γ-OH groups in thesyringyl structures leads to underestimation of the content ofnative type syringyl structures in Py-GC/MS. Thus, Py/TMAHshould be used for the determination of S/G ratios of acylatedlignins.
Fermentation of the Lignin Fractions in the in VitroColon Model. Release of lignin-related small phenolic
Table 2. Relative Molar Abundance of Aromatic Degradation Products of Guaiacyl (G) and Syringyl (S) Type Lignin Units andp-Coumaric and Ferulic Acid Formed in Py/TMAH from the Original BSG and Lignin-rich Enzymatically and ChemicallyIsolated Fractions of BSG
compound orig Mw BSG P-AEF INS AL EMAL
1,2-dimethoxybenzene G 138 0.0 0.0 0.0 0.2 0.03,4-dimethoxytoluene G 152 0.0 0.0 0.0 0.2 0.73,4-dimethoxybenzeneethylene G 164 0.0 1.0 0.3 0.6 1.23,4-dimethoxybenzene methanol methyl ether G 182 0.0 0.0 0.0 0.5 0.01,2-dimethoxy-4-propenylbenzene G 178 0.0 0.0 0.0 0.4 0.33,4-dimethoxybenzaldehyde G 166 0.0 1.5 0.7 0.9 1.23,4-dimethoxybenzoic acid methyl ester G 196 4.5 4.6 4.5 4.6 5.33,4-dimethoxybenzeneacetic acid methyl ester G 210 0.0 0.4 0.5 0.6 0.3cis-1-(3,4-trimethoxyphenyl)-2-methoxyethene G 194 8.6 8.7 8.4 5.6 10.3trans-1-(3,4-trimethoxyphenyl)-2-methoxyethene G 194 5.9 4.7 4.7 3.1 5.3cis-1-(3,4-dimethoxyphenyl)-2-methoxyprop-1-ene G 208 0.0 1.0 1.0 0.9 1.4trans-1-(3,4-dimethoxyphenyl)-2-methoxyprop-1-ene G 208 0.0 0.6 0.9 0.7 0.61-(3,4-dimethoxyphenyl)-1-methoxyprop-1-ene G 208 0.0 1.0 1.2 0.9 1.5erythro-4-(1,2,3-trimethoxypropyl)-1,2-dimethoxybenzene G 270 3.7 3.7 4.0 5.1 6.1threo-4-(1,2,3-trimethoxypropyl)-1,2-dimethoxybenzene G 270 5.8 4.0 3.9 4.7 5.11,2,3-trimethoxybenzene S 168 0.0 2.7 0.6 0.5 4.03,4,5-trimethoxybenzaldehyde S 196 0.0 0.6 0.4 0.8 0.63,4,5-trimethoxybenzoic acid methyl ester S 226 5.3 5.8 4.1 8.0 6.1cis--1-(3,4,5-trimethoxyphenyl)-2-methoxyethene S 224 17.1 6.6 6.8 7.3 10.1trans-1-(3,4,5-trimethoxyphenyl)-2-methoxyethene S 224 0.0 3.7 3.5 3.3 0.0erythro-4-(1,2,3-trimethoxypropyl)-1,2,3-trimethoxybenzene S 300 4.0 5.0 3.7 5.2 5.1threo-4-(1,2,3-trimethoxypropyl)-1,2,3-trimethoxybenzene S 300 6.8 4.4 3.6 4.3 4.5trans-3-(4-methoxypenyl)-3-propenoic acid methyl ester p-CA 192 11.4 11.1 20.1 24.1 11.1cis-3-(3,4-dimethoxyphenyl)-3-propenoic acid methyl ester FA 222 1.5 0.8 1.6 0.5 0.6trans-3-(3,4-dimethoxyphenyl)-3-propenoic acid methyl ester FA 222 25.5 28.1 25.5 17.0 18.6
S/G 1.2 0.9 0.8 1.1 0.8p-CA/FA 0.4 0.4 0.4 0.7 1.4
Journal of Agricultural and Food Chemistry Article
DOI: 10.1021/acs.jafc.5b05535J. Agric. Food Chem. 2016, 64, 812−820
816

metabolites in the fermentation of P-AEF and INS has beenreported earlier.6,7 In this study, the same samples as in thepresent study were utilized to monitor the changes in thepolymeric part of the lignin. The same pyrolysis degradationproducts that were determined for the original samples weremonitored also from the samples after fermentation. Addition-ally, possible new types of pyrolysis products were searched for.The same lignin pyrolysis products were detected for all
samples, even including the fecal controls (Table 3). Thisindicates that the microbiota had already been exposed tolignin-containing food. There were no signs of formation ofnew lignin-based pyrolysis products from polymeric lignin afterincubation with fecal microbiota. New demethylated guaiacylunits were expected to be formed from the polymeric lignin, asnumerous demethylated lignin-based low molecular weightmetabolites have been detected for both P-AEF6 and INS.7 Asmall amount of a catechol (not quantified due to the lowamount), but not 4-methylcatechol, was detected in INS by Py-GC/MS. Due to its low concentration, the catechol compoundwas not detectable anymore from the fecal samples with INS.The fecal microbiota could not demethylate the polymericlignin, but was probably capable of altering the monomericphenolic compounds released from lignin during fermenta-tion.6,7 This indicates that extracellular enzymes hydrolyzelignin to smaller phenolic units, which are further metabolizedby microbial inoculum. Large lignin molecules cannot beextensively metabolized by the microbial inoculum.The distributions of guaiacyl- and syringyl-type pyrolysis
products and ferulic and p-coumaric acid before and after
fermentation of P-AEF and INS were compared with the fecalcontrols (Table 3). Guaiacyl units were enriched infermentation, but clearly more in the fecal controls than inthe actual samples. Variations in the syringyl units were lower.The S/G ratio was similar before and after fermentation for allsamples.Due to difficulties in monitoring the changes in BSG lignin
caused by the microbiota, the Py-GC/MS data were subjectedto PCA. Two principal components of the data were able todescribe 90% of the total variance. The first componentdescribed the highest variance (62%) and the secondcomponent the second highest variance (28%) of the data.The obtained score plot is the map of the samples (Figure 4),which are explained by the lignin degradation products (Table3).Distribution of the samples in different positions in score
plot suggests that the samples and controls slightly differedfrom each other. Samples before (0 h) and after (24 h)fermentation were placed in different positions of the scoreplot, indicating that some changes in lignin structure took placeduring fermentation. In the first component direction, the mainchanges were observed in P-AEF and its control. The distancebetween samples before and after fermentation was the samefor both samples (P-AEF-FC1 and FC1), indicating that similarchanges occurred between lignin structures of P-AEF and therespective control. However, the second component showedhigher variation in P-AEF-FC1 than in the respective control(FC1), suggesting that the microbiota was able to alter the P-AEF lignin structure to a some extent. This result is consistent
Table 3. Relative Molar Abundance of Aromatic Degradation Products Formed from Lignin and p-Coumaric and Ferulic Acidin Py-GC/MS before and after Fermentation of Lignin-rich Fractions of P-AEF, INS, and Controls FC1 and FC2 in in VitroColon Model
P-AEF-FC1 FC1 INS-FC2 FC2
compound orig Mw 0 h 24 h 0 h 24 h 0 h 24 h 0 h 24 h
4-vinylphenol p-CA 120 11.2 10.3 23.5 17.5 14.8 14.9 22.0 11.1guaiacol G 124 5.5 5.7 4.8 5.5 5.5 5.0 5.1 5.14-methylguaiacol G 138 6.7 8.2 5.8 7.0 7.3 7.1 6.7 7.34-ethylguaiacol G 152 2.2 2.4 1.6 2.4 1.6 1.9 2.2 2.14-vinylguaiacol FA 150 30.4 27.1 29.9 28.3 34.3 32.1 35.7 37.0eugenol G 164 2.0 2.8 1.5 1.9 1.7 2.0 1.6 2.2cis-isoeugenol G 164 1.3 1.4 0.8 1.1 1.0 1.1 0.8 1.3trans-isoeugenol G 164 9.3 10.7 6.3 7.6 7.5 8.4 5.8 8.5vanillin G 152 1.4 1.1 1.6 1.4 1.9 1.7 1.8 2.7homovanillin G 166 0.0 0.0 0.0 0.0 0.6 0.0 0.2 0.0acetoguaiacone G 166 0.8 0.8 0.9 0.8 0.8 0.9 0.3 1.0guaiacylacetone G 180 1.7 1.1 1.5 1.3 1.1 0.7 1.1 0.6cis-coniferyl alcohol G 180 0.8 0.6 0.4 0.0 0.9 1.0 0.5 1.2trans-coniferyl alacohol G 180 1.7 2.3 1.5 2.3 2.8 4.0 1.8 5.0coniferaldehyde G 178 0.0 0.0 0.0 0.0 0.6 0.0 0.0 0.0syringol S 154 3.1 3.0 2.6 3.0 2.6 2.6 2.0 1.94-methylsyringol S 168 4.2 4.6 3.4 4.2 3.5 3.8 2.8 3.04-ethylsyringol S 182 0.8 0.8 0.6 0.8 0.5 0.4 0.4 0.34-vinylsyringol S 180 5.5 5.2 5.7 5.5 3.6 3.4 3.8 3.44-allylsyringol S 194 2.0 2.1 1.3 1.7 1.3 1.6 1.1 1.2cis-propenylsyringol S 194 1.5 1.6 0.7 1.3 1.0 1.2 0.0 0.9trans-propenylsyringol S 194 5.6 6.5 3.4 4.4 3.5 4.3 2.8 3.0syringaldehyde S 182 0.8 0.4 0.9 0.6 0.6 0.6 0.8 0.6acetosyringone S 196 0.8 0.8 0.6 0.6 0.7 0.8 0.3 0.5syringylacetone S 210 0.8 0.5 0.9 0.7 0.4 0.3 0.3 0.2
S/G ratio 0.6 0.5 0.5 0.6 0.4 0.5 0.4 0.3
Journal of Agricultural and Food Chemistry Article
DOI: 10.1021/acs.jafc.5b05535J. Agric. Food Chem. 2016, 64, 812−820
817

with previous research showing the release of low molecularweight lignin-related compounds from P-AEF,6 as the structureof the remaining, polymeric P-AEF lignin was changed in thecolon model. The observed changes in INS-FC2 were smallerthan in the respective control FC2. INS was enriched withrecalcitrant cell wall polysaccharides7 that were most probablycross-linked to lignin via ferulates. It contained also a highproportion of p-coumarates that were assumed to acylate the γ-OH of the lignin side chain and especially condensed ligninstructures.13 These properties create structural limitations forenzymatic degradation of the matrix, which may have hinderedthe microbial conversion of lignin in INS fraction.Py/TMAH was used to confirm the results obtained by Py-
GC/MS, especially the ratio of p-coumaric and ferulic acid.Only fermented lignin-rich fractions were analyzed. There wereno significant changes in p-CA/FA or S/G ratios duringfermentation (Table 4). Small changes were seen in the lignincomposition before and after fermentation for both P-AEF andINS. The changes were similar to those seen in Py-GC/MS.
Also, TMAH/Py results before and after fermentation of BSGlignin-rich fractions were evaluated using PCA. Two principalcomponents of the data were able to describe 96% of the totalvariance. The first component described the highest variance(74%) and the second component the second highest variance(22%) of the data seen in score plot (Figure 5). On the basis of
the PCA results, there were some changes in lignin compositionof the P-AEF as samples before and after fermentation wereplaced in different positions, whereas lignin in INS seemed tobe unaffected by microbiota, indicated by the same position ofsamples in the score plot before and after fermentation.In conclusion, lignin fractions (P-AEF, INS, AL, and EMAL)
isolated from BSG with different methods varied from oneanother in terms of yield, purity, and lignin structure. Yield offractions remained low in EMAL due to poor solubility oflignin, whereas in P-AEF and AL lignin was solubilized, but it
Figure 4. PCA of the pyrolysis data for lignin-rich fractions of BSG(soluble P-AEF and insoluble INS fractions after the enzymatichydrolysis) and fecal controls (FC1 and FC2) before (0 h) and after(24 h) fermentation in the in vitro colon model. The score plot of thetwo principal components shows how the samples are related to eachother on the basis of the Py-GC/MS data presented in Table 3.
Table 4. Relative Molar Abundance of Aromatic Degradation Products Formed from Lignin and p-Coumaric Acid and FerulicAcid in Py/TMAH before and after Fermentation of Lignin-rich Fractions P-AEF and INS in the in Vitro Colon Model
P-AEF-FC1 P-AEF-FC1 INS-FC2 INS-FC2
compound orig Mw 0 h 24 h 0 h 24 h
1,2-dimethoxybenzene G 138 1.0 2.2 0.0 0.01,2-dimethoxytoluene G 152 5.1 5.8 0.0 0.03,4-dimethoxybenzaldehyde G 166 11.5 12.8 11.4 10.73,4-dimethoxybenzoic acid methyl ester G 196 11.5 8.8 4.2 3.13,4-dimethoxybenzeneacetic acid methyl ester G 210 1.2 1.0 0.8 0.6cis-1-(3,4-dimethoxyphenyl)-2-methoxyethene G 194 0.5 0.7 0.0 0.0trans-1-(3,4-dimethoxyphenyl)-2-methoxyethene G 194 0.8 0.6 1.6 2.41-(3,4-dimethoxyphenyl)-1-methoxyprop-1-ene G 208 1.8 3.2 2.7 3.1erythro-4-(1,2-dimethoxypropyl)-1,2-dimethoxybenzene G 270 1.9 1.3 1.1 1.03,4,5-trimethoxybenzaldehyde S 196 7.1 7.3 5.9 5.53,4,5-trimethoxybenzoic acid methyl ester S 226 11.7 13.6 6.4 7.5cis-1-(3,4,5-trimethoxyphenyl)-2-methoxyethene S 224 0.0 0.0 1.7 2.5erythro-4-(1,2-dimethoxypropyl)-1,2,3-trimethoxybenzene S 300 1.0 1.4 0.6 0.9trans-3-(4-methoxyphenyl)-3-propenoic acid methyl ester p-CA 192 11.5 10.8 25.4 25.1cis-3-(3,4-dimethoxyphenyl)-3-propenoic acid methyl ester FA 222 2.2 2.1 2.7 2.9trans-3-(3,4-dimethoxyphenyl)-3-propenoic acid methyl ester FA 222 31.3 28.6 35.5 34.8
S/G 0.6 0.6 0.7 0.8p-CA/FA 0.3 0.4 0.7 0.7
Figure 5. PCA of the pyrolysis data for lignin-rich fractions of BSG(soluble P-AEF and insoluble INS fractions after the enzymatichydrolysis) before (0 h) and after (24 h) fermentation in the in vitrocolon model. The score plot of the two principal components showshow the samples are related to each other on the basis of the TMAH/Py data presented in Table 4.
Journal of Agricultural and Food Chemistry Article
DOI: 10.1021/acs.jafc.5b05535J. Agric. Food Chem. 2016, 64, 812−820
818

was poorly precipitable. Due to the complexity of BSGstructure, removal of protein and carbohydrates from ligninfractions was not totally complete by any of the methodsapplied. Acylation of the γ-OH group was suggested to be thereason for the lack of sinapyl alcohol detection in Py-GC/MS,as such structures degrade via formation of unsaturated sidechain and loss of oxygen. More precise information on ligninstructure and S/G ratios in this sense was obtained with Py/TMAH, which showed that the original BSG and all isolatedlignins contained high amounts of both syringyl- and guaiacyl-type degradation products probably derived from β-O-4-linkedlignin. In vitro colon model fermentation showed that thestructure of more soluble P-AEF was slightly altered bymicrobial conversions, whereas lignin in the more recalcitrantINS remained intact.
■ AUTHOR INFORMATIONCorresponding Author*(T.O.) Phone: +358 40 570 9322. Fax: +358 20 722 7026. E-mail: [email protected].
FundingFinancial supports from the Academy of Finland (ProjectLignin Fiber, 133091) and COST Action FP0602 (Biotechnologyfor Lignocellulose Bioref ineries) are gratefully acknowledged
NotesThe authors declare no competing financial interest.
■ ACKNOWLEDGMENTSWe thank Luca Zoia and Eeva-Liisa Tolppa for guidance withpreparation of AL and EMAL samples and Eila Turunen forperforming the technical work in the Py-GC/MS experimentsof lignin fractions.
■ REFERENCES(1) Xiros, C.; Christakopoulos, P. Biotechnological potential ofbrewers spent grain and its recent applications. Waste BiomassValorization 2012, 3, 213−232.(2) Robertson, J. A.; I’Anson, K. J. A.; Treimo, J.; Faulds, C. B.;Brocklehurst, T. F.; Eijsink, V. G. H.; Waldron, K. W. Profilingbrewers’ spent grain for composition and microbial ecology at the siteof production. LWT−Food Sci. Technol. 2010, 43, 890−896.(3) Musatto, S. I.; Dragone, G.; Roberto, I. C. A review. Brewers’spent grain: generation, characteristics and potential applications. J.Cereal Sci. 2006, 43, 1−14.(4) Silanikove, N.; Brosh, A. Lignocellulose degradation andsubsequent metabolism of lignin fermentation products by the desertblack Bedouin goat fed on wheat straw as a single-component diet. Br.Br. J. Nutr. 1989, 62, 509.(5) Begum, A. N.; Nicolle, C.; Mila, I.; Lapierre, C.; Nagano, K.;Fukushima, K.; Heinonen, S.; Adlercreutz, H.; Remesy, C.; Scalbert, A.Dietary lignins are precursors of mammalian lignans in rats. J. Nutr.2004, 134, 120−127.(6) Niemi, P.; Aura, A.-M.; Maukkonen, J.; Smeds, A.; Mattila, I.;Niemela, K.; Tamminen, T.; Faulds, C. B.; Buchert, J.; Poutanen, K.Interactions of a lignin-rich fraction from brewer’s spent grain with gutmicrobiota in vitro. J. Agric. Food Chem. 2013, 61, 6754−6762.(7) Aura, A.-M.; Niemi, P.; Mattila, I.; Niemela, K.; Smeds, A.;Tamminen, T.; Faulds, C. B.; Buchert, J.; Poutanen, K. Release ofsmall phenolic compounds from brewer’s spent grain and its ligninfractions by human intestinal microbiota in vitro. J. Agric. Food Chem.2013, 61, 9744−9753.(8) Aura, A.-M.; Mattila, I.; Hyotylainen, T.; Gopalacharyulu, P.;Cheynier, V.; Souquet, J.; Bes, M.; Le Bourvellec, C.; Guyot, S.; Oresic,M. Characterization of microbial metabolism of Syrah grape products
in an in vitro colon model using targeted and non-targeted analyticalapproaches. Eur. J. Nutr. 2013, 52, 833−846.(9) Pietinen, P.; Stumpf, K.; Mannisto, S.; Kataja, V.; Uusitupa, M.;Adlercreutz, H. Serum enterolactone and risk of breast cancer: a case-control study in eastern Finland. Cancer Epidemiol. Biomarkers Prev.2001, 10, 339−344.(10) Vanharanta, M.; Voutilainen, S.; Lakka, T. A.; van der Lee, M.;Adlercreutz, H.; Salonen, J. T. Risk of acute coronary events accordingto serum concentrations of enterolactone: a prospective population-based case-control study. Lancet 1999, 354, 2112−2115.(11) Funk, C.; Braune, A.; Grabber, J. H.; Steinhart, H.; Bunzel, M.Model studies of lignified fiber fermentation by human fecalmicrobiota and its impact on heterocyclic aromatic amine adsorption.Mutat. Res., Fundam. Mol. Mech. Mutagen. 2007, 624, 41−48.(12) Vitaglione, P.; Napolitano, A.; Fogliano, V. Cereal dietary fibre:a natural functional ingredient to deliver phenolic compounds into thegut. Trends Food Sci. Technol. 2008, 19, 451−463.(13) Rencorent, J.; Prinsen, P.; Gutierrez, A.; Martínez, A. T.; del Río,J. C. Isolation and structural characterisation of the milled wood lignin,dioxane lignin, and cellulolytic lignin preparations from brewer’s spentgrain. J. Agric. Food Chem. 2015, 63, 603−613.(14) Niemi, P.; Tamminen, T.; Smeds, A.; Viljanen, K.; Ohra-aho, T.;Holopainen-Mantila, U.; Faulds, C. B.; Poutanen, K.; Buchert, J.Characterisation of lipids and lignans in brewer’s spent grain and itsenzymatically extracted fraction. J. Agric. Food Chem. 2012, 60, 9910−9917.(15) Gellerstedt, G.; Pranda, J.; Lindfors, E. L. Structural andmolecular properties of residual birch kraft lignin. J. Wood Chem.Technol. 1994, 14, 467−482.(16) Guerra, A.; Filpponen, I.; Lucia, L. A.; Saquing, C.; Baumberger,S.; Argyropoulos, D. S. Toward a better understanding of the ligninisolation process from wood. J. Agric. Food Chem. 2006, 54, 5939−5947.(17) Barry, J.-L.; Hoebler, C.; MacFarlane, G. T.; MacFarlane, S.;Mathers, J. C.; Reed, K. A.; Mortensen, P. B.; Nordgaard, I.; Rowland,I. R.; Rumney, C. J. Estimation of the fermentability of dietary fibre invitro: a European inerlaboratory study. Br. J. Nutr. 1995, 74, 303−322.(18) Faix, O.; Meier, D.; Fortmann, I. Thermal degradation productsof wood. Holz Roh-Werkst. 1990, 48, 351−354.(19) Ralph, J.; Hatfield, R. D. Pyrolysis-GC-MS characterization offorage materials. J. Agric. Food Chem. 1991, 39, 1426−1437.(20) Hardell, H.-L.; Nilvebrant, N.-O. Analytical pyrolysis of sprucemilled wood lignins in the presence of tetramethylammoniumhydroxide. Nord. Pulp Pap. Res. J. 1996, 11, 121−126.(21) Kuroda, K-i. Electron-impact (EI) mass spectra of 1,2-dimethoxybenzenes related to the pyrolysis products of guaiacyl ligninin the presences of tetramethylammonium hydroxide (TMAH). J.Anal. Appl. Pyrolysis 2002, 64, 433−451.(22) Ohra-aho, T.; Gomes, F.; Colodette, J.; Tamminen, T. S/G ratioand lignin structure among Eucalyptus hybrids determined by Py-GC−MS and nitrobenzene oxidation. J. Anal. Appl. Pyrolysis 2013, 101,166−171.(23) Kuroda, K-i.; Suzuki, A.; Kato, M.; Imai, K. Analysis of rice(Oryza sativa L.) lignin in pyrolysis-gas chromatography. J. Anal. Appl.Pyrolysis 1995, 34, 1−12.(24) Blokker, P.; Boelen, P.; Broekman, R.; Rozema, J. Theoccurrence of p-coumaric acid and ferulic acid in fossil plant materialsand their use as UV-proxy. Plant Ecol. 2006, 182, 197−207.(25) del Rıo, J. C.; Gutierrez, A.; Rodríguez, I. M.; Ibarra, D.;Martínez, A. T. Composition of non-woody plant lignins and cinnamicacids by Py-GC/MS, Py/TMAH and FT-IR. J. Anal. Appl. Pyrolysis2007, 79, 39−46.(26) Hernanz, D.; Nunez, V.; Sancho, A. I.; Faulds, C. B.;Williamson, G.; Bartolome, B.; Gomez-Cordoves, C. Hydroxycinnamicacids and ferulic acid dehydrodimers in barley and processed barley. J.Agric. Food Chem. 2001, 49, 4884−4888.(27) Kleen, M.; Ohra-aho, T.; Tamminen, T. On the interaction ofHBT with pulp lignin during mediated laccase delignification a study
Journal of Agricultural and Food Chemistry Article
DOI: 10.1021/acs.jafc.5b05535J. Agric. Food Chem. 2016, 64, 812−820
819

using fractionated pyrolysis-GC/MS. J. Anal. Appl. Pyrolysis 2003, 70,589−600.(28) Nakagawa-izumi, A.; Kuroda, K.-I.; Ozawa, T. Thermochemo-lytic behavior of b−b lignin structures in the presence oftetramethylammonium hydroxide (TMAH). Org. Geochem. 2004, 35,763−774.(29) Kuroda, K.-I.; Nakagawa-izumi, A. Analytical pyrolysis of lignin:products stemming fromb-5 substructures. Org. Geochem. 2006, 37,665−673.(30) Kuroda, K-i. Analytical pyrolysis products derived fromcinnamyl alcohol-end groups in lignins. J. Anal. Appl. Pyrolysis 2000,53, 123−134.(31) Ralph, J.; Lu, F. The DFRC method for lignin analysis. 6. Asimple modification for identifying natural acetates on lignins. J. Agric.Food Chem. 1998, 46, 4616−4619.(32) Rencorent, J.; Ralph, J.; Marques, G.; Gutierrez, A.; Martínez, A.T.; del Río, J. C. Structural characterization of lignin isolated fromcoconut (Cocos nucifera) coir fibers. J. Agric. Food Chem. 2013, 61,2434−2445.(33) Moldoveanu, S. C. The chemistry of the pyrolytic process. InPyrolysis of Organic Molecules with Applications to Health andEnvironmental Issues, 1st ed.; Elsevier: Oxford, UK, 2010; Vol. 28, pp7−48.(34) Ralph, J. Hydroxycinnamates in lignification. Phytochem. Rev.2010, 9, 65−83.(35) Challinor, J. M. A pyrolysis-derivatisation-gas chromatographytechnique for the structural elucidation of some synthetic polymers. J.Anal. Appl. Pyrolysis 1989, 16, 323−333.(36) del Rıo, J. C.; Martin, F.; Gonzalez-Vila, F. J. Thermally assistedhydrolysis and alkylation as a novel pyrolytic approach for thestructural characterization of natural biopolymers and geomacromo-lecules. TrAC, Trends Anal. Chem. 1996, 15, 70−79.(37) Jacquet, G.; Pollet, B.; Lapierre, C.; Mhamdi, F.; Rolando, C.New ether-linked ferulic acid-coniferyl alcohol dimers identified ingrass straws. J. Agric. Food Chem. 1995, 43, 2746−2751.(38) Jaaskelainen, A. S.; Sun, Y.; Argyropoulos, D. S.; Tamminen, T.;Hortling, H. The effect of isolation method on the chemical structre ofresidual lignin. Wood Sci. Technol. 2003, 37, 91−102.(39) Kuroda, K.-I.; Nakagawa-izumi, A. Tetramethylammoniumhydroxide (TMAH) thermochemolysis of lignin: Improvement ofthe distribution profile of products derived from b-aryl ether subunits.J. Anal. Appl. Pyrolysis 2006, 75, 104−111.
Journal of Agricultural and Food Chemistry Article
DOI: 10.1021/acs.jafc.5b05535J. Agric. Food Chem. 2016, 64, 812−820
820

Ohra-aho T., Gomes F.J.B., Colodette J.L., Tamminen T. Carbohydrate composition in Eucalyptus wood and pulps – comparison between Py-GC/MS and acid hydrolysis. Accepted for publication to J.Anal Appl. Pyrolysis.
VI

Carbohydrate composition in Eucalyptus wood and pulps - comparison between Py-
GC/MS and acid hydrolysis
1T. Ohra-aho*, 2F.J.B. Gomes, 2J.L. Colodette, 1T. Tamminen
1VTT-Technical Research Centre of Finland, P.O. Box 1000, FI-02044 VTT, Finland
2 Department of Forest Engineering, Federal University of Viçosa, 36570-000,Viçosa, Brazil
*Corresponding author: Tel. +358 40 570 9322; fax.: +358 20 722 7026; E-mail address: [email protected]
Abstract
In analytical pyrolysis, carbohydrates are degraded into stable anhydrosugars, which are analyzed
by GC/MS. The benefit of Py-GC/MS is that fiber composition including carbohydrates, lignin and
its S/G ratio can be determined simultaneously from fiber-based materials without need of extensive
pretreatment, contrary to the traditional method. In this study, the relative carbohydrate composition
of various Eucalyptus species was determined by Py-GC/MS. In addition, pulps produced from the
same species by soda-AQ and soda-O2 processes were analyzed similarly. The results were
compared with those obtained by acid hydrolysis followed by HPLC. This comparison showed that
the relative carbohydrate composition determined by Py-GC/MS for the wood samples differed
from the values obtained by acid hydrolysis. Significantly better correlation between the two
methods was observed for the pulp samples cooked to varying kappa number levels. Fractionated
pyrolysis was applied in order to find explanation to the observed difference in the degradation
behavior of carbohydrates in wood and pulp samples. Due to the close association of lignin and
carbohydrates, the thermal behavior of lignin was followed as well. The results showed that the
thermal behavior of xylan and cellulose differed in the wood samples, but were almost equal in the
pulp samples. Thermal degradation of xylan was similar with lignin in both sample types. Similar
thermal behavior between the components is a prerequisite for reliable Py-GC/MS analysis.
Therefore, this method cannot be recommended for the comparison of carbohydrate compositions
between different wood raw materials. However, it is applicable to pulp samples and may find
application in research for profiling carbohydrate compositional changes with processing methods
and conditions.
Keywords: Eucalyptus wood, pulp, carbohydrate composition, Py-GC/MS, acid hydrolysis,
fractionated pyrolysis

1 Introduction
Eucalyptus wood is increasingly used for pulp production especially in tropical zones due to its fast
growth rate. Chemical composition of wood varies between different wood species and clones as
well as habitat and age of the wood. Characterisation of wood fibre components, i.e. lignin,
cellulose and hemicelluloses, is important in order to understand wood behaviour during chemical
and mechanical treatments as well as quality of final pulp products [1]. Traditional way to
determine carbohydrate composition together with lignin content from fibre-based material is acid
hydrolysis. After acid hydrolysis with sulphuric acid, carbohydrate monomers can be determined by
High Performance Liquid Chromatography (HPLC). From the same solution, acid-soluble lignin
can be determined by UV-Vis spectrometer. The total amount of lignin is the sum of acid insoluble
material, so-called Klason lignin, and the acid-soluble lignin [2]. Analytical pyrolysis combined
with gas chromatography and mass spectrometry (Py-GC/MS) provides a method for simultaneous
determination of lignin and carbohydrates from fibre-based materials from small sample amounts
[3–7]. Additional benefit of the method is that pre-treatment like extractives removal from the
studied material is not needed [8]. Before acid hydrolysis, extractives removal is essential, due to
the possible condensation reactions of lignin and extractives.
Eucalyptus wood polysaccharides comprise mainly of cellulose and xylan, but minor amount of
glucomannan is present as well. In comparison to cellulose, hemicelluloses have lower molecular
weight and may be branched. Hardwood xylans contain 4-O-methylglucuronic acid side groups and
are highly substituted by O-acetyl groups. In addition, xylan is linked with lignin [9-10]. Xylan,
similarly to other hemicelluloses, is thermally less stable than cellulose. The side groups present in
xylan also lower the thermal stability [11]. In pyrolysis, hemicelluloses together with cellulose are
degraded to a significant degree to anhydrosugars, such as 1,6-anhydromannopyranose, 1,6-
anhydrogalactopyranose, 1,6-anhydroglucopyranose (levoglucosan), 1,5-anhydroarabinofuranose
and 1,4-anhydroxylopyranose. Also significant amounts of pyrans, furans, light oxygenates and

gases are formed [4,11–13]. Their yields are highly dependent on the lignocellulosic material,
pyrolysis temperature [11], and present of trace amounts of metals, especially in the case of pulp
samples [14–16]. Due to the incomplete formation of anhydrosugars, Py-GC/MS is typically used
for qualitative analysis rather than quantitation. However, the relative carbohydrate composition
determined from Kraft pulps by Py-GC/MS has been found to correlate well with the results
obtained by traditional wet chemical methods [15–17], but information is lacking about the
applicability of Py-GC/MS for the analysis of wood feedstocks in a similar manner as pulps.
The aim of this study was to evaluate the applicability of Py-GC/MS for the determination of the
relative carbohydrate composition of Eucalyptus wood species. The lignin composition and S/G
ratio of these samples has been determined earlier by the same method [18]. The hypothesis was
thus that further analysis of the same pyrolysis runs of Eucalyptus wood species would provide
information also about the polysaccharide component of the samples. Thus, Py-GC/MS could be
used as an optional method for the determination of lignin and carbohydrate composition together
with the S/G ratio. For the method evaluation, two types of eucalypt pulps from different cooking
stages were subjected to the same method comparison as the wood samples. Finally, the thermal
behaviour of the polysaccharide components in the wood and pulp matrices was studied using
fractionated pyrolysis by increasing the pyrolysis temperature stepwise [19].
2 Material and methods
2.1 Sample preparation
Eighteen 7-year-old Eucalyptus species, including a number of double/triple/fourth crossings
among E. grandis, E. urophylla, E. globulus, E. dunnii and E. camaldulensis were obtained from the
Brazilian Network of Eucalyptus Genome Research – Genolyptus. Detailed list of the eucalypt
hybrids is presented in the Table 1. For the carbohydrate analysis by acid hydrolysis, wood chips
were screened, refined and extracted as described in [18]. For Py-GC/MS analysis, the eucalypt

chips were Wiley milled, but extractives were not removed.
Soda-O2 and soda-AQ pulps of eucalypt hybrid G1xUGL (E. grandis (Coffs Harbour) x [E.
urophylla (R) x E. globulus (R)]) at different degrees of delignification (kappa values 50, 35 and 15)
were prepared in a Brazilian pulp mill laboratory, using an M&K digester (USA). Before Py-
GC/MS analysis, the pulps were washed with calcium rich tap water to replace alkaline metals to
calcium ions according to a method described elsewhere [15], and thereafter dried and Wiley
milled.
2.2 Acid hydrolysis
Carbohydrate composition was determined by HPLC with Pulse Amperometric Detection (HPAEC-
PAD) after pre-treatment (30°C, 1 h) of the materials with 72% H2SO4 followed by hydrolysis with
3% H2SO4 in an autoclave (120°C, 1 h). HPAEC-PAD was carried out by Dionex ICS-3000 system
equipped with a CarboPac PA1 (250 x 4mm) analytical column. The monosaccharides were
separated isocratically with 0.001 M NaOH (45 min, flow rate 1 mL/min) according to Wallis et al.
[20]. For the comparison with Py-GC/MS data, the relative carbohydrate content was calculated by
normalization to 100 %. The mean deviation percentages of the two parallel measurements of wood
samples for the glucose, xylose, mannose, galactose and arabinose were 4 %, 2 %, 6 %, 3 % and
4 %, respectively. The mean distribution percentage of the parallel measurements of pulp samples
for the xylose and glucose were 0.8 % and 0.1 %, respectively.
2.3. Py-GC/MS
Both isothermal and fractionated Py-GC/MS measurements were performed with a filament pulse
pyrolyzer (Pyrola2000, PyrolAB, Sweden), which was connected to a GC/MS instrument (Varian
3800 GC/2000 MS). The detailed description of the isothermal pyrolysis at 580°C for 2s is
described elsewhere [18]. The conditions used for the fractionated pyrolysis were based on our
previous study [21], with some modification of temperatures and time. Fractionated pyrolysis was

performed at temperatures of 320, 450, 580 and 800 °C for 44, 16, 4, and 2 s, respectively. Both in
the isothermal and the fractionated pyrolysis GC/MS conditions were the same. In the case of
isothermal and fractionated pyrolysis, 70-100 μg of the sample was weighed accurately and
transferred on the filament. After that, the pyrolysis degradation products were led with carrier gas
into a gas chromatography capillary column for separation (J&W, DB-1701, 30 m x 0.25 mm, film
1 μm). The degradation products were detected using ion trap mass spectrometry with the mass
scan range of m/z 46-399 (EI 70 eV). Carbohydrate pyrolysis products were identified using data
from the literature [4,22]. The identities of carbohydrate degradation products used for the
calculation are shown in Table 2. The anhydrosugars were integrated form total ion chromatograms,
except for 1,6-anhydrogalactopyranose (g). Due to the low content of 1,6-anhydrogalactopyranose
(g) the peak area was integrated using selected main ion 60. Its peak area was converted to the total
peak area using factor 4.2 (calculated from the mass spectrum of the pure compound). The relative
monosaccharide composition was calculated after the normalization of peak areas of anhydrosugars
to 100 %. Anhydrosugars 1,5-anhydroarabinofuranose (c) and 1,6-anhydrogalactopyranose (g) were
used to calculate arabinose and galactose, respectively. Two degradation products 1,5-anhydro-4-
deoxypent-1-en-3-ulose (a) and 1,4-anhydroxylopyranose (f) were used to determine xylose,
whereas glucose was determined in two ways using only 1,6-anhydroglucopyranose (i) (method A)
or using four main degradation products of cellulose 1,6-anhydroglucopyranose (i), 5-
hydroxymethyl-2-tetrahydofuraldehyde-3-one (b), 5-hydroxymethyl-2-furaldehyde (d) and 1.4-
dideoxy-D-glycero-hex-1-enopyranos-3-ulose (e) (method B). Average of two and three parallel
measurements was calculated for the Eucalypt hybrids and pulps, respectively. In case of wood
samples, the mean error percentages of xylose, arabinose and galactose were 8 %, 20 %, and 40 %,
respectively. The mean error percentage of glucose was 6 % when the content was calculated using
only 1,6-anhydroglucopyranose (method A) and 4 % when the four main degradation products of
cellulose (1,6-anhydroglucopyranose, 5-hydroxymethyl-2-tetrahydofuraldehyde-3-one, 5-

hydroxymethyl-2-furaldehyde and 1.4-dideoxy-D-glycero-hex-1-enopyranos-3-ulose) were
included to the glucose content calculation (method B). Mannose was not detected. For the pulps,
the average standard deviation percentage of xylose was 4 %. For glucose, the average standard
deviations were 2 % and 0.4 % using only one degradation product (method A) and the four main
cellulose degradation products (method B), respectively. Lignin degradation products were
integrated from the fractionated pyrolysis data according to our previous publications [18,21].
3. Results and discussion
The pyrogram profiles of the eucalypt hybrids were all alike. As an example, the pyrograms of
eucalypt hybrid G1xUGL (E. grandis (Coffs Harbour) x [E. urophylla (R) x E. globulus (R)]) wood
and Kraft pulp from the same wood species are shown in Fig. 1 and identities of degradation
product of cellulose and hemicelluloses are shown in Table 2. The main degradation products of
cellulose are marked in the pyrogram with letters b, d, e and i and main degradation products of
hemicelluloses with letters a, c, f, g and h. For the pulps, increasing intensity of cellulose products
(b, d, e, i) were observed directly from the pyrograms as a function of the progress of cooking. Only
xylose of all hemicelluloses was present in the final pulps. The most abundant unmarked peaks in
the wood samples were lignin pyrolysis degradation products. Their intensity was decreased
radically during cooking. Lignin composition and S/G ratio of the same samples have been
presented in our previous paper [18].
3.1 Carbohydrate composition in eucalypt hybrids
The comparison among Py-GC/MS and acid hydrolysis methods for the carbohydrate composition
analysis of Eucalyptus woods is shown in Fig. 2. When only 1,6-anhydroglucopyranose was used
for the calculation of the relative glucose content (method A) glucose and xylose varied between
51.3–64.1 % and 33.0–46.5 %, respectively. The corresponding values obtained by acid hydrolysis

were 74.1–78.6 % and 16.7–22.6 %. The contents were also calculated using 1,6-
anhydroglucopyranose together with three other pyrolysis degradation product of cellulose (method
B): 5-hydroxymethyl-2-tetrahydofuraldehyde-3-one (b), 5-hydroxymethyl-2-furaldehyde (d) and
1.4-dideoxy-D-glycero-hex-1-enopyranos-3-ulose (e). The values 67.9–78.2% for glucose and
19.4–30.6% for xylose obtained by this calculation method were closer to the acid hydrolysis
values. The range on glucose and xylose content among the Eucalyptus species was same with both
Py-GC/MS methods (A and B). This indicates that the changes on carbohydrate composition among
samples can be followed either including only 1,6-anhydroglucopyranose (method A) or
alternatively including all four main cellulose pyrolysis derivatives (method B). The latter method
can be used only when the sample contains low amount of galactoglucomannan or glucomannan
[5], such as eucalypt wood. Fig. 3 shows that the correlation between the Py-GC/MS and acid
hydrolysis methods is poor for glucose and xylose in the case of wood samples. The same was
detected also for the minor constituent’s arabinose and galactose (not shown).
3.2 Carbohydrate composition in eucalypt pulps
Similar Py-GC/MS conditions as used in the present study have earlier been used to determine the
relative carbohydrate composition from pulp samples. The correlation between Py-GC/MS and acid
hydrolysis for the pulps has been reported to be good [15–17]. Thus, the method seems to work for
pulps better than for wood samples. In order to confirm that hypothesis, two different types of
pulps, soda-AQ and soda-O2, were cooked to different stages from the same raw material (E.
grandis (Coffs Harbour) x [E. urophylla (R) x E. globulus (R)] and analyzed by Py-GC/MS and
acid hydrolysis. Only the relative contents of glucose and xylose were followed, as the other
hemicelluloses were mainly dissolved during cooking. The Py-GC/MS results were calculated using
the two methods, method A and method B, described above for the wood samples. When only 1,6-
anhydroglucopyranose was included to the relative carbohydrate composition (method A), both
xylose and glucose contents were closer to the values obtained by acid hydrolysis compared to
method B (Fig. 4), in accordance with the earlier studies [9] but opposite to what was detected for
the wood samples. In addition, good correlation among Py-GC/MS and acid hydrolysis results was
seen (Fig. 4). This result is consistent with earlier reports [15–17]. The correlation was even better
when the different types of pulps (soda-AQ and soda-O2) were followed separately. Based on the
result, Py-GC/MS seems to be suitable for the comparison of carbohydrate compositions between
pulps originating from the same process type. The correlation between Py-GC/MS and acid
hydrolysis was better by method B, but the absolute values were closer by using only 1,6-
anhydroglucopyranose (method A).
The differences observed for the wood and pulp samples indicate that the degradation behavior of
cellulose and hemicelluloses are different for the two types of samples. Possible reasons for this are
differences in xylan structure due to cooking, such as release of acetyl and uronic acid groups.
Delignification during cooking affects also xylan as it is partially linked with lignin. In the pulp
samples analysed, lignin has mainly been dissolved [9]. In order to clarify the influence of cooking
and lignin content to the thermal degradation behavior of carbohydrates in pyrolysis, two eucalypt
hybrids and one pulp samples were analyzed by using fractionated pyrolysis.
3.3 Thermal degradation behavior of carbohydrates
Eucalypt hybrid G1xUGL and soda-O2 pulp (kappa 15), cooked from the same raw material were
selected for the fractionated pyrolysis. The second Eucalypt hybrid C1xUGL was selected due to
the high difference of glucose and xylose contents among the methods. The fractionated pyrolysis
results of the carbohydrates were calculated only by method B (including all cellulose-related
degradation products). Because carbohydrates are linked with lignin both in wood and pulp [10], the
degradation behavior of lignin was followed by fractionated pyrolysis together with carbohydrates.
In the case of wood samples, the degradation products of xylan were determined at two
temperatures 320 and 450 °C. Slightly higher proportion was detected at 450 °C (Table 3).
Galactose was released at the same temperatures as xylose, but the proportions varied slightly

among the samples (C1xUGL and G1xUGL). Arabinose was released completely at 320 °C. Main
part of glucose was released at 450 °C, but small proportion also at other temperatures 320, 580 and
800 °C. Degradation of cellulose at higher temperatures than hemicelluloses is in accordance with
the results reported in the literature [11-12]. Thermal behavior of xylan was similar among wood
species (G1xUGL and C1xUGL), but different in comparison to the pulp. About 99 % of xylan was
released at 450 °C from the pulp and only minor part at lower temperatures. Release of acetyl and
methylglucuronic acid side groups has been reported to be occur at lower temperature than the
degradation of the xylan backbone [11]. Cooking releases side groups of xylan [9], which can partly
explain the higher thermal stability of pulp than wood xylan. The higher thermal stability of pulp
than wood xylan has earlier been verified by thermogravimetric analysis [23]. The linear pulp xylan
may also interact with the cellulose surfaces, which may stabilize it further.
Lignin degrades from wood species (G1xUGL and C1xUGL) clearly at two different temperatures
320 °C and 450 °C, the higher temperature being dominant. In the case of pulp, the highest
proportion of lignin, about 90 %, was released at 450 °C and clearly lower proportion, 6 % and 4 %,
in the other temperatures 320 °C and 580°C, respectively. Thus, the thermal degradation behavior
of lignin follows closely the behavior of xylan both in the wood and pulp samples. Also the thermal
behavior of cellulose was rather similar among the wood and pulp samples. The thermal
degradation behavior of all fiber components was thus close to each other in the pulp samples, but
not in the wood samples, which explains the observed inconsistencies in case of wood samples.
4. Conclusions
Py-GC/MS is not recommended for the comparison between eucalypt wood samples, as the relative
carbohydrate contents by Py-GC/MS were not found to correlate with the results obtained by acid
hydrolysis followed by HPLC. This was shown by fractionated pyrolysis to be due to differences in
the thermal degradation behaviors of the carbohydrate components in wood. However, the two

methods gave comparable results for the relative carbohydrate composition when analyzing pulp
samples, in accordance with the detected similar thermal degradation behaviors of the fiber
components in the case of pulps.
ACKNOWLEDGMENTS
Ms. Eila Turunen is thanked for performing the technical work in the Py-GC/MS experiments.
Financial support from the Academy of Finland and Brazilian CNPq are gratefully acknowledged
(Effect of fiber wall chemistry on energy demand in wood defibration, Defibre, 133276). We thank
Suzano Papel e Celulose (Brazil) for providing the pulp samples from the alkaline cooking
experiments.
REFERENCES
[1] H. Sixta, Handbook of pulp, WILEY-VCH Verlag GmbH & Co. KGaA, Weinheinm, 2008.
[2] TAPPI, Technical Association of the Pilp and Paper Industry, TAPPI Test Methods, 2000-
2001, TAPPI, Atlanta, USA, 2000.
[3] O. Faix, D. Meier, I. Fortmann, Thermal degradation products of wood: Gas
chromatographic separation and mass spectrometric characterization of monomeric lignin
derived products, Holz Als Roh- Und Werkst. 48 (1990) 281–285.
[4] O. Faix, I. Fortmann, J. Bremer, D. Meier, Thermal degradation products of wood: Gas
chromatographic separation and mass spectrometric characterization of polysaccharide
derived products, Holz Als Roh- Und Werkst. 49 (1991) 213–219.
[5] M. Kleen, G. Gellerstedt, Characterization of chemical and mechanical pulps by pyrolysis-
gas chromatography/mass spectrometry, J. Anal. Appl. Pyrolysis. 19 (1991) 139–152.
[6] J.C. del Río, A. Gutiérrez, M.J. Martínez, A.T. Martínez, Py-GC/MS study of Eucalyptus
globulus wood treated with different fungi, J. Anal. Appl. Pyrolysis. 58–59 (2001) 441–452.
doi:10.1016/S0165-2370(00)00184-4.
[7] A. Lourenço, J. Gominho, A.V. Marques, H. Pereira, Py-GC/MS(FID) assessed behavior of
polysaccharides during kraft delignification of Eucalyptus globulus heartwood and sapwood,

J. Anal. Appl. Pyrolysis. 101 (2013) 142–149. doi:10.1016/j.jaap.2013.01.018.
[8] L.C.A. Barbosa, C.R. Maltha, V.L. Silva, J.L. Colodette, Determination of the
syringyl/guaiacyl ratio in eucalyptus wood by pyrolysis-gas chromatography/mass
spectrometry (Py-GC/MS), Quim. Nova. 31 (2008) 2035–2041. doi:10.1590/S0100-
40422008000800023.
[9] P.C. Pinto, D. V. Evtuguin, C.P. Neto, A.J.D. Silvestre, F.M.L. Amado, Behavior of
Eucalyptus globulus lignin during kraft pulping. I. Analysis by NMR, ESI/MS, and GPC, J.
Wood Chem. Technol. 22 (2002) 109–125. doi:10.1081/WCT-120013356.
[10] J. Li, R. Martin-sampedro, C. Pedrazzi, G. Gellerstedt, Fractionation and characterization of
lignin-carbohydrate complexes (LCCs) from eucalyptus fibers, Holzforschung. 65 (2011)
43–50. doi:10.1515/HF.2011.013.
[11] D.K. Shen, S. Gu, A. V. Bridgwater, The thermal performance of the polysaccharides
extracted from hardwood: Cellulose and hemicellulose, Carbohydr. Polym. 82 (2010) 39–45.
doi:10.1016/j.carbpol.2010.04.018.
[12] H. Yang, R. Yan, H. Chen, D.H. Lee, C. Zheng, Characteristics of hemicellulose, cellulose
and lignin pyrolysis, Fuel. 86 (2007) 1781–1788. doi:10.1016/j.fuel.2006.12.013.
[13] S. Wu, D. Shen, J. Hu, H. Zhang, R. Xiao, Role of β-O-4 glycosidic bond on thermal
degradation of cellulose, J. Anal. Appl. Pyrolysis. 119 (2016) 147–156.
doi:10.1016/j.jaap.2016.03.006.
[14] J. Kelly, M. Mackey, R.J. Helleur, Quantitative analysis of saccharides in wood pulps by
quartz-tube pulse pyrolysis-polar phase gas chromatography, J. Anal. Appl. Pyrolysis. 19
(1991) 150–117.
[15] M. Kleen, G. Lindblad, S. Backa, Quntification of lignin and carbohydrates in Kraft pulps
using analytical pyrolysis and multivariate data analysis, J. Anal. Appl. Pyrolysis. 25 (1993)
209–227.
[16] K. Syverud, I. Leirset, D. Vaaler, Characterization of carbohydrates in chemical pulps by
pyrolysis gas chromatography/mass spectrometry, J. Anal. Appl. Pyrolysis. 67 (2003) 381–
391. doi:10.1016/S0165-2370(02)00076-1.
[17] J. Kelly, R. Helleur, Quantitative analysis of the major saccharides in sulfite-treated wood
pulps by pyrolysis-gas chromatography: the effect of metal ions, J. Anal. Appl. Pyrolysis. 23
(1992) 153–163.

[18] T. Ohra-aho, F.J.B. Gomes, J.L. Colodette, T. Tamminen, S/G ratio and lignin structure
among Eucalyptus hybrids determined by Py-GC/MS and nitrobenzene oxidation, J. Anal.
Appl. Pyrolysis. 101 (2013) 166–171. doi:10.1016/j.jaap.2013.01.015.
[19] P. Selsbo, I. Ericsson, M. Kleen, Characterization of sulfur in wood pulps using pyrolysis-gas
chromatography with sulfur-selective detection, J. Anal. Appl. Pyrolysis. 43 (1997) 1–14.
doi:10.1016/S0165-2370(97)00055-7.
[20] A. Wallis, R. Wearne, P. Wright, Chemical Analysis of Polysaccharides in Plantation
Eucalyptus Wood and Pulps, Apitta J. 49 (1996) 258–262.
[21] T. Ohra-aho, M. Tenkanen, T. Tamminen, Direct analysis of lignin and lignin-like
components from softwood kraft pulp by Py-GC/MS techniques, J. Anal. Appl. Pyrolysis. 74
(2005) 123–128. doi:10.1016/j.jaap.2004.11.010.
[22] O. Faix, I. Fortmann, J. Bremer, D. Meier, Thermal degradation products of wood: A
collection of electron-impact (EI) mass spectra of polysaccharide derived products, Holz Als
Roh- Und Werkst. 49 (1991) 299–304.
[23] A. Oudia, E. Mészáros, R. Simões, J. Queiroz, E. Jakab, Pyrolysis-GC/MS and TG/MS study
of mediated laccase biodelignification of Eucalyptus globulus kraft pulp, J. Anal. Appl.
Pyrolysis. 78 (2007) 233–242. doi:10.1016/j.jaap.2006.07.003.

Fig. 1. Pyrograms of eucalypt hybrid G1xUGL (E. grandis (Coffs Harbour) x [E. urophylla (R) x E.
globulus (R)]) wood and soda-O2 pulp cooked from G1xUGL (kappa 15) obtained at 580 °C.
Carbohydrate-related degradation products marked in the pyrogram are given in Table 2.

Fig. 2. Carbohydrate composition (after normalization to 100%) determined by Py-GC/MS and acid
hydrolysis followed by HPLC. Py-GC/MS results has been calculated two ways A) relative glucose
content calculated including only 1,6-anhydroglucopyranose B) relative glucose content calculated
including 5-hydroxymethyl-2-tetrahydofuraldehyde-3-one; 5-hydroxymethyl-2-furaldehyde; 1.4-
dideoxy-D-glycero-hex-1-enopyranos-3-ulose and 1,6-anhydroglucopyranose

Fig. 3. Comparison of relative glucose and xylose content between Py-GC/MS and acid hydrolysis
followed by HPLC from eucalypt hybrids. Relative glucose content has been calculated using
method B (see Fig. 2.)
Fig. 4. Comparison of relative glucose and xylose content between Py-GC/MS and acid hydrolysis
followed by HPLC from different cooking stages of soda-AQ and soda-O2 pulps. Raw material was
the same for both pulps (E. grandis (Coffs Harbour) x [E. urophylla (R) x E. globulus (R)]. Py-
GC/MS results have been calculated using method A and B (see Fig 2.).

Table 1. Sample names and short codes
No Eucalyptus hybrids Short code 1 E. urophylla (IP) x E. grandis (IP) IP 2 E. urophylla (Flores IP) x E. urophylla (Timor) U1xU2 3 E. urophylla (Flores IP) x E. camaldulensis(VM2) U1xC2 4 E. urophylla (Flores IP) X [E. urophylla (R) x E. globulus (R)] U1xUGL 5 E. grandis (Coffs Harbour) x [E. urophylla (R) x E. globulus (R)] G1xUGL 6 E. dunni (R) x [E. urophylla (R) x E. globulus (R)]? D1xUGL 7 E. camaldulensis (VM1) x [E. urophylla (R) x E. globulus (R)] C1xUGL 8 [E. dunnii (R) x E. grandis (R)] x [E. urophylla (R) x E. globulus (R)] DGxUGL 9 [E. dunnii (R) x E. grandis (R)] x E. urophylla (Timor) DGxU2 10 [E. dunnii (R) x E. grandis (R)] x E. camaldulensis (VM1) DGxC1 11 [E. dunnii (R) x E. grandis (R)] x E. globulus (R) (Dad, pollen) DGxGL2 12 E. dunni (KR) x E. globulus (R)(Dad, pollen) D2xGL2 13 E. grandis (Coffs Harbour) x E. globulus (R) (Dad, pollen) G1xGL2 14 E. urophylla (Timor) x E. globulus (R)(Mom, stigma) U2xGL1 15 E. urophylla (Timor) x E. camaldulensis (VM1) U2xC1 16 E. camaldulensis (VM1) x E. camaldulensis (VM1) C1xC2 17 E. dunni (R) x E. dunni (KR) D1xD2 18 VCP - E. grandis (VCP) x E. urophylla (VCP) VCP
Table 2. Pyrolysis degradation products of carbohydrates. Compound letter refer the letters in Fig.
1
Marker MW Compound name Anhydrosugar a 114 4-hydroxy-5,6-dihydro-(2H)-pyran-2-one xylose b 144 5-hydroxymethyl-2-tetrahydofuraldehyde-3-one glucose c 132 1,5-anhydroarabinofuranose arabinose d 126 5-hydroxymethyl-2-furaldehyde glucose e 144 1.4-Dideoxy-D-glycero-hex-1-enopyranos-3-ulose glucose f 132 1,4-Anhydroxylopyranose xylose g 162 1,6-anhydrogalactopyranose galactose h 162 1,6-anhydromannopyranose mannose i 162 1,6-anhydroglucopyranose glucose

Table 3. Thermal behavior of carbohydrates and lignin in eucalypt hybrids (C1xUGL and
G1xUGL) and soda-O2 pulp of G1xUGL (ĸ=15) determined by fractionated pyrolysis. Results
presented as relative amount (%, after normalization to 100%) of degradation products released
from carbohydrates and lignin as a function of temperature.
C1xUGL G1xUGL soda-O2 pulp of G1xUGL Tem., °C Time, s
320 44
450 16
580 4
800 2
320 44
450 16
580 4
800 2
320 44
450 16
580 4
800 2
Xylose 42.9 57.1 0.0 0.0 44.1 55.9 0.0 0.0 1.3 98.7 0.0 0.0 Arabinose 100.0 0.0 0.0 0.0 100.0 0.0 0.0 0.0 Galactose 55.4 44.6 0.0 0.0 43.3 56.7 0.0 0.0 Glucose 2.2 97.1 0.6 0.1 2.3 97.4 0.3 <0.1 0.1 99.4 0.4 0.1 Lignin 28.2 71.1 0.7 0.1 24.2 74.7 1.0 0.1 5.9 89.8 4.2 0.2

-otl
aA
DD
0
32
/ 7
102
TT
VE
CN
EIC
S
861
+iddhh
a*GMFTSH
9 NBSI 8-3377-06-259-879 )detnirp( NBSI 5-4377-06-259-879 )fdp(
L-NSSI 4394-9971 NSSI 4394-9971 )detnirp( NSSI 2494-9971 )fdp(
3-5958-83-159-879 )detnirp( 6-4958-83-159-879 )fdp(
X911-2422X911-2422 )detnirp( 3021-2422 )fdp(
ytisrevinU otlaA
gnireenignE lacimehC fo loohcS smetsysoiB dna stcudorpoiB fo tnemtrapeD
if.otlaa.www
+ SSENISUB YMONOCE
+ TRA
+ NGISED ERUTCETIHCRA
+ ECNEICS
YGOLONHCET
REVOSSORC
LAROTCOD SNOITATRESSID
oha
-arh
O an
iaT
ssa
m yh
parg
ota
morh
c sa
g si
sylo
ryp l
acit
ylan
a yb
stn
enop
moc
esol
ullec
ongil
fo
noit
asir
etca
rah
C
yrt
emo
rtce
ps y
tisr
evi
nU
otla
A
7102
smetsysoiB dna stcudorpoiB fo tnemtrapeD
fo noitasiretcarahC stnenopmoc esolullecongil
sag sisyloryp lacitylana yb ssam yhpargotamorhc
yrtemortceps
oha-arhO aniaT
LAROTCOD SNOITATRESSID