vt common assets trust fund (s.44) creating a “public equity firm” dec. 11, 2007 g. flomenhoft,...
Post on 22-Dec-2015
214 views
TRANSCRIPT

VT COMMON ASSETS TRUST FUND (S.44)
CREATING A “PUBLIC EQUITY FIRM”
Dec. 11, 2007G. Flomenhoft, Amos Baer, Patrick Wood

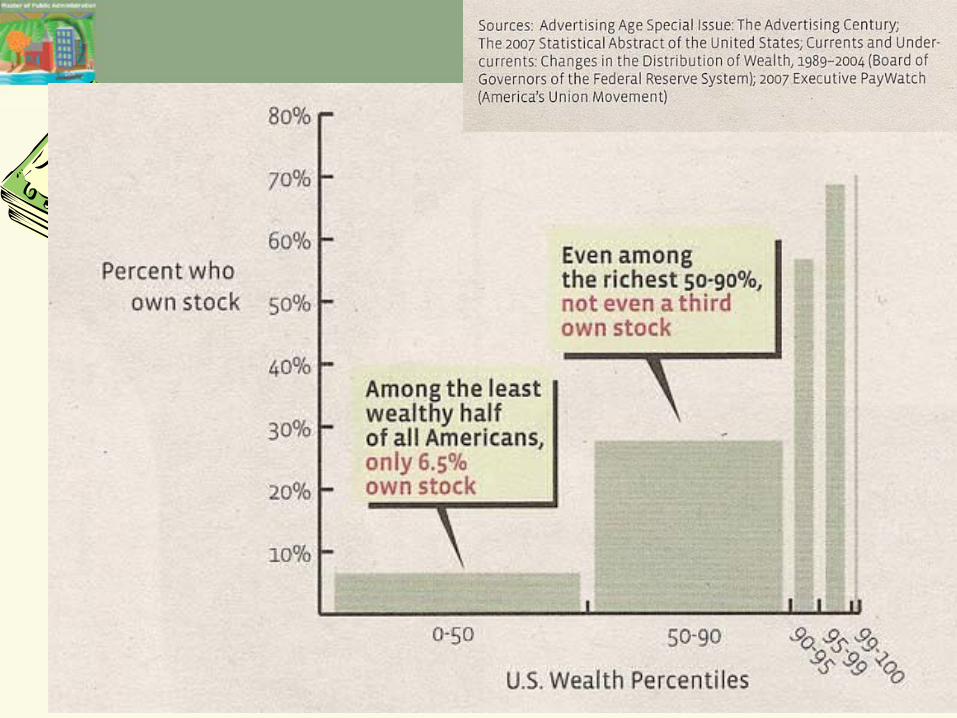
WHO OWNS WHAT?

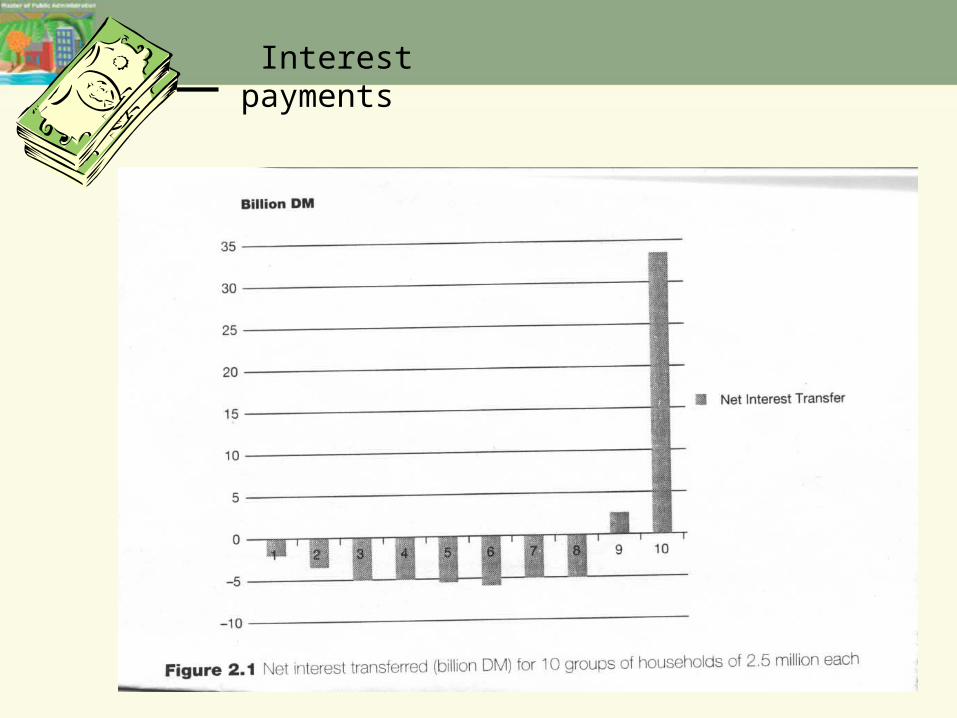
Interest payments

EMPLOYEE STOCK OWNERSHIP
0
5
10
15
20
25
1
% OF EMPLOYEES
Employee Stock Purchase Plan (ESPP)
401K
Stock bonus, deferred profit sharing, etc
Employee Stock Ownership Plan (ESOP)
17%
6%
Private Equity Firms
Private Equity Firm Assets: $1 Trillion
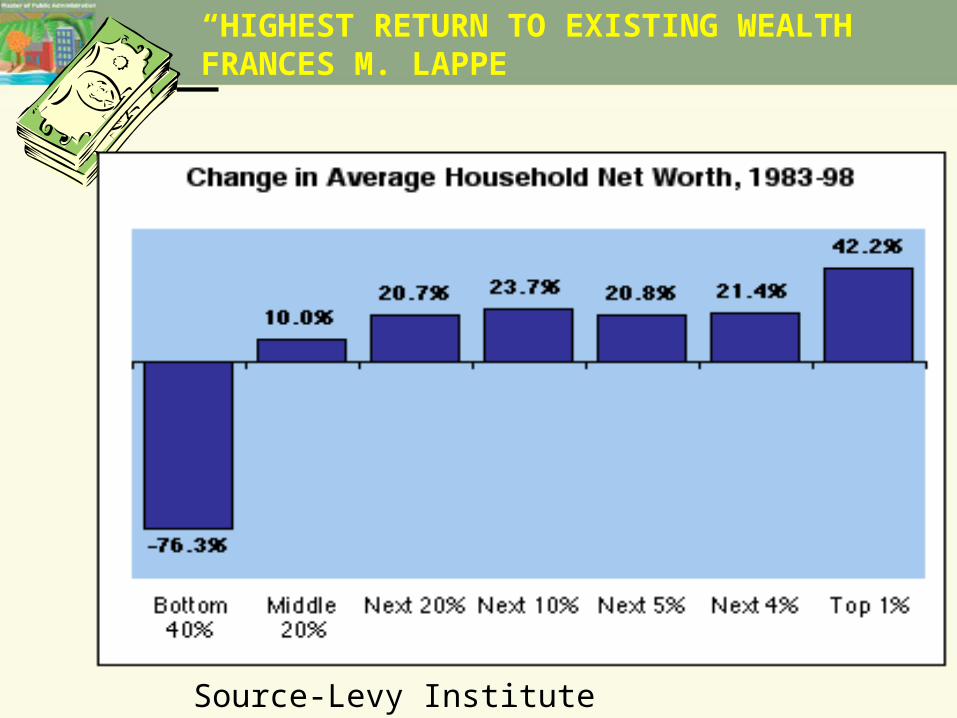
Source-Levy Institute
“HIGHEST RETURN TO EXISTING WEALTH”FRANCES M. LAPPE

CHOICES TO DEAL WITH INEQUALITY?
1. STATE SOCIALISM (COMMUNISM)
2. WELFARE CAPITALISM? ROBIN HOOD(SCANDINAVIA)
3. COMMON ASSETS TRUSTEESHIP & FREE ENTERPRISE
COMMON ASSETS WHAT ARE THEY?

COMMON ASSETS-NATURE
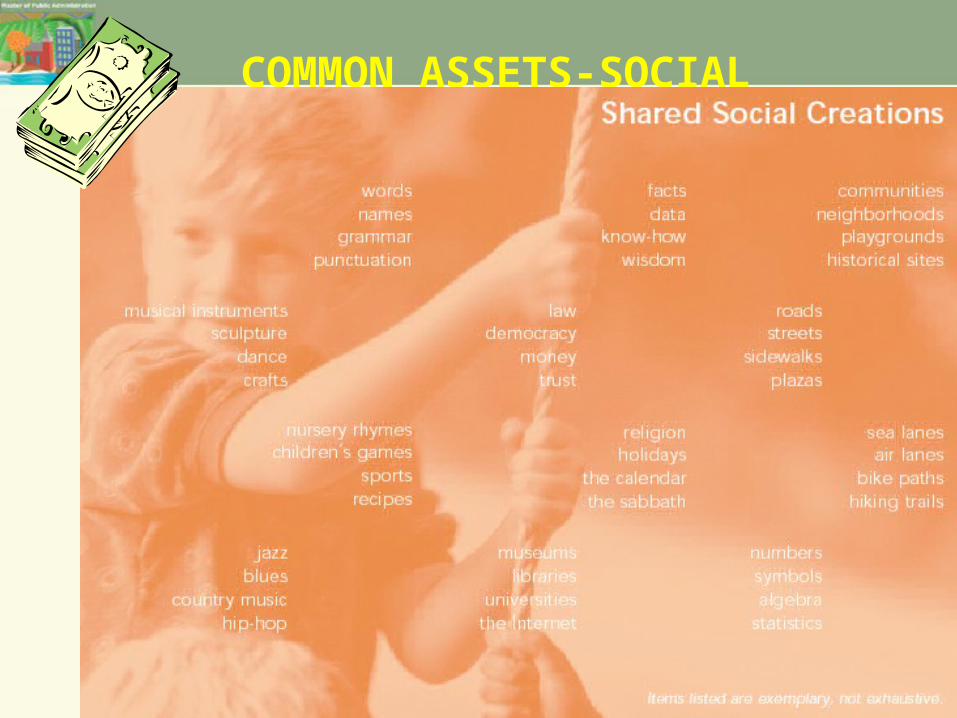
COMMON ASSETS-SOCIAL

ASSAULT ON THE COMMONS

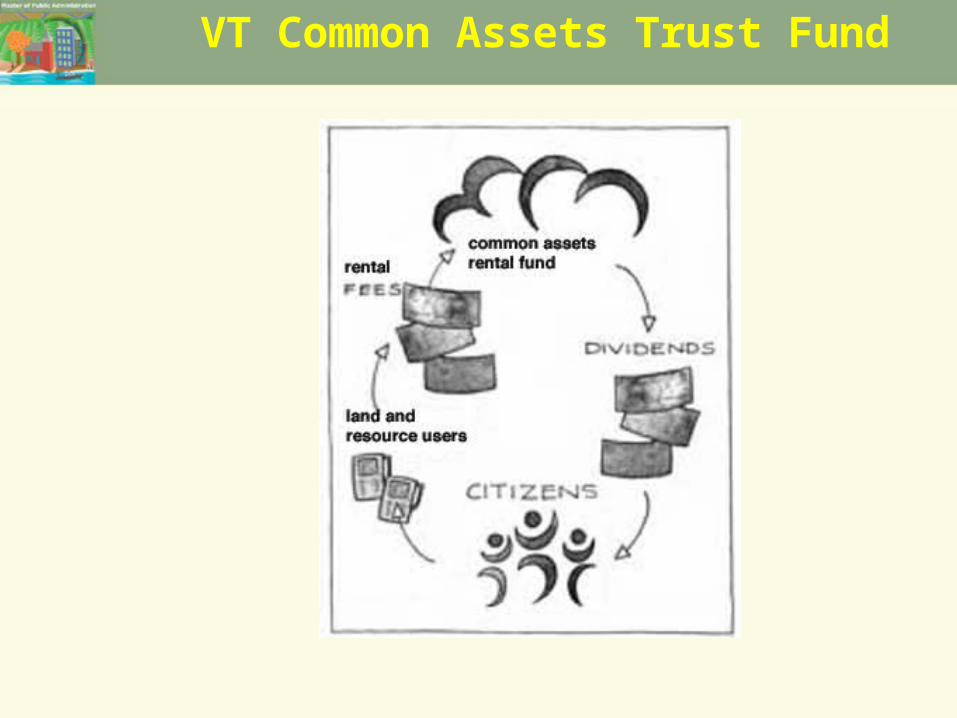
Common Assets Trust Fund
Thomas Paine, Agrarian Justice 1797“Men did not make the earth...it is
the value of the improvements only, and not the earth itself, that is individual property...Every proprietor owes to the community a ground rent for the land which he holds.;...from this ground rent...I...propose to create a national fund, out of which there shall be paid to every person...a sum.”
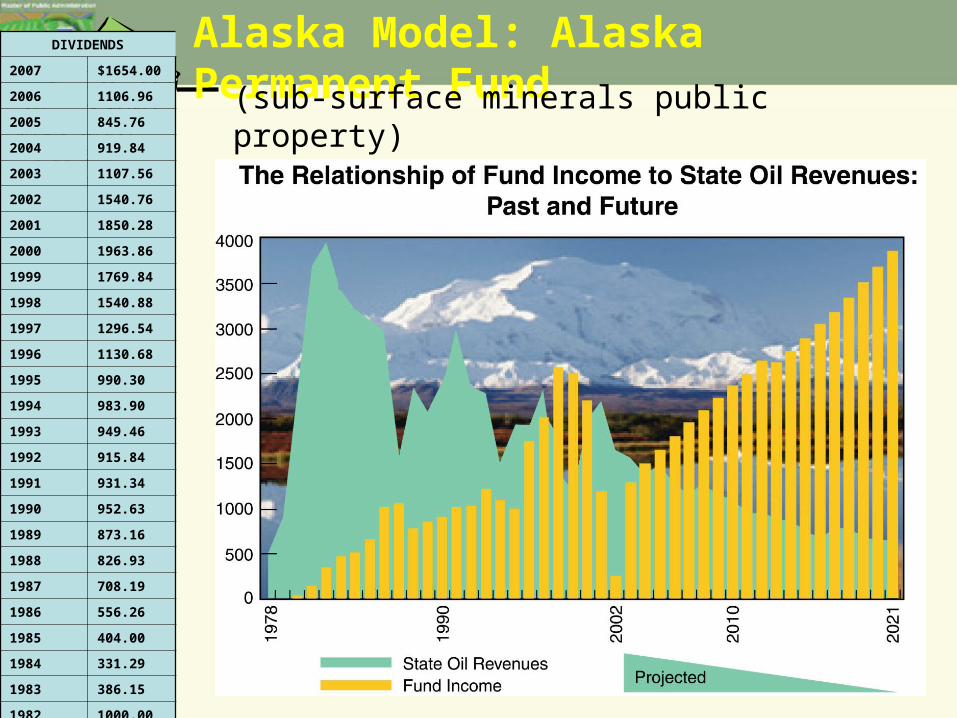
Alaska Model: Alaska Permanent Fund
(sub-surface minerals public property)
DIVIDENDS
2007 $1654.00
2006 1106.96
2005 845.76
2004 919.84
2003 1107.56
2002 1540.76
2001 1850.28
2000 1963.86
1999 1769.84
1998 1540.88
1997 1296.54
1996 1130.68
1995 990.30
1994 983.90
1993 949.46
1992 915.84
1991 931.34
1990 952.63
1989 873.16
1988 826.93
1987 708.19
1986 556.26
1985 404.00
1984 331.29
1983 386.15
1982 1000.00

Alaska Model: Alaska Permanent Fund

2000 Gini by State
0.000
0.100
0.200
0.300
0.400
0.500
0.600
AlaskaUtah
Wisconsin
New Hampshire
Iowa
VermontIndianaNebraskaMinnesota
Idaho
Wyoming
North Dakota0
Delaware
South Dakota
MarylandMaineHawaiiKansasNevadaMontana
Washington
OregonColoradoMichigan
Ohio
MissouriVirginiaArizona
North CarolinPennsylvaniaSouth Carolina
Oklahoma
Illinois
Rhode Island
ArkansasNew JerseyNew Mexico
Georgia
Massachusetts
Tennessee KentuckyWest Virgini
TexasFloridaCaliforniaAlabama
ConnecticutMississippiLouisianaNew York
DC

Increase in GINI (inequality) 1969-2000
0.0%
5.0%
10.0%
15.0%
20.0%
25.0%
30.0%
35.0%
40.0%
45.0%
AlaskaMississippi
South Dakota
Arkansas
North DakotaOklahoma
Florida
New Mexico
VirginiaTennessee KentuckyNebraskaLouisiana
KansasIowa
AlabamaGeorgia
South CarolinaNorth Carolin
MissouriIdaho
MinnesotaHawaiiTexas
VermontArizonaDelaware
Utah
MarylandMontanaColoradoWyoming West Virgini
WisconsinOregon
DC
Washington New Hampshire
NevadaIndianaMaine
California
OhioIllinois
Michigan
Rhode IslandNew Jersey
New YorkPennsylvaniaMassachusetts
Connecticut

Sky-trust
Rent Loop
BARNES-US Sky-Trust-CAP/TRADE

Capitalism 3.0: US Common Asset Trust
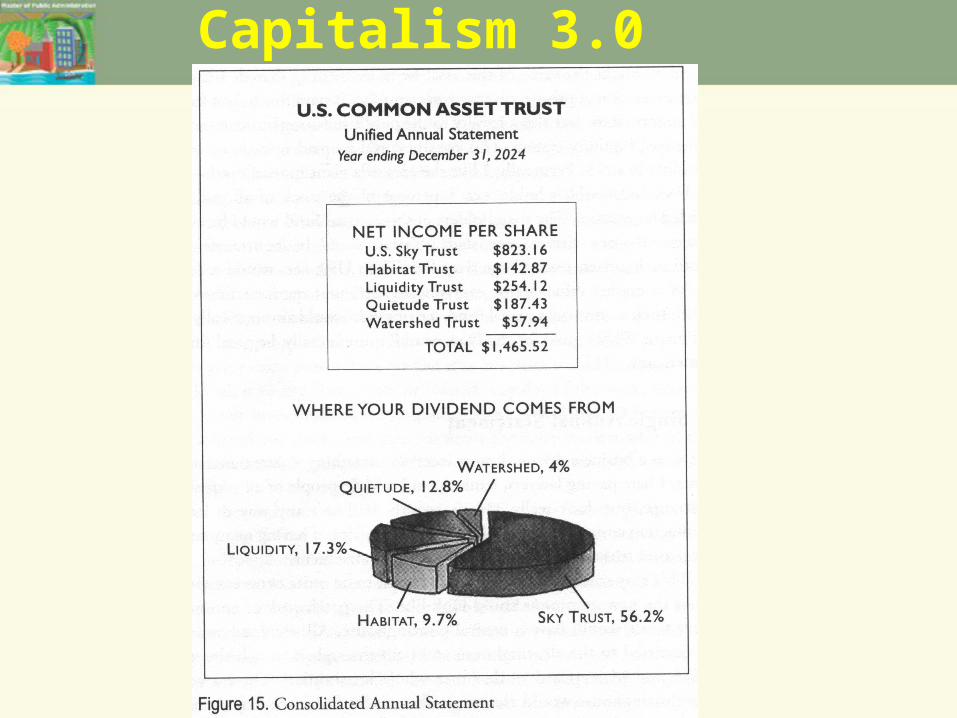
Capitalism 3.0

VT ASSETS-Natural
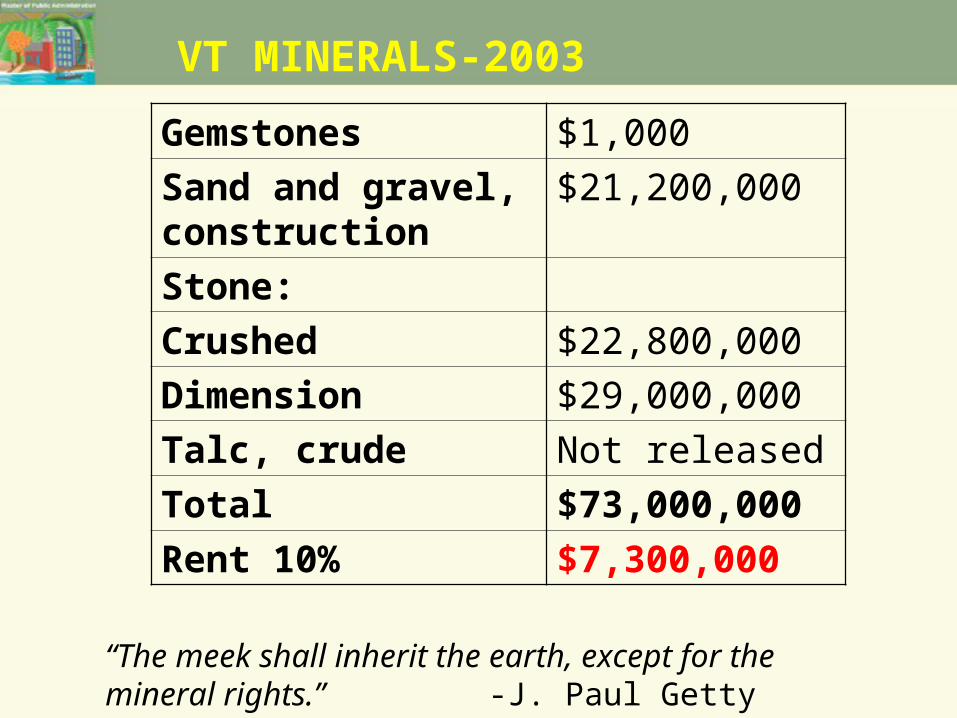
Gemstones $1,000
Sand and gravel, construction
$21,200,000
Stone:
Crushed $22,800,000
Dimension $29,000,000
Talc, crude Not released
Total $73,000,000
Rent 10% $7,300,000
VT MINERALS-2003
“The meek shall inherit the earth, except for the mineral rights.” -J. Paul Getty

VT FORESTS
FORESTS (cords-2002)
791,035
x $50/
Cord =
$39,551,750
x 10%=
$3,955,175
Public Forests
(2004)
$622,371
x10% =
$62,237
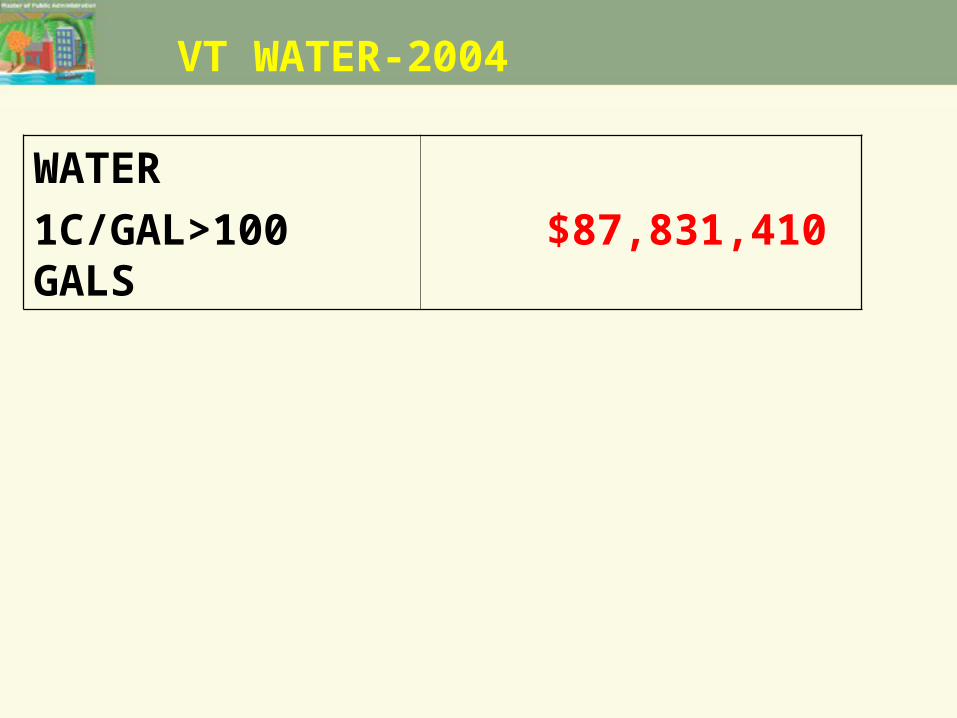
VT WATER-2004
WATER
1C/GAL>100 GALS $87,831,410

VT LAND-2004
VT LAND VALUE $14,928,311,688
RENT 1% $149,283,117

VT ASSETS-Social

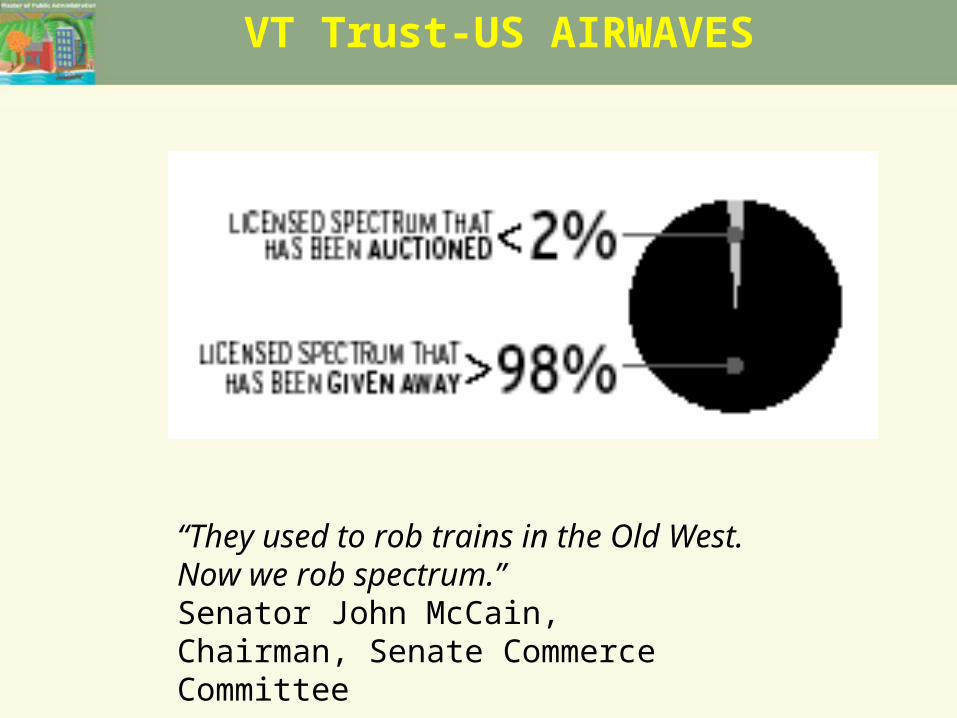
VT Trust-US AIRWAVES

VT Trust-US AIRWAVES
VT Trust-US AIRWAVES
“They used to rob trains in the Old West.Now we rob spectrum.”Senator John McCain,Chairman, Senate Commerce Committee

VT Trust-US AIRWAVES
TOTAL US SPECTRUM VALUE $771,000,000,000US population 294,712,028VT population 619,107ratio 0.21%VT Value $1,619,653,939
10% RATE 10%ANNUAL RENTAL VALUE $161,965,394
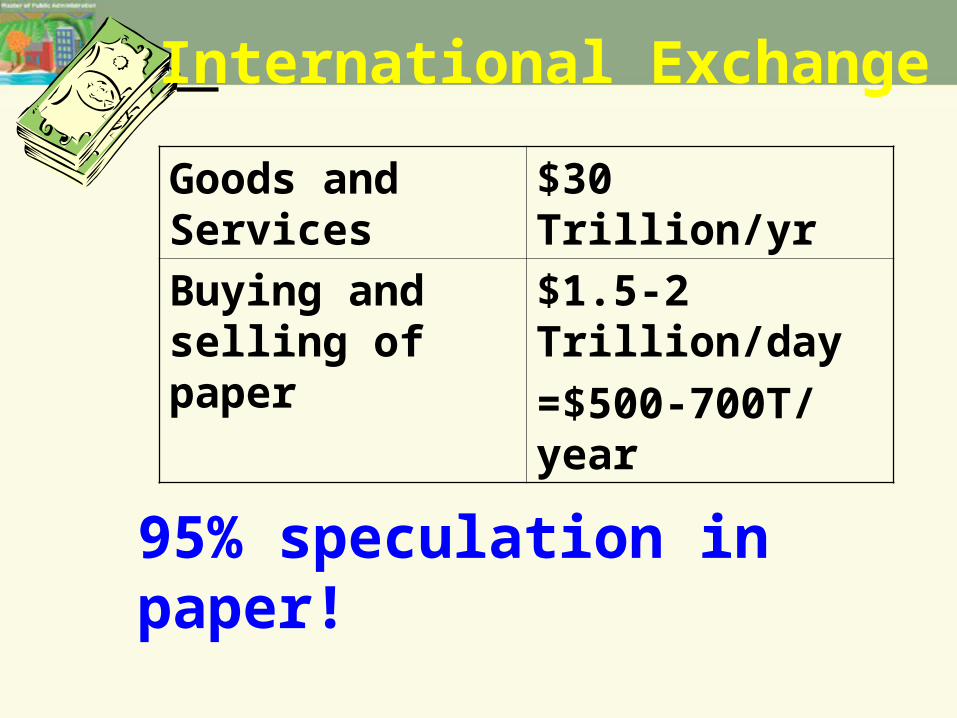
International Exchange
Goods and Services
$30 Trillion/yr
Buying and selling of paper
$1.5-2 Trillion/day
=$500-700T/year
95% speculation in paper!

VT TRUST-US financial Speculation
Current Trading Projected Tax Rate Revenue(Annual Rates) Volume AfterTax Volume (both sides) Stocks $11 trillion $7.3 trillion 0.5% $36.5 billionGovernment Bonds $41.6 trillion $27.7 trillion 0.1% $27.7 billionCorporate Bonds $22.1 trillion $14.7 trillion 0.1% $14.7 billionFutures Contracts $100 trillion $66.7 trillion 0.02% $13.3 billionCurrency $200 trillion $133.3 trillion 0.1% $33.3 billion
(worldwide) (U.S. share = 25%)Swaps $22 trillion $14.7 trillion 0.02% $2.9 billionOptions Not available NA 0.01% NA
Total US Revenue (.25% RATE) $128.4 billionx .21%
Vermont Revenue $268,891,964
Source: Taxing Financial Speculation: Shifting the Tax Burden From Wages to Wagersby Dean Baker. February 2000. Ctre for Economic & Policy Research

WHO CREATES MONEY? (SEIGNORAGE)
GOVT
(CURRENCY)
$600 BILLION 7%
BANKS
(LOANS)
$8 TRILLION 93%
TOTAL $8.6 TRILLION
100%
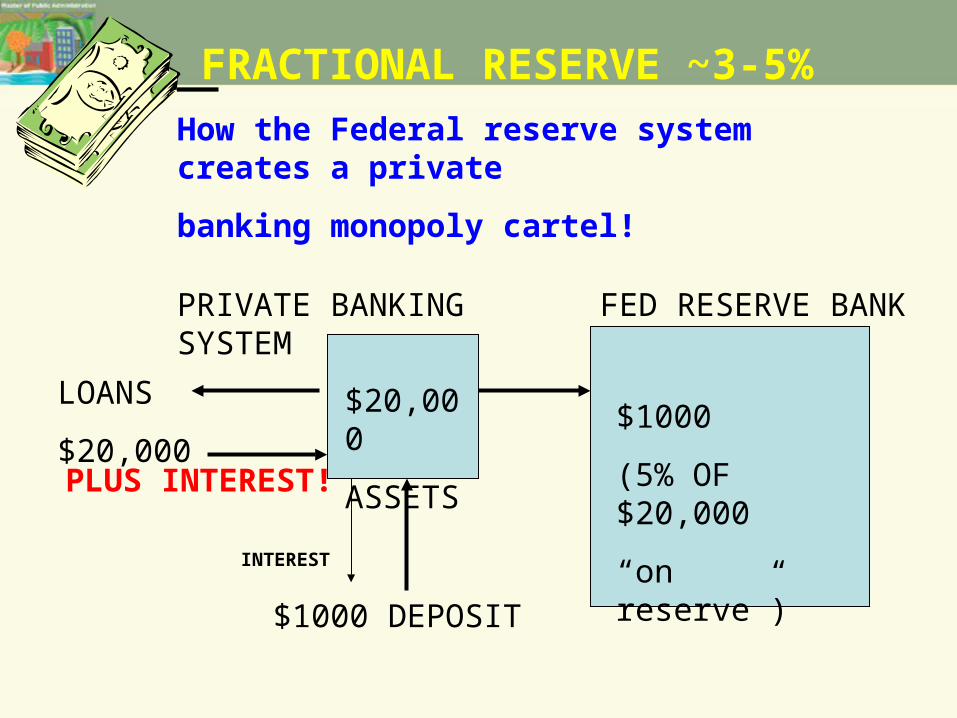
FRACTIONAL RESERVE ~3-5%
FED RESERVE BANKPRIVATE BANKING SYSTEM
$1000 DEPOSIT
$1000
(5% OF $20,000
“on reserve”)
LOANS
$20,000
$20,000
ASSETS
INTEREST
PLUS INTEREST!
How the Federal reserve system creates a private
banking monopoly cartel!

VT MONEY CREATION
VT BANKS
(LOANS)
$3,574,450,000
1% RATE $35,744,500

VT Carbon Emissions
2006 est 6.5 Million metric tons x $30/ton = $195 million
(10,172 metric tons from power plants)Source: Data, EIA, State Energy Data System
12-12-07
CCX: $2.10 (voluntary offsets)
ECX: €22.52 = $33.08 (mandatory)

VT INTERNET ACCESS
WEB SERVERS AND EMAIL ACCOUNTS?
???????????????
Created by Public financing through DARPA.
Public deserves a return on their investment:
Share of access, not commerce:
VT Common Assets Trust Fund

VT Common Assets TOTAL
MINERALS-10% $7,300,000
PUBLIC FORESTS $62,237
WATER -1c/gallon) $87,831,410
LAND-1% $149,283,117
SPECTRUM-10% $161,965,394
SPECULATION-.25% $268,891,964
MONEY-1% $35,744,500
CO2 $195,000,000
INTERNET ? ???????????
TOTAL $906,078,622
Vermont pop 2006 est 623,908Dividend each $1,452.26

COMMON ASSET DIVIDENDS