voxflotation - ammattikorkeakoulut - theseus
TRANSCRIPT

Bui Quoc Hung
VOxFlotation: Future Solution for Water Treatment
Helsinki Metropolia University of Applied Sciences
Bachelor of Engineering
Environmental Engineering
Thesis
05/05/2017

Abstract
Author(s) Title Number of Pages Date
Bui Quoc Hung VOxFlotation: Future Solution for Water Treatment 50 pages + 2 appendices 5 May 2017
Degree Bachelor of Engineering
Degree Programme Environmental Engineering
Specialisation option Water, Wastewater and Waste Treatment Technology
Company SansOx Ltd
Instructor(s)
Jukka Hakola, Company Supervisor, SansOx Ltd Kaj Lindedahl, Principal Supervisor, Metropolia UAS Jarno Leivonen, Experiment Mentor, SansOx Ltd
Flotation is one of the most widely used approaches in water and wastewater treatment
technology. Flotation is utilized in separating suspended matters such as solids and oils
from water. There are variety of flotation methods depending on treatment targets and
purposes. Among those, Dissolved-Air Flotation (DAF) is believed to be the most com-
monly applied. Several advantages compared to sedimentation make DAF more prefer-
ably used. On the basis of DAF but with highly intelligent technology, SansOx Ltd has
developed a new and unique flotation technology, known as the VOxFlotation, which is
totally distinguished from any ever-known flotation system. All-in-one feature, small foot-
print, energy-efficiency, and cost-saving are the most important expectations from the
VOxFlotation.
The objective of this thesis was to design a small-scale VOxFlotation system and to test
the solids removal efficiency of the technology when treating the synthetic wastewater
sample. The Design of Experiment (DOE) was conducted in the way that varies two
quantitative variables in the VOxFlotation design: the diameter of nozzles (X) and the
compressed-air pressure (P) to see how those factors would influence on the final Solid
Removal Efficiency (SRE) of the system as well as their correlation. At last, the direction
for optimizing the process would be predicted.
The experiment results show that, generally, the designed VOxFlotation acceptably per-
formed the solid removal although the maximum achieved SRE was only about 54%.
Also, summary from regression model illustrates that the variables have significant influ-
ences on the removal efficiency and there is clear interaction between two variables.
Higher removal efficiency is expected to be achieved at both higher diameter and com-
pressed-air pressure. In brief, those interpretations can provide SansOx basic infor-
mation and good starting points for their further testing with VOxFlotation system.
Keywords SansOx, DAF, OxTube, VOxFlotation, flotation cell, turbid-ity, coagulant, nozzles’ diameter, compressed-air pressure, DOE, 2N design, regression, optimization
Contents
1 Introduction 1
1.1 Overpopulation, Reasons, and General Consequences 1
1.2 Water Availability on Earth 2
1.3 Overpopulation Resulting in Different Water Issues 3
1.4 Overview on Modern Water Treatment Technology 4
2 SansOx Ltd Introduction 4
3 Goals and Scope 5
4 Theory Review 6
4.1 History of Flotation 6
4.2 Classification on Flotation Process 7
4.3 Theory Behind Flotation Process 7
4.4 Mining Flotation- Froth Flotation (FF) 9
4.4.1 Definition 9
4.4.2 Common Terms 10
4.4.3 Process Description 11
4.5 Water Flotation- Dissolved-Air Flotation (DAF) 12
4.5.1 Basic Concept 12
4.5.2 Process Description 13
4.5.3 Application 14
4.5.4 Design Criteria 14
4.5.5 Advantages and Disadvantages 17
4.6 Induced Gas Flotation (IGF) 17
4.7 VOxFlotation 18
4.7.1 Overview 18
4.7.2 Process Description 19
4.7.3 OxTube 21
4.7.4 General Evaluation 23
4.8 Water analysis parameters 23
5 Experimentation 25
5.1 Synthetic Wastewater Sample Preparation 25
5.2 Wastewater Sample Analysis and Jar-testing Procedure 25
5.2.1 pH 25
5.2.2 Turbidity 25
5.2.3 Jar-Testing Procedure 26
5.3 VOxFlotation System Components 28
5.3.1 Assembling the OxTube 28
5.3.2 Flotation Cell 29
5.3.3 Pump 29
5.3.4 Nozzles 30
5.3.5 Compressed-Air 30
5.3.6 Chemical Feed 32
5.3.7 Pipes and Other Tools 33
5.4 VOxFlotation System Design 33
5.5 Weir and Effluent Design 34
5.6 Experiment Description 35
5.7 System Variables Formulas 36
5.8 Design of Experiment (DOE) 38
5.8.1 General Introduction to Mathematical Modelling 38
5.8.2 Design of Experiment (DOE) 38
6 Results and Analysis 40
6.1 Process Variables 40
6.2 Jar-Testing Results 41
6.3 DOE Results 41
6.3.1 Interpretation 41
6.3.2 Data Plotting and Pair-wise Interaction Analysis 43
7 Discussion and Limitations 46
7.1 Discussion 46
7.2 Limitations and Recommendations for Improvement 46
References 48
Appendix 1. R-Command for creating the model and making Plots
Appendix 2. Meeting between SansOx and Metropolia for cooperation in testing VOxFlotation as thesis-work at Metropolia Laboratory

List of Figures
Figure 1.Water availability on earth (Environmental Canada, 2005) .............................. 2
Figure 2. SansOx Logo (A) and their awards (B) (SansOx Brochure, 2016).................. 5
Figure 3. Overview diagram of a typical FF (Shibang Machinery, n.d.) ....................... 10
Figure 4. Diagram of a Typical DAF unit (Frcsystem.com, n.d.) .................................. 13
Figure 5. Overall VOxSton system and VOxFlotation system (right-hand-side part)
(SansOx Brochure, 2016) ........................................................................................... 18
Figure 6. Diagram of a single VOxFlotation Unit (section view and plan view) (SansOx
Brochure, 2016) .......................................................................................................... 19
Figure 7. Parallel-DAF system with two combined single units (SansOx Brochure, 2016)
................................................................................................................................... 21
Figure 8. OxTube Design (SansOx Brochure, 2016) ................................................... 22
Figure 9. Performance of OxTube in air dissolving (SansOx Brochure, 2016) ............. 22
Figure 10. pH-sensor (A) and turbidity meter (B)......................................................... 26
Figure 11. Lovibond jar-testing device ........................................................................ 27
Figure 12. Assembling the OxTube ............................................................................. 28
Figure 13. Flotation Cell (A) and Pump with maximum 7500 L/h- 400W-500 m (B) ..... 29
Figure 14. Nozzles (A), nipples and reducers (B), and air-flow meter (C) .................... 31
Figure 15. Chemical feed and gas feed ...................................................................... 32
Figure 16. Flotation part with section view (A) and plan view (B) ................................ 33
Figure 17. Weir and effluent design with section view (A) and plan view (B) ............... 34
Figure 18. VOxFlotation system overiew ..................................................................... 35
Figure 19. Contour plot for model in coded unit (A) and physical unit (B) .................... 44
Figure 20. Removal Efficiency plotted against diameter and pressure ........................ 45
List of Tables
Table 1. Operation Parameters for DAF Units (Nguyen, 2014) ................................... 14
Table 2. Pros and cons of DAF system compared to sedimentation (Nguyen, 2014) .. 17
Table 3. Adding volume of ferric sulfate for each beaker ............................................. 27
Table 4. Design of Experiment in physical unit ............................................................ 39
Table 5. Design of Experiment in coded unit ............................................................... 40
Table 6. System variables (all units were conversed accordantly during calculation) .. 40
Table 7. Experimental results...................................................................................... 41

Abbreviation
DAF: Dissolved-Air Flotation
SansOx Ltd: SansOx Limited
DOE: Design of Experiments
SRE: Solid Removal Efficiency
X: Diameter of Nozzles
P: Compressed-air Pressure
Al2(SO4)3.7H2O: Aluminum Sulfate Hexahydrate

Acknowledgement
Generally, I would like to kindly say thank you to all people, without the enormous con-
tribution of whom, this study could not be possibly completed. Especially, I would like
express deep appreciation to the following organizations and persons.
Firstly, I would like to say thank you to SansOx Limited, the company that invented
VOxFlotation system project- my thesis topic. It would be a big honour for myself to be
responsible for conducting such a big project, from which basic information and starting
points can be given back to SansOx for their further invention. Especially, I would like to
appreciate Mr. Jukka Hakola, Commercial Director at SansOx Ltd, who provided the op-
portunity to research the topic as well as promoted the process and provided me with all
needed equipment. Also, I would like to say gratefully say thank you to Mr.Jarno Leivo-
nen, from Project Development at SansOx, who was my main technical consultant for
the experimental stage. Jarno’s understanding and support was really endless and ap-
preciated.
Secondly, I would like to say thank you to Metropolia UAS, which has provided me with
great education throughout 4 years as well as the outstanding facilities for conducting
experiments. Especially, I would like to show my respects to Mr.Kaj Lindedahl, Senior
Lecturer at Metropolia and also my supervisor, who was the main inspector during my
practical work at the Environmental Laboratory. Also, I would like to thank you Mr.Veli-
Matti- Applied Mathematics Lecturer at Metropolia for consulting me in the DOE part as
well as was the creator of DOE_function, and my best friend Loc Huynh, whose assis-
tance in building the system was priceless. Besides, with the help of Ms Minna
Paananen-Porkka- English Teacher at Metropolia, my writing was ensured to be aca-
demic and grammatically correct. And there are still many people whose names cannot
be all enumerated, but their contributions were priceless.
Finally, I would like to express my big love to all relatives, friends, and especially my
parents, who are always in my side and support me financially and mentally during the
last 4 years studying abroad. Thank you very much!
Sincerely
Hung Bui

1
1 Introduction
1.1 Overpopulation, Reasons, and General Consequences
At the moment of writing this sentence, the world population reaches approximately
7,500,000,000 people (Wolrdometers, 2017). Compared to the year 1959, only half-a-
century ago, the world population has doubled, and it is estimated to become 9 billion in
the next over 20 years (United Nations Population Division, 2008). High birth-rate and
improvement in food production are believed to be the two most important factors con-
stituting this rapid growth. Besides, together with the development of science and tech-
nology in medicine, the infant mortality has been reduced considerably. As a result, pub-
lic health has been improved, and conventionally people can now enjoy even longer life
expectancy than in the past. This condition would be so-called overpopulation a very
popular term nowadays.
Eartheclipse.com (n.d.) defines overpopulation as: “Overpopulation is the state whereby
the human population rises to an extent exceeding the carrying capacity of the ecological
setting”. Thus, it would be said overpopulation has been resulting in millions of different
issues, in terms of both short-term and long-term effects, predominantly pressing the
environment into more stress. Urbanization, production and exploitation activities from
humans are contributing to diminishing in environment quality as well as other environ-
ment issues. For instance, deforestation, ecological destruction, mass extinction, envi-
ronmental pollution, and global warming are some common terms which can be heard
every day and everywhere through media channels nowadays, but probably even not
enough to raise people awareness. We, human beings, have not stopped our destruction
activities yet, and we do not have to wait long to see beforehand the consequences.
Absolutely, it is no need to wait until next generation, we are already witnessing some
results of our cruel actions against nature. Fossil fuels such as oils are running out, which
means we will soon have nothing to even lit up bulbs in our room. Air pollution and water
pollution are threatening our life every second with many new diseases and cancers
which medicals have not found effective remediation. Also, we are now experiencing
more and more society problems and conflicts due to the imbalance in development
among countries. In brief, although it seems to contradict the outcomes from the devel-

2
opment, life expectancy will be surprisingly shorter in next generations, where an extinc-
tion may totally be possible. If we do not act as soon as possible, “Life expectancy will
be the shortest in fastest growing countries.” (David E. Bloom, 2011).
1.2 Water Availability on Earth
As a universally accepted truth, water is the most primary and essential element for life
to exist. All living species, included human being who is always proud of their intelligence,
cannot survive without water. We do not only need water for basic survival as other ani-
mals, we even strongly rely on water to take part in all aspects of our life, for example:
cooking, taking bath, irrigation and production. Thus, human being is the species who is
the most vulnerable to water problems. On this planet, there is just 2.5 % of fresh water
beside 97.5 % salt water (Figure 1). In 2.5 % of usable water, groundwater accounts for
the most amount we can use directly compared to just 1% of surface water (the largest
source is 68.7 % but in ice or glaciers form) (Environmental Canada, 2005).
Figure 1.Water availability on earth (Environmental Canada, 2005)

3
1.3 Overpopulation Resulting in Different Water Issues
Among the previous mentioned consequences caused by overpopulation, those relating
to water issues are the most clearly seen and do cause the most adverse effects. As the
population increases and the expansion of urban area as well as production activities as
described previously, water demand also rises drastically, for both domestic and indus-
trial use. Thus, as a result, demand for wastewater treatment also increases since much
more discharge is produced.
Among the environmental factors, the water resources seem to be the most vulnerable
one to human activities simply because we are living very near the water sources. The
water resources might be very diverse; they are not limitless nevertheless. These days,
the water resources are most contaminated by human activities than ever before. Unfor-
tunately, not everyone is aware of water contamination although we are now suffering
tons of serious consequences from polluted water. “We never know the worth of water
till the well is dry.” (Fuller, n.d.). Water-stress, the term that refers to a lack of access to
clean water sources, are now threatening many parts of the world, especially in Africa
and Asia. A total of 37 countries are now facing “extremely high” level of water-stress
(Water Resources Institute, 2013). Climate change and over-exploitation are believed to
be the two main causes.
The next issue is water contamination. The natural water resources quality is diminishing
seriously due to human activities, such as solid waste from municipality, fertilizers and
pesticides from agriculture, as well as wastewater from industrial plants without proper
treatment directly discharged to nearby lakes or rivers. Once being contaminated, espe-
cially the groundwater aquifers, are inevitably very difficult to clean and remediate (Har-
ter, 2012).
Fortunately, we are now more aware of our mistakes. Governments from many countries
are increasingly concerned about environment and water-related issues. More legislation
and policies have been established to have stricter inspection and effective environmen-
tal management. More agreements have been archived to limit and control the waste
discharged into environment and water resources. Especially, scientists are making
much effort to improve the present water treatment methods as well as innovate new
approaches which are more efficient, small footprint, and energy-efficient.

4
1.4 Overview on Modern Water Treatment Technology
Nowadays, along with the growing demand for water treatment as well as development
in technology, we have a variety of choice to select accordant treatment methods, in
terms of both potable water treatment and wastewater treatment. Basically, the water
treatment methods can be classified into mechanical, physical, chemical, and biological
methods. Mechanical methods are screening, sedimentation, and flotation. Physical
methods can be filtration and membrane treatment. Popular chemical treatment ap-
proaches are coagulation, flocculation, and disinfection. As to biological methods, the
conventionally used activated sludge growth, is believed to be the most commonly used
method in many wastewater treatment plants. However, in practical application, water
treatment is accomplished through the combination of the above-mentioned methods. A
typical treatment process consists of many treatment units, each of which is responsible
for different roles.
Among the above-mentioned methods, flotation is very widely used nowadays. It is uti-
lized because of its many remarkable advantages. SansOx Ltd has recently developed
a new flotation technology, a new way to perform flotation as they emphasized. VOxFlo-
tation, as SansOx calls its innovation is expected to totally change the future for water
treatment.
2 SansOx Ltd Introduction
Originally, SansOx Limited is a part of the Finnish Cleantech Cluster of companies, which
is a very big group of companies in Finland who do business in fields of water treatment
and environment technology. After being founded in 2012, SansOx Ltd is growing
strongly and becoming one of the most successful start-up companies in Finland with
wide vision and clear growth-orientation.
Constantly, SansOx is always trying to create new innovations and solutions, even from
old things, in order to develop products that are optimal for the various needs of their
customers. Aiming at bringing cost-effective solutions, quality improvement, and genuine
added value to customers.
SansOx’s main business is to develop innovative applications for intelligent water treat-
ment. SansOx’s products are applied very widely in potable water treatment, process

5
water treatment, and fish farming. Customers of SansOx are global and vary in different
industrial branches, mostly water technology and fish farming companies. Some well-
known products from SansOx are the OxTube, SaoxFuge, and VOxFlotation. Recently,
SansOx has been the double winner of EU Innovation Award: OxTube for 2014 and
SaoxFuge for 2015, which are considered as the most highlighted successes SansOx
has achieved (Figure 2).
SansOx’s current official main office is at Lönnrotinkatu 32 E, 00180 Helsinki.
Figure 2. SansOx Logo (A) and their awards (B) (SansOx Brochure, 2016)
3 Goals and Scope
The objective of this thesis was to examine the influences of different design parameters
on the performance of the entire VOxFlotation system, from which the optimum design
criteria will be drawn. The reason was believed to be the unreasonable selection of those
parameters when designing the system. Thus, in this study, some parameters are varied
by some alternative values to see how they affect the system efficiency as well as each
other, in a set of experiments so-called Design of Experiment (DOE).
There are many process variables involved in the performance of the flotation system.
These variables are temperature, pH, air pressure, water characteristics, and chemical
dose. However, it is absolutely too huge for the scope of Bachelor’s thesis when taking
all those parameters into consideration. Thus, in the scope of this study, some parame-

6
ters are determined and fixed to be less complicated. In the preparation stage, the syn-
thetic wastewater sample was prepared. The aluminium sulphate coagulant was added
into the water to better the process performance. To determine the suitable dose, jar-
testing was performed.
In the DOE, two quantitative variables in the VOxFlotation design: the diameter of noz-
zles (X) and the compressed-air pressure (P) were varied to see how those factors have
influences on the final Solid Removal Efficiency (SRE) as well as their correlation and
direction for optimization. The 2 N design was used to design the experiments. All exper-
iments were conducted and carefully inspected at Metropolia Environmental Laboratory,
with the support from SansOx and instruction from the principal supervisor.
4 Theory Review
4.1 History of Flotation
The history of flotation comes from a technically stagnant problem in mining industry
during 19th century. Klassen and Mokrousov (1963) described flotation as: “…one of the
most outstanding achievements in 20th century technology”. During the end of 19th cen-
tury, as the demand for metals substantially increasing on account of the development
of heavy industries, the world was running out high-grade ore. Basic technologies for
extraction at that time were only gravity methods, which seemed to be impossible and
unprofitable when dealing with low-grade ore and waste rocks. This was said to put the
mineral industry into stagnant condition and then pose challenge for engineers and sci-
entists to innovate a new approach. Flotation was then invented, as a result of which the
history development can be divided into three main stages (Habort, 2010):
From 1860 to 1900
The first commercial flotation plant was built by the Bessel Brothers in Dresden, Germany
in 1877 to clean graphite ore (Graichen, 1977). Another flotation plant to process sulfide
ore was developed by Carrie Everson, but it was not commercially successful like that of
the Bessel Brothers.

7
From 1900 to 1925
In 1905, the world’s first froth flotation was built at Broken Hill, which also brought sub-
stantial commercial success. Continuing with those achievements, the United States and
Britain also innovated successfully their technology. Without the invention of the froth
flotation, nowadays cheap metals such as copper and zinc should have been extremely
costly and rare (Bunyak, 2000).
From 1960 to now
Along with the development of science, such as X-ray and radioisotope, several research
could be conducted in order to improve and provide a better control and optimization for
the flotation process. Nowadays, flotation is not only used in mining industry, but also
widely applied in water and wastewater treatment, which is also the main researching
scope of this thesis.
4.2 Classification on Flotation Process
Nowadays, flotation application is not only limited to mining industry, but it is also utilized
widely in water and wastewater treatment. Actually, there are no absolute benchmarking
for classifying the flotation technology. In this thesis, I am going to recommend one plau-
sible. This classified method is on the basis of which purposes/industries the flotation
technology is utilized for. On the basis of those criteria, flotation can be divided into two
main types: Mining Flotation used in mining industry, from which flotation primarily came
from; and Water Flotation, in which flotation is utilized to treat the water and wastewater.
Mining Flotation is commonly Froth Flotation (FF). Water Floatation includes Dissolved-
Air-Flotation (DAF) and similarly Induced Gas Flotation (IGF). VOxFlotation from SansOx
LTD is also designed basically on the basis of the principles of DAF. Besides, flotation
technology is also applied in oil industry, but this is not going to be mentioned in the
scope of this thesis.
4.3 Theory Behind Flotation Process
Conceptually, the term flotation is named for any concentration processes in which se-
lective hydrophobic materials are separated from hydrophilic materials by ‘floating’ pro-
cess (Jameson, 1992). Conventionally, flotation is used to separate the suspended mat-
ters (solid and liquid), which are insoluble and poorly settable, from the liquid. In typical
flotation process, the particles are adhered onto the air bubbles, which are then floated

8
into the surface if its density is less then water density and removed. Chemicals such as
coagulants can also be utilized to improve the process performance.
Prof. Pylkkänen, Chief Engineer at SansOx Ltd, the creator of VOxFlotation (2016), sug-
gested that the flotation process is absolutely very complicated, but it can comprise three
main steps: collision, attachment, and detachment. He also explained the theory behind
flotation as follows:
Collision
The collision is achieved by particles being within the collision tube of a bubble. The
collision tube refers to the region in which a particle will collide with the bubble, with the
perimeter of the collision tube corresponding to the grazing trajectory. The collision pro-
cess is influenced by two main factors: the velocity and radius of the bubbles.
Attachment
The induction time will be mainly responsible for the attachment process between parti-
cles and bubbles. The particles can adhere to the air bubbles when the time required
for them to bind is larger than induction time, which is primarily affected by: the fluid
viscosity, particles and bubbles size, and the forces between particles and bubbles.
The attachment process could be described by using Young-Duprè Equation (Py-
lkkänen, 2016):
cos ( )lv sv sl (4.1),
where:
ϓlv is the surface energy of the liquid/gas vapor interface
ϓsv is the surface energy of the solid/gas vapor interface
ϓsl is the surface energy of the solid/liquid interface,
θ is the contact angle, the angle formed at the junction between gas, solid, and
liquid phases.
Detachment
The detachment process occurs when the force exerted by surface tension is exceeded
by shear force and gravitation force. Those forces are actually very complicated and vary
depending on the flotation cell. Prof. Pylkkänen (2016) also suggested that high shear
will be experienced close to the impeller of a mechanical flotation cell and mostly gravi-
tational force in the collection and cleaning zone of a flotation column.

9
Collection Efficiency
One parameter which can be used to evaluate the collection efficiency of flotation pro-
cess is determined as Flotation Recovery (R). This value is presented by the probabilities
of collision and attachment of particles to gas bubbles (Pylkkänen, 2016):
2( )4
c
p b
NR
d d Hc
(4.2),
whereas:
i
C cN PN is the product of the probability of the particle being collected, where
P is probability and the number of possible particle collision
dp is particle diameter
db is bubble diameter
H is a specified height within the flotation which the recovery was calculated
c is the particle concentration
4.4 Mining Flotation- Froth Flotation (FF)
4.4.1 Definition
Bunyak (2000) defined in his journal: “The term flotation has been loosely used for all
concentration processes in which heavier mineral particles have been disengaged from
lighter waste particles in water by "floating" the mineral away from waste”.

10
4.4.2 Common Terms
The Figure 3 illustrates a typical FF unit:
Figure 3. Overview diagram of a typical FF (Shibang Machinery, n.d.)

11
Concentrators or Mills
It is named for the place where the flotation process is operated in mining industry.
Slurry and Collector
Slurry (Pulp) is the mixture of ground ore and water. By adding the suitable chemicals,
which is known as collector, the desired minerals can be rendered hydrophobic. For ex-
ample, sodium ethyl xanthate is used as collector in lead and zinc mining.
Flotation cells
Flotation cells are the tanks where the flotation takes place (it is aerated to produce air
bubbles for flotation process). This term will be used many times again in this thesis.
Froth and frothers
The particles after attaching the air bubbles are floated into the surface. This is known
as froth, where the name froth flotation comes from. Frothing agents, known as frothers,
can be added to make the froth formation on the surface stable.
Concentrate
The froth is then removed from the cells, forming concentrate of the desired minerals,
which is also known as con in short.
Flotation tailings or flotation tails
They are referred to the materials which do not float onto the surface.
4.4.3 Process Description
Typically, the principles of operation for froth flotation consists of the following main
stages:
Crushing (Liberation)
The ore will be crushed into the sufficient size so that the targeted minerals can exist as
separate grains. Particularly, the size is around 100 µm, but sometimes it can be smaller
than 7-10 µm (Bowen, 1998).

12
Addition of Chemicals
Particular collectors and frothers are added to optimize the adherence and concentration
process performance.
Air Bubbles Formation
The air bubbles are created by compressed-air and made rise upwards into the surface
of the flotation cell together with attached mineral particles to form the froth, which is then
collected by skimmer arm.
Collection of Concentrates
The final concentrates are then collected and shipped to smelters. Before this step, the
concentrates can be subjected into more flotation stages, known as cleaning in order to
remove more undesired minerals to make the final concentrates “cleaner” (Bowen,
2013). Meanwhile, a stage called scavenging is used for flotation tailings to recover any
minerals that does not float.
Flotation is conventionally conducted in several stages to optimize the recovery effi-
ciency of the minerals in the concentrate and minimize the energy input (Pease, 2013).
4.5 Water Flotation- Dissolved-Air Flotation (DAF)
4.5.1 Basic Concept
Beychok (1967) defined:
“Dissolved air flotation (DAF) is a water treatment process that clarifies wastewaters (or other
waters) by the removal of suspended matter such as oil or solids. The removal is achieved by
dissolving air in the water or wastewater under high pressure and then releasing the air at atmos-
pheric pressure in a flotation tank basin. The released air forms micro bubbles which adhere to
the suspended matter causing the suspended matter to float to the surface of the water where it
may then be removed by a skimming
device.”
Basically, DAF looks very identical to the FF principles discussed above, since all kinds
of flotation share the same principles. The difference is only the area that flotation is
applied, which means which type of materials we would like to concentrate or remove.
13
In mining industry (FF), the target is to make desired minerals from the ore floated onto
the surface to be collected and utilized. Meanwhile, in water treatment (DAF), the objec-
tive is to separate the suspended solids (SS) from the water to make it clean. Thus, the
floated matters are the waste in this case. Nowadays, DAF is very widely applied in
treating the discharge from oil refiners, petrochemical, pulp and paper, and other indus-
tries. Historically, and surprisingly, it was Finland where the first DA was used in potable
water treatment during the 20s of last century (ADKA and Sveen-Pedersen). Nowadays,
DAF is believed to be one of the most widely used water treatment method all over the
world, especially in Nordic countries, UK and US. (Nguyen, 2013)
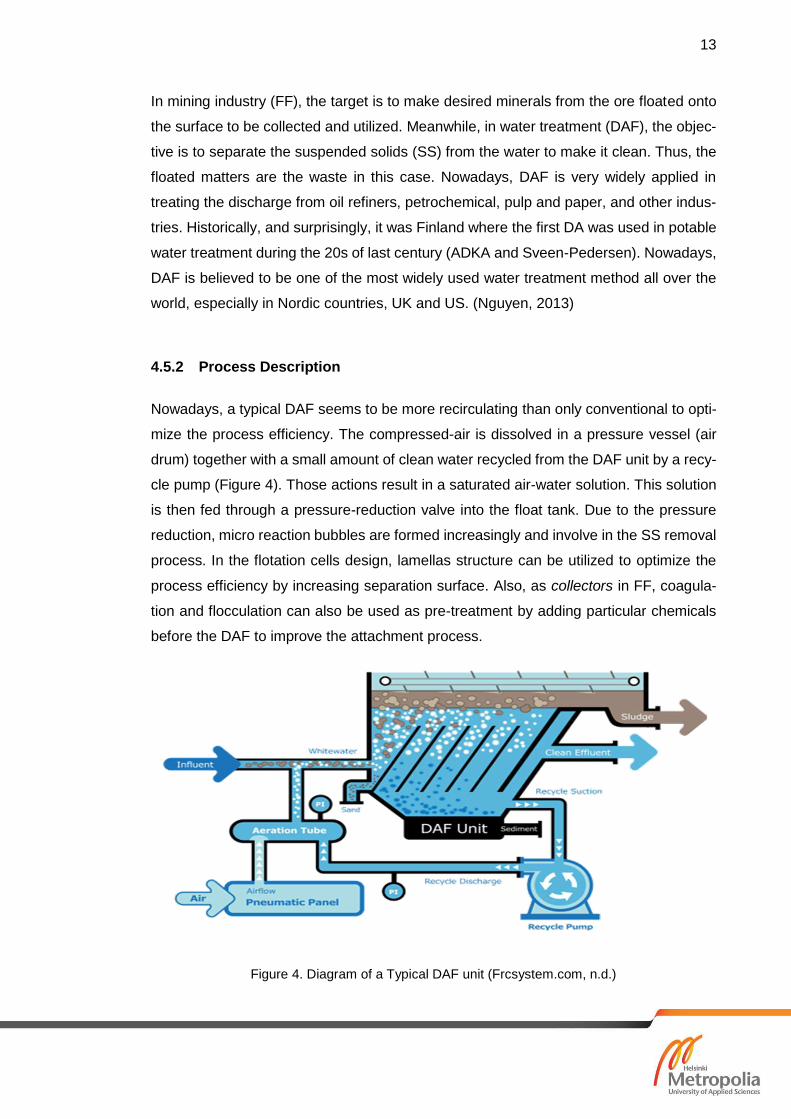
4.5.2 Process Description
Nowadays, a typical DAF seems to be more recirculating than only conventional to opti-
mize the process efficiency. The compressed-air is dissolved in a pressure vessel (air
drum) together with a small amount of clean water recycled from the DAF unit by a recy-
cle pump (Figure 4). Those actions result in a saturated air-water solution. This solution
is then fed through a pressure-reduction valve into the float tank. Due to the pressure
reduction, micro reaction bubbles are formed increasingly and involve in the SS removal
process. In the flotation cells design, lamellas structure can be utilized to optimize the
process efficiency by increasing separation surface. Also, as collectors in FF, coagula-
tion and flocculation can also be used as pre-treatment by adding particular chemicals
before the DAF to improve the attachment process.
Figure 4. Diagram of a Typical DAF unit (Frcsystem.com, n.d.)

14
4.5.3 Application
The main function of DAF is to remove SS from the water. It is utilized in clarification
after flocculation process, after the aero-tank in activated sludge process, thickening of
sludge, or combined with other treatment processes. Compared to sedimentation, DAF
is conventionally more alternative.
4.5.4 Design Criteria
Practically, from practical experience, operation parameters and design criteria for DAF
can be presented as follow:
Table 1. Operation Parameters for DAF Units (Nguyen, 2014)
The factor Recirculating Water Rate can also be known as Recycle Ratio (RR), which
determines the ratio between the recirculating water flow and treated water flow. Study
conducted by Han (2007) showed that the higher RR is, the higher DAF efficiency will
be. Practically, the RR is conventionally kept at 20% (Nguyen, 2013).
Also, there are other practically important factors which should be carefully considered
when designing DAF system. They are supposed to be TSS contents, bubble size and
bubble concentration volume, chemical dose, and A/S ratio.
Bubbles and TSS
It is very perspicuous that the fundamental characteristics of bubbles and particles has
been studied very carefully as they are certainly two most importance factors contributing
to the DAF efficiency. TSS refers to total suspended solids contents and particle size,
which is also relevant to the water quality. Bubbles factor consists of bubble size and
bubble volume concentration (amount of bubbles).
15
The control of bubble size and amount is of great important in a DAF system since they
directly influence the DAF efficiency. Those values are usually regulated by the com-
pressed-air pressure. Actually, it is very complicated to calculate the optimum bubble
size by pure theory. As a rule of thumb, engineers have found out that the bubble size
should be in range between 10 µm and 120 µm (mini bubbles), and 40 µm is believed to
be the most optimum one (Nguyen, 2013). Besides, apart from the size, the bubbles
should be formed stably with large amount (large volume concentration) in order the
optimize the attachment and flotation process.
The TSS also plays an important role. Jinho (2007) has found in his study that the larger
and larger compared to bubble size the particles size is, the higher the DAF efficiency
will be. Apparently, it is not very difficult to understand in this case, as the particles size
is larger, the collision and attachment probability between particles themselves and with
mini bubbles would increase, which then contributes to improving the DAF efficiency.
That is the main reason why chemical pre-treatment is very essential in both sedimenta-
tion and flotation, which can make the particles concentrate to form larger flocs, which
are then more easily to settle in sedimentation, or float in flotation.
Chemical Dose
As stated above, chemical dose, which involves in coagulation and flocculation process,
is strongly recommended before the flotation to improve the performance. The theory
behind coagulation and flocculation is very complicated, so it is not necessary to be dis-
cussed in detail here. Only one point should be noted that; as has been proven, most of
suspended particles in water have negative charge; hence coagulants which can pro-
duce positive ions are chosen. Nowadays, three coagulation agents are most preferred:
aluminum salt, ferric salt, and PAC. The amount of coagulant added depends on the TSS
concentration in water. Besides, each type of coagulants has their specific conditions
where they perform best: pH, dosing amount, and mixing speed. That is the reason why
those factors are also very important in a DAF process; thus a number of pre-tests should
be conducted to determine suitable values. Those tests are usually known as jar-testing.
Aluminum coagulation agents are aluminum salt, conventionally Al2(SO4)3.18H2O. When
using aluminum coagulant, pH should be in range 5.5-7.5 and temperature is between
20-40oC. Highlighted feasibilities from aluminum coagulant are low-cost and easy to use.
16
Ferric coagulant is usually FeCl3 or FeSO4.nH2O (n=1-6). Best pH range for ferric agent
is 5-9. One positive point of ferric compared to aluminum agent is that ferric agent is less
influenced by the pH as its pH range is very wide. However, one disadvantage for both
ferric and aluminum coagulant is they change the pH of the water a bit due to hydrolysis.
The final coagulant is Poly Aluminum Chloride, an inorganic polymer, known as PAC. It
is also the most widely used coagulant nowadays due to its more outstanding character-
istics compared to traditional one such as aluminum or ferric salt. PAC has been proven
to achieve 4-5 times better efficiency compared to any other coagulants. Also, PAC does
not change the pH of water considerably as ferric and aluminum agents do. In reality,
PAC is usually used together with Poly Acrylic Acid (PAA) as coagulant aid. As a rule of
thumb, 1.2-4.5 g PAC should be dosed per 1 kg TSS in water.
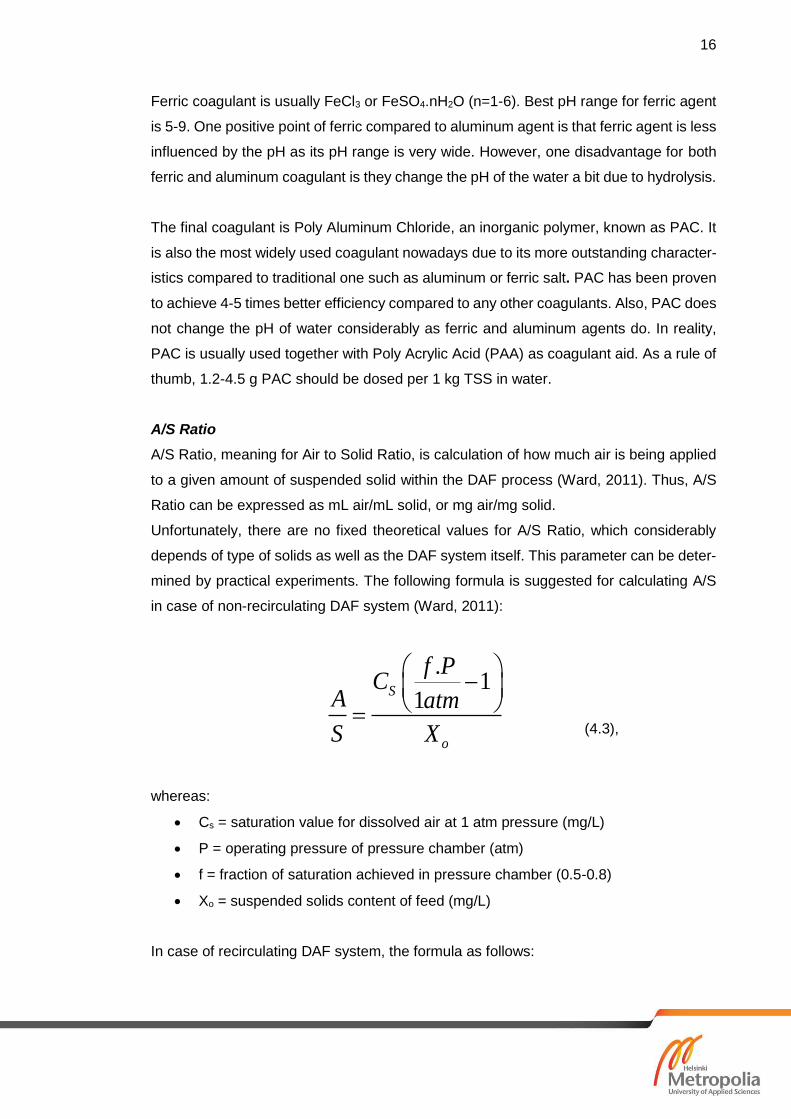
A/S Ratio
A/S Ratio, meaning for Air to Solid Ratio, is calculation of how much air is being applied
to a given amount of suspended solid within the DAF process (Ward, 2011). Thus, A/S
Ratio can be expressed as mL air/mL solid, or mg air/mg solid.
Unfortunately, there are no fixed theoretical values for A/S Ratio, which considerably
depends of type of solids as well as the DAF system itself. This parameter can be deter-
mined by practical experiments. The following formula is suggested for calculating A/S
in case of non-recirculating DAF system (Ward, 2011):
.1
1S
o
f PC
A atm
S X
(4.3),
whereas:
Cs = saturation value for dissolved air at 1 atm pressure (mg/L)
P = operating pressure of pressure chamber (atm)
f = fraction of saturation achieved in pressure chamber (0.5-0.8)
Xo = suspended solids content of feed (mg/L)
In case of recirculating DAF system, the formula as follows:

17
.. 1
1S
o o
f PC R
A atm
S Q X
(4.4),
Qo = feed flow rate (L/min)
R = recycle flow rate (L/min)
In recirculating system, as a rule of thumb, typical value for A/S is 0.01-0.1.
4.5.5 Advantages and Disadvantages
Compared to sedimentation, as also a popular solid removal process in water treatment,
advantages and disadvantages of DAF are highlighted in the table below:
Table 2. Pros and cons of DAF system compared to sedimentation (Nguyen, 2014)
Advantages Disadvantages
Continuous process, widely used
Higher SS-removal rate than sedi-
mentation, waste sludge produced
with lower moisture
SS-removal up to 90-95%
Small footprint and time-saving
Low investment/ operational cost
Efficiency strongly influenced by tem-
perature, pressure…and technical re-
quirements when operating
Not efficiently when temperature is
larger than 40oC
4.6 Induced Gas Flotation (IGF)
Actually, the principles of IGF is mostly similar to DAF. The difference is only, in case of
potentially hydrocarbon-rich environment that could increase the risk of explosion due to
presence of oxygen, natural gas is induced instead of normal air.

18
4.7 VOxFlotation
4.7.1 Overview
VOxFlotation, standing for, is new flotation technology invented by Prof. Pylkkänen, Chief
Engineer at SansOx Ltd. Basically, VOxFlotation shares the basic principles with tradi-
tional DAF, but it is expected to be much more innovative, cost-effective, and energy-
saving. SansOx Ltd has proudly stated that VOxFlotation can expectedly change the way
to perform flotation in future water treatment.
Particularly, VOxFlotation is a part of a larger SansOx system, which is known as
VOxSton system, which is capable of treating and recycling process wastewater effec-
tively. This system is the combination of all SansOx products and considered as the most
important brainchild of SansOx Ltd. However, on account of issue of business secret,
detailed technical information regarding to VOxFlotation is very limited in this thesis. Only
few general descriptions and illustrations are presented. Figure 5 shows an overview of
the system.
Figure 5. Overall VOxSton system and VOxFlotation system (right-hand-side part) (SansOx Bro-chure, 2016)
19
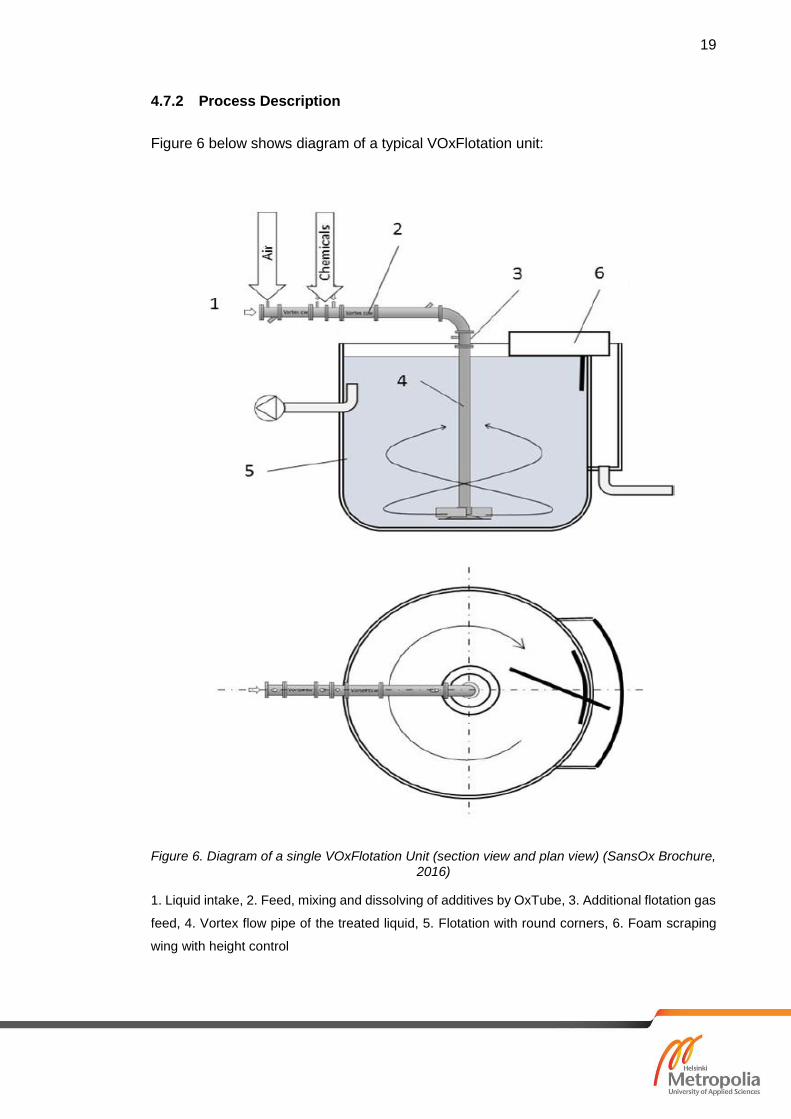
4.7.2 Process Description
Figure 6 below shows diagram of a typical VOxFlotation unit:
Figure 6. Diagram of a single VOxFlotation Unit (section view and plan view) (SansOx Brochure, 2016)
1. Liquid intake, 2. Feed, mixing and dissolving of additives by OxTube, 3. Additional flotation gas
feed, 4. Vortex flow pipe of the treated liquid, 5. Flotation with round corners, 6. Foam scraping
wing with height control
20
A brief process description is taken from SansOx technical paper as follows:
“Separation developed by SansOx is a unique separation method in which the liquid flows with
the particles continuously in a vortex path, the gas bubbles are formed in inlet of the liquid flow
and in the vortex flotation flow, the bubbles spin and cross the vortex liquid flow in optimal angle,
the particles in the vortex flow stick gently on the spinning gas bubbles and are transferred to the
cell surface.
The liquid is treated before the vortex flotation phase by the OxTube of SansOx. The treatment
consists of gas and chemicals feed and mixing, gas dissolving and additional compressed-air
feed if needed for additional air bubbles. The treatment is done continuously and fast in terms of
seconds by the OxTube process that mixes chemicals, e.g. coagulants, dissolves gases, e.g.
oxygen in to the liquid, and generates plenty of flocs and micro bubbles of air and reaction gases
directly in to the flowing liquid.”
Also, two or more VOxFlotation units can be combined to make a parallel system when
needed as follows (Figure 7):

21
Figure 7. Parallel-DAF system with two combined single units (SansOx Brochure, 2016)
4.7.3 OxTube
As we can see from the process description, OxTube is the most important component
in the system. Firstly, its function is to aerate the water and dissolve the oxygen into it,
which is the most important step in a flotation process. Well-aerated water not only
makes flotation more efficient but also helps prevent bacteria-growth and reduction of
DO (Dissolved Oxygen). Also, chemicals such as coagulants are also fed into the injec-
tors on OxTube, where they would be continuously dissolved and mixed. Continuous
aerating, dissolving, and mixing are three most important performance conducted by the
OxTube, which are also the key to success of entire VOxFlotation system. As mentioned
above, OxTube is one in two most famous products supplied by SansOx Ltd (the other
is the SaoxFuge) which won the EU awards in 2014 and 2015. Therefore, OxTube is
mainly applied in fish and shrimp farming to supply the oxygen into the water due to its
superior performance in air dissolving. Nevertheless, the innovation of VOxFlotation,
suggests that we can see that OxTube can even do much more when being applied in
water treatment. Figure 8 presents the design of the OxTube and Figure 9 depicts the
aerated water flow from the OxTube.

22
Figure 8. OxTube Design (SansOx Brochure, 2016)
Figure 9. Performance of OxTube in air dissolving (SansOx Brochure, 2016)

23
4.7.4 General Evaluation
Some highlighted points in evaluation on VOxFlotation is also given in SansOx technical
paper:
“
The liquid is flowing without stopping through mixing, dissolving and flotation separation
that increases performance and decreases energy consumption
The bubbles are evenly distributed and small in size, average bubble diameter of 0.1 mm
(100 µm, as typical bubble size for effective DAF)
There are mixture of air and reaction gas bubbles in the liquid flow that increases sepa-
ration performance
The vortex flow turns bubbles and solids towards the main stream that reduces impact of
shear and gravitational forces on the detachment
The vortex flow in the flotation cell provides the induction time enough for attachment of
the particle to the bubble while the cell size is reduced
The vortex flow in the flotation cell generates the spinning effect of the bubbles and solids
that increases the attachment performance”.
In brief, there are three main features contributing the superior performance of VOxFlo-
tation. Firstly, it is the performance of the OxTube, which can be considered as the “all-
in-one feature”. As we see, in traditional DAF system, there are many stages such as
chemical addition, air supply, and mixing, all of which are now done in one stage of
OxTube. Apparently, it helps save more spaces, cost, time, water and energy. Thus, we
can say that VOxFlotation is small footprint, energy-efficient and cost-saving. Secondly,
it is the role of vortex flow in distributing the bubbles, attaching the particles, and opti-
mizing the flotation efficiency. Finally, due to module design, all parts in VOxFlotation are
easily to be installed, uninstalled, and replaced when needed. Hence, it would also save
cost and time for fixing and maintenance. The highlights presented above indicate that
there is clear evidence to expect that VOxFlotation is absolutely going to become a
model for sustainable water treatment and recycling in future.
4.8 Water analysis parameters
Water characteristics is of great important since they have considerable influences on
human health. Moreover, the water quality also affects the treatment efficiency, as dif-
ferent treatment technologies for different contaminants demand for different conditions.

24
The water characteristics can be determined by three categories: physical, chemical,
and biological properties. Physical properties are temperature, pH, colour, turbidity, vis-
cosity, taste and odor. Chemical properties are chemicals content in water, such as:
phosphorus, nitrogen, metals, BOD, COD, TDS and TSS. Meanwhile, biological proper-
ties relate to microorganisms present in water. Absolutely, the swamp water sample used
in this thesis, which is originally the natural surface water, usually contains less contam-
inants than concentrated domestic or industrial wastewater, which conventionally re-
quires for simpler treatment process.
Temperature and pH
Temperature and pH are two most primarily important in any water treatment processes.
For example, in activated sludge utilizing aerotank, the most popular wastewater treat-
ment method, those parameters are alternatively 20-35oC and 6.5-8 (Tran, 1999). In the
flotation process, temperature and pH are also important as they require for chemical
pre-treatment when adding coagulants before flotation.
Viscosity
The viscosity of a fluid is a measure of its resistance to gradual deformation by shear
stress or tensile stress (Merriam-Webster Dictionary). For a flotation process to be effec-
tive, the viscosity of water at specific temperature should be known (Prof. Pylkkänen,
2016).
Turbidity and TSS
Turbidity and total suspended solids (TSS) are the most conventionally parameters to
evaluate clarity of water. However, they are also usually mistaken and misunderstood
because of not understanding the concept. TSS are particles that are larger than 2 mi-
crons found in the water column. In contrast, anything smaller than 2 microns (average
filter size) is considered a dissolved solid (TDS) (Perlman, 2014). Thus, TSS is meas-
urement of a matter in water, like BOD, COD, or total phosphorus, and is expressed as
mg/L. Meanwhile, the turbidity of water is on the basis of the amount of light scattered
by particles in the water column. Thus, turbidity measurements are often used as an
indicator of water quality on the basis of clarity and estimated total suspended solids in
water (Anderson, 2005). However, although turbidity can be used to estimate the TSS
and water clarity, it is not very precise compared to the exact TSS measurement. Also,
in case the matters in water has color, the estimated on the basis of turbidity might be
falsified. Notwithstanding, the procedures for measuring turbidity are much simpler,

25
which requires only a turbidity meter, whereas the analysis of TSS requires much more
complicated procedure. Hence, in this thesis, the turbidity is used as the response vari-
able to calculate the removal efficiency.
5 Experimentation
5.1 Synthetic Wastewater Sample Preparation
At first, the swamp water sample had been planned to be used. However, due to the
heavy winter condition in Finland, it was nearly impossible to collect a huge amount of
swamp water required for experiments since most of lakes and rivers were still freeze at
that time. Hence, a decision was made to use synthetic wastewater. With the synthetic
wastewater, which was nearly unlimited in the amount, the condition was then more flex-
ible and controllable.
Procedure for making the synthetic wastewater sample was very simple. An amount of
garden soil was added into the clean tap water and mixed simultaneously. Those solids
would act as the suspended solids presented in swamp water, which created the turbid-
ity. The corresponding turbidity would be in range 15-50 NTU.
5.2 Wastewater Sample Analysis and Jar-testing Procedure
5.2.1 pH
To measure the pH, the Mettler Toledo device with pH-sensor was used (Figure 10). pH
is of great important as it directly affects the performance of coagulation and flocculation
process, which then influence the flotation efficiency (section 4.5.4).
5.2.2 Turbidity
Turbidity is the most important key parameter, as it is response variable of the DOE. HI
88713 - ISO Turbidimeter was used to measure the turbidity (Figure 10). For every ex-
periment, the turbidity of wastewater sample was measured before and after experiment.

26
For each analysis, 5 samples were collected, analyzed, and the results were analyzed
to have the precise measurements.
Figure 10. pH-sensor (A) and turbidity meter (B)
5.2.3 Jar-Testing Procedure
Before the flotation, chemical pre-treatment with the sample was utilized to make the
flocs bigger and better for floating (section 4.5.4). The purpose of jar-testing experiment
was to determine the best chemical dose for the sample. The coagulant used in this
thesis was aluminum sulfate Al2(SO4)3.7H2O. The ferric sulfate salt was avoided since it
made the solution yellowish. The device to perform jar-testing is Lovibond floc-tester
(Figure 11). The procedure for jar-testing is described as follows:
Firstly, the wastewater sample was mixed well to make it homogeneous. Then, four 800-
mL beakers were prepared with 500 mL of wastewater sample in every beaker and num-
ber them from 1 to 4. Aluminum sulfate mother-solution 1000 mg/L was prepared by
dissolving 0.5 g of aluminum sulfate salt in 500 mL water in 500 mL-volumetric flask.
Next, a suitable volume of this solution was added to every beaker with suitable pipettes
so that the concentrations would be correspondingly 15 mg/L, 20 mg/L, 30 mg/L, and 40
mg/L. By simply using the formula C1*V1=C2*V2, the adding volume could be calculated
as given in the table 3.

27
Table 3. Adding volume of ferric sulfate for each beaker
Beaker No 1 2 3 4
C (mg/L) 15 20 30 40
V added (mL) 7.5 10 15 20
The samples temperature was 25oC. Importantly, the pH must be adjusted between 5.5
and 7.5 by adding few drops of 0.1 M sulfuric acid or sodium hydroxide, which could be
checked by the pH meter (section 5.2.1). In the next stage, we adjusted the jar-testing
device with speed 20 rpm and time 10 min. After all, we let the stirring begin and observe
the process. After 10 min of stirring, samples were let be there for another 10 min for the
sedimentation and stabilization. Finally, we could observe the four beakers and make
the conclusion.
Figure 11. Lovibond jar-testing device
28
5.3 VOxFlotation System Components
5.3.1 Assembling the OxTube
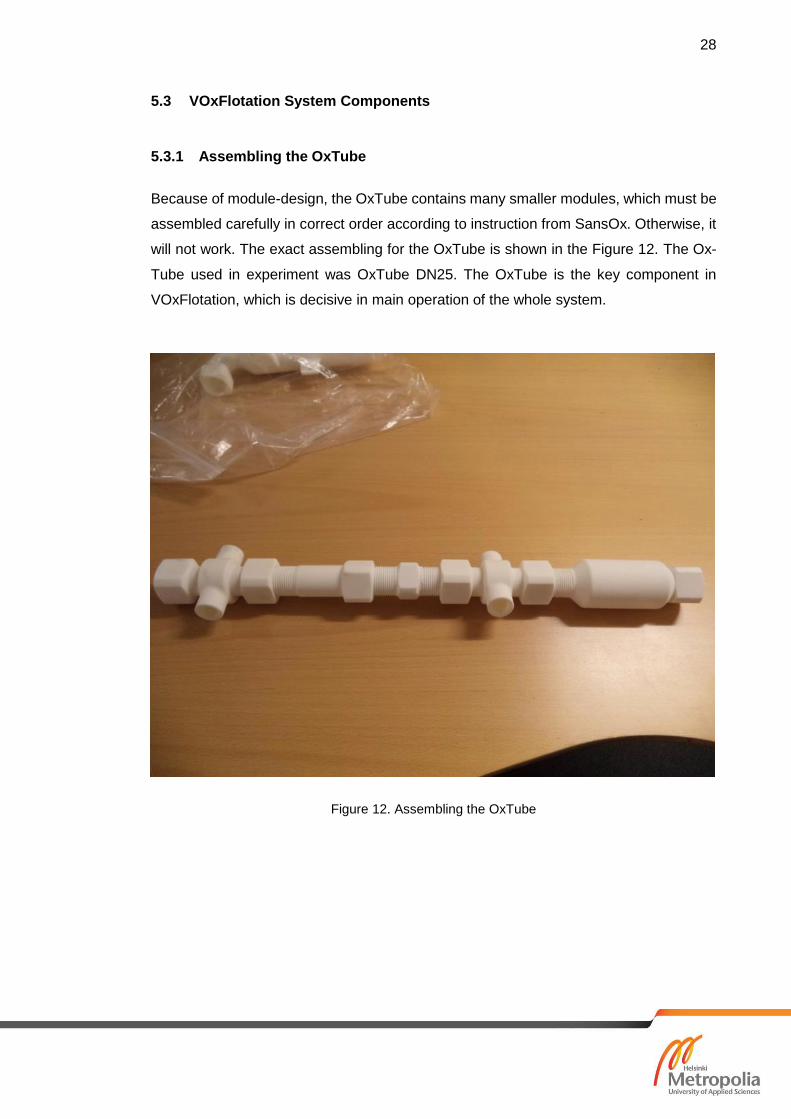
Because of module-design, the OxTube contains many smaller modules, which must be
assembled carefully in correct order according to instruction from SansOx. Otherwise, it
will not work. The exact assembling for the OxTube is shown in the Figure 12. The Ox-
Tube used in experiment was OxTube DN25. The OxTube is the key component in
VOxFlotation, which is decisive in main operation of the whole system.
Figure 12. Assembling the OxTube

29
5.3.2 Flotation Cell
Previously, there had been a plan to manufacture the standard flotation cell and other
parts. However, the time was limited and the manufacturing time was too long. Finally, a
large plastic bucket was utilized to stimulate the flotation cell. Although it was not de-
signed as standard, it was still good enough to stimulate the required shape of flotation
cell, the cylinder-shape (Figure 13). The idea of cylinder-shape is necessary for the flo-
tation process based on vortex flow is referred to the design of flotation cell from Outotec
Company and Metso Company. Dimensioning for the flotation cell was 52 cm in height
(H = 52 cm) and 45 cm in diameter (D=45 cm) of cross section area.
5.3.3 Pump
The pump used was an electricity small submerged garden pump, which could deliver a
minimum flow rate more than 0.75 L/s (Figure 13). Below this value, the VOxFlotation
would not work precisely due to SansOx material.
Figure 13. Flotation Cell (A) and Pump with maximum 7500 L/h- 400W-500 m (B)
30
This pump was controlled by a float (usually turning the pump on/off by changing the
float direction due to water level), which was actually done manually in this case. Also,
diaphragm pump is not preferred, as it creates many pulses during operation, which can
disturb the process performance.
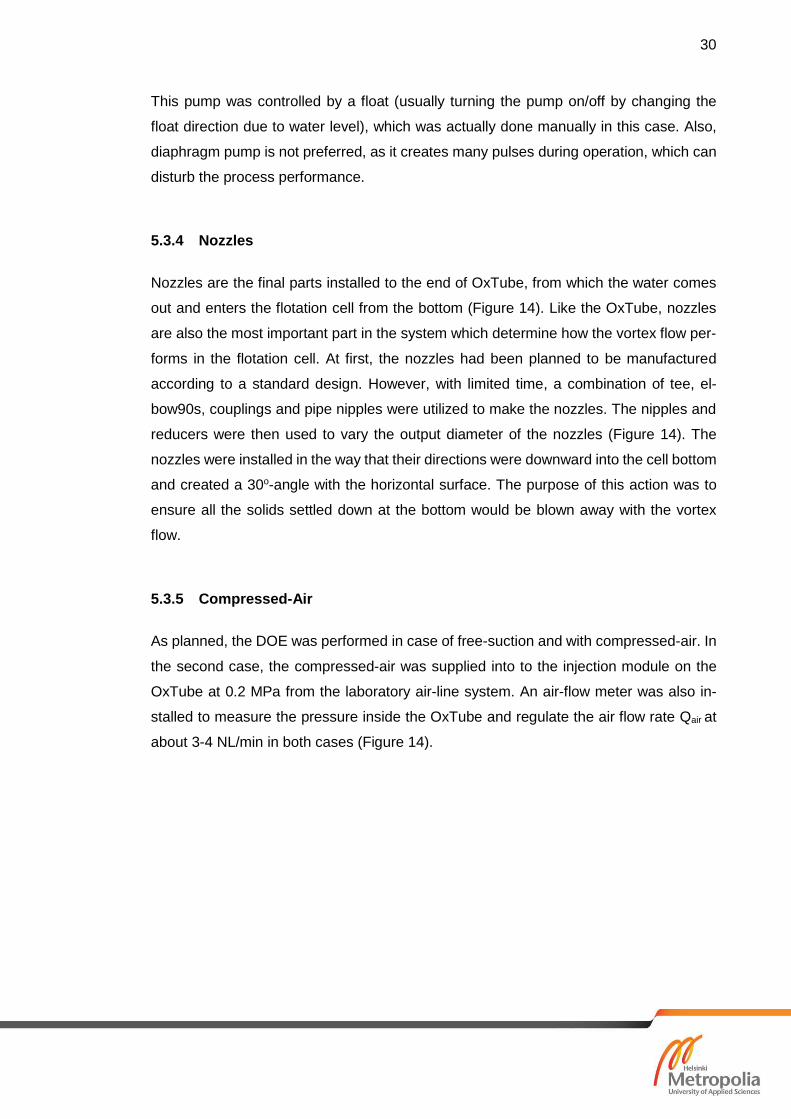
5.3.4 Nozzles
Nozzles are the final parts installed to the end of OxTube, from which the water comes
out and enters the flotation cell from the bottom (Figure 14). Like the OxTube, nozzles
are also the most important part in the system which determine how the vortex flow per-
forms in the flotation cell. At first, the nozzles had been planned to be manufactured
according to a standard design. However, with limited time, a combination of tee, el-
bow90s, couplings and pipe nipples were utilized to make the nozzles. The nipples and
reducers were then used to vary the output diameter of the nozzles (Figure 14). The
nozzles were installed in the way that their directions were downward into the cell bottom
and created a 30o-angle with the horizontal surface. The purpose of this action was to
ensure all the solids settled down at the bottom would be blown away with the vortex
flow.
5.3.5 Compressed-Air
As planned, the DOE was performed in case of free-suction and with compressed-air. In
the second case, the compressed-air was supplied into to the injection module on the
OxTube at 0.2 MPa from the laboratory air-line system. An air-flow meter was also in-
stalled to measure the pressure inside the OxTube and regulate the air flow rate Qair at
about 3-4 NL/min in both cases (Figure 14).

31
It should be noted that, in any cases without or with compressed-air, the pressure inside
the OxTube must be less than 0.5 bar. Otherwise, the pump would not work since the
maximum head it could pump was 5 meters (about 0.5 bar) as technical data shown in
Figure 13.
Figure 14. Nozzles (A), nipples and reducers (B), and air-flow meter (C)

32
5.3.6 Chemical Feed Due to lack of mechanical mixing device, chemical should not be added in the
wastewater sample tank. Moreover, the flocs could be broken by the pump during oper-
ation as experience from SansOx last experiments. Fortunately, the OxTube is also out-
standingly designed for adding and mixing the chemicals continuously, which can save
time and cost from traditional feeding and mixing approaches. The coagulant was fed
into other injectors on the injection module continuously during the experiment process,
after the dose and the dosing rate had been determined (Figure 15). Actually, a chemical
pump should be used to have precise dosing rate. However, due to limited conditions, it
was controlled manually and relatively by general measurement and human sense.
Figure 15. Chemical feed and gas feed

33
5.3.7 Pipes and Other Tools
Apart from the previously mentioned components, water pipe DN25 and other tools were
also needed to connect the components and fix the system.
5.4 VOxFlotation System Design
After all the components were ready, they were installed, fixed, and connected to create
a completed system. The OxTube was fixed as the central part of the flotation cell, along
the cell height to the bottom so that a part of it was submerged under water during oper-
ation while the injection module was still above. The nozzles were installed at the end of
OxTube near the bottom cell so that the water flow with air bubbles could enter the flo-
tation cell from the bottom and moved vortex upwards. The pump was installed in the
way that it could deliver water from wastewater sample tank to the flotation cell through
the OxTube. Those components were connected by water pipe DN25 and with suitable
fittings where needed. In brief, the completed flotation part with components can be
shown clearly in Figure 16.
Figure 16. Flotation part with section view (A) and plan view (B)

34
5.5 Weir and Effluent Design
Weir and effluent design is a special structure designed to take the final effluent based
on the design utilized in practical sedimentation or flotation tanks. Apparently, taking
samples from the upper-flow was not an optimum option since the floating solids on the
surface were not concentrated at a specific point and probably escape with the outflow
due to a lack of skimming device. Thus, one alternative possibility is to collect the effluent
at another point below the surface. A weir and effluent design to collect the effluent is
shown as follows in Figure 17.
Particularly, when the water level increased within the flotation cell and was about to
reach the surface, a part of water flow also passed the weir wall and ran into the collecting
point. Due to the larger velocity of rising bubbles compared the effluent velocity, the sol-
ids could not escape with the effluent and they continued to float onto the surface. One
should be noted that the effluent flow should not adjusted too fast, which could take the
solids escaping with it.
Figure 17. Weir and effluent design with section view (A) and plan view (B)

35
5.6 Experiment Description
Figure 18 illustrates how the completed VOxFlotation system looks like:
Figure 18. VOxFlotation system overiew
The wastewater sample was first prepared in the wastewater sample tank, the initial tur-
bidity was measured and the pH was adjusted. Before the experiment, all components
should be checked carefully, and it should be ensured that there were no water leaking
points. During the experiment, the pump submerged in the wastewater tank delivered
the water through the OxTube, on which the chemical was added and air flow rate was
adjusted. The main flotation process took place in the flotation cell. The vortex flow
moved within the cell, with thousands of micro-bubbles escaping from the nozzles at the
37o-angle, attaching the solids and floating them onto the surface. The water level in-
creased in the tank, and the upper-flow escaped from the top of the flotation. Finally, the
effluent collection point was opened, at which the final effluent was collected and the
final turbidity was analyzed. Every experiment took approximately 2 min.

36
5.7 System Variables Formulas
Flotation Cell Volume (V)
The Flotation Cell has a cylinder shape. The formula for calculating volume of the cell is
shown as follows:
2
4
DV H
, (5.1)
Whereas D is the cell diameter and H is the cell height.
Hydraulic Detention Time or Flotation Time (t)
Hydraulic Detention Time determines how long the water remains in the flotation cell. It
is also the Flotation Time of the system. This parameter can be calculated as follows:
Vt
Q
, (5.2)
Nozzle Water Velocity (v)
Please note that there are two output nozzles, for which the water flow rate from each
nozzle will be halved from the original flow rate Q. Thus, each nozzle velocity is calcu-
lated as follows:
2
2Qv
d
, (5.3)
Whereas Q is water flow rate d is the diameter of the nozzles. Two types of
nozzles were used, DN25 and DN32.

37
Hydraulic Loading Rate (HLR)
Hydraulic Loading Rate determines the volume of upper-flow water applied to the sur-
face in a unit of time.
HLR can be calculated as follows:
2
4QHLR
D
, (5.4)
Chemical Dosing Rate (DR) Chemical Dosing Rate could be calculated as follows:
o
QCDR
C
, (5.5)
Whereas C is desired dose concentration from jar-testing (40 mg/L) and Co is
the concentration of feeding solution (5000 mg/L).
Solid Removal Efficiency (SRE)
Solid Removal Efficiency determines how clear the water will be after the flotation. SRE
can be calculated as follows:
100%
i f
i
NTU NTUSRE
NTU
, (5.6)
Whereas NTUi is the turbidity of the influent and NTUf is the turbidity of the final
effluent.
38
5.8 Design of Experiment (DOE)
5.8.1 General Introduction to Mathematical Modelling
Regression is a powerful tool to analyse the experimental results in case our desired
model contain only continuous variables, such as: pH, temperature, and pressure (Veli,
2015). Among different types of designs, the two-level design (2N-design) is believed to
be one of the most favoured design as it is very fast and cost-effective. The 2N-design is
very useful to build the model and analyse influences among different variables as well
as their interactions and direction for optimizing the process. Based on this, another type
of design can be utilized later on to optimize the process performance.
5.8.2 Design of Experiment (DOE)
In the DOE of this thesis, two quantitative variables in the VOxFlotation design: the di-
ameter of nozzles (X) and the compressed-air pressure (P) are varied to see how those
factors have influences on the response variable Solid Removal Efficiency (SRE) as well
as their correlation. In this case, the used design was 2N design (N=2). There are two
levels of each variable, which makes up to 2*2= 4 experiments. However, two replicates
should be made per experiment. This created 8 experiments in total. All the experiments
should be conducted in random order to guarantee the statistical independence of the
experimental errors.
The two qualitative variables can be written in the following form: X (25,32) and P (0,0.2).
The table 4 illustrates how the DOE should look like:
39
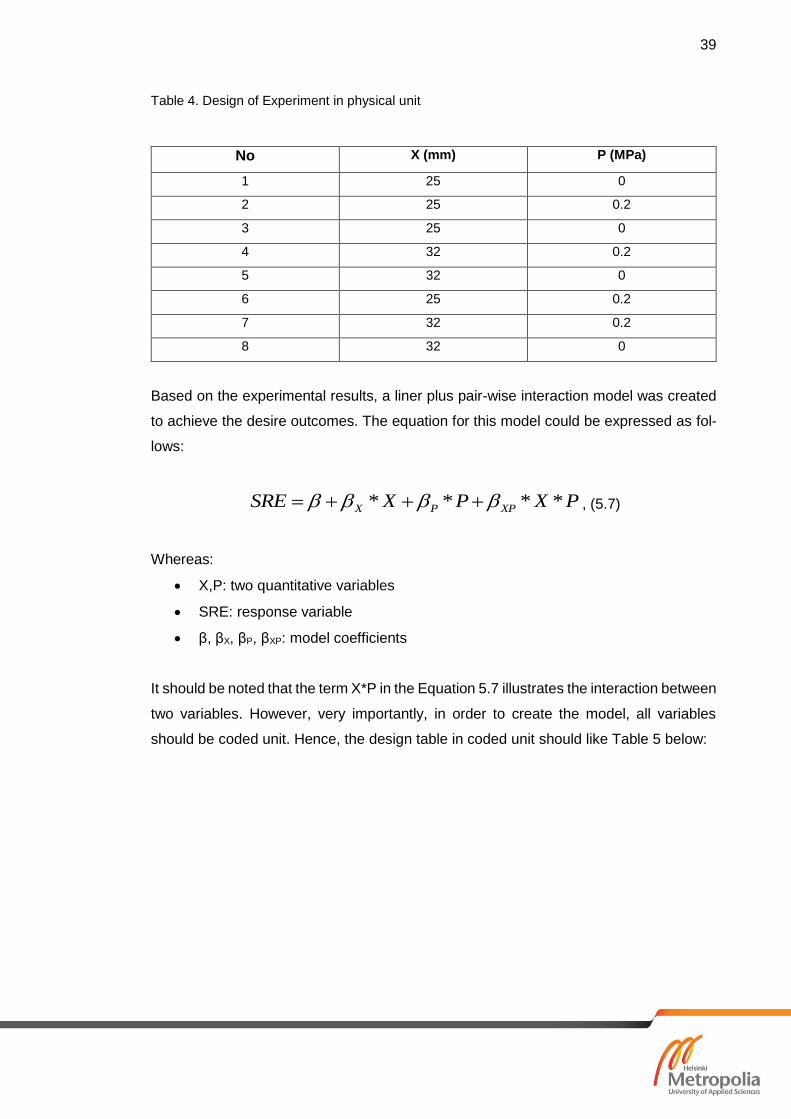
Table 4. Design of Experiment in physical unit
No X (mm) P (MPa)
1 25 0
2 25 0.2
3 25 0
4 32 0.2
5 32 0
6 25 0.2
7 32 0.2
8 32 0
Based on the experimental results, a liner plus pair-wise interaction model was created
to achieve the desire outcomes. The equation for this model could be expressed as fol-
lows:
* * * *X P XPSRE X P X P , (5.7)
Whereas:
X,P: two quantitative variables
SRE: response variable
β, βX, βP, βXP: model coefficients
It should be noted that the term X*P in the Equation 5.7 illustrates the interaction between
two variables. However, very importantly, in order to create the model, all variables
should be coded unit. Hence, the design table in coded unit should like Table 5 below:

40
Table 5. Design of Experiment in coded unit
No X P
1 -1 -1
2 -1 1
3 -1 -1
4 1 1
5 1 -1
6 -1 1
7 1 1
8 1 -1
6 Results and Analysis
6.1 Process Variables
Flow rate, pressure, and other process variables which were approximately measured
or calculated based on the formula in section 5.6 are shown in Table 6 as follows:
Table 6. System variables (all units were conversed accordantly during calculation)
Variable Value Unit
Q 1.4 L/s
Pcompressed-air 0.2 MPa
Qair 3-4 NL/min air
H 52 cm
D 45 cm
V (formula 5.1) 80 L
t (formula 5.2) 1 min
vDN25(formula 5.3) 1.4 m/s
vDN32(formula 5.3) 0.9 m/s
HLR (formula 5.4) 8.8 x 10^-3 m3/m2.s
DR (formula 5.5) 0.7 L/min

41
6.2 Jar-Testing Results
The results from observing jar-testing showed that Beaker 4 (with the largest coagulant
dose) performed the best flocculation, while the result of Beaker 1 was the poorest.
Hence, the dose 40 mg/L was selected.
6.3 DOE Results
6.3.1 Interpretation
The experimental results are given in Table 7:
Table 7. Experimental results
No X P SRE (%)
(equation 5.5)
1 -1 -1 40.6
2 -1 1 47.3
3 -1 -1 41.2
4 1 1 54.2
5 1 -1 43.2
6 -1 1 46.8
7 1 1 53.0
8 1 -1 44
Obviously, we can see that the designed VOxFlotation system has performed an average
removal efficiency from the influent with varying turbidity. The best removal efficiency
was achieved at DN32 and 0.2 MPa (54.2%).
The R-Studio software was utilized to analyse the given results. In order to create and
summarize the model conveniently, a powerful tool called DOE_function was applied.
This function is developed and applied with the permission by Mr.Veli-Matti, Applied
Mathematics Lecturer at Metropolia. The model summary printed from R-command is
given below:
42
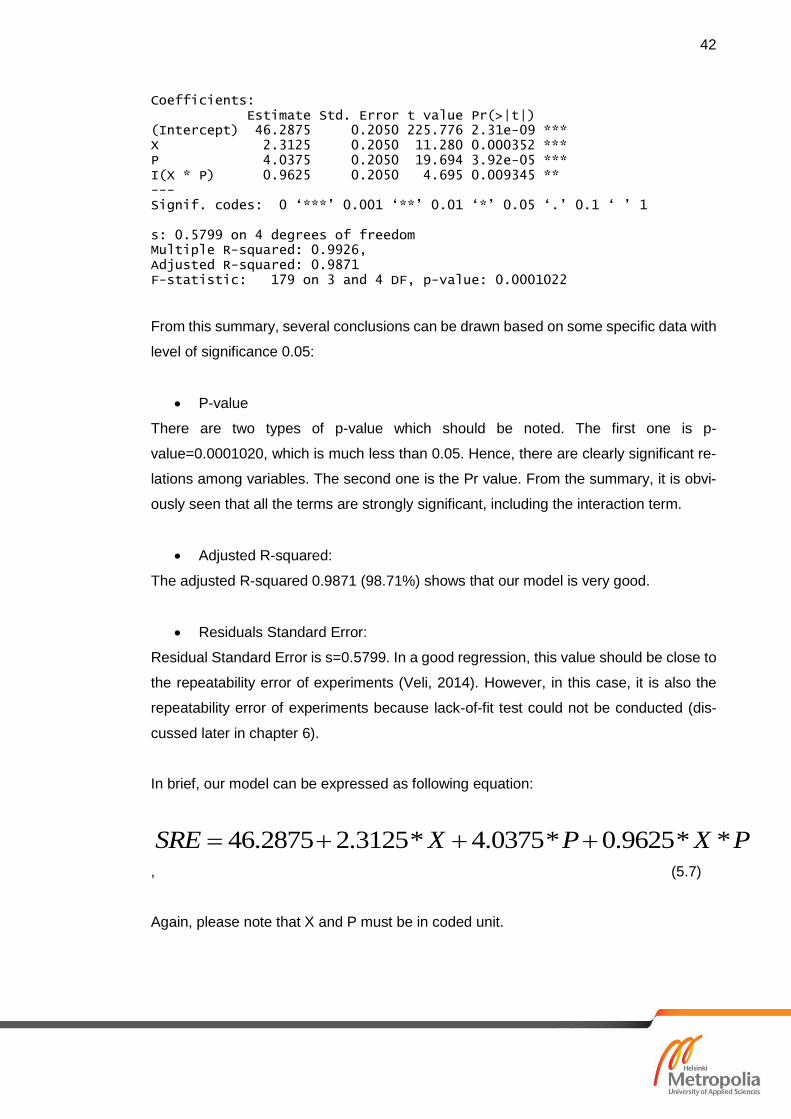
Coefficients: Estimate Std. Error t value Pr(>|t|) (Intercept) 46.2875 0.2050 225.776 2.31e-09 *** X 2.3125 0.2050 11.280 0.000352 *** P 4.0375 0.2050 19.694 3.92e-05 *** I(X * P) 0.9625 0.2050 4.695 0.009345 ** --- Signif. codes: 0 ‘***’ 0.001 ‘**’ 0.01 ‘*’ 0.05 ‘.’ 0.1 ‘ ’ 1 s: 0.5799 on 4 degrees of freedom Multiple R-squared: 0.9926, Adjusted R-squared: 0.9871 F-statistic: 179 on 3 and 4 DF, p-value: 0.0001022
From this summary, several conclusions can be drawn based on some specific data with
level of significance 0.05:
P-value
There are two types of p-value which should be noted. The first one is p-
value=0.0001020, which is much less than 0.05. Hence, there are clearly significant re-
lations among variables. The second one is the Pr value. From the summary, it is obvi-
ously seen that all the terms are strongly significant, including the interaction term.
Adjusted R-squared:
The adjusted R-squared 0.9871 (98.71%) shows that our model is very good.
Residuals Standard Error:
Residual Standard Error is s=0.5799. In a good regression, this value should be close to
the repeatability error of experiments (Veli, 2014). However, in this case, it is also the
repeatability error of experiments because lack-of-fit test could not be conducted (dis-
cussed later in chapter 6).
In brief, our model can be expressed as following equation:
46.2875 2.3125* 4.0375* 0.9625* *SRE X P X P
, (5.7)
Again, please note that X and P must be in coded unit.

43
6.3.2 Data Plotting and Pair-wise Interaction Analysis
From the above section, we have learnt that all the variables have significant influences
on the removal efficiency. Moreover, there is a clear interaction between variables. We
are also interested in this interaction term. In order to illustrate how the reaction direction
and interaction perform, some useful plots should be made for our model.
The first one is called contour plots. Contour plots illustrate the plot for three variables in
2-D viewing (David, n.d.). Fortunately, the DOE_function also allows to make the contour
plot easily.

44
The plots in both coded unit and physical unit can be shown as follows:
Figure 19. Contour plot for model in coded unit (A) and physical unit (B)

45
From this contour plot for our model, we can deduce that higher removal efficiencies at
about 70-80% can probably be predicted to achieve in the area of both higher diameter
and compressed-air pressure.
In order to have an easier viewing for interaction term, we can make a plot for SRE
against X at two P values as follows:
Figure 20. Removal Efficiency plotted against diameter and pressure
The chart is drawn based on the created model equation, Equation 5.7. From this line
plot, we can see that the efficiency absolutely increases with diameter for both com-
pressed-air pressures. Also, the interaction is shown apparently as the slope is clearly
larger with larger pressure. Besides, the efficiency seems to increase faster with higher
pressure at larger nozzles’ diameter.
30
35
40
45
50
55
60
65
70
75
15 20 25 30 35 40 45 50 55 60
SR
E(%
)
X (MM)
VARIABLES INTERACTIONS PLOT
P=0 Mpa P =0.2 Mpa

46
7 Discussion and Limitations
7.1 Discussion
Overall, the following interpretations can be concluded from the results presented in sec-
tion 6.3. Firstly, the experimental results highlighted the highest removal efficiency
achieved at nozzles DN25 with 0.2 MPa compressed-air supply. Secondly, on the basis
of DOE and regression understanding, a model to stimulate the influences and interac-
tions among variables was created, and it was also proven to be a good model. Both
nozzles’ diameter and compressed-air pressure show strong influence on the solids re-
moval efficiency of the VOxFlotation system as well as there is also clear interaction
between them. Finally, it can be predicted that the efficiency will significantly improve
when we increase both nozzles’ diameter and compressed-air pressure. Once again, it
should be noted that we cannot be sure anything since it is only the prediction and we
are still lacking of much important data. However, this interpretation is expected to some-
how provide SansOx much useful information, good starting points and experience for
their further testing.
7.2 Limitations and Recommendations for Improvement
There are still many limitations in the study, which can be divided into experiment limita-
tion and model limitation. In the experiment limitations, they are summed to be several
issues. The first limitation is the wastewater sample used for conducting experiments.
As previously mentioned, the synthetic wastewater sample was made by dissolving soils
into clean water instead of real swamp water. It seemed to be impossible to stimulate
exactly the properties of natural surface water, which are believed to significantly affect
some measurements and the objectives of the system. Hence, in the future when the
weather is becoming more suitable, testing with real swamp water sample is strongly
recommended to have precise results. Secondly, all the components in our VOxFlotation
system were not manufactured from standard materials (stainless steel) with accurate
dimensioning, which may have affected the process performance considerably. Espe-
cially, the flotation cell used in experiments was too small, which was only 80L instead
of 400-500L as recommended in SansOx material. Thus, the vortex flow and rising bub-
bles paths within the cell were not optimized, which could certainly affect the vortex flo-
tation process. Also, together with small cell volume, the hydraulic retention time was too
short, which was only 1 min compared to 5 min recommended in SansOx theory. It might

47
not be sufficient for effective flotation as well as mixing water with coagulants inside the
OxTube. Besides, because due to the lack of chemical pump, dosing rate might be not
controlled precisely. Thirdly, by observing the bubbles paths during experiments, two
nozzles seemed to be not sufficient to distribute bubbles evenly within the cell, making
some area limited for floating the solids. The lack of a skimming device to collect the
floating solids on surface could also be mentioned as one disadvantage. In a nutshell, in
SansOx later testing, it is recommended that a standard manufactured system with suit-
able components and tools should be used in order to have best experiment conditions
and achieve the precise outcomes.
Finally, the model had some limitations. Apparently, our 2N design was missing experi-
ments at central points. However, it is also nearly impossible to conduct testing at central
points since there are no diameter sizes between 25 mm and 32 mm. By missing those
points, linearity-test and lack-of-fit test were not available although those functions are
also included in DOE_function. Hence, only predictions could be made without any con-
firmations as the linearity of the model was not totally certain. Moreover, the 2N design is
only useful to evaluate the influences and direction for optimizing. In the future, in order
to find the optimum point, on the basis of already known conclusions, another type of
design can be utilized by making more experiments at desired points.

48
References
Anderson, C. W, 2005. Turbidity. USGS National Field Manual for the Collection of
Water-Quality Data. U S Geological Survey, section 6.7.
Baram, S., V. Couvreur, T. Harter, M. Read, P.H. Brown, M. Kandelous, D.R.
Smart, and J.W. Hopmans, 2016. Estimating Nitrate Leaching to Groundwater from
Orchards: Comparing Crop Nitrogen Excess, Deep Vadose Zone Data-Driven Esti-
mates, and HYDRUS Modeling. Vadose Zone J. 15. Vol.15, No.11.
Beychok, Milton R, 1967. Aqueous Wastes from Petroleum and Petrochemical
Plants. 1st edition.
Bloom. David.E, 2011. 7 Billion and Counting. Science. Department of Global
Health and Population, Harvard School of Public Health, Harvard University, Bos-
ton, Vol. 333, Issue 6042, pp. 562-569.
Bono. Dissolved air flotation (DAF) / Induced Gas Flotation (IGF). [online] Available
at: http://www.bono.it/artes/en/technologies/Dissolved-air-flotation-DAF-.html# [Ac-
cessed 20 Feb 2017].
Bunyak Dawn., 2000. To Float or Sink: A Brief History of Flotation Milling. 2000
Mining History Journal, pp.35-44.
Eartheclipse. What is Population?. [online] Available at:
http://www.eartheclipse.com/environment/problems-of-overpopulation.html [Ac-
cessed 15 February 2017].
Environment Canada 2005. Water—Here, There, and Everywhere in Canada. Wa-
ter Encyclopedia. Figure 2.
EPA, 2012. 5.5 Turbidity. In Water: Monitoring & Assessment. [online] Available at:
http://water.epa.gov/type/rsl/monitoring/vms55.cfm
Everythingconnects. Effects of Human Overpopulation. [online] Available at:
http://www.everythingconnects.org/overpopulation-effects.html [Accessed 16 Feb-
ruary 2017].

49
Frcsystems. PLC-Series Dissolved Air Flotation Systems [online]. Available at:
http://frcsystems.com/pcl-dissolved-air-flotation-systems/ [Accessed 30 Apr 2017]
Fuerstenau. Maurice C, Jameson. Graeme J, Yoon Roe-Hoan, 2007. Froth Flota-
tion: A Century of Innovation. SME, pp.65-70.
G J Jameson, 1992. Flotation cell development. The AusIMM Annual Conference,
Broken Hill, New South Wales, pp.25–31.
Klassen .V. I, Mokrousov. V. A, 1963. An Introduction to the Theory of Flotation.
Butterworths.
Lane David. Contour Plots. Onlinestatbook. [online] Available at: http://onlinestat-
book.com/2/advanced_graphs/contour.html [Accessed 23 Feb 2017]
Mooyoung Han, Tschung-il Kim, Jinho Kim, 2007. Effects of floc and bubble size on
the efficiency of the dissolved air flotation (DAF) process. Water Science and Tech-
nology. IWA Publishing, Vol.56, Abstract.
Nguyen Dinh Tuan, 2014. Application of Dissolved Air Flotation in Treating Dis-
charge from Pulp and Paper Recycling Zone in Phong Khe- Bac Ninh. Vietnam Na-
tional University, Ho Chi Minh City. Ho Chi Minh City University of Science, pp.6-8.
Nguyen Viet Anh, Nguyen Manh Hung, Vu Thi Minh Thanh, 2013. Research on
Water Treatment Method- Dissolved Air Flotation. Science and Technology Maga-
zine, 2013, pp.54-62.
Nihill D N, Stewart C M and Bowen P, 1998. The McArthur River mine—the first
years of operation, AusIMM ’98 – The Mining Cycle, Mount Isa. The Australasian
Institute of Mining and Metallurgy: Melbourne, 1998, pp.73–82.
Pease. J, 2007. Increasing the energy efficiency of grinding. Crushing and Grind-
ing, Brisbane.

50
Perlman, H, 2014. Sediment and Suspended Sediment. The USGS Water Science
School. [online] Available at: http://water.usgs.gov/edu/sediment.html [Accessed 22
Feb 2017]
Population Reference Bureau. Human Population: Population. [online] Available at:
http://www.prb.org/Publications/Lesson-Plans/HumanPopulation/Popula-
tionGrowth.aspx [Accessed 14 February 2017].
Pylkkänen. J, 2016, Vortex Flotation Seperation. Technical Paper. SansOx Limited.
SansoX. Comapany SansOx Limitted. [online] Available at: http://sansox.fi/fi/com-
pany/ [Accessed 17 February 2017].
Worldometers. Current World Population. [online] Available at:
http://www.worldometers.info/world-population/ [Accessed 14 February 2017]
Wri. Water Stress by Country. [online] Available at: http://www.wri.org/re-
sources/charts-graphs/water-stress-country [Accessed 16 February 2017].

Appendix 1
1 (1)
Appendix 1. R-Command for creating the model and making Plots

Appendix 2
1 (1)
Appendix 2. Meeting between SansOx and Metropolia for cooperation in
testing VOxFlotation as thesis-work at Metropolia Laboratory